Article

Coseismic Deformation, Fault Slip Distribution, and Stress Changes of the 2025 MS 6.8 Dingri Earthquake from Sentinel-1A InSAR Observations

1
Gansu Lanzhou Geophysics National Observation and Research Station, Lanzhou 730000, China
2
Lanzhou Institute of Seismology, China Earthquake Administration, Lanzhou 730000, China
*
Author to whom correspondence should be addressed.
Geosciences 2025, 15(11), 421; https://doi.org/10.3390/geosciences15110421
Submission received: 6 September 2025 / Revised: 24 October 2025 / Accepted: 3 November 2025 / Published: 5 November 2025
(This article belongs to the Section Geophysics)

Abstract

On 7 January 2025, a MS 6.8 earthquake struck Dingri County, southern Tibet, within the extensional regime of the central Himalaya–southern Tibetan Plateau. Using ascending and descending Sentinel-1A SAR data, we applied a two-pass Differential InSAR (D-InSAR) approach with SRTM DEM data to retrieve high-precision coseismic deformation fields. We observed significant LOS deformation, revealing peak displacements of −1.06 m and +0.76 m, with deformation concentrated along the Denmo Co graben and clear offsets along its western boundary fault. Nonlinear inversion using the Okada elastic dislocation model and a quadtree down-sampled dataset yields a rupture plane 28.42 km long and 12.81 km wide, striking 183.51°, dipping 55.41°, and raking −71.95°, consistent with a predominantly normal-faulting mechanism with a minor left-lateral component. Distributed-slip inversion reveals that peak slip (4.79 m) was concentrated in the upper ~10 km of the fault, with the main asperity located in the central fault segment. The seismic moment is estimated to be 4.24 × 10¹⁹ Nm, which corresponds to a magnitude of MW 7.05. Coulomb failure stress (ΔCFS) calculations indicate stress increases (>0.01 MPa) at the northern and southern rupture terminations (5–10 km depth) and the flanks at 15–20 km depth, suggesting elevated seismic potential in these regions. This integrated InSAR–modeling–stress analysis provides new constraints on the source parameters, slip distribution, and tectonic implications of the 2025 Dingri earthquake, offering important insights for regional seismic hazard assessment.

1. Introduction

As reported by the China Earthquake Networks Center (CENC), at 09:05 Beijing time on 7 January 2025, a strong earthquake with a magnitude of MS 6.8 struck Dingri County, Shigatse City, southern Tibet (epicenter: 28.50° N, 87.45° E) at a depth of 10 km at the earthquake’s focus. It was strongly felt across the densely populated region, resulting in 126 fatalities and severe damage to numerous residential buildings. This event was characterized by a mainshock–aftershock sequence. As of 10:00 on 20 January, a total of 5396 aftershocks had been recorded, comprising 12 events of M ≥ 4.0, one event of M5.0–5.9, and none above M6.0. The largest aftershock (M5.0) occurred approximately 9 km away from the mainshock, with aftershocks distributed predominantly in a near N–S alignment [1].
The epicenter is located in the Lhasa Block in the southern Tibetan Plateau, where ongoing convergence between the Indian Plate and the Eurasian Plate drives plateau uplift, crustal shortening, crustal thickening, and widespread intracontinental deformation. This plate–plate collision is the primary geodynamic mechanism controlling tectonic deformation in western China [2,3]. Within this framework, faults within and surrounding the Lhasa Terrane are notably active [4]. Historically, the terrane has experienced frequent moderate-to-strong earthquakes; since 1950, 21 events of M ≥ 6.0 have occurred, with the most recent prior to this event being the MW 6.9 Milin earthquake in Tibet in 2017 [5,6].
Since the early Eocene (~50–55 Ma), the Indian Plate has been continuously subducting northwards and colliding with the Eurasian Plate, leading to the formation of the Tibetan Plateau and the Himalayan Orogenic Belt. This plate convergence has caused large-scale shortening and thickening of the continental crust, driving significant uplift of the plateau. At present, the Indian Plate converges with the Eurasian Plate at a rate of approximately 40 mm/yr [3]. About 15–22 mm/yr of this convergence is accommodated by thrusting along the Main Frontal Thrust (MFT) frontal system, while the remaining strain is distributed heterogeneously across large strike-slip fault systems along the plateau margins and through seven major north–south trending rift systems within its interior [4].
Since the beginning of the Miocene epoch, the Tibetan Plateau has been dominated by a regional east–west extensional tectonic regime, resulting in the development of multiple north–south striking fault zones [7]. These structures represent the primary manifestation of east–west tensile strain during this period, and today they remain among the most seismically active tectonic belts in the plateau interior, frequently generating strong earthquakes and reflecting ongoing crustal deformation processes.
After the earthquake, the source mechanism solutions were released by major authoritative institutions, as shown in Table 1. Among them, USGS refers to the United States Geological Survey, GCMT to Harvard University’s Global Centroid Moment Tensor, GFZ to the German Research Center for Geosciences, IPGP to the Institut de Physique du Globe de Paris, and CENC to the China Earthquake Networks Center. Preliminary field and remote-sensing studies revealed consistent surface rupture characteristics. Shi et al. [8] and Liang et al. [9] reported that the earthquake generated a surface rupture and deformation zone approximately 26 km in length with clear segmentation: The northern segment was primarily characterized by normal faulting, with vertical displacements ranging from 2 to 3 m. and minor secondary left-lateral strike-slip faults, while the southern segment exhibited complex features combining extension and compression. Based on field surveys and aftershock relocation, Yang et al. [1] examined deformation styles and the evolutionary pattern of the Dingmucuo (Denmo Co) graben. Bai et al. [10] analyzed the tectonic background and source characteristics, concluding that the event was a large normal-faulting earthquake along the Dingmucuo Fault within the Xainza–Dingjie rift system of the Tethyan Himalayan tectonic domain.
Dingri County lies within the southern area of Shigatse City in the Tibet Autonomous Region (Figure 1). It is proximal to the southern edge of the Himalayas’ Main Central Thrust. Under the combined influences of eastward extrusion of deep crustal material and lithospheric delamination, the regional stress field exhibits pronounced extensional tectonics with a predominant east–west orientation. This extensional stress has produced a spectrum of NNE–SSW oriented graben systems [11].
One of the most significant of these graben systems is the Xainza–Dingjie rift, an active tectonic belt in southern Tibet formed under east–west extensional strain approximately 13–11 Ma [12]. This rift trends NNE for ~350 km, linking the Gerencuo bounded by the fault to the north and the Himalayan range to the south. Its structural trace traverses several major geological units, covering the Lhasa Terrane, Yarlung Zangbu Suture Zone, Himalayan Terrane, and the South Tibetan Detachment System. It is a major locus of ongoing tectonic strain and is one of the most seismically active regions in the plateau interior, significantly influencing the distribution of earthquake sources [12].
The Denmo Co graben, situated in the southern part of the rift, is one of its largest morphological depressions. The Denmo Co Fault, which defines the graben boundary, is a moderately sized but laterally continuous active normal fault that has been active throughout the Holocene [13]. In the years prior to the 2025 mainshock, four moderate earthquakes (MW ≥ 5.0) occurred in the vicinity: the 2015 MW 5.7 Dingri, 2016 MW 5.3, 2016 MW 5.2, and 2020 MS 5.9 events [14]. Tian et al. [13] reported that the 2015 MW 8.1 Nepal earthquake significantly enhanced the activity of the Denmo Co Fault, leading to apparent earthquake clustering along the structure—suggesting a relatively high potential for future strong seismic events.
The present work, the co-seismic deformation field of the 2025 Dingri event was generated through Differential InSAR (D-InSAR) processing, utilizing both pre and post-event Sentinel-1A SAR data from different orbits. These observations were then used to constrain nonlinear and linear inversions based on the Okada dislocation model [15] to determine fault parameters and high-resolution slip distribution. Furthermore, we evaluated coseismic Coulomb static stress changes to assess implications for future seismic hazards. Our findings provide new constraints on the source characteristics, deformation processes, and seismogenic structures of the Dingri earthquake, offering practical significance for seismic hazard assessment and mitigation on the Tibetan Plateau.

2. Materials and Methods

2.1. InSAR Data and Processing

We employed C-band Sentinel-1A IW mode Single Look Complex (SLC) products (wavelength: 0.056 m; spatial resolution: 5 m (azimuth) × 20 m (range); polarization: VV). We acquired ascending and descending track datasets encompassing the earthquake rupture zone of the 2025 Dingri earthquake (Table 2) from the Copernicus Data Space Ecosystem. Their spatial coverage is presented in Figure 1b. The D-InSAR processing [16] was conducted using the InSAR Scientific Computing Environment (ISCE) platform [17]. The co-registered SLC images were multi-looked at a range-to-azimuth ratio of 8:2 to achieve an equivalent spatial resolution of ~40 m and enhance the signal-to-noise ratio. Topographic phases were removed using the 30 m resolution SRTM DEM and precise orbital ephemerides from the European Space Agency [18,19]. We then applied a Goldstein adaptive filter (window size: 64 × 64; filter parameter: 0.3) to the interferometric phase for noise suppression [20]. The Minimum Cost Flow (MCF) algorithm was employed for phase unwrapping [21], and orbital errors were corrected with a second-order polynomial model. To mitigate atmospheric delays, particularly from tropospheric water vapor heterogeneity, Utilized the Generic Atmospheric Correction Online Service (GACOS) model [22,23,24]. GACOS integrates numerical weather prediction models, continuous GNSS observations, and elevation data to generate high-resolution Zenith Total Delay (ZTD) maps, effectively removing topography-correlated atmospheric signals. For each master-slave SAR image pair, we computed the differential atmospheric delay field from temporally corresponding ZTD data and subtracted it from the original interferogram. Finally, the unwrapped phase was converted to LOS deformation and transformed to the WGS84 coordinate system using the DEM.

2.2. Source Model Inversion and Coulomb Stress Analysis

Within the framework of elastic dislocation theory, the forward model that links the D-InSAR LOS observations to the fault parameters is formulated as:
d = GS(x) + ε
where d is the LOS deformation, S(x) is the vector of the fault’s geometric parameters (location, depth, strike, dip, length, width) and kinematic parameters (rake and slip), G denotes the matrix of Green’s functions relating fault motion to surface deformation, and ε is the observational error [25].
We formulated the source inversion as a two-step scheme to address the inherent nonlinearity between fault parameters and surface deformation. The inversion proceeds by first constraining the fault geometry through nonlinear optimization and then resolving the slip distribution via linear least-squares inversion [26]. Observational data, being homogeneous InSAR measurements, were assigned equal weights. To mitigate edge effects, the fault plane dimensions were set to 54 km along strike by 20 km along dip and discretized into 1080 patches of 1 km × 1 km. The inversion was regularized with a Laplacian smoother; an optimal smoothing factor of 0.02 was determined through rigorous testing to suppress unrealistic slip oscillations while recovering robust slip features.
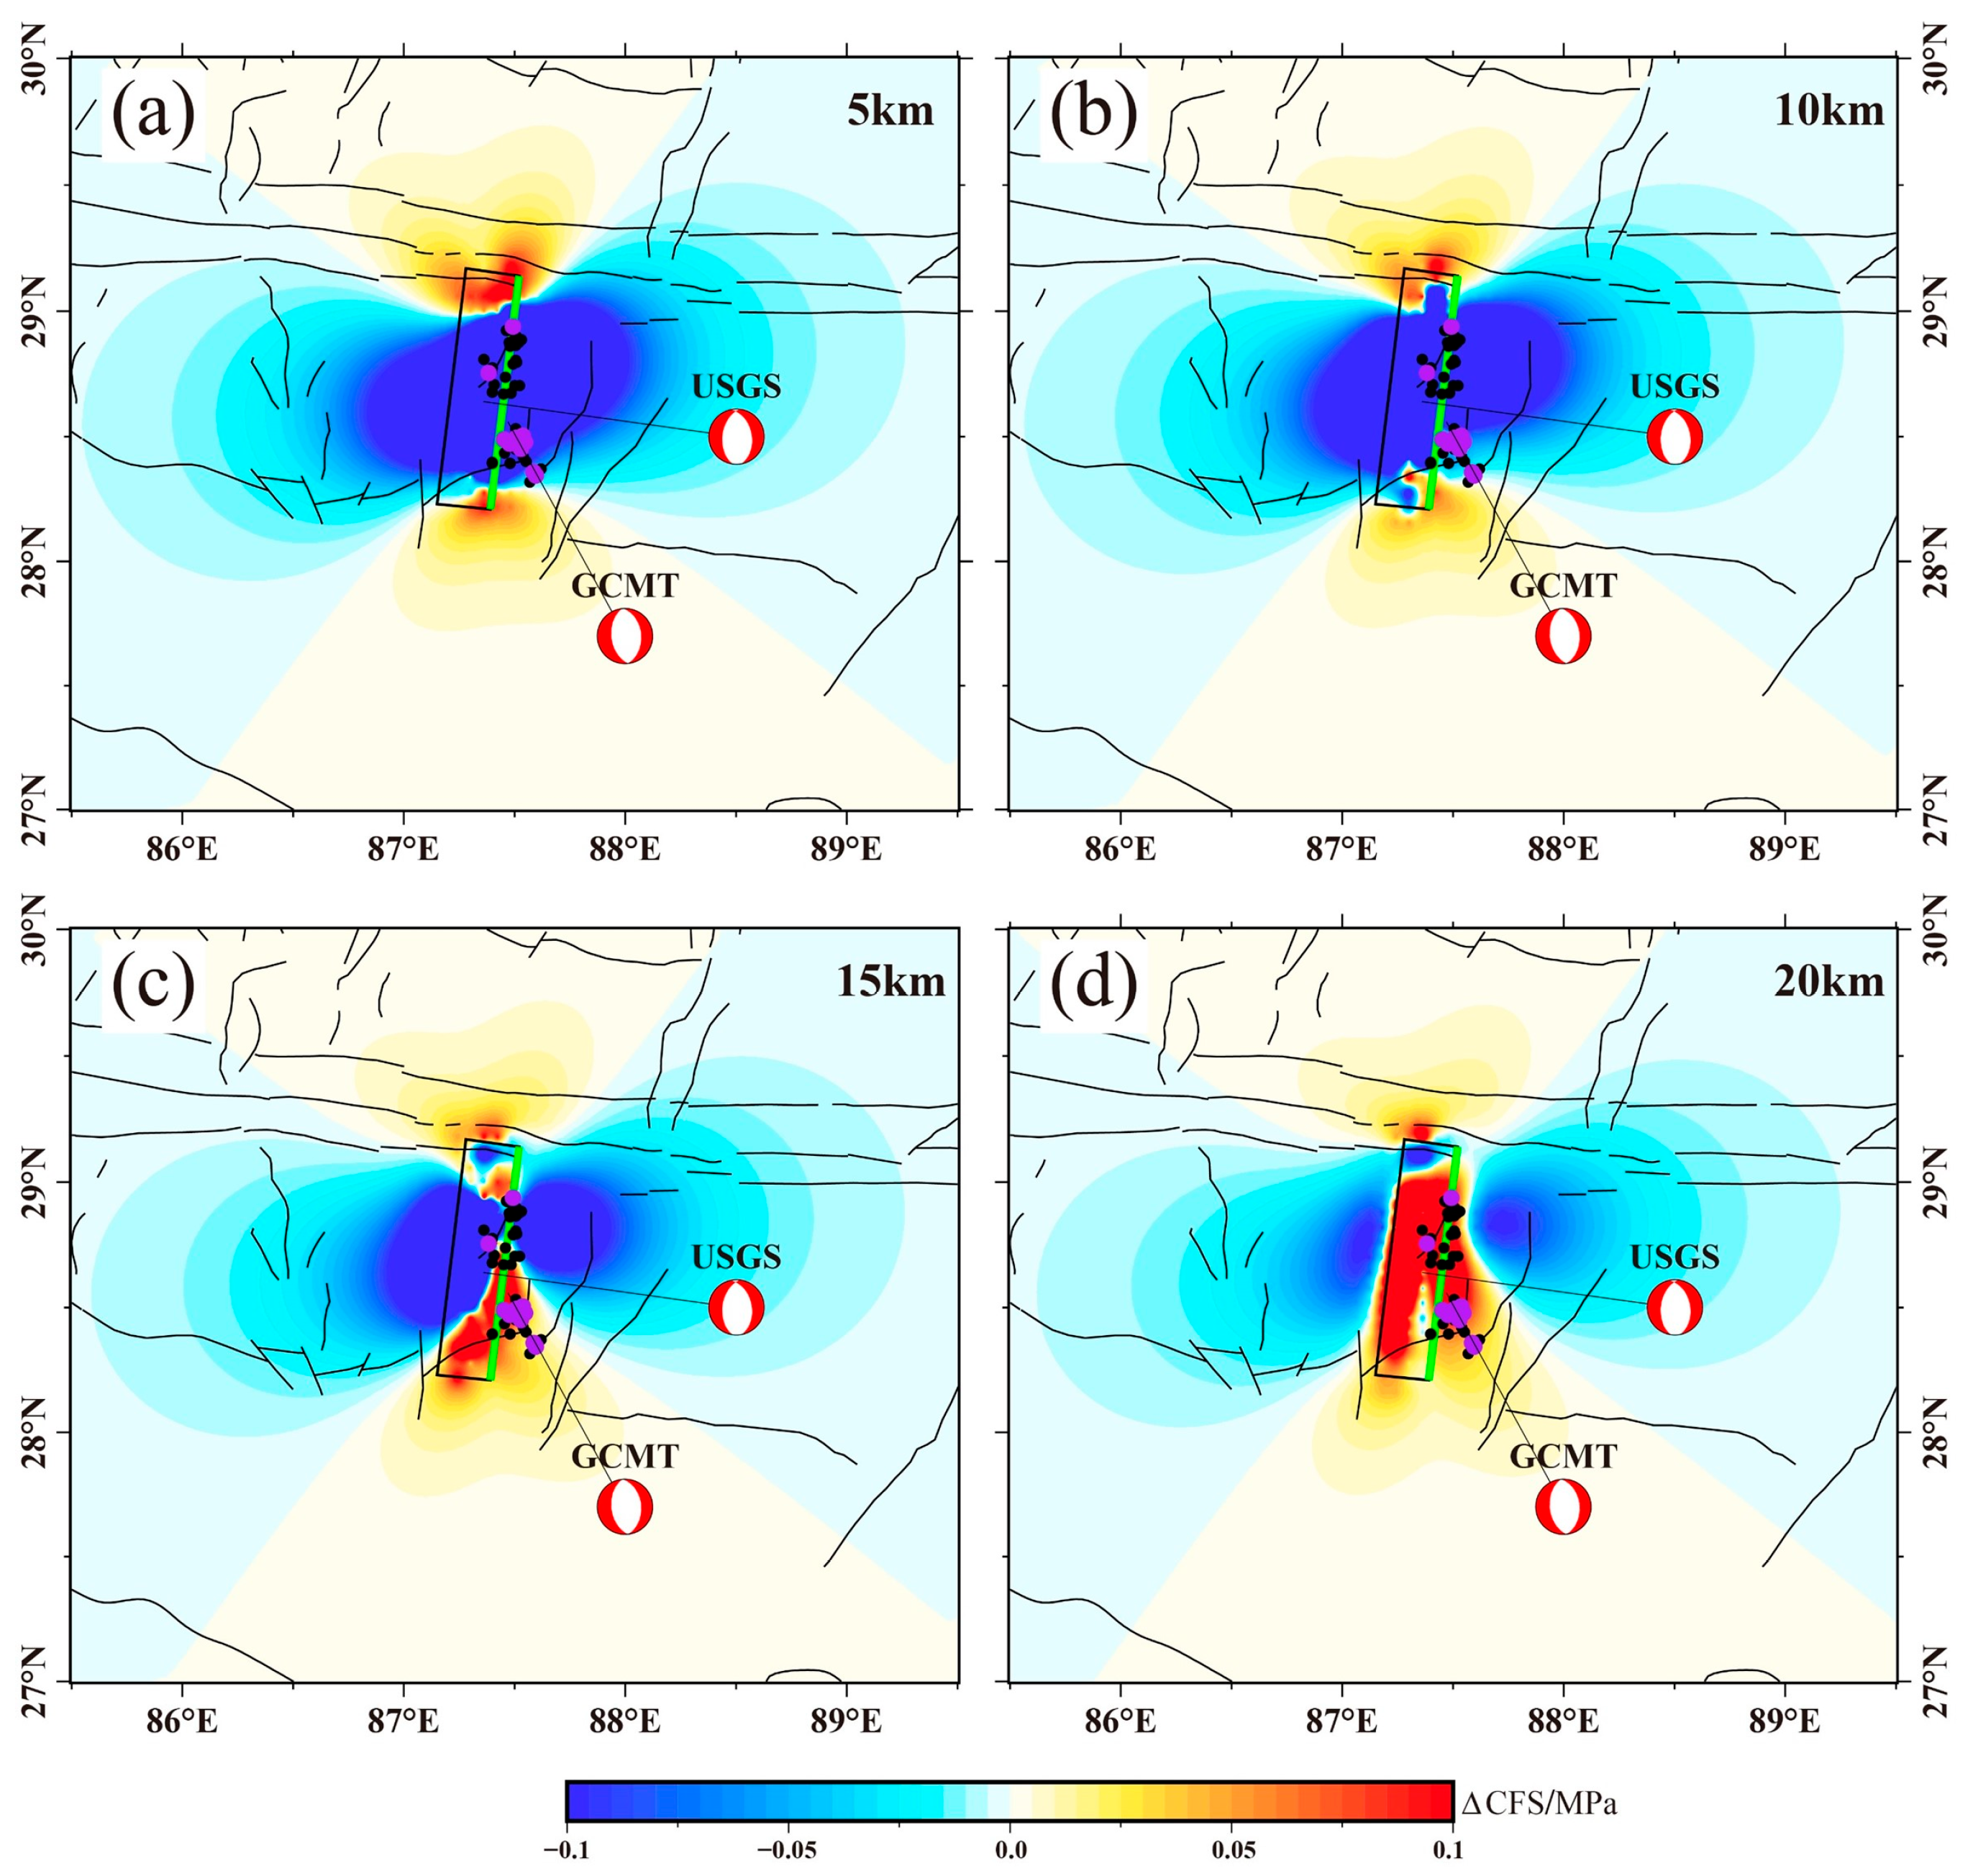
To quantify the static stress transfer resulting from the mainshock rupture process, we computed the static Coulomb stress (ΔCFS). The calculations were performed in Coulomb 3.3 software using our inverted slip model, considering receiver faults at various depths with optimal orientations parallel to the main rupture. The resultant ΔCFS values, where positive indicates stress loading (potentially promoting seismicity) and negative indicates unloading (inhibiting rupture), were analyzed to assess the mainshock’s influence on regional fault stability.
ΔCFS = Δτ + μ′Δσn
Here, ΔCFS refers to the Coulomb stress change imposed on a receiver fault, Δτ refers to the variation in shear stress in the sense of slip on the fault, μ′ represents the effective friction coefficient [27], and Δσn represents the perturbation in normal stress acting on the fault. A value of 0.4 was assigned to the friction coefficient μ′, and the receiver fault geometry was set to: strike 183.51°, dip 55.41°, and rake −71.95° matching the source parameters of the Dingri mainshock.

3. Results

3.1. InSAR Coseismic Deformation

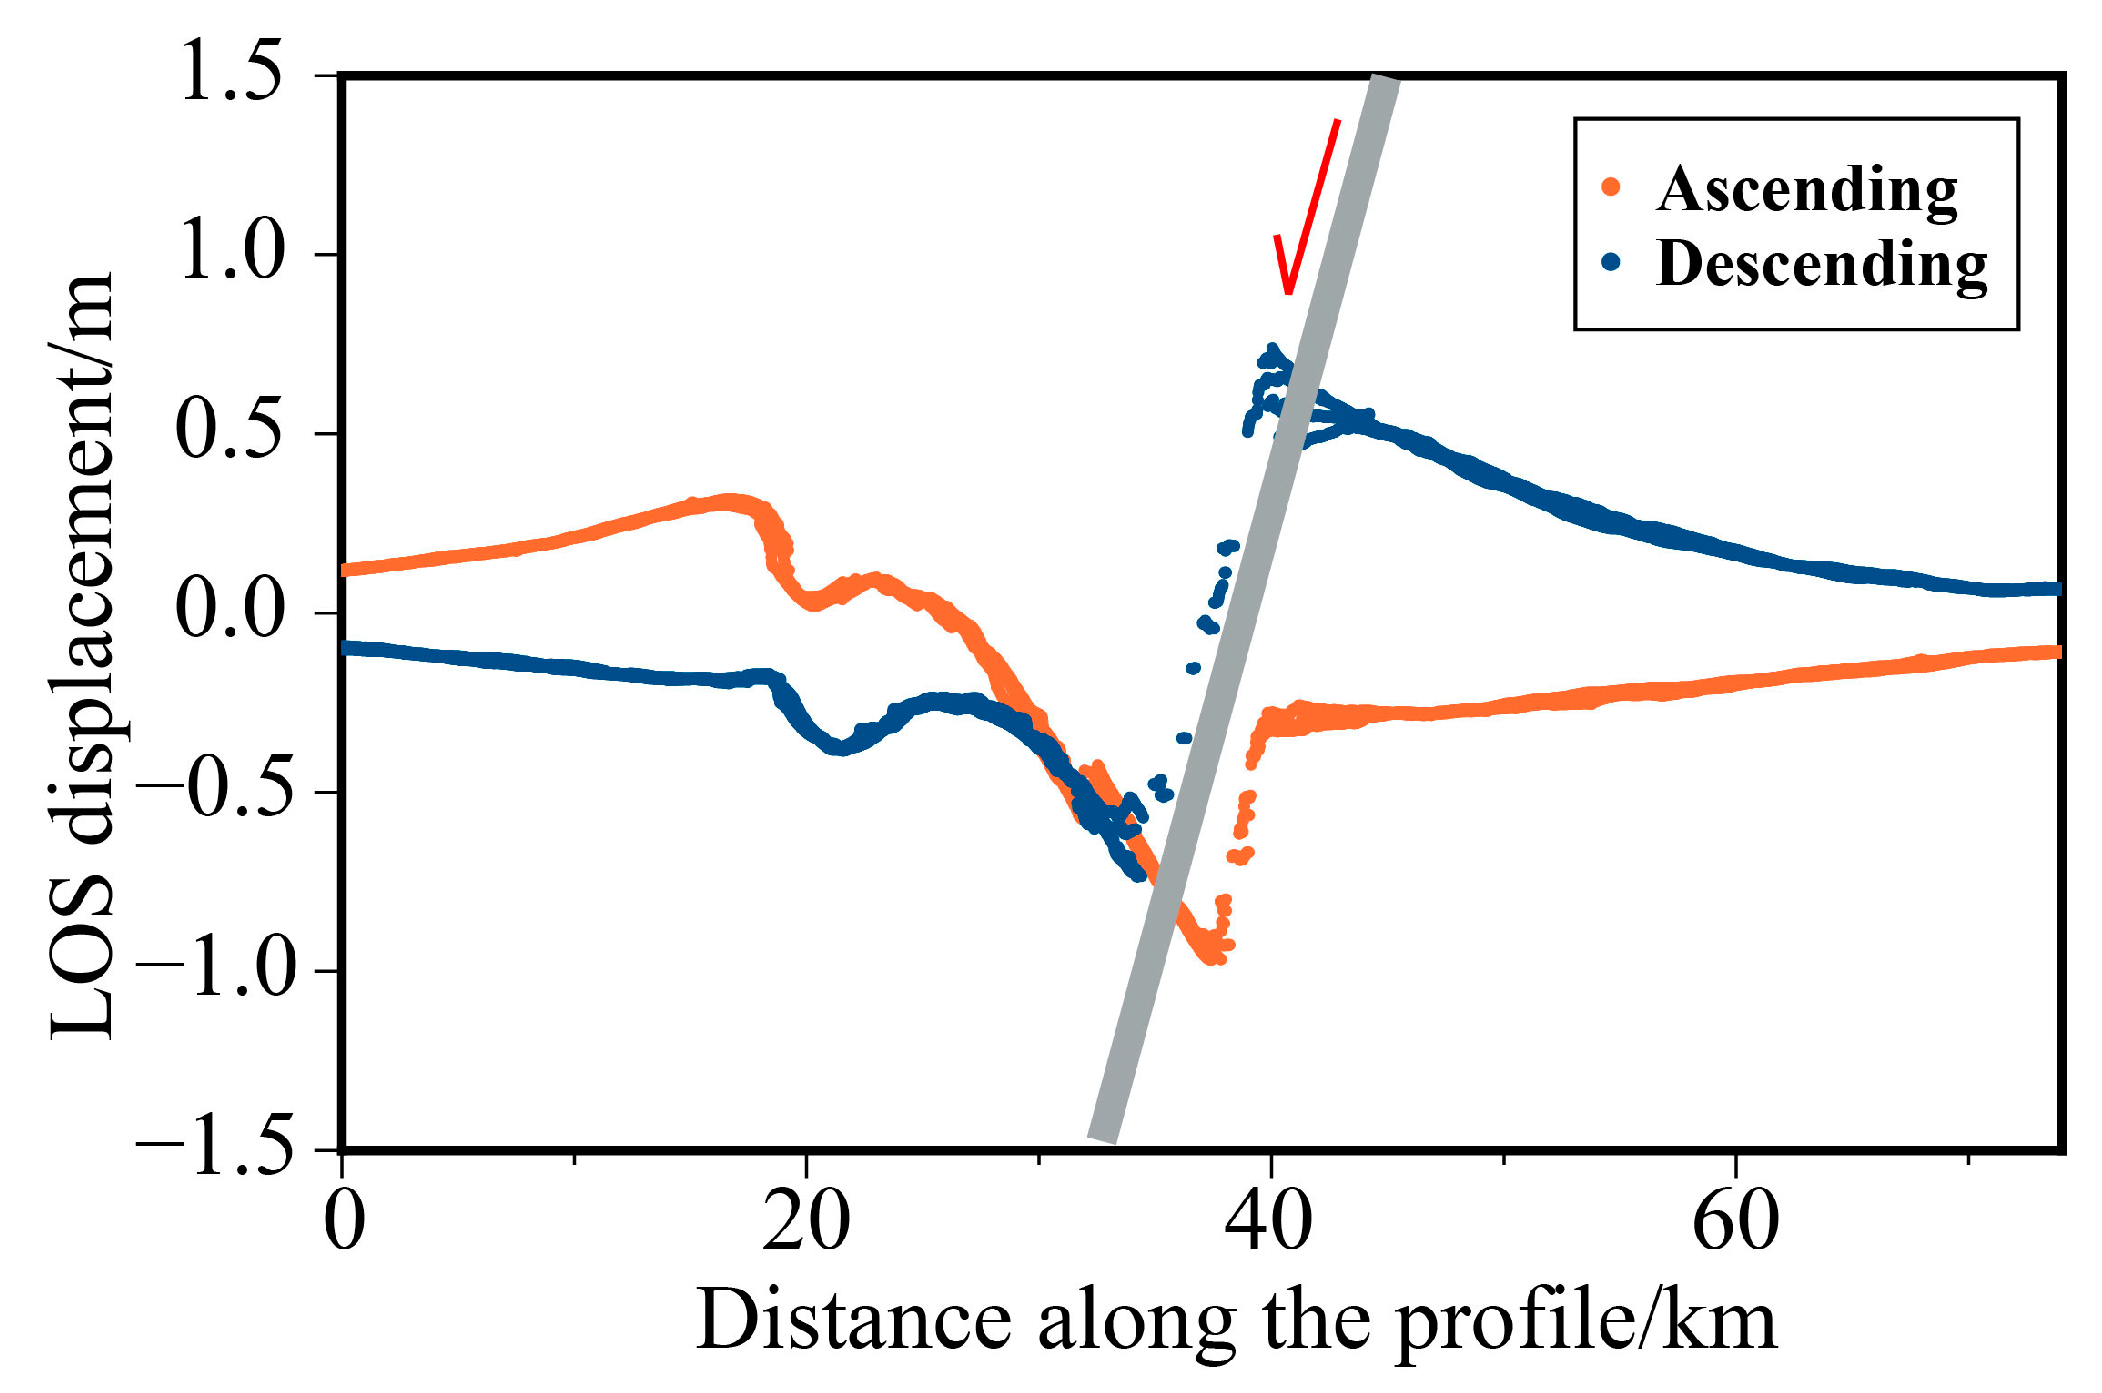
The LOS displacement profiles along transect A–B (Figure 2) show that deformation amplitude increases from the far field toward the fault trace, with abrupt displacement changes across the fault—indicative of possible surface rupture.
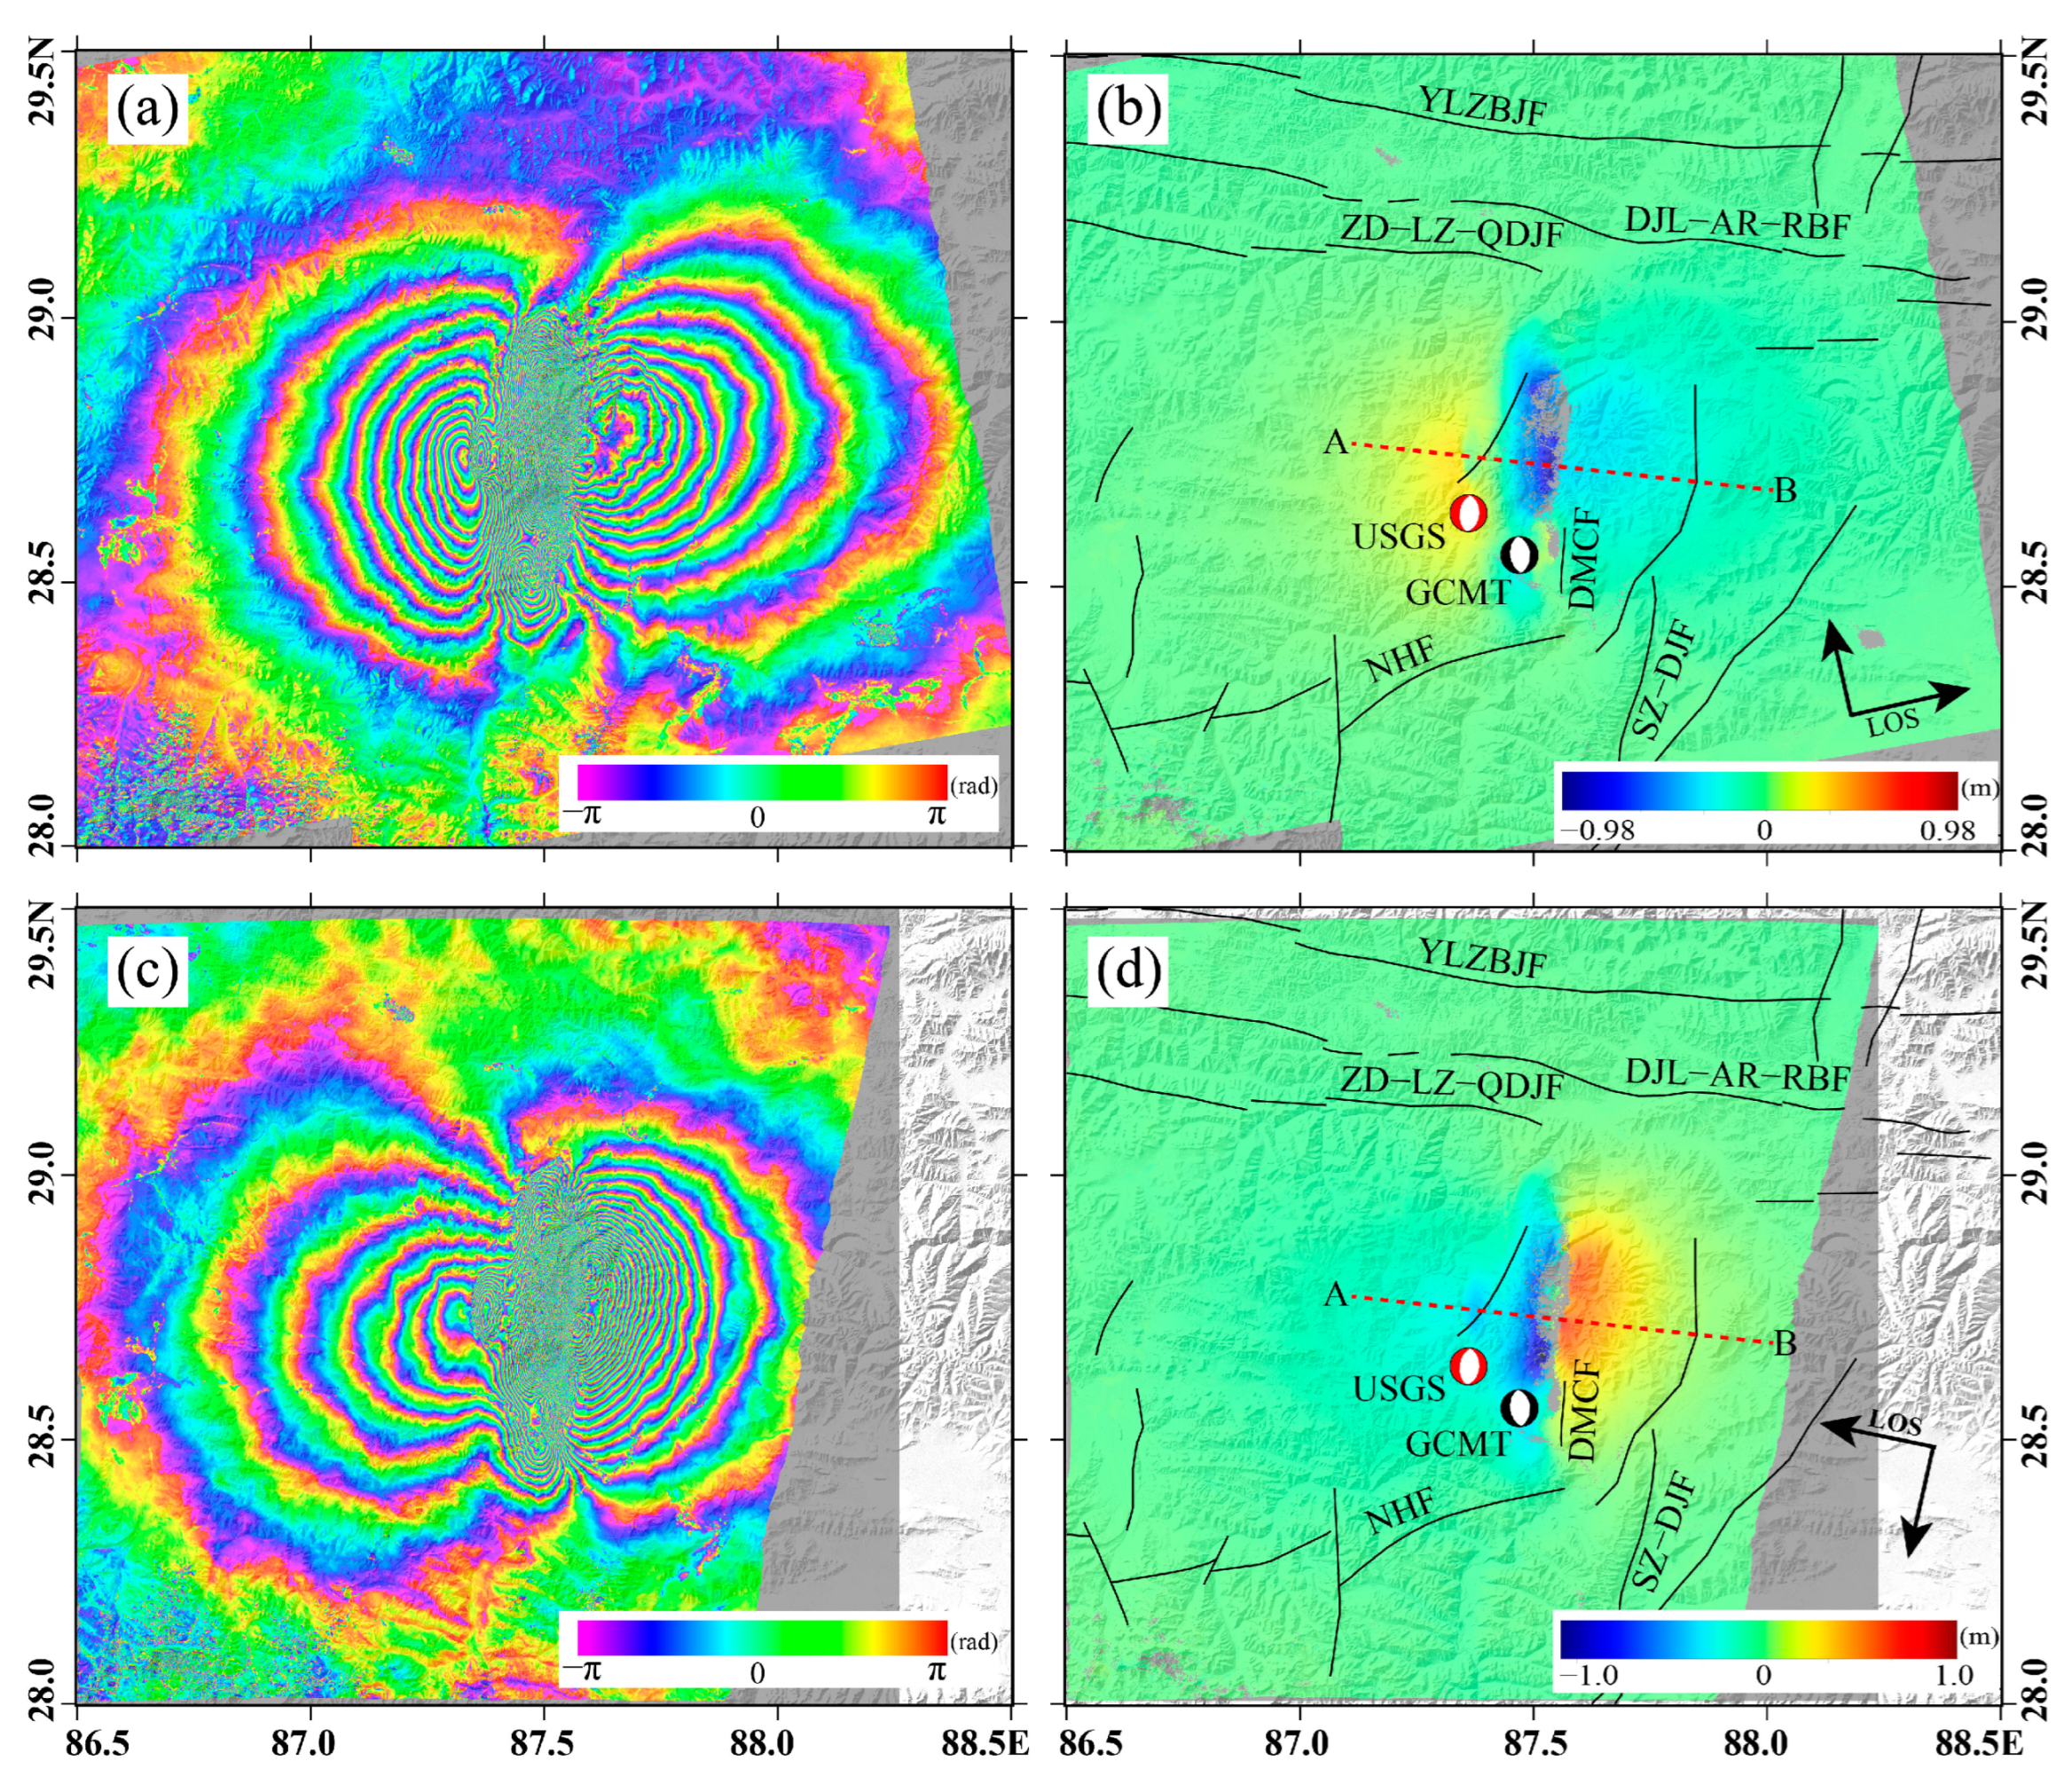
Negative LOS values represent motion away from the satellite. The ascending and descending tracks recorded maximum displacements of −1.06 m and −0.98 m, respectively. Positive values indicate motion toward the satellite direction with a maximum of +0.76 m. Differences in interference fringe patterns and displacement amplitudes between ascending and descending tracks mainly result from differences in radar look angles.
The deformation field (Figure 3) shows a continuous signal concentrated within the Denmo Co graben, whereas the western marginal fault of the graben exhibits a clear discontinuity in interferometric fringes, suggesting significant surface rupture. Field observations reported by the Institute of Geology, CEA confirm the presence of a NNE–SSW striking surface rupture zone, in excellent agreement with the InSAR-derived rupture trace.

3.2. Inversion of Fault Geometry and Slip Distribution

3.2.1. Uniform-Slip Model

To manage data volume and enhance inversion efficiency, we applied a quadtree down-sampling algorithm [21] to the ascending and descending deformation fields, preserving detailed deformation patterns in the near field while suppressing far-field noise. We obtained 1176 deformation points from the ascending track and 1138 from the descending track, respectively.
Using these data as constraints, we conducted a nonlinear inversion using the Okada model, adopting the Levenberg–Marquardt (L-M) optimization algorithm [26] to iteratively determine the best-fitting fault geometry parameters (Table 3).
The optimal solution indicates that the rupture plane of the Dingri MS 6.8 earthquake is approximately 28.42 km × 12.81 km, with a strike of 183.51°, dip of 55.41°, and rake of −71.95°. This geometry reveals a predominantly normal-faulting mechanism with a slight left-lateral strike-slip component, consistent with nodal plane II of focal mechanism solutions reported by other agencies (Table 1).
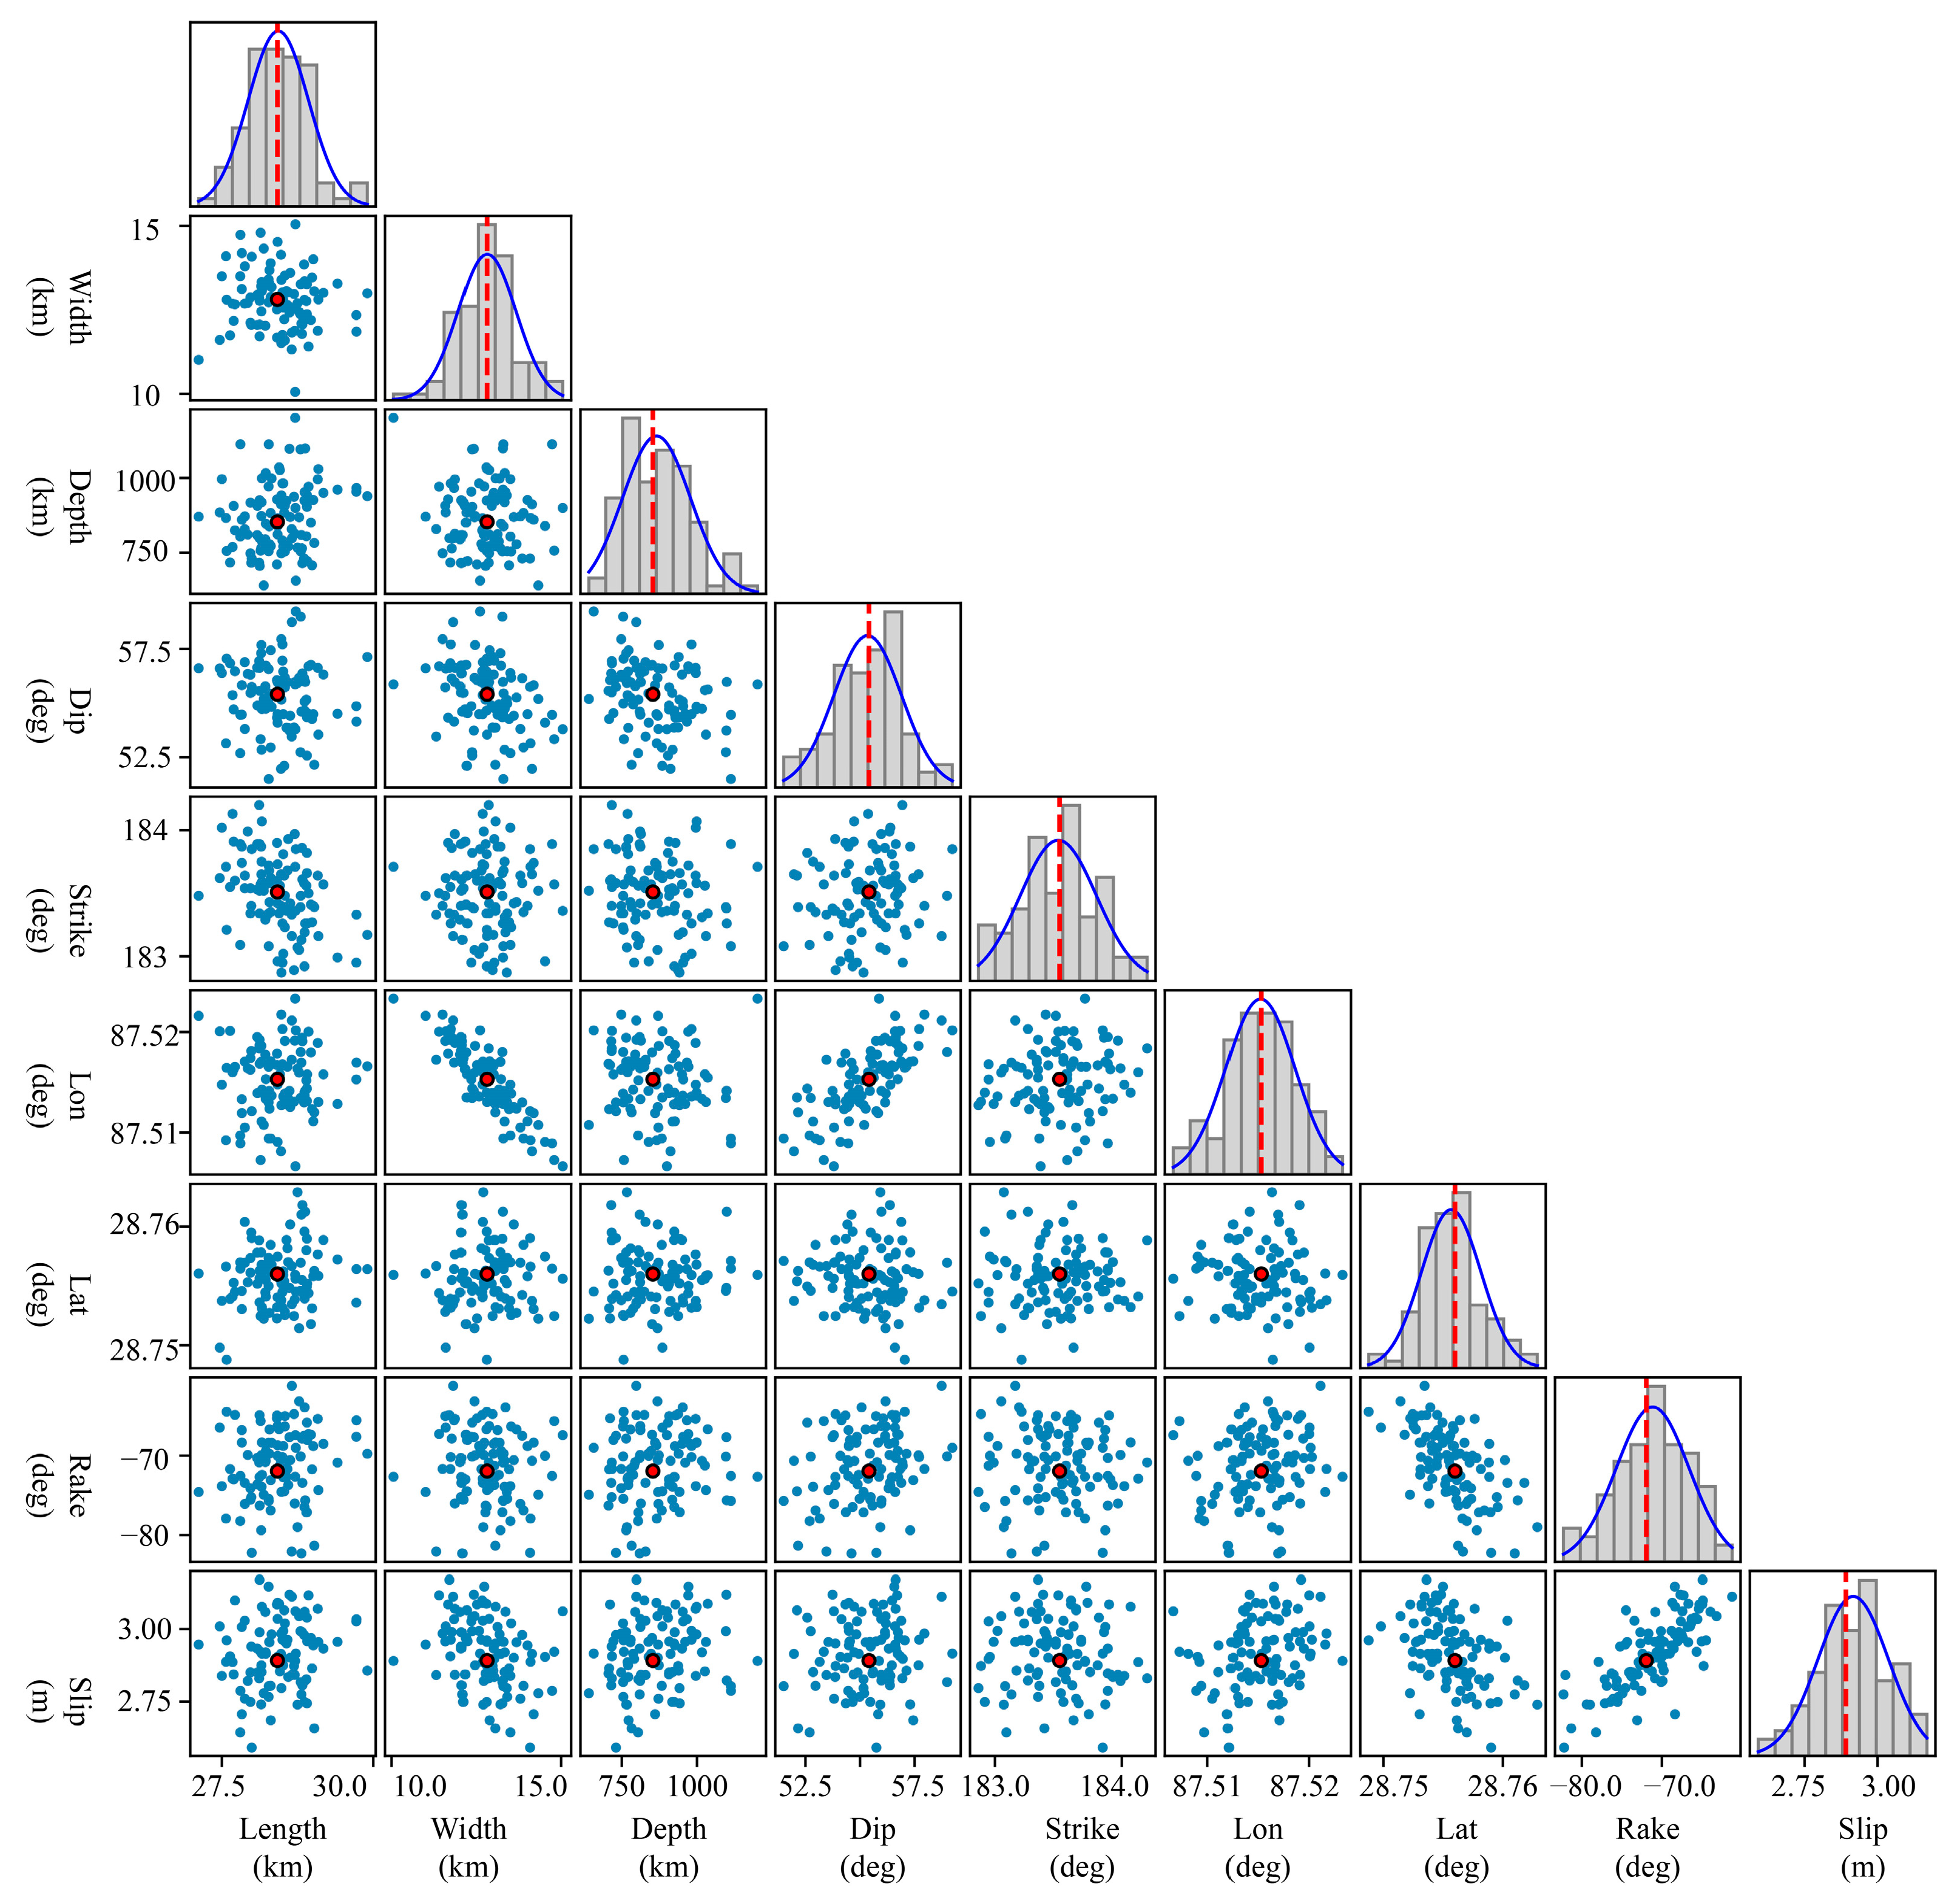
To assess the stability of the inversion results, we conducted a Monte Carlo simulation by superimposing spatially correlated random noise (scaled to observational error) onto the InSAR data and repeating the inversion 100 times. The statistical details (mean and standard deviation at 95% confidence level) of the fault parameters are summarized in Table 3. The results form an approximately Gaussian distribution centered close to the optimal estimate (Figure 4). This distribution morphology, which effectively characterizes a limited dispersion of parameter values, demonstrates strong consistency between the model-derived optimum and the Bayesian peak regions. Together, these findings confirm the robustness and reliability of our inversion.

3.2.2. Distributed-Slip Model

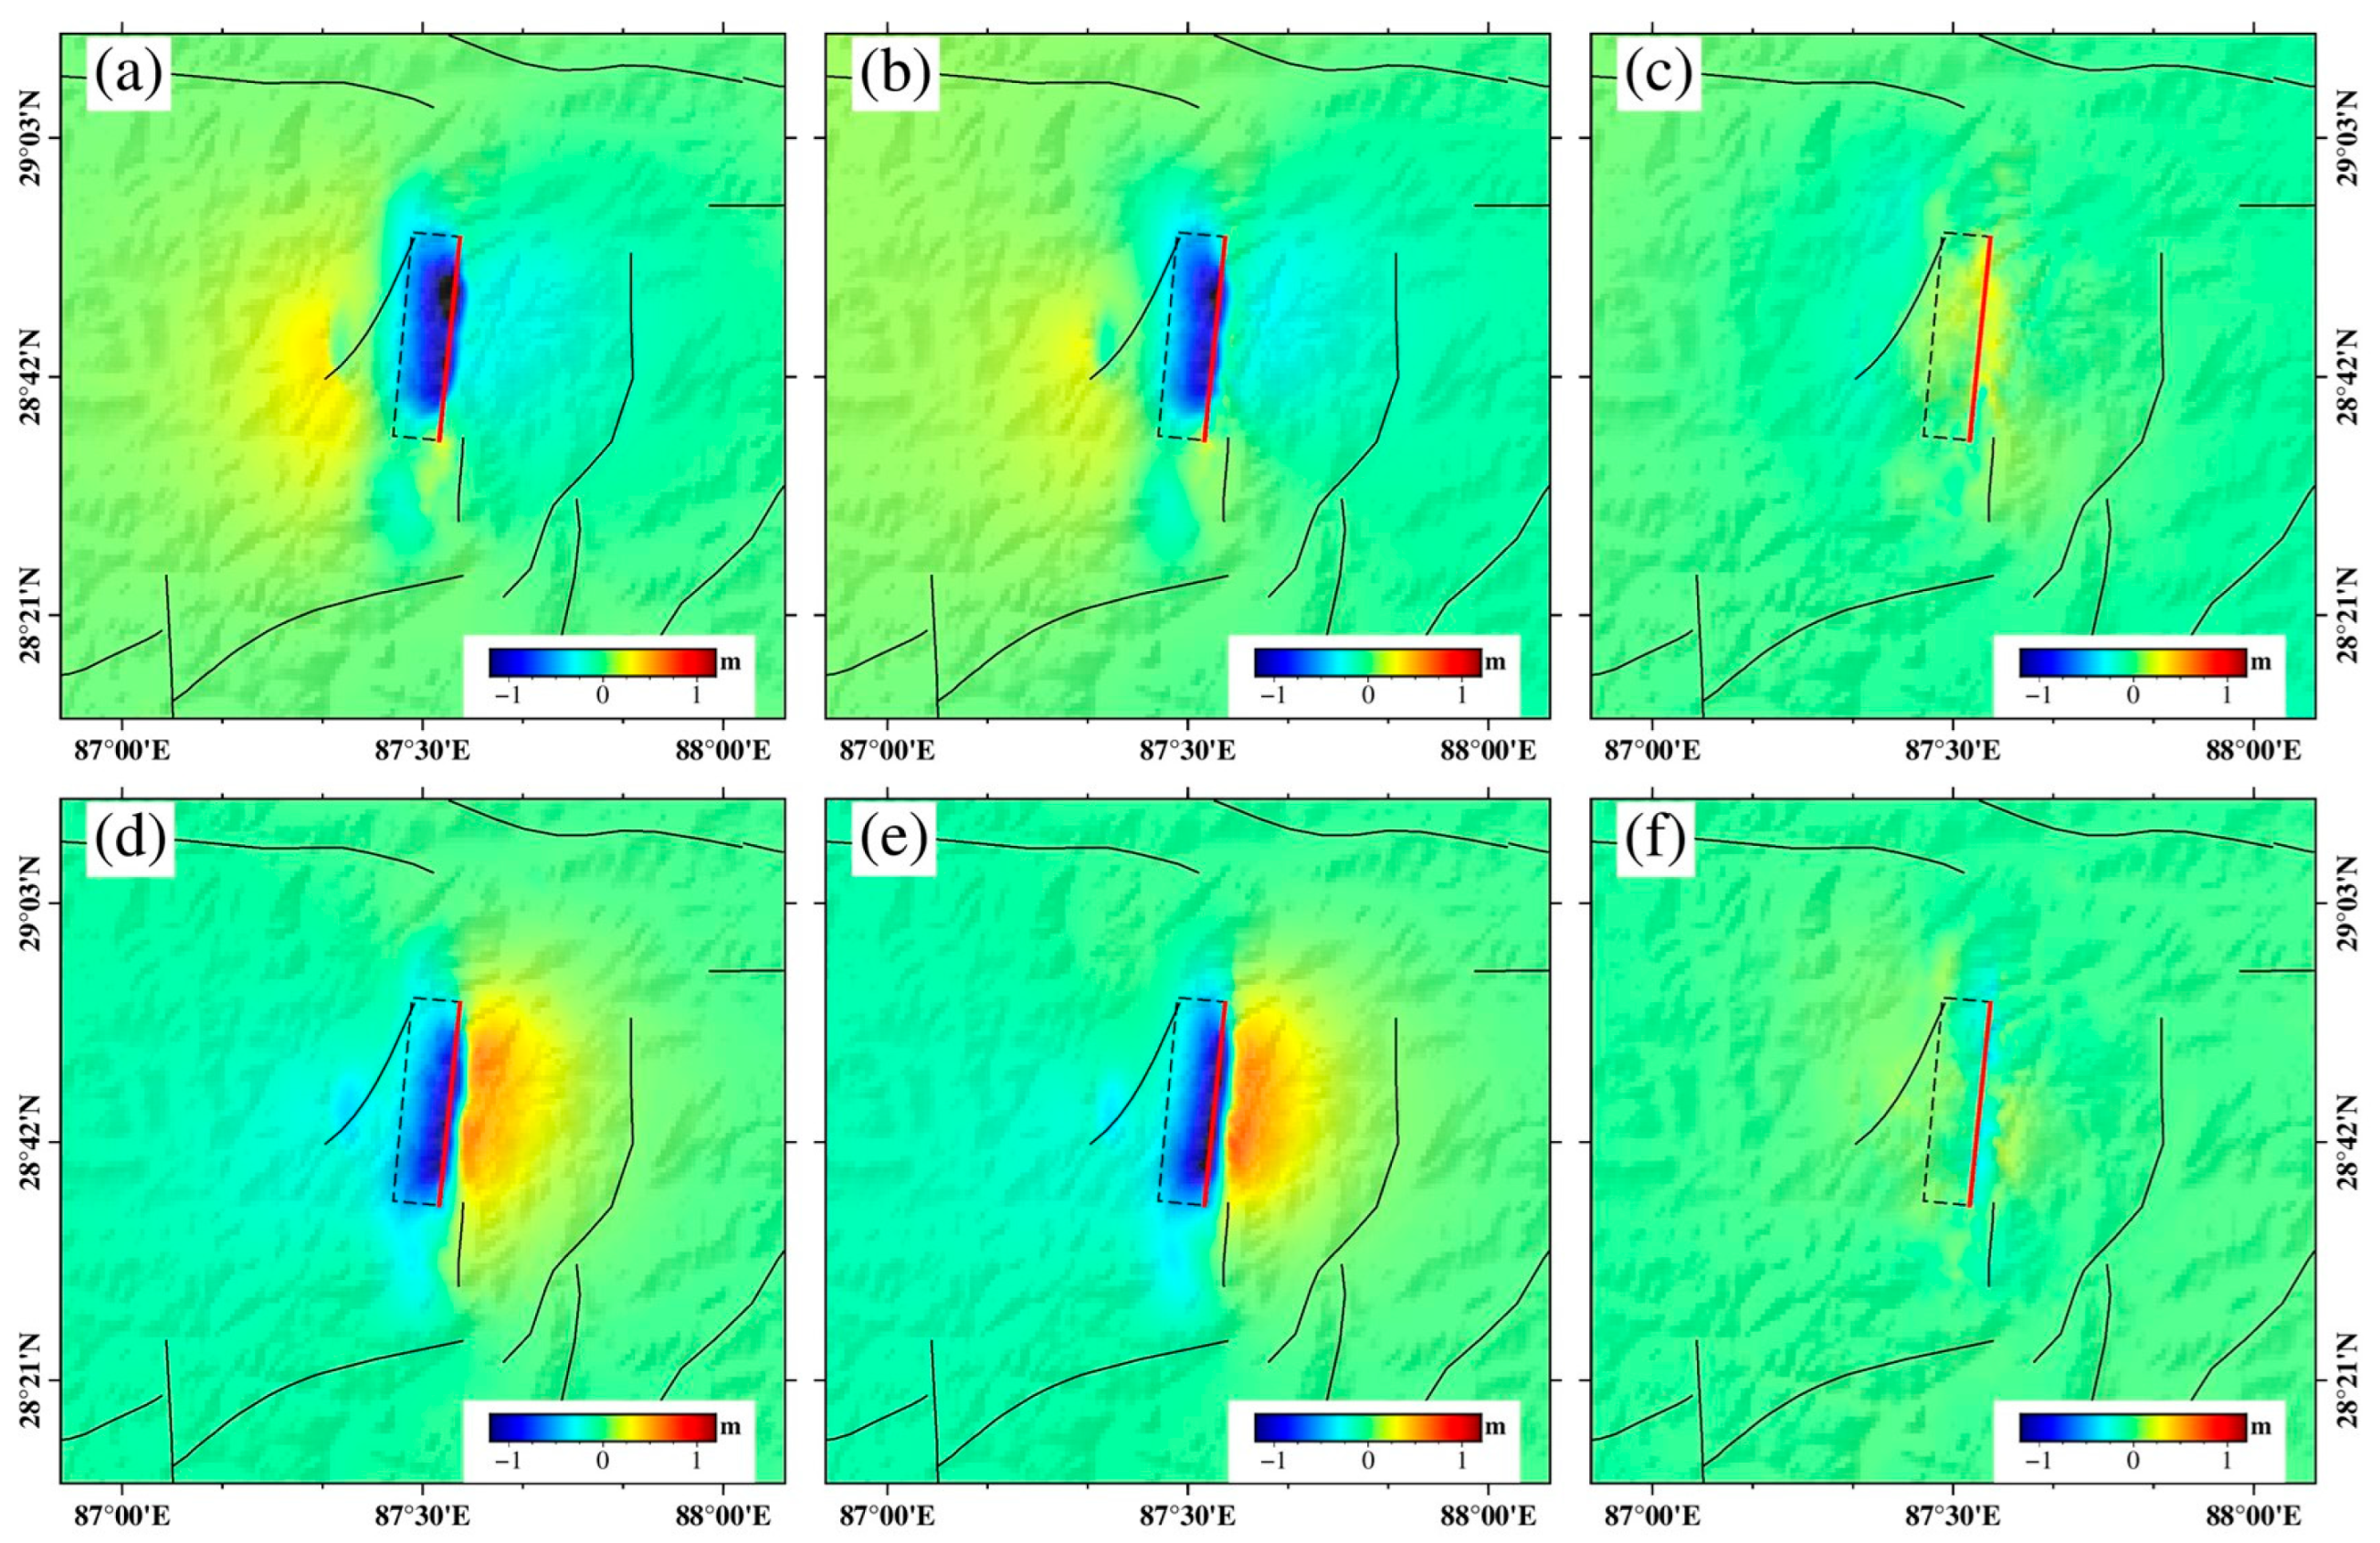
The residual maps (Figure 5) demonstrate that the distributed-slip model produces lower misfits compared to the uniform-slip model, indicating better agreement with the InSAR observations. Based on a shear modulus of 30 GPa, the seismic moment was calculated to be approximately 4.24 × 10¹⁹ Nm, yielding a moment magnitude of Mw 7.05, consistent with the USGS and GCMT solutions.
The resulting distributed-slip models in both plan view are shown in Figure 6. The rupture extends to a maximum depth of ~19.75 km, with a principal asperity ~33 km in length and ~13 km in width, concentrated at depths of 0–9.8 km. The peak dislocation reaches 4.79 m, located near the central portion of the fault plane.

3.3. Regional Stress Field Changes and Seismic Hazard Implications

The static stress variations induced by the Dingri MS 6.8 event exhibit two primary spatial patterns (Figure 7): (1) Near–north–south trend: Stress increases are observed along segments of the Zhada–Lazi–Qiongjie Fault and the Darjeeling–Ngamring–Renbu Fault, with the spatial extent of these positive ΔCFS zones varying with depth. (2) Near–east–west trend: A broad pattern of stress decrease is identified, with the affected area substantially diminishing at greater depths.
According to stress triggering theory, areas where ΔCFS exceeds 0.01 MPa indicate regions where fault segments are brought closer to critical failure conditions. This provides valuable insights for understanding the spatial distribution of subsequent seismic activity, particularly aftershock sequences. In this study, such stress-enhanced zones are mainly situated at: the northern and southern tips of the rupture zone (at 5 km and 10 km depths), and along the eastern and western flanks (at 15 km and 20 km depths).
These findings suggest that the static stress perturbations generated by the mainshock may influence the spatial pattern of subsequent seismicity. We recommend enhanced seismic monitoring of these areas in future studies and propose that they should be prioritized for investigating postseismic stress adjustment and aftershock triggering mechanisms.

4. Discussion

4.1. Methodological Advantage and Primary Findings

Traditional approaches such as optical remote sensing interpretation and field-based fault mapping are invaluable for the initial assessment of surface rupture characteristics and displacement. However, their spatial coverage and resolution limitations often preclude capturing the full extent and heterogeneity of the deformation field. This study leverages the systematic and comprehensive mapping capability of InSAR to resolve these shortcomings. Our high-resolution investigation reveals that the 7 January 2025 MS 6.8 Dingri event occurred along a northeastward extension branch of the Denmo Co Fault, predominantly exhibiting normal faulting with a light left-lateral component. Inversions of ascending and descending LOS deformation fields reveal dominant motion away from the satellite, with maximum displacement approaching 1 m. This pattern is indicative of substantial shallow strain release and firmly confirms the active nature of this fault branch within the regional extensional regime.

4.2. Comparison with the Conjugate Fault Model and Justification of Our Single-Fault Model

Our study presents a single-fault source model that provides a robust explanation for the primary cosesimic deformation signals. This model offers a different perspective from the two-fault conjugate rupture model proposed for the same event by Qiao et al. [28]. It is noteworthy that both models consistently identify the west-dipping structure (F1 in their model) as the dominant seismogenic fault, responsible for the majority of the moment release. This consensus underscores the primary role of this structure.
The key distinction lies in the interpretation of secondary deformation. Qiao et al. [28] attribute far-field displacement gradients west of the main rupture to cosesimic slip on a secondary east-dipping fault (F2). In contrast, our single-fault model explains the overall deformation pattern without requiring significant slip on a separate, deep-seated conjugate structure. The systematic residuals in the far-field observed in our single-fault inversion are of lower amplitude and could potentially be explained by more localized, shallow deformation or near-surface complexities not captured by a simple elastic dislocation model. This difference highlights the inherent non-uniqueness in geodetic inversion.
We acknowledge this non-uniqueness and rigorously evaluated an alternative two-fault scenario before adopting our preferred model. Our decision is grounded in several arguments: (1) Parsimony and Data Fit: Our single-fault model achieves a satisfactory fit to the primary InSAR observations. While adding a second fault might marginally improve the fit in specific areas, the principle of parsimony (Occam’s razor) favors the simpler model that adequately explains the dominant deformation. (2) Spatial Correlation with Aftershocks: The geometry of our single fault plane shows a strong spatial correlation with the main cluster of relocated aftershocks. The secondary western aftershock cluster cited as evidence for F2 is notably shallower and could be interpreted as triggered off-fault activity, rather than requiring a major, independently slipping fault plane. (3) Geomorphic Context: The surface projection of our single fault model aligns well with the clear, continuous surface rupture trace mapped by field investigations, which is primarily associated with the main west-dipping structure.
Therefore, we contend that the 2025 Dingri earthquake was predominantly accommodated by slip on a single, major normal fault, whose northeastward branch served as the primary rupture plane.

4.3. Seismic Hazard Implications and Stress Transfer

Coulomb stress change (ΔCFS) analysis based on our model provides critical insights into the seismic hazard evolution. The calculated ΔCFS exceeds 0.01 MPa at both rupture termini and flanks, identifying zones of elevated seismic potential conducive to future aftershocks or independent events. This stress pattern is consistent with typical shallow normal fault behavior and emphasizes that the northeastward branch serves not only as the primary rupture but also as a key structure governing regional stress redistribution.
Situated within the central Himalaya–southern Tibet extensional belt, the intersection of shallow normal faults in combination with strike-slip faults, as evidenced by the minor left-lateral component, likely amplifies local stress concentrations. The 2025 Dingri event underscores that active branch faults are critical structures capable of hosting significant earthquakes. Our findings emphasize the necessity of integrating high-resolution InSAR deformation, fault geometry inversion, and Coulomb stress modeling into comprehensive seismic hazard assessment. Continuous geodetic monitoring of such active branch faults is imperative for anticipating potential large earthquakes and informing targeted regional risk mitigation strategies.

5. Conclusions

In this study, we utilized Sentinel-1A SAR data to investigate the 7 January 2025 MS 6.8 Dingri event. Through two-pass Differential InSAR processing, we retrieved co-seismic deformation fields for both ascending and descending tracks. Nonlinear and linear inversions based on the Okada model were then conducted to resolve the fault geometry and distributed slip pattern, followed by Coulomb stress change calculations to assess regional seismic hazard. The main conclusions are:
Both ascending and descending LOS deformation fields reveal predominantly movement away from the satellite. The maximum LOS displacement reaches −1.06 m in the ascending track and −0.98 m in the descending track. Inversion of fault geometry yields a strike of 183.51°, dip of 55.41°, and rake of −71.95°, indicating a predominantly normal faulting mechanism with a light left-lateral component. The seismogenic fault is interpreted as a northeastward extension branch of the Denmo Co Fault.
The depth distribution of the main rupture zone spans from 0 to 9.8 km, with a single dominant asperity. The peak dislocation reaches 4.79 m. Given a shear modulus of 30 GPa, the derived seismic moment of ~4.24 × 10¹⁹ Nm yields a moment magnitude of Mw 7.05 consistent with GCMT and USGS estimates.
Positive cosesimic Coulomb stress changes (ΔCFS > 0.01 MPa) are predominantly concentrated at the northern and southern tips of the rupture zone (in the depth intervals of 5 km and 10 km) and along its eastern and western flanks (at 15 km and 20 km depths). These stress-loaded areas may influence the spatial distribution of subsequent seismic activity (particularly aftershock sequences), and their temporal evolution warrants continuous monitoring in future observations. This integrated analysis, combining high-resolution InSAR measurements, elastic dislocation modeling, and Coulomb stress change calculations, systematically reveals the source characteristics of the 2025 Dingri earthquake and its stress perturbation effects. The findings provide important constraints for understanding interseismic strain accumulation and earthquake sequence evolution in the central Himalaya–southern Tibet region.
Analysis of static Coulomb stress changes reveals significant positive ΔCFS values (>0.01 MPa) concentrated at the northern and southern tips of the rupture (5–10 km depth) and along its eastern and western flanks (15–20 km depth). These stress-loaded zones indicate areas where the potential for triggering subsequent seismicity—particularly aftershock activity—is heightened. This finding aligns with the established use of Coulomb stress analysis for evaluating short-term seismic triggering patterns rather than long-term hazard. The observed stress distribution provides a mechanical context for understanding the evolution of postseismic sequences in this region.
The integration of high-resolution InSAR deformation mapping, fault geometry inversion, and Coulomb stress analysis provides a comprehensive framework for understanding the source characteristics of the 2025 Dingri earthquake and its implications for regional tectonics. These results offer valuable constraints for refining seismogenic models and contribute to the basis for developing targeted monitoring strategies in the central Himalaya–southern Tibet region.

Author Contributions

Conceptualization, J.Z., B.Z., S.Y. and Y.C.; writing—original draft preparation; J.Z. methodology, J.Z.; software, S.Y.; validation, S.Y., Y.C. and J.Z.; investigation, Y.C.; resources, J.Z.; data curation, J.Z.; writing—review and editing, B.Z.; funding acquisition, B.Z. All authors have read and agreed to the published version of the manuscript.

Funding

This research was funded by the Science for Earthquake Resilience of the China Earthquake Administration, grant number (XH23040A), Earthquake Science and Technology Development Fund, Gansu Earthquake Agency, grant number (2021M4), the Special Project of Basic Scientific Research Operating Expenses, the Institute of Earthquake Forecasting, China Earthquake Administration, grant number (2021IESLZ06).

Data Availability Statement

Data will be available from the corresponding author upon request.

Acknowledgments

The ESA provided the Sentinel-1A data. Some figures in this paper were created using GMT 6.5 software.

Conflicts of Interest

The authors declare no conflicts of interest.

References

  1. Yang, T.; Wang, S.; Fang, L.; Wang, W.; Li, S.; Xu, G.; Tang, F. Analysis of Earthquake Sequence and Seismogenic Structure of the 2025 MS 6.8 Dingri Earthquake in the Tibetan Plateau. Earth Sci. 2025, 50, 1721–1732. [Google Scholar]
  2. Zhang, P.Z.; Shen, Z.; Wang, M.; Gan, W.; Bürgmann, R.; Molnar, P.; Wang, Q.; Niu, Z.; Sun, J.; Wu, J.; et al. Continuous Deformation of the Tibetan Plateau from Global Positioning System Data. Geology 2004, 32, 809–812. [Google Scholar] [CrossRef]
  3. Tapponnier, P.; Xu, Z.; Roger, F.; Meyer, B.; Arnaud, N.; Wittlinger, G.; Yang, J. Oblique Stepwise Rise and Growth of the Tibet Plateau. Science 2001, 294, 1671–1677. [Google Scholar] [CrossRef]
  4. Armijo, R.; Tapponnier, P.; Mercier, J.L.; Ha, T.L. Quaternary Extension in Southern Tibet: Field Observations and Tectonic Implications. J. Geophys. Res. Solid Earth 1986, 91, 13803–13872. [Google Scholar] [CrossRef]
  5. Bai, L.; Li, G.; Song, B. The Source Parameters of the M6.9 Mainling, Tibet Earthquake and Its Tectonic Implications. Chin. J. Geophys. 2017, 60, 4956–4963. [Google Scholar] [CrossRef]
  6. Zhang, X.M.; Du, G.B.; Liu, J.; Yang, Z.G.; Zou, L.Y.; Wu, X.Y. An M6.9 Earthquake at Mainling, Tibet on Nov. 18, 2017. Earth Planet. Phys. 2018, 2, 84–85. [Google Scholar] [CrossRef]
  7. Wang, S.; Replumaz, A.; Chevalier, M.; Li, H. Decoupling Between Upper Crustal Deformation of Southern Tibet and Underthrusting of Indian Lithosphere. Terra Nova 2022, 34, 62–71. [Google Scholar] [CrossRef]
  8. Shi, F.; Liang, M.; Luo, Q.; Qiao, J.; Zhang, D.; Wang, X.; Yi, W.; Zhang, J.; Zhang, Y.; Zhang, H. Seismogenic Fault and Coseismic Surface Deformation of the Dingri MS 6.8 Earthquake in Tibet, China. Seismol. Geol. 2025, 47, 1–15. [Google Scholar]
  9. Liang, M.; Dong, Y.; Zuo, H.; Dai, Y.; Xiao, B.; Liao, C.; Tan, L.; Wang, Y.; Li, X.; Tang, C.; et al. Surface Deformation Characteristics and Causes of the Dengmecuo Segment in the Xizang Dingri MS 6.8 Earthquake. Seismol. Geol. 2025, 47, 80–89. [Google Scholar]
  10. Bai, L.; Chen, Z.; Wang, S. The 2025 Dingri MS 6.8 Earthquake in Xizang: Analysis of Tectonic Background and Discussion of Source Characteristics. Rev. Geophys. Planet. Phys. 2025, 56, 258–263. [Google Scholar]
  11. Bai, Y.; Zhang, S.; Dong, Y.; Yang, Z.; Han, G. Characteristics of the Gravity Field and Faults in the Tingri–Muztagata Area, Xizang (Tibet) Plateau. Geol. Rev. 2012, 58, 237–249. [Google Scholar]
  12. Leloup, P.H.; Mahéo, G.; Arnaud, N.; Kali, E.; Boutonnet, E.; Liu, D.; Li, X.; Li, H. The South Tibet Detachment Shear Zone in the Dinggye Area: Time Constraints on Extrusion Models of the Himalayas. Earth Planet. Sci. Lett. 2010, 292, 1–16. [Google Scholar] [CrossRef]
  13. Tian, T.T.; Wu, Z.H. Recent Prehistoric Major Earthquake Event of Dingmucuo Normal Fault in the Southern Segment of the Shenzha–Dingjie Rift and Its Seismic Geological Significance. Geol. Rev. 2023, 69 (Suppl. S1), 53–55. [Google Scholar]
  14. Li, D.; Yang, B.; Chen, C. Obtaining Coseismic Deformation Field of the Jiuzhaigou Earthquake with Sentinel-1A Data. Remote Sens. Technol. Appl. 2018, 33, 1141–1148. [Google Scholar]
  15. Okada, Y. Surface Deformation Due to Shear and Tensile Faults in a Half-Space. Bull. Seismol. Soc. Am. 1985, 75, 1135–1154. [Google Scholar] [CrossRef]
  16. Massonnet, D.; Rossi, M.; Carmona, C.; Adragna, F.; Peltzer, G.; Feigl, K.; Rabaute, T. The Displacement Field of the Landers Earthquake Mapped by Radar Interferometry. Nature 1993, 364, 138–142. [Google Scholar] [CrossRef]
  17. Rosen, P.A.; Gurrola, E.; Sacco, G.F.; Zebker, H.A. The InSAR Scientific Computing Environment. In Proceedings of the 9th European Conference on Synthetic Aperture Radar (EUSAR 2012), Nuremberg, Germany, 23–26 April 2012; VDE: Berlin, Germany, 2012; pp. 730–733. [Google Scholar]
  18. Farr, T.G.; Rosen, P.A.; Caro, E.; Crippen, R.; Duren, R.; Hensley, S.; Kobrick, M.; Paller, M.; Rodriguez, E.; Roth, L.; et al. The Shuttle Radar Topography Mission. Rev. Geophys. 2007, 45, 1–33. [Google Scholar] [CrossRef]
  19. Weiss, J.R.; Walters, R.J.; Morishita, Y.; Wright, T.J.; Lazecky, M.; Wang, H.; Hussain, E.; Hooper, A.J.; Elliott, J.R.; Rollins, C.; et al. High-Resolution Surface Velocities and Strain for Anatolia from Sentinel-1 InSAR and GNSS Data. Geophys. Res. Lett. 2020, 47, e2020GL087376. [Google Scholar] [CrossRef]
  20. Goldstein, R.M. Atmospheric limitations to repeat-track radar interferometry. Geophys. Res. Lett. 1995, 22, 2517–2520. [Google Scholar] [CrossRef]
  21. Werner, C.; Wegmuller, U.; Strozzi, T.; Wiesmann, A. Processing strategies for phase unwrapping for InSAR applications. In Proceedings of the European Conference on Synthetic Aperture Radar (EUSAR 2002), Cologne, Germany, 4–6 June 2002. [Google Scholar]
  22. Yu, C.; Li, Z.; Penna, N.T.; Crippa, P. Generic atmospheric correction model for Interferometric Synthetic Aperture Radar observations. J. Geophys. Res. Solid Earth 2018, 123, 9202–9222. [Google Scholar] [CrossRef]
  23. Yu, C.; Li, Z.; Penna, N.T. Interferometric synthetic aperture radar atmospheric correction using a GPS-based iterative tropospheric decomposition model. Remote Sens. Environ. 2018, 204, 109–121. [Google Scholar] [CrossRef]
  24. Yu, C.; Penna, N.T.; Li, Z. Generation of real-time mode high-resolution water vapor fields from GPS observations. J. Geophys. Res. Atmos. 2017, 122, 2008–2025. [Google Scholar] [CrossRef]
  25. Jónsson, S.; Zebker, H.; Segall, P.; Amelung, F. Fault Slip Distribution of the 1999 Mw 7.1 Hector Mine, California, Earthquake, Estimated from Satellite Radar and GPS Measurements. Bull. Seismol. Soc. Am. 2002, 92, 1377–1389. [Google Scholar] [CrossRef]
  26. Marquardt, D.W. An Algorithm for Least-Squares Estimation of Non-Linear Parameters. J. Soc. Ind. Appl. Math. 1963, 11, 431–441. [Google Scholar] [CrossRef]
  27. Barbot, S.; Fialko, Y.; Bock, Y. Postseismic deformation due to the Mw 6.0 2004 Parkfield earthquake: Stress-driven creep on a fault with spatially variable rate-and-state friction parameters. J. Geophys. Res. 2009, 114, B07405. [Google Scholar] [CrossRef]
  28. Qiao, X.; Lu, Z.; Yan, S.; Shi, H.; Zhi, M.; Zhao, D. The 2025 MW 7.0 Dingri Earthquake: Conjugate Normal Faulting of a Graben Structure in the Southern Xainza-Dinggye Rift. Remote Sens. 2025, 52, e2025GL116154. [Google Scholar]
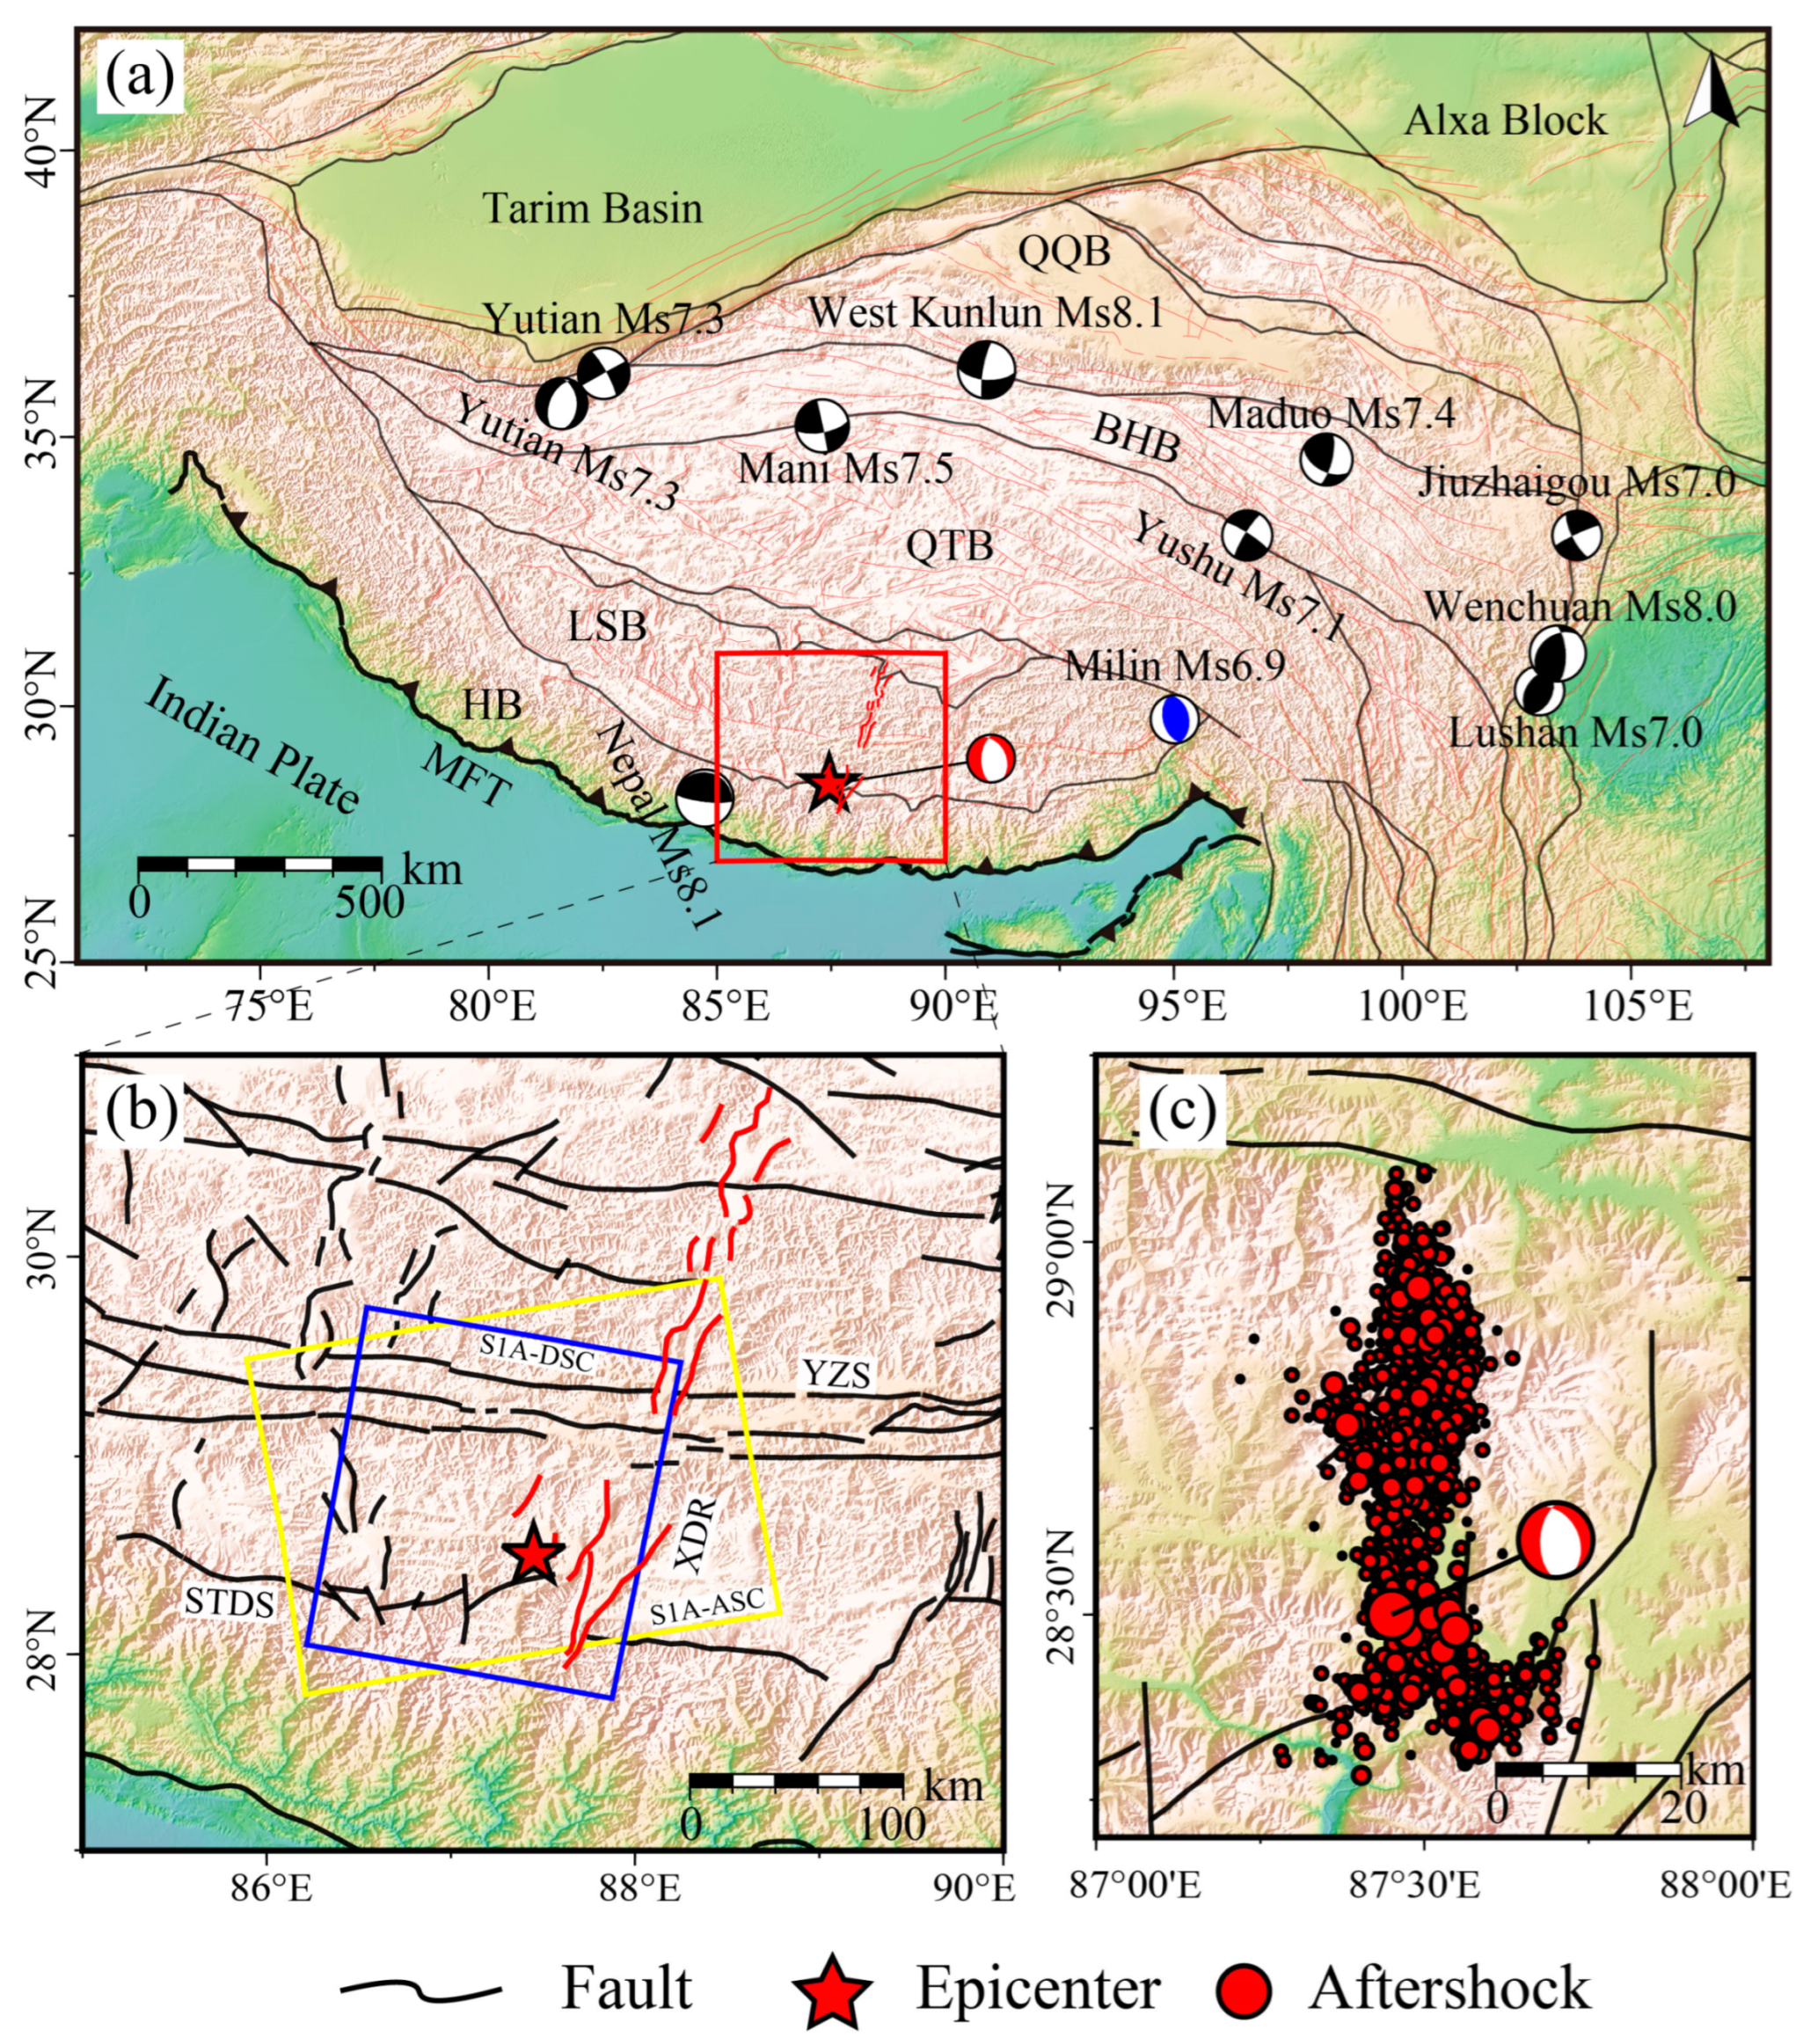
Figure 1. Geological and Tectonic Background of the Investigated Region. (a) Red box in the shows the study area within the Tibetan Plateau, the red beach ball symbolizes the moment tensor solution derived in this study for the 2025 MW 7.05 Dingri earthquake. The blue beach ball corresponds to the 2017 MS 6.9 Milin earthquake’s moment tensor solution. The black beach balls represent 10 shallow-focus earthquakes with a magnitude of plateau-wide MW ≥ 7 earthquakes since the 1997 Mani earthquake, MFT: Main Frontal Thrust, HB: Himalayan Terrane, LSB: Lhasa Terrane, QTB: Qiang-tang Terrane, BHB: Bayan Har Terrane, QQB: Qaidam-Qilian Terrane; (b) Yellow and blue rectangles outline the spatial coverage of Sentinel-1 (ascending and descending) synthetic aperture radar datasets, respectively, STDS: South Tibetan Detachment System, YZS: Yarlung Zangbo Suture. (c) Relocated aftershock distribution of the Dingri earthquake from Yang et al. [1].
Geosciences 15 00421 g001
Figure 2. LOS Coseismic Deformation Profiles along A–B Transect. The gray diagonal lines indicate the profile of the simulated faults, The orange dots representing the profiles of the ascending track deformation field, The dark blue dots representing the profiles for the descending orbits deformation field.
Geosciences 15 00421 g002
Figure 3. LOS Coseismic Deformation and Interferograms Observed from Ascending and Descending Tracks. (a) ascending track wrapped interferogram; (b) ascending track displacement field; (c) descending track wrapped interferogram; (d) descending track displacement field. The red and black focal spheres denote the source mechanisms from USGS and GCMT for the Dingri earthquake, respectively. Black fault traces delineate the active fault systems recognized in the study area. The red dash line segment indicates profile AB, with the profile measurement results shown in Figure 2. Black arrows indicate the satellite’s ascending and descending track directions. DMCF: Dengmo Co fault; NHF: South Tibetan Detachment System; YLZBJF: Yarlung Zangbo Suture Zone; SJF: Xainza–Dingjie fault zone; ZD–LZ–QDJF: Zhada–Lazi–Qiongduojiang fault; DJL–AR-RBF: Dajiling–Angren–Renbu fault.
Geosciences 15 00421 g003
Figure 4. Posterior Distributions and Parameter Correlations from Monte Carlo Inversions. The maximum a posteriori solution is marked by a red dashed line (histogram) and red dots (2D correlation plot). Each blue dot corresponds to one possible fault realization in the ensemble of random samples.
Geosciences 15 00421 g004
Figure 5. Modeled and Residual Coseismic InSAR Deformation Fields. The red lines delineate the surface trace of the seismogenic fault. The black dashed lines delineate the surface trace of the fault plane. the black solid line segments indicate the surrounding faults, (ac) The Data, model, and residual for the ascending viewing geometry. (df) The Data, model, and residual for the descending viewing geometry.
Geosciences 15 00421 g005
Figure 6. Distributed Slip Models of the Dingri MS 6.8 Earthquake. The white arrows indicate the slip directions of the fault patches.
Geosciences 15 00421 g006
Figure 7. Coseismic static Coulomb stress changes on receiver faults parallel to the mainshock at different depths. Subplots (ad) show the stress changes at depths of 5, 10, 15, 20 km, respectively. The black dots represent M3–4 aftershocks, purple dots represent M4–5 aftershocks, and the black line denotes the fault, The black rectangular box represents the surface trace of the inverted fault plane, The green line represents the junction of the fault with the ground.
Geosciences 15 00421 g007
Table 1. The Source Mechanism Solutions from Different Institutions.
SourceLon/(°)Lat/(°)Strike/(°)Dip/(°)Rake/(°)Magnitude
USGS87.4728.56356/17342/48−88/−92MW 7.1
GCMT87.3628.64349/18742/49−103/−78MW 7.05
GFZ87.4128.570/16449/41−79/−102MW 7.1
IPGP87.3628.64341/19651/44−113/−64MW 7.16
CENC87.4528.50356.3/184.443.6/47.7−102.7/−78.1MW 7.0
This study87.5128.76183.555.4−71.9MW 7.05
Table 2. Basic Information of the SAR Data Employed in This Study.
PathDateOrbit
Direction
Time(d)Spatial Baseline (m)Azimuth
Angle (°)
Incidence
Angle (°)
T1212025/01/01Descend12−15.23−167.3536.71
2025/01/13
T122025/01/05Ascend1253.24−12.6539.49
2025/01/17
Table 3. Fault Parameters from the Combined Inversion of Ascending and Descending Data.
Length/kmWidth/kmDepth/kmDip/(°)Strike/(°)Lon/(°)Lat/(°)Rake/(°)Slip/m
Best fit28.4212.81853.355.41183.5187.515328.7559−71.952.89
mean28.4312.84861.955.35183.5087.515128.7557−71.142.92
Std0.50.81108.41.560.300.00330.00254.560.12
Disclaimer/Publisher’s Note: The statements, opinions and data contained in all publications are solely those of the individual author(s) and contributor(s) and not of MDPI and/or the editor(s). MDPI and/or the editor(s) disclaim responsibility for any injury to people or property resulting from any ideas, methods, instructions or products referred to in the content.