Article

Upwellings and Mantle Ponding Zones in the Lower Mantle Transition Zone (660–1000 km)

1
Institut de Physique du Globe de Paris, Université Paris Cité, 75005 Paris, France
2
Department of Earth and Planetary Science, University of California, Berkeley, CA 94720-4767, USA
3
Institute of Geological Sciences, University of Bern, Baltzerstrasse 1 + 3, 3012 Bern, Switzerland
4
Direction Applications Militaires—Ile de France, Commissariat l’Energie Atomique, F-91297 Arpajon, France
*
Author to whom correspondence should be addressed.
Geosciences 2025, 15(11), 413; https://doi.org/10.3390/geosciences15110413
Submission received: 7 July 2025 / Revised: 15 September 2025 / Accepted: 19 October 2025 / Published: 30 October 2025
(This article belongs to the Special Issue Seismology of the Dynamic Deep Earth)

Abstract

Convective instabilities at various boundary layers in the earth’s mantle—including the core–mantle boundary, mantle transition zone and lithosphere-asthenosphere boundary— result in upwellings (mantle plumes) and downwellings (subducting slabs). While hotspot volcanism is traditionally linked to mantle plumes, their structure, origins, evolution, and death remain subjects of ongoing debate. Recent progress in seismic tomography has revealed a complex plumbing system connecting the core–mantle boundary and the surface. In particular, recent seismic imaging results suggest the presence of large-scale ponding zones between 660 km and ∼1000 km, associated with several mantle plumes around the globe. The broad upwellings originating from the CMB spread laterally beneath the 660 km seismic discontinuity, forming extensive ponding zones several thousand kilometers wide and extending up from an approximately 1000 km depth. Similar ponding zones are also observed for downwellings, with stagnant subducting slabs, within the 660–1000 km depth range. Here, we review evidence for wide ponding zones characterized by low seismic velocities and anomalous radial and azimuthal anisotropies in light of recent high-resolution regional studies below La Réunion Island in the Indian Ocean and below St Helena/Ascension in the southern Atlantic Ocean. We review and discuss possible interpretations of these structures, as well as possible mineralogical, geodynamic implications and outlook for further investigations aiming to improve our understanding of the mantle plumbing system.

1. Introduction

The theory of plate tectonics does not explain the presence of “hotspot” volcanism in the middle of tectonic plates. These have been attributed to the presence of plumes of hot material originating in the deep mantle [1,2]. Even though less than 10% of the global surface heat flow can be directly associated with their activity, mantle plumes play a significant role in many geological processes such as flood basalts, continental break-up and mass extinctions (e.g., [3,4,5]).
The morphology, nature, and evolution of mantle plumes and their significance in mantle dynamics are still widely debated. The “classical” plume model consisted of a thin conduit, less than 100 km in radius with a mushroom-shaped head [6,7]. However, since these pioneering studies, this hypothesis was challenged by geophysical observations and dynamical modelling (see, for instance, the debates presented in [8]). There are different families of volcanic plumes (e.g., [9,10]) originating from different boundary layers within the mantle, the core–mantle boundary (CMB), the mantle transition zone, or the asthenosphere. Theoretical modeling has suggested that mantle plumes can display a wide variety of morphologies: they can be tilted by mantle wind [11] and thin or thick depending on their thermal or thermochemical nature [12,13,14]. Seismic observations have suggested that plumes might stagnate in the transition zone [15] or split into several branches on their way to the surface [16]. Ref. [17] imaged mantle plumes using finite-frequency travel time tomography, and observed a widening of plumes just below the 660 km discontinuity. The existence of ponding zones at the base of the lithosphere was conjectured a long time ago [18] and, more recently, in the mid-mantle [19].
Until recently, imaging of mantle plumes was mostly based on travel time tomography, which, even including finite-frequency kernels [20], suffered from poor illumination due to the uneven distribution of earthquake sources and recording stations around the world, especially in the southern hemisphere. In the past 20 years, significant progress has been made, owing to the introduction of full waveform inversion (FWI) and the use of the Spectral Element Method (SEM) for the computation of the seismic wavefield [21,22]. FWI allows for sampling to be improved due to the inclusion of many seismic phases that bounce around the mantle [23], while the SEM accurately predicts the effects of scattering, in particular, by low-velocity zones of small spatial extent such as mantle plumes [24].
Improved radial and lateral resolution owing to this type of FWI led to the realization that the Iceland plume does not extend straight down from the surface to the deep mantle, but is offset horizontally around a 1000 km depth [25]. At the global scale, French et al. (2015) [26] showed the presence of fat quasi-vertical low-velocity conduits extending from the CMB to about 1000 km in the vicinity of most major hotspots lying above the large low shear velocity provinces (LLSVPs) present at the base of the mantle. They are too wide to represent purely thermal plumes, suggesting a thermochemical nature and/or a complex rheology in the lower mantle. Many of these conduits also appear to be deflected horizontally, suggesting plume “ponding” around that depth. This was later confirmed in higher-resolution whole-mantle regional FWI studies, in the depth range of 660–1000 km, beneath the southwest Indian Ocean and the La Réunion hotspot [27] and, more recently, beneath the south and central Atlantic hotspots [28]. There are some other examples of high-resolution observations with ponding zones for Yellowstone in North America [29], such as Iceland and Jan Mayen in the Northern Atlantic [25]. These studies also show that the large low shear velocity provinces (LLSVPs) are likely not unbroken structures extending high above the CMB, but rather zones of concentration of mantle plumes [30]. We note that most subducted slabs also “stagnate” either above or below the 660 km discontinuity [31,32], but it is not clear that these two observations (i.e., stagnant slab and transition zone ponding zones) are dynamically related.
Here, we focus on two high-resolution regional studies developed using a full waveform inversion technique (FWI) which we briefly describe, and we also describe evidence for “ponding” in the mantle transition zone (MTZ) of the Reunion plume and of mantle plumes in the south and central Atlantic Oceans. We then discuss possible relevant observations from anisotropic tomography. Finally, we discuss their possible origin and their geodynamic importance.

2. Full Waveform Seismic Imaging of Mantle Plumes

The full waveform inversion (FWI) technique used for the development of models SEMINDO-WM3 [27] in the Indian Ocean and SEMATL _ 23 [28] in the south and central Atlantic is based on the theoretical framework of Li and Romanowicz (1995) [33]. It uses three-component seismic waveform data and solves for the distribution of isotropic shear velocity as well as radial anisotropy represented by the parameter ξ = ( V S H V S V ) 2 . The seismic waveforms are split into wavepackets containing one or several seismic phases [23,34]. This makes it possible to account for the relative amplitudes of different phases, and the indexing of wavepackets by the seismic phases they contain. Longer period surface waveforms (period range 40–400 s) are split into fundamental mode and overtone wavepackets, while body waveforms (period range 30–180 s) typically include one or several prominent body wave phases, such as S, SS, PS, SP, ScS, ScSn, or Sdiff. For the forward calculation of the seismic wavefield, the spectral element method (SEM) is used, while for the inverse problem, a Gauss–Newton optimization method is applied, with the Hessian calculated using normal mode perturbation theory [33]. The construction of the models proceeds in two steps, by first inverting surface-waveform data including fundamental and higher modes for structure across the upper-mantle (down to a 800 or 900 km depth), and then extending the model down to the CMB by including body waveform data.
In the case of the western Indian Ocean, the regional SEM code RegSEM developed by Cupillard et al. (2012) [35] was used for the forward modeling. In the case of the south-central Atlantic ocean, the code SPECFEM3D_globe was used [28] as the region considered was larger than the 90  ×  90 chunk allowed for RegSEM. Details of the general methodology can be found in [27,28,34,36,37] for the regional studies discussed here.

2.1. Seismic Tomographic Imaging of La Réunion Plume

Located in the western Indian Ocean, La Réunion Island is one of the most active volcanic hotspots on Earth. Its birth is dated at ∼65 Ma ago, and it is associated with the expansion of the Deccan volcanic traps in India (∼2 million km2 and 4 km thick), and with the Cretaceous–Tertiary boundary [5] (see the inset of Figure 1 for the geological setting). The island of La Réunion, located on the African/Somali plate represents the 109 active part of a NS-trending hotspot track (i.e, the record of the northward motion of the 110 Indian Plate over a relatively stationary mantle plume). The seismic coverage around La Réunion hotspot was greatly improved during the last 10 years, owing to broadband (BB) seismic data from permanent land-based stations operated over the past 20 years and, more importantly, from a temporary experiment which deployed Ocean Bottom Seismometers (OBSs) in the western Indian Ocean, in the framework of the RHUM-RUM French-German experiment [38,39]. This made it possible to obtain a surface wave tomographic model with a lateral resolution of 400 km down to a ∼300 km depth [40]. This tomographic model exhibits a large-scale low shear-velocity area beneath the Mascarene Basin, at depths between 100–200 km, coined the Mascarene Basin Asthenospheric Reservoir (MBAR) [41], confirming earlier lower resolution (>1000 km) observations of Montagner et al. (1986) [42] and Debayle et al. (1997) [43]. The evidence of MBAR is good evidence of a ponding zone in the uppermost mantle beneath the lithosphere-asthenosphere boundary.
The LMTZ (660–1000 km depth) remained poorly resolved by classical tomography as it corresponds to the lower limit of resolution for surface wave phase/group velocities and is not well sampled in regions of upwelling by P and S travel time data. Thanks to the good coverage around La Réunion Island provided by the RHUM-RUM experiment stations, permanent and temporary experiments in Eastern Africa, Madagascar, and various islands in the Indian ocean, it was possible to significantly improve the lateral and vertical resolution in this depth range using finite frequency travel time tomography [16] as well as FWI as described in the previous section [27]. Here, we focus on the unexpected finding of the ponding zones in the lower mantle (LMPZ) between 660 and 1000 km depth from FWI (Figure 1).
In the Indian Ocean, the SEMINDO-WM3 [27] model displays three separate quasi-vertical upwellings originating at the core–mantle boundary (CMB) up to approximately 1000–1100 km. At a depth of ∼1000 km, the upwellings merge into a large-scale (several thousands of kilometers) low-velocity zone extending up to 660 km depth, which we coined the lower mantle ponding zone (LMPZ) (Figure 1). In the upper mantle, vertical upwellings are again visible beneath most of the Indian hotspots (La Réunion, Kerguelen, Marion, Crozet, and Comores) but offset with respect to the lower mantle vertical conduits and the large LMPZ beneath La Reunion Island. This LMPZ is well resolved as demonstrated by many numerical tests [27]. However, such LMPZs are not detected beneath other hotspots in the region, such as Kerguelen, Marion, or Crozet.

2.2. Full Waveform Tomography of the Southern and Central Atlantic Mantle

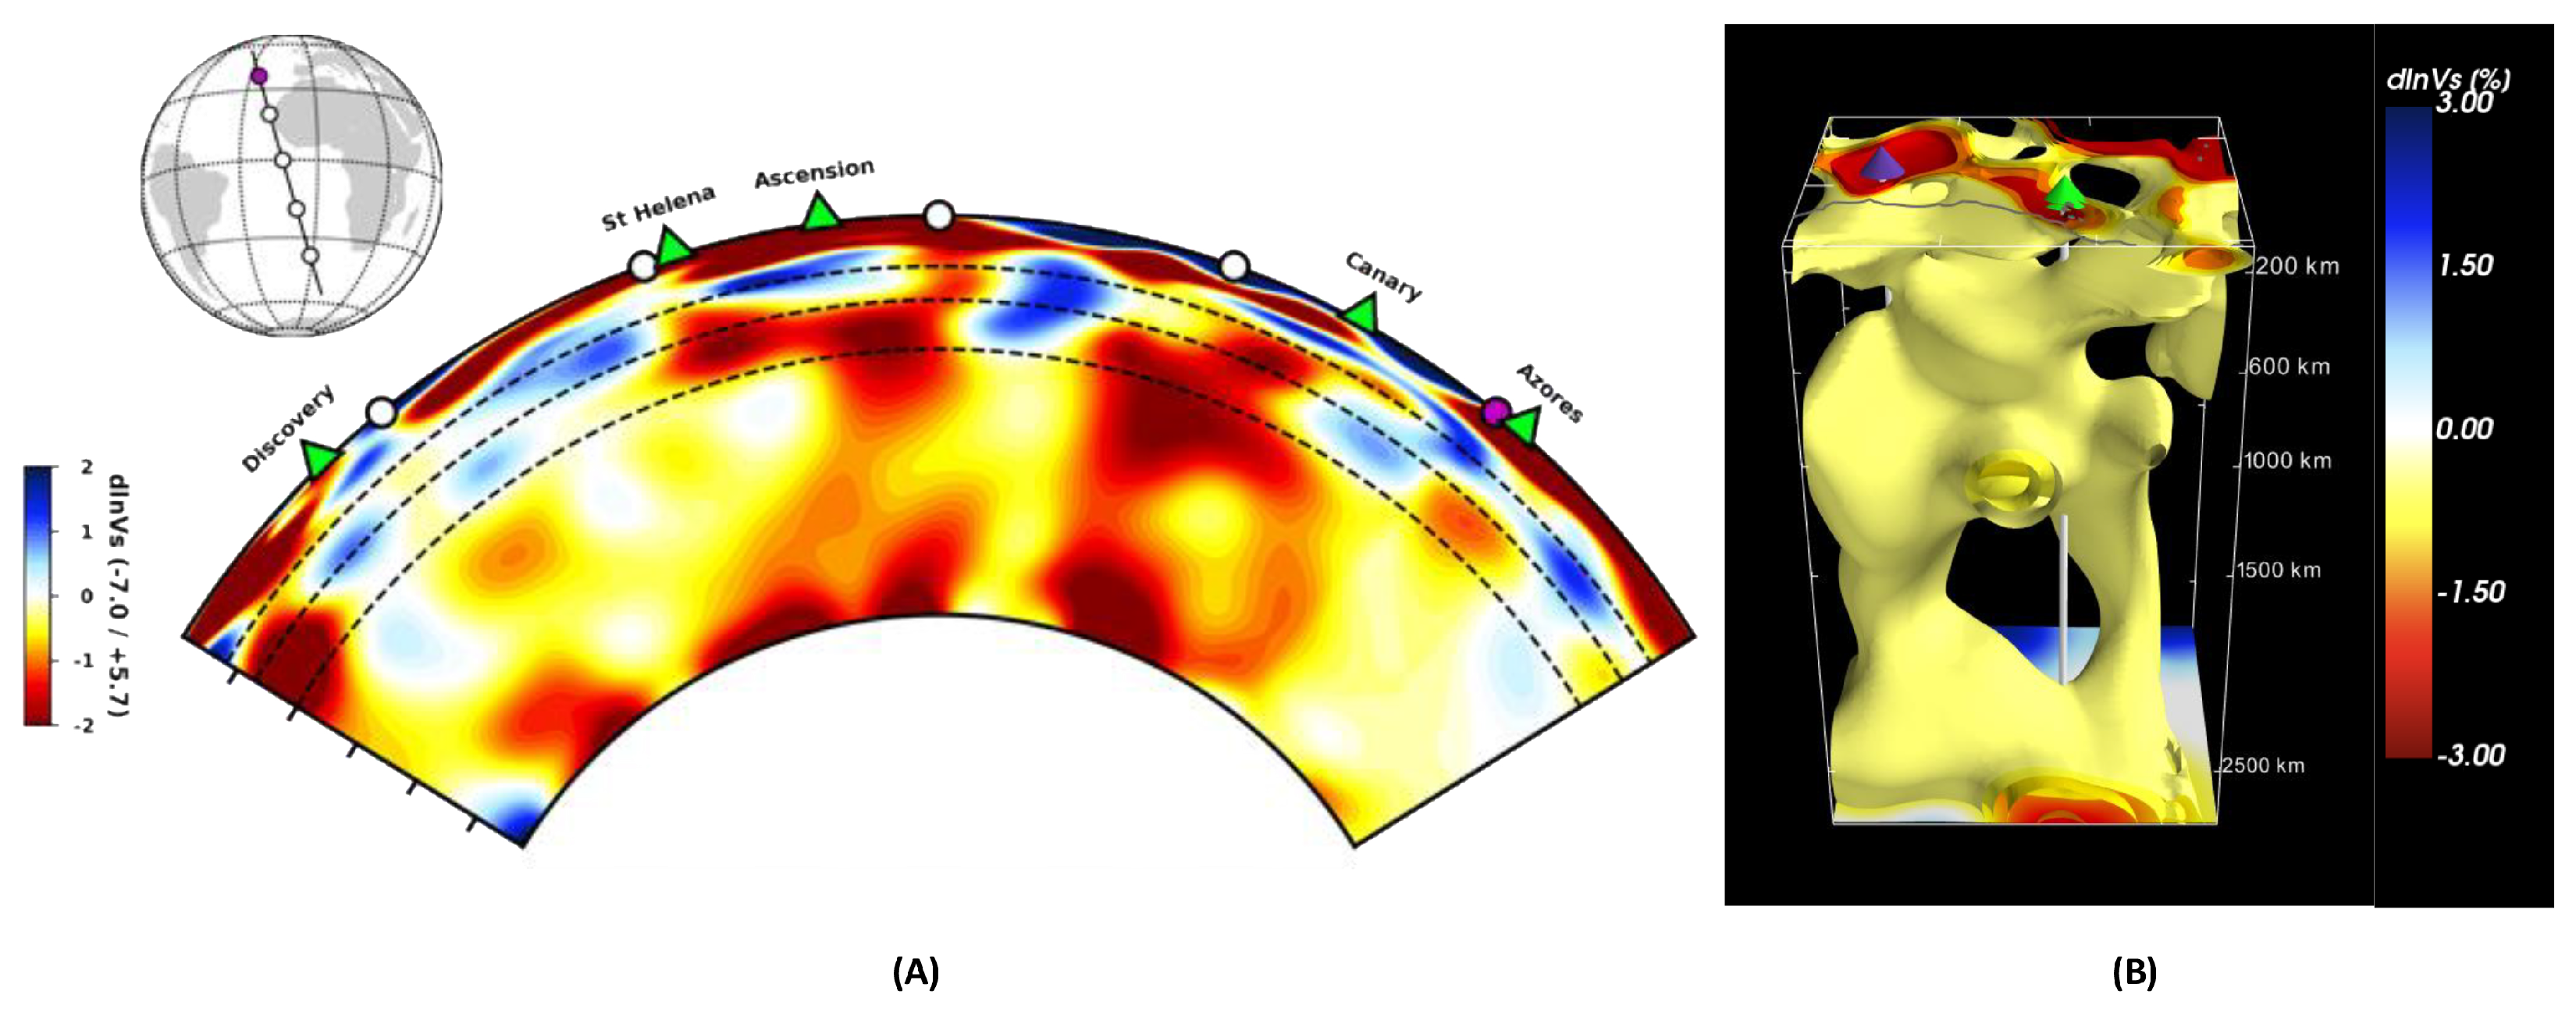
In the south and central Atlantic Ocean, model SEMATL _ 23  [28] was developed using the same FWI approach. Several “plume groups” have been identified on the eastern side of the mid-Atlantic ridge, extending from the CMB to an ∼1000 km depth, beneath, respectively, the Cape-Verde/Canary, Ascension/St Helena, and Tristan/Gough hotspot volcanoes. Each plume group is well separated from the others across the entire lower mantle. In each plume group, two plume conduits are well-separated in the bulk of the lower mantle and then merge into na LMPZ and separate again in the upper mantle into thinner conduits that meander towards the asthenosphere (Figure 2), where they feed into asthenospheric “fingers” that are horizontally elongated in the direction of absolute plate motion of the African plate.

3. Seismic Anisotropy

In addition to S-wave velocity, seismic anisotropy can provide complementary information on LMTZs. Seismic anisotropy is associated with the dependence of seismic wave velocity on the propagation direction or wave polarization. Seismic anisotropy measurements are an efficient way to map deformation processes and flow in the mantle. The presence of radial anisotropy in the extended transition zone (ETZ) [44,45] and in the D″ layer at the base of the mantle [46,47] was documented a long time ago, but the rest of the lower mantle was considered for many decades as isotropic [48] because silicate perovskite was thought to have an isotropic texture during deformation and recrystallization. The mineralogical structure was also considered to be very simple, involving a mixture of perovskite ( M g , F e ) S i O 3 and ferropericlase ( M g , F e ) O . However, these explanations were oversimplified. The lower mantle (excluding LMTZ and D″) is probably isotropic on average at very large scales, but not necessarily at small scales. Recently, evidence has been found for the presence of anisotropy in a few regions, such as around subducting slabs [49,50], close to stagnant slabs, or below central Asia [51] down to a 900–1100 km depth.
Anisotropy in the ETZ (410–1000 km depth) is difficult to retrieve using only body wave data, and so far, the most efficient way to detect it is by analyzing overtones of surface waves sensitive to LMTZ. Surface wave data make it possible to observe two main kinds of anisotropy: radial anisotropy and azimuthal anisotropy. Radial anisotropy (parameter ξ ) only requires a VTI medium (transversely isotropic medium with a vertical symmetry axis) and was proposed by Anderson (1961) [52] to explain the Rayleigh–Love discrepancy. A VTI model is characterized by five parameters, A , C , F , L , N  [53], but from a practical point of view, they are often recombined as V P H , V S V , ϕ = C / A = ( V P V / V P H ) 2 , ξ = N / L = ( V S H / V S V ) 2 , η = F / ( A 2 L ) . The best resolved parameters of surface waves are velocity V S V and parameter ξ , which relates to the difference between the horizontally and vertically polarized S-wave velocities ( ξ = ( V S H V S V ) 2 ). Radial anisotropy is strong in the uppermost mantle and is invoked to explain the Love–Rayleigh wave discrepancy [54]. The first evidence of radial anisotropy in the transition zone was obtained from the analysis of eigenfrequency data [44] and then extensively investigated by [55]. Since then, many whole mantle global tomographic studies [36,56,57,58,59] included the radial anisotropy parameter ξ in their inversion and showed that there might be a secondary maximum (although rather small) of radial anisotropy in the ETZ.
The second kind of observable anisotropy, azimuthal anisotropy, cannot be explained by a VTI model.It requires a more complex anisotropic medium instead, and eight additional parameters are necessary when derived from surface waves [60]. The modulus G and its associated angle Ψ G related to the azimuthal variation of V S V are the best-resolved azimuthal anisotropy parameters. There have been hints of the presence of azimuthal anisotropy in the MTZ given by different kinds of body-wave data, P-to-S receiver functions, and S-wave splitting [61,62]. On a global scale, the first long-wavelength azimuthal anisotropic 3D structure in the MTZ was obtained by [63] inverting Love wave overtone data, with a limited, although significant, radial resolution in this depth range and a poor lateral resolution of 5000 km. More recent tomographic models of azimuthal anisotropy down to the transition zone were derived by the authors of [64,65,66], but the agreement between them is rather poor [67]. The discrepancies might be related to the rms amplitude of lateral variations in the MTZ which is found to be very small (about 1%, within the error bars), much smaller than in the uppermost and lowermost mantles (the D″-layer).
Montagner et al. (2021) [51] inverted surface wave overtone data by using the roller-coaster method of Beucler et al. (2003) [68] to retrieve 3D models of S-velocity, azimuthal and radial anisotropy. This study combined two datasets of fundamental and higher modes (overtones) of Rayleigh and Love waves [69,70] in the period range of 35–250 s. The merged dataset made it possible to derive global 3D maps of radial and azimuthal seismic anisotropy in the UMTZ and LMTZ down to the mid-mantle (∼1200 km) with a lateral resolution of 1000 km down to a depth of 1200 km and a radial resolution of 100 km or less.
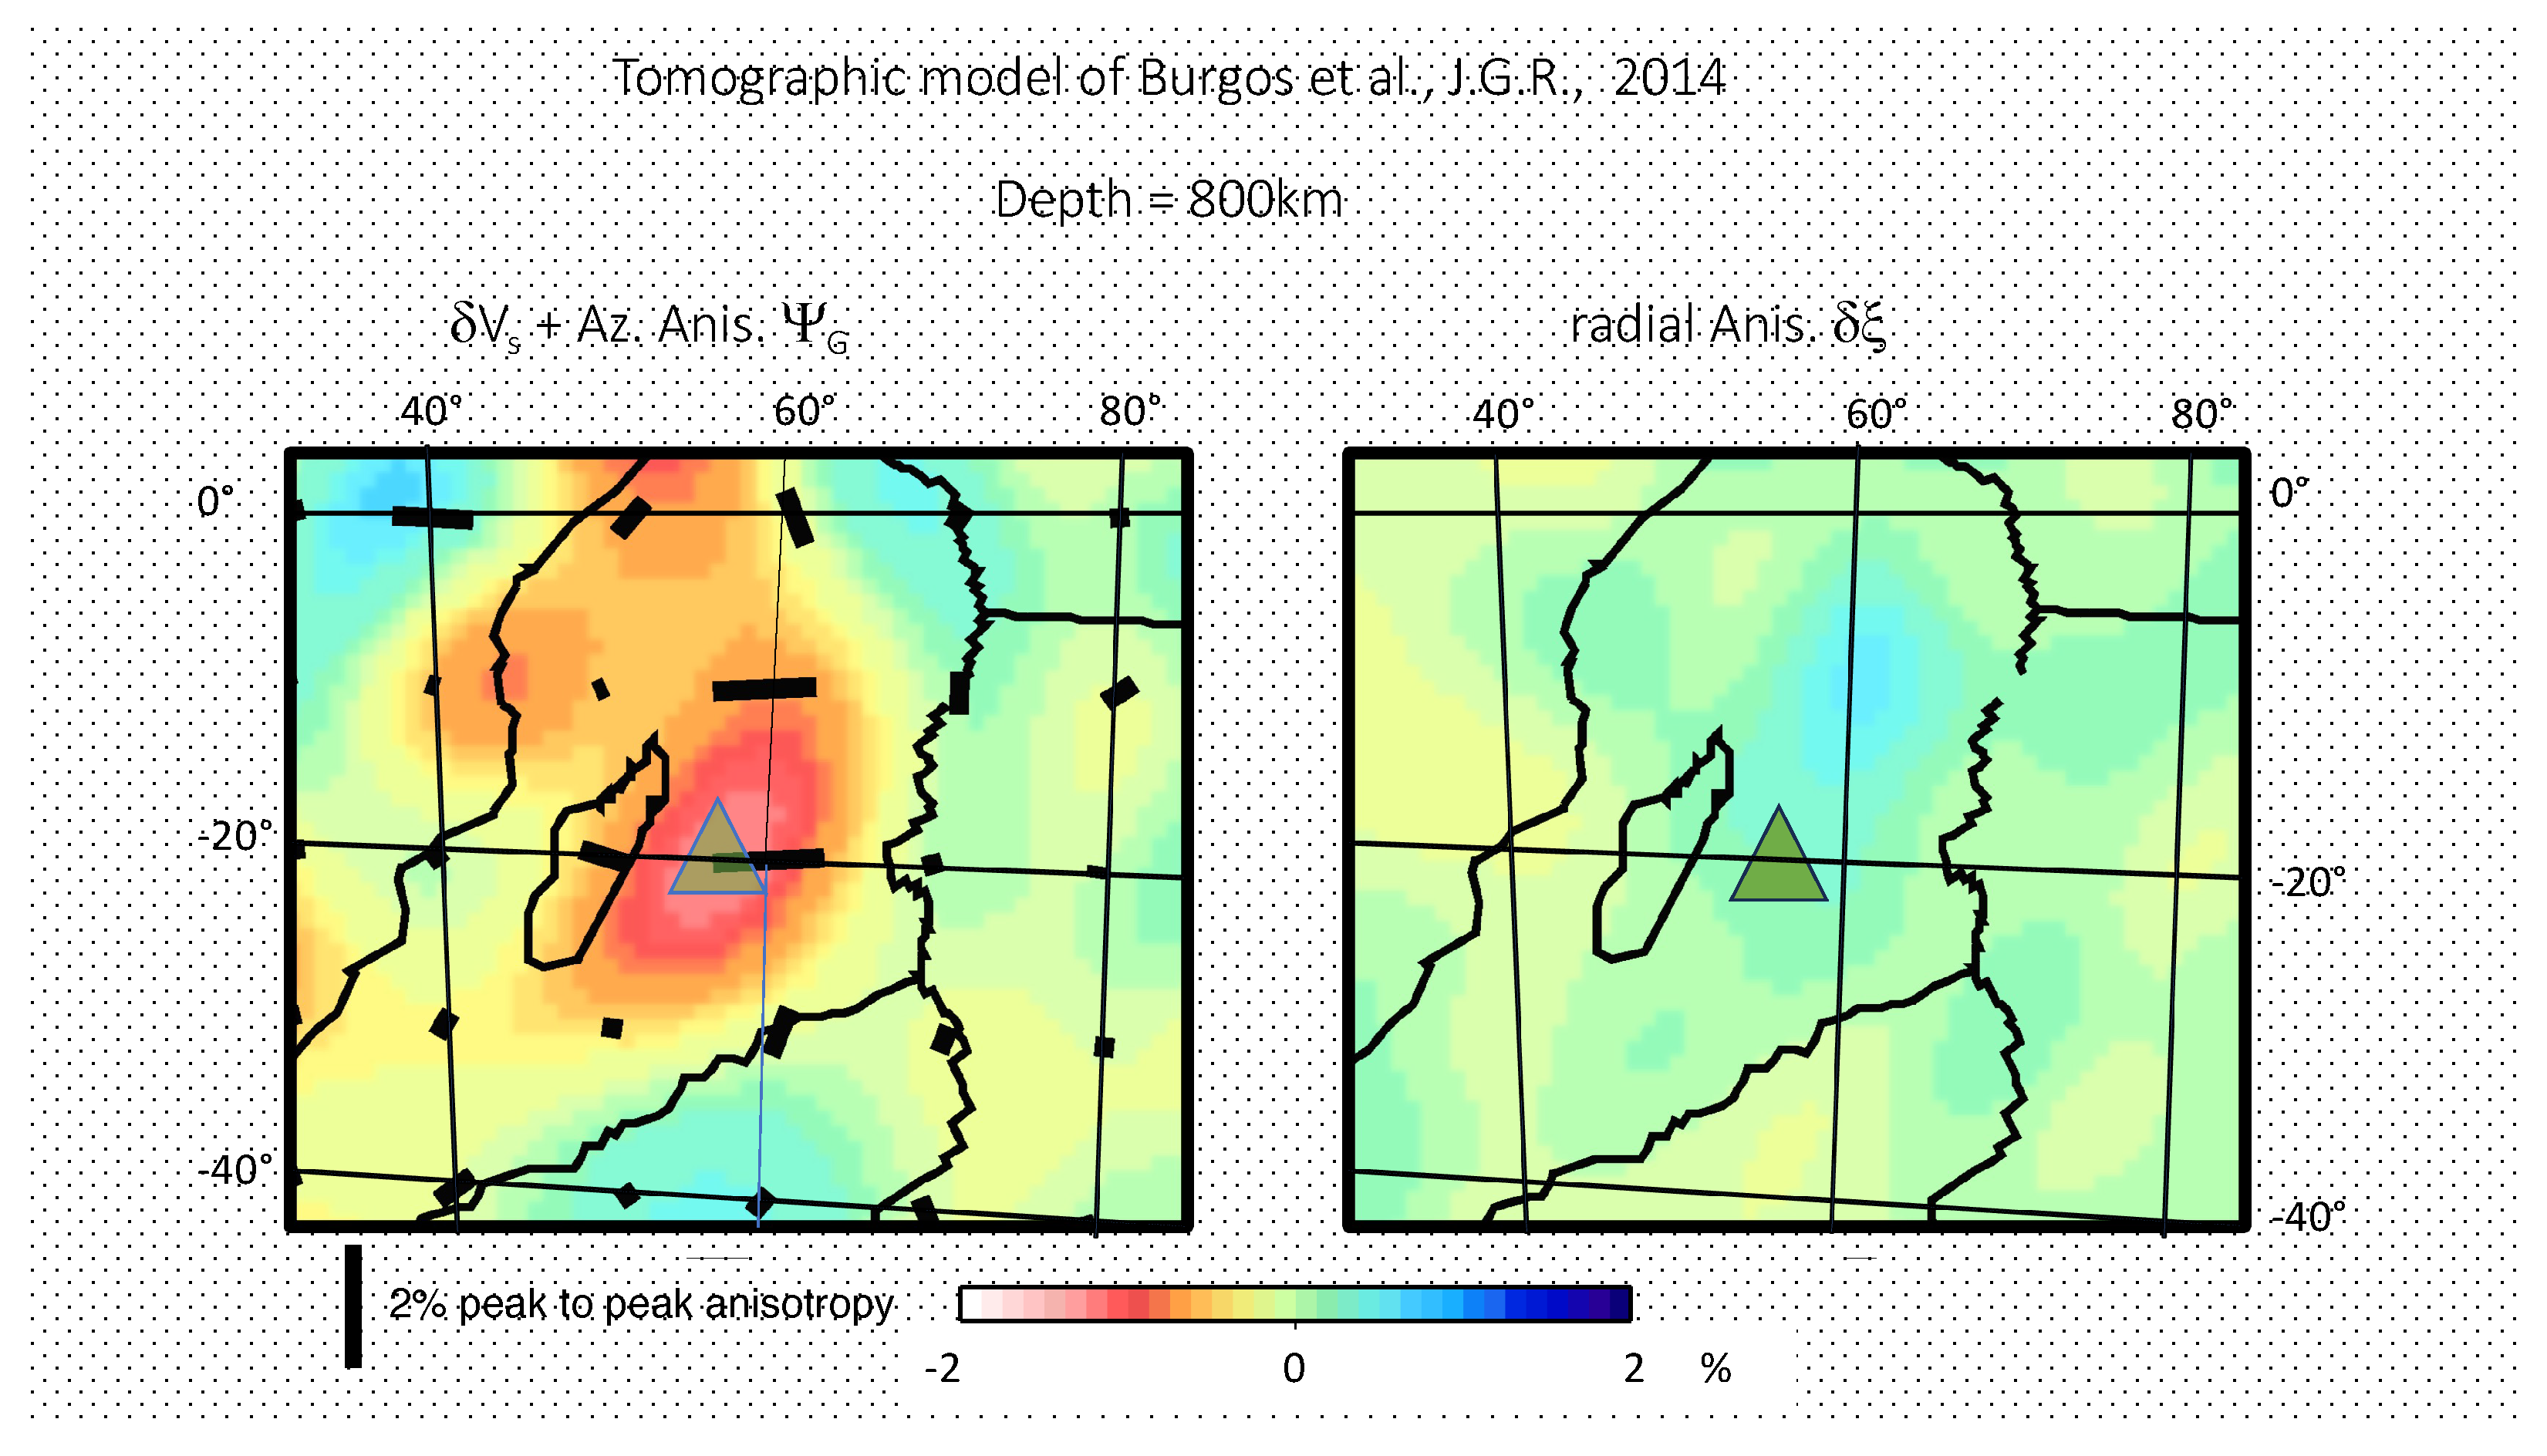
Montagner et al. (2021) [51] found that azimuthal anisotropy in the LMTZ is relatively weak on average, with a variance of 0.1%. Where it is above uncertainties of ∼0.5%, it is primarily well correlated with subducting slabs, with the exception of Central Asia and smaller regions in the western Indian Ocean. Figure 3 displays both isotropic velocity V S and azimuthal anisotropic parameters G, Ψ G in the Indian Ocean surrounding La Réunion Island. According to this tomographic model, the lower mantle ponding zone (LMPZ) below La Réunion Island is characterized not only by low S-wave velocity, but also by anomalies in the azimuthal anisotropic parameter G and radial anisotropy ξ . Below the island of La Réunion, the amplitude of azimuthal anisotropy is around 2%, which is small but above the error bars (∼1%). At an 800 km depth (Figure 3 right), in LMTZ, the pattern of the radial anisotropy parameter ξ is completely different compared to UMTZ since it is almost everywhere below the error bars. In contrast, significant negative values below Western America, Central Africa, and Central Asia are found for ξ and there are very few positive patches outside of the central-west Indian Ocean. The local maximum of 1.5 2.0 % in radial anisotropy ξ beneath the western Indian Ocean is slightly offset northward with respect to La Réunion Island. Its amplitude is just above the noise level (∼1%) and it is not observed in the UMTZ, so it could be confined to the LMPZ. There is not yet evidence of azimuthal and radial anisotropies in the LMTZ in the Atlantic and in the Pacific Ocean. However, observations of both azimuthal and radial anisotropy slightly above the noise level in the Indian Ocean around La Réunion Island indicate that some mechanism of alignment is at play in the LMPZ that gives rise to anisotropy. This point will be addressed in Section 4.2.

4. Discussion

The mineralogical composition of the lower mantle is relatively well-known. The three main minerals in the lower mantle are magnesium silicate perovskite ( M g , F e , A l ) ( S i , A l ) O 3 , now named bridgmanite, magnesiowustite/ferropericlase (Mg,Fe)O, and calcium silicate perovskite C a S i O 3 (davemaoite). In a pyrolitic model [72], bridgmanite [73] is the most abundant mineral in the mantle (75–80%), and ferropericlase [74] accounts for approximately 15–20%. At very high pressure, perovskite/bridgmanite transforms into post-perovskite (pPv), but this phase change occurs very deep in the lowermost mantle [75], or possibly at core depths, in hotter-than-average regions [76]. Importantly, the composition of the lower mantle is likely less uniform than it was thought of thirty years ago, as it may not be well-mixed.

4.1. Discontinuities of 660 km and 1000 km

The LMPZ is bounded by two "discontinuities", namely at ∼660 km and at ∼1000 km. The 660 km discontinuity is very well understood from a mineralogical point of view and corresponds to the phase transformation of ringwoodite to bridgmanite and magnesiowüstite with a negative Clapeyron slope, d P / d T < 0 [77]. This negative Clapeyron slope makes the penetration of subducting slabs difficult but not impossible, and is likely responsible for the existence of stagnant slabs [31,32]. Similarly, mantle plume upwellings may be trapped below the 660 km discontinuity [15,17].
The 1000 km discontinuity is more elusive. It does not seem to be associated with any mineralogical change and is not necessarily a global-scale discontinuity. There have been several detections of a seismic discontinuity in the depth range of 900–1100 km by using various kinds of converted seismic waves with a large variability in depth [78,79,80,81,82]. It is usually interpreted as being due to slab stagnation in this depth range [32]. Many studies investigated why there might be stagnant slabs in the LMTZ. Through numerical modeling of subduction, Ballmer et al. (2015) [83] proposed that lower-mantle enrichment in intrinsically dense basaltic lithologies can render slabs neutrally buoyant in the uppermost lower mantle, and therefore stagnant in LMTZ. Just as it was observed that the 660 km discontinuity can have a strong topography of several tens of kilometers at all scales [84], the 1000 km discontinuity also presents many large-scale lateral and regional variations. For example, Waszek et al. (2018) [85] detected many reflectors of varying lateral sizes in the mid-mantle from 800 km down to 1300 km.
There is also evidence for an increase, or a maximum, in viscosity in the Earth’s mid-mantle between an 800 and 1200 km depth [86,87]. Different processes, not necessarily exclusive, have been invoked to explain it. Marquardt et al. (2015) [88] observed a change in the strength of ferropericlase, which might be evidence for a change in rheology at around ∼1000 km. Shim et al. (2017) [89] found an unexpected change in the oxidation state of Fe in bridgmanite, which can lead to an increase in viscosity between a 1000 and 1600 km depth. Deng et al. (2017) [90] examined the melting behavior in the MgO-FeO binary system at very high pressures, exhibiting a local maximum at ∼40 GPa (800–1200 km depth), likely caused by the spin transition of iron [91]. This single mechanism might simultaneously explain slab stagnation, plume deflection, and mantle ponding zones in LMTZ. On the other hand, the variation in bridgmanite grain size as originally proposed by [92] was carefully investigated by [93]. They proposed that bridgmanite-enriched rocks in the deep lower mantle have a grain size that is more than one order of magnitude larger than that of the overlying pyrolitic rocks, which could explain the mid-mantle viscosity jump.
The amplitude of the viscosity jump is rather large (a factor of more than 100) but its sharpness is not well defined, and it may be related to the seismic discontinuities detected at around a 1000 km depth.

4.2. Mineral Physics and Anisotropy

For many decades, different minerals have been identified that can give rise to seismic anisotropy in the deep mantle [94,95]. As in the rest of the mantle, LMPZ minerals are deformed under the effect of high pressure, temperature, and deviatoric stresses by convective processes. The mineralogical evidence for seismic anisotropy in UMTZ and LMTZ is still a subject of debate (e.g., the review of [96]). In the UMTZ (410–660 km in depth), the 410 km discontinuity, attributed to the transformation from olivine to wadsleyite (orthorhombic), might result in a decrease in anisotropy even though anhydrous or hydrous wadsleyite can be anisotropic. A weaker discontinuity at a 520 km depth [97] was attributed to the transformation from wadsleyite to ringwoodite, with a very low anisotropy. All the minerals in the lower mantle are intrinsically anisotropic but their mechanisms of orientation under deformation are not so well defined. The observed anisotropy might also be a mixture of intrinsic and extrinsic anisotropies. Fine layering, or the influence of water in the LMTZ, might give rise to apparent anisotropy [49]. Anisotropy could also be due to petrological layering caused by bridgmanite-rich and ferropericlase-rich layers of transformed subducted oceanic crustal material [98]. The role of water in MTZ might be important as it was suggested that the MTZ might be a water reservoir [99,100,101] as subducting plates might bring water through hydrous minerals. The effect of water on CPO and slip systems was extensively investigated in UMTZ as a large amount of water transported by subducting slabs might be stored by hydrous wadsleyite. But there is still some debate on the dominant slip systems able to generate seismic anisotropy [102]. For example, phase D, an elastically anisotropic hydrous mineral (ideal formula M g S i 2 O 4 ( O H ) 2 ), is stable around cold slabs and can generate significant seismic anisotropy [103], as can other hydrous phases that are stable at high pressure [104].
As for intrinsic anisotropy in the lower mantle, Gay et al. (2024) [105] showed that, in the pyrolite model, bridgmanite, when deformed, can display microstructures that can produce shear-wave splitting of 1.5 2.0 % between a 660 and 2000 km depth with reversals in fast S-wave polarization directions at an ∼1300 km depth. Therefore, from a 660 km to ∼1000 km depth (LMTZ), the observed anisotropy might be due to the bridgmanite lattice/crystal preferred orientation caused by deformation in the convective boundary layer at the top of the lower mantle [98].
To conclude this section, even though observations of regional anisotropy in LMTZ are mostly limited to regions containing subducting slabs [49,50], our results in the Indian Ocean show that azimuthal and radial anisotropy might also be present in the LMTZ as a result of bridgmanite CPO. Still, seismic anisotropy in the LMTZ is not observed on average at the global scale but only in specific regions. This could be due to its relatively weak amplitude (<2%), making it difficult to measure, and in addition, to the nature of lateral heterogeneities within the lower mantle associated with sluggish lower mantle convection. Very large-scale deformation processes (>1000 km) are necessary to generate large-scale observable anisotropy. For many decades, the lower mantle was considered as relatively homogeneous and well-mixed. However, this assumption is likely partly wrong, as the lower mantle might contain small-scale chemical and/or compositional heterogeneities.

4.3. Geodynamic Consequences of LMPZ

As discussed previously, the various minerals of the lower mantle as well as their deformation properties play a key role in the understanding of the presence or absence of lower mantle ponding zones (LMPZ).
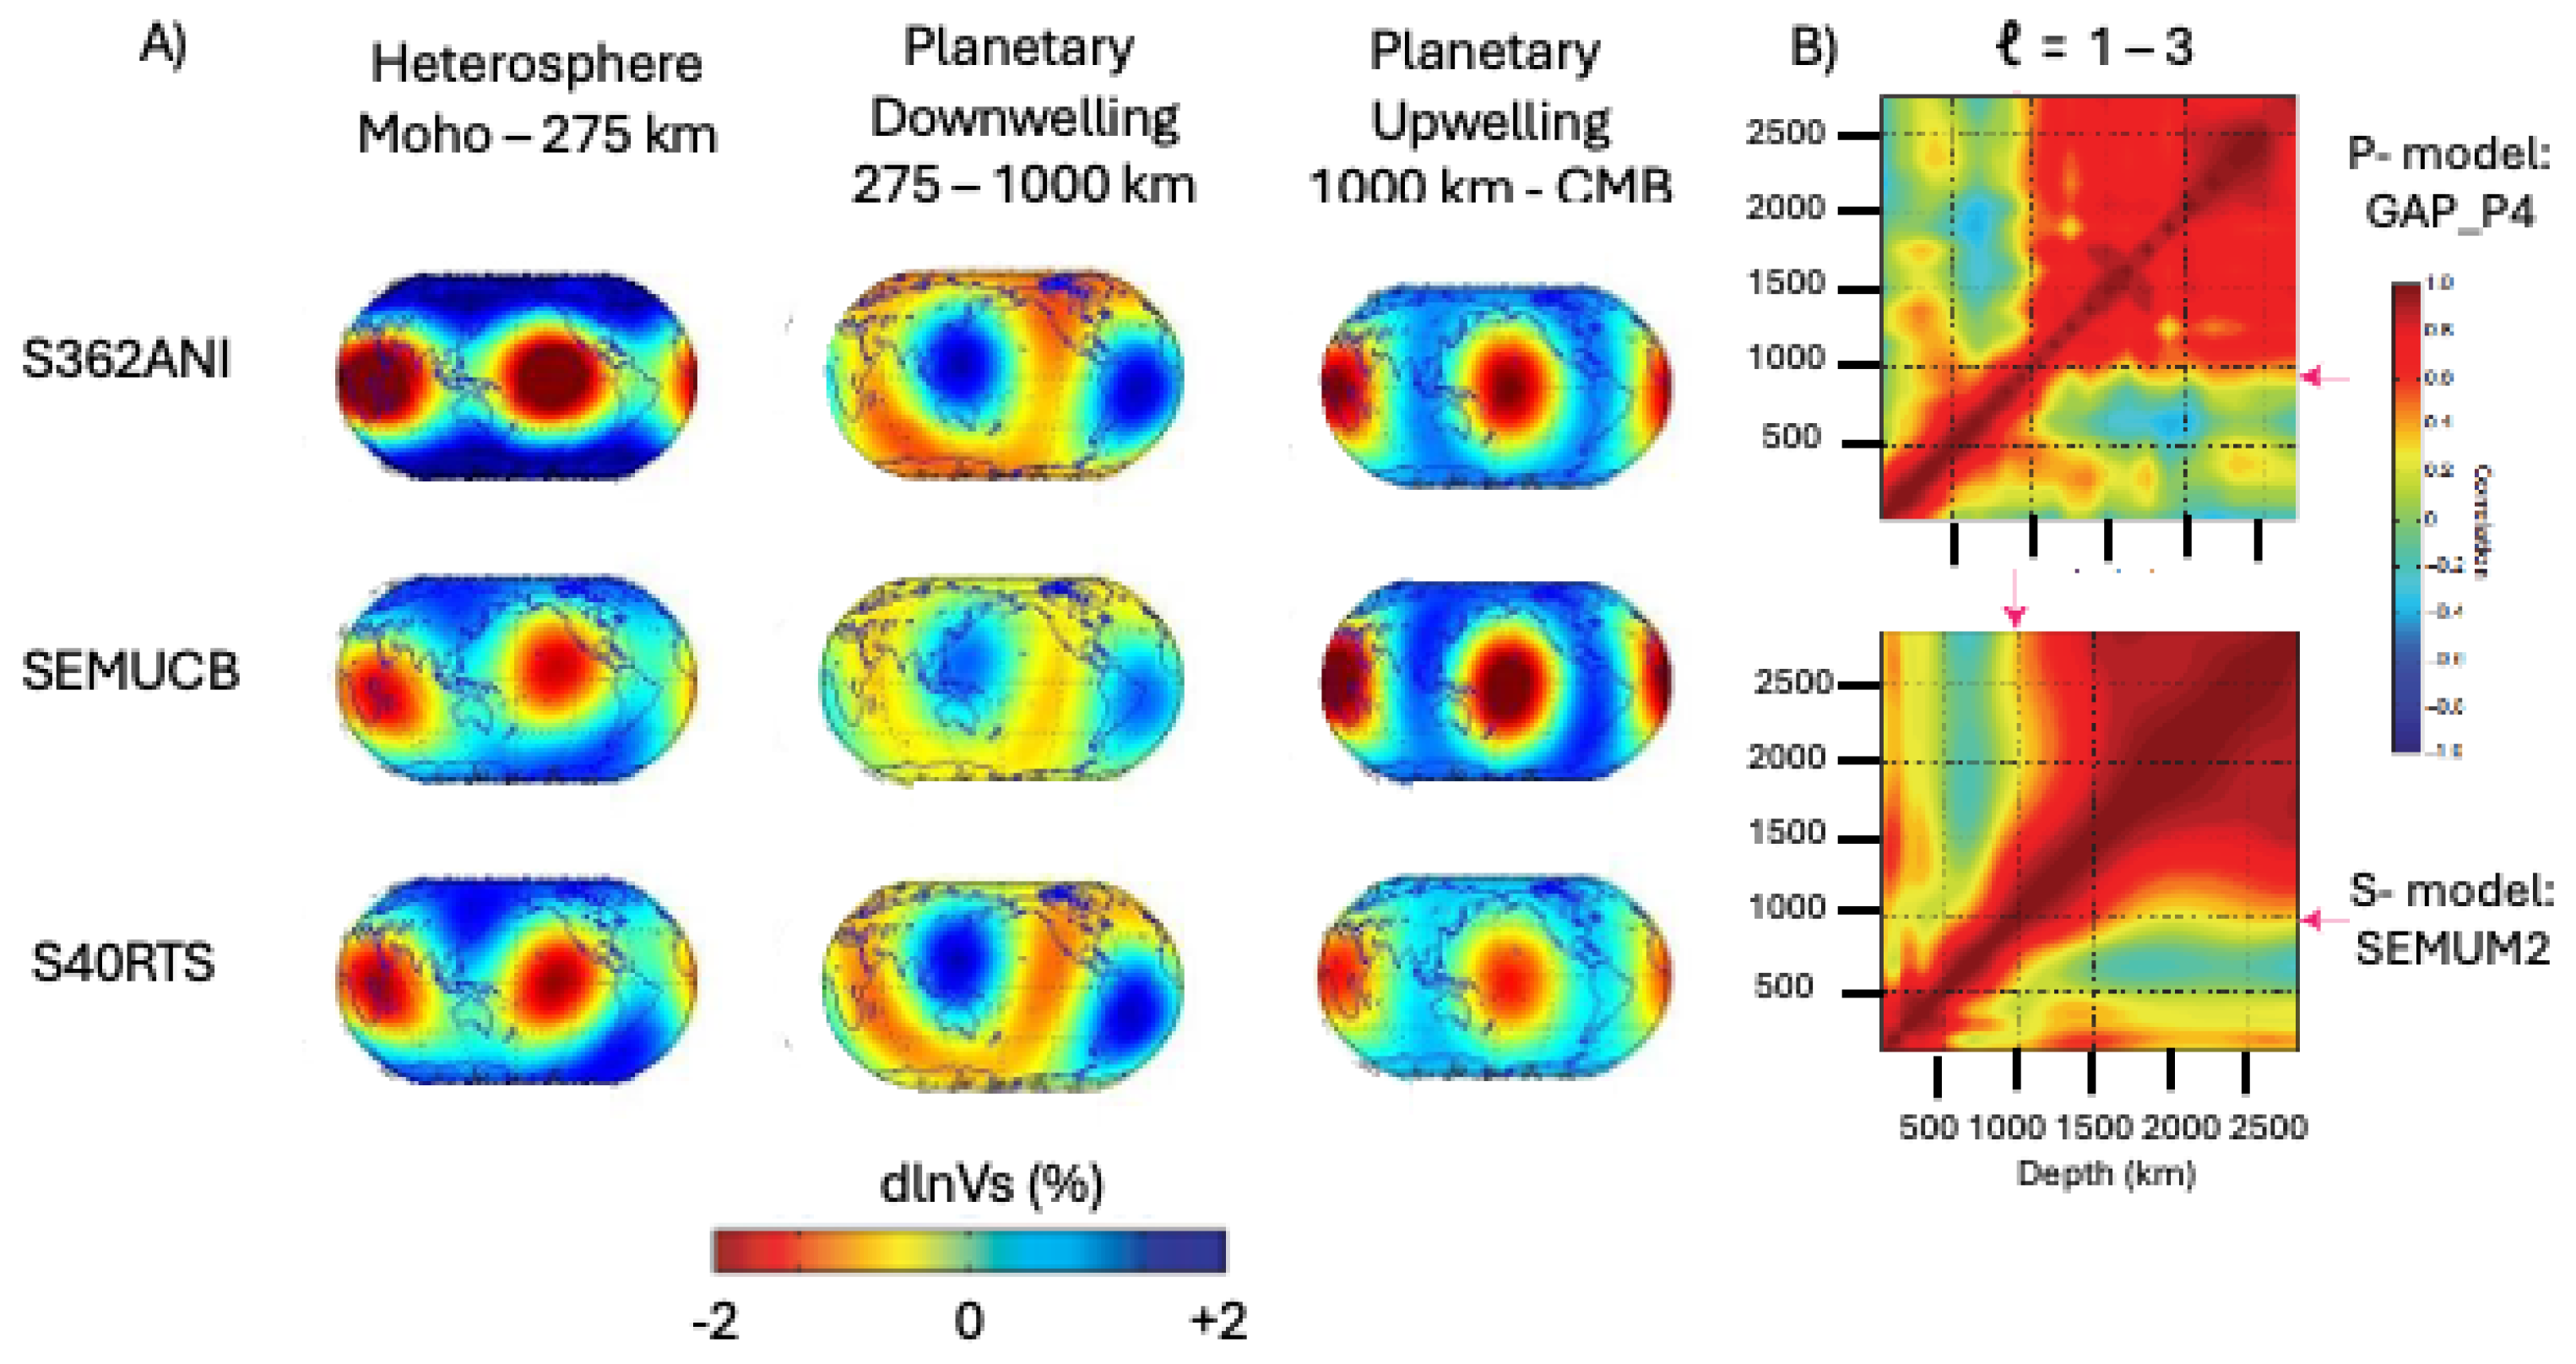
The change in viscosity observed in the depth range of 660–1000 km might reflect different rheologies below and above this depth range, which could act as a barrier for downgoing matter and facilitate horizontal spreading of lower mantle upwellings, thus leading to slab stagnation, plume deflection, and ponding. Farnetani et al. (2005) [106] showed how, in a mantle with a viscosity jump at 660 km, thermo-chemical plumes pond around that depth, and thinner plumes are generated above it (see also [17]). Traditionally, the boundary between the lower-viscosity upper mantle and the higher-viscosity lower mantle is associated with the 660 km discontinuity. The depth of this ponding zone need not be 660 km if the viscosity change is not strictly related to the phase change at that depth. The lower limit of LMPZ might thus be related to a weak seismic discontinuity and associated with the mid-mantle viscosity jump [87]. There is, in fact, a decorrelation of the very long wavelength shear wave velocity structure between the ETZ (410–1000 km) and the rest of the lower mantle, as seen in depth correlation plots [87], with a shift in the global shear velocity pattern around a 1000 km depth [107], which is particularly prominent at “degree 2” (Figure 4).
The geodynamic consequences of an LMPZ have been investigated by Frazer and Korenaga (2022) [19]. By considering the potential amplitude of dynamic topography associated with an LMPZ, they concluded that a purely thermal plume model would lead to unrealistic excess topography, large enough to be detected by geophysical data. So the possibility of thermochemical upwellings originating at the CMB and ponding in the LMTZ is high [30]. A dense chemical component was invoked to explain large radius mantle plumes [106].
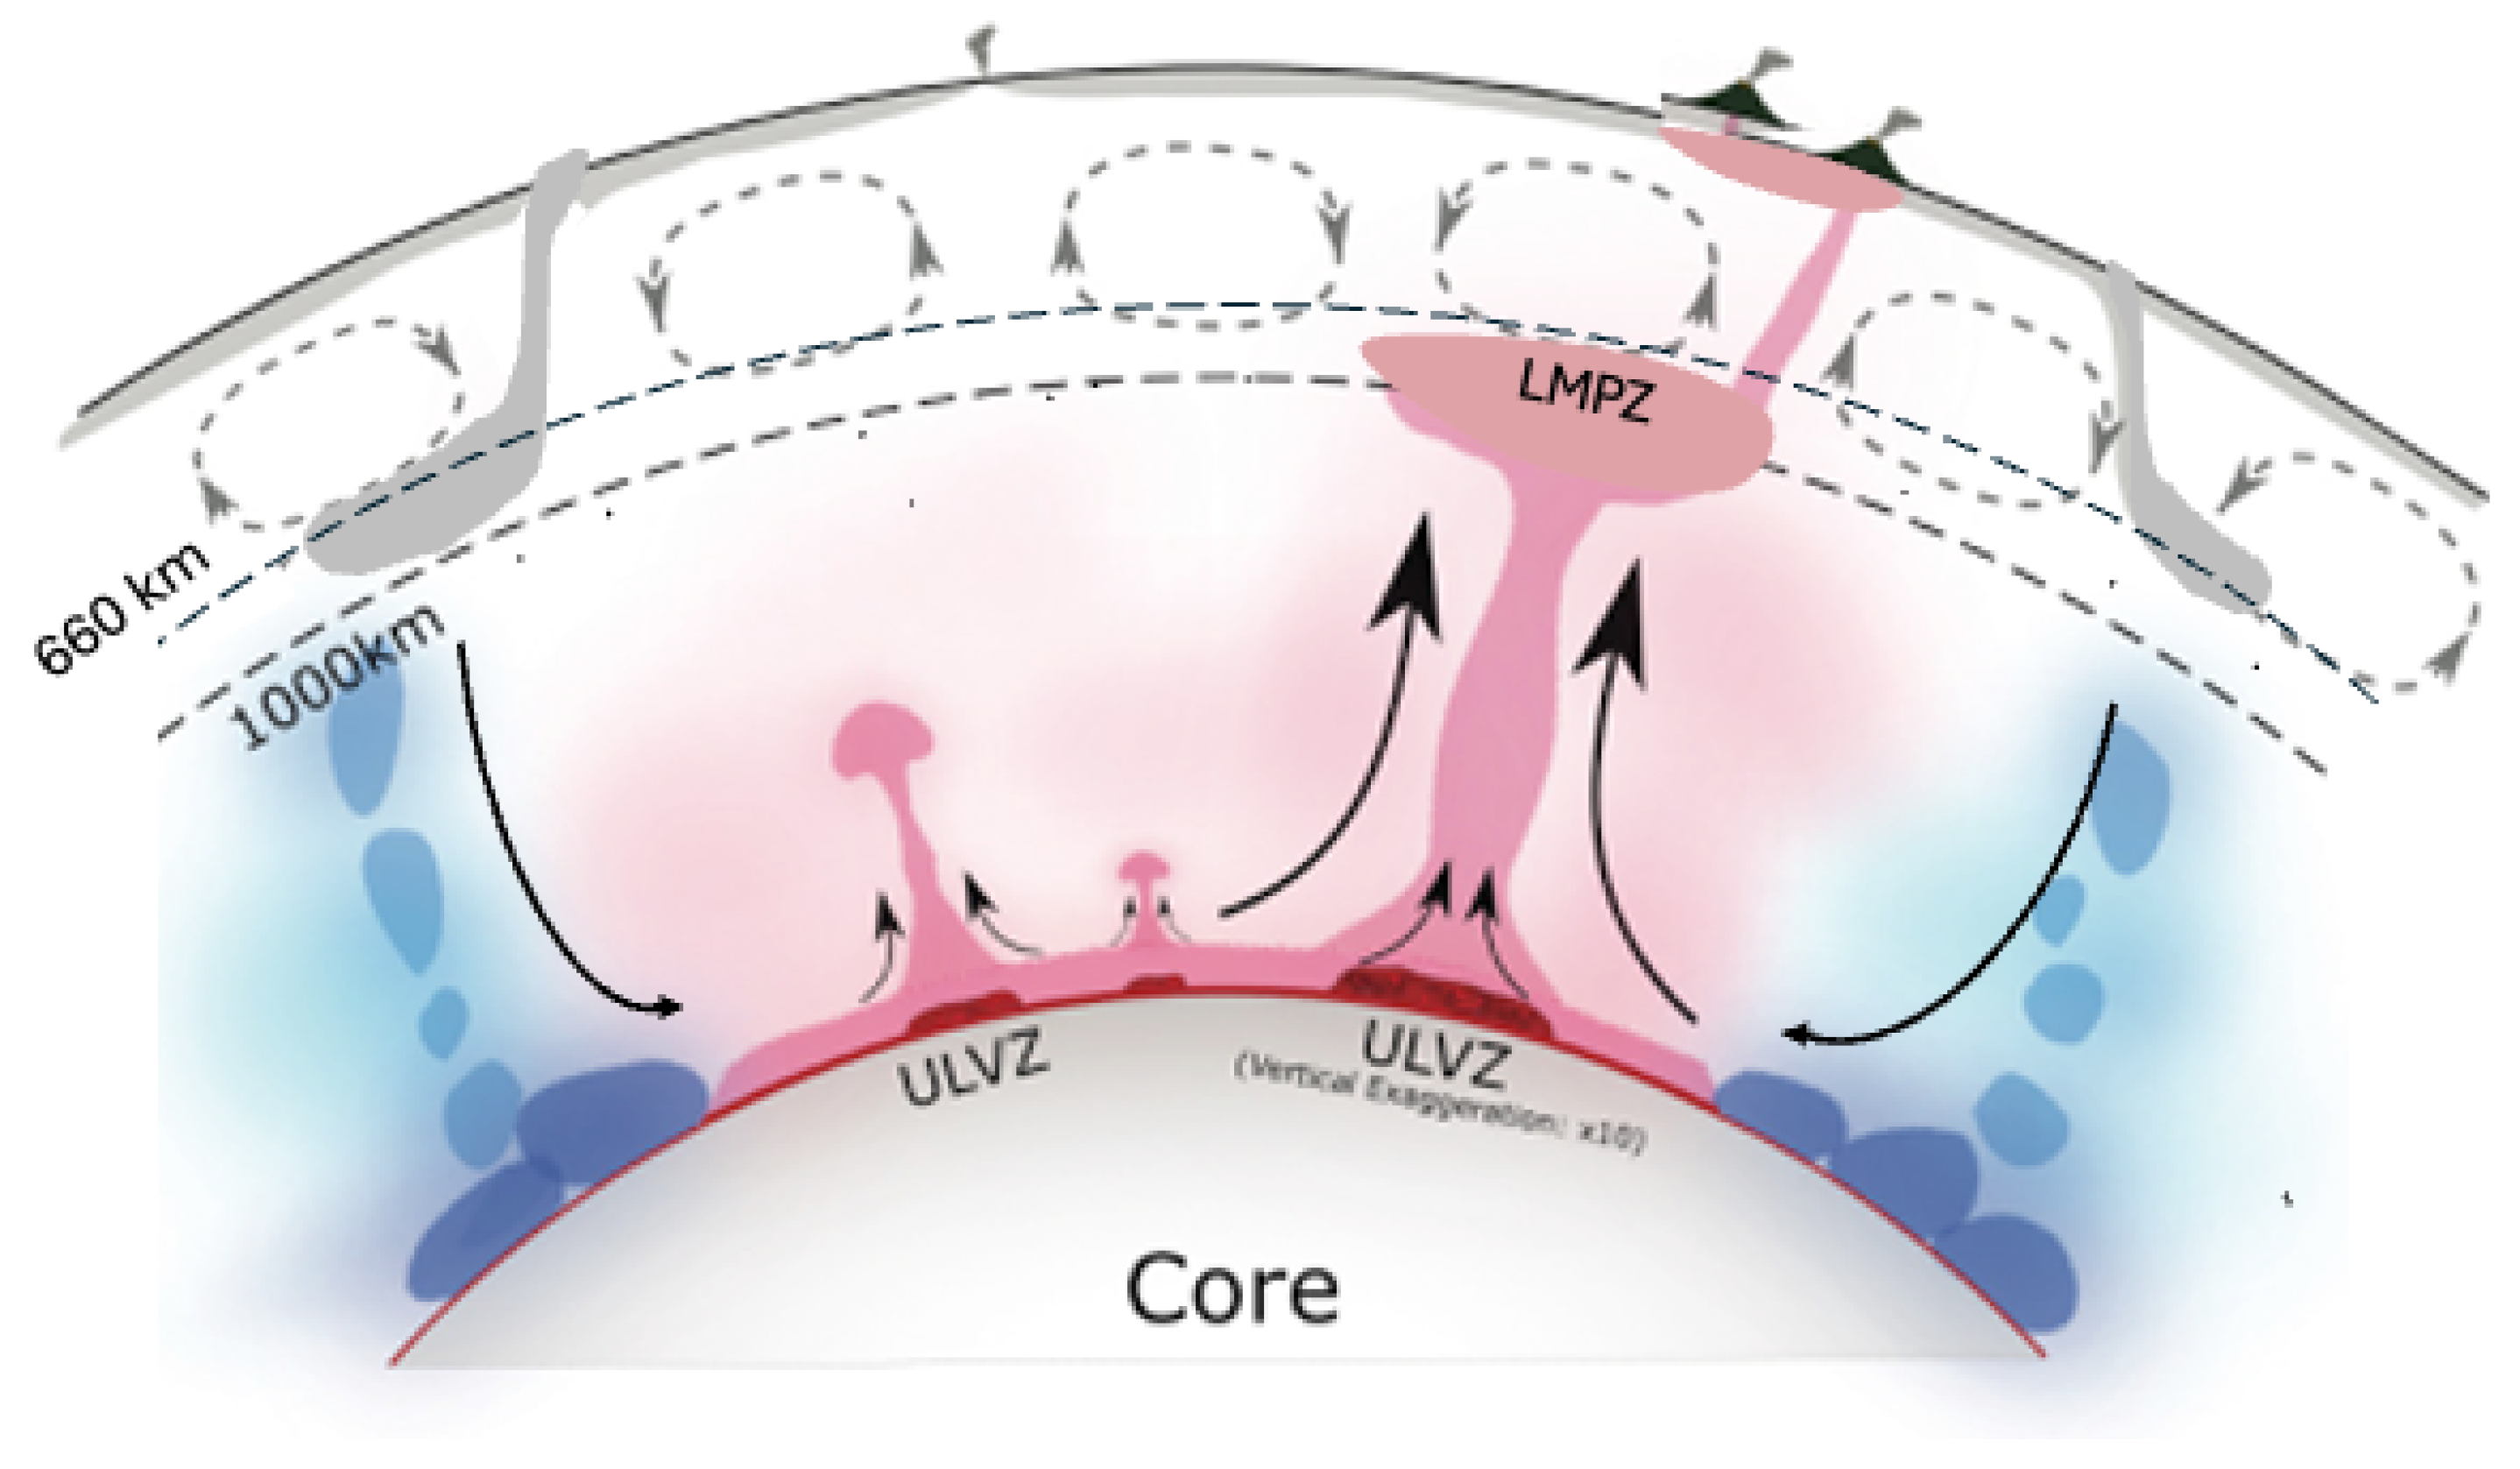
Recent FWI-based tomographic models such as the ones discussed in [27,28] suggest the presence of a complicated plumbing system involving the whole mantle (Figure 5). In the lower mantle, plumes have broad shapes and a quasi-vertical orientation, from the CMB to ∼1000 km, indicating the absence of any strong “mantle wind” [11], suggesting that the circulation may be confined to relatively narrow zones of upwellings (plumes) or downwellings (slab remnants). Around ∼1000 km depth, many of these plumes feed into LMPZs, from which thinner plumes emerge, not necessarily directly above the corresponding lower mantle stem. This effect is clearly visible for the La Réunion hotspot in the Indian Ocean and for St Helena/Ascension hotspots in the the southern Atlantic Ocean. Note that the surface location of a hotspot can be significantly offset with respect to its deep origin: these thinner upper mantle plumes do not always have a straight path to the corresponding hotspots at the surface, indicating that they may be deflected by vigorous secondary-scale convection in the lower-viscosity top 1000 km of the mantle (Figure 5).
Another wide zone of horizontal spreading and ponding is found in the asthenosphere at ∼250 to 100 km (below the lithosphere). For example, the Indian Ocean hotspots of La Réunion and Comores as well as some parts of the Central Indian Ridge appear to be fed from such asthenospheric ponding zones, also observed beneath the Mascareigne Basin [41]. These ponding zones may be related to the asthenospheric fingers regularly spaced every ∼1800–2000 km observed in the asthenosphere in the central and southern Atlantic [28] and in other ocean basins [110].
One may wonder why mantle ponding zones are not systematically present below all hotspots. The existence of LMPZs may depend on several factors, such as the interaction of upwellings with long-lived heterogeneities in the lower mantle. If deformation in the lower mantle is localized as discussed above, and due to the higher viscosity in the lower mantle than in the upper mantle, convection is not as active as in the upper mantle and the lower mantle is probably not well mixed. It is then likely that heterogeneity in the LMTZ reflects the accumulation of past material, as predicted by geodynamic models according to the tomographic models of the extended transition zone by Chang et al. (2015) and Montagner et al. (2021) [51,59] or by geochemical anomalies. The Dupal anomaly [112] was initially associated with MORB in the Indian Ocean, having higher 87Sr/86Sr and lower 206Pb/204Pb than other oceans. The isotopic variations in the basalts of the Indian Ocean were in agreement with the reinjection of sediments into the lower mantle. Later, the DUPAL anomaly was extended to the southern Atlantic Ocean and to the Central Pacific. The authors of [113,114] proposed an alternative explanation, that the Dupal anomaly is associated with regions of slow seismic velocity in the D″ layer. These two regions where superplumes originate are also associated with LMPZs in the lower mantle transition zone. So, the lower mantle is likely characterized by large-scale and also small-scale heterogeneities, as found at the regional scale by Jenkins et al. (2017) [81] and by Schouten et al. (2024) [115] at the global scale.

5. Conclusions

The LMPZ is an important geological object in the depth range of 660–1000 km, which may play an important role in mantle convection and the whole plumbing system of mantle plumes. Tomographic imaging is difficult in this depth range, but regional studies provide robust evidence of LMPZ in the central Indian Ocean and in the southern/central Atlantic Ocean. The complexity of mantle upwellings with several ponding zones separating regions of plume-like upwellings has many similarities with the crustal plumbing system with dykes and sills. The volume of LMPZ can be huge, 1 billion km3 (∼2000 × 2000 × 300 km3) and will evolve with time. If purged, upgoing material might feed the UMPZ and finally give rise to large igneous provinces (LIP, [116]). However, there are still many unresolved questions on the structure, nature, and evolution of the LMPZs and why they are not systematically observed above all mantle plumes.
More detailed tomography and other seismic imaging techniques focused on the mid-mantle, especially efforts to improve the resolution on the anisotropic structure, combined with multi-disciplinary investigations, will help improve our understanding of the nature of these mid-mantle heterogeneities and their relation to mantle dynamics.

Author Contributions

Conceptualization, Writing—Review & Editing: J.-P.M. and B.R.; Methodology: B.R.; Software: B.R., M.W. and G.B.; Formal Analysis: J.-P.M., B.R., M.W. and G.B.; Resources, Visualization and Data Curation: M.W. and G.B.; Project Administration: J.-P.M. All authors have read and agreed to the published version of the manuscript.

Funding

This research received no external funding.

Data Availability Statement

Data availability of seismograms and tomographic models are detailed in the corresponding publications, Wamba et al. (2023), Munch et al., 2024, Burgos et al., 2014 [27,28,70].

Conflicts of Interest

The authors declare no conflicts of interest.

References

  1. Tuzo Wilson, J. Evidence from ocean islands suggesting movement in the earth. Philos. Trans. R. Soc. Lond. Ser. A Math. Phys. Sci. 1965, 258, 145–167. [Google Scholar]
  2. Morgan, W.J. Convection plumes in the lower mantle. Nature 1971, 230, 42–43. [Google Scholar] [CrossRef]
  3. Richards, M.A.; Duncan, R.A.; Courtillot, V.E. Flood basalts and hot-spot tracks: Plume heads and tails. Science 1989, 246, 103–107. [Google Scholar] [CrossRef] [PubMed]
  4. Olsen, P.E. Giant lava flows, mass extinctions, and mantle plumes. Science 1999, 284, 604–605. [Google Scholar] [CrossRef]
  5. Courtillot, V.; Jaupart, C.; Manighetti, I.; Tapponnier, P.; Besse, J. On causal links between flood basalts and continental breakup. Earth Planet. Sci. Lett. 1999, 166, 177–195. [Google Scholar] [CrossRef]
  6. Whitehead, J.J.A.; Luther, D.S. Dynamics of laboratory diapir and plume models. J. Geophys. Res. 1975, 80, 705–717. [Google Scholar] [CrossRef]
  7. Griffiths, R. The differing effects of compositional and thermal buoyancies on the evolution of mantle diapirs. Phys. Earth Planet. Inter. 1986, 43, 261–273. [Google Scholar] [CrossRef]
  8. Foulger, G.R. Plates vs. Plumes: A Geological Controversy; John Wiley & Sons: Hoboken, NJ, USA, 2011. [Google Scholar]
  9. Montagner, J.P. Can seismology tell us anything about convection in the mantle? Rev. Geophys. 1994, 32, 115–137. [Google Scholar] [CrossRef]
  10. Courtillot, V.; Davaille, A.; Besse, J.; Stock, J. Three distinct types of hotspots in the Earth’s mantle. Earth Planet. Sci. Lett. 2003, 205, 295–308. [Google Scholar] [CrossRef]
  11. Steinberger, B.; Antretter, M. Conduit diameter and buoyant rising speed of mantle plumes: Implications for the motion of hot spots and shape of plume conduits. Geochem. Geophys. Geosyst. 2006, 7, Q11018. [Google Scholar] [CrossRef]
  12. Davaille, A. Simultaneous generation of hotspots and superswells by convection in a heterogeneous planetary mantle. Nature 1999, 402, 756–760. [Google Scholar] [CrossRef]
  13. Lin, S.C.; van Keken, P.E. Dynamics of thermochemical plumes: 2. Complexity of plume structures and its implications for mapping mantle plumes. Geochem. Geophys. Geosyst. 2006, 7, Q03003. [Google Scholar] [CrossRef]
  14. Davaille, A.; Carrez, P.; Cordier, P. Fat plumes may reflect the complex rheology of the lower mantle. Geophys. Res. Lett. 2018, 45, 1349–1354. [Google Scholar] [CrossRef] [PubMed]
  15. Vinnik, L.; Chevrot, S.; Montagner, J.P. Evidence for a stagnant plume in the transition zone? Geophys. Res. Lett. 1997, 24, 1007–1010. [Google Scholar] [CrossRef]
  16. Tsekhmistrenko, M.; Sigloch, K.; Hosseini, K.; Barruol, G. A tree of Indo-African mantle plumes imaged by seismic tomography. Nat. Geosci. 2021, 14, 612–619. [Google Scholar] [CrossRef]
  17. Nolet, G.; Karato, S.I.; Montelli, R. Plume fluxes from seismic tomography. Earth Planet. Sci. Lett. 2006, 248, 685–699. [Google Scholar] [CrossRef]
  18. Sleep, N.H. Lateral flow and ponding of starting plume material. J. Geophys. Res. Solid Earth 1997, 102, 10001–10012. [Google Scholar] [CrossRef]
  19. Frazer, W.D.; Korenaga, J. Dynamic topography and the nature of deep thick plumes. Earth Planet. Sci. Lett. 2022, 578, 117286. [Google Scholar] [CrossRef]
  20. Montelli, R.; Nolet, G.; Dahlen, F.; Masters, G.; Engdahl, E.R.; Hung, S.H. Finite-frequency tomography reveals a variety of plumes in the mantle. Science 2004, 303, 338–343. [Google Scholar] [CrossRef]
  21. Komatitsch, D.; Vilotte, J.P. The spectral element method: An efficient tool to simulate the seismic response of 2D and 3D geological structures. Bull. Seismol. Soc. Am. 1998, 88, 368–392. [Google Scholar] [CrossRef]
  22. Komatitsch, D.; Tromp, J. Introduction to the spectral element method for three-dimensional seismic wave propagation. Geophys. J. Int. 1999, 139, 806–822. [Google Scholar] [CrossRef]
  23. Li, X.D.; Romanowicz, B. Global mantle shear velocity model developed using nonlinear asymptotic coupling theory. J. Geophys. Res. Solid Earth 1996, 101, 22245–22272. [Google Scholar] [CrossRef]
  24. Ritsema, J.; Maguire, R.; Cobden, L.; Goes, S. Seismic imaging of deep mantle plumes. In Mantle Convection and Surface Expressions; Wiley Online Library: Hoboken, NJ, USA, 2021; pp. 353–369. [Google Scholar]
  25. Rickers, F.; Fichtner, A.; Trampert, J. The Iceland–Jan Mayen plume system and its impact on mantle dynamics in the North Atlantic region: Evidence from full-waveform inversion. Earth Planet. Sci. Lett. 2013, 367, 39–51. [Google Scholar] [CrossRef]
  26. French, S.; Romanowicz, B. Broad plumes rooted at the base of the Earth’s mantle beneath major hotspots. Nature 2015, 525, 95–99. [Google Scholar] [CrossRef]
  27. Wamba, M.; Montagner, J.P.; Romanowicz, B. Imaging deep-mantle plumbing beneath La Réunion and Comores hot spots: Vertical plume conduits and horizontal ponding zones. Sci. Adv. 2023, 9, eade3723. [Google Scholar] [CrossRef] [PubMed]
  28. Munch, F.D.; Romanowicz, B.; Mukhopadhyay, S.; Rudolph, M.L. Deep mantle plumes feeding periodic alignments of asthenospheric fingers beneath the central and southern Atlantic Ocean. Proc. Natl. Acad. Sci. USA 2024, 121, e2407543121. [Google Scholar] [CrossRef] [PubMed]
  29. Nelson, P.L.; Grand, S.P. Lower-mantle plume beneath the Yellowstone hotspot revealed by core waves. Nat. Geosci. 2018, 11, 280–284. [Google Scholar] [CrossRef]
  30. Davaille, A.; Romanowicz, B. Deflating the LLSVPs: Bundles of mantle thermochemical plumes rather than thick stagnant piles. Tectonics 2020, 39, e2020TC006265. [Google Scholar] [CrossRef]
  31. Fukao, Y.; Widiyantoro, S.; Obayashi, M. Stagnant slabs in the upper and lower mantle transition region. Rev. Geophys. 2001, 39, 291–323. [Google Scholar] [CrossRef]
  32. Fukao, Y.; Obayashi, M. Subducted slabs stagnant above, penetrating through, and trapped below the 660 km discontinuity. J. Geophys. Res. Solid Earth 2013, 118, 5920–5938. [Google Scholar] [CrossRef]
  33. Li, X.D.; Romanowicz, B. Comparison of global waveform inversions with and without considering cross-branch modal coupling. Geophys. J. Int. 1995, 121, 695–709. [Google Scholar] [CrossRef]
  34. Romanowicz, B. Global seismic tomography using time domain waveform inversion. Appl. Data Assim. Inverse Probl. Earth Sci. 2023, 5, 220. [Google Scholar]
  35. Cupillard, P.; Delavaud, E.; Burgos, G.; Festa, G.; Vilotte, J.P.; Capdeville, Y.; Montagner, J.P. RegSEM: A versatile code based on the spectral element method to compute seismic wave propagation at the regional scale. Geophys. J. Int. 2012, 188, 1203–1220. [Google Scholar] [CrossRef]
  36. French, S.; Romanowicz, B. Whole-mantle radially anisotropic shear velocity structure from spectral-element waveform tomography. Geophys. J. Int. 2014, 199, 1303–1327. [Google Scholar] [CrossRef]
  37. Wamba, M.; Montagner, J.P.; Romanowicz, B.; Barruol, G. Multi-mode waveform tomography of the Indian ocean upper and mid-mantle around the Réunion hotspot. J. Geophys. Res. Solid Earth 2021, 126, e2020JB021490. [Google Scholar] [CrossRef]
  38. Barruol, G.; Sigloch, K. Investigating La Réunion hot spot from crust to core. Eos Trans. Am. Geophys. Union 2013, 94, 205–207. [Google Scholar] [CrossRef]
  39. Stähler, S.C.; Sigloch, K.; Hosseini, K.; Crawford, W.C.; Barruol, G.; Schmidt-Aursch, M.C.; Tsekhmistrenko, M.; Scholz, J.R.; Mazzullo, A.; Deen, M. Performance report of the RHUM-RUM ocean bottom seismometer network around La Réunion, western Indian Ocean. Adv. Geosci. 2016, 41, 43–63. [Google Scholar] [CrossRef]
  40. Mazzullo, A.; Stutzmann, E.; Montagner, J.P.; Kiselev, S.; Maurya, S.; Barruol, G.; Sigloch, K. Anisotropic tomography around La Réunion island from Rayleigh waves. J. Geophys. Res. Solid Earth 2017, 122, 9132–9148. [Google Scholar] [CrossRef]
  41. Barruol, G.; Sigloch, K.; Scholz, J.R.; Mazzullo, A.; Stutzmann, E.; Montagner, J.P.; Kiselev, S.; Fontaine, F.R.; Michon, L.; Deplus, C.; et al. Large-scale flow of Indian Ocean asthenosphere driven by Réunion plume. Nat. Geosci. 2019, 12, 1043–1049. [Google Scholar] [CrossRef]
  42. Montagner, J.P. 3-dimensional structure of the Indian Ocean inferred from long period surface waves. Geophys. Res. Lett. 1986, 13, 315–318. [Google Scholar] [CrossRef]
  43. Debayle, E.; Lévêque, J. Upper mantle heterogeneities in the Indian Ocean from waveform inversion. Geophys. Res. Lett. 1997, 24, 245–248. [Google Scholar] [CrossRef]
  44. Montagner, J.P.; Kennett, B. How to reconcile body-wave and normal-mode reference Earth models. Geophys. J. Int. 1996, 125, 229–248. [Google Scholar] [CrossRef]
  45. Yuan, K.; Beghein, C. Seismic anisotropy changes across upper mantle phase transitions. Earth Planet. Sci. Lett. 2013, 374, 132–144. [Google Scholar] [CrossRef]
  46. Vinnik, L.; Romanowicz, B.; Le Stunff, Y.; Makeyeva, L. Seismic anisotropy in the D″-layer. Geophys. Res. Lett. 1995, 22, 1657–1660. [Google Scholar] [CrossRef]
  47. Maupin, V.; Garnero, E.J.; Lay, T.; Fouch, M.J. Azimuthal anisotropy in the D″-layer beneath the Caribbean. J. Geophys. Res. Solid Earth 2005, 110. [Google Scholar] [CrossRef]
  48. Meade, C.; Silver, P.G.; Kaneshima, S. Laboratory and seismological observations of lower mantle isotropy. Geophys. Res. Lett. 1995, 22, 1293–1296. [Google Scholar] [CrossRef]
  49. Nowacki, A.; Kendall, J.M.; Wookey, J.; Pemberton, A. Mid-mantle anisotropy in subduction zones and deep water transport. Geochem. Geophys. Geosyst. 2015, 16, 764–784. [Google Scholar] [CrossRef]
  50. Ferreira, A.M.; Faccenda, M.; Sturgeon, W.; Chang, S.J.; Schardong, L. Ubiquitous lower-mantle anisotropy beneath subduction zones. Nat. Geosci. 2019, 12, 301–306. [Google Scholar] [CrossRef]
  51. Montagner, J.P.; Burgos, G.; Capdeville, Y.; Beucler, E.; Mocquet, A. The mantle transition zone dynamics as revealed through seismic anisotropy. Tectonophysics 2021, 821, 229133. [Google Scholar] [CrossRef]
  52. Anderson, D.L. Elastic wave propagation in layered anisotropic media. J. Geophys. Res. 1961, 66, 2953–2963. [Google Scholar] [CrossRef]
  53. Love, A. A Treatise on the Mathematical Theory of Elasticity; Dover Publications: New York, NY, USA, 1927; p. 643. [Google Scholar]
  54. Aki, K.; Kaminuma, K. Crustal structure in Japan from the phase velocity of Rayleigh waves: Part 2. Rayleigh waves from the Aleutian shock of March 9, 1957. Bull. Earthq. Res. Inst. 1963, 41, 243–259. [Google Scholar]
  55. Beghein, C.; Resovsky, J.; Van Der Hilst, R.D. The signal of mantle anisotropy in the coupling of normal modes. Geophys. J. Int. 2008, 175, 1209–1234. [Google Scholar] [CrossRef]
  56. Kustowski, B.; Ekstrom, G.; Dziewonski, A.M. Anisotropic shear- wave velocity structure of the Earth’s mantle: A global model. J. Geophys. Res. Solid Earth 2008, 113, 2156–2202. [Google Scholar] [CrossRef]
  57. Moulik, P.; Ekstrom, G. An anisotropic shear velocity model of the Earth’s mantle using normal modes, body waves, surface waves and long-period waveforms. Geophys. J. Int. 2014, 199, 1713–1738. [Google Scholar] [CrossRef]
  58. Auer, L.; Boschi, L.; Becker, T.W.; Nissen-Meyer, T.; Giardini, D. Savani: A variable resolution whole-mantle model of anisotropic shear velocity variations based on multiple data sets. J. Geophys. Res. Solid Earth 2014, 119, 3006–3034. [Google Scholar] [CrossRef]
  59. Chang, S.J.; Ferreira, A.M.; Ritsema, J.; van Heijst, H.J.; Woodhouse, J.H. Joint inversion for global isotropic and radially anisotropic mantle structure including crustal thickness perturbations. J. Geophys. Res. Solid Earth 2015, 120, 4278–4300. [Google Scholar] [CrossRef]
  60. Montagner, J.P.; Nataf, H.C. A simple method for inverting the azimuthal anisotropy of surface waves. J. Geophys. Res. Solid Earth 1986, 91, 511–520. [Google Scholar] [CrossRef]
  61. Vinnik, L.; Montagner, J.P. Shear wave splitting in the mantle Ps phases. Geophys. Res. Lett. 1996, 23, 2449–2452. [Google Scholar] [CrossRef]
  62. Wookey, J.; Kendall, J.M.; Barruol, G. Mid-mantle deformation inferred from seismic anisotropy. Nature 2002, 415, 777–780. [Google Scholar] [CrossRef]
  63. Trampert, J.; van Heijst, H.J. Global azimuthal anisotropy in the transition zone. Science 2002, 296, 1297–1299. [Google Scholar] [CrossRef]
  64. Yuan, K.; Beghein, C. Three-dimensional variations in Love and Rayleigh wave azimuthal anisotropy for the upper 800 km of the mantle. J. Geophys. Res. Solid Earth 2014, 119, 3232–3255. [Google Scholar] [CrossRef]
  65. Debayle, E.; Dubuffet, F.; Durand, S. An automatically updated S-wave model of the upper mantle and the depth extent of azimuthal anisotropy. Geophys. Res. Lett. 2016, 43, 674–682. [Google Scholar]
  66. Schaeffer, A.; Lebedev, S. Global shear speed structure of the upper mantle and transition zone. Geophys. J. Int. 2013, 194, 417–449. [Google Scholar] [CrossRef]
  67. Huang, Q.; Schmerr, N.; Waszek, L.; Beghein, C. Constraints on seismic anisotropy in the mantle transition zone from long-period SS precursors. J. Geophys. Res. Solid Earth 2019, 124, 6779–6800. [Google Scholar] [CrossRef]
  68. Beucler, E.; Stutzmann, E.; Montagner, J.P. Surface wave higher-mode phase velocity measurements using a roller-coaster-type algorithm. Geophys. J. Int. 2003, 155, 289–307. [Google Scholar]
  69. Visser, K.; Trampert, J.; Kennett, B. Global anisotropic phase velocity maps for higher mode Love and Rayleigh waves. Geophys. J. Int. 2008, 172, 1016–1032. [Google Scholar] [CrossRef]
  70. Burgos, G.; Montagner, J.P.; Beucler, E.; Capdeville, Y.; Mocquet, A.; Drilleau, M. Oceanic lithosphere-asthenosphere boundary from surface wave dispersion data. J. Geophys. Res. Solid Earth 2014, 119, 1079–1093. [Google Scholar] [CrossRef]
  71. Burgos, G. Tomographie du Manteau Supérieur par Inversion des Ondes de Surface. Ph.D. Thesis, Institut de Physique du Globe de Paris (IPGP), Paris, France, 2013. [Google Scholar]
  72. Ringwood, A. Composition and Petrology of the Earth’s Mantle; McGraw-Hill: New York, NY, USA, 1975; Volume 618. [Google Scholar]
  73. Tschauner, O.; Ma, C.; Beckett, J.R.; Prescher, C.; Prakapenka, V.B.; Rossman, G.R. Discovery of bridgmanite, the most abundant mineral in Earth, in a shocked meteorite. Science 2014, 346, 1100–1102. [Google Scholar] [CrossRef]
  74. Dubrovinsky, L.; Dubrovinskaia, N.; Saxena, S.; Annersten, H.; Hålenius, E.; Harryson, H.; Tutti, F.; Rekhi, S.; Bihan, T.L. Stability of ferropericlase in the lower mantle. Science 2000, 289, 430–432. [Google Scholar] [CrossRef]
  75. Murakami, M.; Hirose, K.; Kawamura, K.; Sata, N.; Ohishi, Y. Post-perovskite phase transition in MgSiO3. Science 2004, 304, 855–858. [Google Scholar] [CrossRef]
  76. Grocholski, B.; Catalli, K.; Shim, S.H.; Prakapenka, V. Mineralogical effects on the detectability of the postperovskite boundary. Proc. Natl. Acad. Sci. USA 2012, 109, 2275–2279. [Google Scholar] [CrossRef] [PubMed]
  77. Bina, C.R.; Helffrich, G. Phase transition Clapeyron slopes and transition zone seismic discontinuity topography. J. Geophys. Res. Solid Earth 1994, 99, 15853–15860. [Google Scholar] [CrossRef]
  78. Kawakatsu, H.; Niu, F. Seismic evidence for a 920-km discontinuity in the mantle. Nature 1994, 371, 301–305. [Google Scholar] [CrossRef]
  79. Niu, F.; Kawakatsu, H. Depth variation of the mid-mantle seismic discontinuity. Geophys. Res. Lett. 1997, 24, 429–432. [Google Scholar] [CrossRef]
  80. Vinnik, L.; Niu, F.; Kawakatsu, H. Broadband converted phases from midmantle discontinuities. Earth Planets Space 1998, 50, 987–997. [Google Scholar] [CrossRef]
  81. Jenkins, J.; Deuss, A.; Cottaar, S. Converted phases from sharp 1000 km depth mid-mantle heterogeneity beneath Western Europe. Earth Planet. Sci. Lett. 2017, 459, 196–207. [Google Scholar] [CrossRef]
  82. Zhang, Z.; Irving, J.C.; Simons, F.J.; Alkhalifah, T. Seismic evidence for a 1000 km mantle discontinuity under the Pacific. Nat. Commun. 2023, 14, 1714. [Google Scholar] [CrossRef]
  83. Ballmer, M.D.; Schmerr, N.C.; Nakagawa, T.; Ritsema, J. Compositional mantle layering revealed by slab stagnation at ∼1000-km depth. Sci. Adv. 2015, 1, e1500815. [Google Scholar] [CrossRef]
  84. Wu, W.; Ni, S.; Irving, J.C. Inferring Earth’s discontinuous chemical layering from the 660-kilometer boundary topography. Science 2019, 363, 736–740. [Google Scholar] [CrossRef]
  85. Waszek, L.; Schmerr, N.C.; Ballmer, M.D. Global observations of reflectors in the mid-mantle with implications for mantle structure and dynamics. Nat. Commun. 2018, 9, 385. [Google Scholar] [CrossRef]
  86. Mitrovica, J.; Forte, A. A new inference of mantle viscosity based upon joint inversion of convection and glacial isostatic adjustment data. Earth Planet. Sci. Lett. 2004, 225, 177–189. [Google Scholar] [CrossRef]
  87. Rudolph, M.L.; Lekić, V.; Lithgow-Bertelloni, C. Viscosity jump in Earth’s mid-mantle. Science 2015, 350, 1349–1352. [Google Scholar] [CrossRef]
  88. Marquardt, H.; Miyagi, L. Slab stagnation in the shallow lower mantle linked to an increase in mantle viscosity. Nat. Geosci. 2015, 8, 311–314. [Google Scholar] [CrossRef]
  89. Shim, S.H.; Grocholski, B.; Ye, Y.; Alp, E.E.; Xu, S.; Morgan, D.; Meng, Y.; Prakapenka, V.B. Stability of ferrous-iron-rich bridgmanite under reducing midmantle conditions. Proc. Natl. Acad. Sci. USA 2017, 114, 6468–6473. [Google Scholar] [CrossRef]
  90. Deng, J.; Lee, K.K. Viscosity jump in the lower mantle inferred from melting curves of ferropericlase. Nat. Commun. 2017, 8, 1997. [Google Scholar] [CrossRef]
  91. Badro, J. Spin transitions in mantle minerals. Annu. Rev. Earth Planet. Sci. 2014, 42, 231–248. [Google Scholar] [CrossRef]
  92. Glišović, P.; Forte, A.M.; Ammann, M.W. Variations in grain size and viscosity based on vacancy diffusion in minerals, seismic tomography, and geodynamically inferred mantle rheology. Geophys. Res. Lett. 2015, 42, 6278–6286. [Google Scholar] [CrossRef]
  93. Fei, H.; Ballmer, M.D.; Faul, U.; Walte, N.; Cao, W.; Katsura, T. Variation in bridgmanite grain size accounts for the mid-mantle viscosity jump. Nature 2023, 620, 794–799. [Google Scholar] [CrossRef]
  94. Vacher, P.; Mocquet, A.; Sotin, C. Computation of seismic profiles from mineral physics: The importance of the non-olivine components for explaining the 660 km depth discontinuity. Phys. Earth Planet. Inter. 1998, 106, 275–298. [Google Scholar] [CrossRef]
  95. Anderson, D. New Theory of the Earth, 2nd ed.; Cambridge University Press: Cambridge, UK, 2007. [Google Scholar]
  96. Mainprice, D. Seismic anisotropy of the deep Earth from a mineral and rock physics perspective. In Treatise of Geophysics; Elsevier: Amsterdam, The Netherlands, 2015; Volume 2. [Google Scholar]
  97. Shearer, P. Transition zone velocity gradients and the 520km discontinuity. J. Geophys. Res. 1996, 101, 3053–3066. [Google Scholar]
  98. Karato, S.I. Seismic anisotropy in the deep mantle, boundary layers and the geometry of mantle convection. In Geodynamics of Lithosphere & Earth’s Mantle: Seismic Anisotropy as a Record of the Past and Present Dynamic Processes; Birkhäuser: Basel, Switzerland, 1998; pp. 565–587. [Google Scholar]
  99. Van der Meijde, M.; Marone, F.; Giardini, D.; Van der Lee, S. Seismic evidence for water deep in Earth’s upper mantle. Science 2003, 300, 1556–1558. [Google Scholar] [CrossRef]
  100. Bercovici, D.; Karato, S.i. Whole-mantle convection and the transition-zone water filter. Nature 2003, 425, 39–44. [Google Scholar] [CrossRef]
  101. Huang, X.; Xu, Y.; Karato, S.i. Water content in the transition zone from electrical conductivity of wadsleyite and ringwoodite. Nature 2005, 434, 746–749. [Google Scholar] [CrossRef]
  102. Tommasi, A.; Mainprice, D.; Cordier, P.; Thoraval, C.; Couvy, H. Strain-induced seismic anisotropy of wadsleyite polycrystals and flow patterns in the mantle transition zone. J. Geophys. Res. Solid Earth 2004, 109, B12405-1. [Google Scholar] [CrossRef]
  103. Wu, W.; Nishihara, Y.; Tsujino, N. Crystallographic preferred orientation of phase D at high pressure and temperature: Implications for seismic anisotropy in the mid-mantle. J. Geophys. Res. Solid Earth 2024, 129, e2024JB029734. [Google Scholar] [CrossRef]
  104. Kattemalavadi, A.; Devoe, M.; Wenk, H.R. Deformation of Hydrous Phases Egg [AlSiO3(OH)], δ [AlO(OH)] and Stishovite [Si1-nH4nO2] Relevant to Anisotropy of the Earth’s Mantle. J. Geophys. Res. Solid Earth 2025, 130, e2025JB031362. [Google Scholar] [CrossRef]
  105. Gay, J.P.; Ledoux, E.E.; Krug, M.; Chantel, J.; Pakhomova, A.; Sanchez-Valle, C.; Speziale, S.; Merkel, S. Depth dependent deformation and anisotropy of pyrolite in the Earth’s lower mantle. Geophys. Res. Lett. 2024, 51, e2024GL109433. [Google Scholar] [CrossRef]
  106. Farnetani, C.; Samuel, H. Beyond the thermal plume paradigm. Geophys. Res. Lett. 2005, 32, L07311. [Google Scholar] [CrossRef]
  107. Durand, S.; Debayle, E.; Ricard, Y.; Zaroli, C.; Lambotte, S. Confirmation of a change in the global shear velocity pattern at around 1000 km depth. Geophys. J. Int. 2017, 211, 1628–1639. [Google Scholar] [CrossRef]
  108. Ritsema, J.; Deuss, A.; van Heijst, H.; Woodhouse, J.H. S40RTS: A degree-40 shear-velocity model for the mantle from new Rayleigh wave dispersion, teleseismic traveltime and normal-mode splitting function measurements. Geophys. J. Int. 2011, 184, 1223–1236. [Google Scholar] [CrossRef]
  109. Romanowicz, B.; Dziewonski, A. Tomographic Stratigraphy: A Possible New Framework for Mantle Dynamics. In Proceedings of the AGU Fall Meeting Abstracts; American Geophysical Union (AGU): Washington, DC, USA, 2015; Volume 2015, p. DI23A-08. [Google Scholar]
  110. French, S.; Lekic, V.; Romanowicz, B. Waveform tomography reveals channeled flow at the base of the oceanic asthenosphere. Science 2013, 342, 227–230. [Google Scholar] [CrossRef]
  111. Yuan, K.; Romanowicz, B. Seismic evidence for partial melting at the root of major hot spot plumes. Science 2017, 357, 393–397. [Google Scholar] [CrossRef] [PubMed]
  112. Dupré, B.; Allègre, C.J. Pb–Sr isotope variation in Indian Ocean basalts and mixing phenomena. Nature 1983, 303, 142–146. [Google Scholar] [CrossRef]
  113. Hart, S.R. A large-scale isotope anomaly in the Southern Hemisphere mantle. Nature 1984, 309, 753–757. [Google Scholar] [CrossRef]
  114. Castillo, P. The Dupal anomaly as a trace of the upwelling lower mantle. Nature 1988, 336, 667–670. [Google Scholar] [CrossRef]
  115. Schouten, T.L.; Gebraad, L.; Noe, S.; Gülcher, A.J.; Thrastarson, S.; van Herwaarden, D.P.; Fichtner, A. Full-waveform inversion reveals diverse origins of lower mantle positive wave speed anomalies. Sci. Rep. 2024, 14, 26708. [Google Scholar] [CrossRef]
  116. Coffin, M.F.; Eldholm, O. Large igneous provinces: Crustal structure, dimensions, and external consequences. Rev. Geophys. 1994, 32, 1–36. [Google Scholar] [CrossRef]
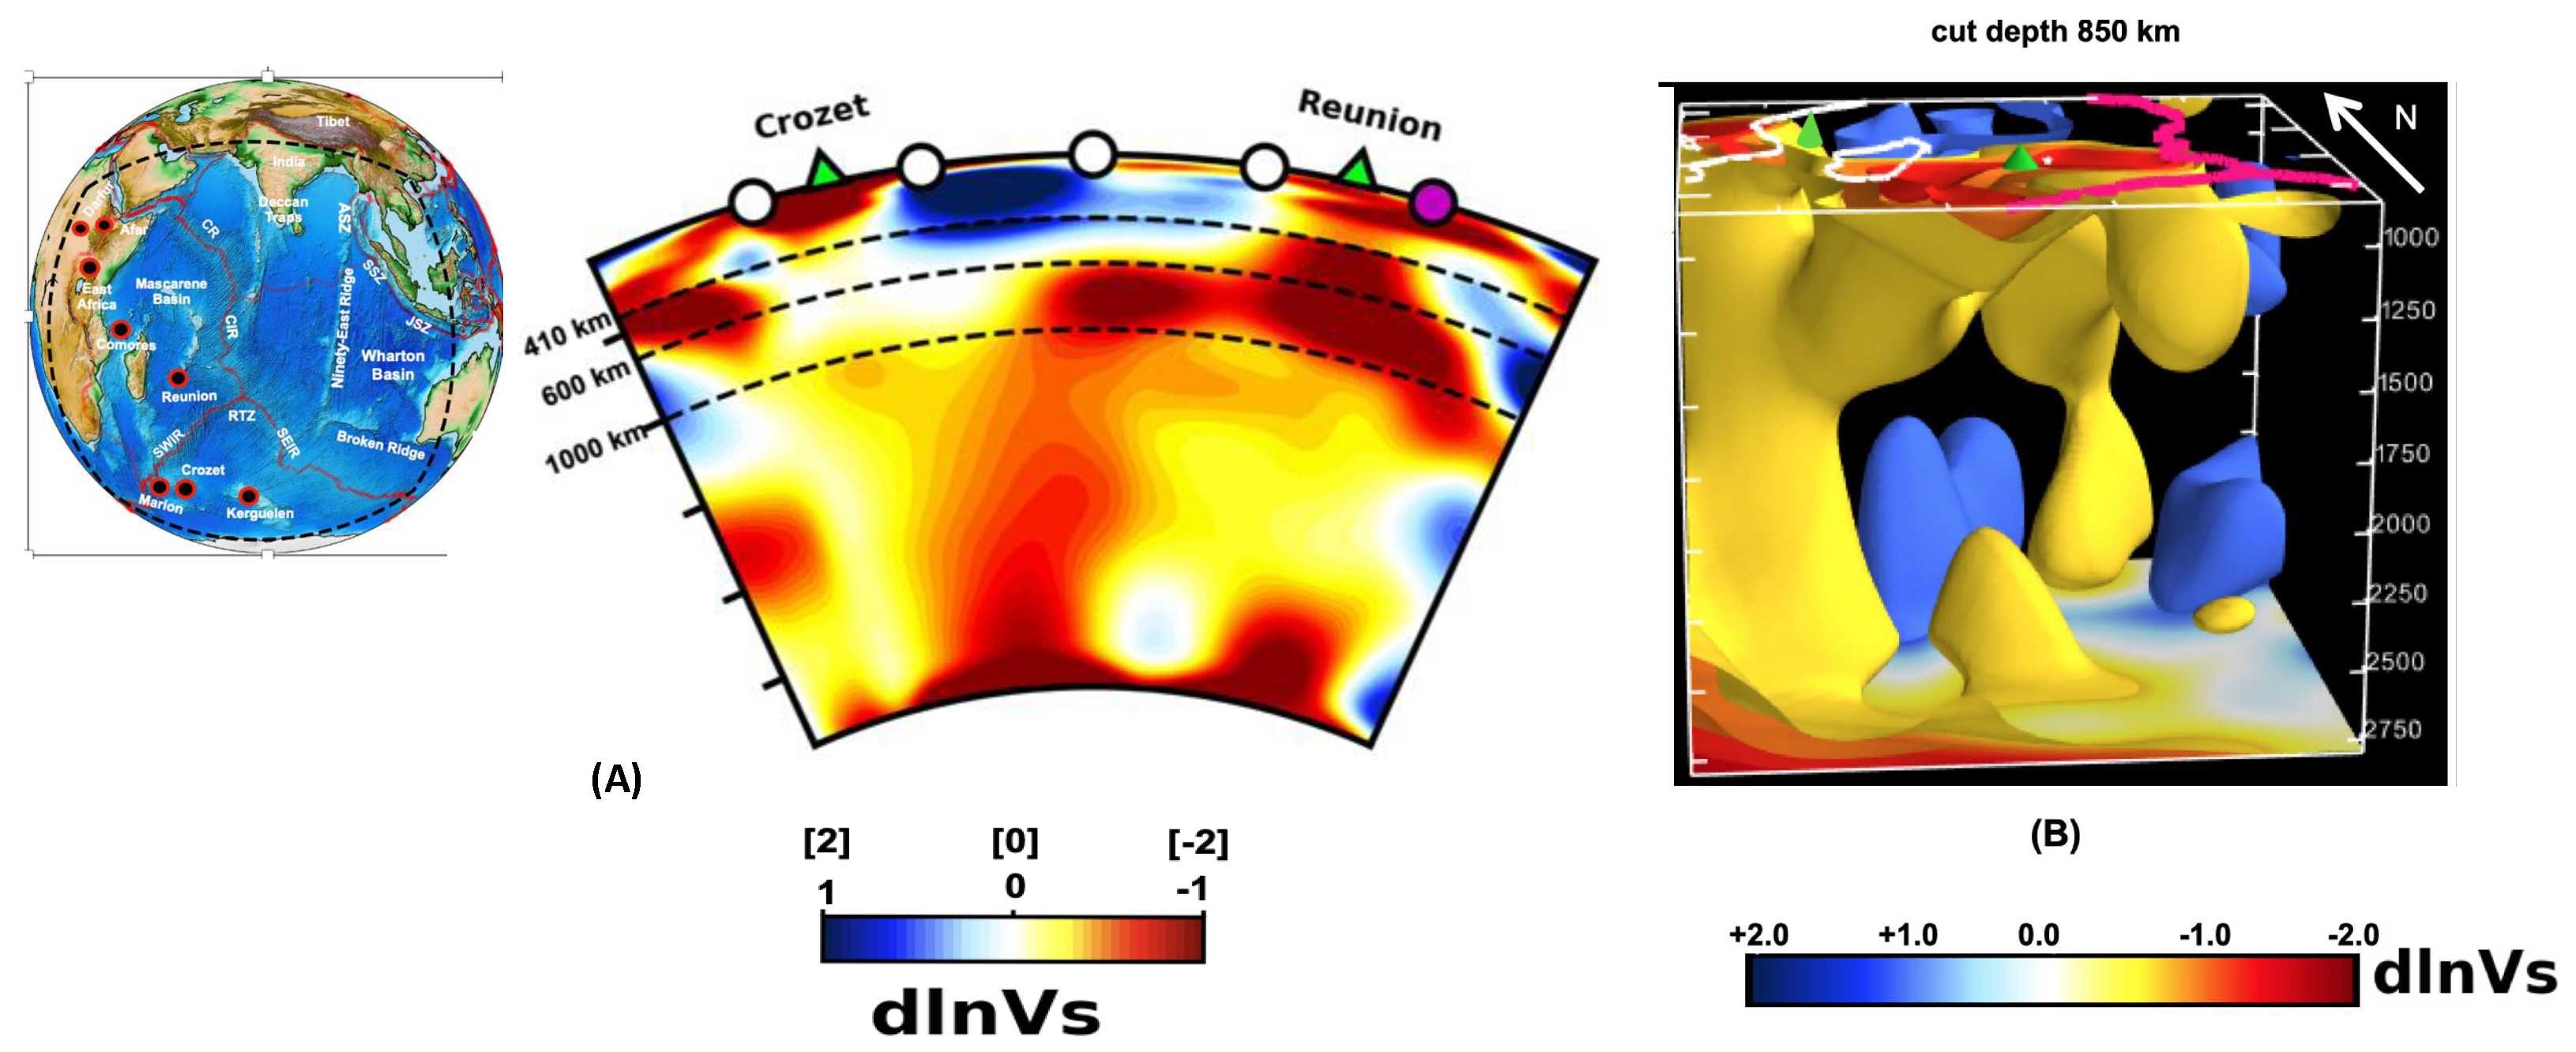
Figure 1. Imaging of LMPZ beneath La Réunion island. (A) Selected one-dimensional north–south cross-section in model SEMINDO-WM3 [27] from the surface down to the CMB in the Indian Ocean. Inset on the left of the cross-sections shows the geological map of the region with hotspots (red circles) and salient structures, Mascarene Basin, Deccan Trapps, Ninety East Ridge, Carlsberg ridge (CR), Central Indian Ridge (CIR), Southwest Indian Ridge (SWIR), Southeast Indian Ridge (SEIR), Rodrigues Triple Junction, Andaman (ASZ), Sumatra (SSZ), and Java (JZS) subduction zones. The black broken lines in the cross-sections correspond to depths of 400, 660, and 1000 km. (B) A 3D-subvolume of model SEMINDO-WM3 around the La Réunion hotspot (green cone) from the CMB shows up to a 850 km depth. The model is shown looking from the south. Land outlines are projected on this surface as white lines, and Indian mid-ocean ridges are shown as red lines.
Geosciences 15 00413 g001
Figure 2. Imaging of LMPZ in the Atlantic ocean. (A) Two-dimensional whole-mantle cross-sections in model SEMATL _ 23 . The inset on the left indicates its geographical location. (B) Three-dimensional rendering of shear velocity perturbations with respect to the regional average (d lnVs, in percent) in model SEMATL _ 23 highlighting the Cape Verde/Canary plume group. Colored cones indicate the location of the Cape Verde (purple) and Canary (green) hotspots. The grey vertical bar indicates the vertical extension from the Canary hotspot to the CMB.
Geosciences 15 00413 g002
Figure 3. Anisotropic tomographic images of S-wave velocity, G-Azimuthal anisotropy, and ξ -radial anisotropy at 800 km depth in the Indian Ocean around La Réunion hotspot (indicated by the green triangle). Adapted from [51,71].
Geosciences 15 00413 g003
Figure 4. (A) Change in the geographical pattern of the prominent “degree 2” pattern in shear velocity across the mantle, showing consistency across global mantle tomographic models. From top to bottom, models S 365 A N I  [56], SEMUCB _ W M 1  [36], and S 40 R T S  [108]. From left to right, models are shown at depths of 200, 500, and 2800 km, respectively, but the patterns are consistent within each depth range as indicated in the column titles. The “heterosphere” represents the top boundary layer of the earth that includes the lithosphere and the asthenosphere. “Planetary downwelling” indicates that regions of subduction dominate the degree 2 pattern in the depth range of 275–1000 km. “Planetary upwelling” indicates that regions of upwelling above the LLSVPs dominate the degree 2 pattern in the depth range of 1000–2800 km. After [109]: (B) depth correlation plots for top: P model G A P _ P 4  [32], bottom: S model S E M u m 2 [110] for structural degrees 1-3, showing that the decorrelation between the “upper” and “lower” mantles occurs around a 1000 km depth and not at the 660 discontinuity (courtesy V. Lekic).
Geosciences 15 00413 g004
Figure 5. Conceptual sketch illustrating the dynamics of the deep Earth mantle, including the plumbing system associated with LMPZ. The thick dashed lines correspond to depths of 660 km and 1000 km, where many plumes are ponding or deflected horizontally. The complexity of upwellings arising from the CMB beneath the hotspot is represented by two ponding zones, one below the LAB and another in the uppermost lower mantle. Slabs (gray) can also stagnate above the 660 km discontinuity or above ∼1000 km depth. Sinking slab fragments are shown in blue. The LLSVP consists of bundles of plumes. Modified from [111].
Geosciences 15 00413 g005
Disclaimer/Publisher’s Note: The statements, opinions and data contained in all publications are solely those of the individual author(s) and contributor(s) and not of MDPI and/or the editor(s). MDPI and/or the editor(s) disclaim responsibility for any injury to people or property resulting from any ideas, methods, instructions or products referred to in the content.