A Dual-Method Assessment of the Yarmouk Basin’s Groundwater Vulnerability Using SINTACS and Random Forest
Abstract
1. Introduction
2. Study Area
2.1. Description of the Study Area
2.2. Geological and Hydrogeological Setting
3. Methodology and Data Analysis
3.1. Data Requirement
3.2. SINTACS Vulnerability Model
3.3. Random Forest Machine Learning Model
- 1.
- Data requirement: hydrogeological, land use, and topographic parameters are required. These often comprise effective infiltration, groundwater depth, soil type, unsaturated zone characteristics, hydraulic conductivity, aquifer media, topographic gradient, rainfall, and land use/cover. These parameters are typically represented as spatial layers in a geographic information system (GIS). For supervised learning, an RF model requires a key variable representing groundwater vulnerability. This variable can come from existing vulnerability maps (for example, from well-known indices such as SINTACS or DRASTIC, which serve as proxy indicators of vulnerability) or, ideally, from detailed groundwater data and quality information (such as nitrate levels or pesticide presence) that indicate contamination levels. The target variable is often classified into specific vulnerability categories, such as very low, low, medium, extreme, and very high. The primary step involves extracting data points, including grid cells and pixels, from all parameter layers and the final vulnerability layer. These sampling factors create training and testing datasets. It is important to ensure that the training data accurately represents the full range of vulnerable situations across the study area.
- 2.
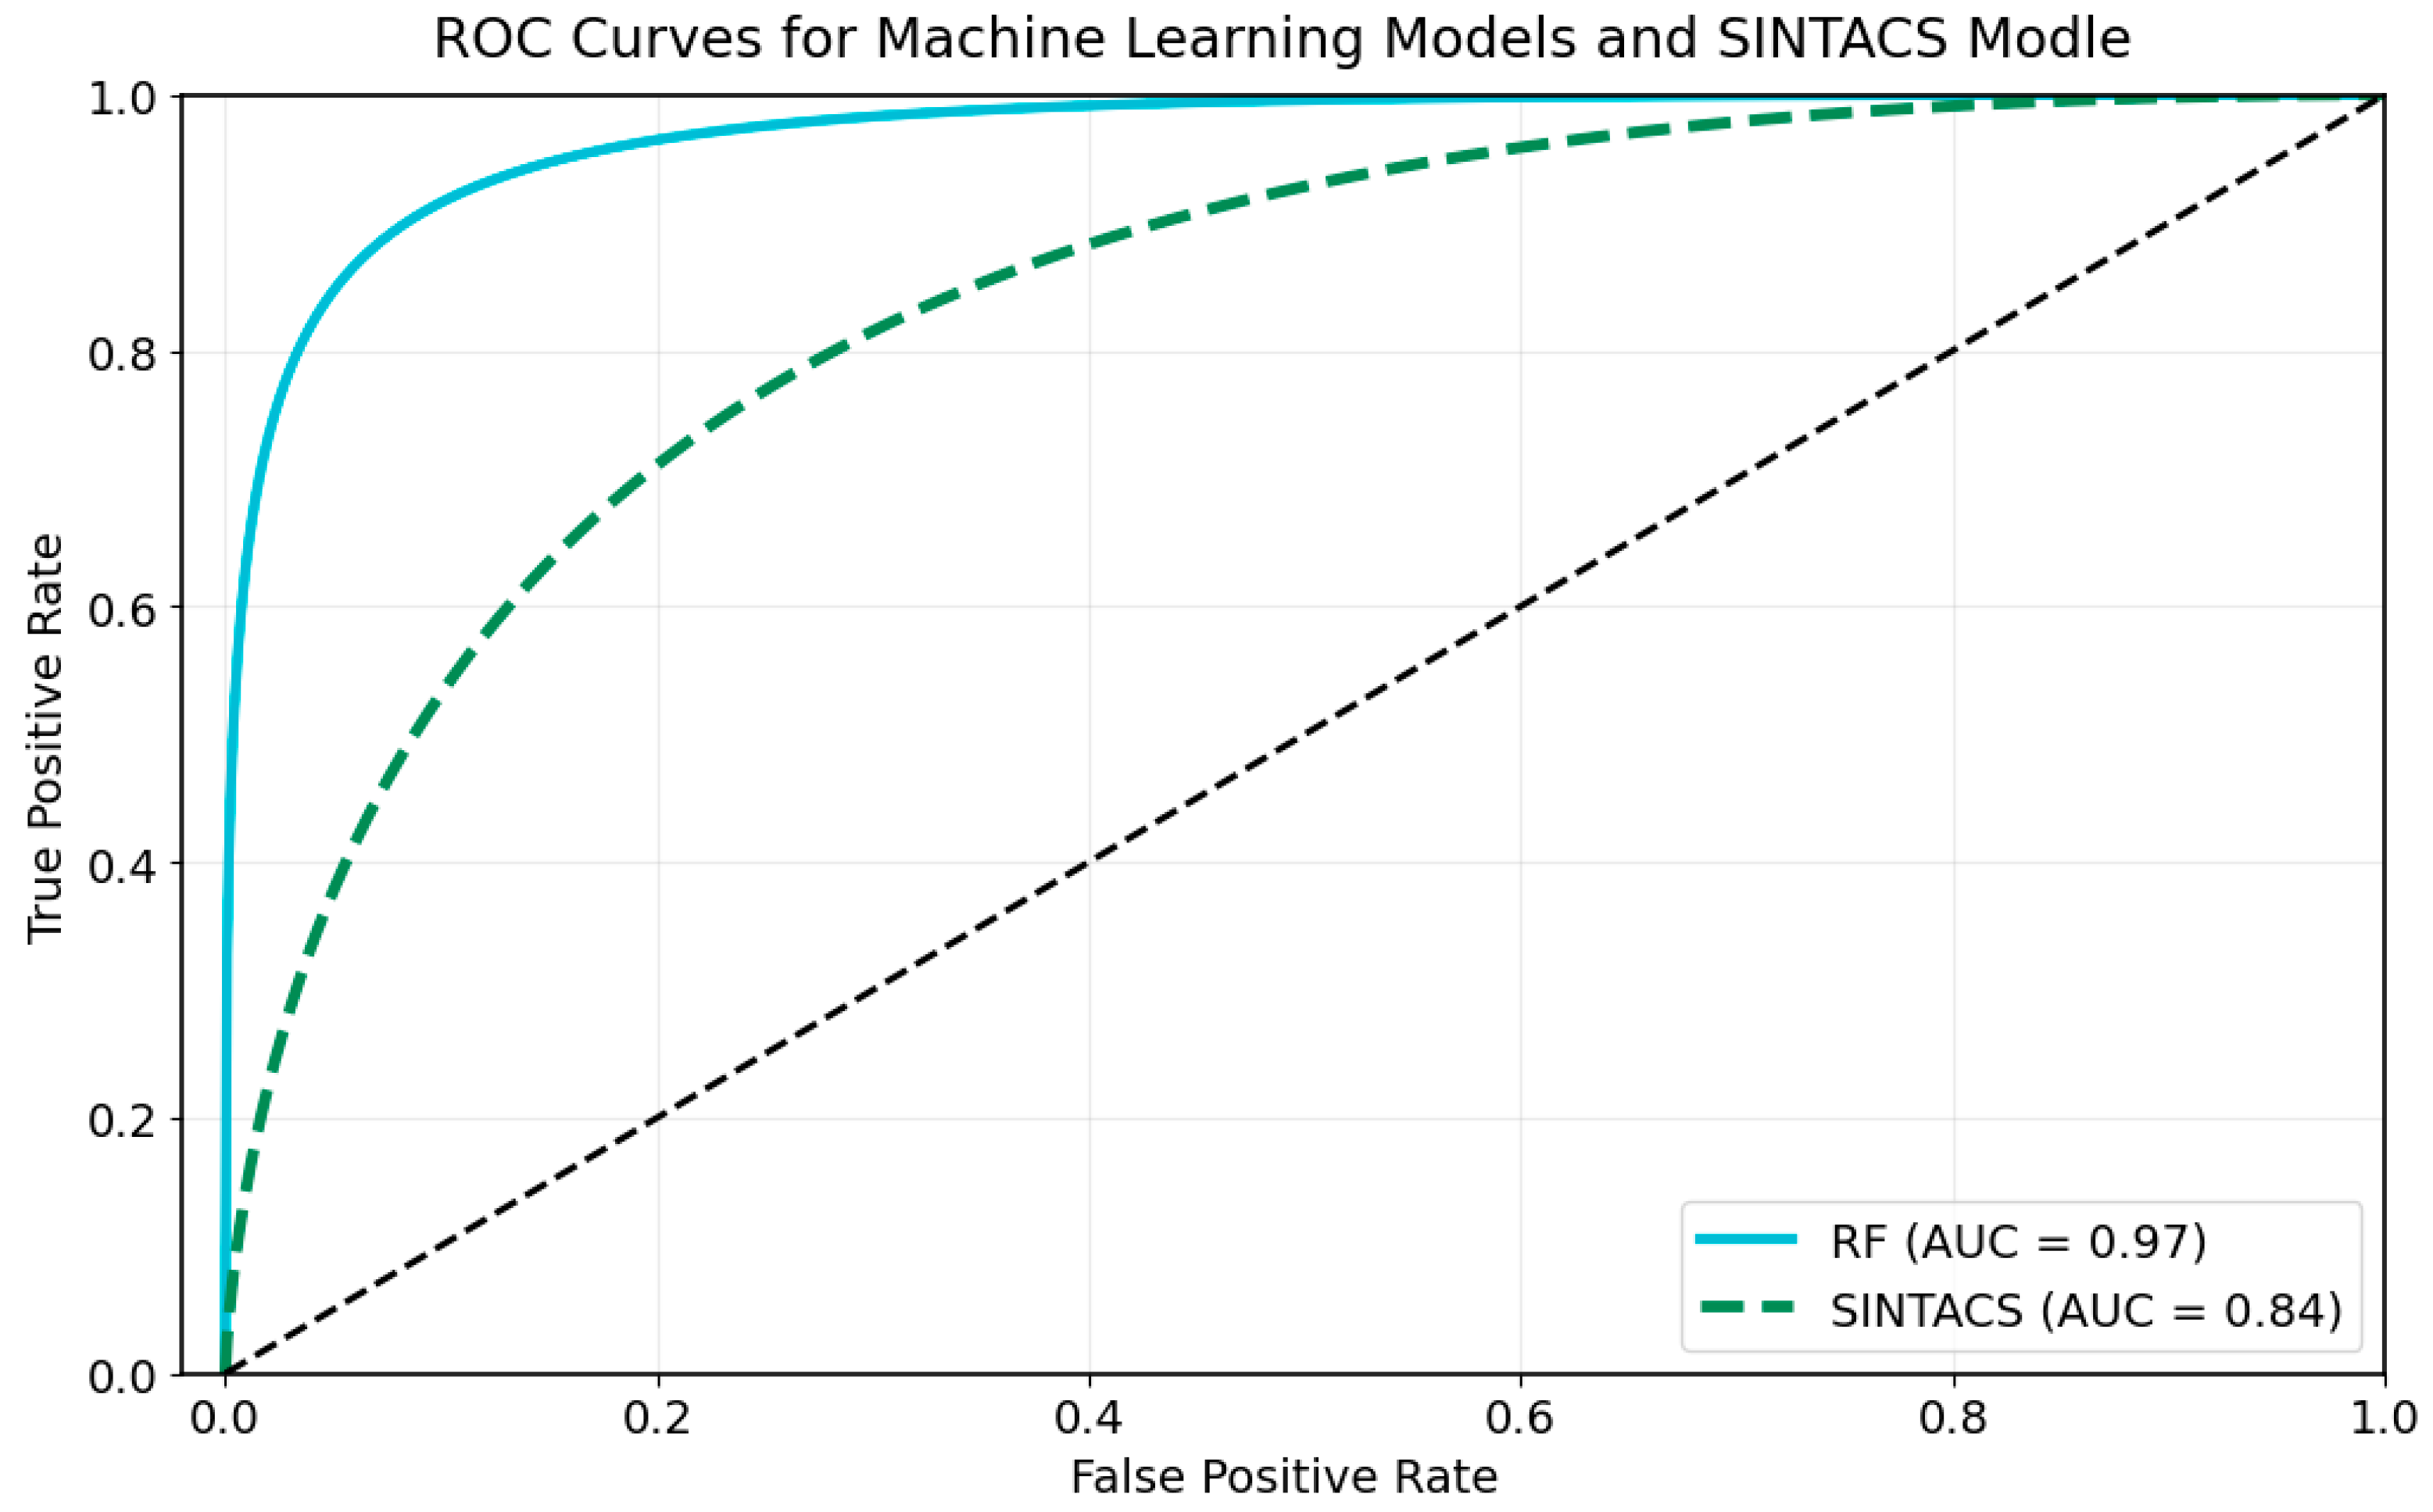
- Model Training and Validation: The dataset was split into 80% training and 20% testing, ensuring a comprehensive evaluation of the model [62]. The model used 6000 random points for training and testing. In this work, the area under the receiver operating characteristic curve (AUC-ROC) measured the overall performance of the radio frequency (RF) model after training. Performance comparisons often use common metrics for classification methods, including accuracy, precision, recall, and F1 score. Random Forest (RF) model performance was compared with overall performance based on Area Under the Receiver Operating Characteristic Curve (AUC-ROC). The AUC-ROC curve was plotted and attained an extremely high AUC of 0.97, indicating the extremely high ability of the model to discriminate between different groundwater vulnerability classes [63].
- 3.
- Hyperparameter Analysis: To obtain the Random Forest (RF) model to run best and to prevent overfitting, hyperparameter tuning was carried out [64]. The most important parameters were tuned (n_estimators, max_depth, min_samples_split and min_samples_leaf). The optimal set of these hyperparameters was found using grid search with 5-fold cross-validation (GridSearchCV) on the training set. The algorithm iteratively goes through a given grid of parameter settings and measures each setting by finding the performance through cross-validation to prevent overfitting. Usually, hyperparameters are the parameter value settings before learning [65]. The process of hyperparameter tuning is used to identify the optimal set of parameter values so that model performance, accuracy, and generalization abilities can be improved [66].
- 4.
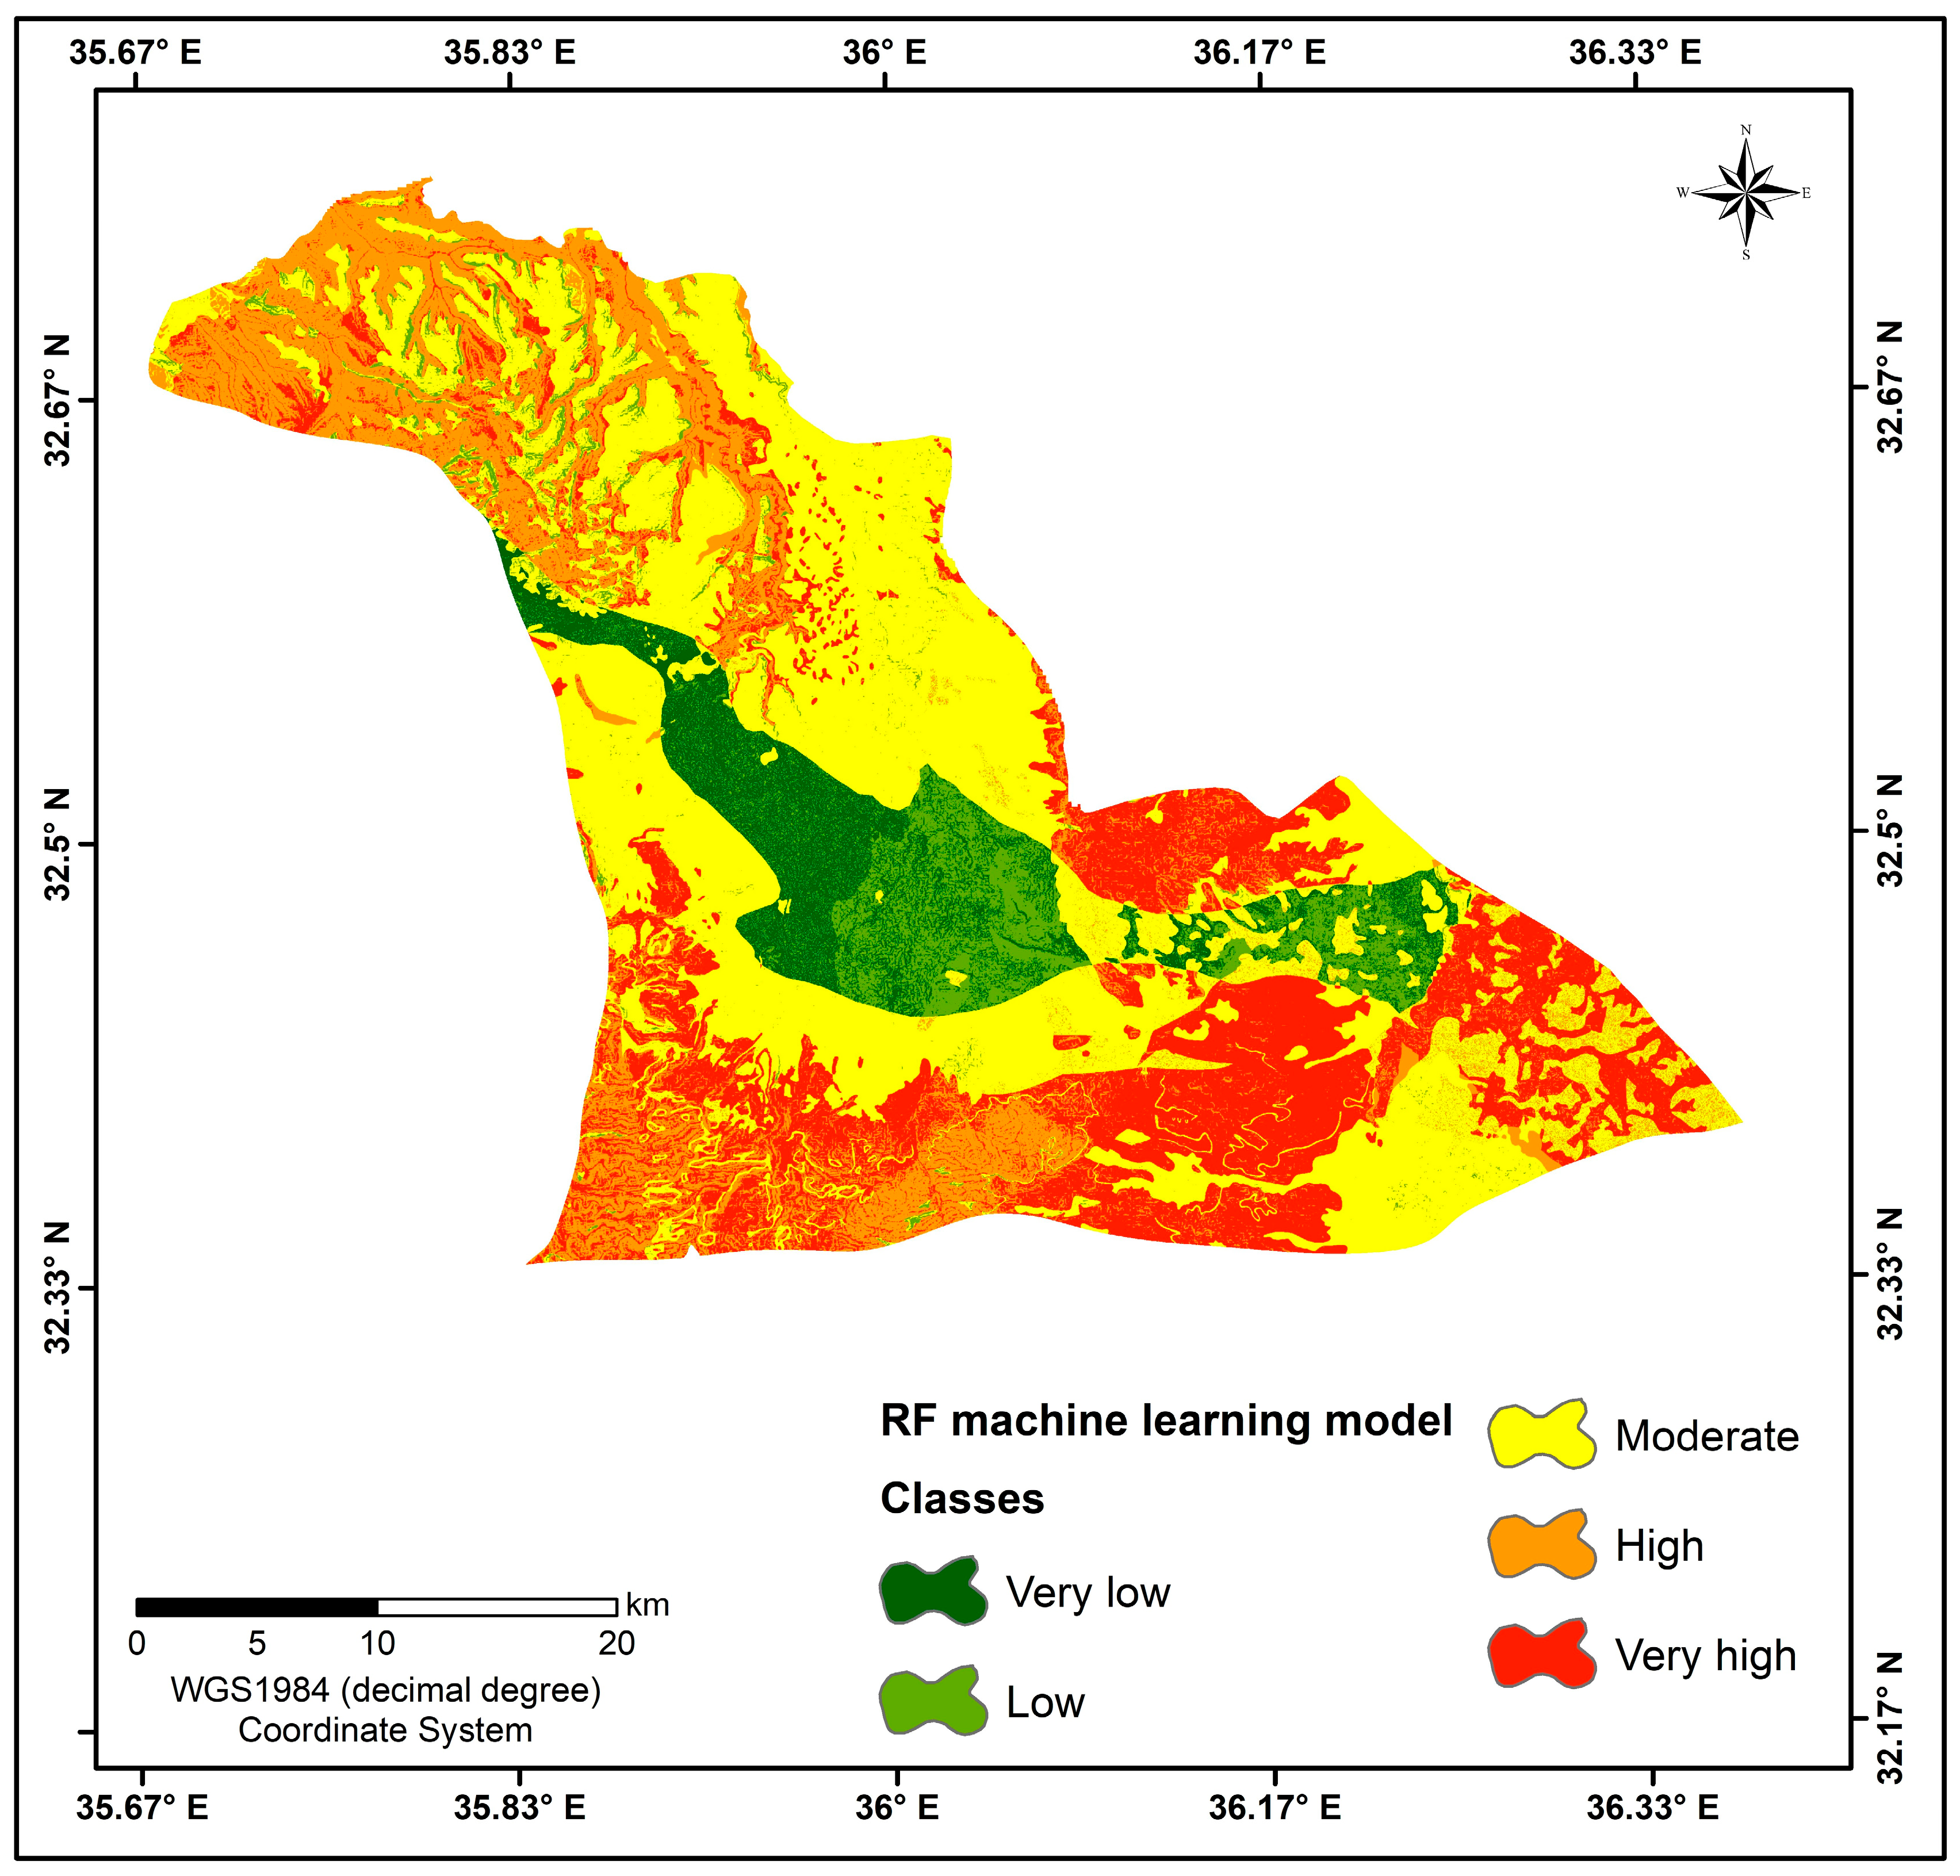
- Vulnerability Mapping: After training and validating the RF model, it predicts groundwater vulnerability for each pixel or grid cell in the study area based on the input parameter values for each cell. These results are displayed in a vulnerability map. The RF model produces a continuous vulnerability index, which is then categorized into discrete vulnerability levels (ranging from very low to very high) using appropriate normalization methods to create the final vulnerability map.
4. Results and Discussion
4.1. SINTACS Model Parameters
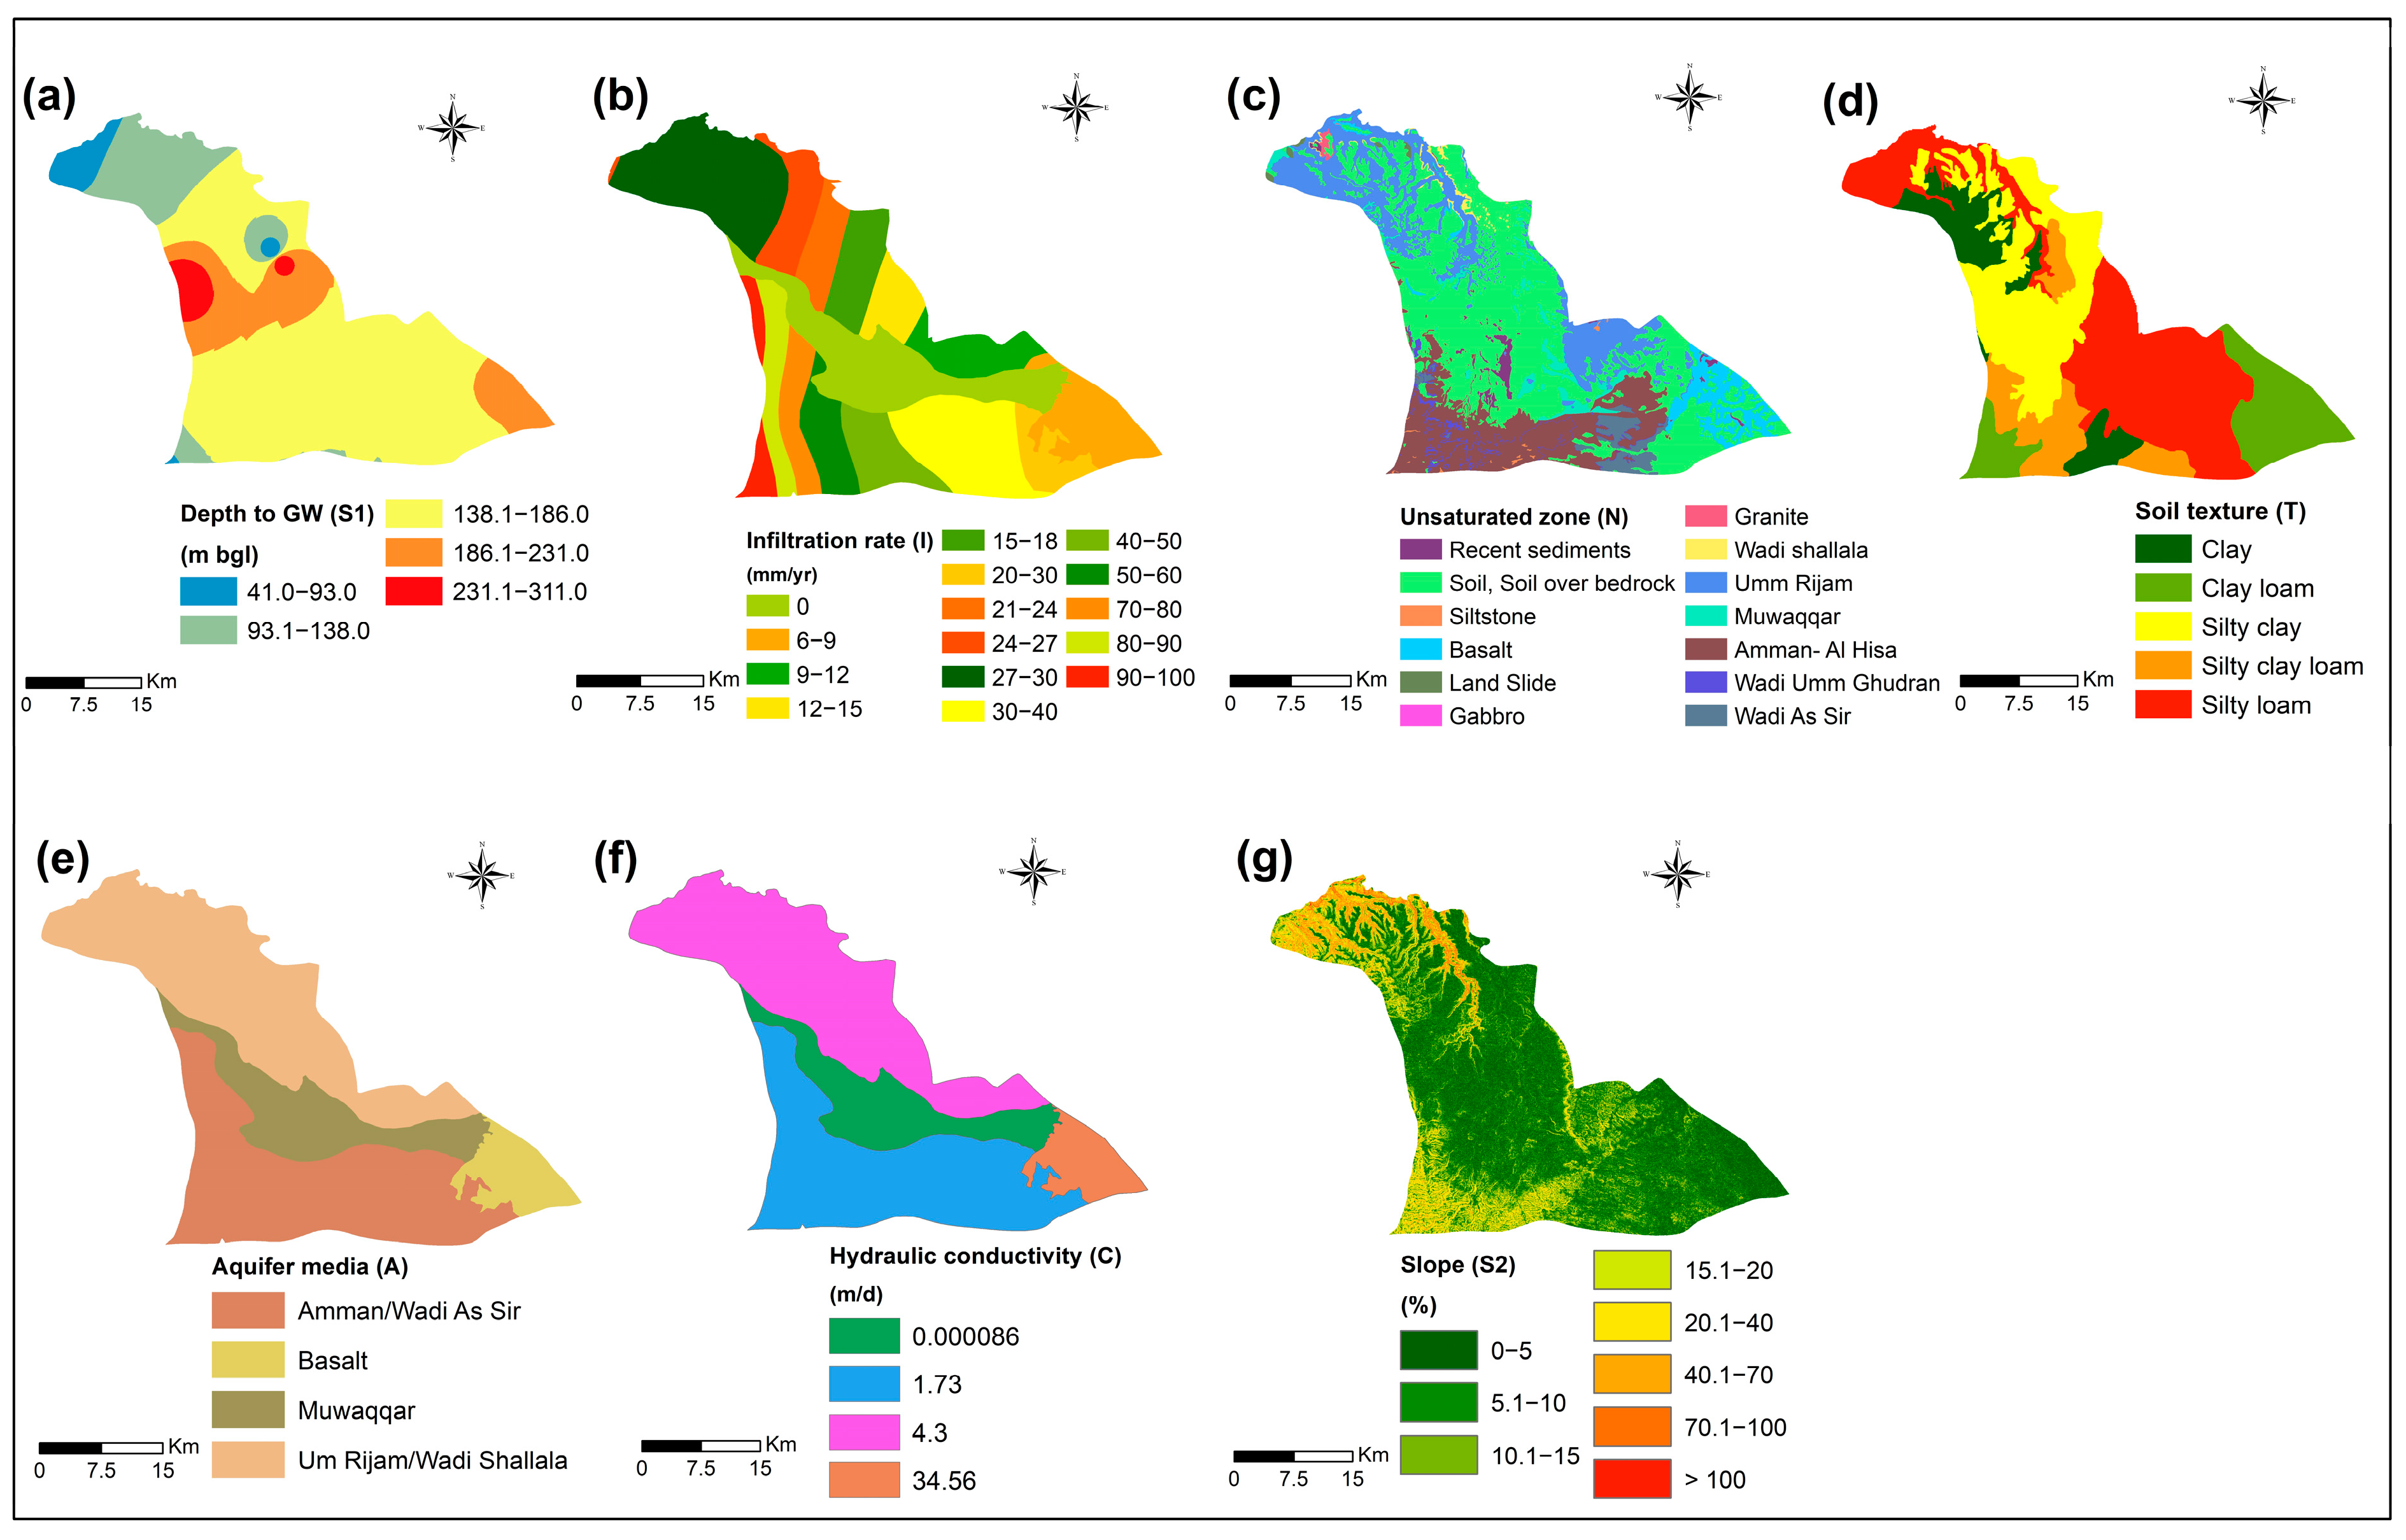
- Depth to Groundwater (Sottosuolo) (S1): Groundwater pollution can affect the exploitable amount of freshwater, leading to water scarcity problems [69]. Depth to groundwater is an important parameter in groundwater vulnerability analysis, as deeper groundwater levels imply a longer travel time and more natural attenuation for pollutants before reaching the groundwater [10,70,71]. In the YRB, the depth to water level ranges from 41 m and 311 m (Figure 4a). This parameter was given the rate value of (1) for depth to GW in the basin, suggesting it is generally deep with slight variations (Table 2).
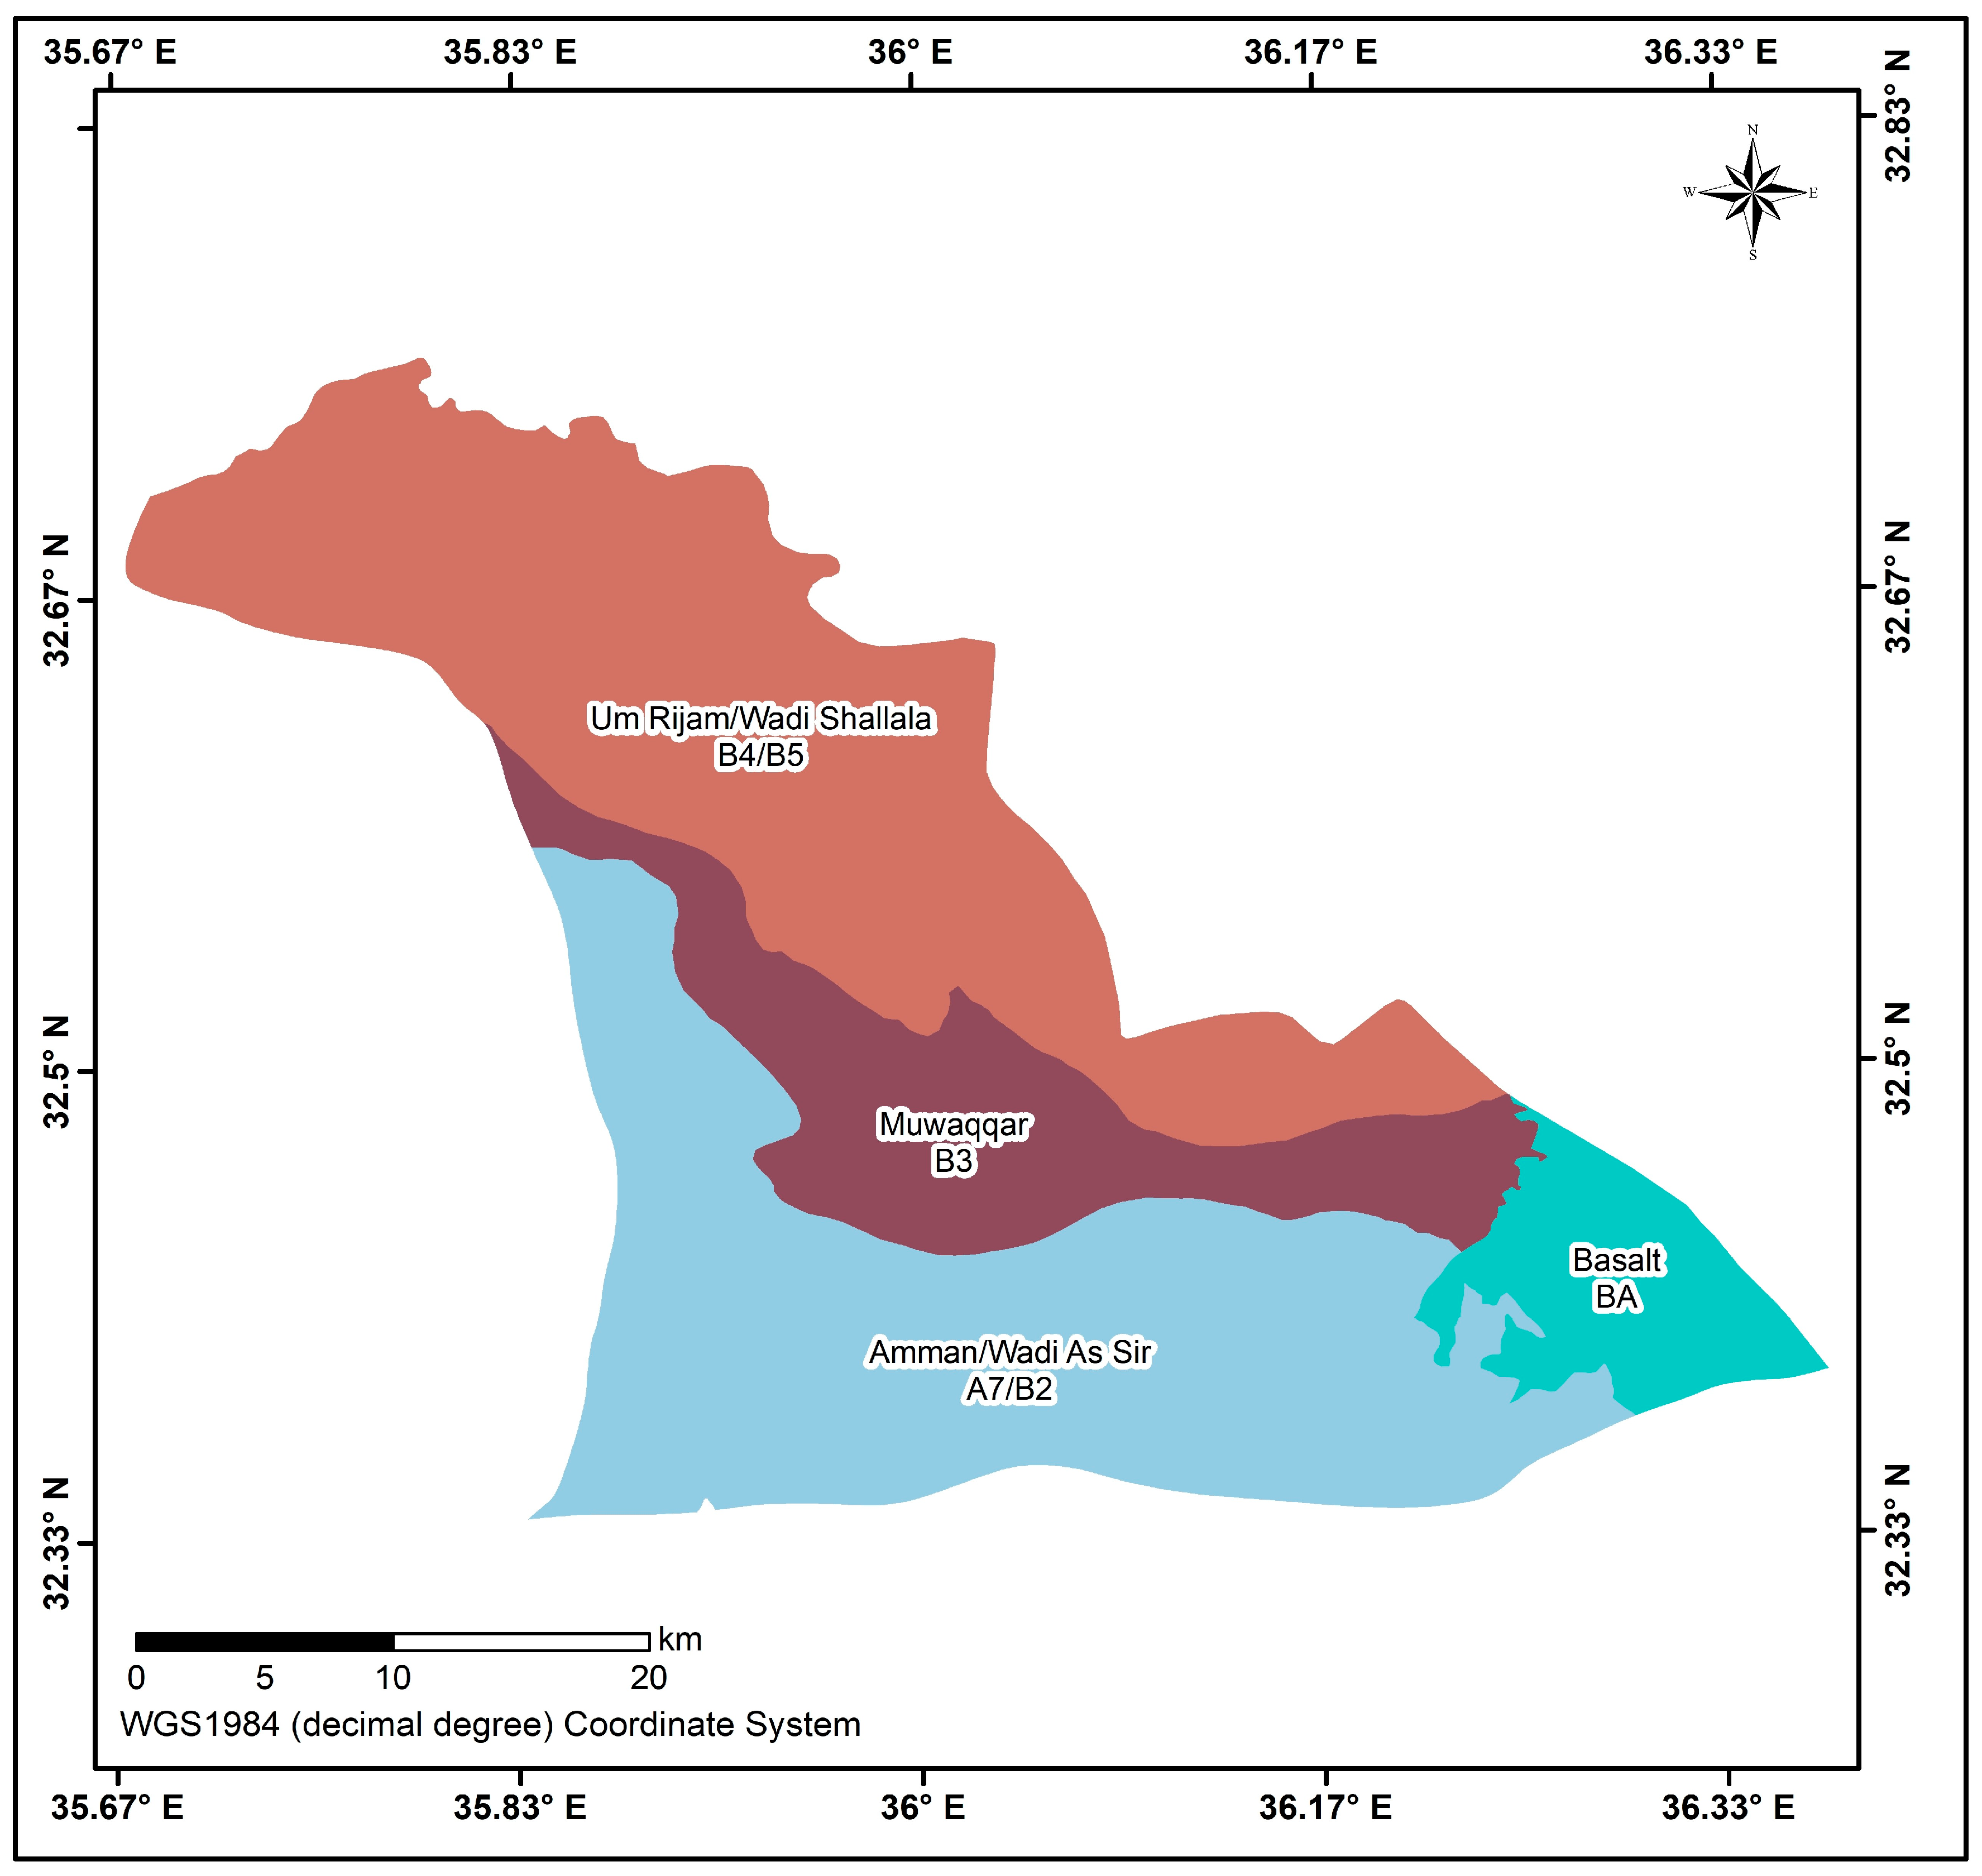
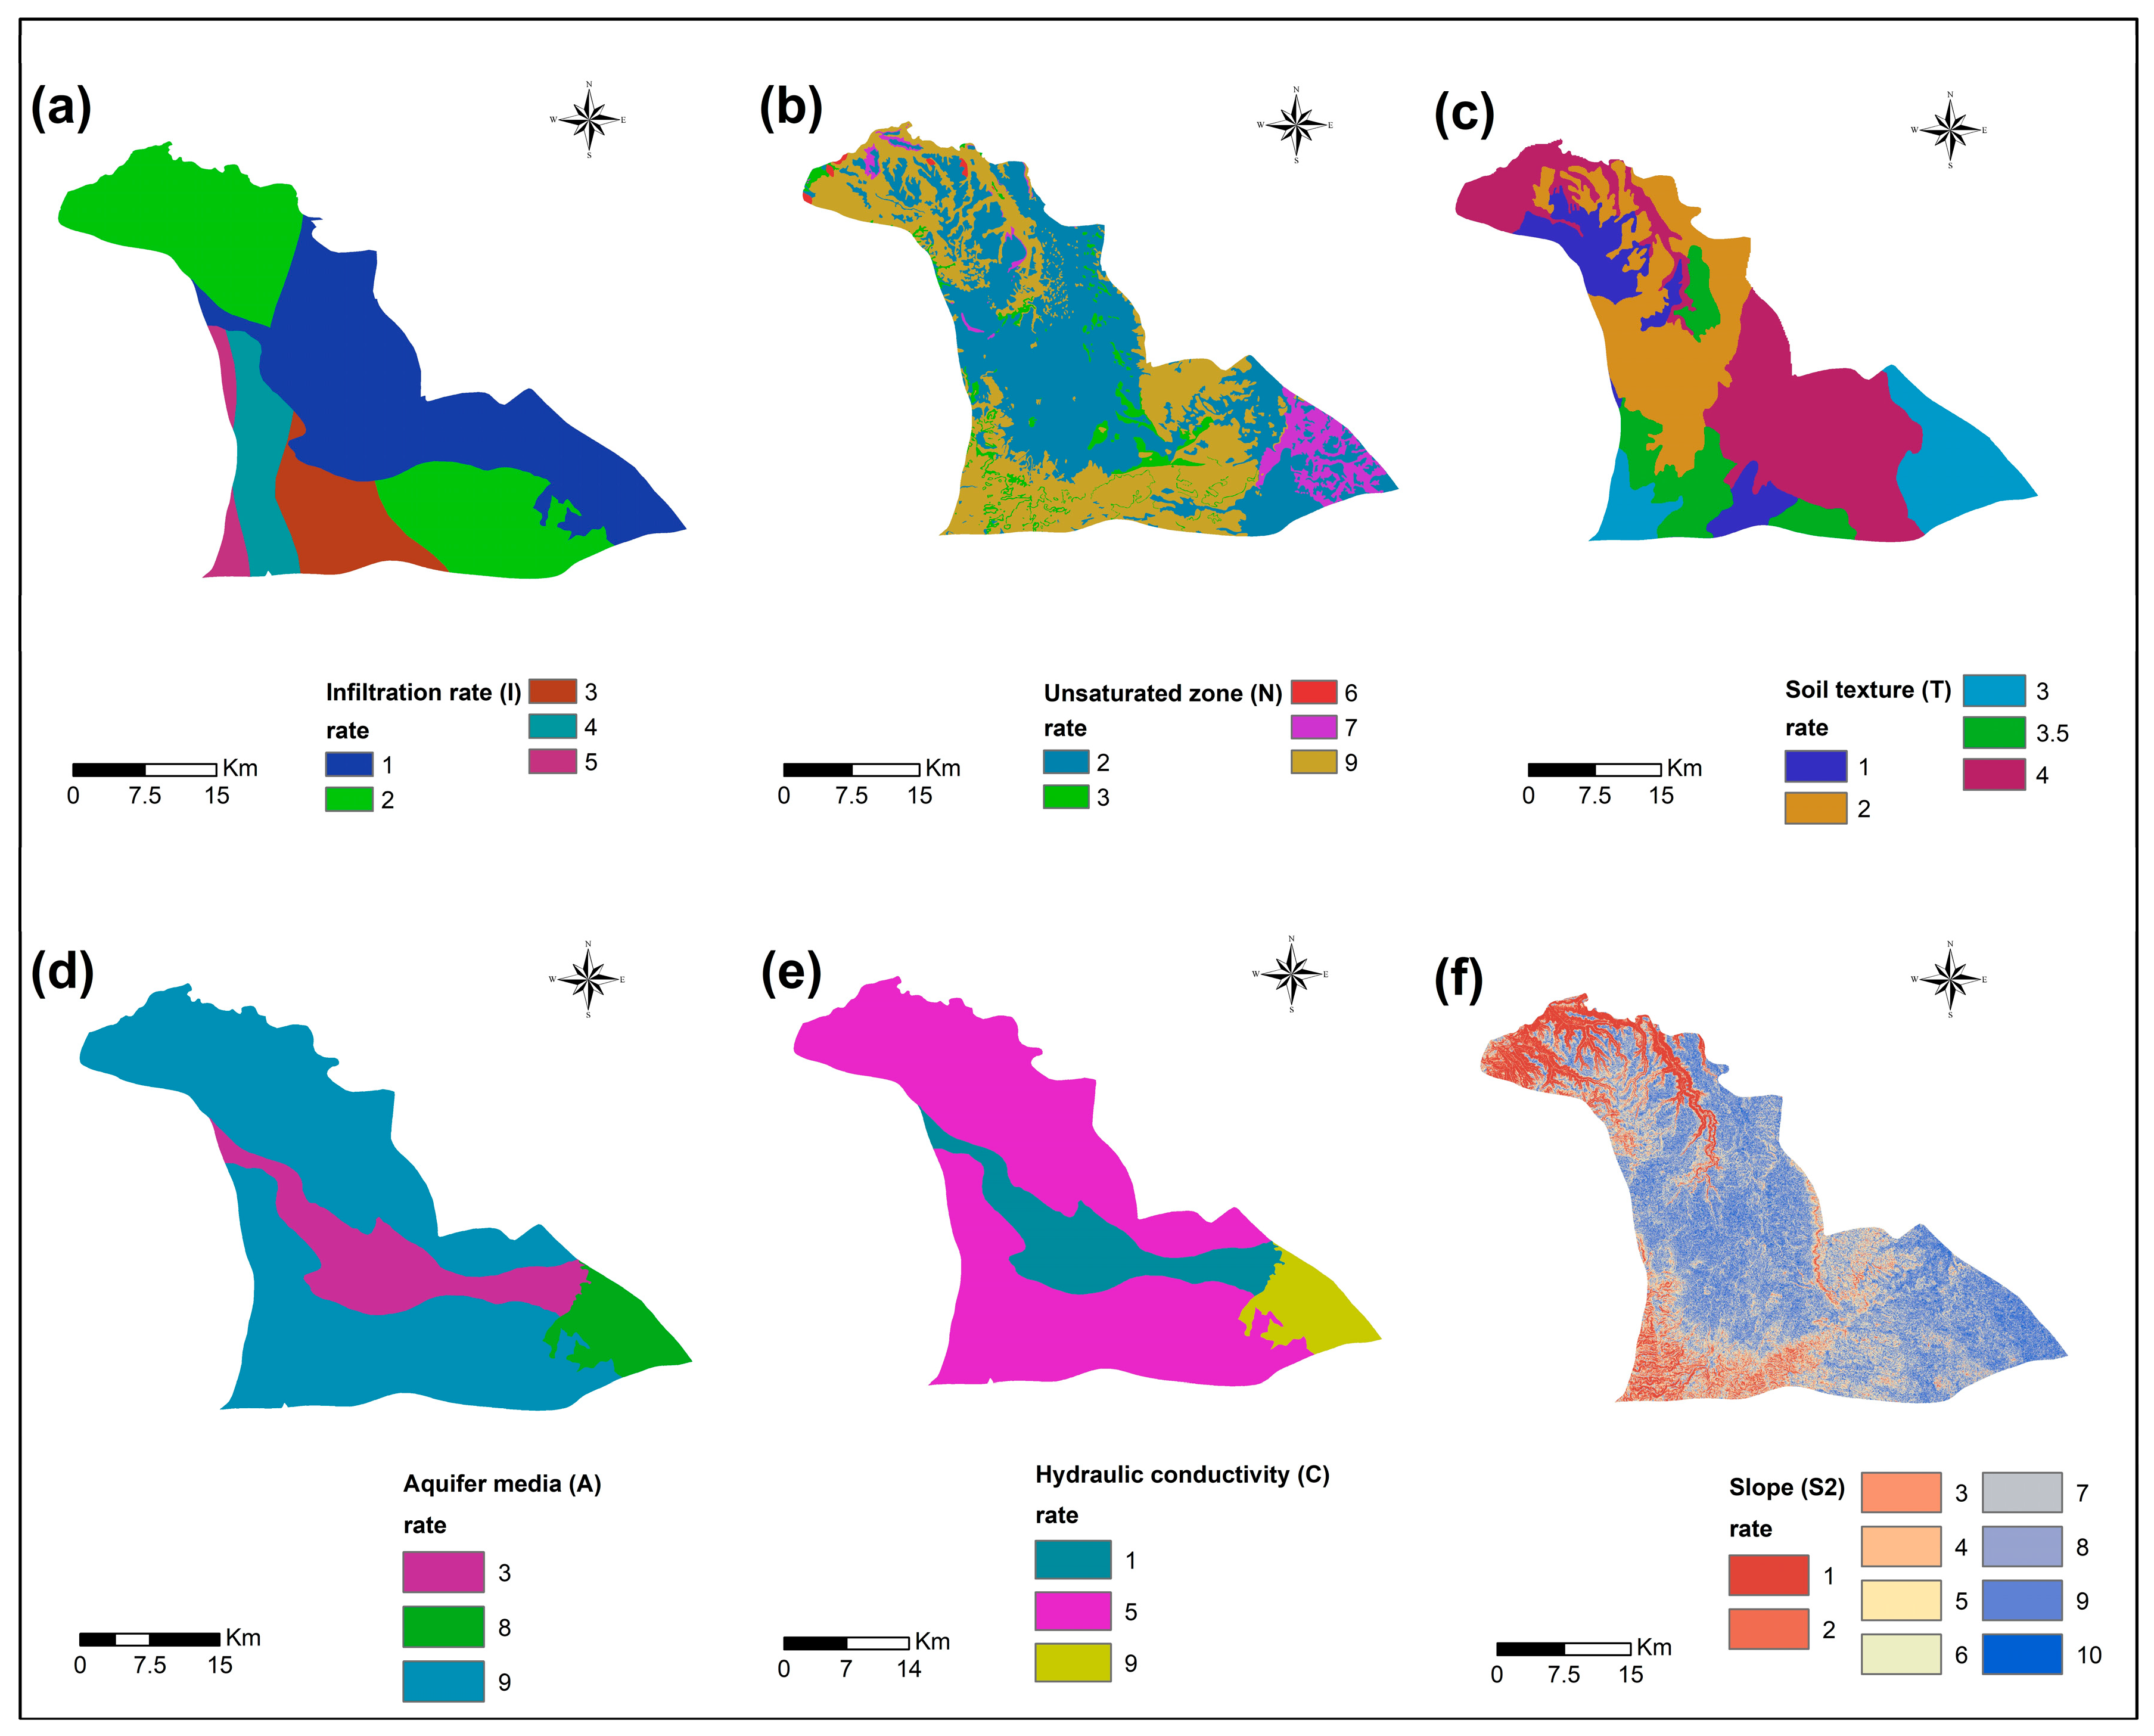
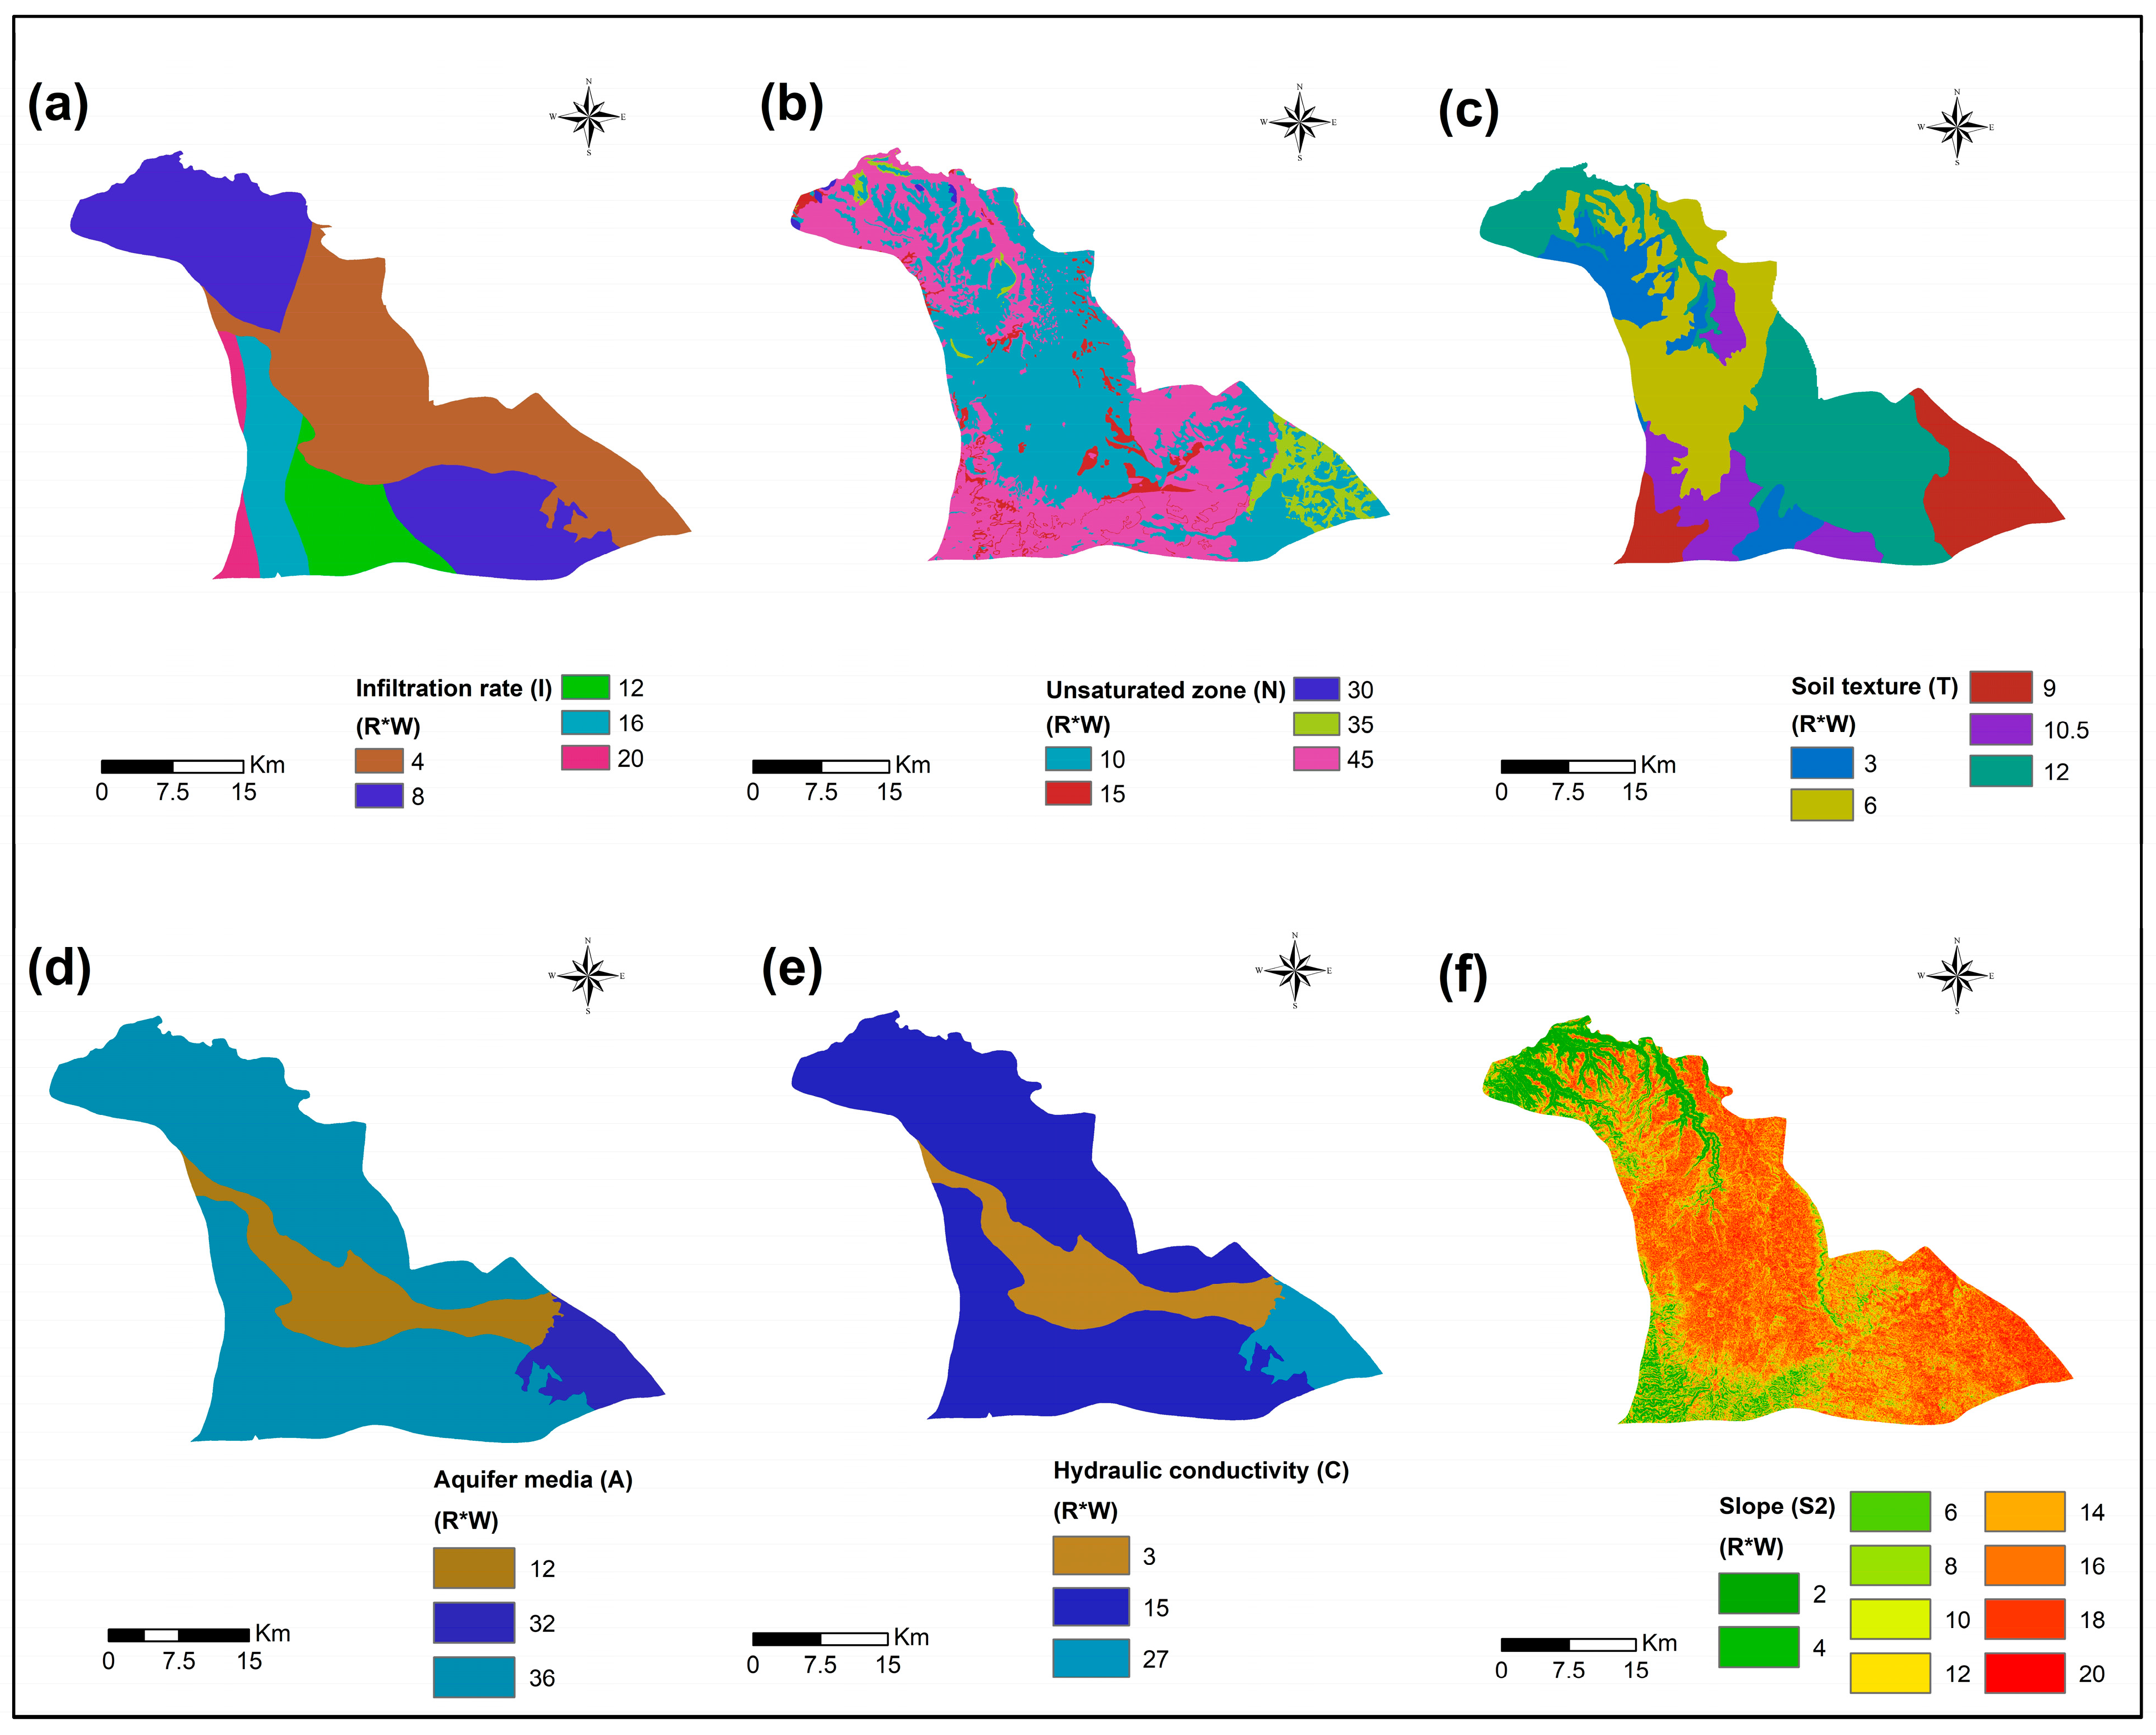
- Infiltration Rate (Infiltrazione) (I): The infiltration rate plays a crucial role in groundwater vulnerability assessment tools. It controls the amount of water that penetrates the ground surface and reaches the aquifer. Specifically, it governs the vertical transport of contaminants through the unsaturated zone toward the aquifer. According to Piscopo [72], it also determines the volume of water available for dispersing and diluting contaminants in the vadose and saturated zones. The infiltration rate was calculated based on the assumed recharge percentage for each aquifer in the basin, following procedures outlined by Hobler et al. [50]. The recharge percentages were assumed to be 20% for the A7/B2 aquifer, 6% for the Basalt and B4/B5 aquifers, and 0% for the B3 aquitard, relative to the total rainfall. An intersection between the aquifers map and the rainfall map was applied, and the infiltration rate was calculated accordingly (Figure 4b); the rates were as listed in Table 2 (Figure 5a).
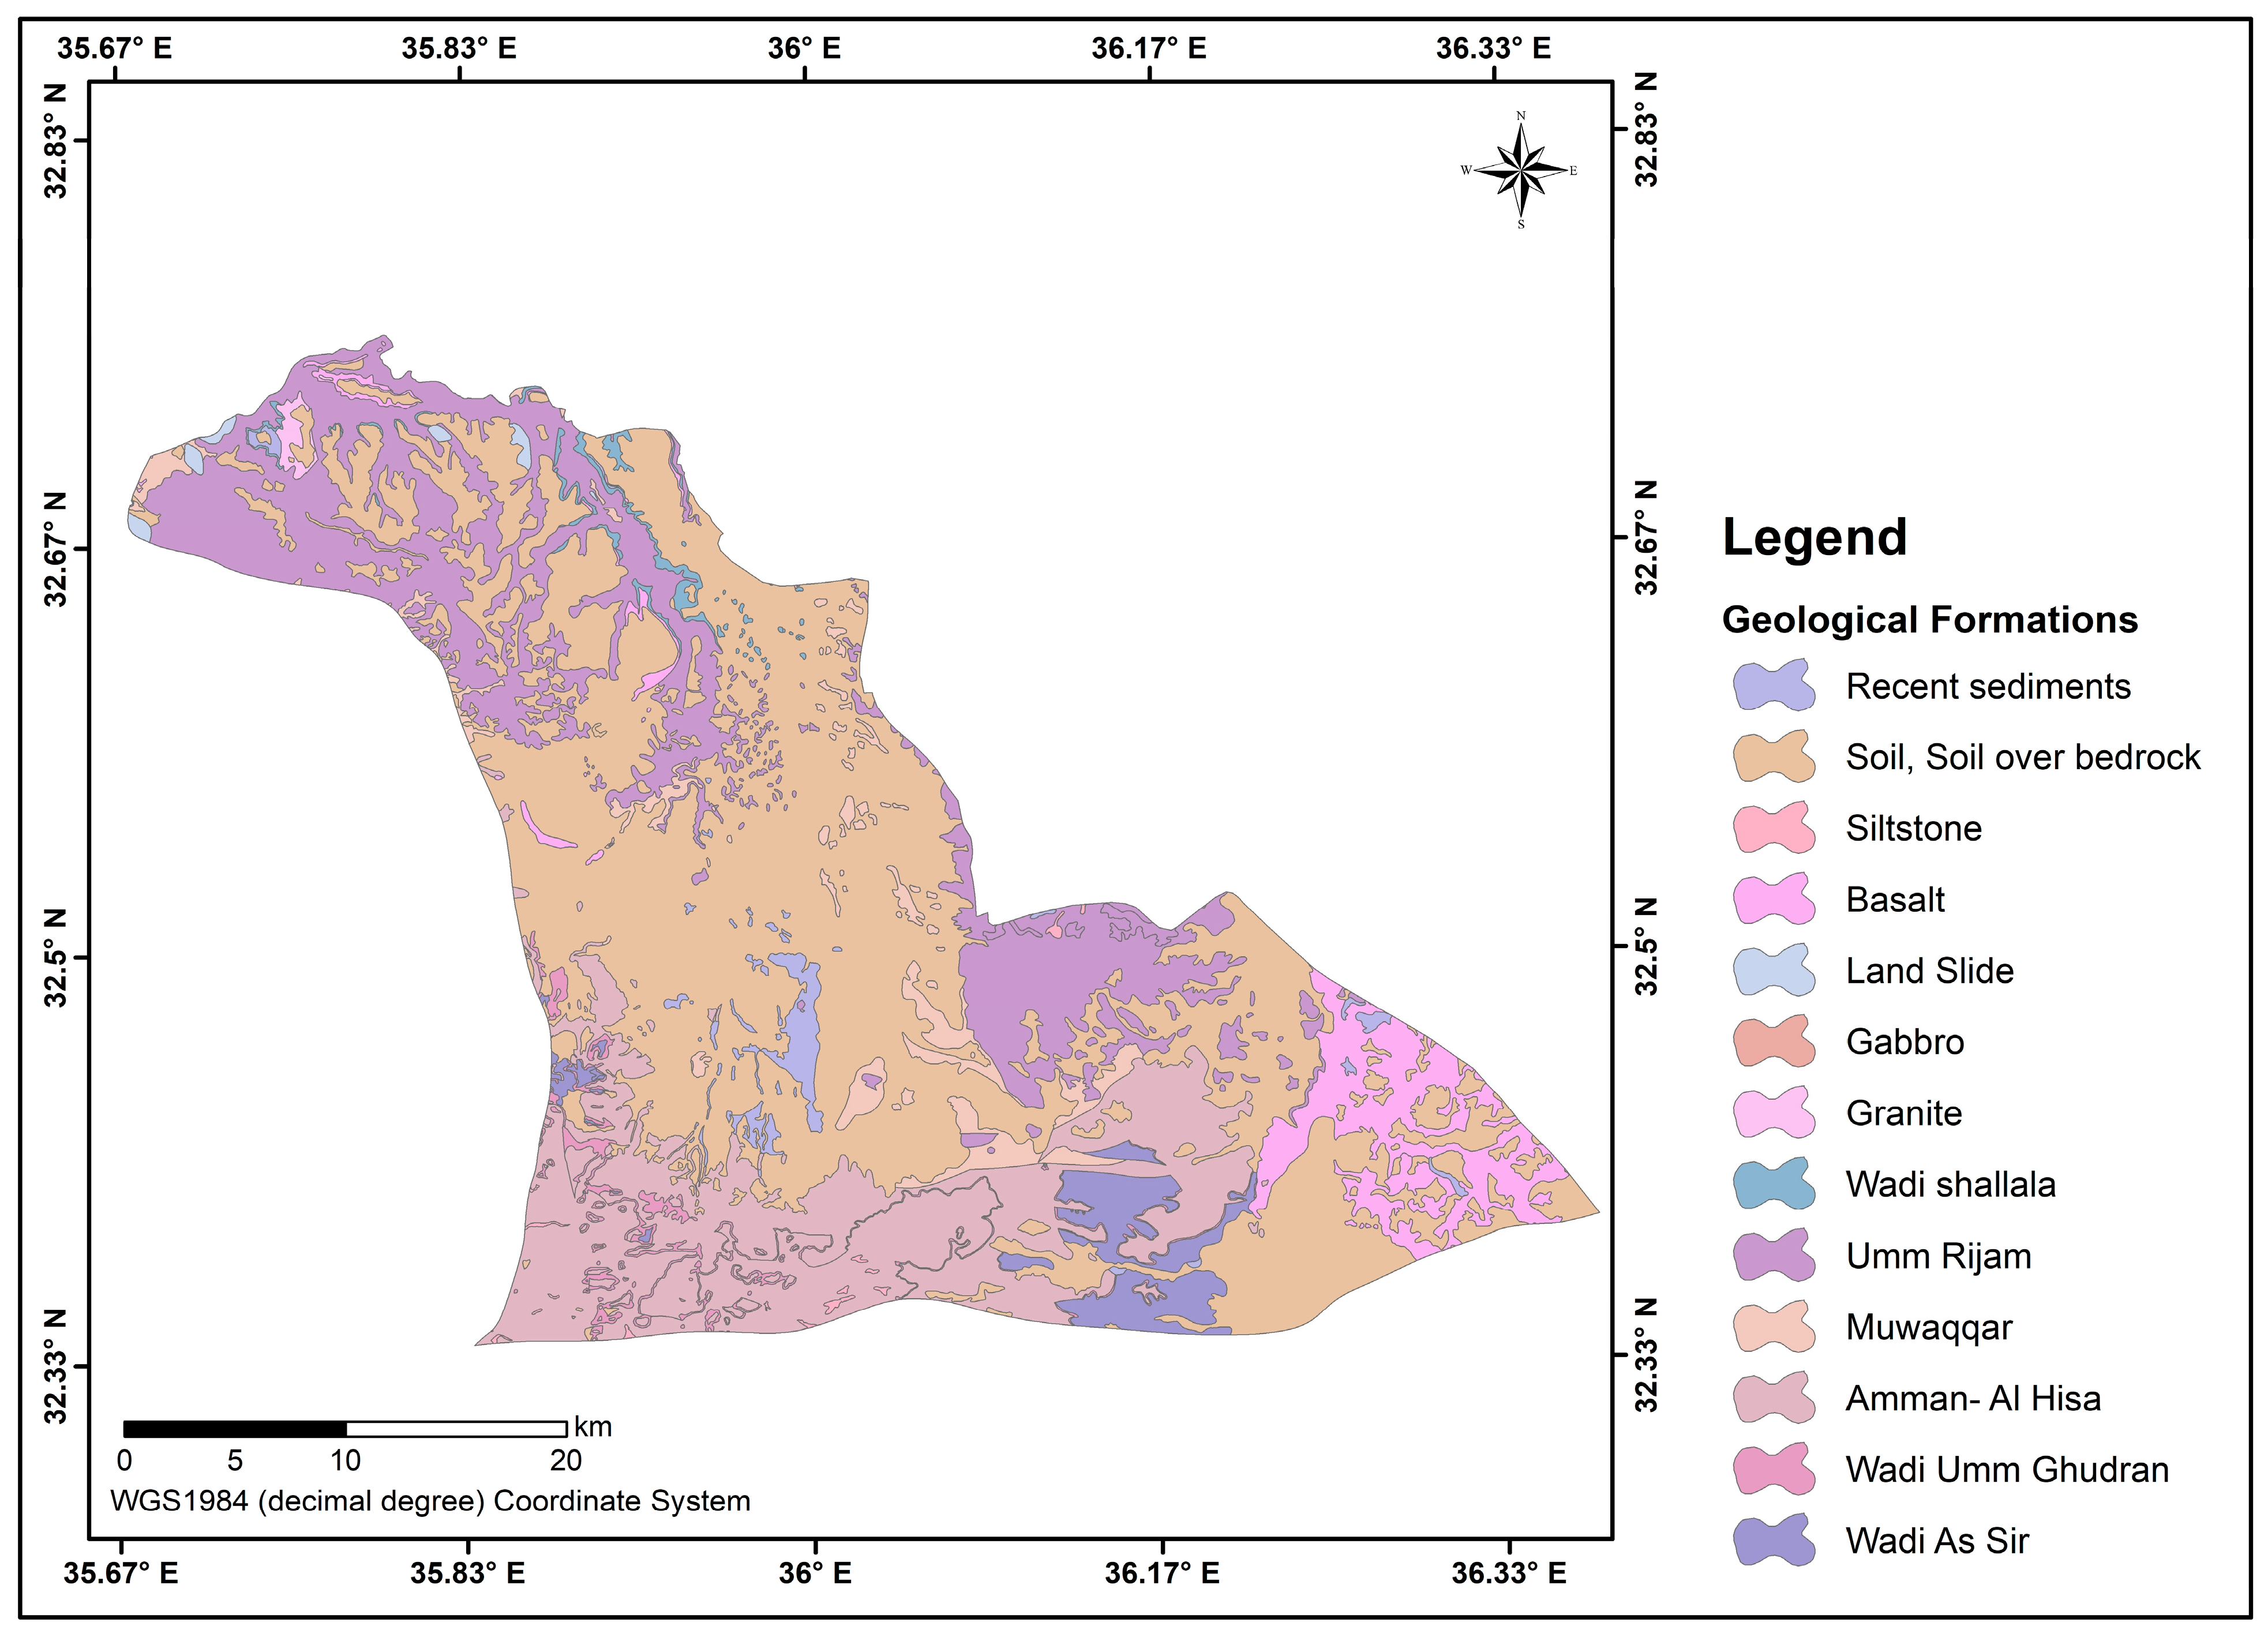
- Unsaturated Zone (Non Saturo) (N): The unsaturated zone reflects the system’s natural attenuation and purification capacity against pollutants reflected by the physico–chemical interactions between the pollutants and the rocks within this zone [32,52,73]. The lithological characteristics of the outcropping geological formations in the YRB were examined, using the geological maps (scale 1:50,000), to evaluate the effect of the unsaturated zone (Figure 4c). The geological formations (Figure 5b) are listed in Table 2.
- Soil Media (Tipologia Copertura) (T): Soil texture describes and controls the runoff potential, infiltration capabilities, and permeability rates of the area [74,75]. According to Tsegay et al. [70], soil texture influences the potential dispersion and purification of contaminants and reduces pollutants’ ability to move vertically into the vadose zone. Within the YRB, five soil texture types are present: clay, clay loam, silty clay, silty clay loam, and silty loam (Figure 4d). The rates are specified in Table 2 (Figure 5c).
- Aquifer Media (Acquifero) (A): Aquifer characteristics describe the process that happens in the phreatic zone, when a contaminant infiltrates the soil and the unsaturated zone and mixes and interacts with groundwater [54]. These processes include dispersion, sorption, dilution, and chemical reactions between the rock and the contaminants [76]. Within the YRB, three aquifers are present: A7/B2, B4/B5, and the Basalt Aquifers (Figure 4e). The assigned rates are listed in Table 2 (Figure 5d).
- Hydraulic Conductivity (Conducibilità Idraulica) (C): Hydraulic conductivity represents the fluid movement and speed through the interconnected voids, bedding planes, and fractures within the aquifer [10,55,77]. It regulates the contamination level within the aquifer; with increasing aquifer hydraulic conductivity, the rate at which contaminants are transferred within the aquifer increases. According to Hobler et al. [50], the hydraulic conductivity within the study area was 1.73 m/d for the A7/B2 aquifer, 8.6 × 10⁻⁵ m/d for the B3 aquitard, 4.3 m/d for the B4/B5 aquifer, and 34.56 m/d for the Basalt aquifer (Figure 4f and Figure 5d).
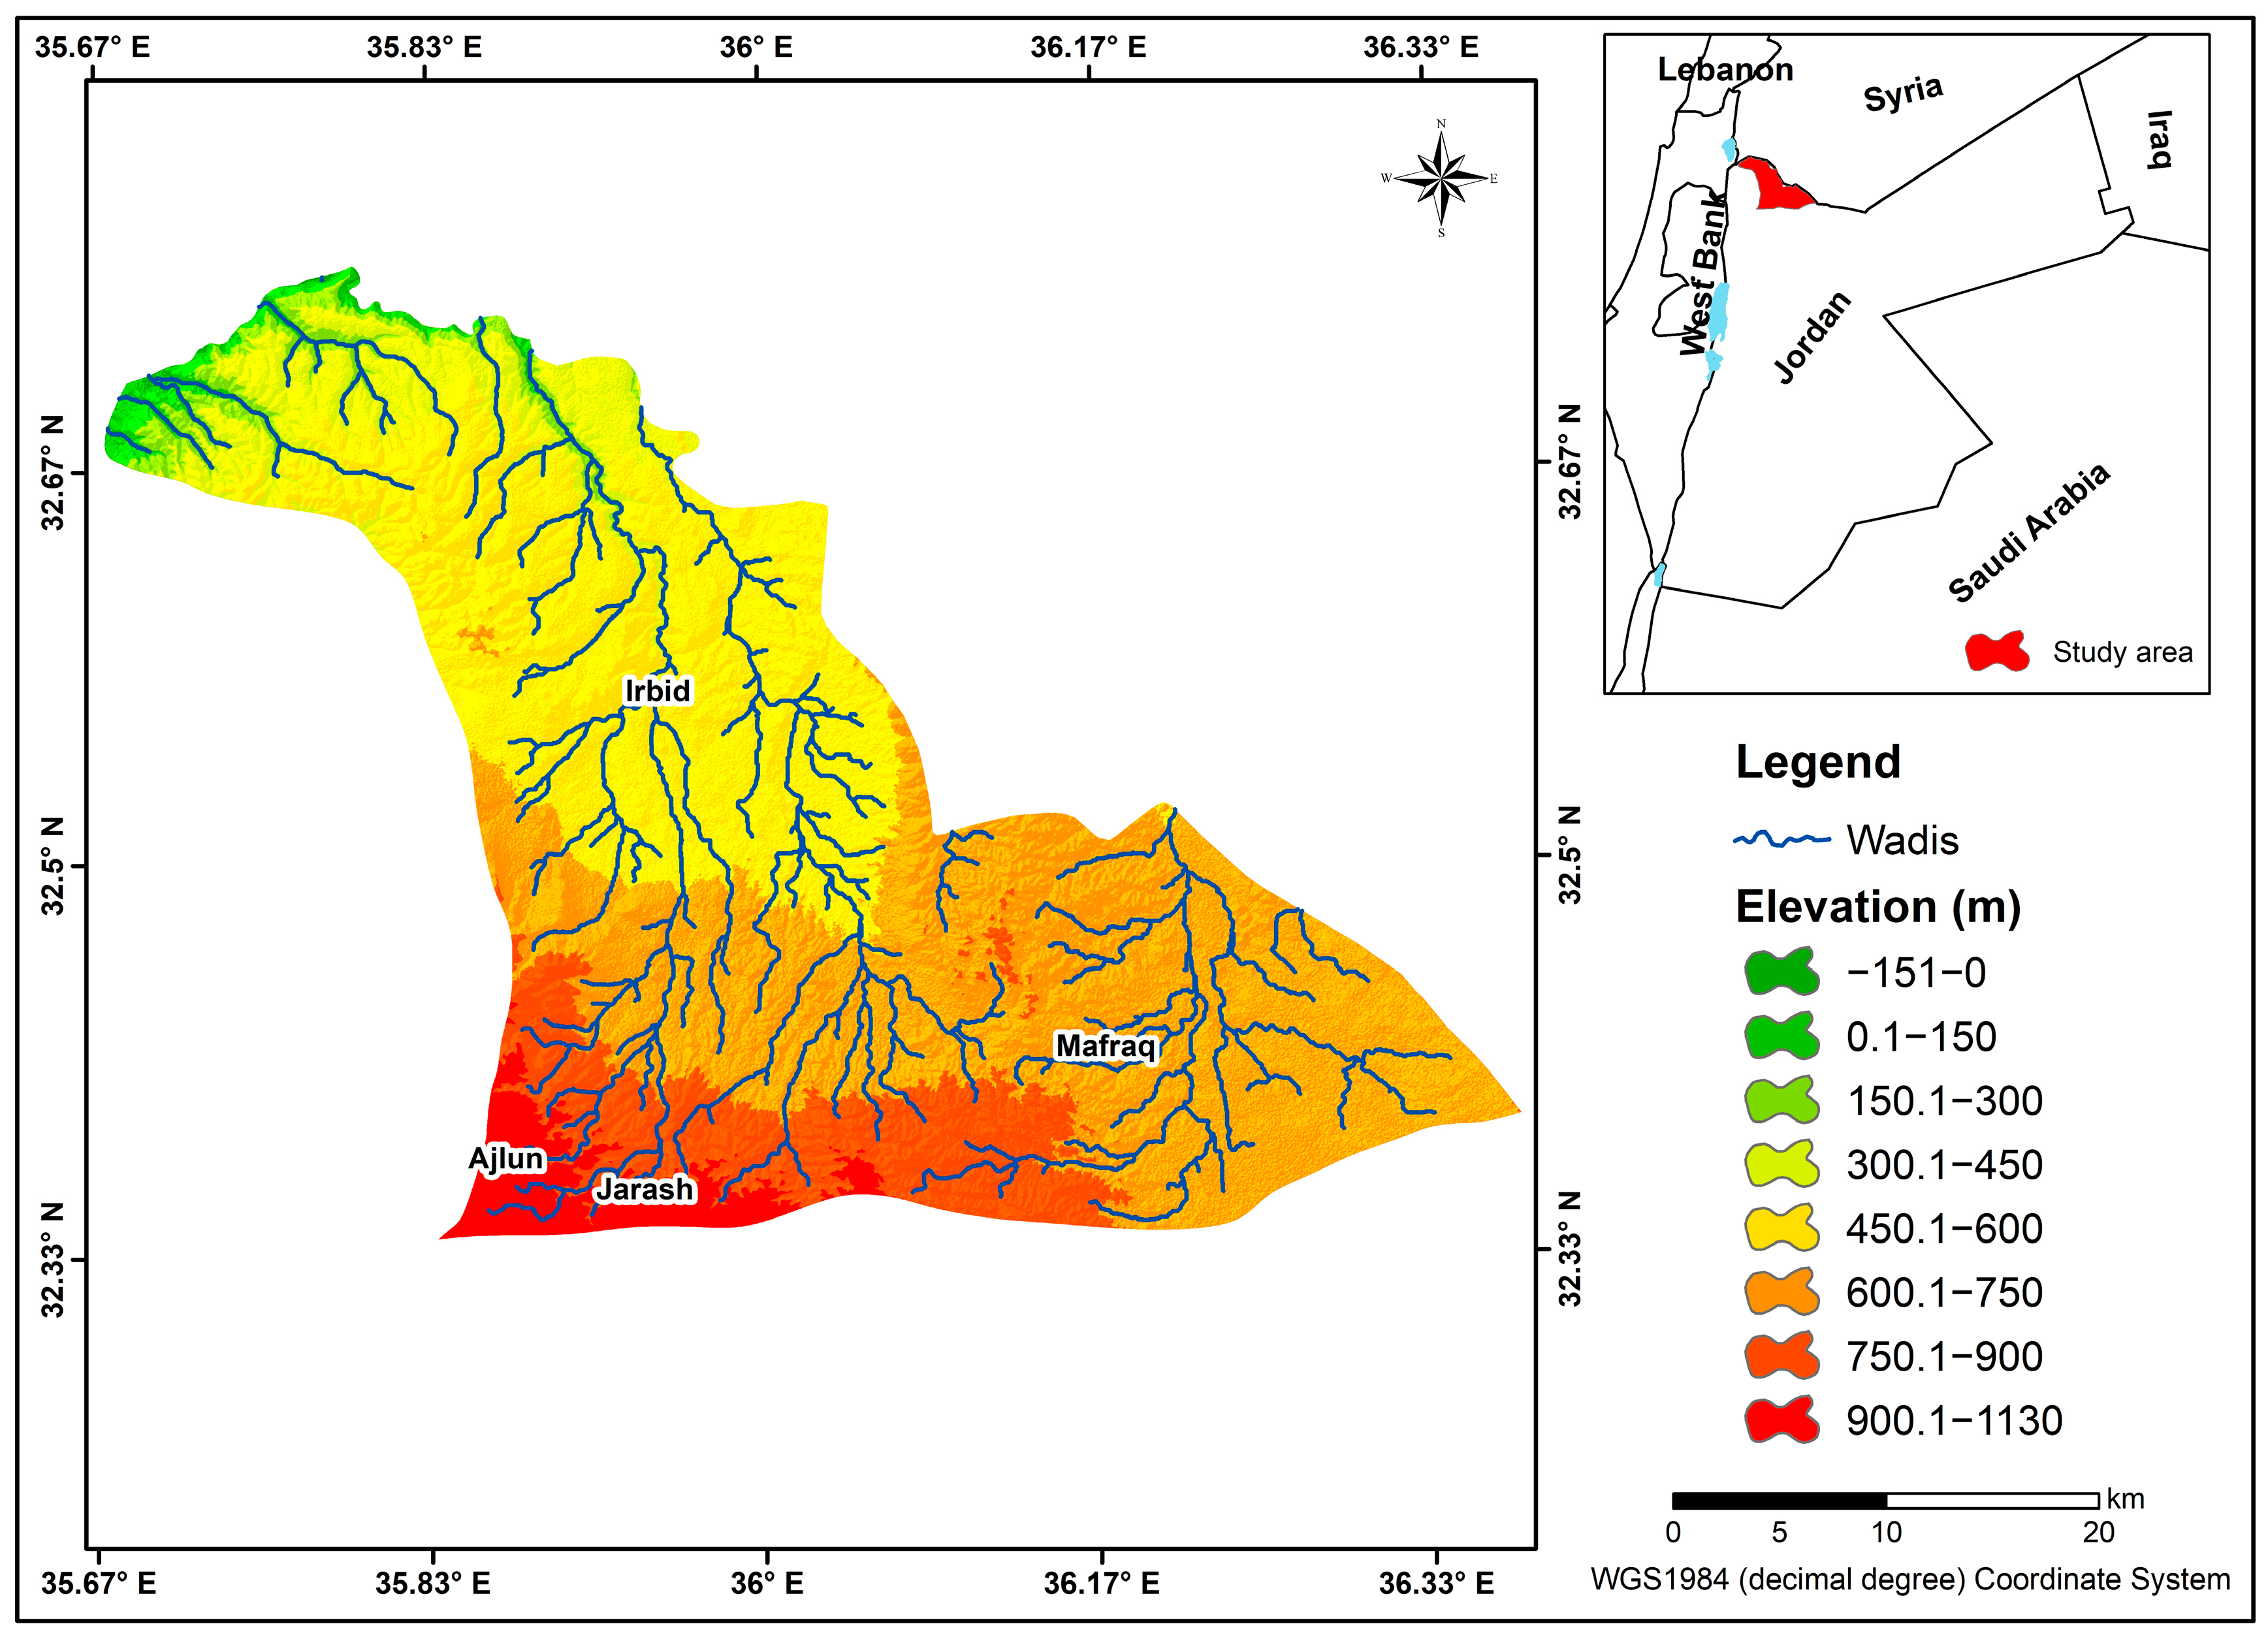
- Topographic Slope (Superficie Topografica) (S2): Slope parameter affects the groundwater vulnerability map indirectly compared to other geological and hydrogeological parameters, through its control over both water and pollutant infiltration rates. Areas with low slopes tend to retain water and pollutants for a longer time, allowing for a greater infiltration of water and pollutants. The digital elevation model (12.5 m resolution [40]) was used to generate the slope map of the study area (Figure 4g and Figure 5f). The resulting slope map was classified according to the slope classes presented in Table 2.
4.2. SINTACS Vulnerability Map
Spatial Distribution of Vulnerability
4.3. Random Forest Machine Learning Map
4.4. Comparison Between the SINTACS Map and the RF Machine Learning Model Map
4.5. Model Validation
4.6. Anthropogenic Pressures and Vulnerability
4.7. Limitations and a Proposal for Future Work
5. Conclusions
Author Contributions
Funding
Data Availability Statement
Conflicts of Interest
References
- Alqadi, M.; Al Dwairi, A.; Merchán-Rivera, P.; Chiogna, G. Presentation of DeMa (Decision Support Software and Database for Wellfield Management) and Its Application for the Wadi Al Arab Wellfield. Water 2023, 15, 331. [Google Scholar] [CrossRef]
- Polemio, M.; Voudouris, K. Groundwater resources management: Reconciling demand, high quality resources and sustainability. Water 2022, 14, 2107. [Google Scholar] [CrossRef]
- UN-Water; UNESCO. The United Nations World Water Development Report 2022—Making the Invisible Visible; UN: Paris, France, 2022. [Google Scholar]
- Almomani, T.; Al Shraydeh, S.; Shakhatreh, H.; Alroud, R.; Ali, B.; Obayat, A.; Atyeh, A.; Mohammad, A.; Alta’ani, A.; Sa’aydeh, H.; et al. Water Year Book 2016/2017; Ministry of Water and Irrigation: Amman, Jordan, 2018; Available online: https://www.deutsche-rohstoffagentur.de/EN/Themen/Wasser/Projekte/abgeschlossen/TZ/Jordanien/Was_tz_gwrm_fig1_g_en.html (accessed on 17 July 2025).
- MWI (Ministry of Water and Irrigation). National Water Strategy 2023–2040; Ministry of Water and Irrigation: Amman, Jordan, 2023. Available online: https://www.mwi.gov.jo/EBV4.0/Root_Storage/AR/EB_List_Page/national_water_strategy_2023-2040.pdf (accessed on 17 July 2025).
- Ananbeh, F. DOS 2024, Jordan Department of Statistics. Available online: https://dosweb.dos.gov.jo/ar/news_07_2024/ (accessed on 17 July 2025).
- Aljaradin, M.; Bashitialshaaer, R.; Alitawi, H.; Amaireh, M. Water quality, availability and potential of geothermal energy utilization, Afra Water, Jordan. Sustain. Resour. Manag. J. 2017, 1, 17–25. [Google Scholar]
- Margane, A.; Alqadi, M.; Alkurdi, O. Updating the Groundwater Contour Map of the A7/B2 Aquifer in North Jordan; Ministry of Water and Irrigation (MWI): Amman, Jordan, 2015; Available online: https://www.deutsche-rohstoffagentur.de/EN/Themen/Wasser/Projekte/abgeschlossen/TZ/Jordanien/syr_report.pdf?__blob=publicationFile&v=2 (accessed on 17 July 2025).
- Brückner, F.; Bahls, R.; Alqadi, M.; Lindenmaier, F.; Hamdan, I.; Alhiyari, M.; Atieh, A. Causes and consequences of long-term groundwater overabstraction in Jordan. Hydrogeol. J. 2021, 29, 2789–2802. [Google Scholar] [CrossRef]
- Hamdan, I.; Al-Rawabdeh, A.; Al Hseinat, M. Groundwater Vulnerability Assessment for the Corridor Wellfield Using DRASTIC and Modified DRASTIC Models: A Case Study of Eastern Jordan. Open J. Geol. 2020, 10, 991–1008. [Google Scholar] [CrossRef]
- Al Naber, M.; Molle, F. Controlling groundwater over abstraction: State policies vs local practices in the Jordan highlands. Water Policy 2017, 19, 692–708. [Google Scholar] [CrossRef]
- Muneer, M.; Khan, M.A.; Shinwari, F.U.; Ahmed, I.; Siyar, S.M.; Alshehri, F.; Shahab, M. Assessment of groundwater intrinsic vulnerability using GIS-based DRASTIC method in district Karak, Khyber Pakhtunkhwa, Pakistan. Front. Water 2025, 7, 1540703. [Google Scholar] [CrossRef]
- Pronk, M.; Goldscheider, N.; Zopfi, J.; Zwahlen, F. Percolation and particle transport in the unsaturated zone of a karst aquifer. Groundwater 2009, 47, 361–369. [Google Scholar] [CrossRef]
- Poulain, A.; Watlet, A.; Kaufmann, O.; Van Camp, M.; Jourde, H.; Mazzilli, N.; Rochez, G.; Deleu, R.; Quinif, Y.; Hallet, V. Assessment of groundwater recharge processes through karst vadose zone by cave percolation monitoring. Hydrol. Process. 2018, 32, 2069–2083. [Google Scholar] [CrossRef]
- Lakshminarayanan, B.; Ramasamy, S.; Anuthaman, S.N.; Karuppanan, S. New DRASTIC framework for groundwater vulnerability assessment: Bivariate and multi-criteria decision-making approach coupled with metaheuristic algorithm. Environ. Sci. Pollut. Res. 2022, 29, 4474–4496. [Google Scholar] [CrossRef]
- Margat, J. Vulnerabilite des Nappes d’eau Souterraine a la Pollution; BRGM-Publication: Orleans, France, 1968. [Google Scholar]
- Aller, L.; Bennett, T.; Lehr, J.; Petty, R.; Hackett, G. DRASTIC: A Standardized System for Evaluating GroundWater Pollution Potential Using Hydrogeologic Setting; EPA/600/2-87/035; EPA (Environmental Protection Agency): Washington, DC, USA, 1987. [Google Scholar]
- Hoelting, B.; Haertlé, T.; Hohberger, K.-H.; Nachtigall, K.H.; Villinger, E.; Weinzierl, W. Wrobel; J.-P. Konzept zur Ermittlung der Schutzfunktion der Grundwasserüberdeckung. Geol. Jahrb. Reihe C 1995 Band C 1995, 63, 5–24. [Google Scholar]
- Civita, M.; De Maio, M. SINTACS: Un Systema Parametrico per la Valutazione e la Cartografia Della Vulnerabilità Degli Acquiferi All’inquinamento (Methodologia e Automatizzazione); Pitagora Editrice: Bologna, Italy, 1997. [Google Scholar]
- Vias, J.M.; Andreo, B.; Perles, M.J.; Carrasco, F.; Vadillo, I.; Jime’nez, P. Preliminary proposal of a method for vulnerability mapping in carbonate aquifers. In Karst and Environment; Carrasco, F., Durán, J.J., Andreo, B., Eds.; Patronato de la Cueva de Nerja: Nerja, Spain, 2002; pp. 75–83. [Google Scholar]
- Vias, J.M.; Andreo, B.; Perles, M.; Carrasco, F.; Vadillo, I.; Jime’nez, P. Proposed method for groundwater vulnerability mapping in carbonate (karstic) aquifers: The COP method-application in two pilot sites in southern Spain. Hydrogeol. J. 2006, 14, 912–925. [Google Scholar] [CrossRef]
- Goldscheider, N.; Klute, M.; Sturm, S.; Hotzl, H. The PI Method—A GIS-Based Approach to Mapping Groundwater Vulnerability with Special Consideration of Karst Aquifers. Z. Für Angew. Geol. 2000, 46, 157–166. [Google Scholar]
- Jeannin, P.Y.; Cornaton, F.; Zwahlen, F.; Perrochet, P. VULK: A tool for intrinsic vulnerability assessment and validation. In Proceedings of the 7th Conference on Limestone Hydrology and Fissured Media, Besancon, France, 20–22 September 2001; Volume 13, pp. 185–188. [Google Scholar]
- Mimi, Z.; Mahmoud, N.; Madi, M. Modified DRASTIC Assessment for Intrinsic Vulnerability Mapping of Karst Aquifers: A Case Study. Environ. Earth Sci. 2011, 66, 447–456. [Google Scholar] [CrossRef]
- Banerjee, A.; Creedon, L.; Jones, N.; Gill, L.; Gharbia, S. Dynamic groundwater contamination vulnerability assessment techniques: A systematic review. Hydrology 2023, 10, 182. [Google Scholar] [CrossRef]
- Goldscheider, N. The Concept of Groundwater Vulnerability. In COST Action 620—Vulnerability and Risk Mapping for the Protection of Carbonate (Karst) Aquifers, Final Report; Zwahlen, F., Ed.; European Commission: Brussels, Belgium, 2003; pp. 5–9. [Google Scholar]
- Wachniew, P.; Zurek, A.J.; Stumpp, C.; Gemitzi, A.; Gargini, A.; Filippini, M.; Rozanski, K.; Meeks, J.; Kværner, J.; Witczak, S. Toward operational methods for the assessment of intrinsic groundwater vulnerability: A review. Crit. Rev. Environ. Sci. Technol. 2016, 46, 827–884. [Google Scholar] [CrossRef]
- Fannakh, A.; Farsang, A. DRASTIC, GOD, and SI approaches for assessing groundwater vulnerability to pollution: A review. Environ. Sci. Eur. 2022, 34, 77. [Google Scholar] [CrossRef]
- Bordbar, M.; Rezaie, F.; Bateni, S.M.; Jun, C.; Kim, D.; Busico, G.; Moghaddam, H.K.; Paryani, S.; Panahi, M.; Valipour, M. Global review of modification, optimization, and improvement models for aquifer vulnerability assessment in the era of climate change. Curr. Clim. Change Rep. 2023, 9, 45–67. [Google Scholar] [CrossRef]
- Yu, H.; Wu, Q.; Zeng, Y.; Zheng, L.; Xu, L.; Liu, S.; Wang, D. Integrated variable weight model and improved DRASTIC model for groundwater vulnerability assessment in a shallow porous aquifer. J. Hydrol. 2022, 608, 127538. [Google Scholar] [CrossRef]
- Khazaa’lah, M.; Talozi, S.; Hamdan, I. Assessment of groundwater vulnerability using GIS-based COP model in the northern governorates of Jordan. Model. Earth Syst. Environ. 2023, 9, 19–40. [Google Scholar] [CrossRef]
- Awawdeh, M.M.; Jaradat, R.A. Evaluation of aquifers vulnerability to contamination in the Yarmouk River basin, Jordan, based on DRASTIC method. Arab. J. Geosci. 2010, 3, 273–282. [Google Scholar] [CrossRef]
- Rahmati, O.; Pourghasemi, H.R.; Melesse, A.M. Application of GIS-based data driven random forest and maximum entropy models for groundwater potential mapping: A case study at Mehran Region, Iran. Catena 2016, 137, 360–372. [Google Scholar] [CrossRef]
- Naghibi, S.A.; Ahmadi, K.; Daneshi, A. Application of Support Vector Machine, Random Forest, and Genetic Algorithm Optimized Random Forest Models in Groundwater Potential Mapping. Water Resour. Manag. 2017, 31, 2761–2775. [Google Scholar] [CrossRef]
- Baalousha, H.M. Machine Learning Approaches for Groundwater Vulnerability Assessment in Arid Environments: Enhancing DRASTIC with ANN and Random Forest. Groundw. Sustain. Dev. 2025, 28, 101290. [Google Scholar] [CrossRef]
- Sajedi-Hosseini, F.; Malekian, A.; Choubin, B.; Rahmati, O.; Cipullo, S.; Coulon, F.; Pradhan, B. A novel machine learning-based approach for the risk assessment of nitrate groundwater contamination. Sci. Total Environ. 2018, 644, 954–962. [Google Scholar] [CrossRef]
- Breiman, L. Random forests. Mach. Learn. 2001, 45, 5–32. [Google Scholar] [CrossRef]
- Civita, M. Groundwater Vulnerability Maps: A Review. In Proceedings of the IX Symposium on Pesticide Chemistry, Mobility and Degradation of Xenobiotics, Piacenza, Italy, 11–13 October 1993; Edizioni G. Biagini: Lucca, Italia; pp. 587–631. [Google Scholar]
- Al-Bakri, J.T.; Shawash, S.; Ghanim, A.; Abdelkhaleq, R. Geospatial techniques for improved water management in Jordan. Water 2016, 8, 132. [Google Scholar] [CrossRef]
- ASF. ALOS PALSAR—Digital Elevation Model (12.5 m Spatial Resolution). 2024. Available online: https://asf.alaska.edu/data-sets/derived-data-sets/alos-palsar-rtc/alos-palsar-radiometric-terrain-correction (accessed on 15 May 2025).
- MWI-BGR (Ministry of Water and Irrigation; Bundesanstalt für Geowissenschaften und Rohstoffe). Groundwater Resource Assessment of Jordan 2017. 2019. Available online: https://www.bgr.bund.de/EN/Themen/Grundwasser/Downloads/gw_resource_assessment_jordan_pdf.pdf?__blob=publicationFile&v=2 (accessed on 15 May 2025).
- Abu-Zreig, M.; Hani, L. Assessment of the SWAT model in simulating watersheds in arid regions: Case study of the Yarmouk River Basin (Jordan). Open Geosci. 2021, 13, 377–389. [Google Scholar] [CrossRef]
- Goode, D.J.; Senior, L.A.; Subah, A.; Jaber, A. Groundwater-Level Trends and Forecasts, and Salinity Trends, in the Azraq, Dead Sea, Hammad, Jordan Side Valleys, Yarmouk, and Zarqa Groundwater Basins, Jordan (No. 2013-1061); US Geological Survey: Reston, VA, USA, 2013. [Google Scholar]
- Abdelhamid, G. Geological Map of Jarash [Map]; Jordan Ministry of Energy and Mineral Resources—Natural Resources Authority (Geology Directorate): Amman, Jordan, 1993; National Mapping Project, Sheet No. (3154-I). [Google Scholar]
- Smadi, A. Geological Map of Al Mafraq [Map]; Jordan Ministry of Energy and Mineral Resources—Natural Resources Authority (Geology Directorate): Amman, Jordan, 1997; National Mapping Project, Sheet No. (3254-IV). [Google Scholar]
- Moh’d, B. Geological Map of Irbid [Map]; Jordan Ministry of Energy and Mineral Resources—Natural Resources Authority (Geology Directorate): Amman, Jordan, 1997; National Mapping Project, sheet No. (3155-II). [Google Scholar]
- Gharaibeh, A. Geological Map of Ar Ramtha [Map]; Jordan Ministry of Energy and Mineral Resources—Natural Resources Authority (Geology Directorate): Amman, Jordan, 2003; National Mapping Project, Sheet No. (3254-I). [Google Scholar]
- Moh’d, B. Geological Map of Ash Shuna Ash Shamaliyya [Map]; Jordan Ministry of Energy and Mineral Resources—Natural Resources Authority (Geology Directorate): Amman, Jordan, 2000; National Mapping Project, Sheet No. (3155-III). [Google Scholar]
- Soboh, A. Geological Map of Ar Ramtha [Map]; Jordan Ministry of Energy and Mineral Resources—Natural Resources Authority (Geology Directorate): Amman, Jordan, 2013; National Mapping Project, Sheet No. (3255-II). [Google Scholar]
- Hobler, M.; Margane, A.; Almomani, M.; Subah, A. Groundwater Resources of Northern Jordan; Vol. 4 Contributions to the hydrogeology of northern Jordan; Federal Institute for Geosciences and Natural Resources (BGR) and Ministry of Water and Irrigation (MWI): Amman, Jordan, 2001; Available online: https://www.deutsche-rohstoffagentur.de/EN/Themen/Wasser/Projekte/abgeschlossen/TZ/Jordanien/gw_res_management_fb_en.html?nn=1546392 (accessed on 15 May 2025).
- BRGM. Jordan Aquifers Modelling Project 3D Geological Model—Intermediary Report No 1; Unpublished Report; BRGM: Amman, Jordan, 2010. [Google Scholar]
- Hamdan, I.; Margane, A.; Ptak, T.; Wiegand, B.; Sauter, M. Groundwater vulnerability assessment for the karst aquifer of Tanour and Rasoun springs catchment area (NW-Jordan) using COP and EPIK intrinsic methods. Environ. Earth Sci. 2016, 75, 1474. [Google Scholar] [CrossRef]
- MoA (Ministry of Agriculture). National Soil Map and Land Use Project. The Soil of Jordan, Level 2: Semi Detailed Studies 1994. Volume 2: Main Report, Hunting Technical Services in Association with Soil Survey and Land Research Centre, Jordan; Unpublished Report; MoA (Ministry of Agriculture): Amman, Jordan, 1994. [Google Scholar]
- Majandang, J.; Sarapirome, S. Groundwater vulnerability assessment and sensitivity analysis in Nong Rua, Khon Kaen, Thailand, using a GIS-based SINTACS model. Env. Earth Sci. 2013, 68, 2025–2039. [Google Scholar] [CrossRef]
- Sahu, I.; Prasad, A.; Ahmad, I. Groundwater vulnerability assessment using SINTACS model and GIS: A case study in Raipur city. In IOP Conference Series: Earth and Environmental Science; IOP Publishing: Bristol, UK, 2022; Volume 982, p. 012070. [Google Scholar]
- Soyaslan, I.I. Assessment of groundwater vulnerability using SINTACS and modified-SINTACS methods in Burdur Çine Basin (Turkiye). Earth Sci. Res. J. 2025, 29, 201–210. [Google Scholar] [CrossRef]
- Band, S.S.; Janizadeh, S.; Chandra Pal, S.; Saha, A.; Chakrabortty, R.; Melesse, A.M.; Mosavi, A. Flash flood susceptibility modeling using new approaches of hybrid and ensemble tree-based machine learning algorithms. Remote Sens. 2020, 12, 3568. [Google Scholar] [CrossRef]
- Probst, P.; Wright, M.N.; Boulesteix, A.L. Hyperparameters and tuning strategies for random forest. Wiley Interdiscip. Rev. Data Min. Knowl. Discov. 2019, 9, e1301. [Google Scholar] [CrossRef]
- Han, S.; Kim, H.; Lee, Y.S. Double random forest. Mach. Learn. 2020, 109, 1569–1586. [Google Scholar] [CrossRef]
- Xia, H.; Akay, Y.M.; Akay, M. Selecting relevant genes from microarray datasets using a Random Forest Model. IEEE Access 2021, 9, 97813–97821. [Google Scholar] [CrossRef]
- Pantic, I.; Paunovic Pantic, J. Artificial Intelligence in Chromatin Analysis: A Random Forest Model Enhanced by Fractal and Wavelet Features. Fractal Fract. 2024, 8, 490. [Google Scholar] [CrossRef]
- Elkhrachy, I. Flash flood water depth estimation using SAR images, digital elevation models, and machine learning algorithms. Remote Sens. 2022, 14, 440. [Google Scholar] [CrossRef]
- Heman-Ackah, S.M.; Blue, R.; Quimby, A.E.; Abdallah, H.; Sweeney, E.M.; Chauhan, D.; Hwa, T.; Brant, J.; Ruckenstein, M.J.; Bigelow, D.C.; et al. A multi-institutional machine learning algorithm for prognosticating facial nerve injury following microsurgical resection of vestibular schwannoma. Sci. Rep. 2024, 14, 12963. [Google Scholar] [CrossRef]
- Fadhila, R.N.; Ulinnuha, N.; Yuliati, D. Implementation of Random Forest Method with Information Gain Selection and Hyperparameter Tuning for Alzheimer’s Disease Classification. Lontar Komput. J. Ilm. Teknol. Inf. 2025, 16, 1–13. [Google Scholar] [CrossRef]
- Putri, T.A.E.; Widiharih, T.; Santoso, R. Penerapan Tuning Hyperparameter Randomsearchcv Pada Adaptive Boosting Untuk Prediksi Kelangsungan Hidup Pasien Gagal Jantung. J. Gaussian 2023, 11, 397–406. [Google Scholar] [CrossRef]
- Alibrahim, H.; Ludwig, S.A. Hyperparameter optimization: Comparing genetic algorithm against grid search and bayesian optimization. In Proceedings of the 2021 IEEE Congress on Evolutionary Computation (CEC), Kraków, Poland, 28 June–1 July 2021; pp. 1551–1559. [Google Scholar]
- Ravindiran, G.; Rajamanickam, S.; Sivarethinamohan, S.; Karupaiya Sathaiah, B.; Ravindran, G.; Muniasamy, S.K.; Hayder, G.A. Review of the Status, Effects, Prevention, and Remediation of Groundwater Contamination for Sustainable Environment. Water 2023, 15, 3662. [Google Scholar] [CrossRef]
- Nakagawa, K.; Amano, H.; Persson, M.; Berndtsson, R. Spatiotemporal variation of nitrate concentrations in soil and groundwater of an intensely polluted agricultural area. Sci. Rep. 2021, 11, 2598. [Google Scholar] [CrossRef] [PubMed]
- Siarkos, I.; Sevastas, S.; Mallios, Z.; Theodossiou, N.; Ifadis, I. Investigating groundwater vulnerability variation under future abstraction scenarios to estimate optimal pumping reduction rates. J. Hydrol. 2021, 598, 126297. [Google Scholar] [CrossRef]
- Tsegay, T.; Birhanu, B.; Azagegn, T.; Hailu, B.T.; Ayenew, T. Assessing groundwater vulnerability to pollution in a rapidly urbanizing river basin using a modified drastic land use–lineament density method. Geol. J. 2024, 59, 3278–3295. [Google Scholar] [CrossRef]
- Ahmadi, M.M.; Mahdavirad, H.; Bakhtiari, B. Multi-criteria analysis of site selection for groundwater recharge with treated municipal wastewater. Water Sci. Technol. 2017, 76, 909–919. [Google Scholar] [CrossRef] [PubMed]
- Piscopo, G. Groundwater Vulnerability Map, Explanatory Notes, Castlereagh Catchment; Centre for Natural Resources, NSW Department of Land and Water Conservation: Sydney, Australia, 2001. [Google Scholar]
- Rivett, M.O.; Wealthall, G.P.; Dearden, R.A.; McAlary, T.A. Review of unsaturated-zone transport and attenuation of volatile organic compound (VOC) plumes leached from shallow source zones. J. Contam. Hydrol. 2011, 123, 130–156. [Google Scholar] [CrossRef]
- Vishwakarma, A.; Goswami, A.; Pradhan, B. Prioritization of sites for Managed Aquifer Recharge in a semi-arid environment in western India using GIS-Based multicriteria evaluation strategy. Groundw. Sustain. Dev. 2021, 12, 100501. [Google Scholar] [CrossRef]
- Talozi, S.; Alharahsheh, T.; Hamdan, I. Selecting suitable sites for groundwater recharge in Jordan using the spreading techniques via the integration of multi-criteria decision analysis and geographic information system tools. Groundw. Sustain. Dev. 2023, 22, 100948. [Google Scholar] [CrossRef]
- Civita, M.; De Maio, M. Assessing and mapping groundwater vulnerability to contamination: The Italian ‘‘combined’’ approach. Geofísica Int. 2004, 43, 513–532. [Google Scholar] [CrossRef]
- Al Kuisi, M.; El-Naqa, A.; Hammouri, N. Vulnerability mapping of shallow groundwater aquifer using SINTACS model in the Jordan Valley area, Jordan. Environ. Geol. 2006, 50, 651–667. [Google Scholar] [CrossRef]
- Al Kuisi, M.; Mashal, K.; Al-Qinna, M.; Hamad, A.A. Groundwater vulnerability and hazard mapping in an arid region: Case study, Amman-Zarqa Basin (AZB)-Jordan. J. Water Resour. Prot. 2014, 6, 442. [Google Scholar] [CrossRef]
- Margane, A.; Hobler, M.; Subah, A. Mapping of Groundwater Vulnerability and Hazards to Groundwater in the Irbid Area, N Jordan. Z. Für Angew. Geol. 1999, 45, 4. [Google Scholar]
- Awawdeh, M.; Al-Kharabsheh, N.; Obeidat, M.; Awawdeh, M. Groundwater vulnerability assessment using modified SINTACS model in Wadi Shueib, Jordan. Ann. GIS 2020, 26, 377–394. [Google Scholar] [CrossRef]
- El-Naqa, A.; Hammouri, N.; Kuisi, M. GIS-based evaluation of groundwater vulnerability in the Russeifa area, Jordan. Rev. Mex. De Cienc. Geológicas 2006, 23, 333–342. [Google Scholar]
- Noghreyan, A.; Mohamadvali Samani, J.; Zarei, H. Comparison of the SINTACS aquifer vulnerability model to nitrate with three-dimensional numerical model (case study of Varamin Plain Aquifer). Iran. J. Soil Water Res. 2022, 53, 103–116. Available online: https://ijswr.ut.ac.ir/article_87269_en.html?lang=en (accessed on 15 May 2025).
- Assefi, M.; Zarei, H.; Radmanesh, F. Improvement of SINTACS method using analytical hierarchy process in geographic information system environment to evaluate aquifer vulnerability (case study of Varamin Plain Aquifer). Irrig. Water Eng. 2015, 5, 109–125. [Google Scholar]
- Elzain, H.E.; Chung, S.Y.; Venkatramanan, S.; Selvam, S. Novel machine learning algorithms to predict the groundwater vulnerability index to nitrate pollution at two levels of modeling. Chemosphere 2023, 310, 136859. [Google Scholar] [CrossRef] [PubMed]
- Fu, J.; Le, X.C. Improving groundwater vulnerability assessment using machine learning. J. Environ. Sci. 2024, 153, 6–9. [Google Scholar] [CrossRef] [PubMed]
- Abba, S.I.; Yassin, M.A.; Jibril, M.M.; Tawabini, B.; Al-Ansari, N. Nitrate concentrations tracking from multi-aquifer groundwater vulnerability zones: Insight from machine learning and spatial mapping. Process Saf. Environ. Prot. 2024, 182, 110–125. [Google Scholar] [CrossRef]
- Idir, S.; Khemmoudj, K.; Bouali, H. Comparative analysis of groundwater vulnerability in the Oued Agrioun watershed, northeast Algeria: DRASTIC, GOD, and SINTACS approaches with ROC AUC Validation. Stud. Eng. Sci. 2024, 5, e11736. [Google Scholar] [CrossRef]
- Norouzi, H.; Moghaddam, A.A.; Celico, F.; Shiri, J. Assessment of groundwater vulnerability using genetic algorithm and random forest methods (case study: Miandoab plain, NW of Iran). Environ. Sci. Pollut. Res. 2021, 28, 15004–15018. [Google Scholar] [CrossRef]
- Chakrabortty, R.; Roy, P.; Chowdhuri, I.; Pal, S.C. Groundwater Vulnerability Assessment Using Random Forest Approach in a Water-Stressed Paddy Cultivated Region of West Bengal, India. In Groundwater Geochemistry; Madhav, S., Singh, P., Eds.; Wiley: Hoboken, NJ, USA, 2021. [Google Scholar] [CrossRef]
- Al-Adamat, R.A.N.; Foster, I.D.L.; Baban, S.M.J. Groundwater vulnerability and risk mapping for the Basaltic aquifer of the Azraq basin of Jordan using GIS, remote sensing and DRASTIC. Appl. Geogr. 2003, 23, 103–124. [Google Scholar] [CrossRef]
| Parameter | Data/Parameter Values Needed and Their Source |
|---|---|
| Depth to groundwater (S1) | Based on data from MWI and BGR [41] |
| Net recharge (I) | Calculated based on the estimated recharge percentage from literature reviews [51] for rainfall amount based on the aquifer media. |
| Unsaturated zone (N) | Based on geological maps (shape file) scale 1:50,000 [44,45,46,47,48,49]. |
| Soil media (T) | Soil units map with texture description (after [53]. |
| Aquifer media (A) | Outcropping hydrogeological units [41]. |
| Hydraulic conductivity (C) | Values from the literature reviews [50]. |
| Topographic Slope (S2) | Derived based on ALOS PALSAR digital elevation model (12.5 m spatial resolution) [40]. |
| Parameter | Weight | Category | Ratings | Category | Ratings |
|---|---|---|---|---|---|
| Depth to Groundwater (S1) (m) | 5 | 0–10 | 10 | 30–40 | 3 |
| 10–20 | 7 | >40 | 1 | ||
| 20–30 | 5 | ||||
| Infiltration rate (I) (mm/year) | 4 | 0–25 | 1 | 110–135 | 6 |
| 25–40 | 2 | 135–165 | 7 | ||
| 40–65 | 3 | 165–190 | 8 | ||
| 65–90 | 4 | 190–235 | 9 | ||
| 90–110 | 5 | ||||
| Unsaturated zone (N) (Class) | 5 | Coarse alluvial deposits | 6–9 | Sandstone, Conglomerate | 5–8 |
| Karstified limestone | 8–10 | Fissured volcanic rocks | 5–10 | ||
| Fractured limestone | 4–8 | Marl, clay stone | 1–3 | ||
| Fissured dolomite | 2–5 | Clay, silt, peat | 1–2 | ||
| Medium fine alluvial Deposits | 3–6 | Pyrotoclastic rock | 2–5 | ||
| Sand complex | 4–7 | Fissured metamorphic rocks | 2–6 | ||
| Soil media (T) (Texture) | 3 | Clay | 1 | Sandy clay loam | 5 |
| Silty clay | 2 | Sandy loam | 6 | ||
| Clay loam | 3 | Loamy sand | 8 | ||
| Silty clay loam | 3.5 | Sand | 8.5 | ||
| Silty loam | 4 | No soil cover | 10 | ||
| Loam | 4.5 | ||||
| Aquifer media (A) (Class) | 4 | Coarse alluvial deposits | 4–9 | Sandstone, conglomerate | 4–9 |
| Karstified limestone | 9–10 | Fissured volcanic rocks | 8–10 | ||
| Fractured limestone | 6–9 | Marl, clay stone | 1–3 | ||
| Fissured dolomite | 4–7 | Clay, silt, peat | 1–3 | ||
| Medium fine alluvial deposits | 6–8 | Pyrotoclastic rock | 4–8 | ||
| Sand complex | 7–9 | Fissured metamorphic rocks | 2–5 | ||
| Hydraulic conductivity (C) (m/day) | 3 | <0.1 | 1 | 5–15 | 6–7 |
| 0.1–1 | 3 | 15–50 | 8–9 | ||
| 1–5 | 5 | >50 | 10 | ||
| Topographic Slope (S2) (%) | 2 | 0–2 | 10 | 13–15 | 5 |
| 3–4 | 9 | 16–18 | 4 | ||
| 5–6 | 8 | 19–21 | 3 | ||
| 7–9 | 7 | 22–25 | 2 | ||
| 10–12 | 6 | >25 | 1 |
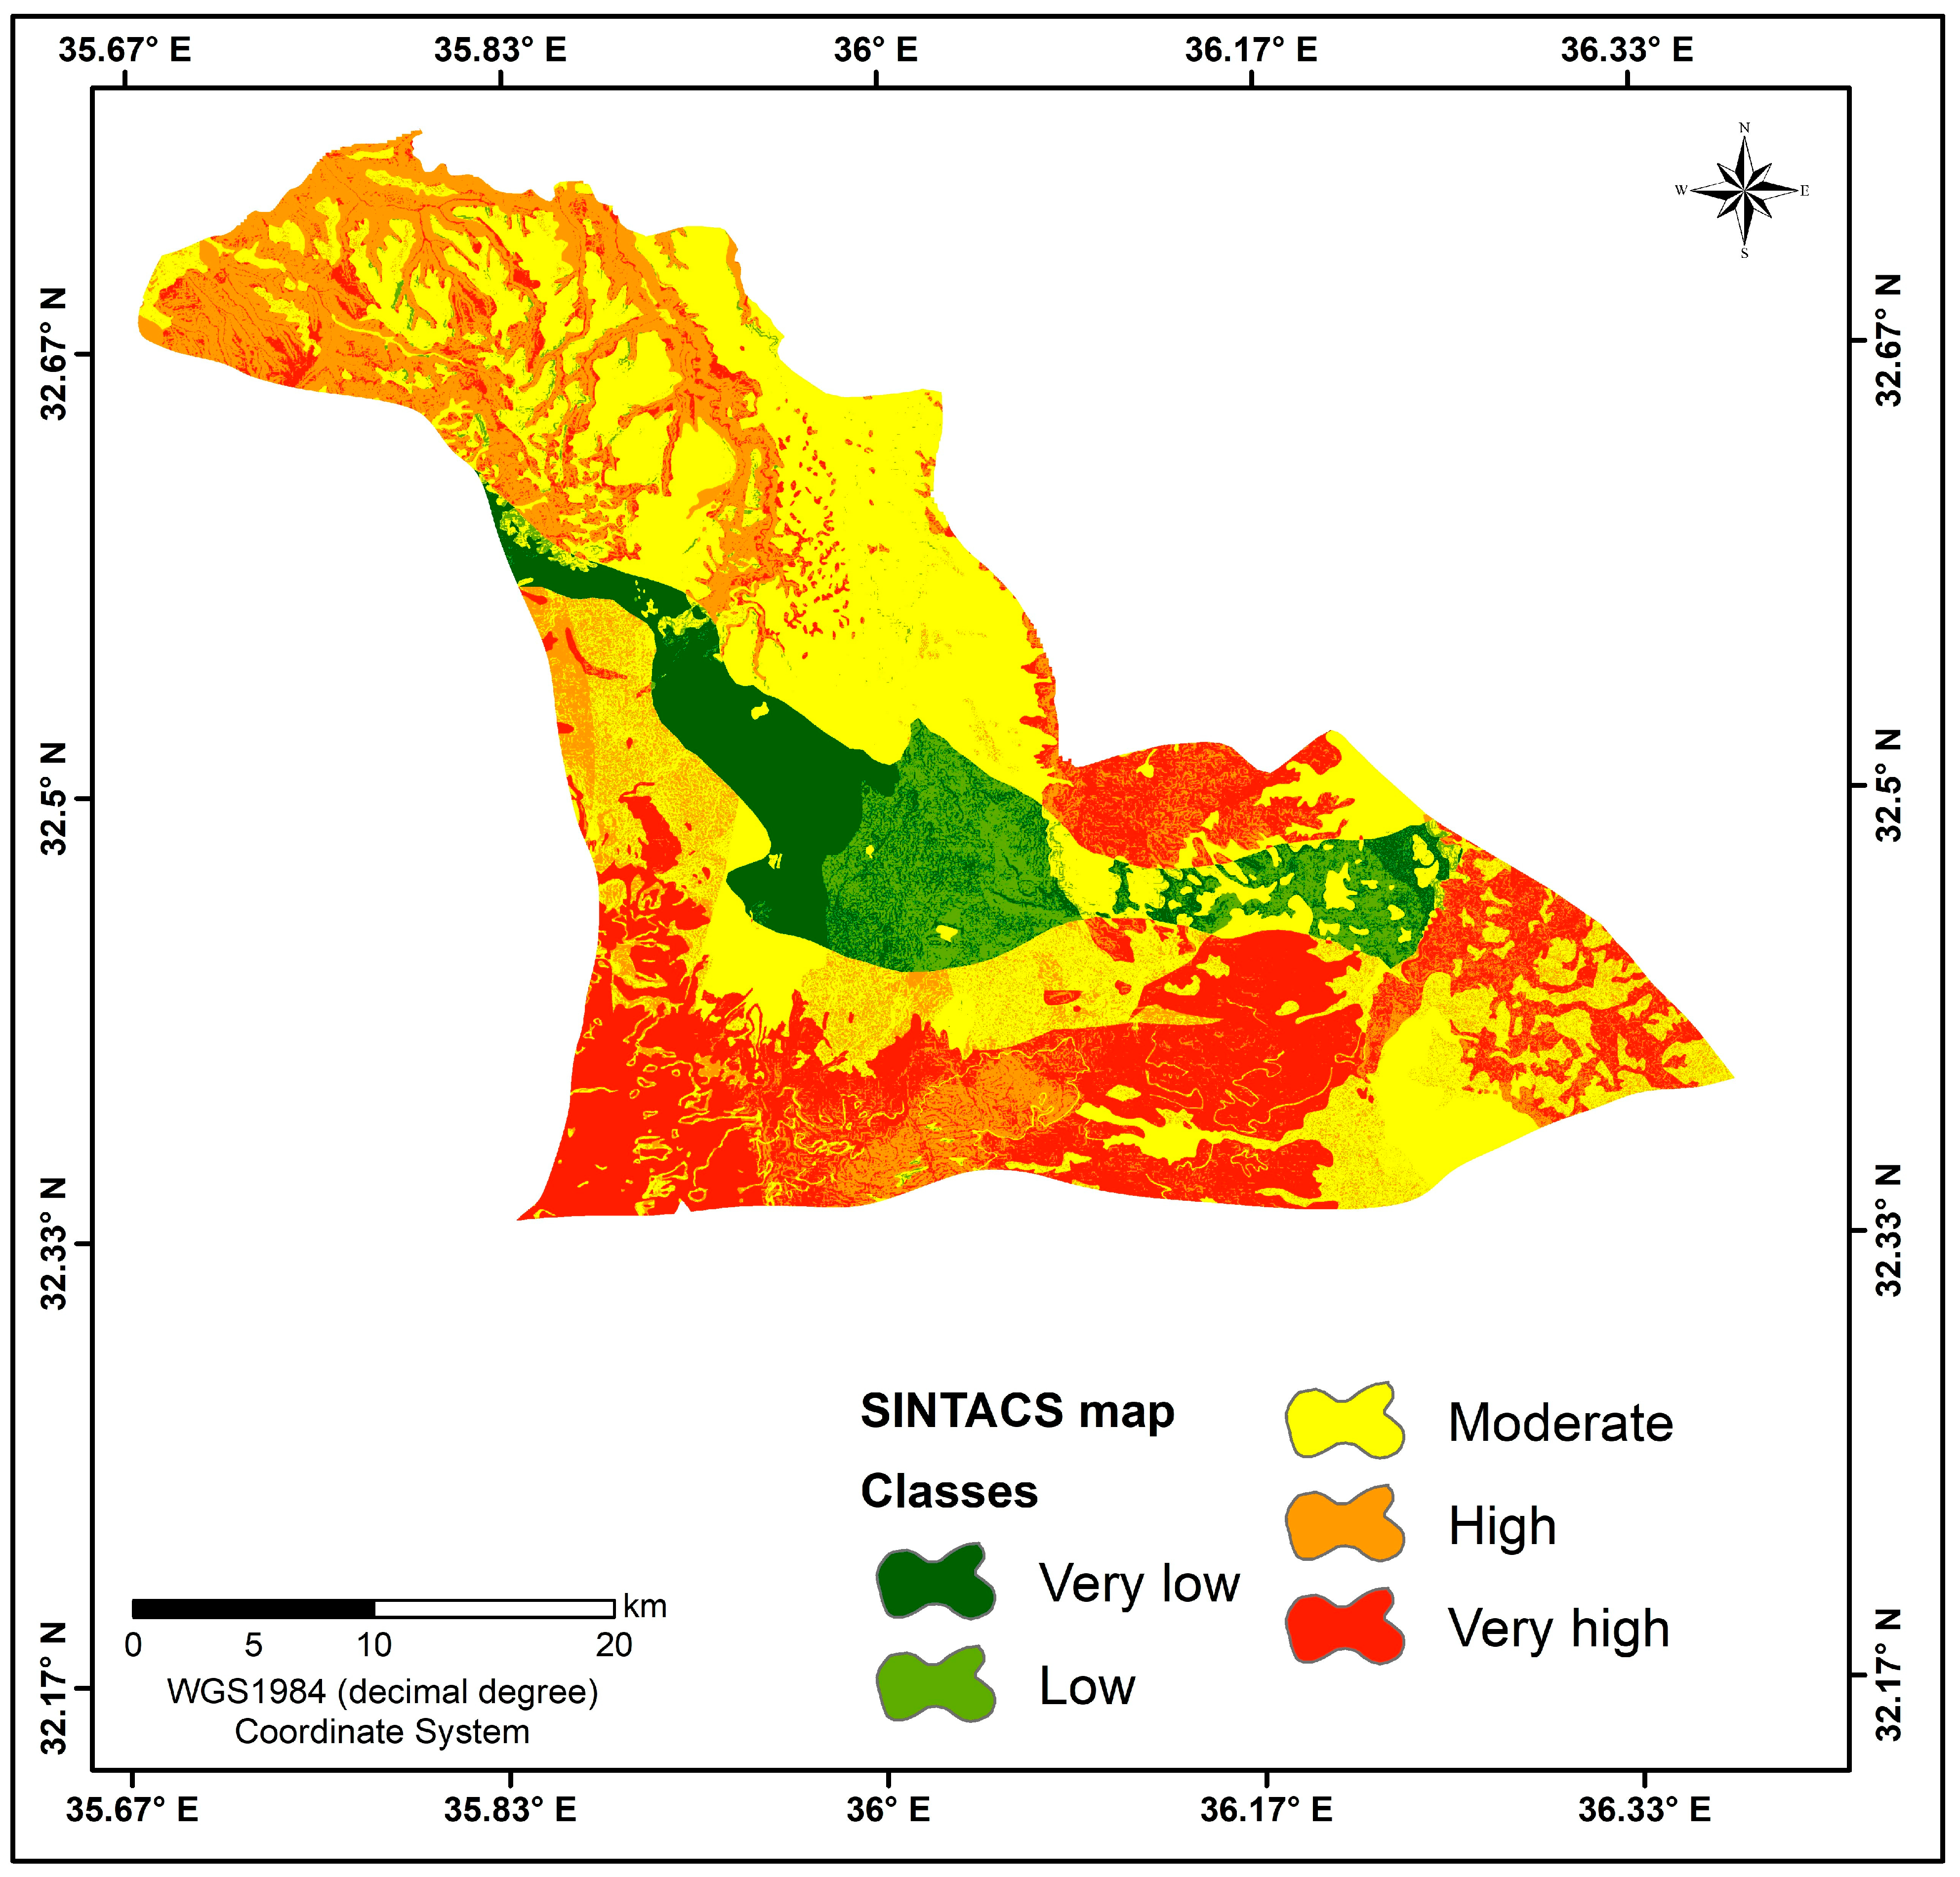
| Vulnerability Class | SINTACS Model | SINTACS Map Using a Random Forest Machine Learning Model | ||
|---|---|---|---|---|
| Area (Km2) | (%) | Area (Km2) | (%) | |
| Very low | 105.39 | 8.37 | 90.3 | 7.2 |
| Low | 74.5 | 5.92 | 101.15 | 8 |
| Moderate | 479.26 | 38.07 | 522.71 | 41.5 |
| High | 271.43 | 21.56 | 238.05 | 18.9 |
| Very high | 328.41 | 26.09 | 306.78 | 24.4 |
| Vulnerability Class | Agriculture | Bare Soil | Forest | Rocks | Urban | Water |
|---|---|---|---|---|---|---|
| Very low | 3.732 | 3.966 | - | - | 0.671 | 0.005 |
| Low | 0.593 | 4.983 | 0.001 | - | 0.347 | 0.005 |
| Moderate | 14.338 | 18.440 | 0.017 | 0.003 | 5.325 | 0.004 |
| High | 3.018 | 15.535 | 0.084 | 0.013 | 2.872 | 0.009 |
| Very high | 1.830 | 21.458 | 0.179 | 0.075 | 2.491 | 0.005 |
Disclaimer/Publisher’s Note: The statements, opinions and data contained in all publications are solely those of the individual author(s) and contributor(s) and not of MDPI and/or the editor(s). MDPI and/or the editor(s) disclaim responsibility for any injury to people or property resulting from any ideas, methods, instructions or products referred to in the content. |
© 2025 by the authors. Licensee MDPI, Basel, Switzerland. This article is an open access article distributed under the terms and conditions of the Creative Commons Attribution (CC BY) license (https://creativecommons.org/licenses/by/4.0/).
Share and Cite
Hamdan, I.; AlShdaifat, A.; Ibrahim, M.; Al-Shabeeb, A.R.; Al-Adamat, R.; Al-Fugara, A. A Dual-Method Assessment of the Yarmouk Basin’s Groundwater Vulnerability Using SINTACS and Random Forest. Geosciences 2025, 15, 414. https://doi.org/10.3390/geosciences15110414
Hamdan I, AlShdaifat A, Ibrahim M, Al-Shabeeb AR, Al-Adamat R, Al-Fugara A. A Dual-Method Assessment of the Yarmouk Basin’s Groundwater Vulnerability Using SINTACS and Random Forest. Geosciences. 2025; 15(11):414. https://doi.org/10.3390/geosciences15110414
Chicago/Turabian StyleHamdan, Ibraheem, Ahmad AlShdaifat, Majed Ibrahim, Abdel Rahman Al-Shabeeb, Rida Al-Adamat, and A’kif Al-Fugara. 2025. "A Dual-Method Assessment of the Yarmouk Basin’s Groundwater Vulnerability Using SINTACS and Random Forest" Geosciences 15, no. 11: 414. https://doi.org/10.3390/geosciences15110414
APA StyleHamdan, I., AlShdaifat, A., Ibrahim, M., Al-Shabeeb, A. R., Al-Adamat, R., & Al-Fugara, A. (2025). A Dual-Method Assessment of the Yarmouk Basin’s Groundwater Vulnerability Using SINTACS and Random Forest. Geosciences, 15(11), 414. https://doi.org/10.3390/geosciences15110414


