Article

Grain Shape Variation of Different Sand-Sized Particles and Its Implication for Discriminating Sedimentary Environment

College of Life Science and Resources and Environment, Yichun University, Yichun 336000, China
*
Author to whom correspondence should be addressed.
Geosciences 2025, 15(11), 412; https://doi.org/10.3390/geosciences15110412
Submission received: 2 September 2025 / Revised: 23 October 2025 / Accepted: 24 October 2025 / Published: 29 October 2025
(This article belongs to the Section Climate and Environment)

Abstract

Particle shape analysis is essential in sedimentological research, as it offers vital insights into the sedimentary environment and transport history. However, little is known about the particle shape variation across different sand fractions, as well as the differences between particle shape data based on volume and number weighting. In this study, we investigate the grain shape variation of different sand-sized particles (fine, medium, and coarse sand fractions) in aeolian dune (11 samples) and lake beach (12 samples) environments around Poyang Lake, China, using dynamic image analysis (DIA). The shape data results based on both volume-weighted and number-weighted methods reveal significant differences in shape parameters (circularity, symmetry, aspect ratio, and convexity) among different sand fractions, especially between coarse and fine sand. This highlights the critical need for size-fractionated analysis when employing particle shape as an environmental discriminant. By integrating 86 sets of published particle shape data from different depositional environments, we found that volume-weighted shape data has limited ability to differentiate beach and dune sands, although it distinguished the fluvial, desert dune, and coastal beach sand well. In contrast, number-weighted shape data effectively distinguished the beach and dune sands, as fine sand particles are typically transported in suspension during fluvial processes and in saltation during aeolian processes. This demonstrates the role of integrating both volume-weighted and number-weighted shape data in future studies to accurately distinguish sedimentary environments.

1. Introduction

Particle morphology, including size and shape, is an important research topic in fields such as geology [1], engineering [2], and materials science [3], as it plays a crucial role in understanding the mechanical behavior, fluid dynamic properties, and sedimentary environments of granular materials [4,5,6]. For instance, in geotechnical engineering, particle shape directly influences soil shear strength and deformation characteristics [7,8], while in environmental geology, quantitative analysis of detrital particle morphology can help identify sedimentary environments and reveal sediment transport history and provenance [5,9]. Early particle shape measurements mainly relied on manual operations and qualitative descriptions [10,11,12]. This method, determining the shape parameters by visually comparing particles with standard charts, exhibits limitations in accuracy and reproducibility, especially when dealing with irregular or complex-shaped particles [13,14,15,16], restricting its widespread application in the geoscience community.
In recent years, benefiting from advancements in high-frame-rate cameras and image processing technology, automated digital image analysis (DIA) has become the primary method for particle shape measurement [5,13,17,18]. DIA is a rapid, reproducible, statistically robust, objective method, and it enables the simultaneous testing of large quantities of material, making quantitative study of particle shape one of the major focuses in the field of geoscience and materials science. Deal et al. [4] studied the grain shape of bed load sediment and found that it can significantly alter transport rates by affecting fluid drag and granular friction; they then proposed a corrected bed load transport law that accounts for grain shape effects. Liang and Yang [9] performed a comprehensive study on the changes in grain shape of sediments from mountainous regions to dune fields, and they claimed that that grain shape is an effective tool for tracing the history of sediment transport. Furthermore, grain shape has been effectively utilized to discriminate fluvial, strand plain, aeolian, and glacial depositional environments in terrestrial and Martian settings [6]. However, it is worth noting that these studies primarily focus on shape variation of all grains (bulk samples), overlooking the potential impact of grain size sorting, which is prevalent in depositional systems, on the differentiation of grain shape; this grain size effect on shape may lead to biases in sedimentary environment interpretation. Although some studies have claimed that particle shape is independent of grain size [2], others indicate significant heterogeneity in particle shape among different size fractions [19,20,21]. This contradiction highlights the complexity of the relationship between grain size and shape, and may stem from two limitations: (1) the sensitivity of the existing shape parameters to grain size variations has not been systematically validated; (2) the differences in size sorting mechanisms in different sedimentary environments (such as aeolian dunes, alluvial fans, and moraines) may reshape the coupling relationship of size and shape [20]. Therefore, it is imperative to conduct further systematic studies on the variations in particle shape across different grain sizes and depositional environments, so that particle shape can be better utilized to distinguish sedimentary environments.
In addition, most studies calculated the average values of particle shape parameters using volume-weighted data [9,13,20]. This method clearly biases the results towards coarse particles (due to their greater volume), potentially leading to the loss or masking of signals from finer particles. Dynamic image analysis (DIA), used by Camsizer X2 and Sympatec QICPIC, not only provides particle shape distribution based on volume weighting but also offers number-weighted data. Unsurprisingly, number-weighted data tends to bias results towards finer particles, as there are significantly more fine particles than coarse ones [2]. Especially when the particle size distribution is wide, both methods can result in the loss of some signals. However, combining the results from these two weighting approaches may provide richer particle shape information, thereby better utilizing particle shape to accurately distinguish sedimentary environments and transport history.
The grain shapes of fine-to-coarse sand fractions from 23 modern dune and beach sand samples around Poyang Lake in China were measured using the DIA method. The aims of our study are (1) to investigate grain shape variation of different sand-size particles in aeolian and beach environments, and (2) to establish an optimized analytical framework integrating both volume-weighted and number-weighted shape distributions from dynamic image analysis that enhance the diagnostic accuracy of sedimentary environment identification based on grain shape.

Regional Background

Poyang Lake, located in the middle Yangtze River valley (Figure 1a,b), is the largest freshwater lake in China. The Ganjiang River, running through Jiangxi Province from south to north, flows into the lake. Poyang Lake is a large shallow water body and experiences an annual water level fluctuation of over 10 m. This variation leads to significant changes in the lake’s surface area between the wet and dry seasons. During high-water-level periods (20 m), the lake expands to 4125 km2; in contrast, during low-water-level periods (12 m), it contracts to approximately 500 km2 [22], nearly transforming into a network of rivers. Numerous sand dunes, commonly referred to as sand hills [23], have developed along the banks of Poyang Lake, particularly in Xingzi (Figure 1c), Duobao (Figure 1c), and Songmen Mountain. These sand dunes are believed to have formed during the Late Pleistocene, driven by extreme aridity and strong winter monsoons [24]. They are currently in a semi-fixed state. The sand dunes, typically characterized by longitudinal ridges, have formed dish- and trough-shaped blowouts, residual dunes, and other erosional landforms upwind, while longitudinal dunes, dendritic dunes, sand sheets, and other accumulation landforms have developed downwind [23]. Climatically, the study region is characterized by a typical subtropical humid monsoon climate with high temperatures and precipitation concentrated in the summer. The annual average temperature, evaporation, and precipitation are 17.6 °C, 816 mm, and 1500 mm, respectively. During the summer months, southerly winds are predominant, while northerly winds are more common in the other seasons, and the annual mean wind speed is 3.9 m/s. The annual sand drift potential (DP) and resultant drift direction (RDD) are about 255–279 vector units (VU) and 230° [13]. Since the DP value exceeds 200 VU, Poyang Lake is classified as a medial-energy wind environment [25].

2. Materials and Methods

During our field investigations, we collected 11 modern surface aeolian dune sand (DS) samples from Duobao sand hill, and 12 lake beach sand (BS) samples from Poyang Lake (Figure 1c–e). Beach sand samples were collected from the beach face. Approximately 2000 g of samples were collected from the top 10 cm of the surface. To investigate the variations in particle shape of different grain sizes, the samples were separated into four different grain size fractions by dry sieving, including a fine sand fraction (<250 μm), a medium sand fraction (250–500 μm), a coarser sand fraction (>500 μm), and bulk samples. To verify the reliability of our hypothesis that integrating both volume-weighted and number-weighted shape data may better distinguish sedimentary environments, we also collected 86 published grain shape data samples from three known depositional environments for comparison (Figure 1a): 11 coastal beach sand (CBS) and 11 coastal aeolian dune sand (CDS) samples from Hainan Island [20], 28 desert dune sand (DDS) samples from Alxa Plateau Desert [26], and 36 fluvial sand (FLS) samples from the Ganjiang River in China [27].
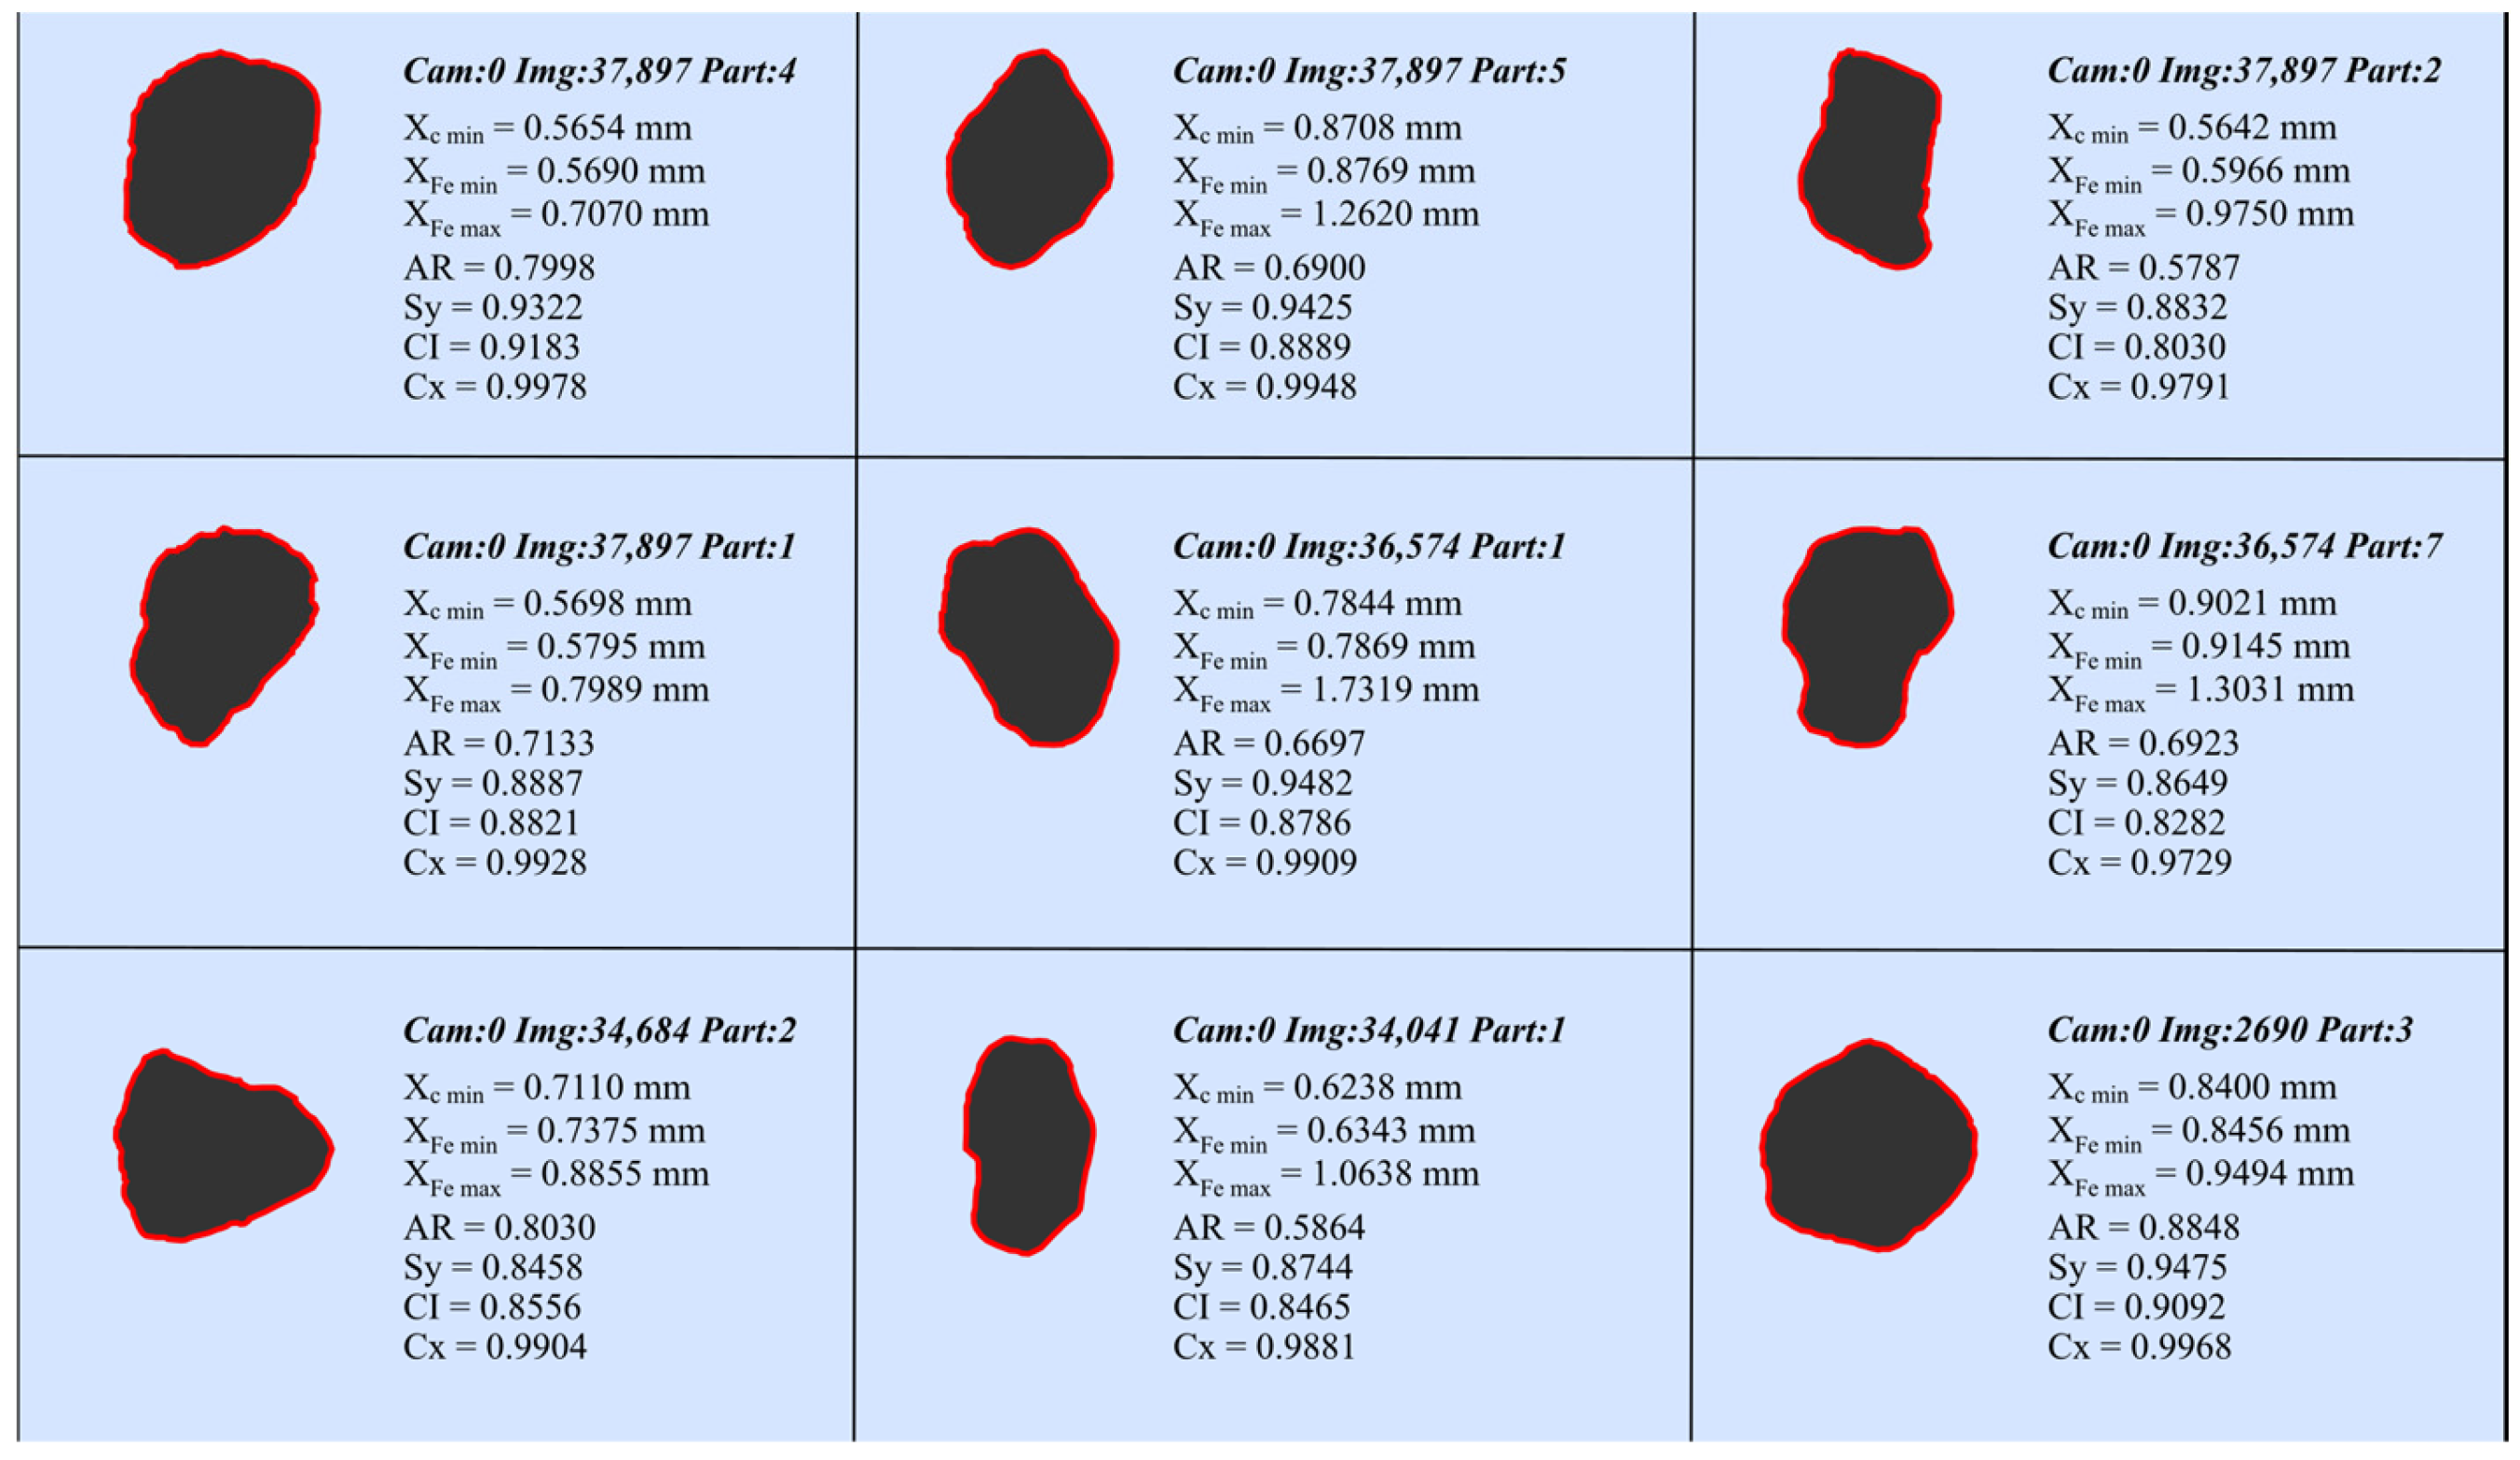
The particle size and shape of samples were measured using a Camsizer X2 particle size and shape analyzer (Microtrac Retsch GmbH, North Rhine-Westphalia, Germany) at the School of Earth Sciences, Zhejiang University. Detailed procedures followed the method described by [13]. The Camsizer X2 particle size and shape analyzer employs ultrabright LED stroboscopic light sources and dual digital CCD cameras to capture detailed information on particle size and shape. Two cameras (a basic camera analyzing coarse particles and a zoom camera analyzing fine particles) operate simultaneously to capture real-time images of moving particles at a high resolution (0.08 μm/pixel) as the sand grains pass the measurement window [9]. Around 10–30 g of sediment (~200,000–2,000,000 individual grains) was analyzed for each sample. Based on the captured images by the dual camera (Figure 2), the average grain size and shape value of imaged particles were calculated using the Particle X-Plorer software. To compare the differences in average shape value obtained based on number and volume weighting, we separately used the Particle X-Plorer V2.3.9 software (Microtrac Retsch GmbH, Germany) to extract average shape values for samples based on number and volume weighting.
The CAMSIZER X2 measures various areas, perimeters, and lengths of the particle projections, determining up to 50 different parameters per particle. Typical shape results obtained include circularity (CI), symmetry (Sy), aspect ratio (AR), and convexity (Cx); their definitions are illustrated in Hu et al. [13]. Circularity is a typical shape characteristic that measures how spherical the grains are, which is determined from the particle perimeter P and the particle area A. It has also been identified as high-sensitivity circularity (HS = 4πA/P2), roundness, and/or a form index [17]. Circularity values range from 0 to near 1. For a spherical or a circular particle, the circularity value is 1; in all other cases, circularity is less than 1. Symmetry indicates the symmetry of particles on a two-dimensional projection. Each particle is scanned by the CAMSIZER® X2 program in up to 64 directions. For each of these scanning directions, the two distances r1 and r2 are determined from the center of area Z to the particle boundary perpendicular to the scanning direction. The smallest resulting radius ratio is then displayed as symmetry. Perfectly symmetrical shapes have a symmetry equal to 1. For all other shapes, the symmetry is <1. If the center of area Z is located outside of the particle, the symmetry is <0.5. The aspect ratio displays the width/length ratio, which is determined from the particle width Xcmin and the particle length XFemax. The aspect is the inverse of elongation. Convexity indicating the irregularity of particle edges or particle roughness is the convex hull perimeter of an object divided by its perimeter. Convex particles have a convexity equal to 1; for all other particles, the convexity is <1. According to Campaña et al. [19], convexity may be a suitable indicator of textural maturity. The CAMSIZER X2 generates various grain sizes. We selected chord diameter (Xcmin) to represent grain size as it is the most suitable characteristic for comparison with sieve analysis results [9], and mean grain size is calculated using the geometric mean diameter.

3. Results

3.1. Grain Size and Shape Distribution

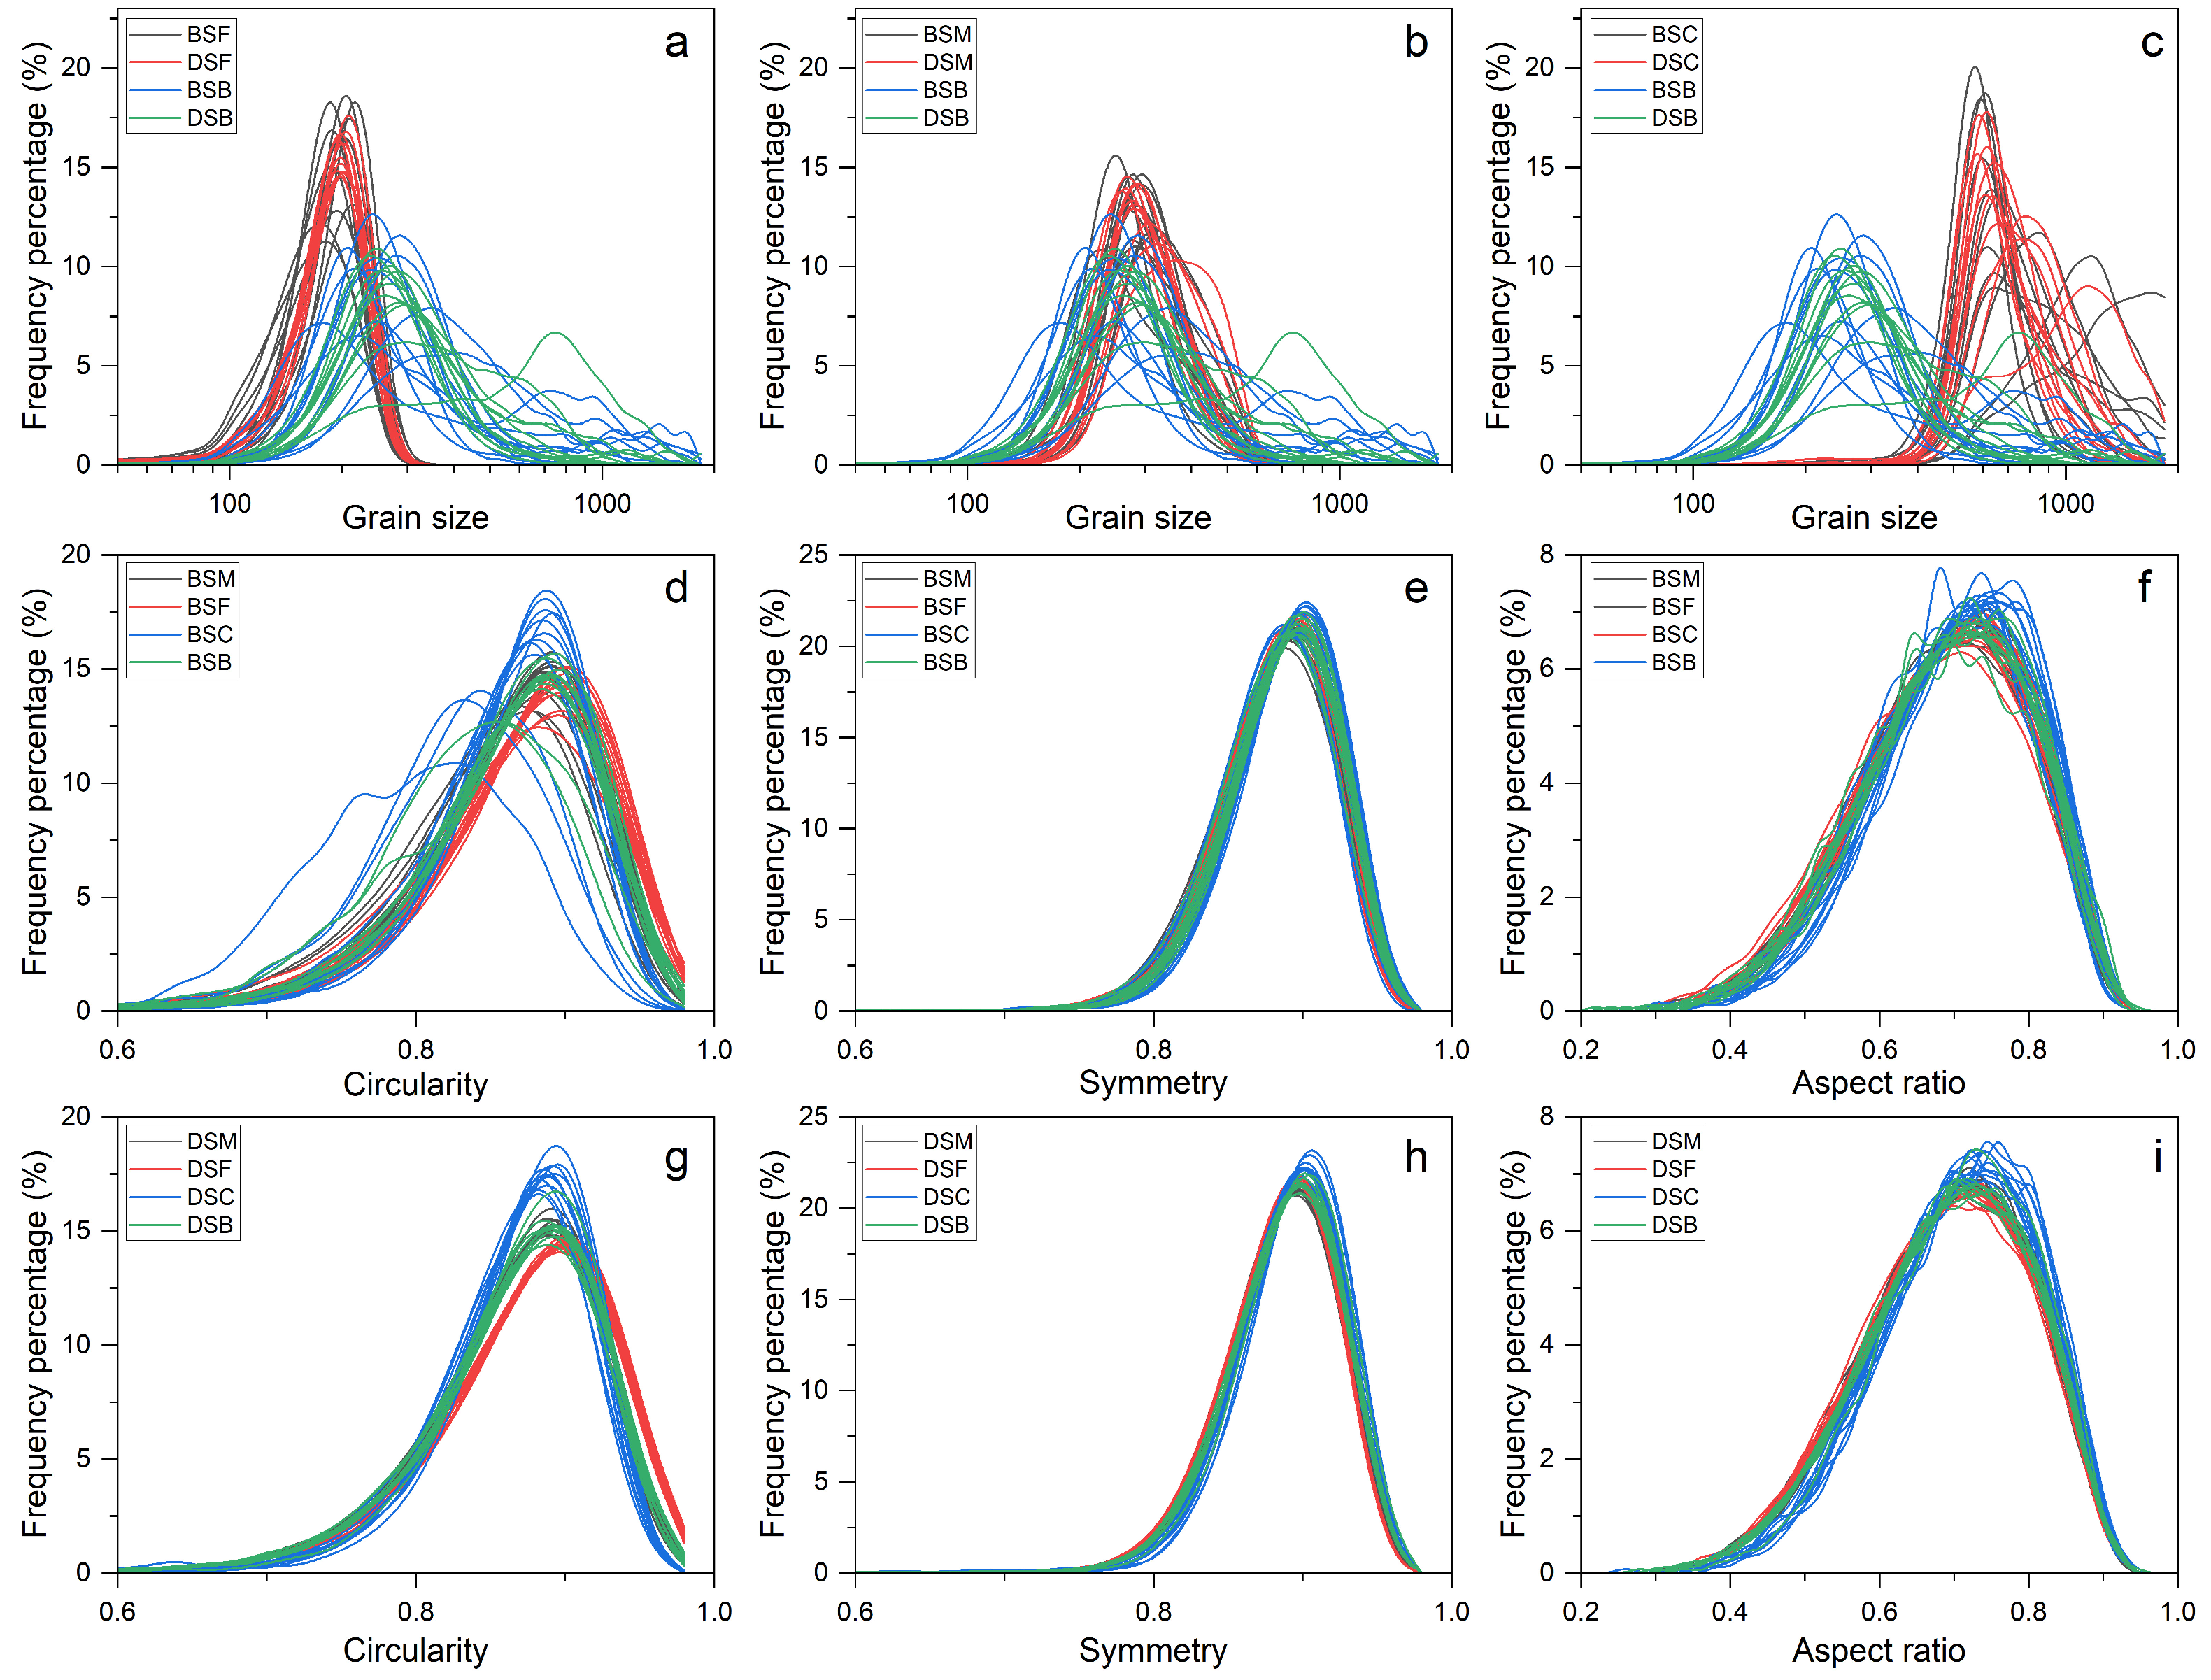
Bulk samples of surface aeolian dune sand (DSB) and beach sand (BSB) exhibit roughly similar particle size distributions (Figure 3a–c). Most of them show mesokurtic, symmetrical to coarse-skewed, and unimodal distributions with the main mode at 250–300 μm. The grain size composition of these bulk samples of dune sand and beach sand is dominated by medium and fine sand, with average contents of 52% and 31% for dune sand, and 46% and 37% for beach sand, respectively. Their coarse sand content is relatively low, about 15%. The grain size distribution curves of beach sand and sand dune sand also show similar patterns in the three different size fractions (fine, medium, and coarse sand), with grain size modes of 190 μm, 280 μm, and 600 μm, and fine-skewed, symmetrical, coarse-skewed distribution, respectively.
The circularity, symmetry, and aspect ratio distribution curves of bulk samples from different environments and their corresponding different size fractions are shown in Figure 3d–i. Similar to grain size, the shape distribution curves of DSB and BSB do not show striking dissimilarity, as most of them highly overlap and have a similar trend, especially for AR and Sy. However, there are some variations in shape distribution between different size fractions of sediments from the same sedimentary environment, especially between coarse and fine sand fractions (e.g., BSF and BSC). This difference is significantly greater than the differences observed between DSB and BSB, or between different sediments in the same sand fraction (e.g., DSC and BSC). Overall, it seems difficult to effectively distinguish beach sand from sand dune sand based on bulk samples using grain shape and size distribution.

3.2. Grain Shape Parameter Variations Between Different Size Fractions

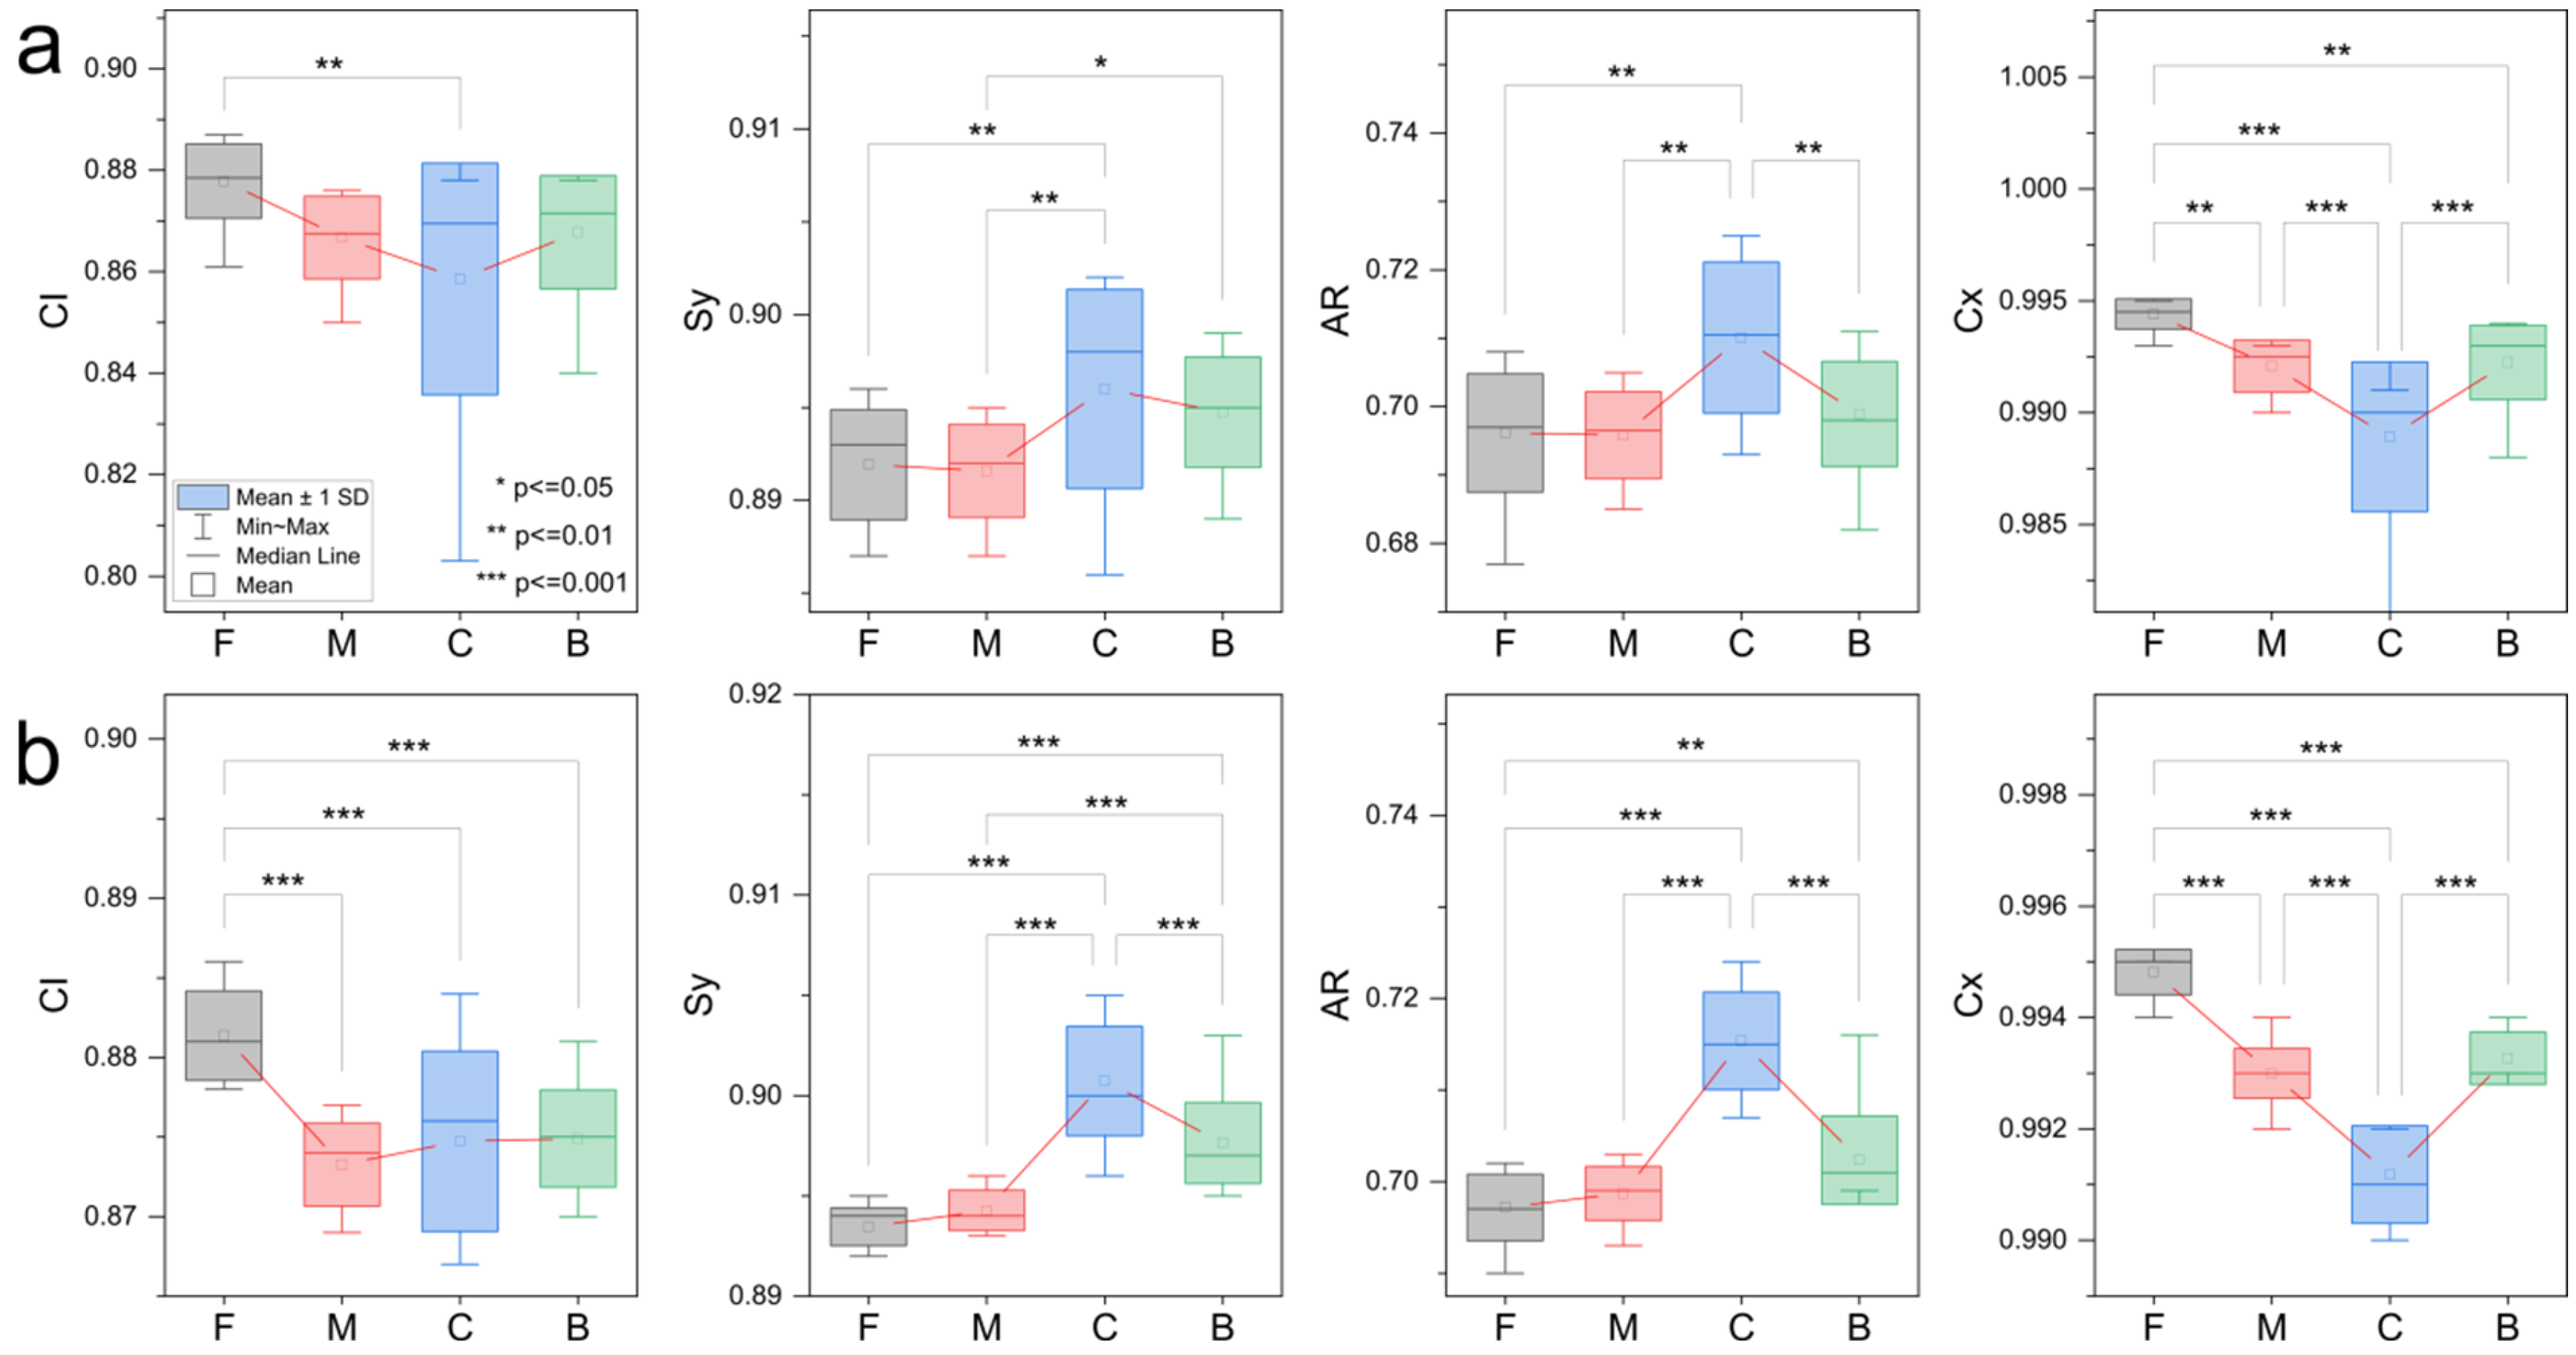
Box plots of grain shape parameters provide a more detailed view of visual variations for different size fractions (Figure 4 and Figure 5). The grain shape values of different size fractions (Table 1), based on the volume-weighted shape data, of beach sand and dune sand show similar variation tendency (Figure 4). The fine sand fraction has the highest Cx value, and as the grain size increases, Cx gradually decreases. Sy and AR exhibit opposite trends, with their values being highest in the coarse sand fraction and smaller in the fine and medium sand fractions. The CI value of beach sand decreased from fine to coarse sand fraction, while the dune sand sample has the lowest CI value in the medium sand fraction. Pairing comparison analysis shows that Cx exhibits significant differences among the three different components (p < 0.01), while other shape parameters only show significant differences between one or two fractions. For example, the CI of beach sand only shows a significant difference between the fine and coarse sand fractions, and there is no statistical difference between the medium and fine sand fractions, as well as between the medium and coarse sand fractions. In addition, for larger size fractions, the range of the shape value is wider, and there are significant differences in all parameters between the coarse and fine sand fractions. The grain shape values of bulk samples are between the medium and coarse sand fractions, and their differences from the other three sand fractions on different shape parameters are not the same. For example, sometimes they differ from the medium sand fraction, and sometimes they differ significantly from the fine sand or coarse sand fractions.
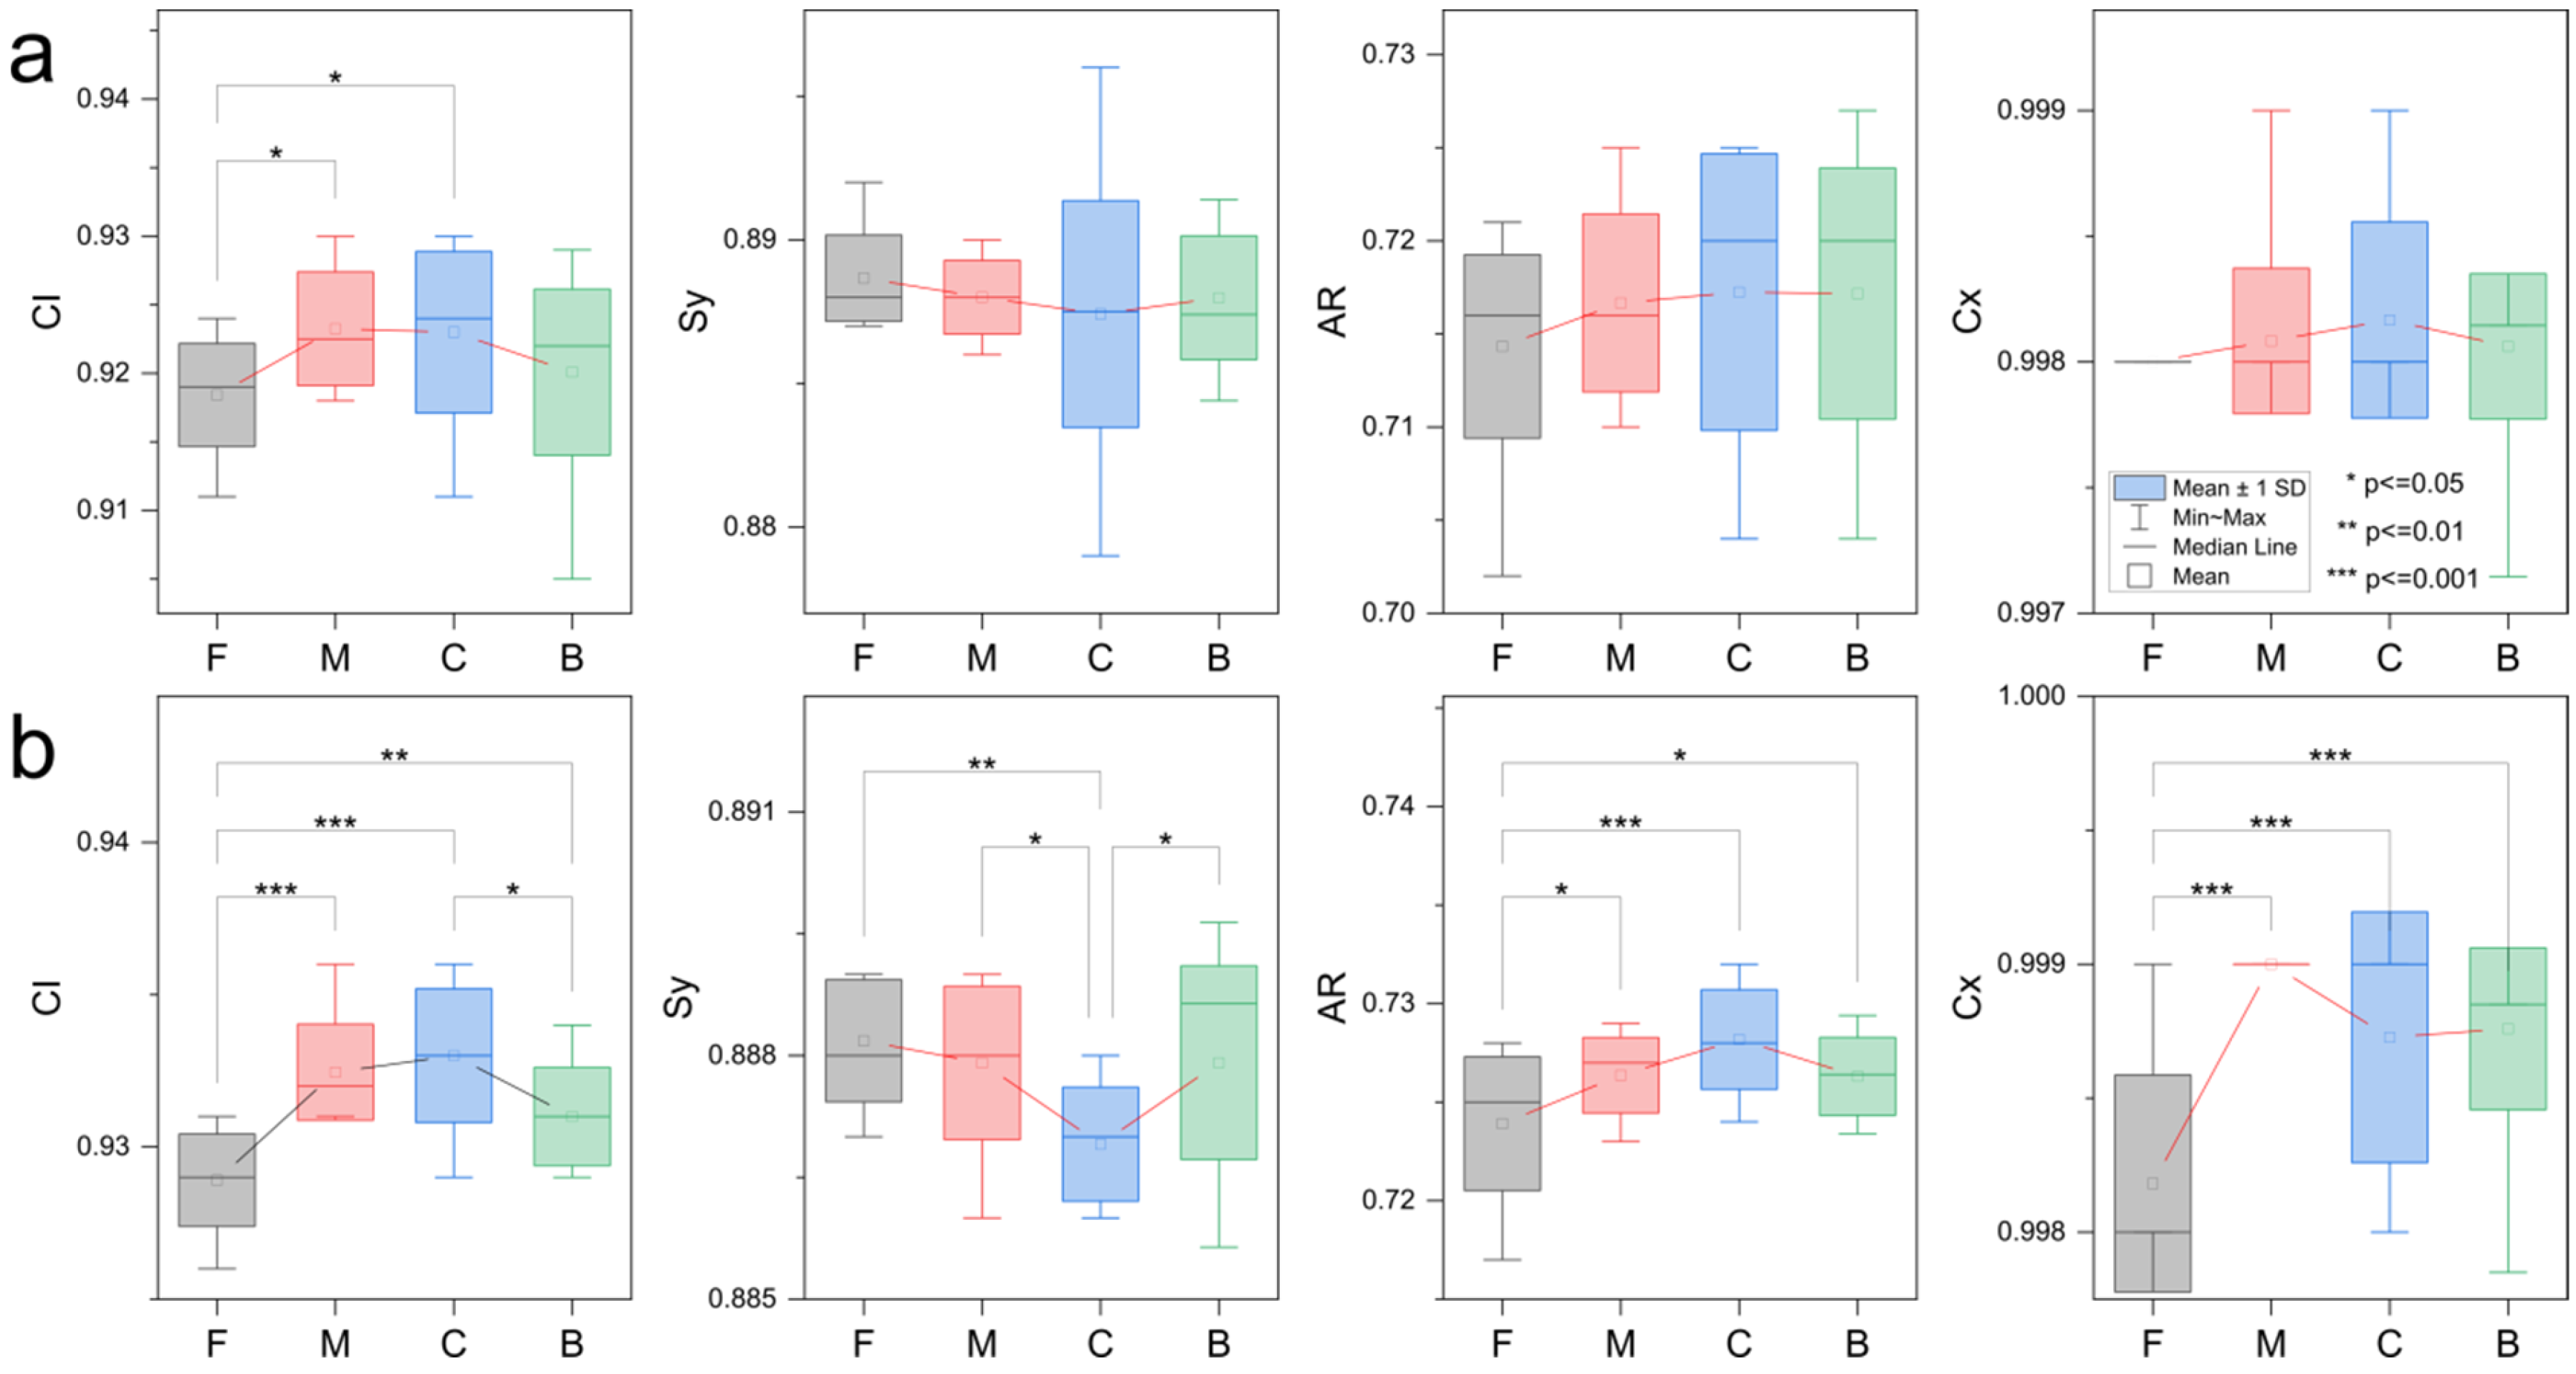
In the result based on the number weighting of the data, grain shape values of different size fractions of beach sand and dune sand also exhibit similar trends of change (Figure 5). The most prominent feature is that the CI and AR values gradually increase from the fine sand to the coarse sand fraction, while Sy shows the opposite trend. It should be noted that, except for Sy, the grain shape value calculated based on the number-weighted data is significantly larger than those based on the volume-weighted data (Table 1). For instance, based on volume-weighted data, the CI and AR value for the fine, medium, and coarse sand fractions of dune sand are 0.929 and 0.724, 0.932 and 0.726, and 0.933 and 0.728, respectively, while based on number-weighted data, their corresponding shape values are 0.881 and 0.697, 0.873 and 0.699, and 0.875 and 0.715, respectively. In addition, the differences in grain shape among the three sand fractions and bulk samples obtained based on these two methods are also inconsistent (Figure 5). Based on the number-weighted data, the grain shape results show that there is no statistical difference in the AR of the three sand fractions in beach sand (Figure 5). Based on the volume weighting, however, the grain shape of the coarse sand fraction in beach sand has significant differences (p < 0.001) in AR compared to the fine and medium sand fractions (Figure 5).

3.3. Grain Shape Difference Between Beach Sand and Dune Sand

On average, in both the results based on volume and number weighting, the grain shape value of sand dunes is larger than that of beach sand in all three sand fractions and bulk samples (Table 1). Based on number weighting, the CI, AR, and Cx values for the fine, medium, and coarse sand fractions of dune sand are 0.929, 0.724, and 0.998; 0.932, 0.726, and 0.999; and 0.933, 0.728, and 0.999, respectively, while for beach sand, their shape values are 0.918, 0.714, and 0.998; 0.923, 0.717, and 0.998; and 0.923, 0.717, and 0.998, respectively. The only exception was observed in Sy, where the average values obtained by both weighting methods are roughly equal, regardless of the different sand fractions or bulk sample (Figure 6c). However, based on the volume weighting, only in the coarse sand fraction are there statistically significant differences (p < 0.001) in CI, Sy, and Cx between beach sand and sand dune sand (Figure 6a,b,d); in the fine and medium sand fractions or bulk sample, beach sand has no significant statistical difference from dune sand in grain shape. In contrast, based on the number weighting, beach sand in the three sand fractions and bulk sample all exhibit significant statistical difference (p < 0.001) from dune sand in CI, AR, and Cx, and only no difference in Sy (Figure 6e–h).

4. Discussions

4.1. Implications for Grain Shape Variations Across Different Size Fractions

Although particle size does not inherently alter particle shape, variations in transport modes and transport distances among different grain size fractions indirectly modulate shape characteristics through abrasion and sorting processes [20,28,29]. Therefore, investigating shape variation in different grain size fractions is critical for using particle shape as a diagnostic tool in discriminating depositional environments. As evidenced by our volume-weighting result, bulk and fine sand fractions of beach sand samples exhibit no significant statistical difference (p < 0.001) in shape from dune sand, whereas those of coarse sand can effectively differentiate them (Figure 6a–d). Li and Iskander [2] argued that the three shape parameters of circularity, aspect ratio, and convexity do not appear to have marked size dependence, as when particles fracture, daughter particles may preserve a similar shape feature to that of the parent material. However, our results indicate that there are significant statistical differences in grain shape parameters of CI, Sy, AR, and Cx across fine-to-coarse sand fractions in dune and beach systems. These variations persist under both volume and number weighting, with particularly pronounced distinctions between coarse and fine sand fractions. Similar results have also been observed in many different sediments, such as loess and red clay [30]; beach, dune, and riverbed sand [31,32]; and flood plain and debris flow sediment [19].
It is noteworthy that for the three sand fractions, the average shape value based on number weighting is significantly greater than those based on volume-weighting. This reveals that within the same sand fraction (e.g., medium sand fraction: 250–500 μm), the average shape values of finer particles are generally greater, since volume-weighted data tends to favor coarser particles, while the number-weighted data tends to favor finer particles. Additionally, the results of the relationship between particle shape and particle size calculated by volume- and number-weighted data are inconsistent. The number-weighted CI and Cx gradually increase from fine sand to coarse sand, whereas the volume-weighted results show the opposite trend. This may be due to the fact that for different grain size fractions, the CI and Cx of the larger particles decrease with increasing grain size (i.e., the CI and Cx of large particles in fine sand are greater than those in coarse sand), while the CI and Cx of the smaller particles increase with increasing grain size (the CI and Cx of small particles in coarse sand are greater than those in fine sand). The differences in the transport distance (closely related to sorting as large particles are often preferentially deposited during transportation), abrasion efficiency (with different abrasion rates for coarse and fine grains), and source between different particles can explain this case: the larger particles (e.g., 1500 μm) in the coarse sand fraction may originate from rapid deposition near the source (with lowest CI and Cx), while the smaller particles (e.g., 550 μm) in the coarse sand fraction may have high abrasion efficiency (with highest CI and Cx); the larger particles in the fine sand fraction (e.g., 200 μm) are transported over shorter distances with relatively low abrasion efficiency (with high CI and Cx), while the smaller particles have the lowest abrasion efficiency but are transported over the longest distances (with higher CI and Cx). Unlike Cx and CI, the AR value gradually increases from the fine sand to the coarse sand fraction, regardless of whether based on number-weighted or volume-weighted data. This may be related to the differences in the dominant factors influencing particle shape variations for different-sized particles. In aeolian processes, particles finer than 100 μm, between 250 and 500 μm, and coarser than 500 μm move in suspension, saltation, and creep, respectively [33]. Among these three modes of movement, the coarse sand fraction moving by creep exhibits higher abrasion efficiency, while particles suspended in the air have very low collision energy, resulting in lower wear efficiency [34,35]. The differences in abrasion efficiency between different sand fractions are the primary factor controlling the AR, whereas within the same sand fraction, AR variations are more influenced by the distance of transport.
Although our number-weighted data demonstrates a progressive increase in CI, AR, and Cx values from fine to coarse sand fractions in beach and dune environments, shape–size relationships may be more complex under different sediment compositions, transport dynamics, depositional environments, and sources. Shang et al. [30] studied the particle shapes of loess and red clay with diameters ranging from 2 to 63 μm on the Loess Plateau, finding that CI, AR, and Cx all decrease with increasing grain size. However, a study on the grain shape variation of a 25 m thick sedimentary sequence with 19 different depositional facies in the Gran Dolina Cave of Spain revealed that [19] for terra rossa, debris flow, decantation, and autochthonous deposits, CI, Cx, and AR values increase gradually from fine sand to coarse sand; for weathered deposits, CI and Cx values decrease from fine sand to coarse sand, while AR shows the opposite trend; for channel deposits, CI and Cx values increase gradually from fine sand to coarse sand, while AR shows the opposite trend. Furthermore, Lira’s [31] results indicate that the CI decreases with increasing grain size for both dune sand and beach sand, which contradicts our findings. This contradiction is actually unsurprising, as differences in maturity, grain size composition, transport history, lithology, and hydrodynamic and wind conditions among different regions of sediments can lead to variations in the relationship between grain size and shape [17,36,37,38,39]. Moreover, Cheng et al. [20] observed that the relationship between the grain size and shape of sediments in Baoding Bay of China varies across different beach morphologies and at different locations within the same beach profile. They attributed this variation to differences in the interaction between abrasion and sorting characteristics of the grains under different hydrodynamic conditions and transport modes and argued that the grain size and shape trend curves can effectively indicate the sediment transport modes and improve the accuracy of sub-depositional environment identification [20]. These findings collectively underscore the complexity and variability of the relationship between grain size and shape and emphasize the need for region-specific studies to accurately interpret sedimentological data. Although our study provides valuable insights into the grain size–shape relationship in depositional environments, it also has certain limitations. This study focuses on lake beach and aeolian dune sediments around Poyang Lake, which may limit its direct applicability to other regions with different geographical and transport dynamics conditions. Additionally, our analysis is primarily centered on quartz-dominated (sand-sized) sediments; incorporating a more diverse mineral and particle composition, as well as sand sources, might yield different shape parameter responses.

4.2. Integrating Volume- and Number-Weighted Shape Data to Discriminate Sedimentary Environment

The primary factors influencing the shape of sediment particles generally encompass parent rock properties, transporting medium, transport history, and depositional environment [5,9,17]. Variations in the hardness and structure of parent rocks significantly affect particle shape: harder rocks (e.g., granite) typically yield angular particles resistant to rounding during transport, whereas laminated rocks (e.g., shale) tend to generate platy particles during weathering and erosion, with bedding orientation further influencing their shape characteristics [36]. The abrasion efficiency of particles varies markedly across different transporting agents, with aeolian processes exhibiting substantially higher abrasion rates compared to fluvial systems [28]. As transport distance increases, particles subjected to either aqueous or aeolian processes become progressively rounded [37,40]. These influencing factors constitute the intrinsic logic behind the widespread application of grain shape in the identification of depositional environments, provenance tracing, and reconstruction of transport history. However, distinguishing depositional environments where sand sources are mutually derived from each other such as aeolian-and-fluvial or aeolian-and-beach zones has always been highly challenging [26,31,41,42,43,44,45]. Hu et al. [13] compiled 217 published grain shape data samples from various sedimentary environments to comprehensively assess the applicability of grain shape discrimination for sedimentary settings; their results show that fluvial, desert dune, and coastal beach sand can be effectively distinguished by grain shape (based on volume weighting); in contrast, dune sand and beach sand around Poyang Lake exhibit identical grain shape features, and they cannot be well discriminated even based on principal component analysis. Similar results have also been observed in coastal dune-and-beach zone of Hainan Island [20]. They attribute this to the aeolian and fluvial interaction, which results in dunes and beach sands serving as mutual sources for each other [13].
However, our results show that based on number weighting (Figure 7a–c), bulk samples of beach sand could be effectively distinguished from those of dune sand. This result was unexpected. To verify the reliability of our findings, we collected grain shape data from beach and coastal dunes from Hainan Island [20], as well as typical desert dunes [26] and river sands from the Ganjiang River [27]. Based on volume weighting (Figure 7d,e), our results align with those of Hu et al. [13], demonstrating that river sand, desert sand, and coastal sand can be well distinguished, whereas coastal dunes and beach sands exhibit poor separability. In contrast, based on number weighting (Figure 7a–c), consistent with our observations for dune sands and beach sands around Poyang Lake, coastal dunes and beach sands are clearly distinguishable. Furthermore, Figure 7a–c show that beach sand from Poyang Lake falls within the region of Ganjiang River sand. Given that Poyang Lake is a river-communicating lake fed by the Ganjiang River, beach sand around Poyang Lake could be considered as fluvial sediment of the Ganjiang River, making it understandable that they exhibit similar grain shape characteristics. Although aeolian–fluvial interactions can indeed facilitate frequent material exchange between beach sands and dune sands, the mechanisms governing these interactions in humid zones differ fundamentally from those in arid or semi-arid regions. In semi-arid regions, aeolian and hydrological processes exhibit comparable dynamics [46], whereas the interactions of aeolian and fluvial processes are predominantly governed by hydrological processes in humid zones [41]. This would result in the grain shape signatures of beach sands being primarily characterized by hydrological process signals rather than aeolian modifications, even in environments where both processes coexist.
The inability of volume-weighted shape results to effectively differentiate beach sands from dune sands, in contrast to the clear distinction achieved based on number-weighted data (Figure 7a–f), may be attributed to the volume-weighted data’s bias toward coarse-grained fractions, leading to the loss or masking of signals from finer particles [2]. Due to their shorter transport distance, coarse particles (>500 μm) undergo relatively minor shape modification when transported by wind from the lake shore to form dunes on land. Conversely, fine grains (<250 μm), subjected to longer transport, exhibit significant shape alterations, thus making it easier to distinguish between beach sand and dune sand [29]. Regarding the significant difference in shape between beach sand and Ganjiang River sand based on volume weighting, two possible reasons may be highlighted: (1) grain size effects: beach sand has finer grain sizes compared to Ganjiang River sand; Hu et al.’s [27] studies indicate a downstream fining trend in Ganjiang River sediments, and our results further demonstrate that shape indices of CI, Sy, and Cx increase as grain size decreases (Figure 4); (2) transport history: beach sand is transported over longer distances than Ganjiang River sand, and coarse and medium sand fractions of Ganjiang River sand exhibit a clear trend of improvement in particle shape from upstream to downstream [27]. In contrast, the high similarity of grain shape between beach sand and river sand based on number weighting may be related to the hydrodynamic behavior of fine-grained fractions. Fine sands in fluvial systems are predominantly transported in suspension, a mode characterized by low abrasion efficiency [34]. As evidence by the result from Hu et al. [27] and Russel [47], they observed no significant downstream improvement in grain shape parameters of fine sand in the Ganjiang River and Mississippi River. Furthermore, due to the fact that fine sand particles are usually transported in suspension during fluvial transportation [48], while they are transported in saltation during aeolian process [33], the difference in wear efficiency between these two transport processes [29,35] may be the main reason why particle shape based on number-weighted data can effectively distinguish river sand/beach sand from dune sand. The contrasting performance between volume-weighted and number-weighted shape data highlights the importance of integrating both of them to accurately distinguish sedimentary environments in future studies.

5. Conclusions

The grain shape has proven to be an effective tool in distinguishing sedimentary environments. However, there is limited understanding regarding the variation in particle shape across different sand fractions and the discrepancies between particle shape data derived from volume and number weighting. This study systematically investigated grain shape variations across different sand-sized fractions in aeolian dune and beach environments around Poyang Lake, China, using dynamic image analysis (DIA). By integrating volume-weighted and number-weighted shape data, we established an optimized analytical framework to enhance sedimentary environment discrimination.
The key findings are as follows: (1) Coarse sand fractions (>500 μm) exhibited statistically distinct shape characteristics (p < 0.001) compared to fine (<250 μm) and medium (250–500 μm) fractions; these variations reflect differential abrasion and sorting mechanisms during sediment transport. (2) While volume-weighted shape data (biased toward coarse grains) failed to distinguish aeolian and beach sands, number-weighted results (biased toward fine grains) revealed significant differences in circularity, aspect ratio, and convexity between aeolian and beach sands, as fine sand particles are typically transported in suspension during fluvial processes and in saltation during aeolian processes.
Our study offers valuable insights into size–shape relationships in sedimentary environments, though it has certain limitations. The focus on lake beach and dune sediment around Poyang Lake may restrict its direct applicability to other regions with differing geological and hydrodynamic conditions. Furthermore, our analysis centered on quartz-dominated (sand-sized) sediments, and the inclusion of more diverse mineralogical compositions might yield different shape parameter responses. Despite these limitations, our research offers significant implications for sedimentary environment discrimination, especially through combination of volume-weighted and number-weighted shape data. These findings enhance our understanding of the size–shape relationship in sediment dynamics and highlight the importance of grain size fractionation in interpreting particle shape data.

Author Contributions

F.H.: Conceptualization, data curation, funding acquisition, resources, investigation, methodology, project administration, validation, visualization, writing—original draft, and writing—review and editing. X.X.: Investigation and writing—original draft. All authors have read and agreed to the published version of the manuscript.

Funding

The authors declare that financial support was received for the research, authorship, and/or publication of this article. This research was supported by the Natural Science Foundation of Jiangxi Province (20224BAB203032) and the National Natural Science Foundation of China (41801009).

Data Availability Statement

The raw data supporting the conclusions of this article will be made available by the authors, without undue reservation.

Acknowledgments

Heartfelt thanks are extended to Xiaoping Yang, Deguo Zhang, and Peng Liang from Zhejiang University for their help in particle size and shape measurement, and Jing Liang, Gan Luo, Mengting Cao, Yaning Zhou, Zhicai Xiao, and Yichen Li for their assistance during fieldwork.

Conflicts of Interest

The authors declare that the research was conducted in the absence of any commercial or financial relationships that could be construed as a potential conflict of interest.

References

  1. Krumbein, W.C. Measurement and geological significance of shape and roundness of sedimentary particles. J. Sediment. Petrol. 1941, 11, 64–72. [Google Scholar] [CrossRef]
  2. Li, L.; Iskander, M. Evaluation of Dynamic Image Analysis for Characterizing Granular Soils. Geotech. Test. J. 2019, 43, 20190137. [Google Scholar] [CrossRef]
  3. Zhang, S.; Dai, H. Effect of diamond grain shape on gallium nitride nano-grinding process. Mater. Sci. Semicond. Process. 2024, 171, 108034. [Google Scholar] [CrossRef]
  4. Deal, E.; Venditti, J.G.; Benavides, S.J.; Bradley, R.; Zhang, Q.; Kamrin, K.; Perron, J.T. Grain shape effects in bed load sediment transport. Nature 2023, 613, 298–302. [Google Scholar] [CrossRef] [PubMed]
  5. Gresina, F.; Farkas, B.; Fábián, S.Á.; Szalai, Z.; Varga, G. Morphological analysis of mineral grains from different sedimentary environments using automated static image analysis. Sediment. Geol. 2023, 455, 106479. [Google Scholar] [CrossRef]
  6. Szabó, T.; Domokos, G.; Grotzinger, J.P.; Jerolmack, D.J. Reconstructing the transport history of pebbles on Mars. Nat. Commun. 2015, 6, 8366. [Google Scholar] [CrossRef]
  7. Cho, G.C.; Dodds, J.; Santamarina, J.C. Particle shape effects on packing density, stiffness, and strength: Natural and crushed sands. J. Geotech. Geoenviron. Eng. 2006, 132, 105602. [Google Scholar] [CrossRef]
  8. Liu, F.Y.; Ying, M.J.; Yuan, G.H.; Wang, J.; Gao, Z.Y.; Ni, J.F. Particle shape effects on the cyclic shear behaviour of the soil-geogrid interface. Geotext. Geomembr. 2021, 49, 991–1003. [Google Scholar] [CrossRef]
  9. Liang, P.; Yang, X. Grain Shape Evolution of Sand-Sized Sediments During Transport From Mountains to Dune Fields. J. Geophys. Res. Earth Surf. 2023, 128, e2022JF006930. [Google Scholar] [CrossRef]
  10. Cox, E. A method of assigning numerical and percentage values to the degree of roundness of sand grains. J. Paleontol. 1927, 1, 179–183. [Google Scholar]
  11. Powers, M.C. A New Roundness Scale for Sedimentary Particles. J. Sediment. Res. 1953, 23, 117–119. [Google Scholar] [CrossRef]
  12. Riley, N.A. Projection sphericity. J. Sediment. Res. 1941, 11, 94–97. [Google Scholar] [CrossRef]
  13. Hu, F.; Xiao, X.; Fan, Q.; Yu, L.; Xu, Y.; Feng, Y.; Zhou, Y.; Yu, M. Grain size and shape analysis of recent and paleo sediments along Poyang Lake with insight into its environmental significance. Catena 2025, 248, 108588. [Google Scholar] [CrossRef]
  14. Li, L.; Beemer, R.D.; Iskander, M. Granulometry of Two Marine Calcareous Sands. J. Geotech. Geoenviron. Eng. 2021, 147, 20190137. [Google Scholar] [CrossRef]
  15. Liu, B.; Cen, W.; Yan, G.; Scheuermann, A.; Zheng, C.; Zhang, P. Particle shape effects on breakage behaviors in granular materials: A multiscale geotechnical perspective. Comput. Geotech. 2025, 187, 107504. [Google Scholar] [CrossRef]
  16. Maroof, M.A.; Mahboubi, A.; Noorzad, A.; Safi, Y. A new approach to particle shape classification of granular materials. Transp. Geotech. 2020, 22, 100296. [Google Scholar] [CrossRef]
  17. Chmielowska, D.; Woronko, B.; Dorocki, S. Applicability of automatic image analysis in quartz-grain shape discrimination for sedimentary setting reconstruction. Catena 2021, 207, 105602. [Google Scholar] [CrossRef]
  18. Li, D.; Kang, Y.; Li, D. Comparison of grain-size and grain-shape characters of alluvial and lakeshore sands based on dynamic image analysis. Quat. Sci. 2015, 25, 484–492, (In Chinese with English Abstract). [Google Scholar] [CrossRef]
  19. Campaña, I.; Benito-Calvo, A.; Pérez-González, A.; Bermúdez De Castro, J.M.; Carbonell, E. Assessing automated image analysis of sand grain shape to identify sedimentary facies, Gran Dolina archaeological site (Burgos, Spain). Sediment. Geol. 2016, 346, 72–83. [Google Scholar] [CrossRef]
  20. Cheng, W.; Chen, S.; Zhu, J.; Zhong, X.; Hu, J.; Guo, J. Identification of the Sediment Movement Mechanism via Grain Size and Shape: A Case Study of a Beach in Eastern Hainan Island in South China. Water 2023, 15, 3637. [Google Scholar] [CrossRef]
  21. Gale, S. The shape of fluvial gravels; insights from Fiji’s Sabeto River. Geosciences 2021, 11, 161. [Google Scholar] [CrossRef]
  22. Zhang, Q. Study on the Changes of Hydrological Situation in Poyang Lake; Science Press: Beijing, China, 2018. [Google Scholar]
  23. Han, Z.; Li, X.; Zhang, Z. Genesis of ridge like landform on sand hill on the shore of the Poyang Lake. Acta Geogr. Sin. 2010, 65, 331–338, (In Chinese with English Abstract). [Google Scholar] [CrossRef]
  24. Liu, J.; Wu, X.H.; Li, S.Q.; Zhang, M.S. The last glacial stratigraphic sequence, depositional environment and climatic fluctuations from the aeolian sand dune in Hongguang, Pengze, Jiangxi (China). Quat. Sci. Rev. 1997, 16, 535–546. [Google Scholar] [CrossRef]
  25. Fryberger, S.G. Dune forms and wind regime. In A Study of Global Sand Seas; McKee, E.D., Ed.; Professional Paper, 1052; United States Government Printing Office: Washington, DC, USA, 1979; pp. 137–169. [Google Scholar]
  26. Hu, F.; Jianhui, J.; Xie, M.; Xiao, Z.; Cao, M.; Zhou, Y.; Liang, J. Insights into the age and genesis of the clay dunes in the Suhongtu Basin, Alashan Plateau, China. Geomorphology 2022, 408, 108241. [Google Scholar] [CrossRef]
  27. Hu, F. Downstream Fining and Rounding in Sand-Bed River and Its Significance: A Case Study from the Ganjiang River, China; Mendeley Data, V1; 2025. Available online: https://data.mendeley.com/datasets/kc9ymdt8fm/1 (accessed on 23 October 2025).
  28. Bui, E.N.; Mazzullo, J. Using quartz grain size and shape analysis to distinguish between Aeolian and fluvial deposits in the Dallol Bosso of Niger (West Africa). Earth Surf. Process. Landf. 1989, 14, 157–166. [Google Scholar] [CrossRef]
  29. Mazzullo, J.; Sims, D.; Cunningham, D. The effects of eolian sorting and abrasion upon the shapes of fine quartz sand grains. J. Sediment. Petrol. 1986, 56, 45–56. [Google Scholar] [CrossRef]
  30. Shang, Y.; Kaakinen, A.; Beets, C.J.; Prins, M.A. Aeolian silt transport processes as fingerprinted by dynamic image analysis of the grain size and shape characteristics of Chinese loess and Red Clay deposits. Sediment. Geol. 2018, 375, 36–48. [Google Scholar] [CrossRef]
  31. Lira, C.; Pina, P. Automated Grain Shape Measurements Applied to Beach Sands. J. Coast. Res. 2009, SI, 1527. [Google Scholar]
  32. Patro, B.; Sahu, B. Factor analysis of sphericity and roundness data of clastic quartz grains: Environmental significance. Sediment. Geol. 1974, 11, 59–78. [Google Scholar] [CrossRef]
  33. Livingstone, I.; Warren, A. Aeolian Geomorphology; John Wiley & Sons Ltd.: Hoboken, NJ, USA, 1996. [Google Scholar]
  34. Frings, R.M. Downstream fining in large sand-bed rivers. Earth-Sci. Rev. 2008, 87, 39–60. [Google Scholar] [CrossRef]
  35. Krumbein, W.C. The Effects of Abrasion on the Size, Shape and Roundness of Rock Fragments. J. Geol. 1941, 49, 482–520. [Google Scholar] [CrossRef]
  36. Bray, E.N.; Litwin Miller, K.; Cardona, M.; Pettyjohn, S.; Sklar, L.S. Influence of particle lithology, size and angularity on rates and products of bedload wear: An experimental study. Earth Surf. Process. Landf. 2024, 49, 4972–4990. [Google Scholar] [CrossRef]
  37. Domokos, G.; Gibbons, G.W. The evolution of pebble size and shape in space and time. Proc. R. Soc. A 2012, 468, 3059–3079. [Google Scholar] [CrossRef]
  38. Lindsey, D.A.; Langer, W.H.; Van Gosen, B.S. Using pebble lithology and roundness to interpret gravel provenance in piedmont fluvial systems of the Rocky Mountains, USA. Sediment. Geol. 2007, 199, 223–232. [Google Scholar] [CrossRef]
  39. Litty, C.; Schlunegger, F. Controls on Pebbles’ Size and Shape in Streams of the Swiss Alps. J. Geol. 2017, 125, 101–112. [Google Scholar] [CrossRef]
  40. Mazzullo, J.; Alexander, A.; Tieh, T.; Menglin, D. The effects of wind transport on the shapes of quartz silt grains. J. Sediment. Petrol. 1992, 62, 961–971. [Google Scholar] [CrossRef]
  41. Liang, W.; Hu, X.; Garzanti, E.; Dong, X.; Zhang, Y. Fluvial-Aeolian Interaction and Compositional Variability in the River-Fed Yarlung Tsangpo Dune System (Southern Tibet). J. Geophys. Res. Earth Surf. 2023, 128, e2022JF006920. [Google Scholar] [CrossRef]
  42. Mason, C.C.; Folk, R.L. Differentiation of beach, dune, and aeolian flat environments by size analysis, Mustang Island, Texas. J. Sediment. Petrol. 1958, 28, 211–226. [Google Scholar] [CrossRef]
  43. Shepard, F.P.; Manar, R.Y.; Young, R. Distinguishing between beach and dune sands. J. Sediment. Petrol. 1961, 31, 196–214. [Google Scholar] [CrossRef]
  44. Vincent, P. Variation in particle size distribution on the beach and windward side of a large coastal dune, southyest France. Sediment. Geol. 1996, 103, 273–280. [Google Scholar] [CrossRef]
  45. Saha, K.; Sinha, S. Distinguishing depositional environments in the beach–dune system of Chandipur, India, based on sediment texture and quartz grain surface features. Earth Surf. Process. Landf. 2023, 48, 1251–1266. [Google Scholar] [CrossRef]
  46. Liu, B.; Coulthard, T.J. Mapping the interactions between rivers and sand dunes: Implications for fluvial and aeolian geomorphology. Geomorphology 2015, 231, 246–257. [Google Scholar] [CrossRef]
  47. Russell, R.D.; Taylor, R.E. Roundness and shape of Mississippi River sands. J. Geol. 1937, 45, 225–267. [Google Scholar] [CrossRef]
  48. Dong, Y. Review on 10 Groups of Demarcating Grain Sizes of River Sediment. J. Yangtze River Sci. Res. Inst. 2018, 35, 1–7. [Google Scholar]
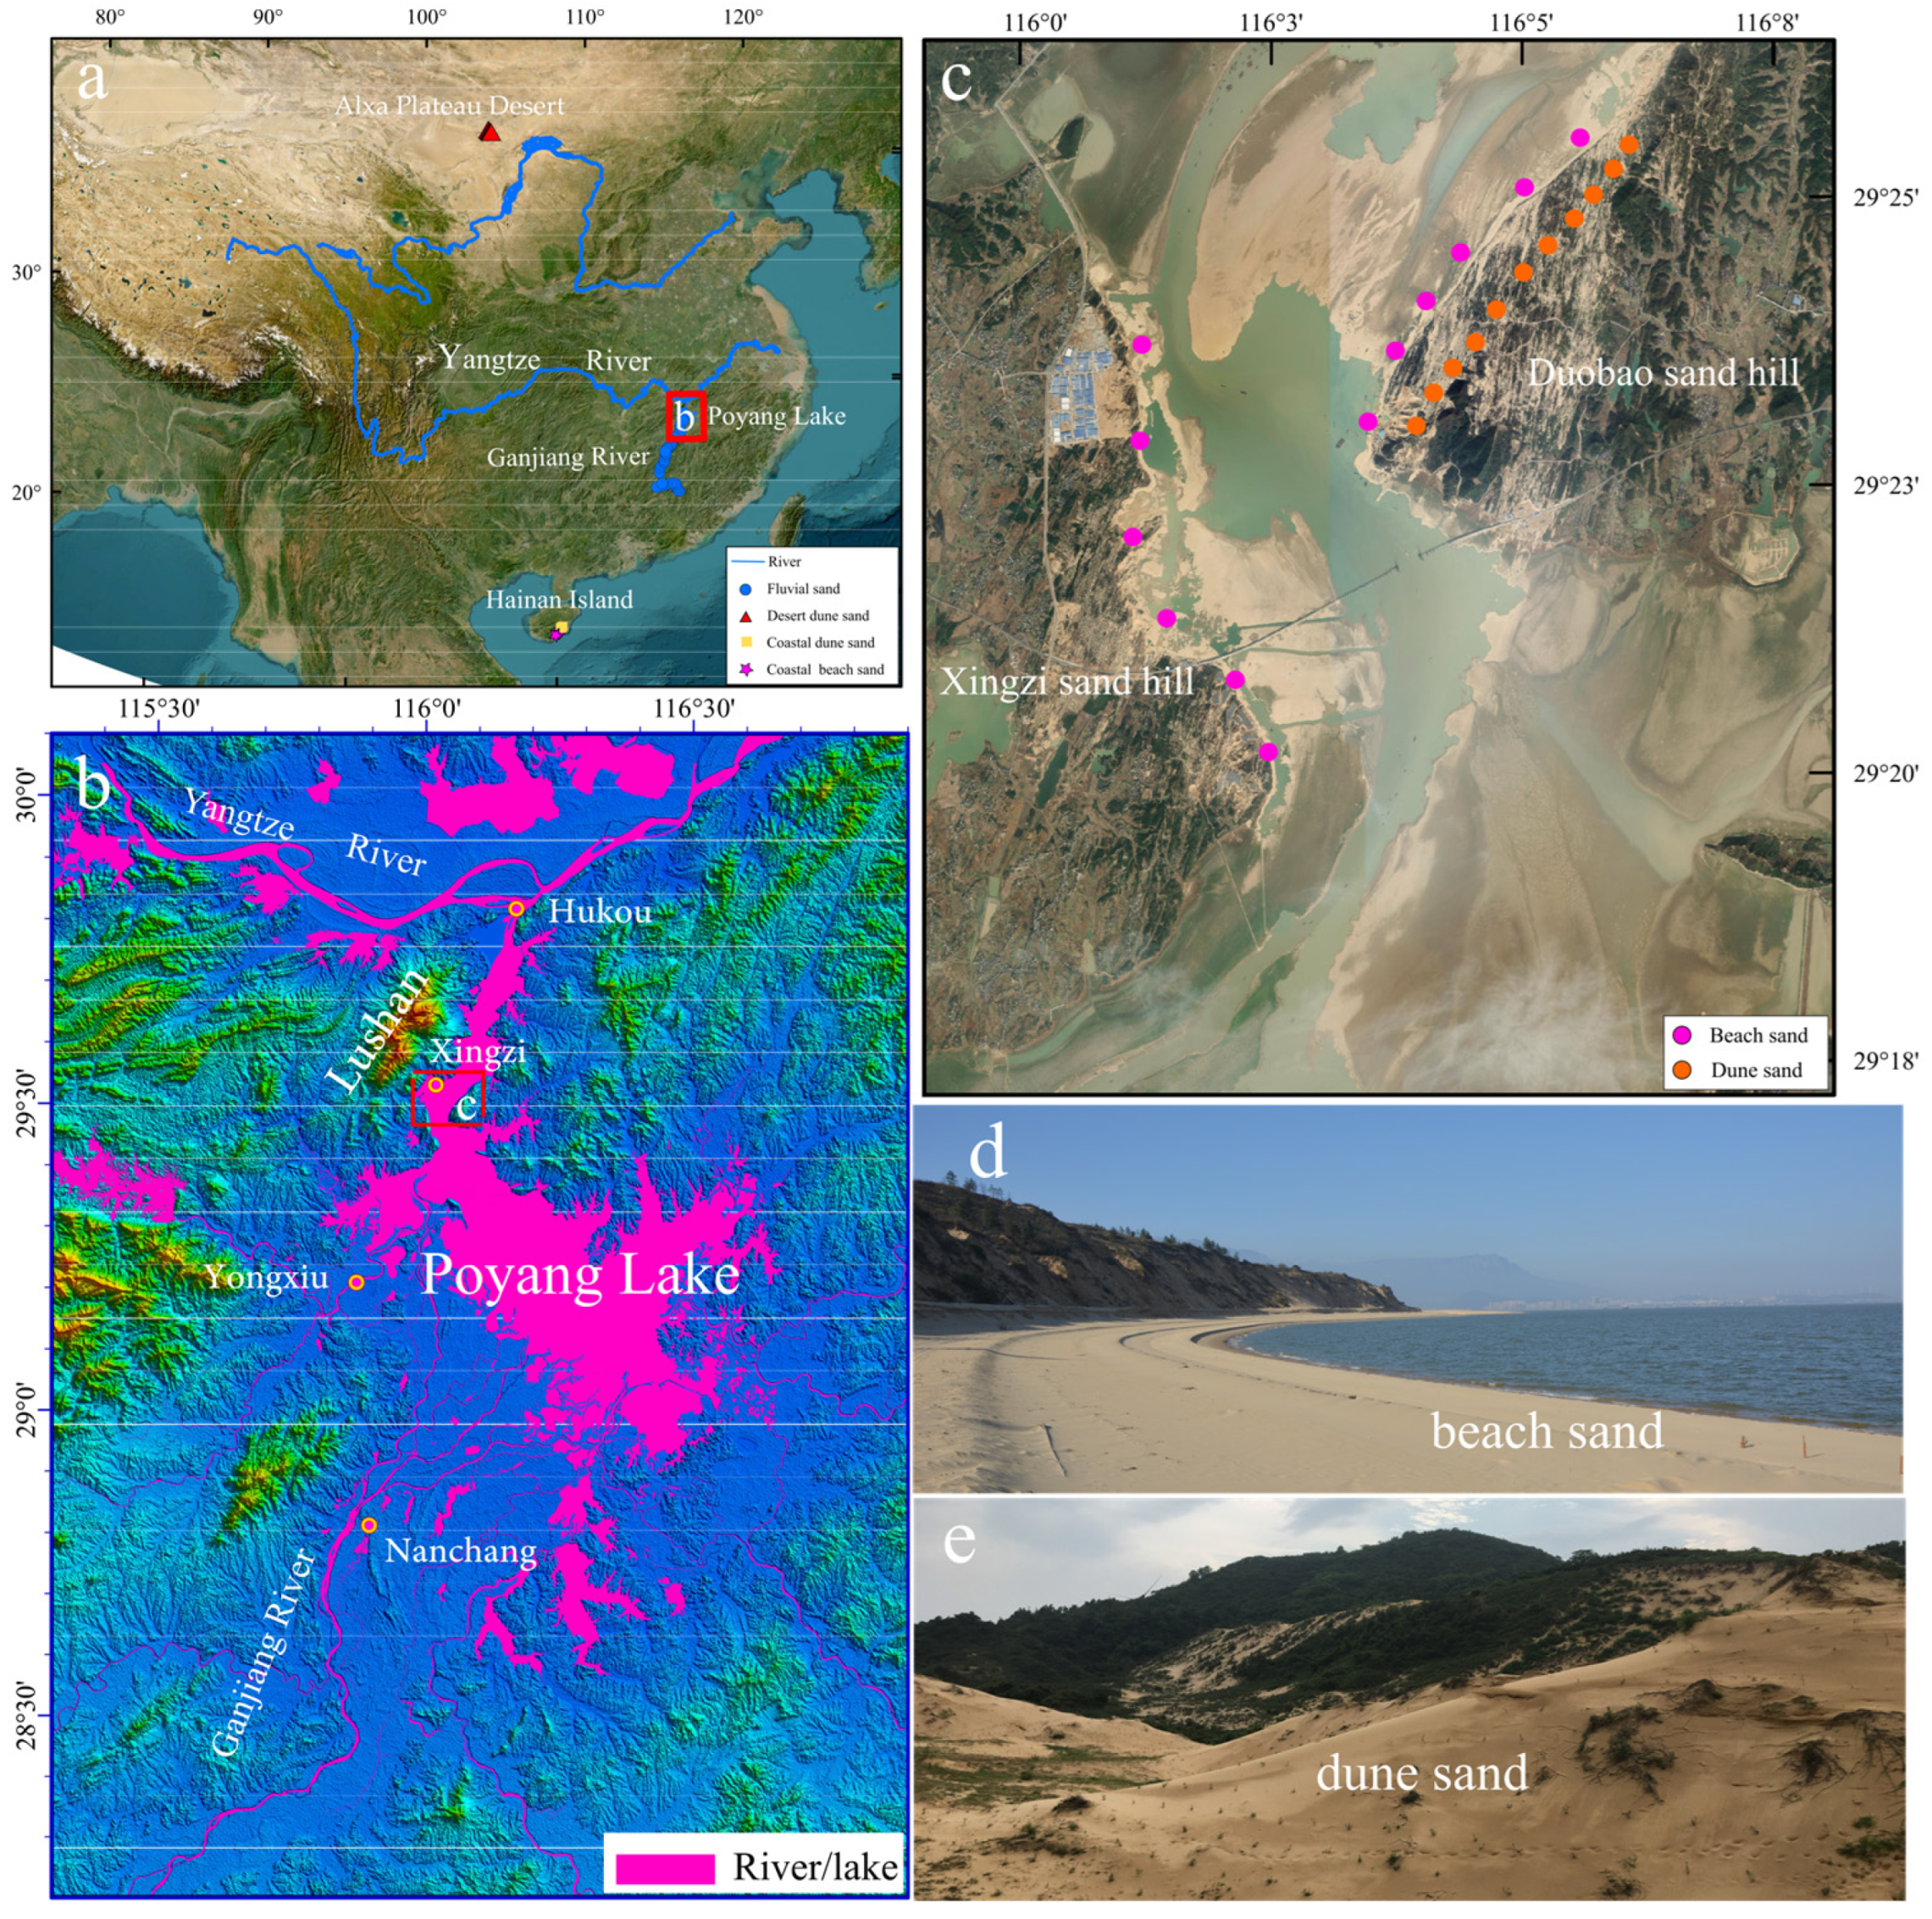
Figure 1. Geomorphic and hydrologic context of the study area. (a) Geomorphic location of the study area and location of published grain shape data from different sedimentary environments referenced in this study; (bd) sampling locations and related geomorphic and hydrologic settings (DEM data from https://www.gscloud.cn/sources/accessdata/306?pid=302 (accessed on 21 January 2025), image data from ESRI); (d) beach sand at Poyang Lake; (e) aeolian dune sand from Duobao sand hill.
Geosciences 15 00412 g001
Figure 2. The extracted outline of some particles for aeolian sand sample DS-11 with particle shape and size parameters. All the particle size and shape analysis was performed using the Particle X-Plorer software based on the captured images by the dual camera.
Geosciences 15 00412 g002
Figure 3. Comparison of grain size and shape distribution among different sediments and different size fractions. (ac) Grain size distributions; (dg) grain shape distributions of beach sand; (h,i) grain shape distributions of dune sand. BSF, BSM, BSC, and BSB are fine, medium, and coarse sand fractions, and bulk sample of beach sand, respectively; DSF, DSM, DSC, and DSB are fine, medium, and coarse sand fractions, and bulk sample of dune sand, respectively.
Geosciences 15 00412 g003
Figure 4. Box plots showing the differences among the three different sand fractions and bulk sample in the grain shape of lake beach sand (a) and dune sand (b), based on the volume-weighted data. F = fine sand fraction; M = medium sand fraction; C = coarse sand fraction; B = bulk sample.
Geosciences 15 00412 g004
Figure 5. Box plots showing the differences among the three different sand fractions and bulk sample in the grain shape of lake beach sand (a) and dune sand (b), based on volume weighting of the data. F = fine sand fraction; M = medium sand fraction; C = coarse sand fraction; B = bulk sample.
Geosciences 15 00412 g005
Figure 6. Box plots showing the grain shape difference between beach and dune sand in the three sand fractions and bulk sample. (ad) Grain shape result based on volume weighting of data; (eh) grain shape result based on number weighting of data. F = fine sand fraction; M = medium sand fraction; C = coarse sand fraction; B = bulk sample.
Geosciences 15 00412 g006
Figure 7. Bivariate diagrams of grain shape in bulk samples showing the discrimination of various sedimentary environments. (ac) Grain shape result based on number weighting of data; (df) grain shape result based on volume weighting of data. BS = beach sand around Poyang Lake; DS = dune sand around Poyang Lake; FLS = Ganjiang River sand (data from [27]); DDS = desert dune sand (data from [26]); CDS = coastal dune sand (data from [20]); CBS = coastal beach sand (data from [20]).
Geosciences 15 00412 g007
Table 1. The average shape values and standard deviations of the three sand fractions and bulk sample of beach sand and sand dune sand, based on the volume and number weighting of the data.
Based on the Volume Weighting of the Data
FractionCIsdSysdARsdCxsd
BSF0.8780.00730.8920.00300.6960.00860.9940.0007
DSF0.8810.00280.8930.00090.6970.00360.9950.0004
BSM0.8670.00810.8920.00250.6960.00640.9920.0012
DSM0.8730.00260.8940.00100.6990.00290.9930.0004
BSC0.8590.02280.8960.00530.7100.01100.9890.0033
DSC0.8750.00570.9010.00270.7150.00530.9910.0009
BSB0.8680.01110.8950.00300.6990.00770.9920.0017
DSB0.8750.00310.8980.00200.7020.00480.9930.0005
Based on the number weighting of the data
BSF0.9180.00380.8890.00150.7140.00490.9980.0000
DSF0.9290.00150.8880.00080.7240.00340.9980.0004
BSM0.9230.00410.8880.00130.7170.00480.9980.0003
DSM0.9320.00160.8880.00090.7260.00190.9990.0000
BSC0.9230.00590.8870.00390.7170.00740.9983.0000
DSC0.9330.00220.8870.00070.7280.00250.9990.0005
BSB0.9200.00610.8880.00210.7180.00670.9980.0003
DSB0.9310.00160.8880.00120.7260.00200.9990.0003
Disclaimer/Publisher’s Note: The statements, opinions and data contained in all publications are solely those of the individual author(s) and contributor(s) and not of MDPI and/or the editor(s). MDPI and/or the editor(s) disclaim responsibility for any injury to people or property resulting from any ideas, methods, instructions or products referred to in the content.