Abstract
Geomagnetic storms can severely disturb the ionosphere, degrading Global Navigation Satellite System (GNSS) performance, particularly at low latitudes. The 10 May 2024 superstorm produced a strong ionospheric response across Mexico, with well-defined positive and negative phases observed at all analyzed stations. The proximity in time of %dTEC peaks to the second and third steps of the storm’s main phase, together with their local time dependence, indicates that Prompt Penetration Electric Fields (PPEFs) dominated the initial positive phase on the dayside. These eastward electric fields uplifted the F-region plasma, enhancing TEC values—especially at northern stations, where increases reached ±180%. In contrast, the subsequent nighttime depletion and extended recovery were mainly driven by composition-related plasma loss and enhanced recombination. A suppression of TEC followed the positive phase, with depletions between −58% and −77%, showing a persistent latitudinal gradient. Low-cost GNSS receivers successfully captured these ionospheric signatures but exhibited higher positioning degradation—up to 50% greater than geodetic-grade receivers. Multi-constellation Precise Point Positioning (PPP) mitigated these effects, reducing 3D errors by up to 23% and 53% in geodetic and low-cost receivers, respectively. These findings reveal the day–night dependence of ionospheric storm phases and underscore the importance of regional multi-GNSS monitoring during extreme space weather.
1. Introduction
Geomagnetic storms are large-scale disturbances in the Earth’s magnetosphere triggered by interactions between solar wind structures, interplanetary shocks, and the terrestrial magnetic field [1,2]. These storms inject significant energy and momentum into the upper atmosphere, altering thermospheric and ionospheric dynamics. As a result, the ionosphere can undergo major restructuring, producing irregularities in electron density, modifications of the Equatorial Ionization Anomaly (EIA), and Traveling Ionospheric Disturbances (TIDs) [3]. Such changes can disrupt critical technological systems, including power grids, satellite communications, and, importantly, satellite-based positioning and navigation [4].
On 10 May 2024, an exceptionally strong geomagnetic storm—commonly referred to as the Mother’s Day superstorm—impacted Earth. This event, driven by multiple Coronal Mass Ejections (CMEs) associated with solar active region AR3664, reached a minimum Dst index of −412 nT and a Sym-H index below −500 nT [5,6,7,8]. The Kp index peaked at 9, confirming G5-level conditions (NOAA/SWPC, 2024). These values make it the most intense storm since the 2003 Halloween storms and the second strongest of the space age after March 1989 [9,10,11]. The storm produced auroras visible at latitudes as low as 20–25° N, including reports from Mexico, highlighting the electrodynamic coupling between the solar wind, magnetosphere, and ionosphere [11]. In specific, the storm was characterized by a Sudden Impulse (SI+) of +88 nT at 17:15 UT, followed by a three-step storm main-phase development lasting approximately nine hours. The first, second, and third main-phase minima in the SYM-H index reached −183 nT, −354 nT, and −518 nT at 19:21 UT, 23:12 UT (10 May), and 02:14 UT (11 May), respectively. Each main-phase step was associated with intensified southward interplanetary magnetic field components and strong magnetosonic compressions within the interplanetary sheath [12,13].
During its main phase, the ionosphere exhibited a strong positive response, with Total Electron Content (TEC) enhancements exceeding 100% over the American longitudinal sector [5]. Poleward expansion of the EIA crests and “super-fountain” effects were reported, lifting plasma to atypical latitudes and altitudes [14,15]. In the subsequent negative phase, significant TEC depletions occurred, consistent with storm-time changes in thermospheric composition and electrodynamics [16]. Such behavior has been observed worldwide, but impacts in the Americas were particularly severe [17].
In the case of Mexico, magnetometers recorded large geomagnetic fluctuations, while GNSS observations showed marked TEC disturbances [10]. Auroras at unusually low latitudes and reports of Geomagnetically Induced Currents (GICs) further confirmed the severity of this event [18]. Given that a variation of 1 TECU can cause up to 0.16 m of error in single-frequency GNSS positioning, the strong storm-time deviations significantly degraded navigation accuracy. This is particularly relevant for civilian applications, where low-cost GNSS receivers are increasingly used in agriculture, drones, and transportation.
Furthermore, it is well known that geomagnetic storms have a severe impact on GNSS positioning due to irregularities in electron density, which cause signal scintillation and generate frequent carrier-phase cycle slips [19,20,21,22]. In recent years, the impact of geomagnetic storms on GNSS positioning has been evaluated through the kinematic Precise Point Positioning (PPP) method [22,23,24,25,26].
Jacobsen and Andalsvik [22], studied the impact of the 2015 St. Patrick’s Day storm on positioning using RTK (Real-Time Kinematic) and PPP techniques in Norway, the first severe storm of solar cycle 24 on the NOAA scale. They reported that PPP was more accurate than RTK in the vertical component during the storm, with errors at the centimeter level. Luo et al. [23] evaluated the performance of dual-frequency GPS PPP during moderate, intense, and superstorms using nearly 500 GPS stations from the IGS (International GNSS Service) distributed worldwide. They found three-dimensional (3D) Root Mean Square Error (RMSE) values for PPP-GPS at high latitudes, in moderate, intense, and superstorms of 0.393 m, 0.680, and 1.051 m, respectively. Meanwhile, mid- and low-latitude stations showed smaller error variations (<0.320 m).
Further studies have analyzed PPP-Multi GNSS performance in kinematic mode during different storms using up to 5500 GNSS stations, with the goal of identifying PPP degradation at different latitudes [25,27,28]. The extreme geomagnetic storm of 10 May 2024 has been recognized as an extraordinary case due to its intensity and broad latitudinal impact. Danilchuk et al. [29] reported that during its main phase, PPP-GPS 3D positioning errors increased 1.5 to 5 times, reaching up to 1.5 m, with significant error propagation to midlatitudes (~30° N). Similarly, ref. [30] focused their study on mid-latitudes affected by the same storm (10 May 2024) and reported that frequent ambiguity resets occurred during processing, leading to a decrease in the percentage of resolved ambiguities.
Recently, ref. [26] conducted a comprehensive study of the 10 May 2024 geomagnetic storm in low, mid, and high-latitude regions. They evaluated the performance of multi-GNSS PPPs before and during the storm using over 1800 GNSS stations distributed around the world. They considered 4 GNSS combinations (GPS only, GPS + Galileo, GPS + GLONASS, GPS + GLONASS + Galileo) and analyzed the performance of each as a strategy to mitigate the effects of the storm on positioning. Their conclusions highlight two important findings; the first corresponds to the strong dependence between latitude and positioning errors, where GNSS stations at high latitudes have had the greatest impact on precision degradation. The second corresponds to the reduction in errors between 41% and 52% when using the GPS + GLONASS + Galileo combination compared to GPS-only solutions, demonstrating that multi-GNSS combinations can reduce the error in positioning.
While previous studies have advanced global knowledge of PPP performance during geomagnetic storms, they generally lack regional-scale multi-GNSS evaluations, do not incorporate higher-order ionospheric corrections, and often exclude the BeiDou constellation. In addition, the performance of low-cost GNSS receivers and antennas under extreme space weather conditions remains poorly understood. To address these gaps, the present study analyzes the ionospheric and GNSS positioning response to the 10 May 2024 superstorm across low-latitude Mexico and the Dominican Republic. Using both geodetic-grade and low-cost GNSS receivers, Vertical Total Electron Content (VTEC) deviations were evaluated. Furthermore, the degradation in positioning accuracy using multi-GNSS PPP solutions that incorporate second-order ionospheric corrections were quantified. This dual perspective provides new insight into the regional ionospheric impacts of an extreme geomagnetic storm and highlights the vulnerability of low-cost systems, while assessing the potential of multi-GNSS strategies to mitigate positioning errors during severe space weather events.
2. Data and Methodology
This section describes the datasets used in this study. In addition, the processing strategies of GNSS datasets for the calculation of TEC and PPP are presented.
2.1. GNSS Data
To evaluate the impact of the 10 May 2024, geomagnetic storm on positioning, dual-frequency GNSS observations from 71 permanent stations geographically distributed in Mexico were used, as illustrated in Figure 1. Permanent stations are part of open access GNSS networks such as the National Institute of Statistics and Geography (INEGI, acronyms in Spanish), the IGS, the EarthScope Consortium (formerly UNAVCO), and the Continuously Operating Reference Stations (CORS) network. Because the permanent stations have different measurement configurations, the GNSS data were standardized only to the GPS constellation with a sampling frequency of 30 s using GFZRNX v1.13 software [31]. Furthermore, to assess the effects of the geomagnetic storm on positioning in more detail, only GPS constellation observations were used since it is well known that multi-GNSS measurements help mitigate the effects of the ionosphere on positioning [26]. To characterize the ionospheric disturbances and their effect on positioning before and after the geomagnetic storm, GNSS data were downloaded from 5 to 15 May (11 days) for the 71 stations.
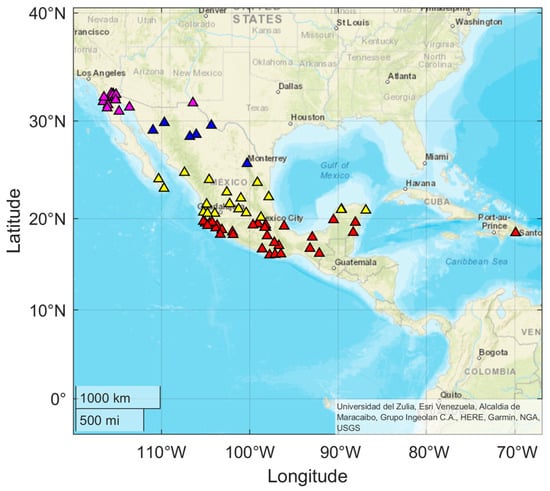
Figure 1.
Geographic distribution of GNSS stations analyzed across Mexico and the Dominican Republic. Stations are color-coded by latitude: northern (magenta and blue), central (yellow), and southern (red) regions.
On the other hand, to evaluate the GNSS positioning performance of a low-cost receiver during the geomagnetic storm, GNSS observations acquired by a permanent station composed of the u-blox ZED-F9P receiver and the TOPGNSS antenna were used; readers are referred to [32] for further technical details. The ZED-F9P receiver is capable of acquiring dual-frequency code and phase multi-constellation observations. The low-cost permanent station is located in the Dominican Republic, as illustrated in Figure 1. Also, a nearby IGS GNSS station was used as a reference for the evaluation of the low-cost receiver. The stations analyzed in the Dominican Republic are located at the same latitudes as the stations evaluated in Mexico.
2.2. TEC Calculation
TEC is widely recognized as a reliable indicator of ionospheric variability, expressed in TEC units (TECU), where 1 TECU corresponds to electrons per square meter. In this study, VTEC was derived using the IONOLAB-TEC v1.41 software https://www.ionolab.org/ (accessed on 16 June 2025), which implements the Reg-Est algorithm [33,34,35]. This method processes dual-frequency GNSS observations at high temporal resolution by converting slant TEC measurements from satellites above a 10° elevation mask into vertical TEC values. The algorithm applies a least-squares approach combined with a high-pass filter, enabling the extraction of both long-term variations and rapid fluctuations of the ionosphere. This procedure provides robust VTEC estimates under a wide range of geomagnetic and geographic conditions.
GNSS data were processed with a temporal resolution of 15 s. The geographic distribution and coordinates of the analyzed stations are visualized in Figure 1 and Table 1, respectively. To quantify storm-time disturbances, the percentage deviation in TEC (%dTEC) was calculated relative to a 27-day median reference, which represents quiet-time ionospheric behavior [36]. Only stations with sufficient continuous data to fully cover the 27-day reference window were included to ensure a consistent and reliable baseline. The computation follows:
where is the observed value and is the 27-day median at the same time.

Table 1.
%dTEC values during the 10 May 2024, geomagnetic storm across analyzed GNSS stations, with corresponding geographic coordinates. PPD = Positive Phase Duration, NPD = Negative Phase Duration. Durations are given in decimal hours (UT). For reference, 0–12 UT = local nighttime, 12–24 UT = local daytime.
The Disturbance Storm Time (Dst) index, an established global measure of storm intensity, was obtained from the OMNIWeb Data Explorer service (https://omniweb.gsfc.nasa.gov/form/dx1.html, accessed on 27 June 2025) to contextualize the ionospheric response during the geomagnetic superstorm (Figure 2).
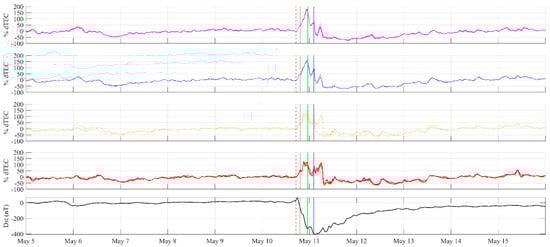
Figure 2.
Percentage deviation of the Vertical Total Electron Content (%dTEC) from 5 to 15 May 2024 at four regional clusters of GNSS stations in Mexico (northern in magenta and blue, central in yellow, and southern in red). The bottom panel shows the Dst index as a reference for geomagnetic activity. The black dashed line indicates the storm’s onset time at 17:15 UT on 10 May. The storm’s main phases (MP) are indicated as vertical lines at 19:21 UT on 10 May (red, MP1), 23:12 UT on 10 May (green, MP2), and 02:14 UT on 11 May (blue, MP3). For reference: 0–12 UT = local nighttime; 12–24 UT = local daytime.
For the stations in the Dominican Republic, GNSS data in Receiver INdependent EXchange (RINEX) format were processed using the GPS-TEC analysis software developed by Seemala [37]. This tool converts RINEX observations into VTEC estimates, applying its own bias correction and mapping functions. Given that IONOLAB v1.41 and Seemala’s software apply different approaches to handle instrumental biases and ionospheric mapping, direct numerical comparisons must be interpreted with caution. While both methods capture storm-time variability, software-related processing differences may contribute to discrepancies in absolute TEC values.
The 10 May 2024, superstorm produced strong positive ionospheric enhancements over both Mexico and the Dominican Republic primarily due to local dayside Prompt Penetration Electric Fields (PPEFs), which uplifted the F-region plasma to higher altitudes and latitudes under sunlit conditions.
In this work, results from each software package are presented to highlight regional storm-time impacts, acknowledging that part of the observed differences may arise from the distinct processing strategies applied.
2.3. Kinematic PPP-GNSS Processing Strategies
Precise Point Positioning (PPP) is an absolute method of GNSS positioning in which baselines are not analyzed as in the relative method and only a receiver is required to obtain coordinates of a point [38]. PPP was proposed by [39] and improved by [40]. The PPP technique requires various precise products to achieve high precision, these products being: precise ephemerides, corrections to the satellite and receiver clocks, hardware biases and delay, atmospheric parameters, antenna calibration parameters, among others [41,42]. The PPP technique typically has two processing modes: static and kinematic. PPP in static mode assumes that the receiver’s position is constant over time, while kinematic mode estimates the position per epoch, considering the receiver in motion [43]. Because PPP-static mode mitigates the impact of geomagnetic storms, it was not considered in this study for evaluation [23]. On the other hand, PPP-kinematic can detect precise degradation caused by TEC variations during geomagnetic storms because it estimates positioning in each measurement epoch independent of the previous epoch [24].
The phase and code observations of the dataset from 5 to 15 May 2024 corresponding to the 73 GNSS stations, including the low-cost one, were processed in the scientific software RIDE-PPPAR v2.2 [44] in kinematic mode. This tool was selected due to its ability to resolve ambiguities and mitigate most of the error sources that affect the PPP-AR method in order to relate possible positioning errors to the behavior of the ionosphere and not to other sources of error. In addition, the software has proven to be a high-performance software compared to other open-source software and online PPP processing platforms [45]. The GNSS data-processing strategy is summarized in Table 2. The precise products from the CODE analysis center were selected because they present greater positioning performance compared to other analysis centers [46].
On the other hand, since the low-cost GNSS antenna does not have calibration parameters, it was necessary to estimate them from the strategy proposed by [47] and the antenna of the IGS station located in the Dominican Republic was used for relative calibration due to its short separation distance [47,48]. The calibration parameters for the low-cost antenna were added to the igs20_2309.atx file for reading by the software. In this study, the ionosphere-free linear combination technique was used to mitigate the first-order term of ionospheric refraction [24,49,50].
Table 2.
Data-processing strategies of PRIDE-PPPAR [44].
Table 2.
Data-processing strategies of PRIDE-PPPAR [44].
| Item | Strategy |
|---|---|
| GNSS | GPS |
| Positioning mode | PPP Kinematic |
| Observation types | Code + Carrier-phase |
| Frequencies | GPS L1 and L2 |
| Sampling interval | 30 s |
| Elevation mask angle | 12° |
| Satellite orbit and clock | CODE precise ephemeris and precise clock files |
| Troposphere delays | Saastamoinen model [51] and Global Mapping Function (GMF) |
| Ionosphere delays | First-order delays eliminated in the ionosphere-free combination |
| Tidal displacements | Solid/Ocean/Pole corrected |
| Satellite antenna phase center correction | Igs20_2309.atx |
| Observation weighting | Elevation-dependent weight |
| Relativistic effect | Corrected |
| Ambiguity Resolution Method | Rounding |
| Output coordinate system | ECEF (Earth-Centered, Earth-Fixed) |
To evaluate in detail the performance of GNSS positioning during the geomagnetic storm, 5 windows of interest were established, corresponding to different measurement periods involving quiet days and the day of the geomagnetic storm. The initial and main (divided into three steps) phase of the geomagnetic storm spans approximately from 17:00 to 03:00 UT on 10–11 May 2024 [12,26]. Therefore, taking as reference the ~10 h of duration of the geomagnetic storm’s main phase, the following windows were established:
- Window 1 (W1): 07:00–17:00 UT on 5 May 2024. This window was selected considering a quiet day in the ionosphere before the geomagnetic storm.
- Window 2 (W2): 07:00–17:00 UT on 10 May 2024. This window was selected 10 h before the onset of the geomagnetic storm.
- Window 3 (W3): 17:00–03:00 UT on 10–11 May 2024. This window corresponds to the geomagnetic storm phenomenon.
- Window 4 (W4): 03:00–13:00 UT on 11 May 2024. This window corresponds to 10 h after the end of the geomagnetic storm.
- Window 5 (W5): 03:00–13:00 UT on 15 May 2024. This window was selected considering a quiet day for the ionosphere after the geomagnetic storm.
These windows were strategically selected to evaluate the PPP-kinematic performance under quiet ionospheric conditions before and after the geomagnetic storm (5 and 15 May 2024, W1 and W5), and hours before and after the geomagnetic storm (10 and 11 May, W2 and W4). On the other hand, to evaluate the performance of PPP-kinematic positioning under the effect of the geomagnetic storm, the RMSE was established as an indicator of precision.
To establish the reference coordinates of the 73 GNSS stations, data from 1 to 2 May 2024, were processed using the PPP technique in static mode using the PRIDE-PPPAR scientific software. These days were selected based on ionospheric conditions. The reference coordinates were defined as topocentric origin to transform the ECEF coordinates of the 73 stations to ENU (North, East and Up) coordinates for proper analysis of positioning performance.
3. Results
3.1. Ionospheric Response over Mexico
The G5 geomagnetic storm of 10 May 2024, produced a strong and well-defined ionospheric response across Mexico, with distinct positive and negative phases observed at all 30 stations analyzed (Figure 2, Table 1). The data revealed a nationwide picture of a large ionospheric disturbance with clear and systematic latitudinal dependencies for nearly every phase of the storm. The effects were observed at the end of day 10, and on days 11 and 12 May 2024, with some stations showing residual effects on the 13th (Figure 2). Following the disturbance, all stations showed the ionosphere gradually returning to its normal state, with the daily %dTEC progressively increasing toward the pre-storm baseline. The characteristic peak, negative phase, and recovery pattern were present in every single station analyzed.
For reference, 0–12 UT corresponds to local evening and nighttime hours, while 12–24 UT corresponds to local daytime. The onset of the ionospheric disturbance was remarkably consistent across the entire country. All stations, spanning over ~13° of latitude (~1400 km), registered the onset between 18:24 UT and 19:01 UT on May 10th, with a mean time of 18:36 UT (Table 1). Considering the Sudden Storm Commencement (SSC) at 17:07 UT, the effect took approximately 77 min to become present in the %dTEC of all stations.
The primary effect was a sustained increase in TEC values starting in the afternoon (local time) of May 10th, manifesting as a sharp peak in the %dTEC data (Figure 2). A clear latitudinal gradient was observed in the magnitude of this positive phase. The highest percentage enhancements occurred at the northernmost stations (latitude > 25° N). For example, stations above 30° N latitude (e.g., daex, phby, Table 1) presented enhancements of ~175–180%, while southern stations below 20° N (e.g., cn25, tniq) showed lower enhancements of ~105–125%. Station NAYX (Lat 32.32° N, Lon −115.29° W) was the most impacted, with the strongest %dTEC of 180.65%. The timing of the maximum enhancement also showed a distinct latitudinal progression. The %dTEC peaks appeared first at the southern stations, with mean times of 21:18 UT, 21:43 UT, 22:33 UT, and 22:41 UT for the red, yellow, blue, and magenta station groups, respectively (Table 1).
The storm’s effect was recorded from south to north in a time difference of less than one hour between the stations (Figure 2). The structure of the positive phase also varied with latitude; it was a relatively clean, sharp peak in the north, while in the south, the structure was more complex and choppier, with multiple distinct peaks. The positive phase for northern stations lasted between 8.17 and 11.52 h (h), with a mean time of 9.63 h, while for the yellow and red stations, the mean durations were 10.78 h and 12.14 h, respectively, indicating that the positive phase was longer in the south (Table 1). The shortest positive phase duration was 7.8 h at unpm station, and the longest durations were observed at tncy and tnmq stations (12.3 h).
Following the positive phase, a suppression of TEC occurred across all stations. The magnitude of this maximum depletion was more uniform across all latitudes compared to the positive phase, with most stations recording a peak depletion between −58% and −77%. However, a latitudinal gradient was still present, with the lowest values observed from −77.75 TECU at the northern station ptex to −58.77 TECU at the southern station tnnp. More intense depletions tended to occur in the northern stations. In general, Min %dTEC mean values were −65.29 TECU, −66.48 TECU, −69.90 TECU and −74.22 TECU, for red, yellow, blue and magenta stations (Figure 2), respectively. The timing of the maximum depletion showed a clear progression, with northern stations reaching their minimum first on May 11th between 19:11 UT and 19:40 UT, while the southernmost stations (< 20° N) hit their minimum up to ~15 h later, between May 11th at 07:31 UT and May 12th at 11:01 UT. The duration of the negative phase was significantly longer in the south, with northern stations experiencing a mean duration of ~46–49 h, while southern stations endured a longer depletion of ~50–52 h. In general, the storm negative phase duration extended between 40.36 h (ptex station) and 56.93 h (quex station). The overall storm duration was consequently longer in the south (mean ~62–64 h) compared to the north (mean ~57–60 h), with a total range between 52.61 h and 65.57 h. Most stations (67%) exhibit durations between 63 and 65 h. Finally, considering all Mexican stations, the mean duration of the positive phase was 10.55 h, the negative phase lasted on average 49.67 h, and the total duration of the geomagnetic storm was 60.93 h.
To better understand the temporal evolution of the ionospheric disturbance, %dTEC peaks and depletions were analyzed with respect to the three-step main phase of the geomagnetic storm identified from the SYM-H index (−183 nT at 19:21 UT, −354 nT at 23:12 UT, and −518 nT at 02:14 UT on 11 May) accurately described in [12]. Considering the local time, the storm’s onset and the first two main-phase steps occurred during daytime hours, whereas the third step occurred during local night (Figure 2). The %dTEC enhancements observed across the northern (magenta) and central (blue) stations peaked between 22:30 and 22:54 UT (Table 1), temporally aligned with the second main-phase step, indicating a strong dayside uplift likely driven by PPEFs [3]. In contrast, southern (yellow and red) stations showed their first %dTEC peaks between 21:00 and 22:00 UT, intermediate between the first and second step of the storm’s main phase, and a second enhancement delayed until ~06:00 UT, several hours after the third main-phase minimum (Figure 2). These spatial and temporal differences suggest a progressive propagation of PPEF-induced uplift and delayed recombination effects at lower latitudes.
The strongest negative %dTEC values occurred ~00:38 UT (Table 1), before the third main-phase step (02:14 UT), coinciding with local nighttime hours when downward plasma motion and enhanced recombination dominate [3,12]. This pattern is consistent with nightside PPEF polarity reversal and thermospheric composition changes, both contributing to plasma depletion.
3.2. Low-Cost vs. Geodetic Receiver Performance in the Dominican Republic
The performance of a low-cost receiver (ubxa) was analyzed against a co-located geodetic-grade instrument (rdsd) in the Dominican Republic (Figure 3). The data demonstrates a remarkable agreement between the two receivers, which tracked the storm’s evolution in near-perfect unison. A cross-correlation of 0.92163 provided strong quantitative evidence that the low-cost sensor successfully captured the timing and large-scale structure of the storm with high fidelity. Both receivers captured the sharp, double-peaked structure of the positive phase on May 11th, the deep negative phase on 11–12 May, and subsequent disturbances on May 13th (Figure 3).
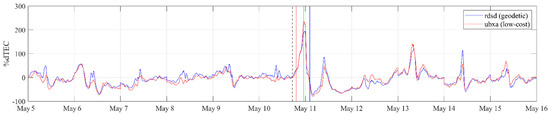
Figure 3.
Percentage deviation of Vertical Total Electron Content (%dTEC) from 5 to 15 May 2024, as measured by a co-located geodetic-grade receiver (rdsd, blue) and a low-cost receiver (ubxa, red) in the Dominican Republic. The black dashed line indicates the storm’s onset time at 17:15 UT on 10 May. The storm’s main phases (MP) are indicated as vertical lines at 19:21 UT on 10 May (red, MP1), 23:12 UT on 10 May (green, MP2), and 02:14 UT on 11 May (blue, MP3). For reference, 0–12 UT = local nighttime, 12–24 UT = local daytime.
A noticeable difference was in the magnitude of the positive phase peak, with the low-cost receiver recording a higher value of 226.30% (on 10 May, 23:16 UT) compared to the geodetic receiver’s 194.32% (Table 1). In terms of timing, the geodetic receiver detected the onset 22 min earlier (18:36 UT) than the low-cost receiver (18:58 UT). Moreover, the low-cost receiver recorded its maximum peak enhancement 32 min earlier (23:16 UT) than the geodetic receiver (23:48 UT) (Table 1). However, for the maximum depletion, both instruments recorded the event at the exact same time: 03:52 UT on May 11th. The depth of the negative phase and the duration of the positive phase were nearly identical between the two receivers (Min %dTEC −71.69 vs. −70.59% and 14.98 h vs. 14.76 h) (Table 1). The geodetic receiver, however, recorded a significantly longer negative phase (36.41 h vs. 26.55 h) and a longer overall storm disturbance (77.9 h vs. 67.85 h).
3.3. Kinematic PPP-GNSS Performance During Geomagnetic Storm
To evaluate the positioning performance of PPP-kinematic under the impact of the geomagnetic storm, the RMSE was calculated per Window of interest for each of the 73 GNSS stations considering the reference coordinates. Figure 4 shows the RMSE values for the East, North, and Up components, with each color representing a window of interest. It is clear that the cyan color data contains the highest RMSE values at most stations, as it represents positioning errors during the geomagnetic storm (Window 3). The remaining windows generally showed lower RMSE values for all components compared to the day of the geomagnetic storm. In all five evaluated windows only the QUEX station was found to have high RMSE values in the East, North and Up components. This station with the highest RMSE belongs to the EarthScope network. Due to the high level of error found in this station, the health status was reviewed on the UNAVCO website (https://www.unavco.org/instrumentation/networks/status/nota/health/QUEX) (accessed on 21 June 2015) and it was found that the station presented high multipath values (greater than 50 cm in L1 and L2, GPS) and a low level in the signal-to-noise ratio (SNR) in the GPS L2 signal. Therefore, due to the low quality of the GPS observations, a high positioning error was reached, and this was not entirely related to the impact of the geomagnetic storm. The remaining stations presented GPS observations within the recommended standards (https://igsorg.zendesk.com/hc/en-us/articles/202011433-Current-IGS-Site-Guidelines, accessed on 27 June 2025).
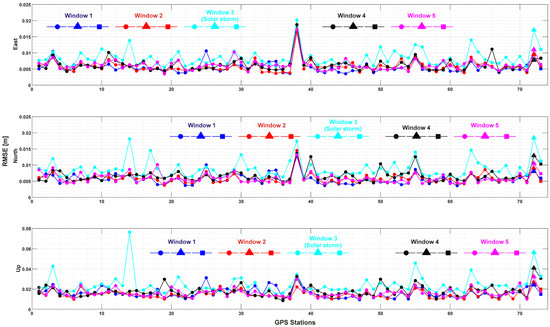
Figure 4.
RMSE values of the 73 GPS stations studied. The colors represent a window of interest: blue (W1), red (W2), cyan (W3), black (W4), and pink (W5). The circular shape represents the GPS stations in Mexico, the triangular shape represents the low-cost receiver, and the square shape represents the IGS station in the Dominican Republic. Window 3 corresponds to the maximum period when the solar storm impacted the positioning error.
For the GPS station corresponding to the low-cost receiver and antenna, the RMSE values were higher than the rest of the stations in all the windows evaluated. This is probably due to the quality of the GPS observations and the performance of the estimated calibration parameters of the antenna. For the low-cost UBXA station, on a calm ionospheric day (W1), RMSEs of 0.009, 0.008, and 0.024 m were achieved for the East, North, and Up components, respectively. While the rest of the stations equipped with geodetic-grade hardware achieved average RMSEs of 0.005, 0.005, and 0.015 m for the East, North, and Up components, respectively. On the other hand, during window 3 (geomagnetic storm), RMSEs of 0.017, 0.018, and 0.056 m were achieved for the East, North, and Up components, respectively, at the low-cost station. While the remaining stations achieved average RMSE values of 0.008, 0.008, and 0.023 m for the East, North, and Up components, respectively. Clearly the component with the greatest impact on positioning during the geomagnetic storm for the low-cost station was the Up, reaching RMSE greater than double that of the rest of the stations.
In order to analyze the error of the PPP-Kinematic GPS positioning in each component (ENU) for the five windows evaluated, the RMSE values of each of them for the 72 geodetic degree stations were averaged, and subsequently the 3D RMSE of each Window was calculated. The RMSEs per component and the 3D RMSE for each window are found in Table 3. It is clearly identified that Window 3 achieved the highest RMSE values in the East, North and Up components, and therefore in the 3D RMSE. However, the difference was less than 4 mm compared to the other windows in the horizontal component. In the Up component, this difference was less than 10 mm. Finally, the 3D RMSE indicates that the greatest impact on PPP-kinematic positioning occurred during the geomagnetic storm (W3), as expected, with a 3D RMSE of 0.0267 m. Window 4 was the one that reached the highest 3D RMSE value after W3, which shows that after the geomagnetic storm the ionosphere remains with important variations in the total electron content, which negatively affects positioning even when applying the free ionosphere combination that eliminates about 99.9% of the first order errors of the ionosphere [27,48]. Windows 1, 2 and 5 showed 3D RMSEs of 0.0179, 0.0169 and 0.0182 m, respectively. This shows that 5 days after the geomagnetic storm (15 May 2024 (W5)) the ionosphere behaves as quiet as the days before the storm (5 May 2024 (W1) and 10 May 2024 (W2)) and it does not show considerable errors in the kinematic GPS PPP.
Table 3.
Average of the RMSEs for each component and 3D RMSE.
Overall, considering the RMSE values of Window 1 and comparing them with Window 3, it was found that the positioning error increased by 48%, 55%, 47% and 49% for the East, North, Up and 3D components, respectively, during the geomagnetic storm for the geodetic grade GNSS stations. In the case of the low-cost station, it was found that the positioning error during the geomagnetic storm increased by 81%, 119%, 127% and 125% for the East, North, Up and 3D components, respectively. The low-cost station presented a greater impact than the geodetic grade stations during the storm, probably due to the quality of the antenna, lower stability in the internal clock and lower observational quality, which lead to a decrease in positioning accuracy [52,53,54,55].
On the other hand, it has been shown that geomagnetic storms have different impacts at different latitudes, [24,26,56,57] classified latitude according to its magnitude: High-latitude (>60°), Mid-latitude (30–60°) and Low-latitude (<30°). The study area covers latitudes 15–32°, i.e., low latitude. To investigate the impact of latitude on the PPP-kinematic positioning error for the case of the five windows studied, Figure 5 illustrates the 3D RMSE of the 73 GPS stations geographically distributed in Mexico and the Dominican Republic. In the case of Figure 5, for each window studied no direct relationship was found between latitude and 3D RMSE, which shows that for our case study the latitude and positioning error during the geomagnetic storm did not have a considerable impact, and the error was present in most of the GPS stations. The red dashed box shows the 3D RMSE of the low-cost station for each window, and as displayed in Figure 5, it was the station that had the greatest effect on positioning during the geomagnetic storm.
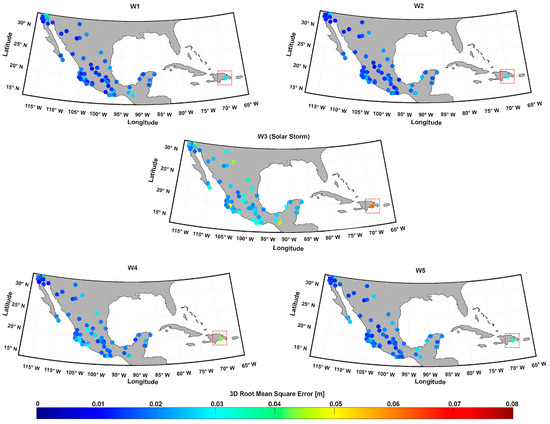
Figure 5.
Geographic distribution of the 3D RMSE for the 73 GPS stations in the different windows studied. W3 corresponds to the geomagnetic storm. Window 3 corresponds to the maximum period when the solar storm impacted the positioning error.
Furthermore, in Window 3 of Figure 5 the circles are observed with a more intense color than the rest of the windows. Also, there are circles with the same color intensity in northern, central, and southern Mexico, demonstrating that the geomagnetic storm had a similar impact on PPP-kinematic positioning at all low latitudes in our study area.
To correlate the ionospheric variables TEC and Kp index, three GPS stations with the greatest impact of the geomagnetic storm on PPP-kinematics were selected. The low-cost station UBXA was among those selected. Figure 6 shows the time series of PPP-kinematic positioning errors in the East, North and Up components, covering the period from 10 to 13 May, 2024. The figure also includes the variations in the Total Electron Content and the Kp index over the same period. The storm starts suddenly at 16:45 UT on 10 May 2024, and ends its main phase at 03 UT on 11 May 2024, corresponding to ~10 h. After 03 UT the geomagnetic storm began the recovery phase, which lasted more than 3 days.
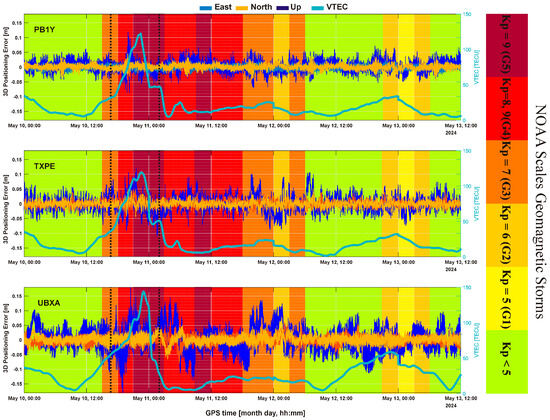
Figure 6.
Correlation between 3D positioning error and TEC/Kp index for 3 GPS stations during 10–13 May 2024. The color in the panel corresponds to the NOAA Space Weather Scale for geomagnetic storms.
At the beginning of the geomagnetic storm, the TEC and the Kp index increase, in addition, the positioning error of the three components also grows for the 3 stations, with the Up component of UBXA having the greatest impact. The geodetic-grade stations exhibited positioning errors of up to 5 cm in the horizontal component and 10 cm in the vertical component, whereas the low-cost station showed higher errors, up to 5 cm and 15 cm in the horizontal and vertical components, respectively. The time series of the East, North and Up components begin to stabilize until 12 May 2024, when the Kp values are less than 5. The dashed black vertical lines represent Window 3 (geomagnetic storm) and 10 h later Window 4, these two windows have the highest 3D RMSE values for the 73 GPS stations.
The greatest impact on PPP-kinematic positioning occurred during the main phase of the storm. Furthermore, the positioning error begins to decrease as the storm’s recovery phase begins.
3.4. Mitigation of the Solar Storm on GNSS Positioning
During severe geomagnetic storms, it is critical to consider cycle slip detection and correction in processing, higher order (second or third order) ionospheric corrections to minimize or mitigate the impact of the ionosphere on GNSS positioning [25,50,58].
On the other hand, various studies have shown that the combination of multi-GNSS in PPP-kinematic drastically improves accuracy under the effect of geomagnetic storms and reduces convergence time [26]. However, no other strategy has been implemented to mitigate the ionospheric error in PPP-kinematic during the geomagnetic storm of 10 May 2024, in geodetic-grade receivers and antennas, let alone in low-cost equipment. Therefore, we propose using second-order ionospheric corrections. PRIDE-PPPAR software was used to implement this strategy. This software uses global ionospheric maps final products developed by CODE to correct for second-order ionospheric delays [59]. Also, it detects cycle slips to fix ambiguity [44]. To evaluate the impact of the second-order correction on positioning during the geomagnetic storm, two approaches were adopted: first-order and second-order corrections were applied to the GPS and multi-GNSS (GPS + GLONASS + Galileo + BeiDou, GREC) combinations. Therefore, 3 GNSS stations with the highest RMSE values during the geomagnetic storm were selected, including the low-cost receiver.
Figure 7 shows the positioning performance in the horizontal (2D) and Up components for the GPS (blue points) and GREC (orange points) combination considering the first-order ionospheric correction. The improvement in positioning is notable when using multi-constellation measurements. The RMSE for the north, east, up, horizontal (2D), and 3D components was calculated as quality indicators to evaluate the impact of first and second-order corrections on positioning, and these values are shown in Table 4. First, the geodetic grade stations showed an average reduction in East, North, Up, 2D and 3D horizontal RMSE values of 18%, 31%, 22%, 22% and 23%, respectively, when considering the Multi-Constellation GREC measurements over the GPS-only ones for first-order ionospheric correction. Second, when the second-order correction was applied to the GPS and GREC combination, no significant improvements in positioning were observed. The differences between the East, North, Up, and horizontal 2D and 3D RMSEs considering the first and second-order corrections were less than 1 mm.
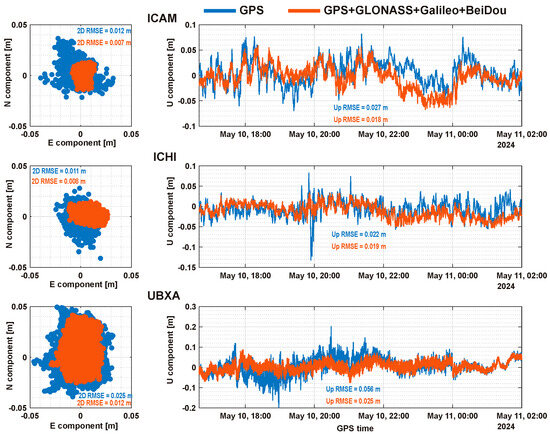
Figure 7.
RMSE values in 2D horizontal and Up component positioning for GPS and Multi-GNSS measurements during the geomagnetic storm of 10 May 2024.
Table 4.
RMSE values of the East, North, Up, 2D and 3D components considering first and second order ionospheric corrections for GPS and Multi-GNSS observations during the geomagnetic storm of 10 May 2024.
On the other hand, the low-cost GNSS station showed a reduction in East, North, Up, 2D and 3D horizontal RMSE values of 48%, 51%, 54%, 49% and 53%, respectively, when GREC measurements were considered over GPS-only measurements for first-order ionospheric correction. Compared to the geodetic-grade stations, better positioning performance was achieved when multi-constellation GREC measurements were considered. It was also found that the second-order ionospheric corrections at the low-cost station did not show significant improvement, reaching differences in less than 2 mm with respect to the first-order corrections. The component that showed the highest positioning performance when using the GREC combination was the Up at the low-cost station.
Overall, it was observed that in both geodetic-grade and low-cost GNSS receivers, second-order ionospheric correction has no impact on mitigating the effects of geomagnetic storms on positioning. Furthermore, the same results as other studies were found, where the mitigation of the geomagnetic storm effect decreases when observations from multiple GNSS constellations are available [26].
4. Discussion
The extreme geomagnetic storm of 10 May 2024, was classified as the largest storm of the current solar cycle 25. It was also the first geomagnetic storm to reach the Kp index with a value of 9, corresponding to the extreme level G5 of the NOAA geomagnetic storm classification (https://www.swpc.noaa.gov/noaa-scales-explanation) (accessed on 2 July 2025). During the night of 10–11 May 2024, the Aurora Borealis were observed at low latitudes worldwide [10].
The observed day–night asymmetry in %dTEC response across Mexico is consistent with the expected behavior of PPEFs during storm main phases [3]. The dayside PPEF causes an uplift of the ionospheric F region to altitudes where the recombination rate is low. Meanwhile, solar UV radiation replaces the uplifted ionospheric plasma by photoionization. The overall effect is an increase in TEC. The first and second step of the storm’s main phase storm, occurring under local daytime conditions, generated pronounced positive ionospheric storms, particularly at northern and central latitudes, where the upward ExB drift raised the F region to higher altitudes and latitudes. Solar EUV ionization then replaces the uplifted plasma, enhancing TEC [60]. During the third step of the storm’s main phase and early recovery, occurring under local nighttime conditions, the convection electric field polarity reversed, driving plasma downward and producing the widespread negative %dTEC observed across all stations. This diurnal modulation, also reported by [12] for the May 2024 event, indicates that PPEF effects dominated the early storm-time response, while compositional depletion controlled the prolonged nighttime recovery. The latter disturbances impact the propagation of radio signals used in navigation and communication systems [19].
The positive ionospheric storm phase is primarily driven by electric fields, which cause a massive, region-wide injection of plasma into the ionosphere. The observation that the greatest relative increase in plasma density, compared to the 27-day median baseline, was concentrated in the north likely suggests that the storm-time crest of EIA was pushed far northward of its typical position, with its peak influence settling over northern Mexico. The dynamic evolution of plasma transport is further evidenced by the latitudinal progression of the positive peak’s timing. The longer duration of the positive phase in the south suggests this region remained “overcharged” for a longer period, likely influenced by sustained electric fields and uplifted plasma. At latitudes greater than 28° N (nayx, daex, pb1y, yumx), the high Max %dTEC and very deep Min %dTEC may indicate a strong response to these penetrating electric fields.
The subsequent negative phase is caused by changes in the upper atmosphere’s chemical composition as well as the nightside effects that lead to rapid plasma loss [61]. This depletion results from a decrease in the O/N2 ratio, which increases the plasma recombination rate [62]. The timing of the maximum depletion, which occurred first in the north and up to 15 h later in the south, is consistent with the transport of molecules from high-latitude zones toward the equator. Commonly, the negative storm effects begin immediately after storm onset in the nightside high-latitude ionosphere, then expand equatorward and corotate into the dayside [63]. In the present study, the fact that the negative phase was longer and the overall recovery time was greater in the south confirms this region was more profoundly and persistently affected by these composition changes. In the southern stations, even though the positive phase was more attenuated, the negative phase was not reduced to the same extent, likely implying that the loss mechanism was still strongly at work even with a weaker plasma loading phase.
The comparison between the geodetic and low-cost receivers in the Dominican Republic supports the use of low-cost sensors as a viable tool for monitoring major space weather events. The offset in timing is likely due to differences in how each receiver’s hardware and internal software respond to the extreme and rapidly changing plasma density. Despite this difference, both instruments identified the peak of the storm’s main impact within the same half-hour window, which is excellent agreement and confirms they are observing the same primary physical event. Furthermore, both the low-cost and the geodetic receivers recorded the time of maximum depletion at the exact same time. The negative phase is a more gradual, large-scale phenomenon than the sharp positive peak. The perfect temporal agreement demonstrates that this slower, broader feature is tracked with identical accuracy by both instruments. The capacity of low-cost sensors to reliably capture the key features of a superstorm opens the door for creating denser and more cost-effective ionospheric monitoring networks.
An extreme geomagnetic storm poses a risk to GNSS by degrading accuracy due to the scintillation phenomenon [64,65]. This phenomenon generates cycle slips, loss of synchronization, and poor carrier phase tracking. Following the geomagnetic storm of 10 May 2024, ref. [30] reported the first study analyzing the impact of the storm on PPP. They focused on mid-latitudes using only one GNSS station in Italy and used the CSRS-PPP online service for PPP data processing, considering the GPS + GLONASS constellations. They reported errors in the vertical component of up to 10 cm during the geomagnetic storm. Later, ref. [29] report a study where they similarly analyze the impact of the storm on PPP-GPS positioning. They analyzed more than 6000 GPS stations distributed around the world. The GAMP software was used for data processing in PPP-kinematic mode, considering only the GPS constellation, and they reported errors of up to 1.5 m. A more comprehensive study was reported by [26], who performed a global analysis with over 1800 GNSS stations distributed worldwide and divided into high, mid, and low latitudes. They evaluated GNSS combinations to analyze the impact of multi-GNSS measurements on improving PPP-GNSS positioning. For data processing, they used Net_Diff software [66] and achieved errors of 9, 3.5, and 4.2 cm for high, mid, and low latitudes using only GPS observations. They also proposed using multi-constellation observations to improve positioning performance using PPP-GNSS. For high latitudes, they reduced the error from 9 cm to 4.3 cm using the GPS + GLONASS + Galileo combination. Furthermore, in a recent study focused on mid-latitudes in the United States, they analyzed the positioning error for more than 100 stations using RTKLIB software [66]. They reported PPP position errors of up to 70 m during the main phase of the storm.
The results achieved in our study show the significant impact of the extreme geomagnetic storm of 10 May 2024 on PPP-Kinematic positioning in Mexican territory, which is located at low latitudes. Specifically, 3D PPP accuracy degradations of up to 49% were observed during storm onset for geodetic grade stations reaching a 3D RMSE value of 0.017 m. These findings are consistent with studies conducted in other high, mid, and low latitude regions such as those reported by [30] in Italy, [29] globally, and [66] in the United States, although with some differences in the magnitude of the positional error probably attributed to geographic location, local ionospheric characteristics and processing software. Although our study focused solely on Mexico and not globally, and unlike those observed by [26] at low latitudes, they reported a maximum 3D PPP error of 0.840 m during the geomagnetic storm, while we achieved a 3D PPP error of 0.026 m, that is, a positioning error approximately 32 times smaller. Therefore, this large difference could be due to the processing software used.
To further analyze the impact of software on GNSS PPP-kinematic processing during the geomagnetic storm, the results were compared with those of other studies where different software was used [26]. To achieve this, three GNSS stations strategically distributed at high, medium and low latitudes were selected, where two of these were analyzed in [26]. The GNSS stations were: SYOG located in Antarctica, HUEL located in Spain and CHPI located in Cachoeira Paulista, Brazil, close to the CHPG station analyzed in [26]. In [26], the Net_Diff software was used, and the GPS + GLONASS + Galileo combination achieved a 3D PPP error of 2.8 m, 1.5 m, and 0.84 m for the SYOG, HUEL, and CHPG stations, respectively. In the present study, the PRIDE-PPPAR software was applied, processing three different GNSS combinations (G, GREC, GRE) to provide an overview of the software’s performance. The analysis focused exclusively on positioning errors corresponding to the geomagnetic storm (Window 3). Figure 8 presents the positional error values for the East, North, Up, and the 2D and 3D components for each GNSS combination and station.
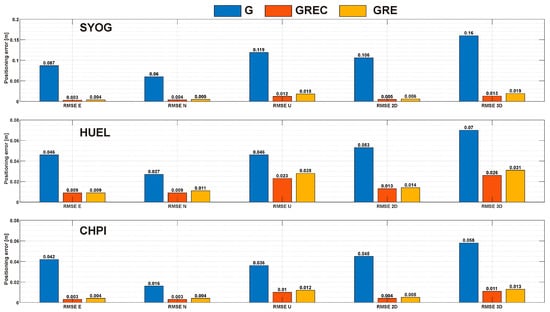
Figure 8.
PPP positional error values obtained with the PRIDE-PPPAR software for the East, North, Up, 2D, and 3D components at the SYOG (top, high-latitude), HUEL (middle, mid-latitude), and CHPI (bottom, low-latitude) stations, considering the GNSS combinations GPS (G), GPS + GLONASS + Galileo + BeiDou (GREC), and GPS + GLONASS + Galileo (GRE).
When comparing the 3D PPP positional error results for the GRE combination, the errors reported in [26] are 147 times larger for the SYOG station (high latitude), 48 times larger for the HUEL station (mid latitude), and 64 times larger for the CHPI station. Moreover, even the GPS-only combination provided better positioning performance than the GRE combination. In contrast, the GREC combination exhibited the best performance, significantly surpassing the results reported in [26]. The analysis indicates that the use of scientific-grade software enhances GNSS positioning solutions even under extreme geomagnetic storm conditions. These findings are also consistent with those reported in [45], where GNSS positioning performance was evaluated using different open-source software and PPP processing platforms. Among them, PRIDE-PPPAR achieved the highest precision compared to widely used software in the scientific community such as RTKLIB, Net_Diff, PPPH, GipsyX, gLab, CSRS-PPP, GAPS, APPS, GAMP, goGPS, and MG-APP.
5. Conclusions
The 10 May 2024 geomagnetic storm produced a strong ionospheric response across Mexico, with well-defined positive and negative phases observed at all 30 considered stations. The disturbance began late on May 10th with a remarkably coherent onset across all latitudes, confirming the nationwide scale of the event.
The proximity in time of %dTEC peaks to the second and third steps of the storm’s main phase, and their dependence on local time, strongly indicates that PPEFs ruled the initial positive storm phase on the dayside, while composition-driven plasma loss dominated the prolonged nighttime depletion and recovery. A suppression of TEC occurred across all stations following the initial positive phase. While the peak depletion magnitude was relatively uniform (most stations recorded between −58% and −77%), a latitudinal gradient persisted, with the most intense depletions tending to occur in the northern stations. For instance, the lowest observed value was −77.75 TECU at the northern station PTEX, compared to −58.77 TECU at the southern station TNNP.
A clear latitudinal gradient was observed in the positive phase, where the northernmost stations showed the highest percentage of TEC increase, with peak values decreasing southward. Conversely, the negative phase was most prolonged and severe in the south, leading to a longer overall recovery time in that region. The plasma dynamics during the storm’s peak were also more turbulent and complex at lower latitudes. Furthermore, analysis of co-located geodetic and low-cost receivers in the Dominican Republic demonstrated that low-cost sensors can reliably capture the timing and large-scale structure of a major ionospheric storm, supporting their use in widespread space weather monitoring networks.
On the other hand, it was found that the impact of the geomagnetic storm increased the positioning error by 48%, 56%, and 47% in the East, North, and Up components in the geodetic-grade receivers, respectively. While in the low-cost receiver, the effect was even greater, reaching an increase in positioning error of 81%, 119%, and 127% in the East, North, and Up components, respectively. The low-cost GNSS receiver had a higher positioning error during the geomagnetic storm than the geodetic-grade receivers, precisely 50% more. Regarding the geographical distribution of the stations, no correlation was found between latitude and 3D positioning error.
In the same way as other studies, it was found that using multi-constellation observations reduces the error in 3D PPP up to 23% in geodetic grade receivers and 53% in low-cost GNSS receivers. It was also observed that the second-order ionospheric correction did not have a relevant impact on error reduction in both receiver grades.
Finally, the importance of the software selected for data processing in Kinematic PPP was demonstrated. Selecting scientific-grade software such as PRIDE-PPPAR guarantees centimeter-level accuracies regardless of the latitude where the GNSS receiver is located, even during the geomagnetic storm being studied. Other software achieves accuracies of up to tens of meters. Also, the low-cost GNSS receiver and antenna were reported to have high positioning performance when using Multi-GNSS observations, achieving 3D errors as low as 0.028 m.
Author Contributions
Conceptualization, J.R.V.-O., and A.M.-M.; methodology, J.R.V.-O. and A.M.-M.; software, J.R.V.-O., J.R.M.-B. and A.M.-M.; validation, J.R.V.-O., A.M.-M. and C.A.M.-F.; formal analysis, J.R.V.-O., A.M.-M., J.R.M.-B. and C.A.M.-F.; investigation, J.R.V.-O., J.R.M.-B. and A.M.-M.; data curation, J.R.V.-O. and A.M.-M.; writing—original draft preparation, J.R.V.-O., J.R.M.-B. and A.M.-M.; writing—review and editing, J.R.V.-O., A.M.-M., C.A.M.-F., J.R.M.-B. and J.R.M.-B.; supervision, J.R.V.-O. and A.M.-M.; project administration, J.R.V.-O. and A.M.-M. All authors have read and agreed to the published version of the manuscript.
Funding
This research received no external funding.
Data Availability Statement
GNSS data used in this study are publicly available from several sources: UNAVCO (https://www.unavco.org/data/gps-gnss/gps-gnss.html, accessed on 27 June 2025), IGS (https://cddis.nasa.gov/archive/gnss/data/daily/2024/, accessed on 27 June 2025), INEGI (https://www.inegi.org.mx/app/geo2/rgna/, accessed on 27 June 2025), EPN (https://igs.bkg.bund.de/root_ftp/EUREF/, accessed on 27 June 2025), CORS (https://geodesy.noaa.gov/corsdata/rinex/2024/, accessed on 27 June 2025).
Acknowledgments
For the availability of GNSS data, we acknowledge the International GNSS Service, National Institute of Statistics and Geography, EarthScope Consortium, The NOAA Continuously Operating Reference Station Network.
Conflicts of Interest
The author J. Rene Vazquez-Ontiveros is affiliated with CANDE Ingenieros SA de CV Company. The other authors declare no competing interests.
References
- Yang, Z.; Morton, Y.T.J. Impacts of the May 2024 Extreme geomagnetic Storm on Global High—Accuracy GPS Positioning Solutions. Space Weather 2025, 23, e2025SW004547. [Google Scholar] [CrossRef]
- Sergeeva, M.A.; Maltseva, O.A.; Caraballo, R.; Gonzalez-Esparza, J.A.; Corona-Romero, P. Latitudinal dependence of the ionospheric slab thickness for estimation of ionospheric response to geomagnetic storms. Atmosphere 2021, 12, 164. [Google Scholar] [CrossRef]
- Tsurutani, B.T.; Verkhoglyadova, O.P.; Mannucci, A.J.; Saito, A.; Araki, T.; Yumoto, K.; Tsuda, T.; Abdu, M.A.; Sobral, J.H.A.; Gonzalez, W.D.; et al. Prompt penetration electric fields (PPEFs) and their ionospheric effects during the great magnetic storm of 30–31 October 2003. J. Geophys. Res. Atmos. 2008, 113, A05311. [Google Scholar] [CrossRef]
- Zhang, S.; He, L.; Wu, L. Statistical study of loss of GPS signals caused by severe and great geomagnetic storms. J. Geophys. Res. Space Phys. 2020, 125, e2019JA027749. [Google Scholar] [CrossRef]
- Tulasi Ram, S.; Veenadhari, B.; Dimri, A.P.; Bulusu, J.; Bagiya, M.; Gurubaran, S.; Parihar, N.; Remya, B.; Seemala, G.; Singh, R.; et al. Super-intense geomagnetic storm on 10–11 May 2024: Possible mechanisms and impacts. Space Weather 2024, 22, e2024SW004126. [Google Scholar] [CrossRef] [PubMed]
- Gordiyenko, G.; Arikan, F.; Litvinov, Y.; Zhiganbaev, M. Ionospheric response to the extreme geomagnetic storm of 10–11 May 2024 based on total electron content observations in the Central Asian and East Asian regions. Atmosphere 2025, 16, 854. [Google Scholar] [CrossRef]
- Hayakawa, H.; Ebihara, Y.; Mishev, A.; Koldobskiy, S.; Kusano, K.; Isobe, H.; Bechet, S.; Yashiro, S.; Iwai, K.; Shinbori, A.; et al. The solar and geomagnetic storms in May 2024: A flash data report. Astrophys. J. 2025, 979, 49. [Google Scholar] [CrossRef]
- Aa, E.; Chen, Y.; Luo, B. Dynamic expansion and merging of the equatorial ionization anomaly during the 10–11 May 2024 super geomagnetic storm. Remote Sens. 2024, 16, 4290. [Google Scholar] [CrossRef]
- Mayaud, P.N. What is a geomagnetic index? In Derivation, Meaning, and Use of Geomagnetic Indices; Mayaud, P.N., Ed.; AGU: Washington, DC, USA, 1980; pp. 1–19. [Google Scholar] [CrossRef]
- Gonzalez-Esparza, J.A.; Sanchez-Garcia, E.; Sergeeva, M.; Corona-Romero, P.; Gonzalez-Mendez, L.X.; Valdes-Galicia, J.F.; Aguilar-Rodriguez, E.; Rodriguez-Martinez, M.; Ramirez-Pacheco, C.; Castellanos, C.I.; et al. The Mother’s Day geomagnetic storm on 10 May 2024: Aurora observations and low latitude space weather effects in Mexico. Space Weather 2024, 22, e2024SW004111. [Google Scholar] [CrossRef]
- Spogli, L.; Alberti, T.; Bagiacchi, P.; Cafarella, L.; Cesaroni, C.; Cianchini, G.; Coco, I.; Di Mauro, D.; Ghidoni, R.; Giannattasio, F.; et al. The effects of the May 2024 Mother’s Day superstorm over the Mediterranean sector: From data to public communication. Ann. Geophys. 2024, 67, PA218. [Google Scholar] [CrossRef]
- Hajra, R.; Tsurutani, B.T.; Lakhina, G.S.; Lu, Q.; Du, A. Interplanetary causes and impacts of the 2024 May superstorm on the Geosphere: An overview. Astrophys. J. 2024, 974, 264. [Google Scholar] [CrossRef]
- Tsurutani, B.T.; Sen, A.; Hajra, R.; Lakhina, G.S.; Horne, R.B.; Hada, T. Review of the August 1972 and March 1989 (Allen) space weather events: Can we learn anything new from them? J. Geophys. Res. Space Phys. 2024, 129, e2024JA032622. [Google Scholar] [CrossRef]
- Singh, R.; Scipión, D.E.; Kuyeng, K.; Condor, P.; De La Jara, C.; Velasquez, J.P.; Flores, R.; Ivan, E.; Souza, J.R.; Migliozzi, M. Ionospheric disturbances observed over the Peruvian sector during the Mother’s Day storm (G5-level) on 10–12 May 2024. J. Geophys. Res. Space Phys. 2024, 129, e2024JA033003. [Google Scholar] [CrossRef]
- Bai, D.; Fu, Y.; Yang, C.; Zhang, K.; Cui, Y. The poleward shift of the equatorial ionization anomaly during the main phase of the superstorm on 10 May 2024. Remote Sens. 2025, 17, 2616. [Google Scholar] [CrossRef]
- Jain, A.; Trivedi, R.; Jain, S.; Choudhary, R.K. Effects of the super intense geomagnetic storm on 10–11 May 2024 on total electron content at Bhopal. Adv. Space Res. 2025, 75, 953–965. [Google Scholar] [CrossRef]
- Carmo, C.S.; Dai, L.; Wrasse, C.M.; Barros, D.; Takahashi, H.; Figueiredo, C.A.O.B.; Wang, C.; Li, H.; Liu, Z. Ionospheric response to the extreme 2024 Mother’s Day geomagnetic storm over the Latin American sector. Space Weather 2024, 22, e2024SW004054. [Google Scholar] [CrossRef]
- Caraballo, R.; González-Esparza, J.A.; Pacheco, C.R.; Corona-Romero, P.; Arzate-Flores, J.A.; Castellanos-Velazco, C.I. The impact of geomagnetically induced currents (GIC) on the Mexican power grid: Numerical modeling and observations from the 10 May 2024 geomagnetic storm. Geophys. Res. Lett. 2025, 52, e2024GL112749. [Google Scholar] [CrossRef]
- Ishii, M.; Berdermann, J.; Forte, B.; Hapgood, M.; Bisi, M.M.; Romano, V. Space weather impact on radio communication and navigation. Adv. Space Res. 2024; in press. [Google Scholar] [CrossRef]
- Jacobsen, K.S.; Schäfer, S. Observed effects of a geomagnetic storm on an RTK positioning network at high latitudes. J. Space Weather Space Clim. 2012, 2, A13. [Google Scholar] [CrossRef]
- Bergeot, N.; Bruyninx, C.; Defraigne, P.; Pireaux, S.; Legrand, J.; Pottiaux, E.; Baire, Q. Impact of the Halloween 2003 ionospheric storm on kinematic GPS positioning in Europe. GPS Solut. 2011, 15, 171–180. [Google Scholar] [CrossRef]
- Jacobsen, K.S.; Andalsvik, Y.L. Overview of the 2015 St. Patrick’s day storm and its consequences for RTK and PPP positioning in Norway. J. Space Weather Space Clim. 2016, 6, A9. [Google Scholar] [CrossRef]
- Luo, X.; Gu, S.; Lou, Y.; Xiong, C.; Chen, B.; Jin, X. Assessing the performance of GPS precise point positioning under different geomagnetic storm conditions during solar cycle 24. Sensors 2018, 18, 1784. [Google Scholar] [CrossRef]
- Geng, W.; Huang, W.; Liu, G.; Liu, S.; Luo, B. Assessing the kinematic GPS positioning performance under the effect of strong ionospheric disturbance over China and adjacent areas during the magnetic storm. Radio Sci. 2022, 57, 1–18. [Google Scholar] [CrossRef]
- Zhou, W.; Yuan, Y.; Tang, C.; Meng, Y.; Chen, Y. Ionosphere disturbances on GNSS signal and positioning performance: Analysis of the solar flare and geomagnetic storm events in September 2017 and October 2021. Adv. Space Res. 2024, 73, 4608–4620. [Google Scholar] [CrossRef]
- dos Santos Bezerra, L.; de Oliveira, P.S., Jr.; Krueger, C.P. Performance Analysis of multi-GNSS PPP under the Effects of Extreme Geomagnetic Event: A Case Study of Mother’s Day Solar Storm (10–15 May 2024). Adv. Space Res. 2025; in press. [Google Scholar]
- Yang, K.; Jiang, W.; Li, Z.; Ding, X.; Lu, R. Comparative analysis of higher-order ionospheric delay on PPP long-term coordinate time series and residual modeling using horizontal gradients and RINEX data. Space Weather 2024, 22, e2024SW004178. [Google Scholar] [CrossRef]
- Chen, D.; Hu, Z.; Wang, F.; Gou, Y.; Zhang, T. Ionospheric response characteristics and PPP accuracy analysis at different latitudes during strong geomagnetic storms. Acta Geophys. 2024, 72, 2097–2106. [Google Scholar] [CrossRef]
- Danilchuk, E.; Yasyukevich, Y.; Vesnin, A.; Klyusilov, A.; Zhang, B. Impact of the May 2024 Extreme Geomagnetic Storm on the Ionosphere and GNSS Positioning. Remote Sens. 2025, 17, 1492. [Google Scholar] [CrossRef]
- Park, J.; Spogli, L.; Azeez, A.; Alfonsi, L.; Cesaroni, C.; Romano, V.; Akande, A. The impact of Mother’s Day Storms in May 2024 on Precise Point Positioning at mid-latitudes. Ann. Geophys. 2025, 68, A214. [Google Scholar] [CrossRef]
- Nischan, T. GFZRNX-RINEX GNSS Data Conversion and Manipulation Toolbox, Version 1.05; German Research Centre for Geosciences (GFZ): Potsdam, Germany, 2016.
- Janos, D.; Kuras, P.; Ortyl, Ł. Evaluation of low-cost RTK GNSS receiver in motion under demanding conditions. Measurement 2022, 201, 111647. [Google Scholar] [CrossRef]
- Arikan, F.; Erol, C.B.; Arikan, O. Regularized estimation of vertical total electron content from Global Positioning System data. J. Geophys. Res. Space Phys. 2003, 108, 1469. [Google Scholar] [CrossRef]
- Arikan, F.; Erol, C.B.; Arikan, O. Regularized estimation of vertical total electron content from GPS data for a desired time period. Radio Sci. 2004, 39, RS6010. [Google Scholar] [CrossRef]
- Nayir, H.; Arikan, F.; Arikan, O.; Erol, C.B. Total electron content estimation with Reg-Est. J. Geophys. Res. Space Phys. 2007, 112, A11312. [Google Scholar] [CrossRef]
- Blagoveshchensky, D.V.; Maltseva, O.A.; Sergeeva, M.A. Impact of magnetic storms on the global TEC distribution. Ann. Geophys. 2018, 36, 1057–1071. [Google Scholar] [CrossRef]
- Seemala, G.K. Estimation of ionospheric total electron content (TEC) from GNSS observations. In Earth Observation, Atmospheric Remote Sensing; Singh, A.K., Tiwari, S., Eds.; Elsevier: Amsterdam, The Netherlands, 2023; pp. 63–84. [Google Scholar] [CrossRef]
- Hofmann-Wellenhof, B.; Lichtenegger, H.; Collins, J. Global Positioning System: Theory and Practice; Springer Science & Business Media: New York, NY, USA, 2012. [Google Scholar]
- Anderle, R.J. Point positioning concept using precise ephemeris. Satell. Doppler Position 1976, 1, 47–75. [Google Scholar]
- Zumberge, J.F.; Heflin, M.B.; Jefferson, D.C.; Watkins, M.M.; Webb, F.H. Precise point positioning for the efficient and robust analysis of GPS data from large networks. J. Geophys. Res. Solid Earth 1997, 102, 5005–5017. [Google Scholar] [CrossRef]
- Héroux, P.; Kouba, J. GPS precise point positioning using IGS orbit products. Phys. Chem. Earth Part A Solid Earth Geod. 2001, 26, 573–578. [Google Scholar] [CrossRef]
- Sanz Subirana, J.; Juan Zornoza, J.M.; Hernández-Pajares, M. GNSS Data Processing; Volume I: Fundamentals and algorithms; ESA Communications: Noordwijk, The Netherlands, 2013; pp. 145–161. [Google Scholar]
- Kouba, J.; Lahaye, F.; Tétreault, P. Precise point positioning. In Springer Handbook of Global Navigation Satellite Systems; Springer International Publishing: Cham, Switzerland, 2017; pp. 723–751. [Google Scholar]
- Geng, J.; Chen, X.; Pan, Y.; Mao, S.; Li, C.; Zhou, J.; Zhang, K. PRIDE PPP-AR: An open-source software for GPS PPP ambiguity resolution. GPS Solut. 2019, 23, 91. [Google Scholar] [CrossRef]
- Vazquez-Ontiveros, J.R.; Padilla-Velazco, J.; Gaxiola-Camacho, J.R.; Vázquez-Becerra, G.E. Evaluation and Analysis of the Accuracy of Open-Source Software and Online Services for PPP Processing in Static Mode. Remote Sens. 2023, 15, 2034. [Google Scholar] [CrossRef]
- Chen, C.; Xiao, G.; Chang, G.; Xu, T.; Yang, L. Assessment of GPS/Galileo/BDS precise point positioning with ambiguity resolution using products from different analysis centers. Remote Sens. 2021, 13, 3266. [Google Scholar] [CrossRef]
- Krietemeyer, A.; van der Marel, H.; van de Giesen, N.; Ten Veldhuis, M.C. A field calibration solution to achieve high-grade-level performance for low-cost dual-frequency GNSS receiver and antennas. Sensors 2022, 22, 2267. [Google Scholar] [CrossRef]
- Krietemeyer, A.; van der Marel, H.; van de Giesen, N.; ten Veldhuis, M.C. High quality zenith tropospheric delay estimation using a low-cost dual-frequency receiver and relative antenna calibration. Remote Sens. 2020, 12, 1393. [Google Scholar] [CrossRef]
- Hoque, M.M.; Jakowski, N. Estimate of higher order ionospheric errors in GNSS positioning. Radio Sci. 2008, 43, 1–15. [Google Scholar] [CrossRef]
- Wang, M.; Li, B. Evaluation of Empirical Tropospheric Models Using Satellite-Tracking Tropospheric Wet Delays with Water Vapor Radiometer at Tongji, China. Sensors 2016, 16, 186. [Google Scholar] [CrossRef]
- Odolinski, R.; Teunissen, P.J. An assessment of smartphone and low-cost multi-GNSS single-frequency RTK positioning for low, medium and high ionospheric disturbance periods. J. Geod. 2018, 93, 701–722. [Google Scholar] [CrossRef]
- Hamza, V.; Stopar, B.; Ambrožič, T.; Sterle, O. Performance evaluation of low-cost multi-frequency gnss receivers and antennas for displacement detection. Appl. Sci. 2021, 11, 6666. [Google Scholar] [CrossRef]
- Hamza, V.; Stopar, B.; Sterle, O.; Pavlovčič-Prešeren, P. Observations and positioning quality of low-cost GNSS receivers: A review. GPS Solut. 2024, 28, 149. [Google Scholar] [CrossRef]
- Xue, C.; Psimoulis, P.; Horsfall, A.; Zhang, Q.; Meng, X. Assessment of the accuracy of low-cost multi-GNSS receivers in monitoring dynamic response of structures. Appl. Geomat. 2023, 15, 315–326. [Google Scholar] [CrossRef]
- Yang, Z.; Liu, Z. Observational study of ionospheric irregularities and GPS scintillations associated with the 2012 tropical cyclone Tembin passing Hong Kong. J. Geophys. Res. Space Phys. 2016, 121, 4705–4717. [Google Scholar] [CrossRef]
- Yang, Z.; Liu, Z. Low-latitude ionospheric density irregularities and associated scintillations investigated by combining COSMIC RO and ground-based Global Positioning System observations over a solar active period. J. Geophys. Res. Space Phys. 2018, 123, 3998–4014. [Google Scholar] [CrossRef]
- Kashcheyev, A.; Nava, B.; Radicella, S.M. Estimation of higher-order ionospheric errors in GNSS positioning using a realistic 3-D electron density model. Radio Sci. 2012, 47, 1–7. [Google Scholar] [CrossRef]
- Geng, J.; Yang, S.; Guo, J. Assessing IGS GPS/Galileo/BDS-2/BDS-3 phase bias products with PRIDE PPP-AR. Satell. Navig. 2021, 2, 17. [Google Scholar] [CrossRef]
- Kapil, C.; Seemala, G.K.; Katual, I.; Dimri, A. Ionospheric response to PPEF events in the Indian region during high and low intense geomagnetic storms. Adv. Space Res. 2024, 73, 4329–4341. [Google Scholar] [CrossRef]
- Fuller-Rowell, T.J.; Codrescu, M.V.; Moffett, R.J.; Quegan, S. Response of the thermosphere and ionosphere to geomagnetic storms. J. Geophys. Res. Space Phys. 1994, 99, 3893–3914. [Google Scholar] [CrossRef]
- Prölss, G.W. Density perturbations in the upper atmosphere caused by the dissipation of solar wind energy. Surv. Geophys. 2011, 32, 101–195. [Google Scholar] [CrossRef]
- Kumar, V.V.; Parkinson, M.L. A global scale picture of ionospheric peak electron density changes during geomagnetic storms. Space Weather 2017, 15, 637–652. [Google Scholar] [CrossRef]
- Linty, N.; Minetto, A.; Dovis, F.; Spogli, L. Effects of phase scintillation on the GNSS positioning error during the September 2017 storm at Svalbard. Space Weather 2018, 16, 1317–1329. [Google Scholar] [CrossRef]
- Zhao, D.; Cui, S.; Zhang, X.; Li, L.; Sun, P.; Bian, C.; Ban, W.; Hancock, C.M.; Wang, Q.; Zhang, K. Analysis of global ionospheric scintillation and GPS positioning interference triggered by full-halo CME-driven geomagnetic storm: A case study. Adv. Space Res. 2024, 74, 2492–2509. [Google Scholar] [CrossRef]
- Mou, Y.; Luo, X.; Xie, Z.; Peng, X. Performance analysis of four PPP service software under different intensity geomagnetic storms. Adv. Space Res. 2023, 72, 1593–1604. [Google Scholar] [CrossRef]
- Younas, W.; Nishimura, Y.; Liao, W.; Semeter, J.L.; Mrak, S.; Morton, Y.J.; Groves, K.M. Spatio-temporal evolution of mid-latitude GPS scintillation and position errors during the May 2024 solar storm. J. Geophys. Res. Space Phys. 2025, 130, e2025JA033839. [Google Scholar] [CrossRef]
Disclaimer/Publisher’s Note: The statements, opinions and data contained in all publications are solely those of the individual author(s) and contributor(s) and not of MDPI and/or the editor(s). MDPI and/or the editor(s) disclaim responsibility for any injury to people or property resulting from any ideas, methods, instructions or products referred to in the content. |
© 2025 by the authors. Licensee MDPI, Basel, Switzerland. This article is an open access article distributed under the terms and conditions of the Creative Commons Attribution (CC BY) license (https://creativecommons.org/licenses/by/4.0/).