Article

Subsidence in Qinghai—Tibet Plateau Peatlands Driven by Drainage Disturbance and Climatic Variability

1
Northeast Institute of Geography and Agroecology, Chinese Academy of Sciences, Changchun 130102, China
2
University of the Chinese Academy of Sciences, Beijing 100049, China
*
Author to whom correspondence should be addressed.
Geosciences 2025, 15(11), 407; https://doi.org/10.3390/geosciences15110407
Submission received: 15 September 2025 / Revised: 15 October 2025 / Accepted: 18 October 2025 / Published: 22 October 2025
(This article belongs to the Section Climate and Environment)

Abstract

Peatlands are globally important carbon sinks, yet these are increasingly threatened by climate change and human disturbances. Among degradation indicators, surface subsidence is gradual and challenging to monitor, particularly in alpine peatlands. This study applied SBAS-InSAR techniques to analyze surface deformation in the Zoige peatland of the eastern Qinghai—Tibet Plateau using Sentinel-1 SAR data from 2017 to 2023. The results showed a maximum interannual subsidence of −167.92 mm and a peak seasonal deformation of −144.11 mm, with a cumulative average of −23.99 mm (−3.43 mm·yr−1). Approximately 80.9% of peatlands within the protected area exhibited subsidence. Drainage ditch construction emerged as the dominant driver, while climatic factors such as precipitation and temperature exhibited seasonal effects. Subsidence was more pronounced in drier years and during winter months. These findings highlight the spatial heterogeneity and seasonal dynamics of peatland subsidence and underscore the urgent need for hydrological restoration and long-term monitoring to mitigate degradation in alpine peatland ecosystems.

1. Introduction

Peatlands are formed through the slow accumulation of partially decomposed organic matter and represent one of the most effective long-term carbon sinks on Earth [1]. Although they occupy only 2.8–3.0% of the global land surface, peatlands store approximately 50–70 billion tons of carbon—about one-quarter of the global soil carbon pool—making them vital for climate regulation [2,3,4]. In addition to their role in carbon storage, peatlands contribute to water regulation, flood mitigation, and biodiversity support [5,6]. However, extensive peatland degradation has been observed globally due to land conversion, drainage, and climate change. Since 1700, an estimated 10–15% of global peatlands have been disturbed, with substantial losses reported in Southeast Asia, Europe, and North America [7,8].
With the growing concern about peatland degradation, remote sensing—particularly Interferometric Synthetic Aperture Radar (InSAR)—is increasingly recognized as a reliable tool for quantifying vertical deformation related to drainage and carbon loss. Recent studies across Southeast Asia, northern Europe, and boreal regions demonstrate the capability of InSAR time series to detect peat subsidence associated with water-table decline, land-use change, and restoration efforts [9,10,11]. These advances provide valuable global references for large-scale peatland monitoring and form a basis for assessments in alpine systems such as the Zoige Plateau.
Peatland degradation is typically characterized by declining water tables, altered vegetation composition, increased carbon emissions, and surface subsidence [9,12]. Among these, subsidence reflects cumulative hydrological and structural degradation but is often rarely addressed due to its gradual nature and the technical challenges of monitoring it accurately over large, remote areas [10]. Recent studies have reported high subsidence rates in lowland agricultural peatlands—for instance, up to 50 cm·yr−1 in Indonesia and 9.5 cm·yr−1 in drained peat forests of Europe [13,14,15,16]. However, high-altitude peatlands remain insufficiently characterized, especially concerning long-term deformation and its climatic or anthropogenic drivers [11,17,18,19].
The Zoige Plateau, located on the eastern Qinghai—Tibet Plateau, contains one of the world’s largest high-altitude peatland complexes [20]. It plays a key role in carbon sequestration and alpine hydrological regulation [21]. Since the 1960s, widespread drainage, peat reclamation, and overgrazing have led to significant hydrological alteration and ecosystem degradation in the region [22]. Drainage-induced drying and compaction have caused observable surface subsidence, yet its magnitude remains poorly quantified [23,24,25,26,27,28]. Given the vulnerability of this ecosystem to both climatic extremes and human disturbance, reliable, large-scale monitoring tools are urgently needed to assess ongoing changes and inform conservation strategies.
Synthetic Aperture Radar (SAR), particularly Sentinel-1 data combined with InSAR techniques, offers a cost-effective and weather-independent approach for subsidence monitoring [29,30,31,32,33,34]. In recent years, InSAR has been increasingly applied to peatland ecosystems worldwide. For example, one study [35] used the APSIS-DInSAR technique to map spatial patterns of tropical peatland subsidence in Malaysia, while another [36] compared subsidence between drained and restored peatlands in Indonesia using Sentinel-1 data. In northern temperate zones, validation of InSAR-derived deformation against field observations in UK peatlands demonstrated high consistency and potential for long-term ecological monitoring [11]. Similar approaches have also been applied to cold-region peatlands, where InSAR revealed thaw-related deformation in permafrost-affected bogs [37]. Together, these studies highlight the versatility of InSAR for quantifying peatland degradation under diverse climatic and management conditions, providing valuable methodological insight for alpine ecosystems such as the Zoige Plateau.
Among InSAR methods, the SBAS-InSAR technique is particularly effective for capturing gradual, spatially distributed subsidence in vegetated and hydrologically dynamic environments such as peatlands [38,39,40,41]. This study advances the current knowledge by providing the first long-term SBAS-InSAR assessment of alpine peatland deformation on the Qinghai—Tibet Plateau and by integrating climatic and anthropogenic factors through a GeoDetector framework to quantitatively disentangle their relative influences. The approach offers a transferable framework for monitoring and attributing peatland subsidence in other high-altitude ecosystems. Accordingly, this study aims to: (1) quantify the magnitude and spatial–temporal patterns of peatland subsidence in the Zoige region using SBAS-InSAR; (2) identify and quantify the relative influence of climatic and anthropogenic factors through GeoDetector analysis; and (3) evaluate the implications of these findings for hydrological restoration and peatland management in alpine ecosystems.

2. Materials and Methods

2.1. Study Area

This study was conducted in the Zoige Plateau Basin, located in Sichuan Province on the eastern margin of the Qinghai—Tibet Plateau. This region contains the world’s largest and best-preserved alpine peatland system, shaped by unique geological, hydrological, and climatic conditions (Figure 1). A national survey in the 1980s identified 220 large and medium-sized peatlands, covering approximately 2228 km2 [42,43]. The climate is cold and humid, with long winters and a short growing season. The mean temperature in January is −10.6 °C, in July it is 10.8 °C, and the annual mean is 1.4 °C. Annual precipitation averages 720 mm [44].

2.2. SAR Data

A total of 574 Sentinel-1A SAR images (IW mode, VV (vertical–vertical) polarization) acquired between January 2017 and December 2023 were used for surface deformation analysis. The data were obtained from the Copernicus Open Access Hub (https://www.copernicus.eu/en/access-data/conventional-data-access-hubs, accessed on 25 May 2024) and processed at Level-1 Single Look Complex (SLC) format. Each scene has a spatial resolution of 5 m (range) × 20 m (azimuth). Approximately 10–12 scenes per year were selected based on coverage and coherence.

2.3. Peatland Classification Using Multi-Source Remote Sensing

To extract peatland distribution and support subsidence interpretation, a land cover classification was developed on the Google Earth Engine (GEE) platform using Sentinel-2 multispectral imagery and Sentinel-1 SAR backscatter data. Seventeen input features, including spectral bands and indices, were used (e.g., NDVI, NDWI, ARI, SDWI, VV, VH; Table 1), and training samples were collected from field surveys and high-resolution imagery. A Random Forest classifier was used for supervised classification, and accuracy was assessed using a confusion matrix with a 70/30 train-validation split. Overall accuracy reached 88.75%, with a Kappa coefficient of 0.82. Peatland and water bodies showed the highest classification accuracy due to their distinct spectral characteristics, while impervious surfaces had relatively lower accuracy.

2.4. InSAR Processing and Deformation Retrieval

Surface deformation was retrieved using SBAS-InSAR method [40,41,51]. SBAS-InSAR processing was conducted in ENVI SARscape 5.6 following a standard four-step workflow: (1) Interferogram Network Construction: Image pairs with spatial baseline < 200 m and temporal baseline < 180 days were selected. A super-master image was chosen to maximize coherence. (2) Interferometric Processing: Co-registration, interferogram generation, topographic phase removal (using the 30 m SRTM DEM), coherence estimation, and phase unwrapping were performed. Multi-looking was set to 8 × 2 (range × azimuth). (3) Time Series Inversion: Atmospheric noise was suppressed using spatial low-pass filtering (radius: 1600 m) and temporal high-pass filtering (365-day window). Displacement time series were resolved using Singular Value Decomposition (SVD). (4) Geocoding and LOS-to-Vertical Conversion: Deformation was geocoded and converted from line-of-sight to vertical displacement assuming near-vertical radar incidence.

2.5. Accuracy Assessment

The accuracy of SBAS-InSAR–derived deformation was evaluated using both internal indicators and external reference data. Interferometric coherence ( γ ) was used as the primary internal quality metric to assess the reliability of phase information across image pairs.
Coherence was calculated within a local moving window using the following expression:
γ = S 1 · S 2 * S 1 2 · S 2 2
where S 1 and S 2 * denote the complex SAR images from the master and slave acquisitions, and · represents spatial averaging over a defined kernel (5 × 5 pixels). Pixels with persistently low coherence were excluded from time-series analysis to reduce phase noise and improve result stability.
External validation was conducted using GNSS time series data from the GSMA station (longitude 102.06° E, latitude 34.02° N; elevation 3562.84 m), obtained from the Eastern Deformation Data Center (https://www.eqdsc.com/, accessed on 25 March 2025). Due to the absence of GNSS stations within the study area, this station—located approximately 35 km from the monitoring area—was used as the nearest available reference. The SBAS-InSAR pixel closest to the GNSS location was extracted, and the two displacement time series were compared using root mean square error (RMSE) to evaluate consistency.

2.6. Analysis of Subsidence Drivers

To explore the drivers of peatland subsidence, two types of explanatory variables were analyzed: climatic and anthropogenic. Climate variables included mean annual temperature (MAT) and mean annual precipitation (MAP), derived from the China 1 km gridded dataset (National Earth System Science Data Center, http://www.geodata.cn, accessed on 20 June 2025). Changes were calculated by comparing 1961–1990 and 1991–2023 averages. Anthropogenic variables included livestock density (2012–2022), distance to drainage ditches (DTD), and distance to roads (DTR).
Spatial relationships between subsidence and these variables were assessed using the GeoDetector model [52,53], which quantifies the explanatory power (q) of each factor based on spatial stratified heterogeneity. The underlying assumption of the model is that if an explanatory factor significantly influences the spatial distribution of a dependent variable, the spatial patterns of the two should be similar. Continuous variables were stratified using the natural breaks (Jenks) classification method to minimize within-group variance and maximize between-group variance. The q-statistic is calculated as follows:
q = 1 h = 1 L N h σ h 2 N σ 2
where N h is the number of samples in the hth stratum, σ h 2 is the variance within the hth stratum, N is the total number of samples, and σ 2 is the overall variance. All variables were resampled to a common spatial resolution and aligned with the InSAR-derived subsidence maps for pixel-wise comparison. The GeoDetector analysis was conducted using GeoDetector v2.0 (available at http://www.geodetector.cn, accessed on 20 June 2025) implemented in Arcgis 10.8. In addition, we incorporated long-term daily snow depth data from the China long-term snow depth dataset (1978–2024, 0.25° resolution; National Tibetan Plateau Data Center, http://data.tpdc.ac.cn, accessed on 10 August 2025) [54], which were aggregated to winter means for comparison with subsidence. Detailed procedures and results are provided in Supplementary Table S1.

3. Results

3.1. Peatland Classification Accuracy

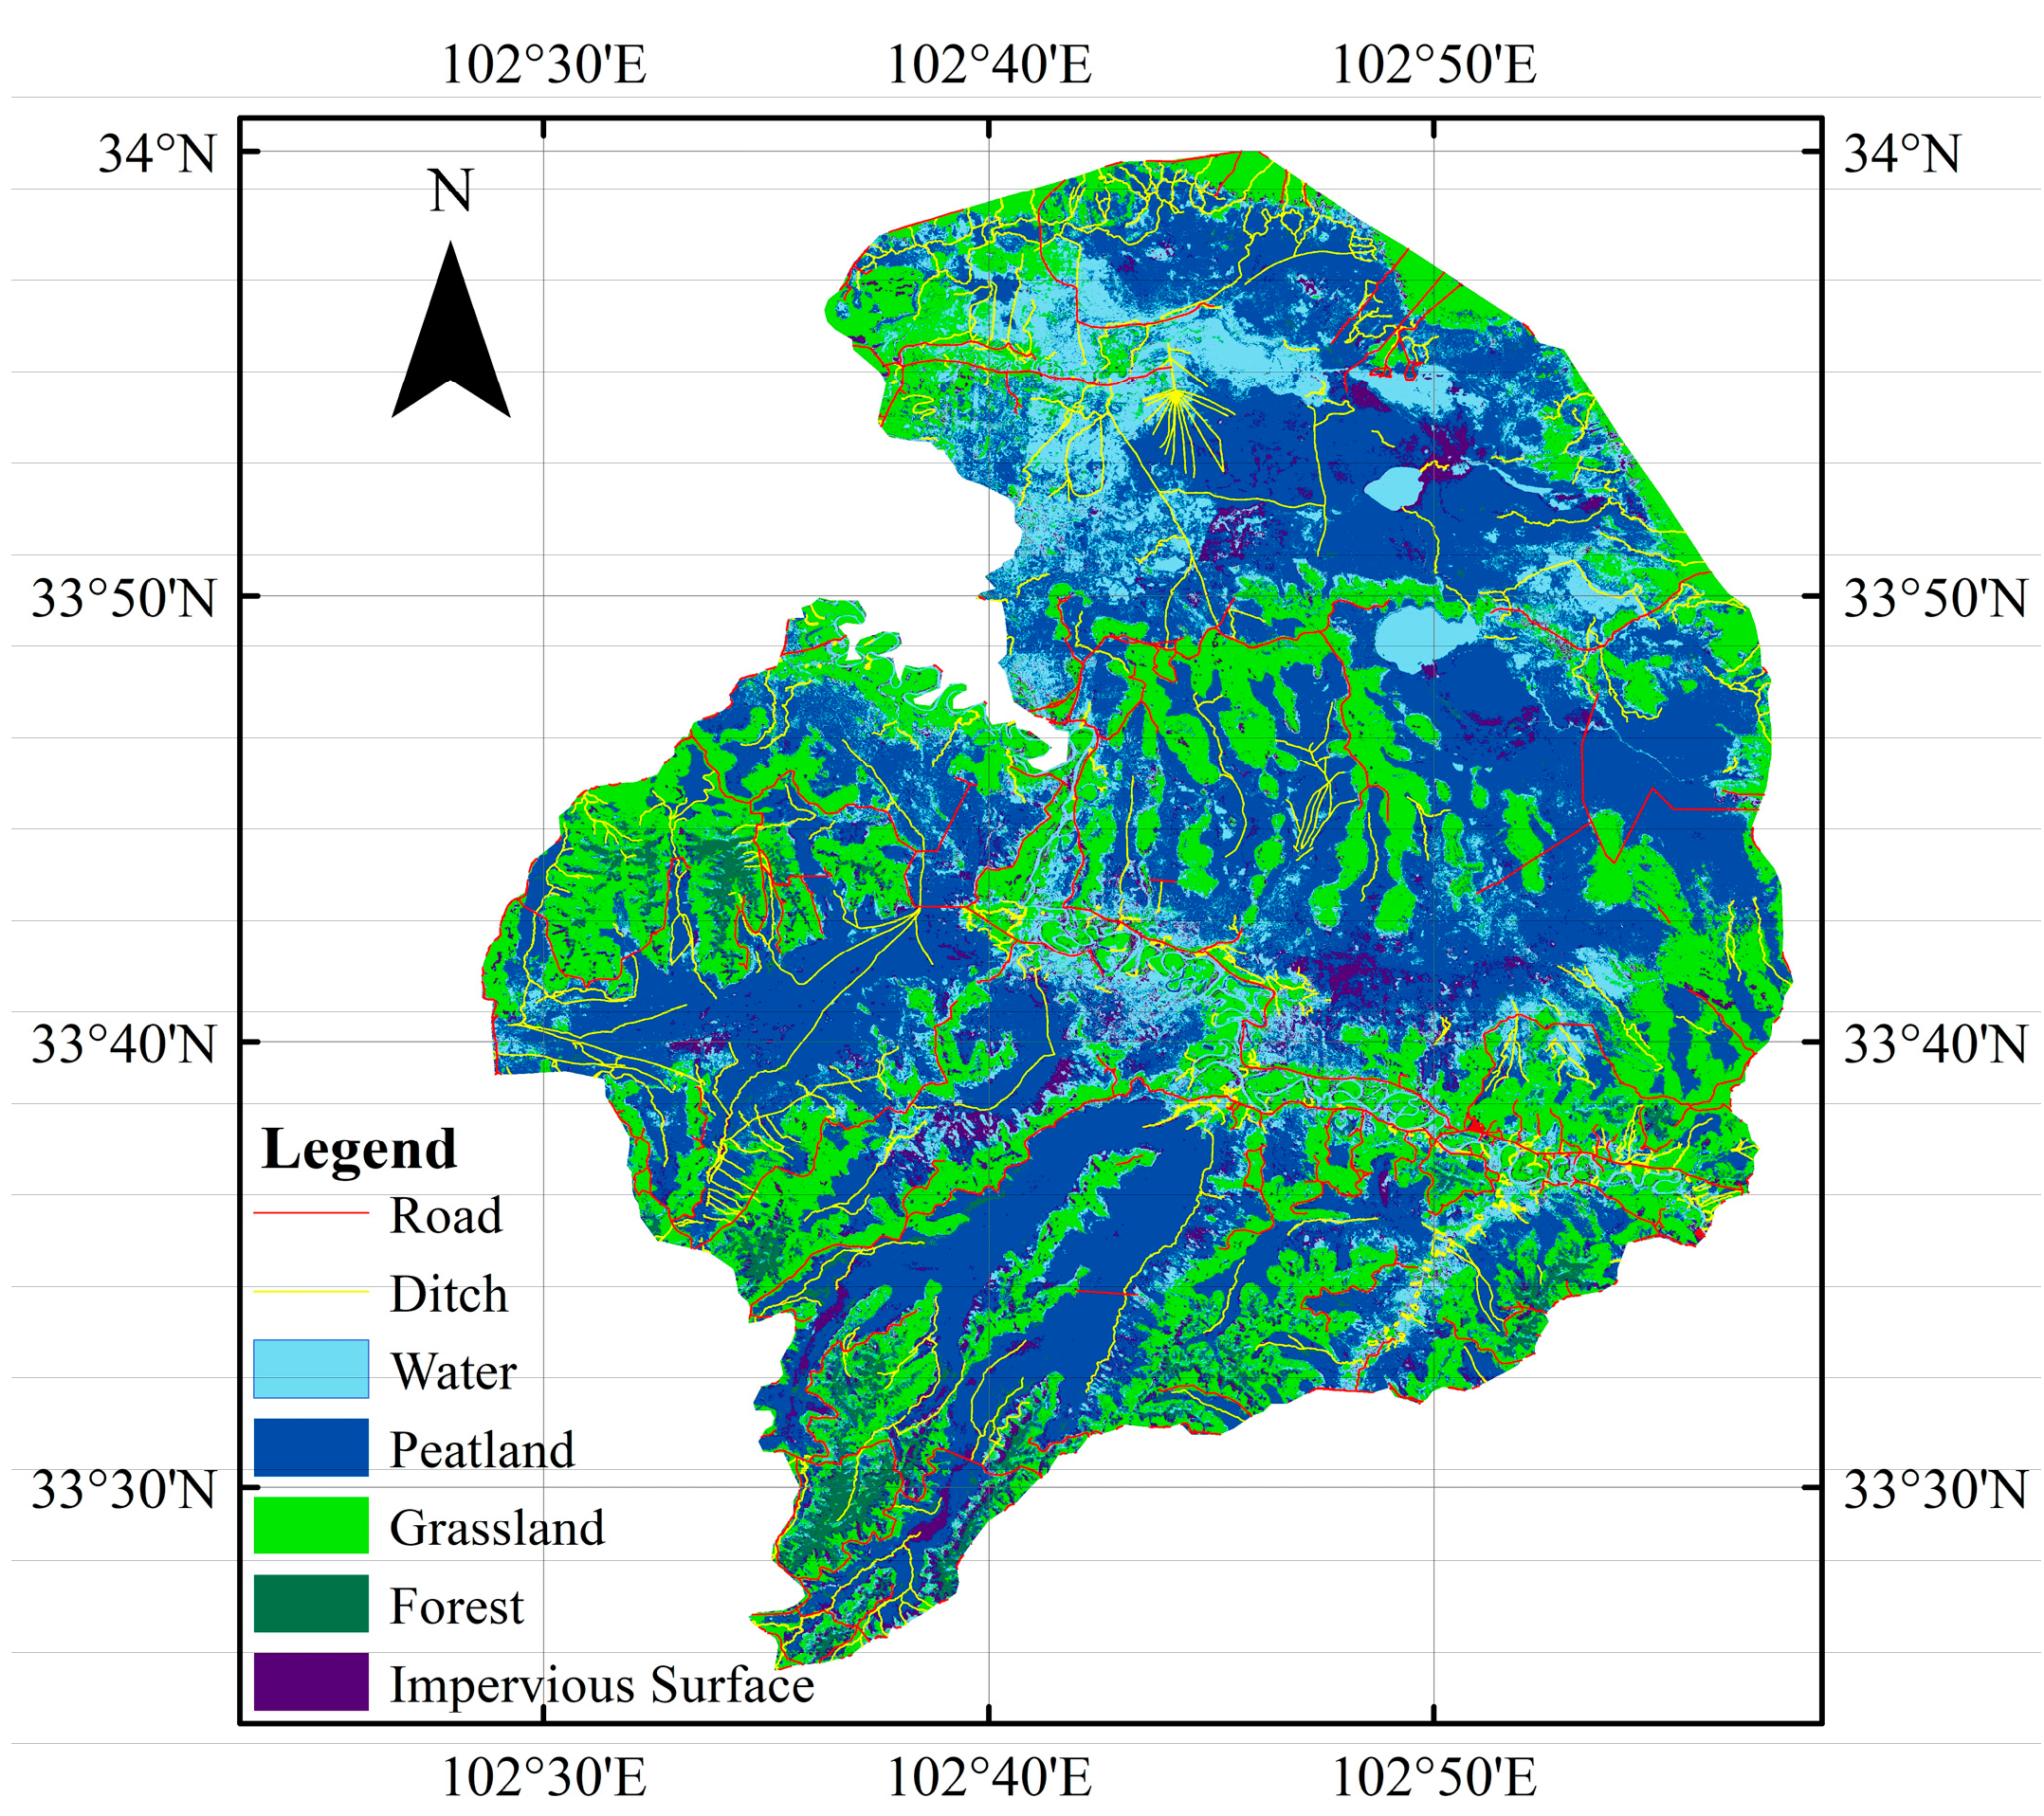
Land cover classification based on Sentinel-2 and Sentinel-1 data using the Random Forest algorithm successfully delineated major land cover types within the Zoige region (Figure 2). The classified categories included water bodies, peatlands, grasslands, forests, and impervious surfaces. Among these, peatlands accounted for 953 km2 within the protected area, followed by grassland (539 km2), water surface (392 km2), built-up land (122 km2), and forest (48 km2).
The classification model achieved an overall accuracy of 88.75% and a Kappa coefficient of 0.82. Peatland and water surfaces exhibited the highest classification accuracy, with producer and user accuracies exceeding 90%. Impervious surfaces had the lowest accuracy, likely due to their small area and spectral confusion with other land types.

3.2. SBAS-InSAR Accuracy Evaluation

Temporal coherence (γ) varied across both time and space throughout the monitoring period. Based on interferometric stack averaging, annual γ declined from 0.41 ± 0.09 in 2017 to 0.24 ± 0.12 in 2021, with a partial recovery to 0.27 ± 0.11 in 2023. Spatially, coherence was higher in flat and unvegetated areas, while peat-rich zones with dense vegetation and complex topography exhibited lower coherence (Supplementary Figure S1).
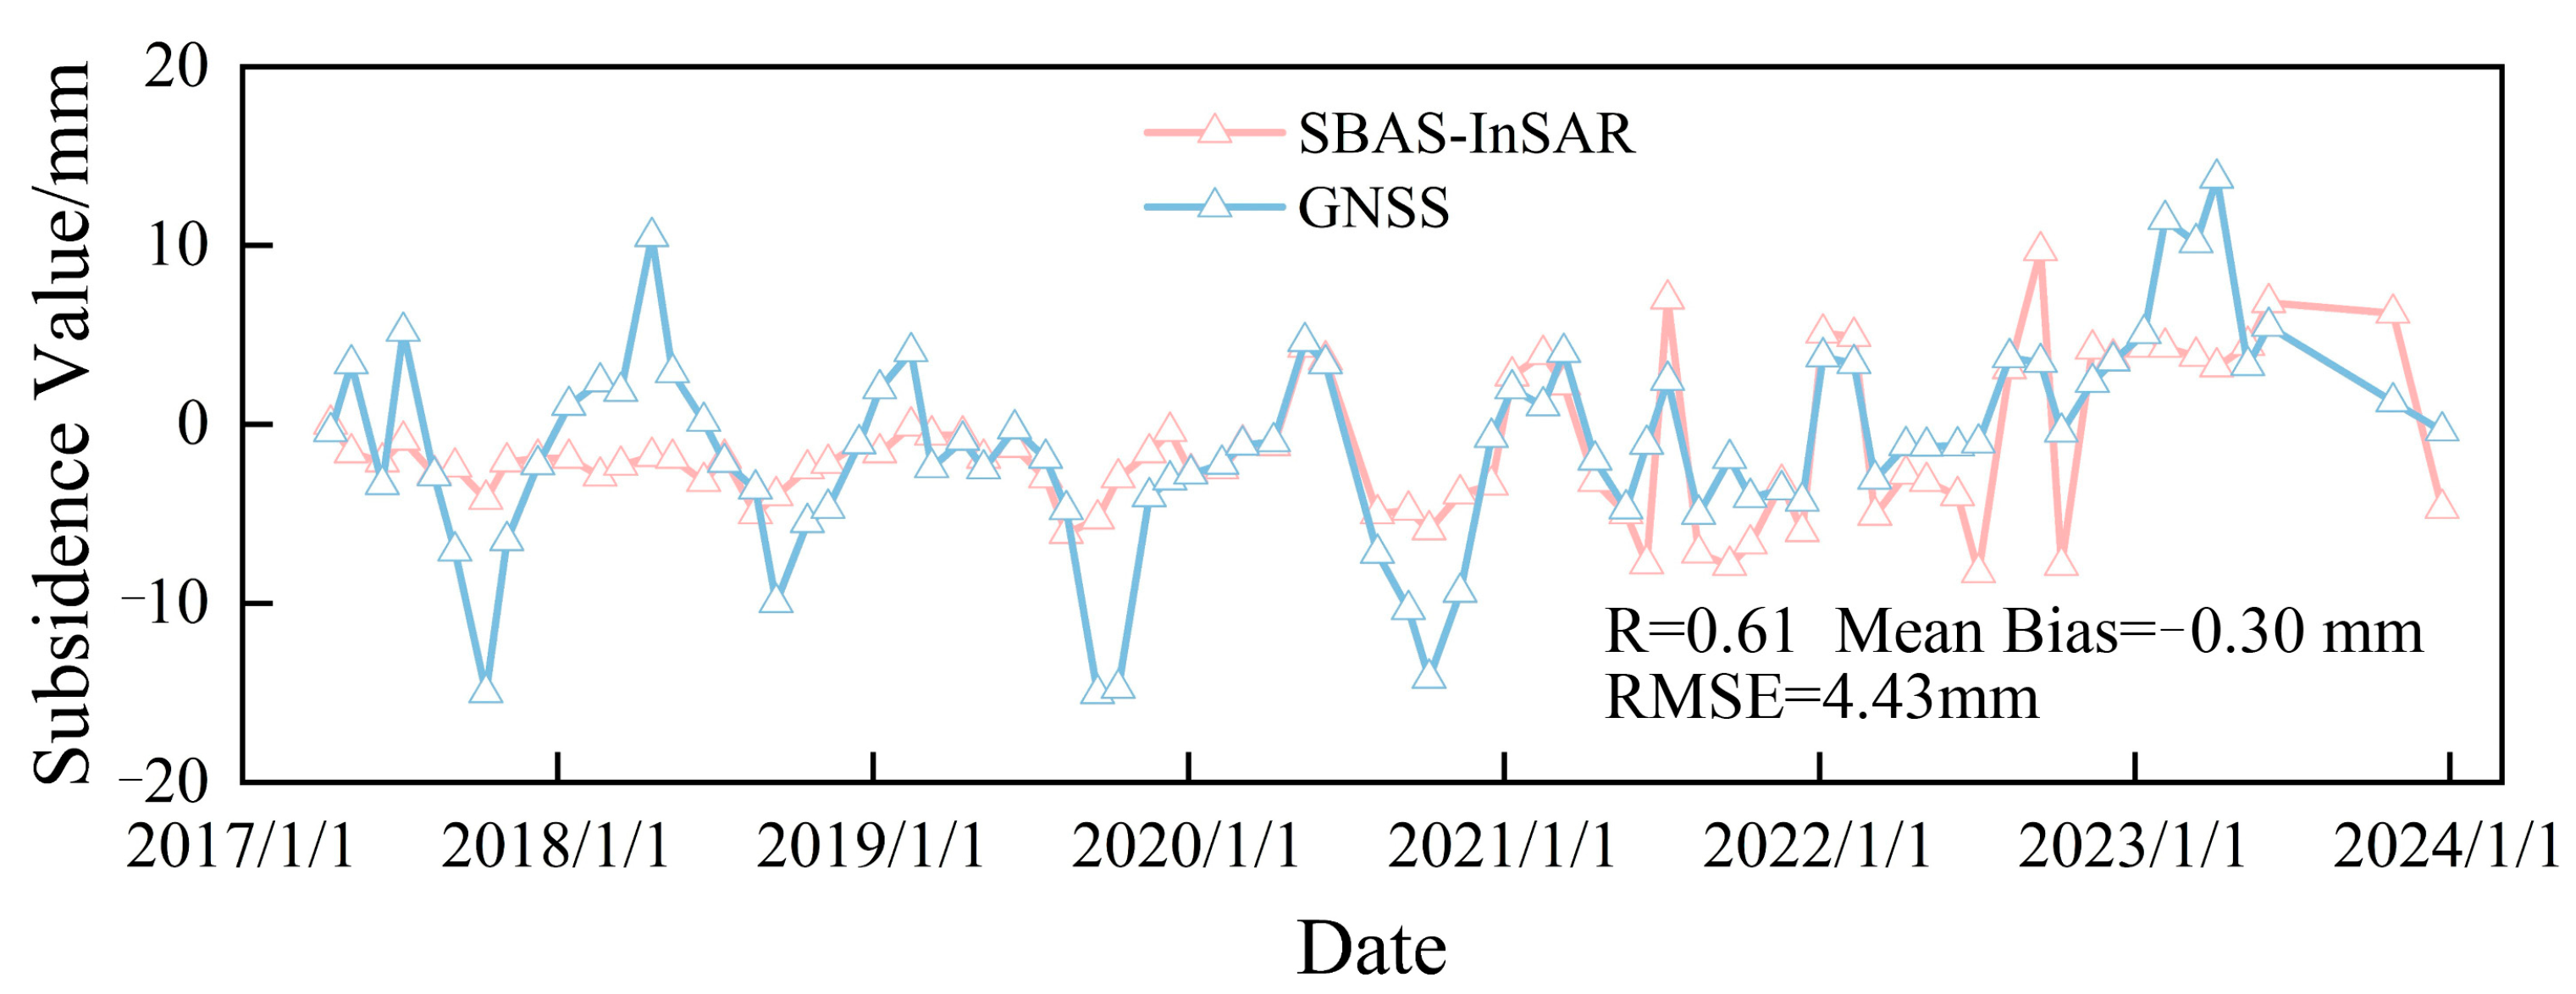
Due to the absence of GNSS stations within the study area, validation of SBAS-InSAR displacement time series was performed using the GSMA GNSS station (102.06° E, 34.02° N; 3562.84 m a.s.l.), located approximately 35 km from the monitoring region. After spatial alignment and projection of InSAR line-of-sight (LOS) deformation into vertical displacement, the SBAS-InSAR and GNSS time series showed strong temporal consistency, with a correlation coefficient (R) of 0.61, a mean bias of −0.30 mm, and a root mean square error (RMSE) of 4.43 mm (Figure 3).
Although the general deformation trends were consistent, the GNSS data exhibited a larger seasonal amplitude (up to ±10 mm) than the SBAS-InSAR results. This difference reflects the contrasting characteristics of the two observation techniques: GNSS provides point-based daily measurements that record localized frost-heave and soil-moisture variations, while SBAS-InSAR represents deformation averaged over 30 m pixels and 6–12-day intervals, which smooths short-term changes. Small residual errors introduced during LOS-to-vertical projection may also contribute to the difference in amplitude. Despite these discrepancies, the consistent overall patterns and the low RMSE indicate that the SBAS-InSAR results are reliable for long-term monitoring of peatland surface deformation in the eastern Qinghai—Tibet Plateau.

3.3. Seasonal Patterns of Subsidence

Seasonal deformation patterns derived from SBAS-InSAR revealed substantial intra-annual variability across the Zoige peatland. The most pronounced seasonal deformation occurred in December 2018, reaching −144.11 mm. In contrast, 2023 exhibited the smallest annual mean seasonal deformation (−5.05 mm), whereas minor surface uplift was observed in 2017 (2.18 mm) (see Figure 4 for 2023 and Supplementary Figure S2 for other years).
Winter subsidence was consistently more pronounced, particularly in central and northern regions. For instance, in 2023, the average seasonal deformation reached −14.88 mm in the central zone, compared to −1.68 mm in the south. Spatial variation also showed that western and northern regions experienced moderate seasonal deformation (−7.33 mm and −7.14 mm, respectively), while eastern regions had the lowest seasonal rates (−3.40 mm). These seasonal patterns reflected interactions between freeze–thaw processes, vegetation growth cycles, and anthropogenic stress. A comparison between winter mean snow depth and InSAR-derived subsidence during 2017–2023 showed no significant correlation, suggesting that the pronounced winter subsidence was not directly controlled by interannual snow cover variations (see Supplementary Table S1 and Figure S3).

3.4. Interannual Patterns of Subsidence

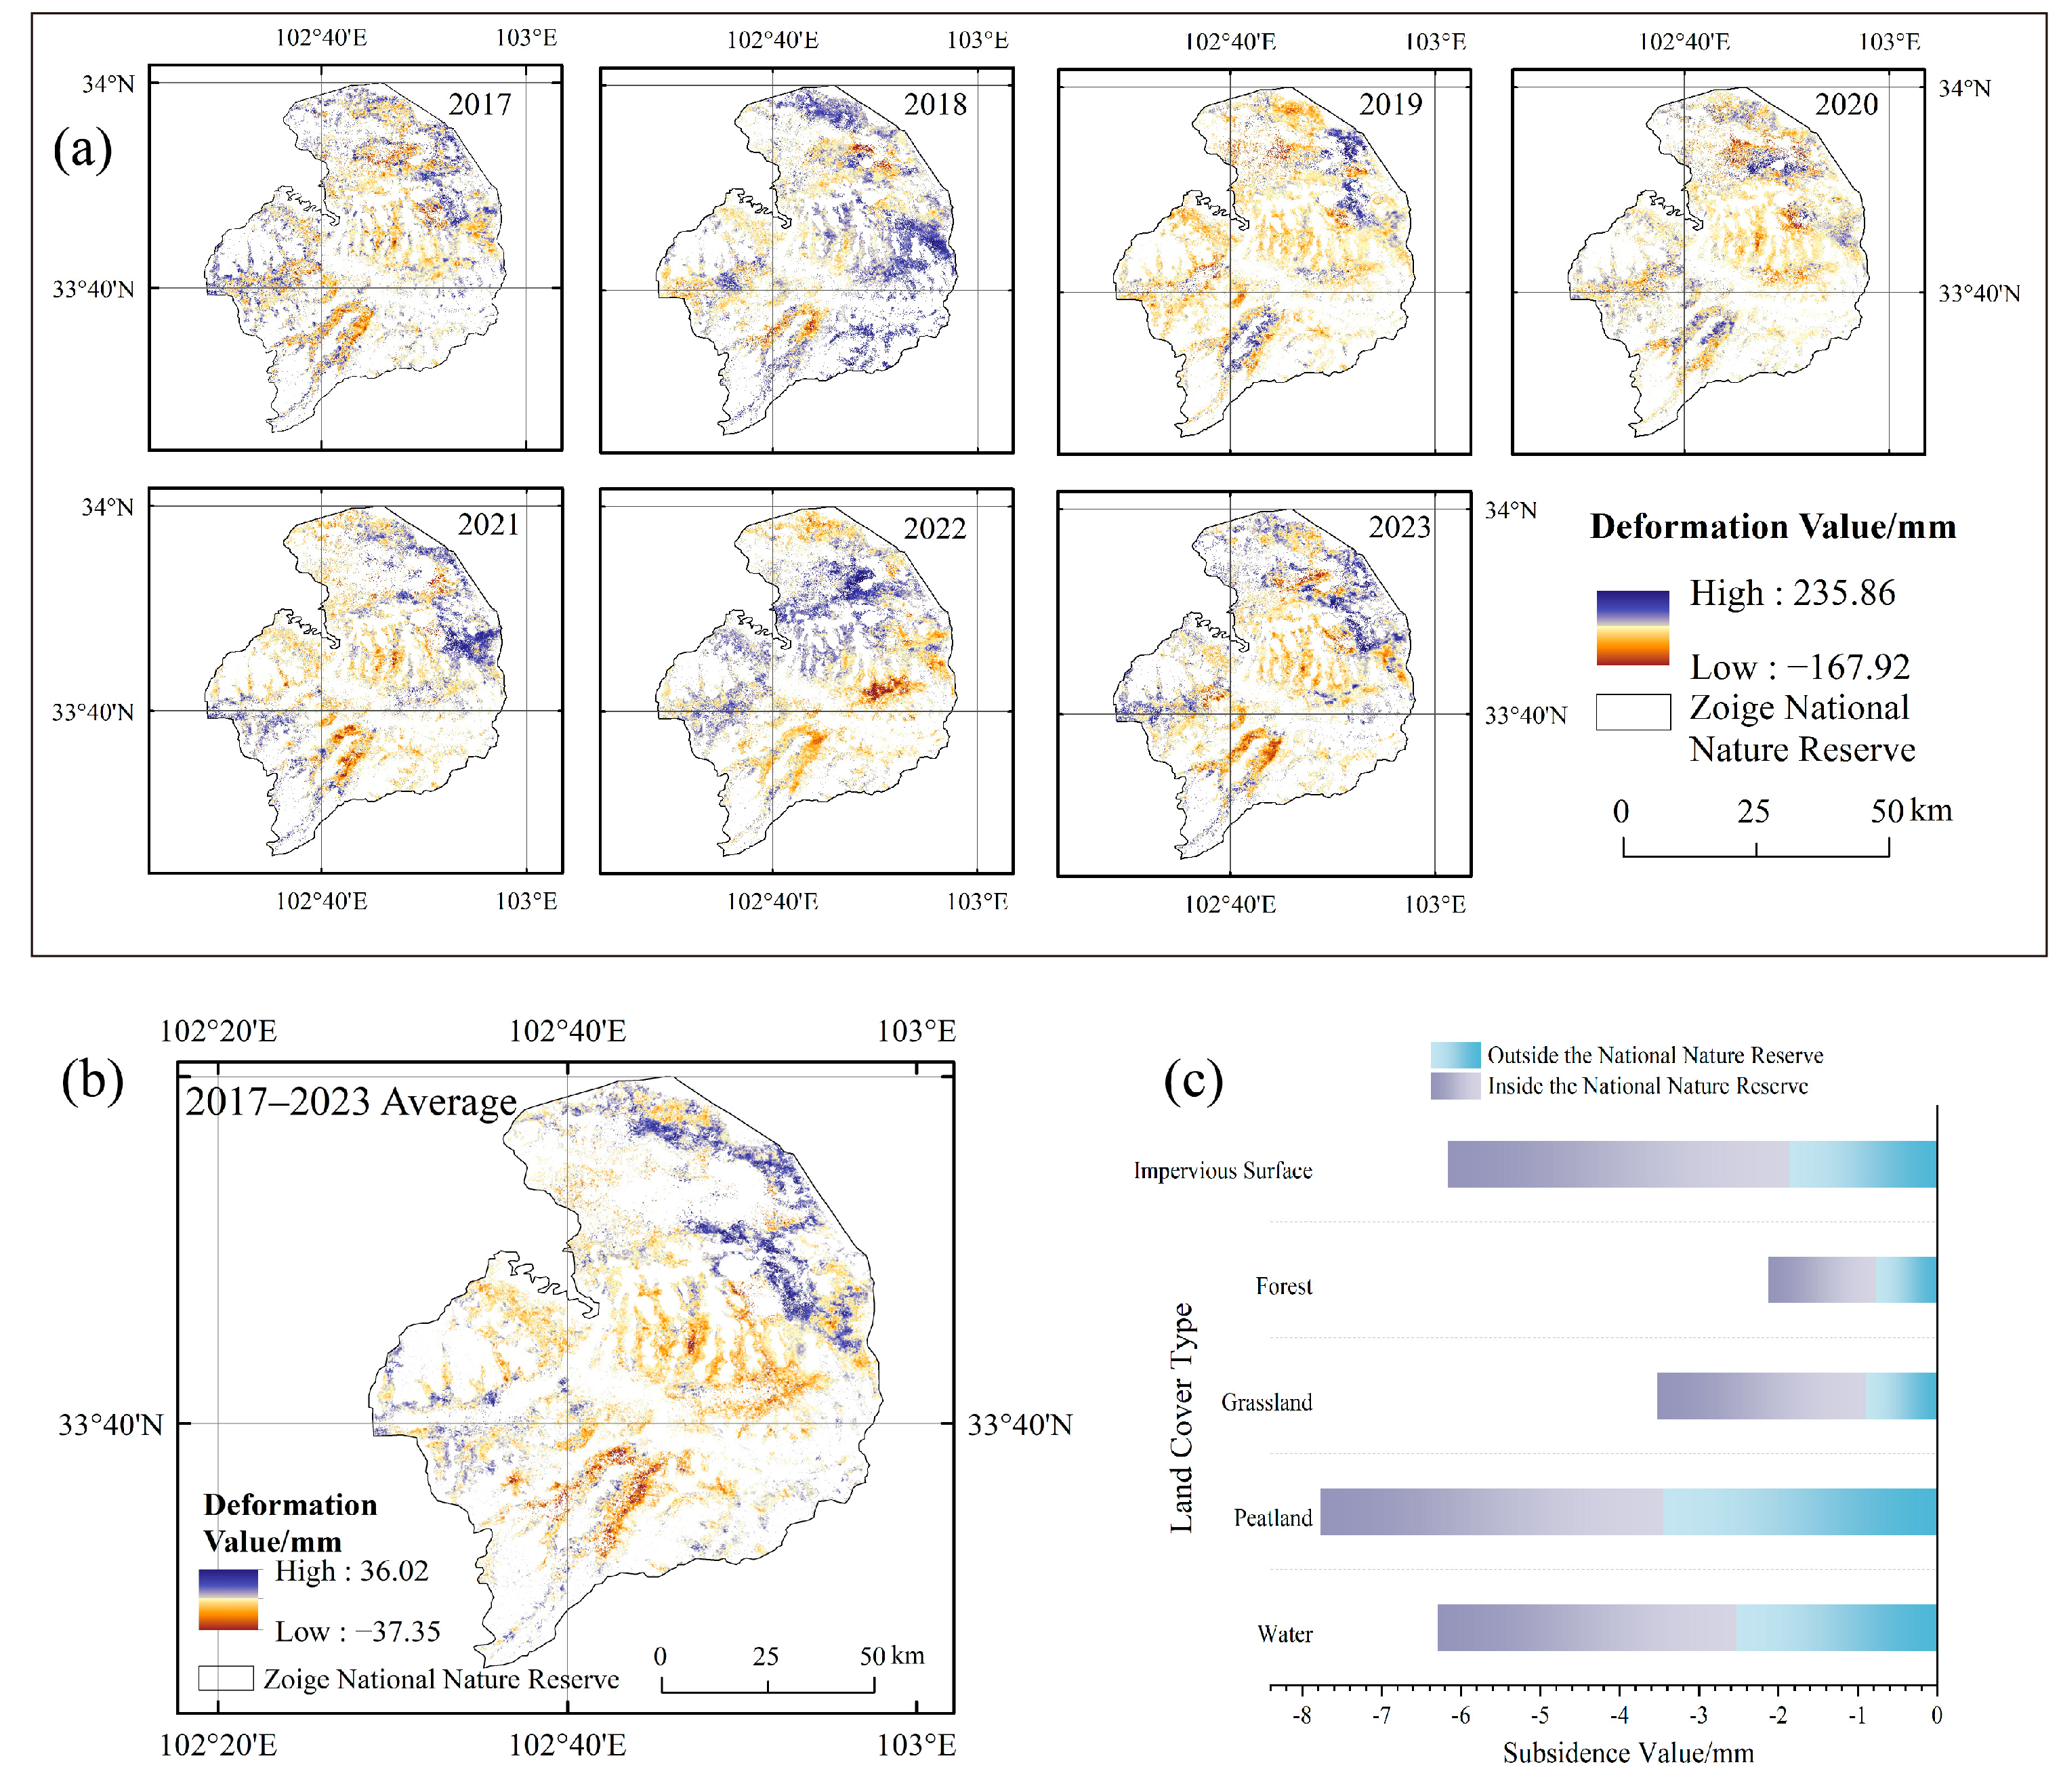
Interannual deformation from 2017 to 2023 revealed persistent and heterogeneous subsidence across the peatland (Figure 5). Maximum deformation occurred in 2020 (−167.92 mm), followed by −163.68 mm in 2018 and −158.83 mm in 2017. The annual average subsidence over the study period was −3.43 mm·yr−1, with a cumulative displacement of −23.99 mm.
Regionally, 74.2% of peatlands showed measurable subsidence, with 80.9% of those within the protected area also exhibiting vertical deformation. The central region displayed the greatest average annual subsidence (−28.92 mm·yr−1), followed by the west (−11.79 mm), north (−10.9 mm), and east (−6.82 mm). The southern region showed the least deformation (−4.25 mm·yr−1), indicating spatially uneven vulnerability to subsidence. Comparison across land cover types revealed the highest subsidence rate in peatlands (−3.43 mm·yr−1), followed by water bodies (−2.53 mm), impervious surfaces (−1.86 mm), grasslands (−0.90 mm), and forests (−0.77 mm). Notably, subsidence within protected areas was more severe than outside, suggesting persistent degradation despite formal conservation status.

3.5. Drivers of Peatland Subsidence

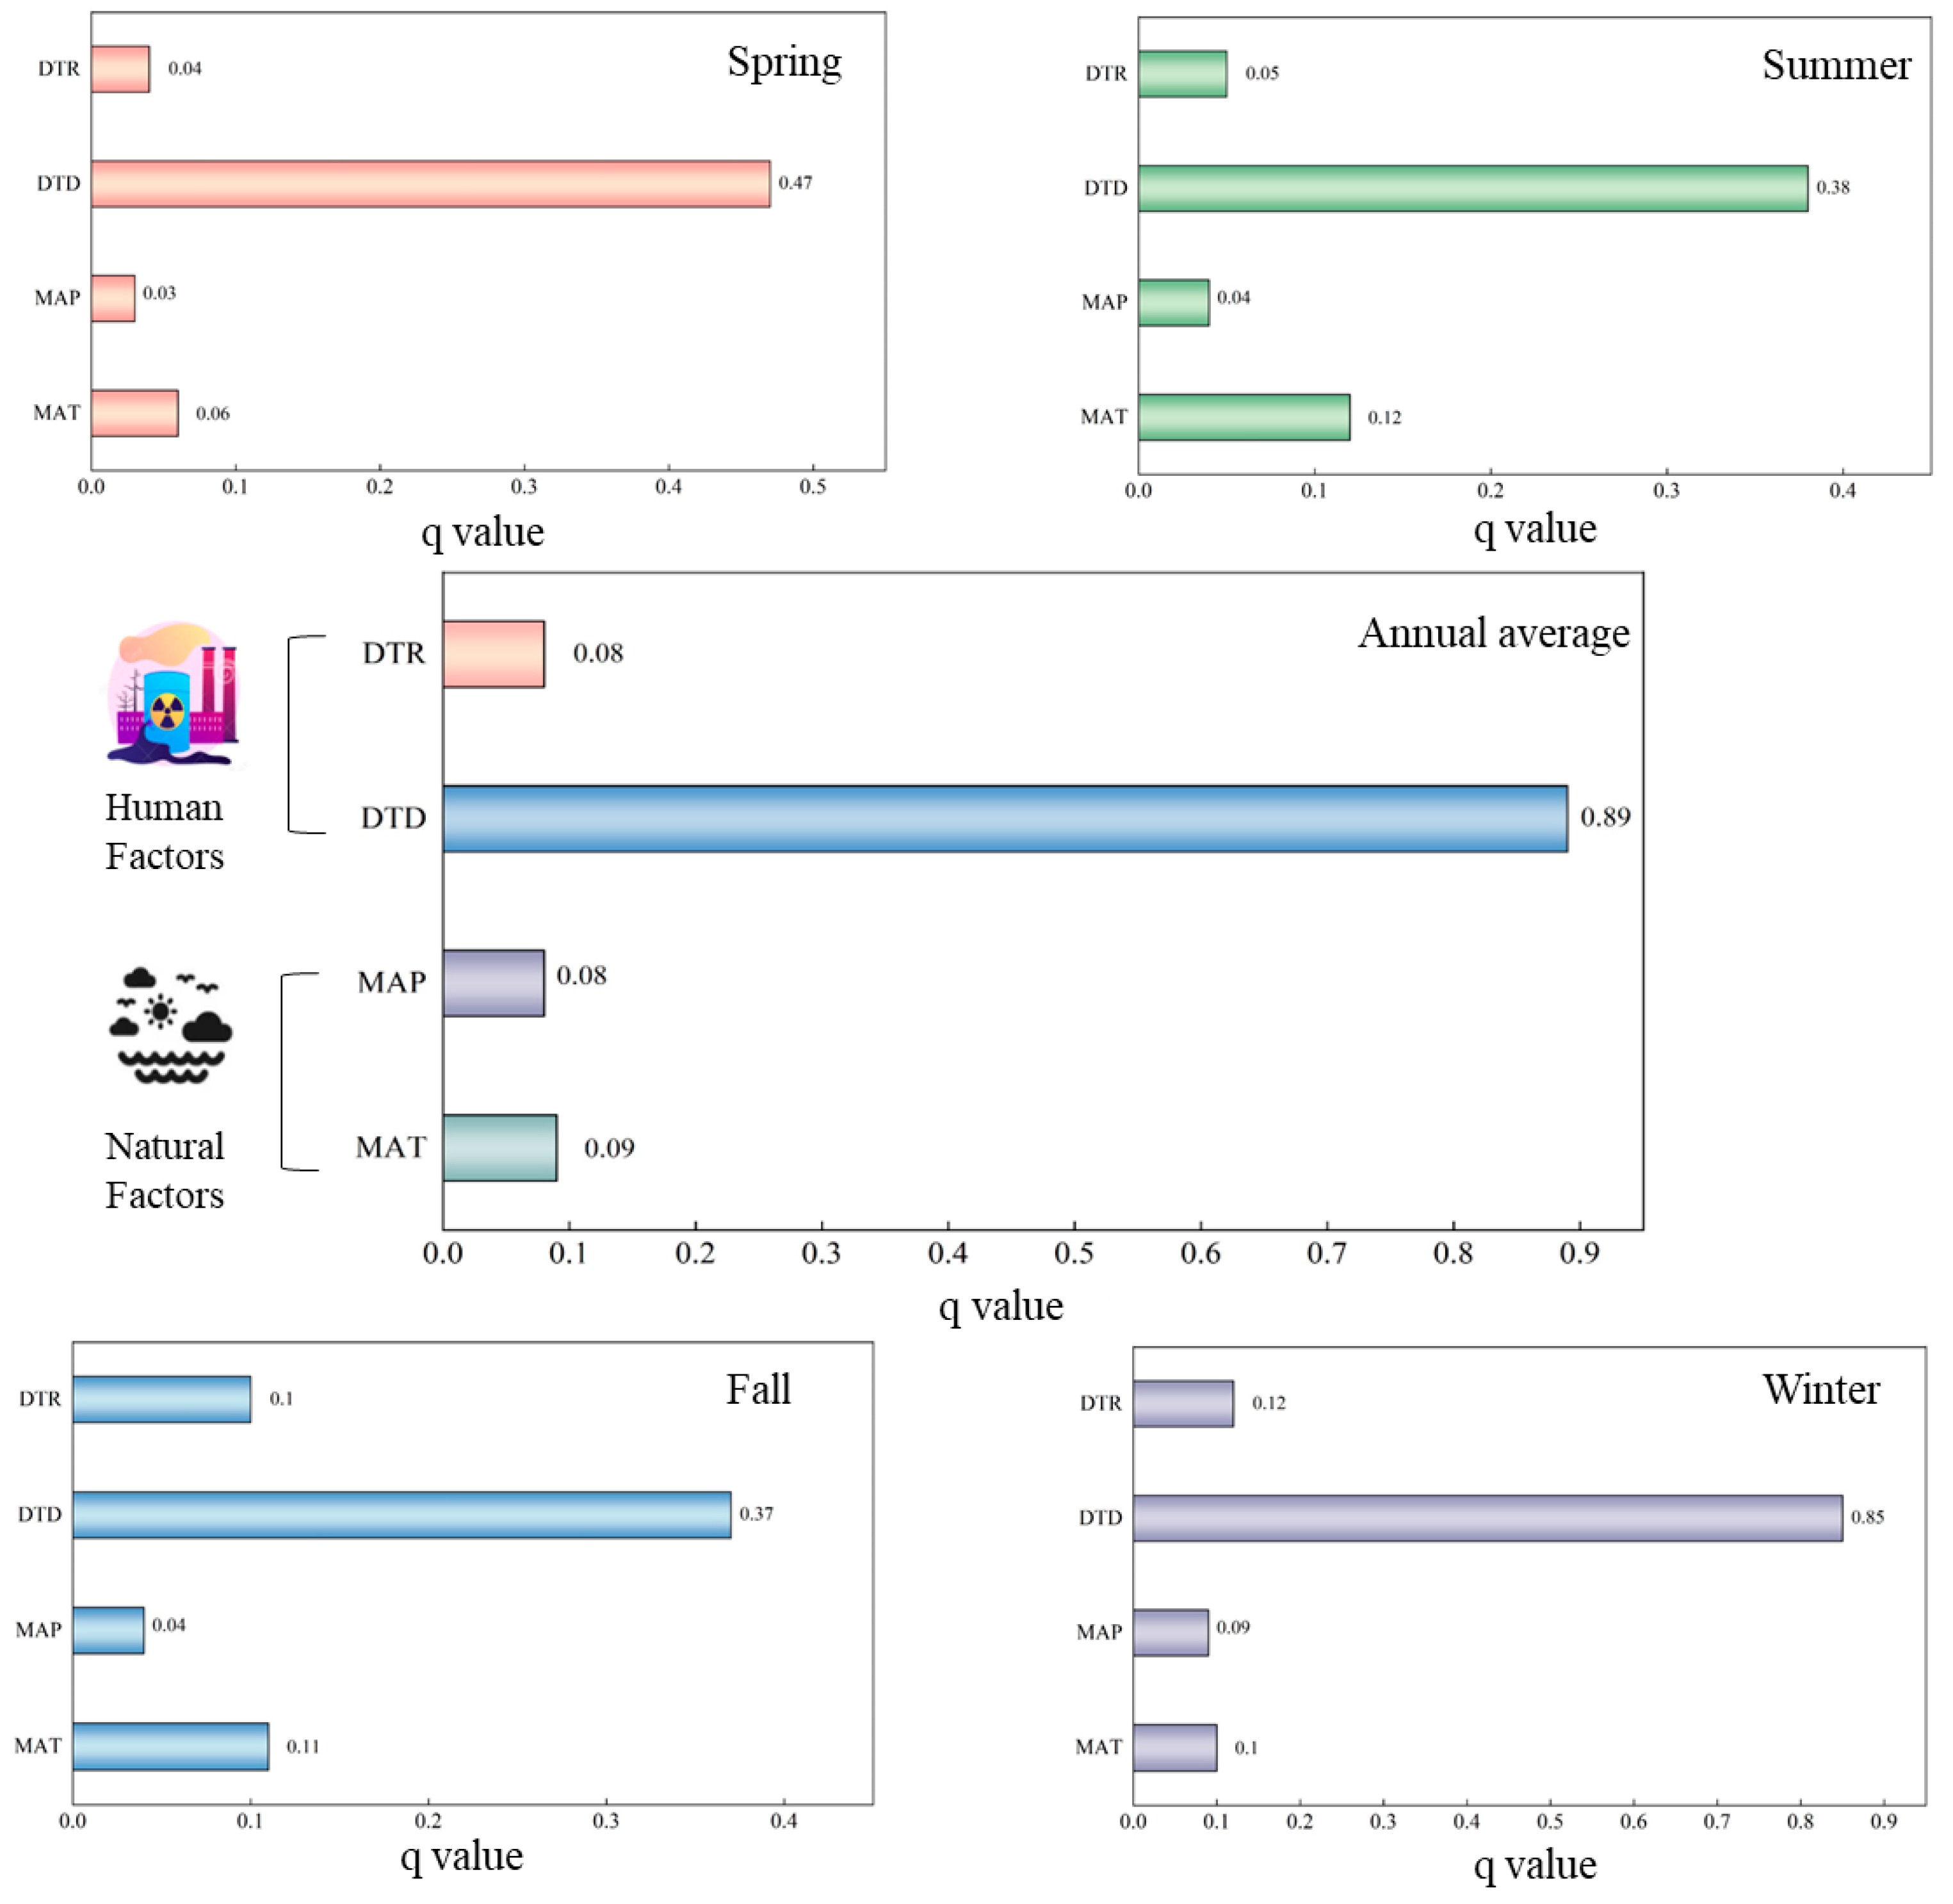
The GeoDetector analysis quantified the relative contributions of anthropogenic and climatic variables to peatland subsidence across the Zoige region. Among all factors, drainage-ditch proximity (DTD) exhibited the highest explanatory power (q = 0.89) (Figure 6), indicating a strong spatial correspondence between artificial drainage networks and deformation intensity. Road proximity (DTR) showed a lower but measurable influence (q = 0.08), suggesting localized deformation around infrastructure corridors. Climatic variables—mean annual precipitation (MAP) and mean annual temperature (MAT)—displayed comparatively weak explanatory power, confirming that human-induced disturbance is the dominant control on the spatial pattern of subsidence.
These quantitative results demonstrate that anthropogenic disturbances exert stronger spatial control on peatland subsidence than climatic variability. These findings provide a quantitative foundation for subsequent discussion of anthropogenic and climatic mechanisms.

4. Discussion

4.1. Anthropogenic Drivers and Mechanisms of Subsidence

Anthropogenic disturbances—particularly drainage—are the dominant drivers of peatland subsidence in the Zoige region. Proximity to drainage ditches revealed a strong spatial alignment between artificial hydrological structures and vertical deformation patterns (Figure 6). Drainage networks, which exceeded 1700 km by 2000, have disrupted natural hydrological conditions and lowered the regional groundwater table [55,56]. As oxygen exposure increases, aerobic decomposition of organic matter accelerates, promoting irreversible peat compaction and volume loss [57]. Although road influence was weaker than that of drainage, it still contributed to localized deformation. Road construction can alter surface water flow, fragment habitats, and cause long-term compaction. This is consistent with field observations suggesting that infrastructure impairs surface resilience to environmental stress. Overgrazing further exacerbates subsidence by degrading vegetation cover and increasing soil bulk density. The livestock population in Zoige County has grown from 950,700 in 1958 to 2.27 million sheep units in 2022, exerting sustained pressure on the peatland surface. Livestock trampling reduces soil porosity, limits water infiltration, and compromises peat integrity [58,59]. This chronic stress leads to a gradual decline in peatland structure and increases susceptibility to deformation.

4.2. Climatic Modulation and Seasonal Feedback

In addition to human-induced factors, climatic variability modulates seasonal patterns of peatland subsidence. The Geo-Detector results showed that precipitation and temperature exerted relatively weak but seasonally dependent effects (Figure 7). Subsidence was more pronounced during dry periods or drought years, reflecting the role of low water content in reducing the stability of peat structures [60]. Reduced precipitation lowers soil moisture, causing shrinkage and weakening the capillary forces that maintain peat matrix cohesion. Conversely, elevated temperatures can promote evapotranspiration and accelerate microbial activity, facilitating further organic matter loss and subsurface volume reduction. These processes reflect a positive feedback mechanism: while climate factors may not dominate spatial variation, they significantly influence temporal sensitivity. Notably, the influence of natural factors was most pronounced in winter, suggesting a possible role for freeze–thaw dynamics. Cyclical freezing and thawing destabilize the peat surface, alter pore structure, and may induce delayed compaction. These effects are well documented in permafrost and alpine peatlands and may contribute to the enhanced deformation observed in cold-season periods. Consistent with this interpretation, the analysis of AMSR2 (Advanced Microwave Scanning Radiometer 2)-derived snow depth data indicated that winter snow depth across Zoige remained shallow (mostly <1 cm), and its interannual variation did not significantly correlate with winter subsidence (Pearson r = −0.04, p = 0.93; Spearman r = 0.36, p = 0.43; see Supplementary Table S1). This implies that freeze–thaw processes strongly modulate seasonal deformation, but snow depth itself is not a dominant explanatory factor at the resolution of available datasets. In contrast, anthropogenic factors such as ditch networks and grazing exert relatively stable influence across seasons. This suggests that while climate introduces seasonal pulses of stress, land-use patterns determine the long-term trajectory and cumulative magnitude of subsidence. Recent InSAR studies reveal clear climatic contrasts in peatland subsidence. In tropical regions, drainage-driven compaction dominates, with deformation rates often exceeding tens of centimeters per year in Malaysia and Indonesia [61,62]. In temperate Europe, deformation is slower but seasonally dynamic, typically below 2 cm yr−1 and partly reversible after rewetting [63,64]. Compared with these systems, the Zoige Plateau exhibits an intermediate pattern—spatially extensive but moderate in magnitude—where anthropogenic drainage and grazing outweigh climatic forcing. This comparison highlights drainage-induced hydrological alteration as the most consistent global driver of peatland subsidence.
Although the InSAR analysis provides spatially consistent measurements, several uncertainties should be acknowledged. Residual atmospheric phase delays and temporal decorrelation over vegetated surfaces may introduce local noise in the deformation estimates. The AMSR2-derived snow-depth dataset, with its coarse 0.25° resolution, may obscure small-scale variability in snow accumulation and melt [65]. In addition, the lack of ground-based leveling or GNSS observations limits the validation of InSAR-derived results. Future integration of in situ and higher-resolution datasets will help reduce these uncertainties.

4.3. Management Implications and Regional Strategies

Our findings reveal that subsidence occurs not only in degraded areas but also within formally protected peatland zones. This suggests that current conservation measures—primarily passive protection—are insufficient to curb hydrological degradation and surface instability. The persistence of drainage-induced impacts within reserves indicates a pressing need for proactive management. Hydrological restoration should be prioritized, especially in areas heavily affected by ditch construction. Rewetting via ditch blocking, water table recovery, and soil moisture retention can significantly reduce peat degradation and limit further subsidence [42,66]. These interventions have shown success in northern temperate peatlands and can be adapted to the high-altitude Zoige landscape. Grazing management is equally essential. To reduce trampling-induced compaction, it is advisable to regulate stocking densities, implement rotational grazing systems, and establish exclusion zones. Considering the overlap between grazing hotspots and areas of severe subsidence, targeted management would likely yield measurable ecological benefits. Finally, long-term monitoring combining SBAS-InSAR and ground-based GNSS data should be institutionalized to track recovery and detect new risks. SBAS-InSAR provides the temporal resolution and spatial coverage needed to evaluate restoration outcomes. Nevertheless, our study is constrained by the lack of in situ measurements within the peatland, and the weak correlations observed between snow depth and subsidence highlight the limitations of current coarse-resolution climatic datasets. Future work should integrate higher-resolution snow and permafrost observations, continuous hydrological monitoring, and process-based ecohydrological models to complement InSAR analysis. Adaptive management informed by multi-source observations and scenario modeling can better enhance the resilience of peatlands under intensifying climate and anthropogenic stress.

5. Conclusions

This study employed SBAS-InSAR techniques to quantify surface deformation in the Zoige peatland from 2017 to 2023. The results revealed persistent and spatially variable subsidence, with peak seasonal and interannual values reaching −144.11 mm and −167.92 mm, respectively. Cumulative average subsidence was −23.99 mm, equivalent to an annual rate of −3.43 mm·yr−1. Approximately 80.9% of peatlands within the protected area exhibited detectable subsidence. Drainage ditch proximity emerged as the dominant driver, followed by road construction and livestock density. Climatic factors such as reduced precipitation and elevated temperature contributed to seasonal variability but had weaker spatial explanatory power. Subsidence was most severe in central peatland zones and during winter periods. These findings demonstrate that even protected peatlands remain vulnerable to subsurface instability driven by hydrological alteration and land cover intensification. Long-term monitoring, targeted hydrological restoration, and regulation of anthropogenic disturbances are essential to mitigate degradation and preserve the ecological integrity of high-altitude peatland ecosystems. Specifically, reducing artificial drainage density, controlling grazing intensity, and maintaining higher groundwater levels are recommended management actions to alleviate subsidence and enhance the resilience of alpine peatland systems.

Supplementary Materials

The following supporting information can be downloaded at: https://www.mdpi.com/article/10.3390/geosciences15110407/s1, Figure S1: Spatial distribution of interferometric coherence (γ) averaged over the monitoring period (2017–2023) across the Zoige peatland; Figure S2: Multi-year seasonal surface deformation time series derived from SBAS-InSAR for the Zoige peatland, covering 2017 to 2022; Figure S3: Correlation between winter mean snow depth and mean subsidence in the Zoige peatland (2017–2023). Table S1: title Summary of winter snow depth and peatland subsidence in the Zoige region during 2017–2023.

Author Contributions

Conceptualization, Z.X. and K.S.; methodology, Z.X.; software, E.T. and R.L.; validation, E.T., Z.X., Y.W., R.Z. and R.L.; formal analysis, E.T., R.L. and R.Z.; investigation, E.T., Z.X., Y.W., R.L. and R.Z.; resources, Z.X., Y.W. and K.S.; data curation, Z.X., Y.W. and R.L.; writing—original draft, E.T.; visualization, E.T.; supervision, Z.X.; project administration, Z.X.; funding acquisition, Z.X. All authors have read and agreed to the published version of the manuscript.

Funding

This study was supported by the National Natural Science Foundation of China (U2243230, 42430511), and the National Key Research and Development Program of China (2023YFF1304502, 2022YFF1300900).

Data Availability Statement

The dataset supporting this study is openly available in Zenodo at https://doi.org/10.5281/zenodo.15922026, accessed on 15 July 2025 [67]. Additional derived results are available from the corresponding author upon reasonable request.

Conflicts of Interest

The authors declare no conflicts of interest.

References

  1. Page, S.E.; Baird, A.J. Peatlands and global change: Response and resilience. Annu. Rev. Environ. Resour. 2016, 41, 35–57. [Google Scholar] [CrossRef]
  2. FAO. Peatlands Mapping and Monitoring—Recommendations and Technical Overview; FAO: Rome, Italy, 2020. [Google Scholar] [CrossRef]
  3. Xu, J.R.; Morris, P.J.; Liu, J.G.; Holden, J. PEATMAP: Refining estimates of global peatland distribution based on a meta-analysis. Catena 2018, 160, 134–140. [Google Scholar] [CrossRef]
  4. Yu, Z.C.; Loisel, J.; Brosseau, D.P.; Beilman, D.W.; Hunt, S.J. Global peatland dynamics since the last glacial maximum. Geophys. Res. Lett. 2010, 37, L13402. [Google Scholar] [CrossRef]
  5. Acreman, M.; Holden, J. How wetlands affect floods. Wetlands 2013, 33, 773–786. [Google Scholar] [CrossRef]
  6. Flood, K.; Wilson, D.; Renou-Wilson, F. Evidence synthesis and knowledge integration for sustainable peatland management. Land 2025, 14, 1397. [Google Scholar] [CrossRef]
  7. Leifeld, J.; Menichetti, L. The underappreciated potential of peatlands in global climate change mitigation strategies. Nat. Commun. 2018, 9, 1071. [Google Scholar] [CrossRef] [PubMed]
  8. Fluet-Chouinard, E.; Stocker, B.D.; Zhang, Z.; Malhotra, A.; Melton, J.R.; Poulter, B.; Kaplan, J.O.; Goldewijk, K.K.; Siebert, S.; Minayeva, T.; et al. Extensive global wetland loss over the past three centuries. Nature 2023, 614, 281–286. [Google Scholar] [CrossRef] [PubMed]
  9. Ghezelayagh, P.; Oleszczuk, R.; Stachowicz, M.; Eini, M.R.; Kamocki, A.; Banaszuk, P.; Grygoruk, M. Developing a remote-sensing-based indicator for peat soil vertical displacement. A case study in the Biebrza Valley, Poland. Ecol. Indic. 2024, 166, 112305. [Google Scholar] [CrossRef]
  10. Hoyt, A.M.; Chaussard, E.; Seppalainen, S.S.; Harvey, C.F. Widespread subsidence and carbon emissions across Southeast Asian peatlands. Nat. Geosci. 2020, 13, 435–440. [Google Scholar] [CrossRef]
  11. Hrysiewicz, A.; Williamson, J.; Evans, C.D.; Jovani-Sancho, A.J.; Callaghan, N.; Lyons, J.; White, J.; Kowalska, J.; Menichino, N.; Holohan, E.P. Estimation and validation of InSAR-derived surface displacements at temperate raised peatlands. Remote Sens. Environ. 2024, 311, 114232. [Google Scholar] [CrossRef]
  12. Antonijević, D.; Hoffmann, M.; Zak, D.; Prochnow, A.; Dubbert, M.; Schmidt, M.; Augustin, J. Impact of plant succession on greenhouse gas fluxes during the transition of a flooded fen peatland. Commun. Earth Environ. 2025, 6, 611. [Google Scholar] [CrossRef]
  13. Sa, R.; Nie, Y.; Chumachenko, S.; Fan, W. Biomass estimation and saturation value determination based on multi-source remote sensing data. Remote Sens. 2024, 16, 2250. [Google Scholar] [CrossRef]
  14. Hooijer, A.; Vernimmen, R.; Mulyadi, D.; Triantomo, V.; Hamdani; Lampela, M.; Agusti, R.; Page, S.E.; Doloksaribu, J.; Setiawan, I.; et al. Benefits of tropical peatland rewetting for subsidence reduction and forest regrowth: Results from a large-scale restoration trial. Sci. Rep. 2024, 14, 10721. [Google Scholar] [CrossRef] [PubMed]
  15. Ikkala, L.; Ronkanen, A.K.; Utriainen, O.; Klove, B.; Marttila, H. Peatland subsidence enhances cultivated lowland flood risk. Soil. Tillage Res. 2021, 212, 105078. [Google Scholar] [CrossRef]
  16. Zanello, F.; Teatini, P.; Putti, M.; Gambolati, G. Long term peatland subsidence: Experimental study and modeling scenarios in the Venice coastland. J. Geophys. Res.-Earth Surf. 2011, 116, F04002. [Google Scholar] [CrossRef]
  17. Hasan, M.F.; Smith, R.; Vajedian, S.; Pommerenke, R.; Majumdar, S. Global land subsidence mapping reveals widespread loss of aquifer storage capacity. Nat. Commun. 2023, 14, 6180. [Google Scholar] [CrossRef]
  18. Hooijer, A.; Page, S.; Canadell, J.G.; Silvius, M.; Kwadijk, J.; Wösten, H.; Jauhiainen, J. Current and future CO2 emissions from drained peatlands in Southeast Asia. Biogeosciences 2010, 7, 1505–1514. [Google Scholar] [CrossRef]
  19. Minasny, B.; Adetsu, D.V.; Aitkenhead, M.; Artz, R.R.E.; Baggaley, N.; Barthelmes, A.; Beucher, A.; Caron, J.; Conchedda, G.; Connolly, J.; et al. Mapping and monitoring peatland conditions from global to field scale. Biogeochemistry 2023, 167, 383–425. [Google Scholar] [CrossRef]
  20. Sun, J.; Gallego-Sala, A.; Yu, Z. Topographic and climatic controls of peatland distribution on the tibetan plateau. Sci. Rep. 2023, 13, 14811. [Google Scholar] [CrossRef]
  21. Qiu, T.; Cong, N.; Rong, L.; Qi, G.; Du, L.; Ren, P.; Xiao, J. Spatiotemporal dynamics and driving mechanisms of alpine peatland wetlands in the eastern qinghai–tibet plateau based on a vision transformer model. Ecol. Indic. 2025, 178, 114136. [Google Scholar] [CrossRef]
  22. Guo, X.; Du, W.; Wang, X.; Yang, Z. Degradation and structure change of humic acids corresponding to water decline in zoige peatland, qinghai-tibet plateau. Sci. Total Environ. 2013, 445–446, 231–236. [Google Scholar] [CrossRef] [PubMed]
  23. Gao, J.H.; Holden, J.; Kirkby, M. The impact of land-cover change on flood peaks in peatland basins. Water Resour. Res. 2016, 52, 3477–3492. [Google Scholar] [CrossRef]
  24. Jaenicke, J.; Rieley, J.O.; Mott, C.; Kimman, P.; Siegert, F. Determination of the amount of carbon stored in Indonesian peatlands. Geoderma 2008, 147, 151–158. [Google Scholar] [CrossRef]
  25. Page, S.E.; Rieley, J.O.; Banks, C.J. Global and regional importance of the tropical peatland carbon pool. Glob. Change Biol. 2011, 17, 798–818. [Google Scholar] [CrossRef]
  26. Xiang, S.A.; Guo, R.Q.; Wu, N.; Sun, S.C. Current status and future prospects of zoige marsh in eastern qinghai-tibet plateau. Ecol. Eng. 2009, 35, 553–562. [Google Scholar] [CrossRef]
  27. Yule, C.M. Loss of biodiversity and ecosystem functioning in indo-malayan peat swamp forests. Biodivers. Conserv. 2010, 19, 393–409. [Google Scholar] [CrossRef]
  28. Zhong, Q.; Chen, H.; Liu, L.; He, Y.; Zhu, D.; Jiang, L.; Zhan, W.; Hu, J. Water table drawdown shapes the depth-dependent variations in prokaryotic diversity and structure in Zoige peatlands. FEMS Microbiol. Ecol. 2017, 93, fix049. [Google Scholar] [CrossRef]
  29. Canisius, F.; Brisco, B.; Murnaghan, K.; Van der Kooij, M.; Keizer, E. SAR backscatter and InSAR coherence for monitoring wetland extent, flood pulse and vegetation: A study of the amazon lowland. Remote Sens. 2019, 11, 720. [Google Scholar] [CrossRef]
  30. Khakim, M.Y.N.; Bama, A.A.; Yustian, I.; Poerwono, P.; Tsuji, T.; Matsuoka, T. Peatland subsidence and vegetation cover degradation as impacts of the 2015 El nino event revealed by sentinel-1A SAR data. Int. J. Appl. Earth Obs. Geoinf. 2020, 84, 101953. [Google Scholar] [CrossRef]
  31. Lees, K.J.; Quaife, T.; Artz, R.R.E.; Khomik, M.; Clark, J.M. Potential for using remote sensing to estimate carbon fluxes across northern peatlands—A review. Sci. Total Environ. 2018, 615, 857–874. [Google Scholar] [CrossRef]
  32. Merchant, M.A.; Adams, J.R.; Berg, A.A.; Baltzer, J.L.; Quinton, W.L.; Chasmer, L.E. Contributions of C-band SAR data and polarimetric decompositions to subarctic boreal peatland mapping. IEEE J. Sel. Top. Appl. Earth Obs. Remote Sens. 2017, 10, 1467–1482. [Google Scholar] [CrossRef]
  33. Mullissa, A.; Vollrath, A.; Odongo-Braun, C.; Slagter, B.; Balling, J.; Gou, Y.Q.; Gorelick, N.; Reiche, J. Sentinel-1 SAR backscatter analysis ready data preparation in google earth engine. Remote Sens. 2021, 13, 1954. [Google Scholar] [CrossRef]
  34. Oakes, G.; Hardy, A.; Bunting, P. Rad wet: An improved and transferable mapping of open water and inundated vegetation using sentinel-1. Remote Sens. 2023, 15, 1705. [Google Scholar] [CrossRef]
  35. De la Barreda-Bautista, B.; Ledger, M.J.; Sjögersten, S.; Gee, D.; Sowter, A.; Cole, B.; Page, S.E.; Large, D.J.; Evans, C.D.; Tansey, K.J. Exploring spatial patterns of tropical peatland subsidence in Selangor, Malaysia using the APSIS-DInSAR technique. Remote Sens. 2024, 16, 2249. [Google Scholar] [CrossRef]
  36. Tarigan, S.; Kristanto, Y.; Utomo, W.Y. Characterizing subsidence in used and restored peatland with Sentinel SAR data. Front. Environ. Sci. 2023, 11, 1088923. [Google Scholar] [CrossRef]
  37. Valman, S.; Siewert, M.B.; Boyd, D.; Ledger, M.; Gee, D.; De La Barreda-Bautista, B.; Sowter, A.; Sjögersten, S. InSAR-measured permafrost degradation of palsa peatlands in northern Sweden. Cryosphere 2024, 18, 1773–1790. [Google Scholar] [CrossRef]
  38. Chen, Y.; Yu, S.W.; Tao, Q.X.; Liu, G.L.; Wang, L.Y.; Wang, F.Y. Accuracy verification and correction of D-InSAR and SBAS-InSAR in monitoring mining surface subsidence. Remote Sens. 2021, 13, 4365. [Google Scholar] [CrossRef]
  39. Hussain, S.; Pan, B.; Hussain, W.; Sajjad, M.M.; Ali, M.; Afzal, Z.; Abdullah-Al-Wadud, M.; Tariq, A. Integrated PSInSAR and SBAS-InSAR analysis for landslide detection and monitoring. Phys. Chem. Earth Parts A/B/C 2025, 139, 103956. [Google Scholar] [CrossRef]
  40. Yao, J.M.; Yao, X.; Liu, X.H. Landslide detection and mapping based on SBAS-InSAR and PS-InSAR: A case study in gongjue county, Tibet, China. Remote Sens. 2022, 14, 4728. [Google Scholar] [CrossRef]
  41. Zhang, Z.; Hu, C.; Wu, Z.; Zhang, Z.; Yang, S.; Yang, W. Monitoring and analysis of ground subsidence in Shanghai based on PS-InSAR and SBAS-InSAR technologies. Sci. Rep. 2023, 13, 8031. [Google Scholar] [CrossRef]
  42. Gaffney, P.P.J.; Tang, Q.; Li, Q.; Zhang, R.; Pan, J.; Xu, X.; Li, Y.; Niu, S. The impacts of land-use and climate change on the Zoige peatland carbon cycle: A review. WIREs Clim. Chang. 2023, 15, e862. [Google Scholar] [CrossRef]
  43. Lei, J.J.; Zeng, C.L.; Zhang, L.; Wang, X.G.; Ma, C.H.; Zhou, T.; Laffitte, B.; Luo, K.; Yang, Z.H.; Tang, X.L. Prediction of soil organic carbon stock combining Sentinel-1 and Sentinel-2 images in the Zoige Plateau, the northeastern Qinghai-Tibet Plateau. Ecol. Process. 2024, 13, 32. [Google Scholar] [CrossRef]
  44. Liu, L.; Chen, H.; Zhu, Q.; Yang, G.; Zhu, E.; Hu, J.; Peng, C.; Jiang, L.; Zhan, W.; Ma, T.; et al. Responses of peat carbon at different depths to simulated warming and oxidizing. Sci. Total Env. 2016, 548–549, 429–440. [Google Scholar] [CrossRef]
  45. Weiss, M.; Jacob, F.; Duveiller, G. Remote sensing for agricultural applications: A meta-review. Remote Sens. Environ. 2020, 236, 111402. [Google Scholar] [CrossRef]
  46. McFeeters, S.K. The use of the normalized difference water index (NDWI) in the delineation of open water features. Int. J. Remote Sens. 1996, 17, 1425–1432. [Google Scholar] [CrossRef]
  47. Gitelson, A.A.; Merzlyak, M.N.; Chivkunova, O.B. Optical properties and nondestructive estimation of anthocyanin content in plant leaves. Photochem. Photobiol. 2001, 74, 38–45. [Google Scholar] [CrossRef]
  48. Hatfield, J.L.; Prueger, J.H. Value of using different vegetative indices to quantify agricultural crop characteristics at different growth stages under varying management practices. Remote Sens. 2010, 2, 562–578. [Google Scholar] [CrossRef]
  49. Baret, F.; Hagolle, O.; Geiger, B.; Bicheron, P.; Miras, B.; Huc, M.; Berthelot, B.; Niño, F.; Weiss, M.; Samain, O.; et al. LAI, fAPAR and fCover CYCLOPES global products derived from VEGETATION: Part 1: Principles of the algorithm. Remote Sens. Environ. 2007, 110, 275–286. [Google Scholar] [CrossRef]
  50. Du, Q.; Li, G.; Chen, D.; Qi, S.; Zhou, Y.; Wang, F.; Cao, Y. Extracting water body data based on SDWI and threshold segmentation: A case study in permafrost area surrounding Salt Lake in Hoh Xil, Qinghai-Tibet Plateau, China. Res. Cold Arid. Reg. 2023, 15, 202–209. [Google Scholar] [CrossRef]
  51. Umarhadi, D.A.; Avtar, R.; Widyatmanti, W.; Johnson, B.A.; Yunus, A.P.; Khedher, K.M.; Singh, G. Use of multifrequency (C-band and L-band) SAR data to monitor peat subsidence based on time-series SBAS InSAR technique. Land. Degrad. Dev. 2021, 32, 4779–4794. [Google Scholar] [CrossRef]
  52. Shi, S.H.; Wang, X.L.; Hu, Z.R.; Zhao, X.; Zhang, S.R.; Hou, M.; Zhang, N. Geographic detector-based quantitative assessment enhances attribution analysis of climate and topography factors to vegetation variation for spatial heterogeneity and coupling. Glob. Ecol. Conserv. 2023, 42, e02398. [Google Scholar] [CrossRef]
  53. Wang, J.F.; Li, X.H.; Christakos, G.; Liao, Y.L.; Zhang, T.; Gu, X.; Zheng, X.Y. Geographical detectors-based health risk assessment and its application in the neural tube defects study of the Heshun region, China. Int. J. Geogr. Inf. Sci. 2010, 24, 107–127. [Google Scholar] [CrossRef]
  54. Che, T. Long-Term Series of Daily Snow Depth Dataset in China (1979–2024); National Tibetan Plateau Data Center: Beijing, China, 2015. [Google Scholar] [CrossRef]
  55. Li, Z.W.; Gao, P.; Lu, H.Y. Dynamic changes of groundwater storage and flows in a disturbed alpine peatland under variable climatic conditions. J. Hydrol. 2019, 575, 557–568. [Google Scholar] [CrossRef]
  56. Li, Z.W.; Gao, P.; You, Y.C. Characterizing hydrological connectivity of artificial ditches in zoige peatlands of qinghai-tibet plateau. Water 2018, 10, 1364. [Google Scholar] [CrossRef]
  57. Oleszczuk, R.; Zajac, E.; Urbanski, J.; Jadczyszyn, J. Rate of fen-peat soil subsidence near drainage ditches (central poland). Land 2021, 10, 1287. [Google Scholar] [CrossRef]
  58. Liu, M.; Zhang, Z.C.; Sun, J.; Li, Y.R.; Liu, Y.; Berihun, M.L.; Xu, M.; Tsunekawa, A.; Chen, Y.J. Restoration efficiency of short-term grazing exclusion is the highest at the stage shifting from light to moderate degradation at Zoige, Tibetan Plateau. Ecol. Indic. 2020, 114, 106323. [Google Scholar] [CrossRef]
  59. Pan, T.; Hou, S.; Wu, S.H.; Liu, Y.J.; Liu, Y.H.; Zou, X.T.; Herzberger, A.; Liu, J.G. Variation of soil hydraulic properties with alpine grassland degradation in the eastern Tibetan Plateau. Hydrol. Earth Syst. Sci. 2017, 21, 2249–2261. [Google Scholar] [CrossRef]
  60. Brouns, K.; Eikelboom, T.; Jansen, P.C.; Janssen, R.; Kwakernaak, C.; van den Akker, J.J.; Verhoeven, J.T. Spatial analysis of soil subsidence in peat meadow areas in Friesland in relation to land and water management, climate change, and adaptation. Environ. Manag. 2015, 55, 360–372. [Google Scholar] [CrossRef]
  61. Ledger, M.J.; Sowter, A.; Morrison, K.; Evans, C.D.; Large, D.J.; Athab, A.; Gee, D.; Brown, C.; Sjögersten, S. Potential of APSIS-InSAR for measuring surface oscillations of tropical peatlands. PLoS ONE 2024, 19, e0298939. [Google Scholar] [CrossRef]
  62. Zahro, Q.; Izumi, Y.; Novresiandi, D.A.; Cahyana, D.; Widodo, J.; Ito, D.; Ota, K.; Dong, M. Tropical peatland restoration evaluation using time-series L-band InSAR analysis. Sci. Rep. 2025, 15, 23749. [Google Scholar] [CrossRef]
  63. Marshall, C.; Sterk, H.P.; Gilbert, P.J.; Andersen, R.; Bradley, A.V.; Sowter, A.; Marsh, S.; Large, D.J. Multiscale variability and the comparison of ground and satellite radar based measures of peatland surface motion for peatland monitoring. Remote Sens. 2022, 14, 336. [Google Scholar] [CrossRef]
  64. de Waard, F.; Connolly, J.; Barthelmes, A.; Joosten, H.; van der Linden, S. Remote sensing of peatland degradation in temperate and boreal climate zones–A review of the potentials, gaps, and challenges. Ecol. Indic. 2024, 166, 112437. [Google Scholar] [CrossRef]
  65. Chang, S.; Chen, H.; Pan, J.; Jiang, L. Performances of three representative snow depth products originated from passive microwave sensors over the mongolian plateau. Int. J. Digit. Earth 2024, 17, 2395871. [Google Scholar] [CrossRef]
  66. Zhang, X.H.; Liu, H.Y.; Baker, C.; Graham, S. Restoration approaches used for degraded peatlands in Ruoergai (Zoige), Tibetan Plateau, China, for sustainable land management. Ecol. Eng. 2012, 38, 86–92. [Google Scholar] [CrossRef]
  67. Tian, E. Zoige Peatland Surface Deformation and Driving Factors Dataset (2017–2023); Zenodo: Geneve, Switzerland, 2025. [Google Scholar] [CrossRef]
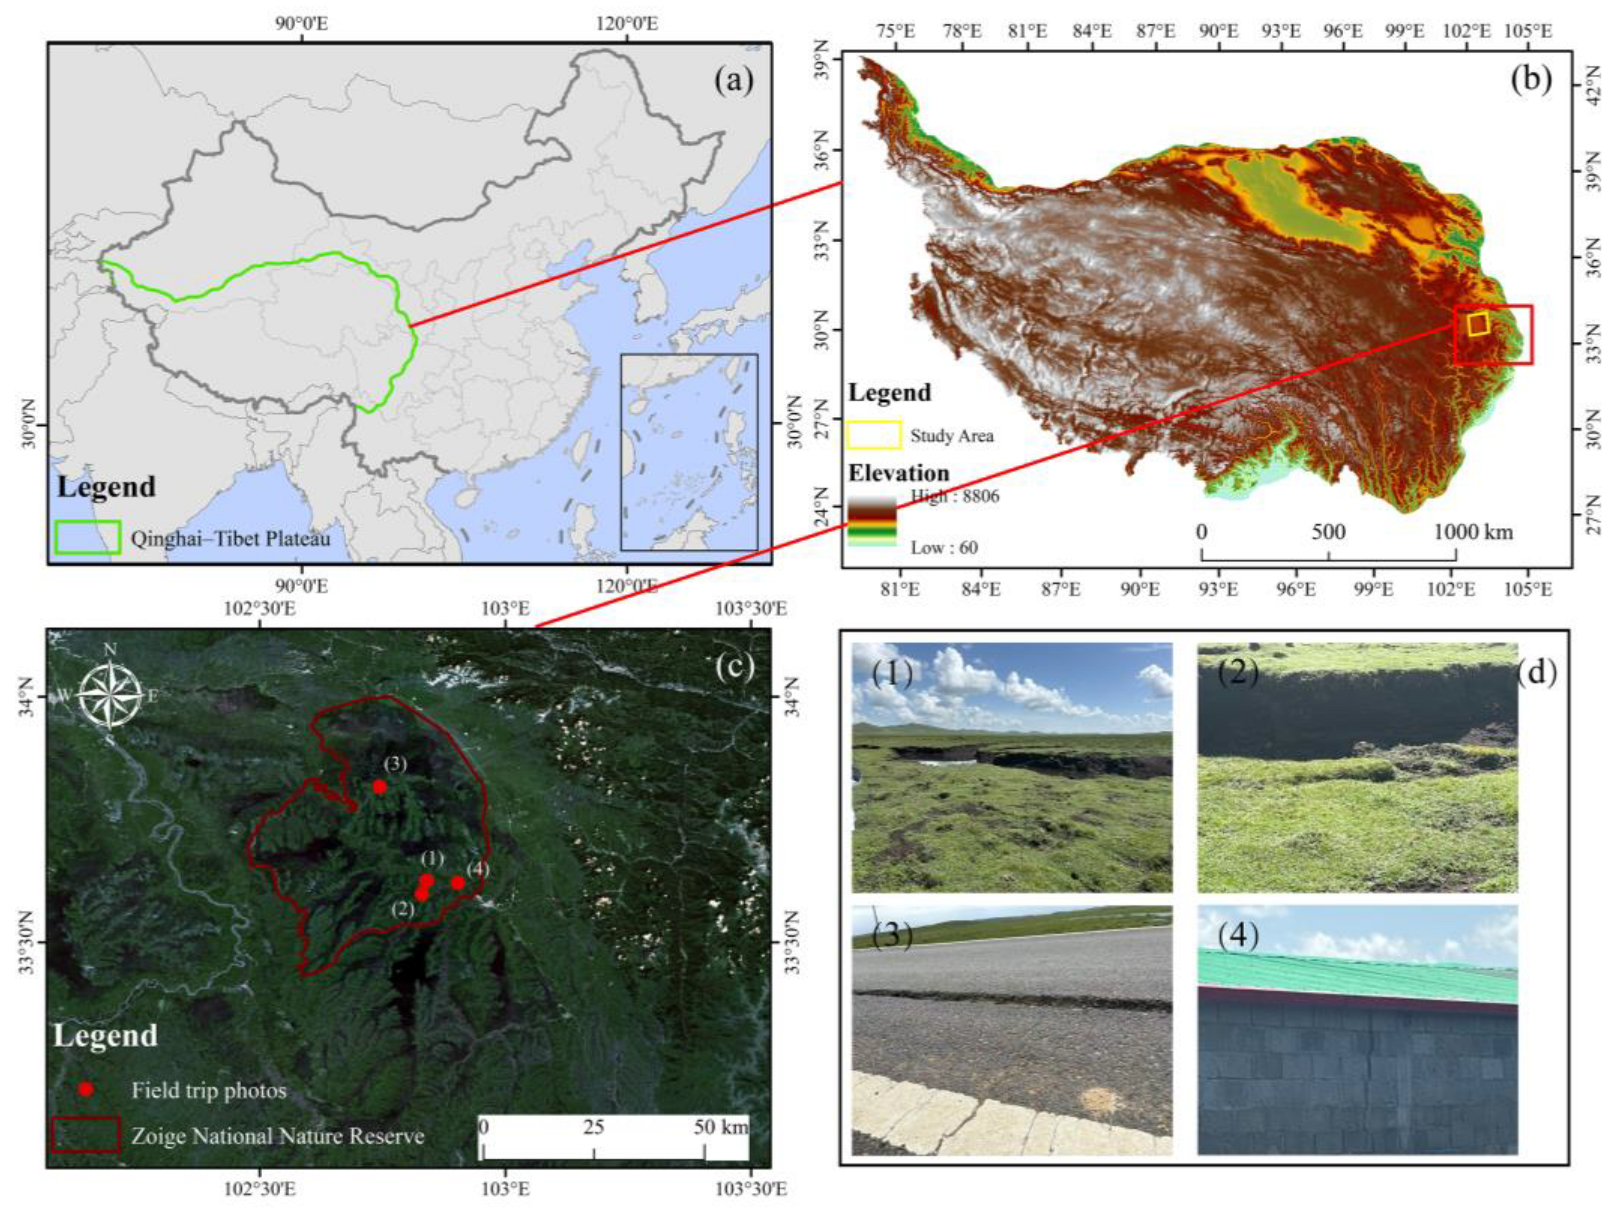
Figure 1. (a,b): Location of the study area, Sichuan, China; (c): Sentinel-2 Multispectral Instrument (MSI) satellite imagery of the study area acquired in July–August 2024, with a band combination of 4, 3, 2; (d): Examples of peatland surface deformation, including artificial drainage ditches (1 and 2) and cracks in roads and buildings (3 and 4) caused by surface subsidence (photographed on 26 July 2024). Data source: European Space Agency (ESA) Copernicus Open Access Hub, Sentinel-2 Level-2A imagery (2024).
Geosciences 15 00407 g001
Figure 2. Land cover types derived from classification of Sentinel-2 Multispectral Instrument (MSI) data.
Geosciences 15 00407 g002
Figure 3. Comparison between SBAS-InSAR and GNSS time series.
Geosciences 15 00407 g003
Figure 4. Seasonal surface deformation patterns in the Zoige peatland for 2023.
Geosciences 15 00407 g004
Figure 5. (a) results of interannual deformation in the study area; (b) average deformation of the study area from 2017 to 2023; (c) comparison of subsidence between different land cover types inside and outside the protected area.
Geosciences 15 00407 g005
Figure 6. Plot of correlation coefficients between ground subsidence and driving indicators: DTD (distance to drainage ditches), DTR (distance to roads), MAT (mean annual temperature), and MAP (mean annual precipitation).
Geosciences 15 00407 g006
Figure 7. Spatial correlation between peatland subsidence and explanatory variables derived from GeoDetector analysis. Climate variables include mean annual temperature (MAT) and mean annual precipitation (MAP) from the China 1 km gridded dataset (National Earth System Science Data Center, http://www.geodata.cn, accessed on 20 June 2025), calculated as changes between the 1961–1990 and 1991–2023 averages. Anthropogenic variables include livestock density (2012–2022), distance to drainage ditches (DTD), and distance to roads (DTR).
Geosciences 15 00407 g007
Table 1. Remote sensing feature index image data.
DataSourceFormulaDescription
B2Sentinel-2-Blue (492.4 nm)
B3Sentinel-2-Green (559.8 nm)
B4Sentinel-2-Red (664.6 nm)
B5Sentinel-2-Vegetation Red Edge (703.9 nm)
B6Sentinel-2-Vegetation Red Edge (740.2 nm)
B7Sentinel-2-Vegetation Red Edge (782.5 nm)
B8Sentinel-2-NIR (832.8 nm)
B8ASentinel-2-Narrow NIR (865 nm)
B11Sentinel-2-SWIR (1613.7 nm)
NDVISentinel-2 ( B a n d 8 B a n d 4 B a n d 8 + B a n d 4 ) Normalized Vegetation Index. Detecting Vegetation Growth Status, Vegetation Cover and Eliminating Partial Radiation Errors, etc. [45]
NDWISentinel-2 ( B a n d 3 B a n d 8 B a n d 3 + B a n d 8 ) Normalized water index. Extraction of vegetation water information based on water absorption characteristics in the near-infrared and short-wave infrared ranges, and light penetration in the near-infrared range [46]
ARISentinel-2 ( B a n d 8 B a n d 2 ) ( B a n d 8 B a n d 3 ) Anthocyanin Reflectance Index. An index of sensitivity to anthocyanin pigments in plant leaves, often associated with plant stress or senescence [47]
PSRISentinel-2 ( B a n d 4 B a n d 2 B a n d 5 ) Vegetation Decay Index. Detecting plant initiation and senescence using carotenoid to chlorophyll ratios [48]
REIPSentinel-2 702 + 40   ( B a n d 2 + B a n d 7 2 B a n d 5 B a n d 6 B a n d 5 ) Red edge tilt points. Approximation of the hyperspectral index used to estimate the position of the NIR/red inflection point in the vegetation spectrum [49]
SDWISentinel-1In (10 × VV × VH) − 8Sentinel-1 Dual-Polarized Water Index. The proposed SDWI (Sentinel-1 Dual-Polarized Water Index) water body information extraction method based on Sentinel-1 satellite data containing C-band synthetic aperture radar for the identification of water body information on a large scale [50]
VVSentinel-1-Polarized radar backward scattering coefficient. Vertical polarization sends decibel backward scattering from vertically polarized receiving SAR. The polarization of electromagnetic waves is sensitive to the dielectric constant, physical properties, geometry and orientation of the target, and thus polarization measurements can greatly improve the acquisition of various information about the target by imaging radar
VHSentinel-1-Polarized radar backward scattering coefficient. Decibel backscatter from vertically polarized transmitter and horizontally polarized receiver SARs
Disclaimer/Publisher’s Note: The statements, opinions and data contained in all publications are solely those of the individual author(s) and contributor(s) and not of MDPI and/or the editor(s). MDPI and/or the editor(s) disclaim responsibility for any injury to people or property resulting from any ideas, methods, instructions or products referred to in the content.