1. Introduction
Groundwater is a valuable freshwater resource that is stored in aquifers, which are underground layers of rock or sediment that can hold water. Demands for groundwater are increasing. The world’s growing population, expanding agricultural sector, and rising economic activity are all driving forces behind the ever-increasing demand for water [
1,
2]. According to [
2], groundwater is used for both domestic and agricultural purposes, and it is especially important in areas where surface water is scarce. Many social, economic, and environmental processes can affect groundwater quality and quantity. The effects of land use and land cover (LU/LC) change on groundwater are becoming more well-known, especially at the watershed scale [
3,
4].
The global trend of urbanization is driven by a number of factors, including the pull of job opportunities and amenities in large cities, as well as the push of environmental degradation and economic hardship in rural areas. This trend has led to the expansion of urban areas and the intensification of agricultural production in surrounding areas. Rapid urbanization in large cities, such as Taejon in South Korea, Beijing and Shanghai in China, Solapur and Shimla in India, Nairobi in Kenya, and Islamabad in Pakistan, is a major driver of groundwater depletion. This is because these cities rely heavily on groundwater for their water supply, and the increasing demand for water is outpacing the rate of natural recharge. As a result, groundwater levels are falling, and in some cases, wells have gone dry [
5,
6,
7,
8,
9,
10].
Kabul, the capital and largest city of Afghanistan, has experienced rapid urbanization over the past two decades. With a population of about 5.3 million, it is considered the fifth fastest growing city in the world [
11,
12,
13]. After a political change in Afghanistan in 2001, there was a gradual return to social, economic, and political stability. This led to an increase in migration from poor villages and deprived areas of the country to Kabul, where people could benefit from the available facilities. In addition to the internal migration, hundreds of thousands of Afghan refugees also returned to the country from neighboring countries after the establishment of a new government. Most of them settled in Kabul, which led to a significant increase in the city’s population. The population of Kabul increased from around 1 million in 2001 to 5.3 million people in 2021 [
14,
15].
Groundwater is a vital part of the water cycle, but it is difficult to study and understand. The amount, location, and quality of groundwater resources are often unknown or uncertain. This makes it challenging to manage groundwater effectively. Diverse remote sensing-based studies have been conducted worldwide to assess the spatial distribution and temporal variability of groundwater levels, as well as the factors that influence groundwater levels, e.g., groundwater level assessment [
16,
17,
18,
19,
20], impact of urbanization on groundwater recharge rate [
21,
22,
23], impact of land use/land cover on groundwater level [
24,
25,
26,
27,
28], and groundwater potential and recharge zone mapping [
4,
29,
30,
31,
32,
33].
Diverse studies have been conducted over the past years in Kabul to assess the groundwater level, quality, quantity, and environmental factors that drive groundwater dynamics [
13,
16,
18,
34,
35,
36,
37]. However, only one study, by [
13], has assessed the impact of urbanization on the groundwater level of the Kabul aquifer. Other studies have focused on the quantity and quality of groundwater in Kabul over specific periods of time. The primary water source for Kabul is the Kabul aquifers, playing a vital role in the city’s socioeconomic progress [
18]. Nevertheless, excessive exploitation of these aquifers has resulted in significant drops in groundwater levels in certain areas. According to [
38], groundwater extraction is occurring at a rate six times higher than its replenishment rate. This overexploitation is a consequence of the growing population and has triggered a crisis for the Paghman–Darulaman and Central Kabul aquifers. Furthermore, unsustainable groundwater development and excessive extraction have led to the deterioration of groundwater quality. This depletion of groundwater poses a grave risk to both the region’s socio-economic stability and its environmental well-being.
Groundwater depletion and its fluctuating levels in densely populated urban areas like Kabul are intricate issues that demand regular investigation. This research aims to delve into these complexities by leveraging geospatial technology to comprehensively analyze the impact of land use/land cover and particularly built-up expansion on Kabul city’s groundwater levels over a span of 22 years, from 2000 to 2022.
The outcomes of this meticulous investigation promise to be of paramount importance, extending their benefits to various sectors. By shedding light on the intricate relationship between urban development and groundwater dynamics, this study stands poised to furnish pertinent governmental bodies and relevant authorities with crucial insights. These insights, in turn, hold the potential to fuel more sustainable strategies for managing groundwater resources in Kabul. Moreover, as urbanization continues to be a global trend, the methodologies employed in this study transcend its specific geographical scope. Researchers grappling with analogous challenges in arid and semi-arid regions can find inspiration and guidance in the approaches employed herein.
2. Hydrological and Geological Settings of Study Area
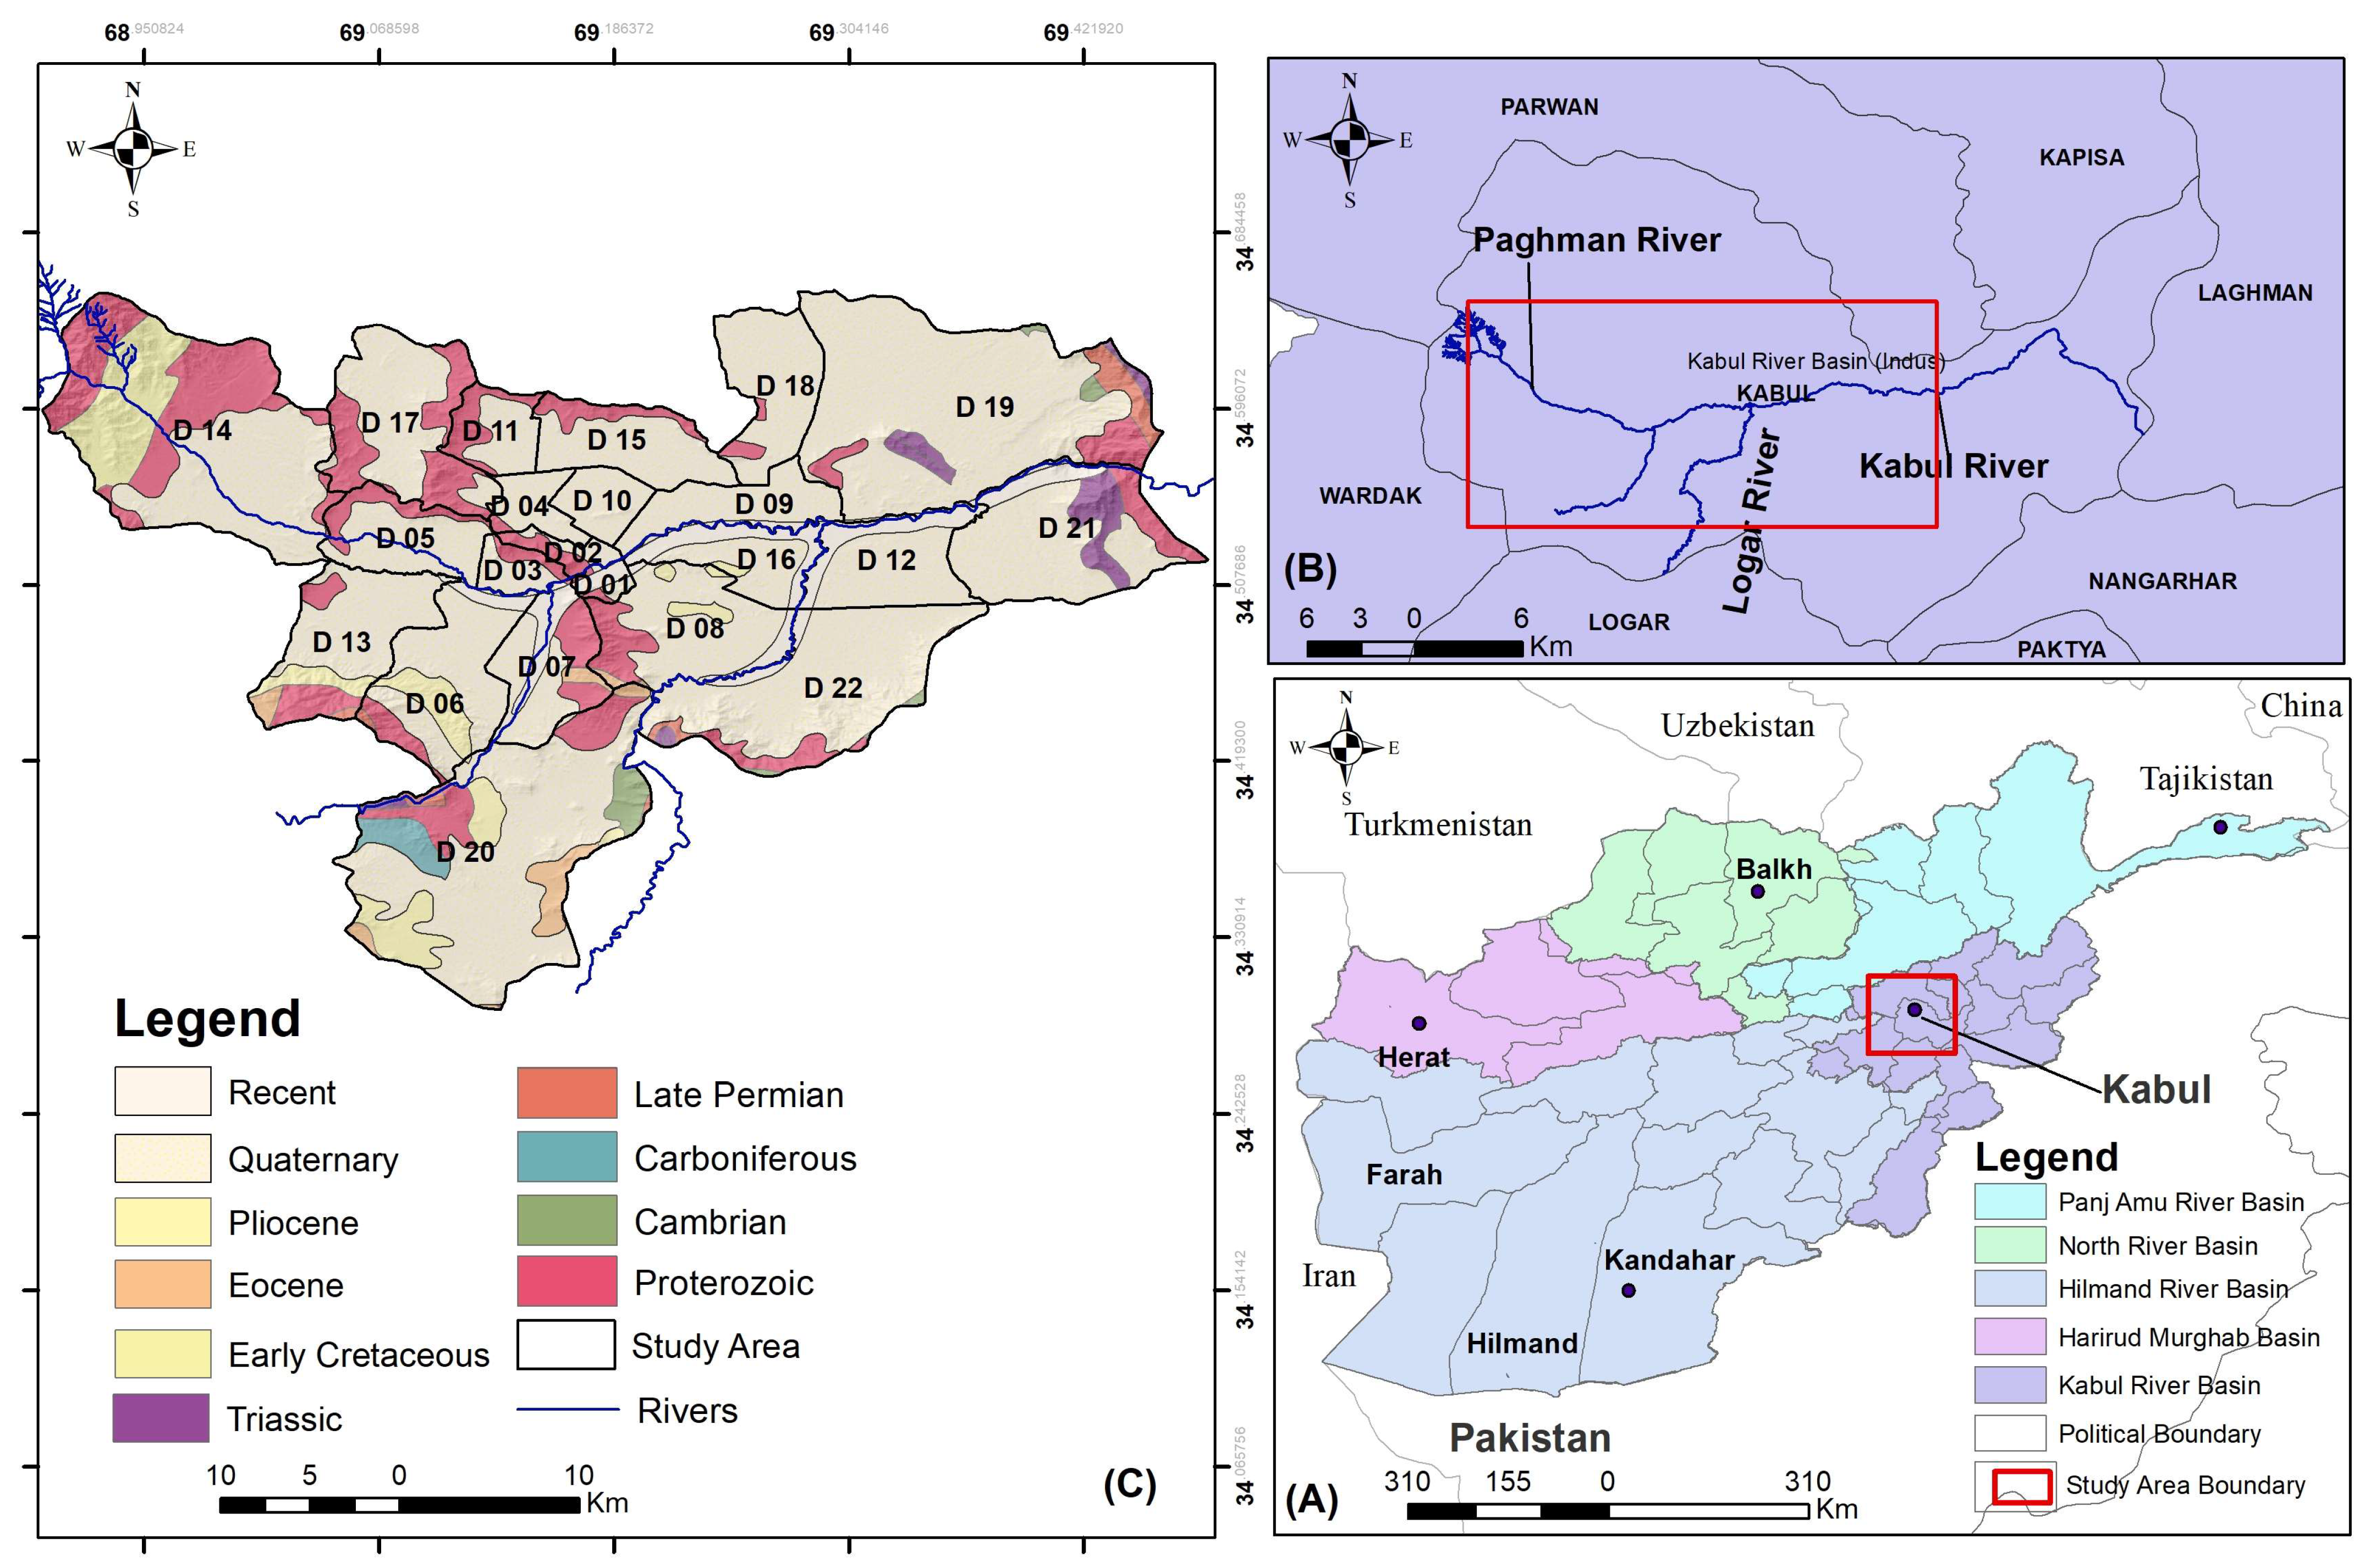
Kabul, the capital of Afghanistan, is located in the east central part of the country, at 69°02′–69°23′ E longitude, 34°25′–34°36′ N latitude, and altitude of 1800 m (6000 feet) above sea level (
Figure 1). The city is situated in a triangular valley between the Asamai and Sherdarwaza mountain ranges and is bisected by the Kabul River [
11,
12]. Kabul city has a total area of 1049 km
2 land area and 396,095 dwelling units and is divided into 22 administrative districts [
12,
39]. The Kabul River, Logar River, and Paghman River are three seasonal rivers that flow through Kabul (
Figure 1). These rivers drain to the northeast through the Tangi Gharu gorge. Kabul has a continental climate, with hot, dry summers and cold, snowy winters. The average temperature in Kabul is 12.1 °C (53.8 °F), with a high of 40 °C (104 °F) in July and a low of −10 °C (14 °F) in January [
11,
40].
Kabul is a mountainous city, with approximately 56% of its territory covered by mountains and rough terrain. The remaining 38% of the city is flat. Guzarga-Asmai Mountain divides the Kabul Basin into two sub-basins: the upper and lower Kabul sub-basins. The upper sub-basin is located to the northwest of Kabul and drains southeast through the upper Kabul and Paghman rivers. The lower Kabul River is formed when these two rivers join together at a narrow gorge called Shardarwaza. The lower Kabul sub-basin is located under the northeastern part of Kabul and drains via the Kabul and Logar rivers, which join and pass through the second narrow gorge, called Tangi Gharo [
41].
Kabul is one of the fastest growing cities in the world. The city’s population increased from approximately 1.5 million in 2001 to around 4.9 million people by 2015, and a further increase of up to 8 million is estimated by 2050. This rapid urbanization is putting a strain on a city that was originally designed for around 800,000 people. As a result, an estimated 70% of Kabul’s residents live in informal or illegal settlements [
12,
39,
42].
Shallow groundwater is the main source of water supply in Kabul. The Kabul basin is situated at the intersection of three major fault systems. It comprises three interconnected aquifers, which are 20–70 m thick and consist of coarse sandy to gravely detritus originating from the surrounding mountains. The aquifers were deposited by the three rivers flowing through the basin. The coarse aquifer material has a high permeability. Deeper parts are affected by the cementation of pore spaces, resulting in the formation of semi-diagenetic conglomerates. This decreases the pore space and interconnectivity, leading to lower well yields. The main groundwater recharge occurs after the snowmelt from direct infiltration from the rivers [
43]. Based on [
44], the city is situated upon a system of three interconnected, unconsolidated alluvial aquifers. These aquifers were deposited as a series of terraced fluvial (river) deposits by the historical flows of the Paghman, Logar, and Kabul Rivers. The underlying aquifers are permeable (2.3 × 10
−5 to 1.3 × 10
−3 m/s) and act as a single hydraulic system due to minimal internal barriers. Deeper sections show some mineral cementation. Droughts and pumping have caused unconfined conditions, but past wetter periods may have led to semi-confined aquifers with loess as the confining layer.
Geologically, Kabul City is located in the north central part of the Kabul Block. It was formed by the faulting of crystalline rocks and erosion. The faulting uplifted the surrounding mountains and hills, creating a depression in the landscape. Subsequent erosion of these highlands and deposition of sediment in the basin grabens filled the depression, resulting in the present landscape [
45,
46,
47]. Kabul is bordered on the west by the Paghman Massif, which is comprised of Proterozoic and Mesozoic crystalline rocks, as well as Paleozoic and Mesozoic sedimentary rocks. These rocks are highly faulted, as described by [
48] (
Figure 1). The Kohi Safi Mountain range borders the Kabul basin on the east and northeast. It is a complex geological formation that contains Proterozoic and Paleogene crystalline rocks, Paleozoic sedimentary rocks, and Triassic rhyolitic lavas [
48]. According to [
48,
49], the hills to the south of the Kabul basin are made up of sedimentary rocks from the late Paleozoic and Mesozoic eras, as well as intrusive rocks from the Cenozoic era. The low hills within the basin are made up of Proterozoic gneiss and are surrounded by alluvial fan material from the late Cenozoic era (
Figure 1).
Figure 1.
General sketch of Kabul city location: (
A) hydrological setting of Afghanistan and related major basins and the extend of study area, (
B) geographical location of Kabul and surrounding districts, and (
C) simplified geological map of Kabul modified from [
50].
Figure 1.
General sketch of Kabul city location: (
A) hydrological setting of Afghanistan and related major basins and the extend of study area, (
B) geographical location of Kabul and surrounding districts, and (
C) simplified geological map of Kabul modified from [
50].
3. Materials and Methods
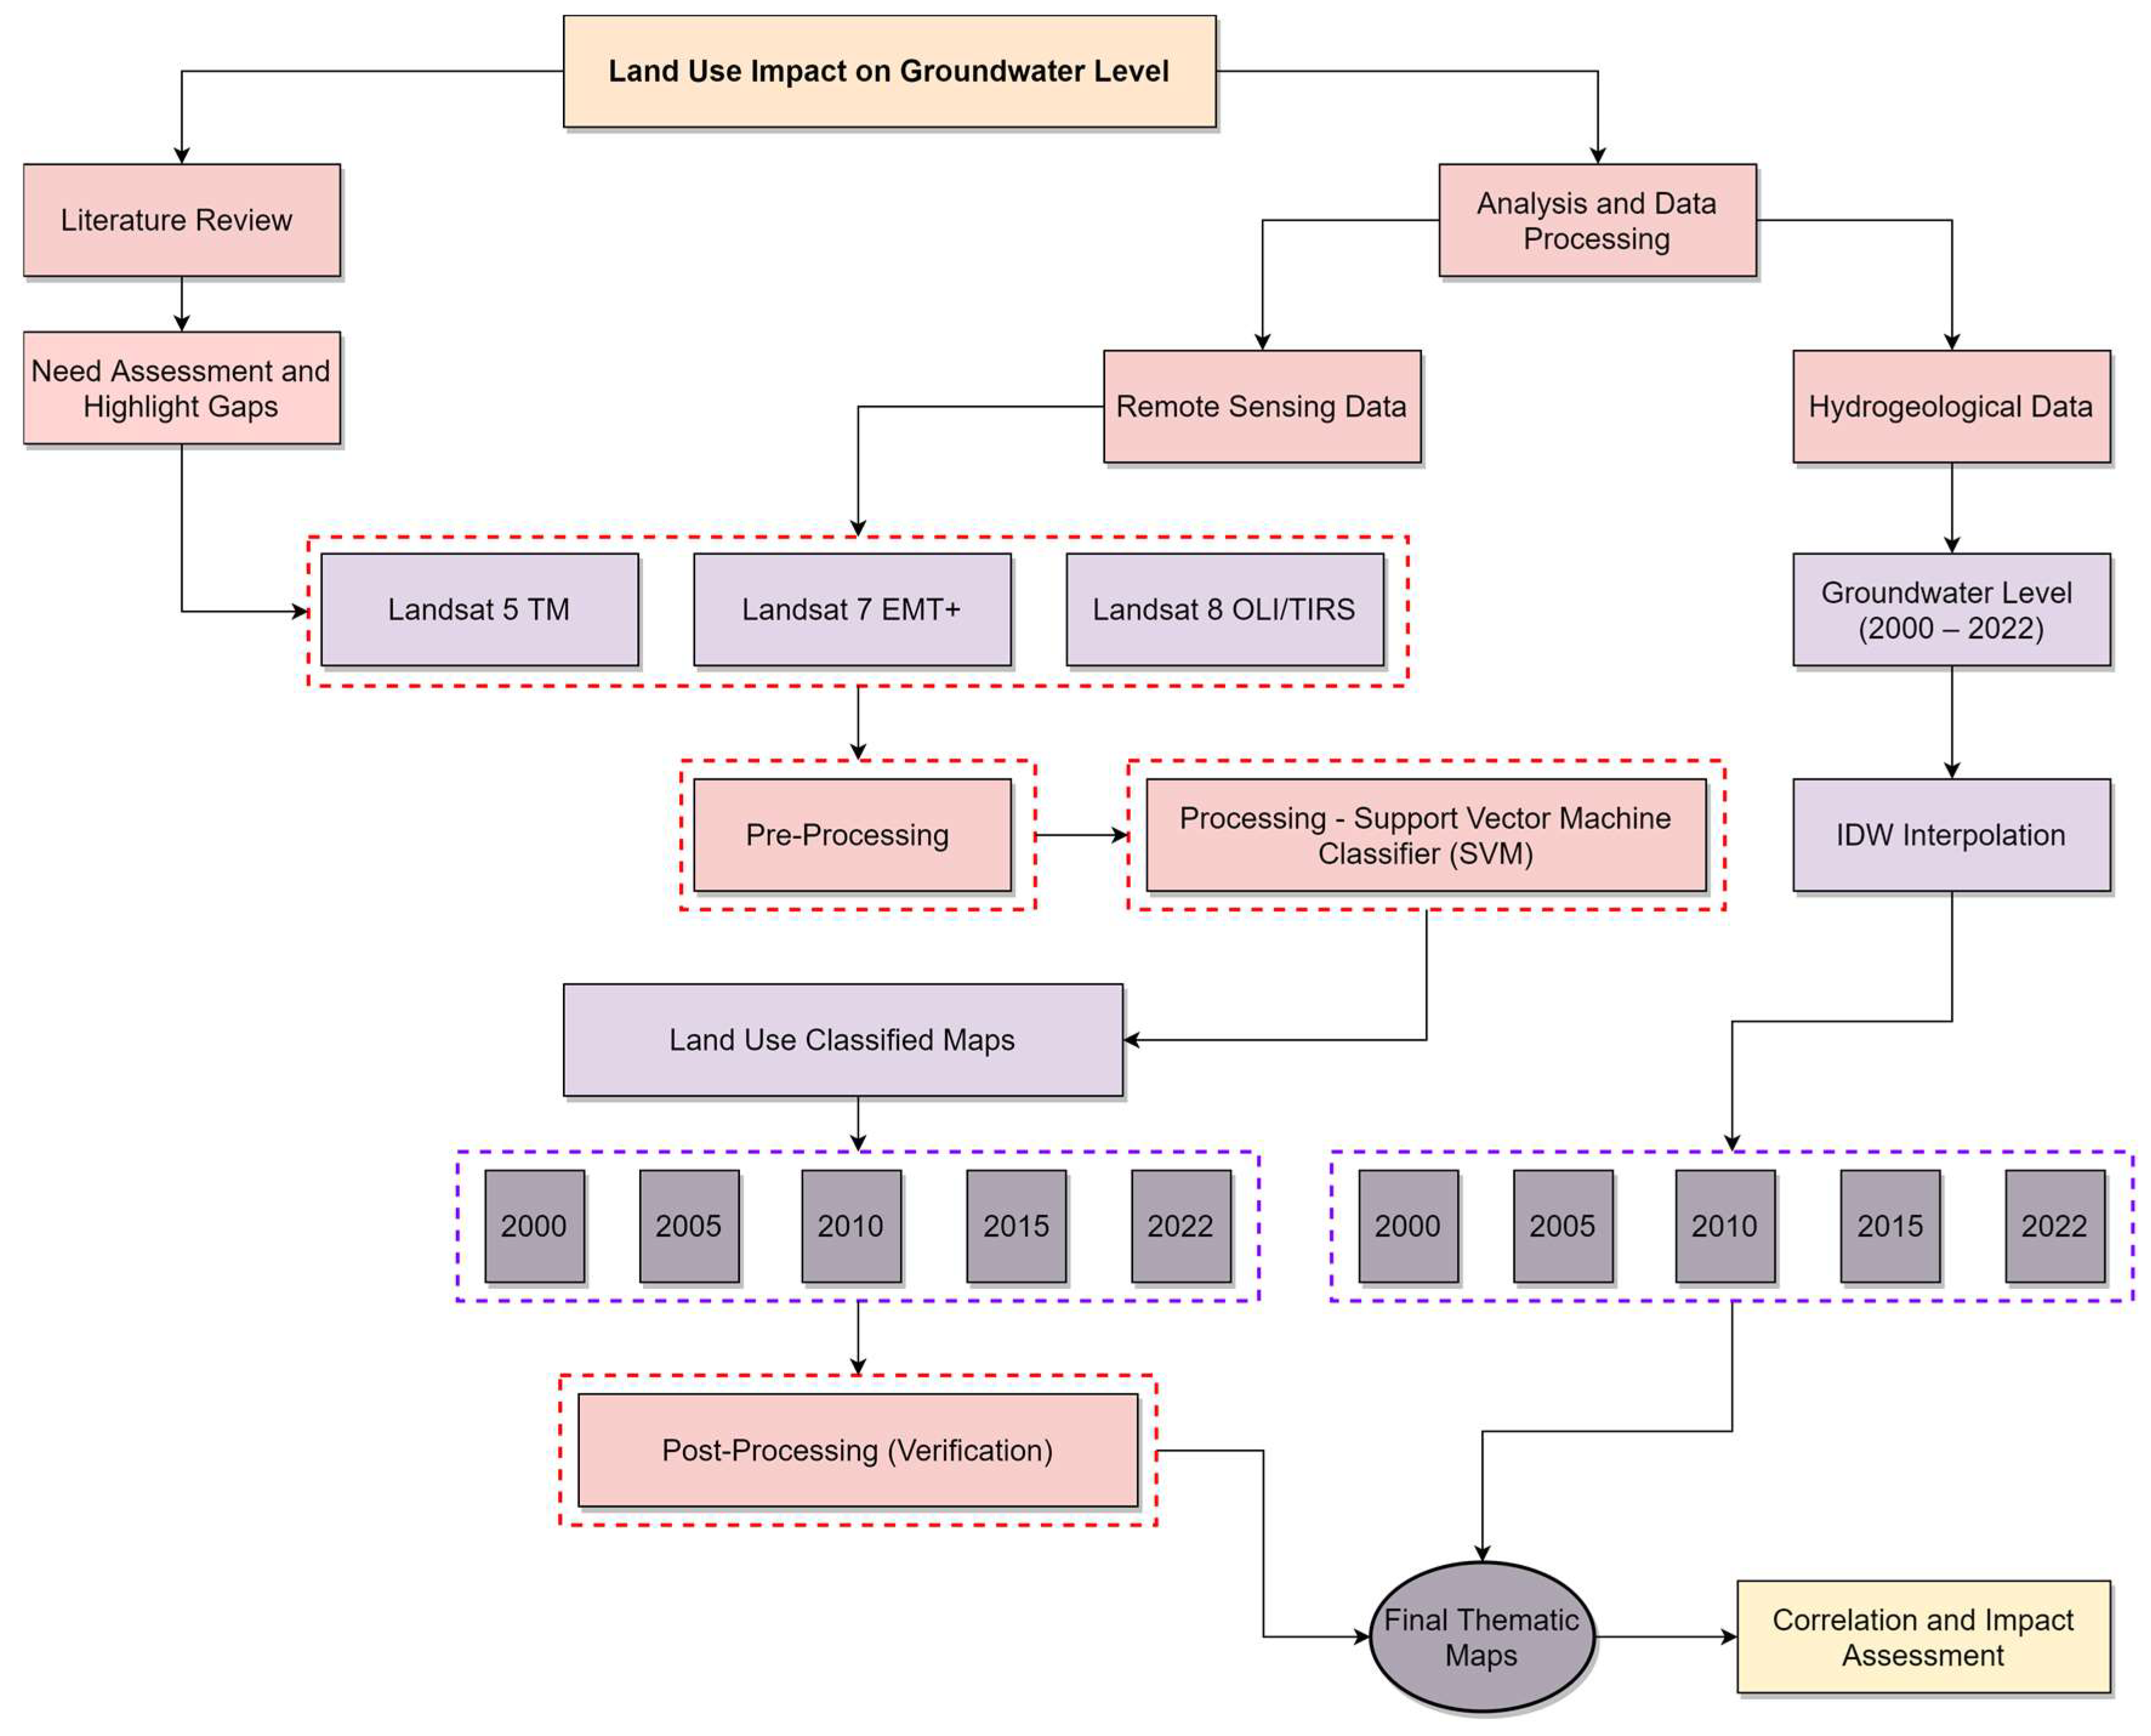
In this study, we primarily utilized remote sensing and hydrogeological data to evaluate the effects of land use and its expansion on groundwater depletion in Kabul city. We acquired multispectral Landsat series data, including Landsat 5 TM, Landsat 7 ETM+, and Landsat 8 OLI/TIRS, spanning five time points (2000, 2005, 2010, 2015, and 2022) from the official NASA USGS website. The chosen time interval facilitates the alignment of remote sensing data with groundwater level data. This alignment allows for the effective observation of how spatial patterns of urbanization influence (or are influenced by) groundwater levels. The specifications of the dataset are elaborated in (
Table 1). Hydrogeological data, encompassing previous studies regarding the groundwater conditions in Kabul city, were meticulously examined through an array of sources, including journal articles, conference proceedings, published reports, and authorized official websites. Groundwater-level data, including data for 1007 wells, spanning from 2000 to 2022 were sourced from various institutions, notably the Ministry of Energy and Water (MEW), the Danish Committee for Aid to Afghan Refugees (DACAAR), and the Japan International Cooperation Agency (JICA), among others. The description, including numbers and comprehensive details of this groundwater-level data, have been succinctly outlined in
Table 1.
As depicted in
Figure 2, a series of preprocessing steps were undertaken on the remote sensing data to ensure radiometric and atmospheric correction. Similarly, preprocessing was applied to the groundwater data, involving sorting and filtering based on the chosen date intervals. The preprocessed remote sensing data were then subjected to a comprehensive processing phase, enabling a robust supervised classification of distinct categories—namely, vegetation, bare land, urbanization, and water bodies. Concurrently, interpolation was employed to derive comprehensive groundwater-level data covering the entire city. The resultant classified maps underwent validation using test data to determine accuracy levels for each interval. Concluding the process, during the post-processing stage, the land use thematic maps were meticulously examined for temporal changes. These alterations were subsequently correlated with the interpolated groundwater data, facilitating an assessment of how urbanization expansion contributes to the depletion of groundwater levels across distinct districts within the city. ENVI 5.3 was employed for processing and classifying satellite imagery, while ArcMap 10.8 was utilized for groundwater data processing and plotting. Additionally, Google Earth Pro and ESRI basemaps were scrutinized to gather test data for verification purposes. Four sets of reference data points were collected for the years 2000, 2005, 2010, and 2015 from historical satellite imagery available on Google Earth Pro and represent known locations within the study area encompassing various land cover classes. One set of reference points for 2022 was derived from the basemap layer within ArcMap 10.8. A systematic approach was employed to ensure representative coverage of all relevant land cover classes across the entire study area during point collection. These points were imported to the ArcMap 10.8 environment for making confusion matrix calculations.
3.1. Support Vector Machine (SVM)
There are two main methods for digital image classification: unsupervised and supervised classification. Both methods use automated quantitative decision-making mechanisms to classify pixels in an image into different categories [
51]. In unsupervised classification, images are auto-grouped based on pixel similarity, forming spectral classes or themes. However, this may miss subtle spectral differences in user-relevant themes. Supervised classification solves this using a hand-classified training set. This set creates an interpretation key describing spectral signatures for user-relevant themes [
52,
53,
54].
Support vector machines (SVMs) are a type of supervised learning algorithm that are based on the principle of statistical learning theory. SVMs are known for their accuracy and robustness, and they are often used for classification and regression problems [
51,
55,
56]. SVMs work by finding a hyperplane in the space of possible inputs that separates the data into two classes. The hyperplane is chosen in such a way that it maximizes the margin between the two classes. In SVMs, the hyperplane is developed using a training dataset and validated using a testing dataset to prevent overfitting [
55,
57]. The efficiency of SVMs with other classification algorithms has been proven in the literature [
58,
59]
In this study, we employed Support Vector Machine (SVM) classification due to its efficiency for LULC classification to delineate four distinct classes: vegetation, bare land, urbanization, and water bodies. Under the vegetation classification, we encompassed dense vegetation, open green spaces, and agricultural land marked by crops and trees. The bare land class accounted for terrains like mountains, sandy expanses, deserts, and non-utilizable areas. The urbanization category encompassed residential, commercial, and industrial zones. Lastly, the water body class incorporated wetlands, canals, rivers, and lakes. In total, we obtained 3917 training samples, distributed as follows: 887 for vegetation, 1558 for bare land, 1307 for urbanization, and 165 for water bodies. The accuracy of the classified maps for each date interval was evaluated through a confusion matrix, which is elaborated upon later in the discussion.
3.2. Inverse Distance Weighting (IDW) Interpolation
Inverse distance weighting (IDW) interpolation is a method for estimating the value of a variable at an unsampled location based on the values of the variable at nearby sampled locations. It is a simple and effective method that is often used for mapping variables such as elevation, rainfall, groundwater level, and population density. IDW interpolation is an exact method, which means that the interpolated values will exactly match the values at the sampled locations. It is also a convex method, which means that the interpolated values will always be between the minimum and maximum values of the variable at the sampled locations. IDW interpolation is only suitable for variables that have a continuous model of spatial variation. This means that the variable must change smoothly from one location to another, without any sudden jumps or discontinuities [
20,
60]. According to [
60], the fundamental concept underlying IDW interpolation involves employing a set of sampled points through a weighted linear combination. It relies on both statistical and mathematical approaches to construct surfaces and estimate values for unmeasured points. The overarching equation utilized for IDW interpolation is as follows:
In this context, Z represents the interpolated value at a grid node, while Zi signifies the neighboring data points, and dij corresponds to the distances between the grid node and the data points.
In this research, we employed IDW interpolation techniques within the ArcMap environment to interpolate groundwater level data across five distinct intervals: 2000, 2005, 2010, 2015, and 2022 for the entire area of Kabul city. Subsequently, we utilized the raster calculator to quantify the fluctuations in groundwater levels for each of the five-year periods. These outcomes were then cross-referenced with changes in land use, with a specific focus on urbanization, to facilitate an impact assessment.
4. Results
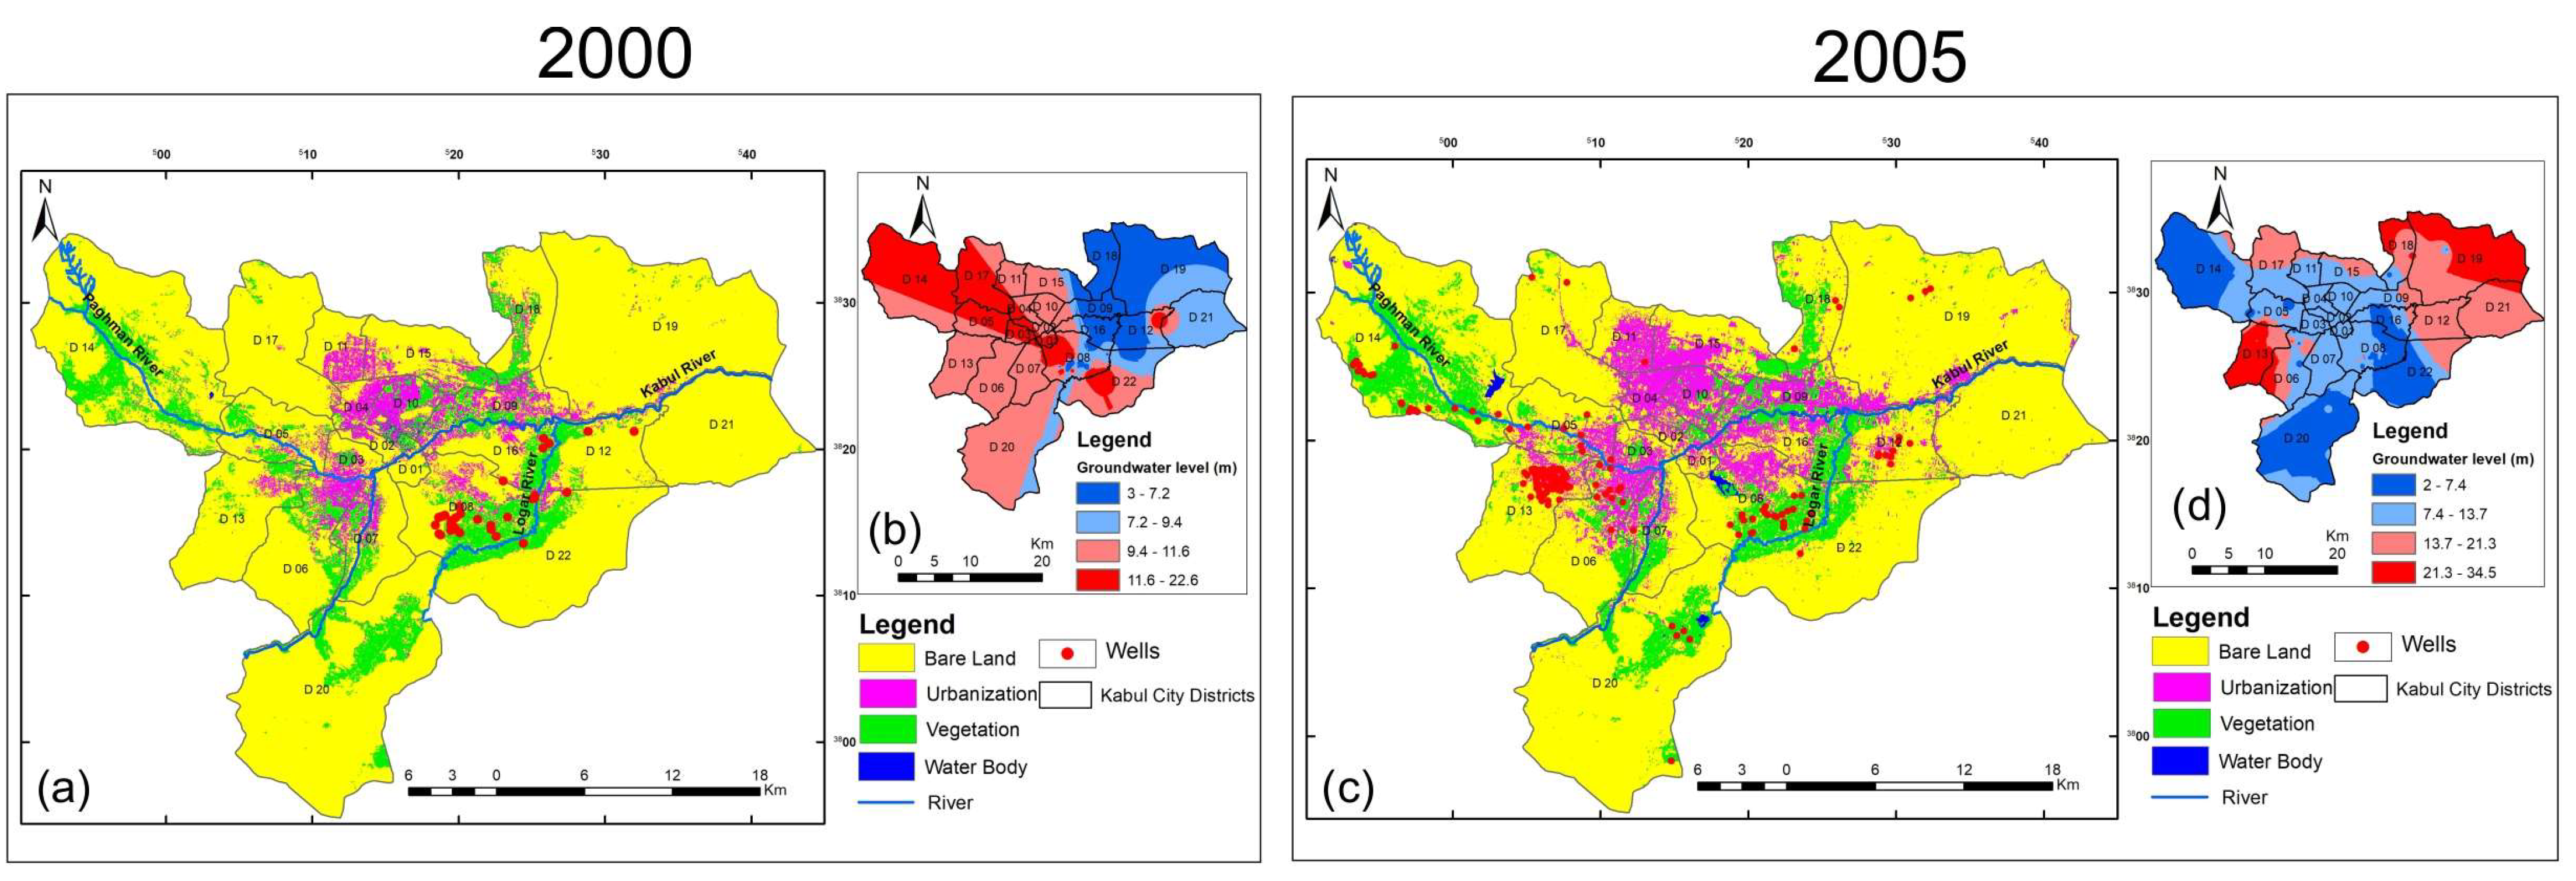
4.1. Land Use and Land Cover (LULC)
LULC analysis of Landsat imagery from 2000 to 2022 revealed significant changes in Kabul’s natural environment, likely due to human activities. The analysis identified four land cover classes: bare land, urbanization, vegetation, and water bodies. These classes exhibited variations across the city throughout the study period. A supervised classification using a support vector machine (SVM) was employed to estimate the rate of change in land cover classes across the study area for the five years 2000, 2005, 2010, 2015, and 2022. The classification achieved high accuracy (
Figure 3 and
Figure 4). Spatial patterns and total area of each land cover class for the study period (2000–2022) are presented in
Figure 3 and
Figure 4 and
Table 2. Analysis of these results reveals changes in the area of different LULC classes over time. Notably, the data indicate a significant increase in urbanization.
The LULC analysis revealed substantial changes between 2000 and 2005. Vegetation area increased by 700 hectares (5.15%), while bare land decreased by 6700 hectares (8.8%). Notably, built-up areas exhibited the most significant increase, expanding by 5800 hectares (44.9%). Water bodies also showed a noteworthy increase of 300 hectares (60%) (
Figure 3a,c). As observed, mostly bare land and vegetation were substituted with built-up areas over the central districts of Kabul. Further research is needed to establish a definitive link between these observed changes and potential drivers such as changes in the government system, refugee resettlement, and population growth.
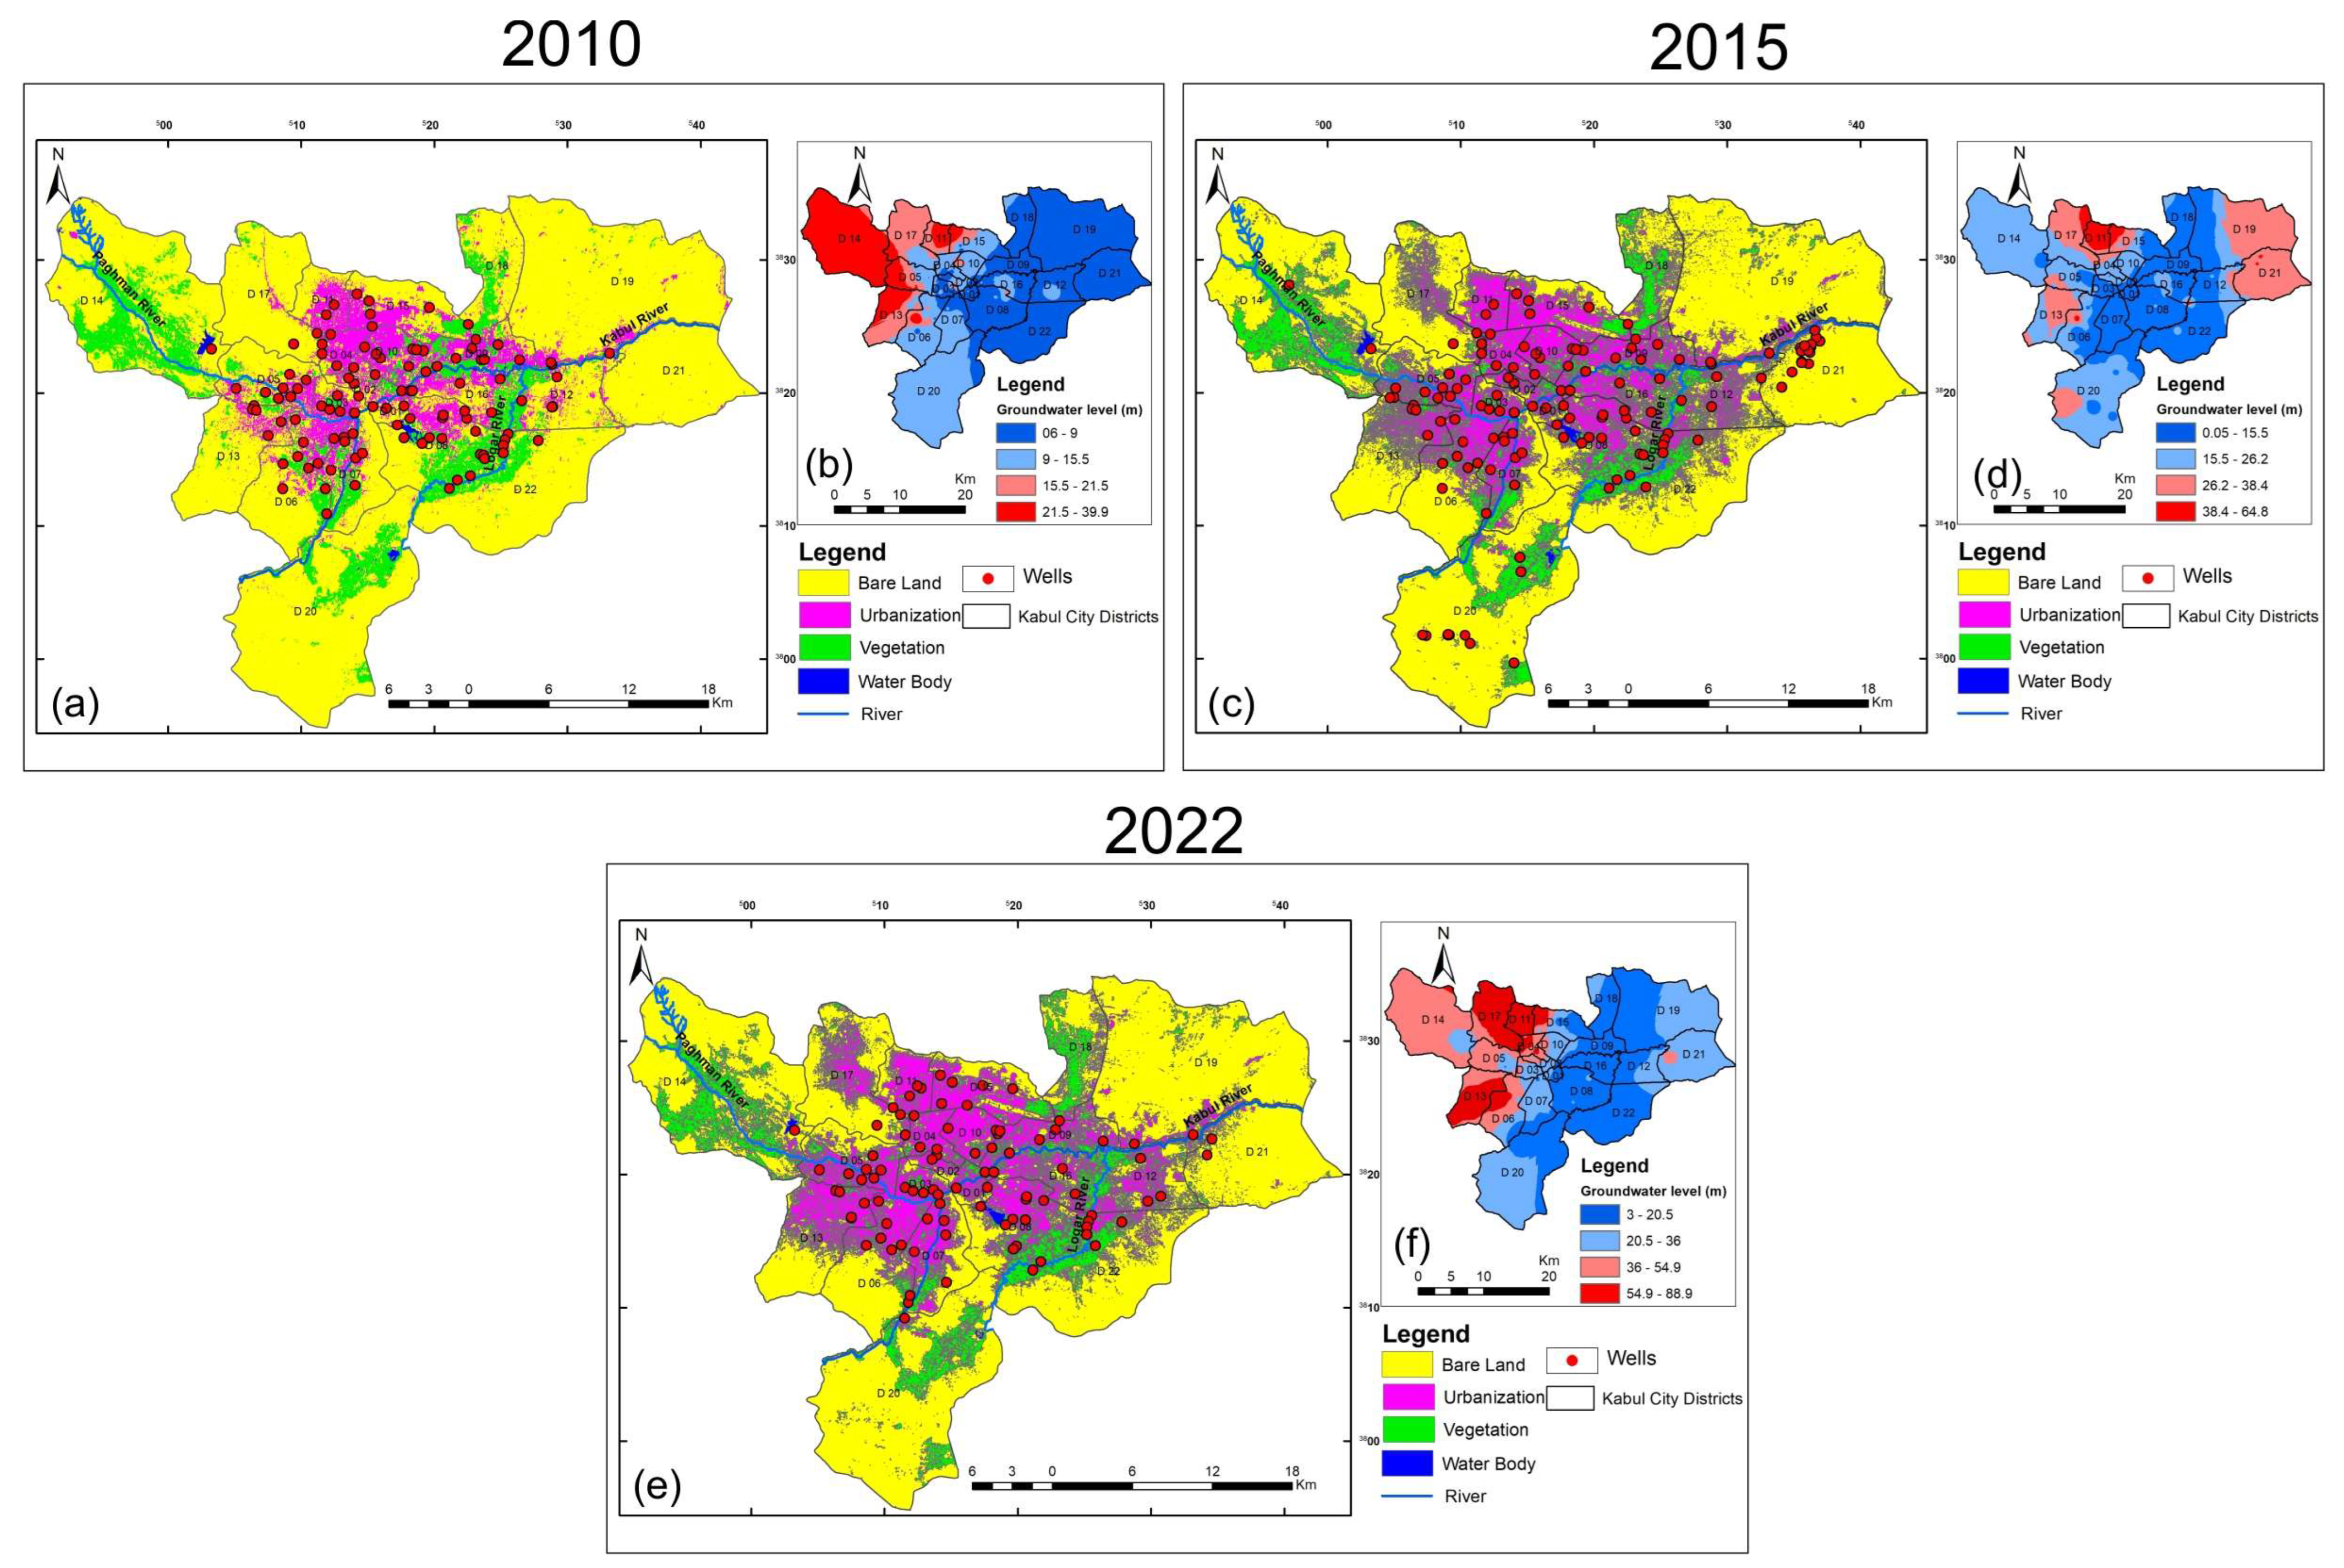
As indicated in
Figure 4, the LULC analysis for 2010 revealed a decrease in the vegetation area of 100 hectares (1.0%). Notably, the remaining three land cover classes (bare land, built-up areas, and water bodies) did not exhibit significant changes compared to 2005. The 2015 LULC analysis revealed substantial changes. Vegetation area decreased by 600 hectares (4.6%), and bare land area decreased even more significantly by 9200 hectares (13.75%). Conversely, built-up areas, a crucial class for the city’s development, increased by 10,000 hectares (43.67%). Notably, water bodies also showed a decrease of 100 hectares (25%) (
Figure 4) (
Table 2).
The period from 2015 to 2022 witnessed continued changes in land cover. Vegetation area decreased by 200 hectares (1.57%), and bare land area also exhibited a decrease of 1400 hectares (2.14%). Conversely, built-up area continued its expansion, increasing by 1700 hectares (6.91%). Notably, water bodies showed the most significant decline in this period, with a decrease of 100 hectares (33.3%) (
Figure 4) (
Table 2). During the past two decades, urbanization has been extended around the central capital and mostly the districts, e.g., D5, D6, D7, D11, D12, D13, D15, D17, and D22.
As observed, analysis of land use and land cover (LULC) changes in Kabul city from 2000 to 2022 revealed a gradual increase in urbanization. Built-up areas expanded from approximately 5800 hectares in 2000 to 10,000 hectares by 2015, with a further increase of 1700 hectares by 2022. The most notable increase in built-up areas occurred between 2010 and 2015. The other land cover classes have also undergone substantial changes over the past two decades. Vegetation extent decreased by 200 hectares from 2000 to 2022. Bare land, directly correlated with built-up areas, decreased by 17,300 hectares from 2000 to 2022. The water body class, however, increased by 300 hectares from 2000 to 2005 but then decreased again from 2005 to 2015. Overall, the water body area only expanded by 100 hectares across the city (
Table 2).
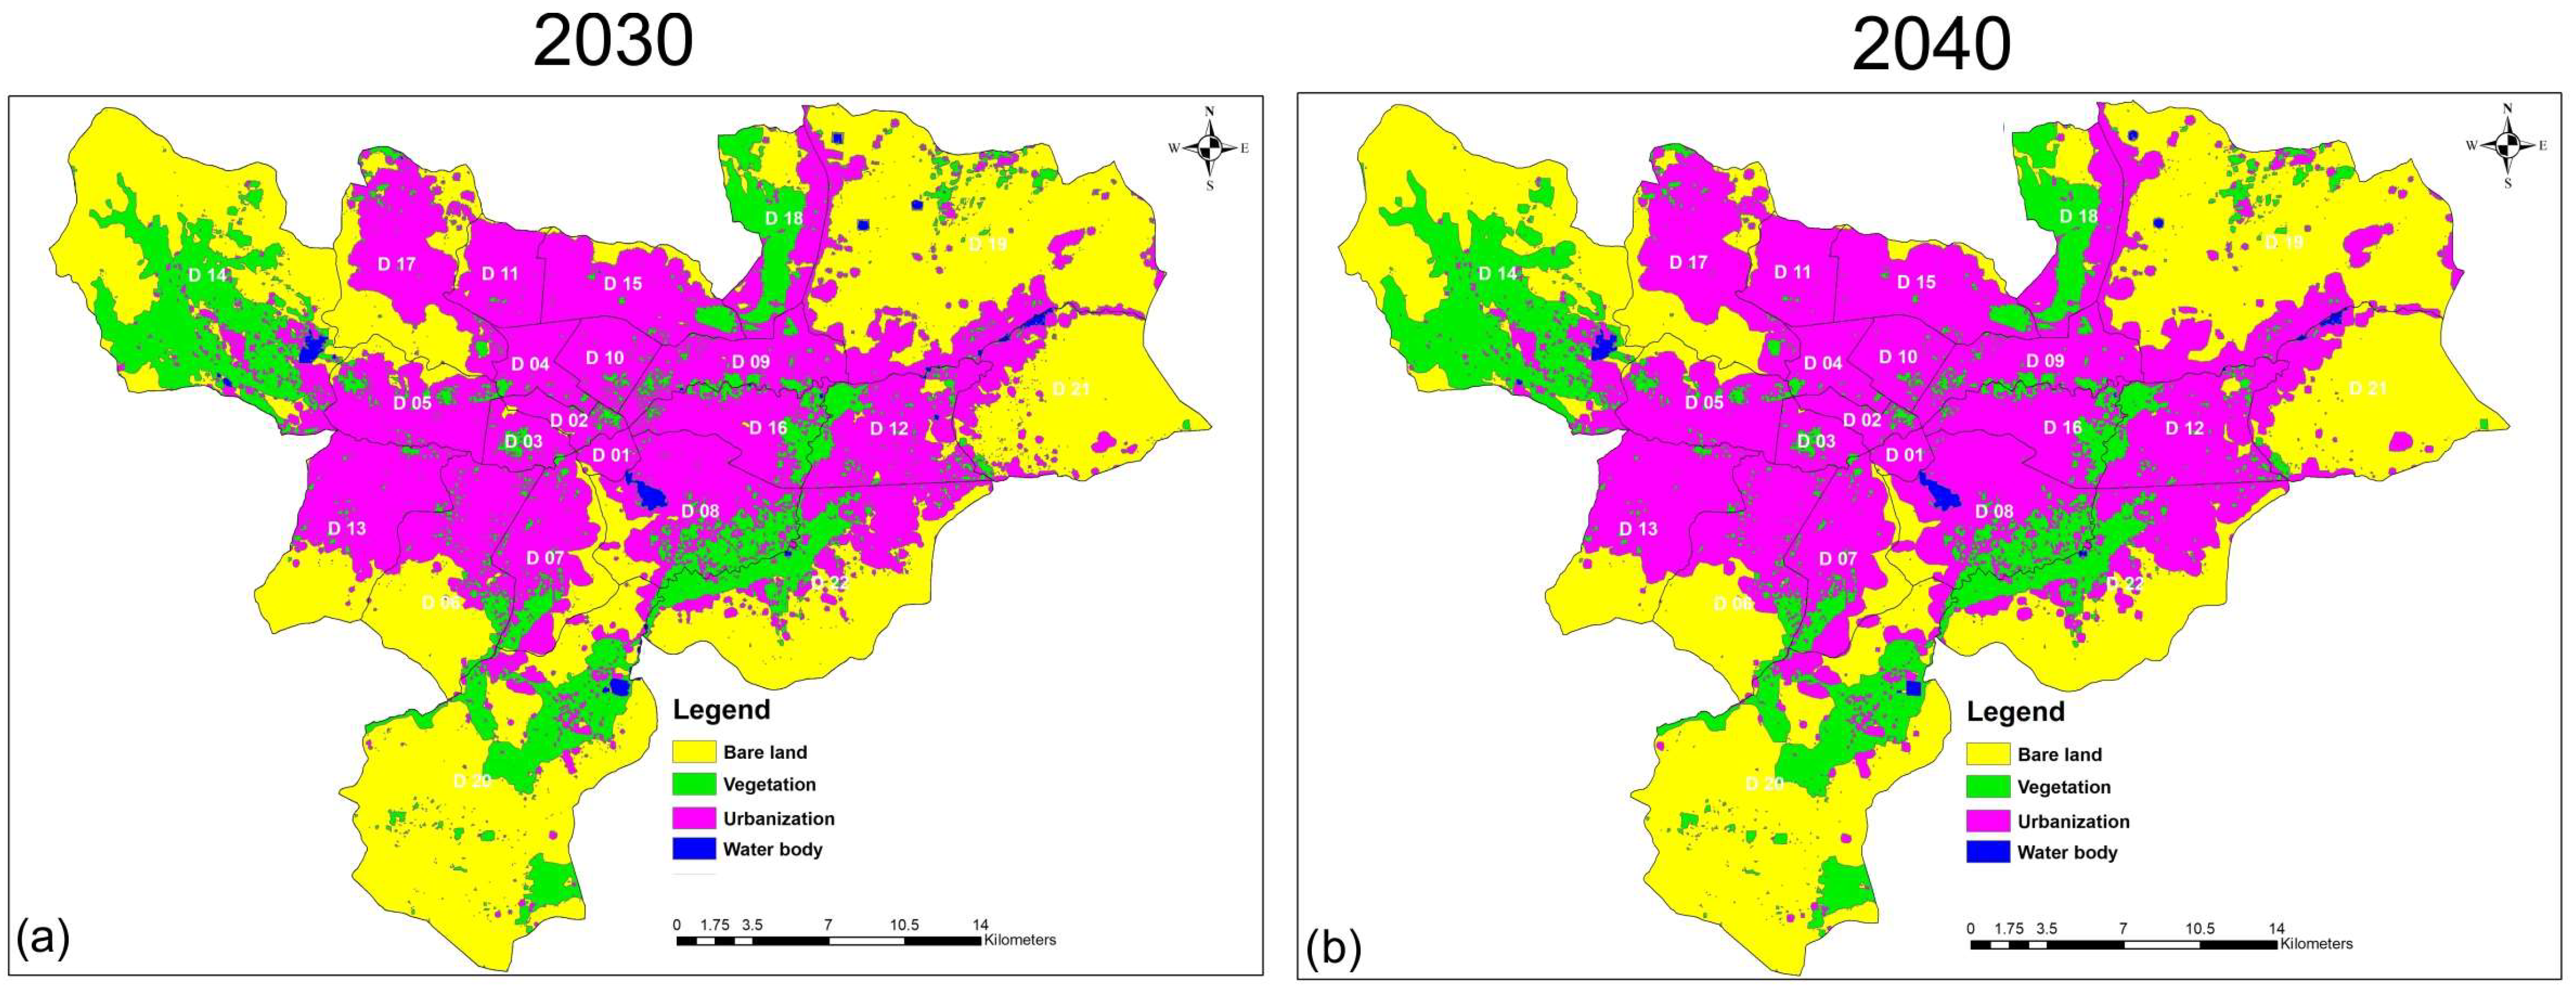
The CA-Markov model was employed to simulate potential land use/land cover (LULC) changes for 2030 and 2040. The model was trained on the historical LULC data from 2000 to 2022 (identified using vector machine classification). Simulated LULC maps for 2030 and 2040 are presented in
Figure 5. The corresponding areas of each simulated land cover class in 2030 and 2040 are detailed in
Table 3. The CA-Markov model simulations project changes in land cover for the study area. Vegetation area is expected to increase from 12,700 hectares in 2022 to 15,400 hectares in 2030 and 16,100 hectares in 2040. Conversely, bare land is expected to decrease from 65,500 hectares in 2022 to 46,600 hectares in 2030 and 43,800 hectares in 2040. The predictions continue expansion of built-up areas, a key indicator of urbanization. Built-up areas are expected to increase from 24,600 hectares in 2022 to 40,500 hectares in 2030 and 42,700 hectares in 2040. Water bodies, on the other hand, exhibit a more complex pattern. While they are expected to increase to 600 hectares in 2030, the model predicts a decrease to 400 hectares by 2040 (
Table 3).
4.2. Groundwater Fluctuation
To assess the potential impacts of urbanization and land cover changes on Kabul city’s groundwater, groundwater-level data were acquired from various sources. These sources include private wells, public standard wells, and piezometers installed and monitored by the Groundwater Department of the Ministry of Water and Energy (MWE) and DACAAR. The wells and piezometers are situated across different areas of the city. A total of 1007 groundwater-level data points were obtained for the analysis. These data were distributed across the study periods, with 78 measurements from 2000, 527 from 2005, 116 from 2010, 189 from 2015, and 97 from 2022. This data was used to generate interpolation maps depicting groundwater levels.
Groundwater-level data for 2000 reveal spatial variations across Kabul city. The eastern part exhibited the shallowest groundwater table, ranging from 3 m to 22.6 m, while the central and western regions had the deepest groundwater, ranging from an unspecified minimum to a maximum of 22.6 m (
Figure 3b). By 2005, a decline in groundwater levels was observed across the entire city, with the range expanding from 2 m to 34.5 m. Notably, the eastern region continued to show the most significant decline, with a water table depth now lower than the central and western regions (
Figure 3b).
Groundwater-level data from observatory wells in 2010 indicate spatial variations across Kabul city (
Figure 4b). The eastern and central regions exhibited the shallowest groundwater table, ranging from 6 m to 9 m. Conversely, the western and northwestern districts, particularly D14, D11, D13, and a part of D5, had the deepest groundwater, reaching up to 39.9 m. By 2015, the data (
Figure 4d) reveals a decline in groundwater levels across the entire city, with depths reaching up to 64.8 m. Central and southern districts showed the shallowest levels in 2015, although deeper than those observed in 2010. Eastern districts, particularly D19 and D21, and northern districts, specifically D11 and D17, had the deepest groundwater levels in 2015.
The decline in groundwater levels observed throughout the previous years persists in 2022. Data from recent well measurements indicate a range of 3 to 88.9 m, with eastern Kabul districts exhibiting shallower groundwater compared to western districts. However, compared to groundwater levels two decades ago, a significant decline is evident across the entire city (
Figure 4f).
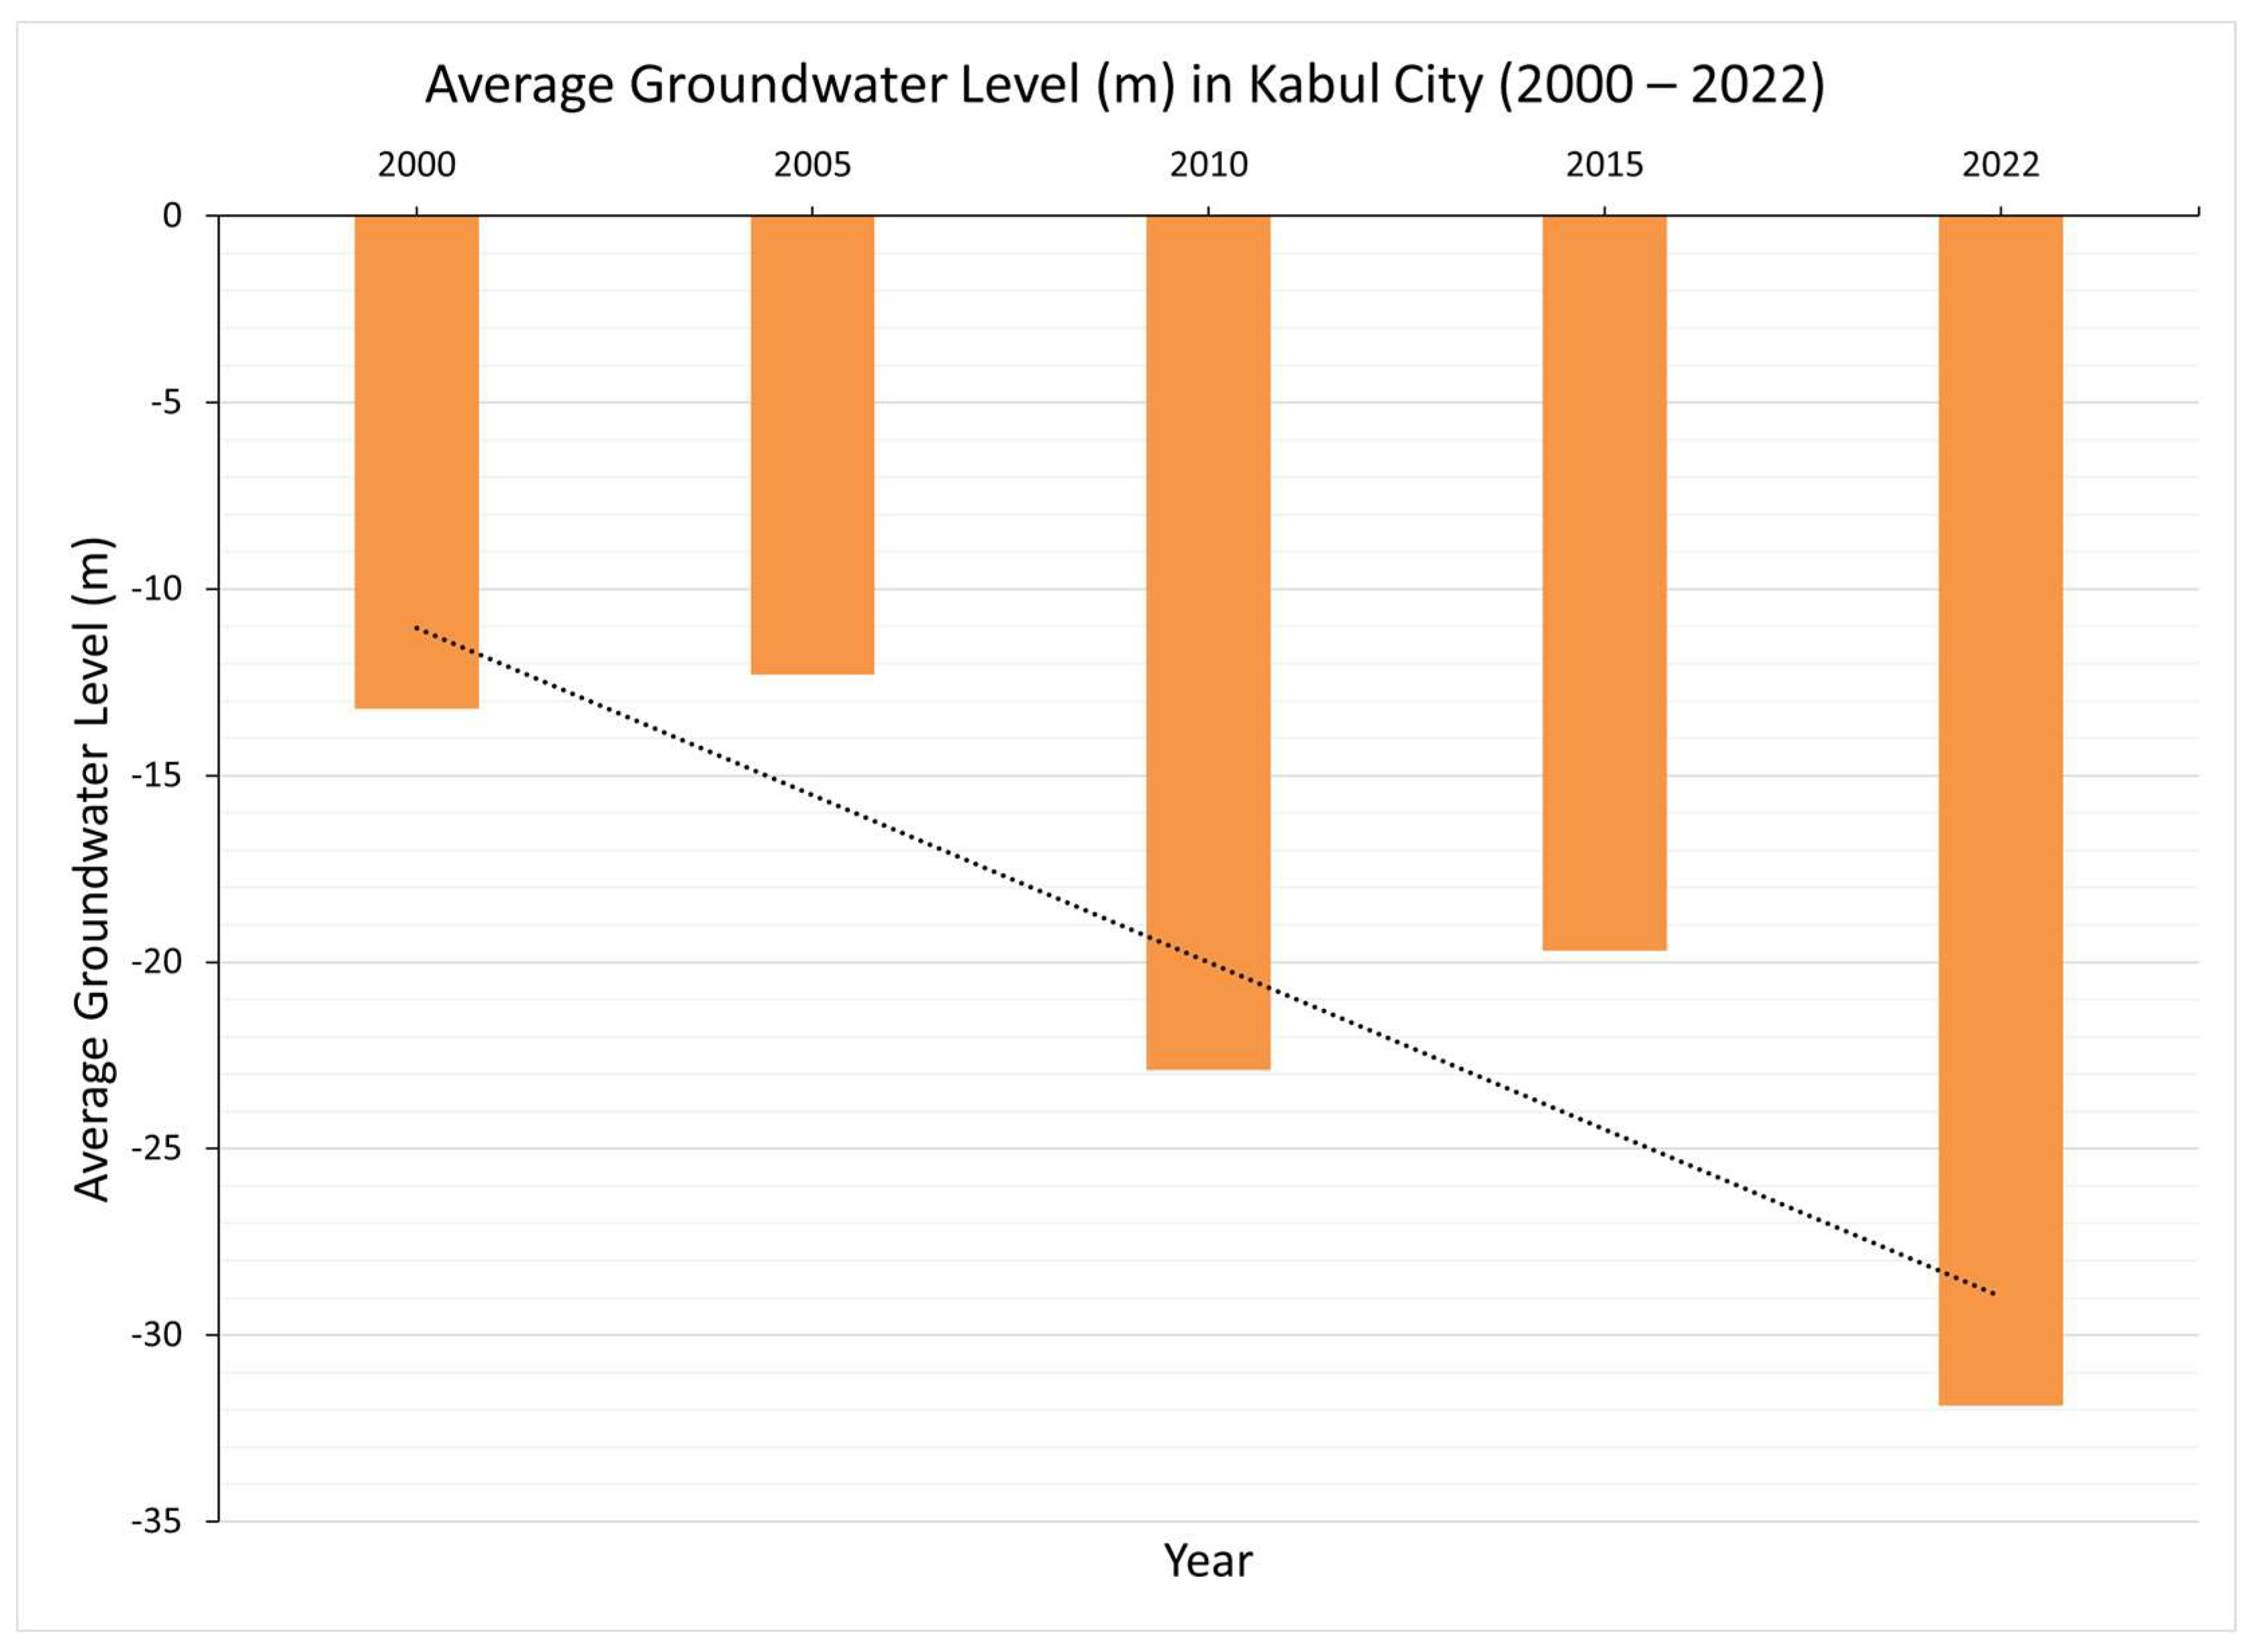
Analysis of groundwater-level data collected from 2000 to 2022 indicates a decline in groundwater levels across the study area. The data reveals a decrease in water table depth in nearly all wells monitored.
Figure 6 illustrates this trend, with groundwater levels dropping within a range of 13 to 35 m between 2000 and 2022. This decline may be linked to factors such as population growth, urban expansion, and climate change, which require further investigation.
5. Discussion
This study employed geospatial technology to assess the impact of land use and land cover (LULC) dynamics on groundwater depletion in Kabul City, Afghanistan, from 2000 to 2022. The findings reveal a significant correlation between increasing urbanization and declining groundwater levels. Urbanization has multiple consequences for groundwater resources, e.g., reduced infiltration impervious surfaces (such as concrete and asphalt hinder rainwater infiltration into the ground, thereby limiting groundwater recharge), increased water demand (growing urban populations require more water for domestic and industrial uses, leading to overexploitation of groundwater resources), and deterioration of water quality (urban wastewater infiltration can contaminate groundwater with pollutants). Landsat imagery from missions 5, 7 (Enhanced Thematic Mapper Plus), and 8 (Operational Land Imager/Thermal Infrared Sensor) was acquired at five-year intervals over the past two decades to map land use/land cover (LULC) dynamics. This high-resolution time series data facilitated the analysis of urbanization patterns. Concurrently, groundwater well data encompassing 1007 points was employed to delineate groundwater levels and assess depletion trends over the same two-decade period. Change detection techniques were applied to both LULC and groundwater data, followed by spatial interpolation to elucidate the relationship between urbanization patterns and groundwater depletion. A strong spatial correlation was observed between the patterns of LULC change and groundwater level fluctuations across the entire city. Notably, districts characterized by the most intensive urban expansion exhibited the most pronounced declines in groundwater levels.
Our analysis revealed a significant decline in groundwater levels within urbanizing districts between 2000 and 2005, with an average decrease of approximately 10 m (
Figure 3). This period coincided with an influx of Afghan refugees from neighboring countries to Kabul due to a government transition. This influx likely caused a significant increase in water demands. Additionally, the concurrent expansion of urbanization around the city likely triggered a rise in domestic well usage, further straining drinking water supplies. Climate change is another factor that may have contributed to the reduction in precipitation feeding the Kabul aquifer. This trend continued during the 2005–2010 period, with a less pronounced decline of roughly 4 m. Interestingly, the spatial pattern of groundwater depletion shifted from eastern to western districts during this five-year interval. This shift could potentially be attributed to a confluence of factors, including population growth, urban expansion, and the overexploitation of groundwater resources for agricultural purposes.
A substantial decline in groundwater levels, exceeding 20 m, was observed across the northern, eastern, and western districts during the 2010–2015 period (
Figure 4). This coincided with a significant expansion of built-up areas evident in the corresponding LULC data, suggesting a causal relationship between urbanization and increased groundwater consumption. The conversion of vegetated and bare lands suitable for infiltration, particularly in the northern, eastern, and southwestern peri-urban areas of Kabul, to built-up areas has likely significantly reduced groundwater recharge. This process is known as urban sprawl. Additionally, the expansion of built-up areas along the Kabul and Paghman Rivers may have further exacerbated groundwater demands due to increased population density and potential changes in water usage patterns. Furthermore, analysis of LULC and well data from 2015 to 2022 reveals continued depletion, with an additional decrease of approximately 24 m in the northwestern and western districts, particularly within Districts D11, D13, and D17. Despite the potentially high vegetation cover in these districts, groundwater depletion has likely occurred over the past two decades. A significant contributing factor could be the overexploitation of groundwater resources by agricultural activities. The widespread adoption of solar-powered irrigation systems may have enabled farmers to pump groundwater for extended periods, potentially exceeding natural aquifer recharge rates.
Our findings indicate a strong negative impact of urban expansion on groundwater levels in Kabul City. The observed spatial correlation between land use/land cover (LULC) changes and groundwater depletion suggests a causal relationship. Utilizing the CA-Markov model’s predictions for LULC changes over the next 10 and 20 years (2030–2040), we can anticipate further depletion of groundwater resources (
Figure 5). This scenario necessitates the development and implementation of a comprehensive groundwater management strategy to ensure the city’s long-term water security.
The accuracy of the LULC maps derived from remote sensing data was assessed using ground truth data for verification (in total, 3917 reference points, including 936 for 2000, 973 for 2005, 976 for 2010, 476 for 2015, and 556 for 2022). Direct access to field truth data was not available; therefore, high-resolution imagery from Google Earth served as the reference data for this validation process. We attempted to collect the reference data randomly from each class to cover the entire study area. Overall accuracy, user accuracy, producer accuracy, and Kappa coefficient were calculated for each classified image (2000, 2005, 2010, 2015, 2022) to evaluate both thematic and positional correctness. As presented in
Table 4, the overall accuracy for all LULC maps exceeded 86%. Notably, these values surpass the minimum threshold of 85% established by the USGS for satisfactory land cover classifications [
61]. Furthermore, the Kappa coefficients for each classified map ranged from 78.4% to 93.5%, with most exceeding 0.80. This indicates a high level of agreement between the classified maps and the reference data, supporting their suitability for further analyses. This study encountered limitations in differentiating built-up areas with low classification accuracy, particularly when these areas comprised mixed construction materials and were confused with bare land. Building roof materials in Kabul exhibit significant spatial variability. Local construction practices incorporate mud roofs, which spectrally resemble bare land composed of clay and sand. This spectral similarity presents a challenge for accurate land use/land cover (LULC) classification using remote sensing data. However, the accuracy of simulated land use/land cover (LULC) from the CA-Markov model is demonstrably linked to the quality and availability of input data. In this study, while we lack field-based truth data for future scenarios to directly assess the CA-Markov model’s accuracy, we can indirectly evaluate it using the generated LULC data for the 2000–2022 period. The high overall accuracy of the model for this historical period suggests its potential for simulating future LULC changes. Additionally, the spatial patterns in the model output exhibit a strong correlation with the input data, further supporting its reliability. A key limitation of this study is the absence of direct ground truth data for future LULC simulations. Future research efforts could address this limitation by incorporating field data collection for model validation.
6. Conclusions
In alignment with the primary objective of this study, which was to assess the influence of land use/land cover (LULC) changes on groundwater fluctuations across Kabul over the past two decades (2000–2022), a geospatial approach was implemented. A time series of Landsat imagery, encompassing Landsat 5, 7 ETM+, and 8 OLI/TIRS, was utilized to generate LULC maps using a supervised classification algorithm based on support vector machines. This analysis produced five distinct LULC maps corresponding to the years 2000, 2005, 2010, 2015, and 2022. Our findings revealed statistically significant changes in LULC classes over the study period, particularly a notable increase in the built-up class within Kabul City.
Our analysis revealed a substantial increase in urban extent of 44.9% between 2000 and 2005, coinciding with a decrease in bare land cover of 8.8%. This shift can be attributed to factors such as changes in government, refugee resettlement programs, and population growth. The subsequent period (2005–2010) did not exhibit significant changes in land cover classes. However, a renewed surge in urban expansion was observed from 2010 to 2015, with a 43.67% increase in built-up areas. Conversely, vegetation cover, bare land, and water bodies experienced reductions of 4.6%, 13.75%, and 25%, respectively, during this timeframe. This trend continued over the next five years (2015–2020), with a further expansion of built-up class (6.91%) at the expense of other land cover classes. Notably, these land cover changes coincided with a decline in groundwater levels across the city. Over the entire study period (2000–2022), urban areas within Kabul City expanded by a significant 70%, particularly within Districts 5, 6, 7, 11, 12, 13, 15, 17, and 22. Furthermore, predictions based on the CA-Markov model, considering the current LULC patterns, suggest a continued expansion of built-up areas over the next two decades.
A strong spatial correlation was observed between the patterns of LULC changes and groundwater-level fluctuations across Kabul City. Districts characterized by the most intensive urban expansion exhibited the most pronounced declines in groundwater levels. This spatial correspondence suggests a potential causal relationship between urbanization and groundwater depletion. Our analysis of LULC and groundwater well data further indicates that overexploitation of groundwater resources for agricultural purposes in rural villages surrounding the central districts likely contributes to the overall decline in groundwater levels.
The projected continuation of current LULC trends and groundwater depletion patterns suggests a heightened risk of water scarcity, land subsidence, and environmental degradation for Kabul City in the coming decades. To mitigate these potential threats, several strategies are highly recommended, including water conservation initiatives, rainwater harvesting programs, improved wastewater management practices, exploration of alternative water sources, and the implementation of sustainable urban planning principles. Sustainable groundwater management is critical for Kabul’s future. Implementing several key strategies is recommended. First, adopting an Integrated Water Resources Management (IWRM) framework would ensure coordinated management across all water sectors. Second, a robust monitoring system with a centralized database for groundwater levels and quality would provide real-time data for informed decision-making. Third, a legal framework regulating extraction and preventing overexploitation is crucial. Fourth, public education programs promoting water conservation and sustainable practices, along with community engagement, are essential. Fifth, investment in modern water recycling technologies and efficient irrigation systems would minimize reliance on groundwater. Finally, for transboundary aquifers, collaborating with neighboring countries on sustainable management is vital. Implementing these scientifically grounded recommendations will contribute significantly to the long-term health of Kabul’s groundwater resources.
This study serves as a valuable foundation for further research on Kabul’s water resources and management. Future investigations could focus on groundwater quality assessment and future trends based on the CA-Markov-generated model for LULC, the development of models to predict water demand and groundwater availability under various scenarios, and a socio-economic impact analysis of water resource management strategies.
Author Contributions
Conceptualization, H.A., G.O. and A.P.; methodology, H.A.; software, A.P. and S.A.; validation, H.A., E.P. and A.B.; formal analysis, A.B.; investigation, H.A.; resources, G.O., Y.A. and S.A.; data curation, E.P.; writing—original draft preparation, A.P.; writing—review and editing, H.A.; visualization, A.P.; supervision, H.A.; project administration, H.A.; funding acquisition, A.B. and Y.A. All authors have read and agreed to the published version of the manuscript.
Funding
This research received no external funding.
Data Availability Statement
The original contributions presented in the study are included in the article, further inquiries can be directed to the corresponding author.
Conflicts of Interest
The authors declare no conflicts of interest.
References
- Wada, Y.; Van Beek, L.P.H.; Van Kempen, C.M.; Reckman, J.W.T.M.; Vasak, S.; Bierkens, M.F.P. Global depletion of groundwater resources. Geophys. Res. Lett. 2010, 37. [Google Scholar] [CrossRef]
- Zhang, X.; Zhang, L.; He, C.; Li, J.; Jiang, Y.; Ma, L. Quantifying the impacts of land use/land cover change on groundwater depletion in Northwestern China—A case study of the Dunhuang oasis. Agric. Water Manag. 2014, 146, 270–279. [Google Scholar] [CrossRef]
- Agam, N.; Evett, S.R.; Tolk, J.A.; Kustas, W.P.; Colaizzi, P.D.; Alfieri, J.G.; McKee, L.G.; Copeland, K.S.; Howell, T.A.; Chávez, J.L. Evaporative loss from irrigated interrows in a highly advective semi-arid agricultural area. Adv. Water Resour. 2012, 50, 20–30. [Google Scholar] [CrossRef]
- Ahmadi, H.; Kaya, O.; Babadagi, E.; Savas, T.; Pekkan, E. GIS—Based groundwater potentiality mapping using AHP and FR models in central Antalya, Turkey. Environ. Sci. Proc. 2021, 5, 11. [Google Scholar]
- Dong, S.; Samsonov, S.; Yin, H.; Ye, S.; Cao, Y. Time-series analysis of subsidence associated with rapid urbanization in Shanghai, China measured with SBAS InSAR method. Environ. Earth Sci. 2014, 72, 677–691. [Google Scholar] [CrossRef]
- Jeong, C.H. Effect of land use and urbanization on hydrochemistry and contamination of groundwater from Taejon area, Korea. J. Hydrol. 2001, 253, 194–210. [Google Scholar] [CrossRef]
- Misra, A.K. Impact of Urbanization on the Hydrology of Ganga Basin (India). Water Resour. Manag. 2011, 25, 705–719. [Google Scholar] [CrossRef]
- Oiro, S.; Comte, J.C.; Soulsby, C.; MacDonald, A.; Mwakamba, C. Depletion of groundwater resources under rapid urbanisation in Africa: Recent and future trends in the Nairobi Aquifer System, Kenya. Hydrogeol. J. 2020, 28, 2635–2656. [Google Scholar] [CrossRef]
- Sohail, M.T.; Manzoor, Z.; Ehsan, M.; Al-Ansari, N.; Khan, M.B.; Shafi, A.; Ullah, J.; Hussain, A.; Raza, D.; Usman, U.; et al. Impacts of urbanization, LULC, LST, and NDVI changes on the static water table with possible solutions and water policy discussions: A case from Islamabad, Pakistan. Front. Environ. Sci. 2023, 11, 1018500. [Google Scholar] [CrossRef]
- Zhou, Y.; Wang, L.; Liu, J.; Li, W.; Zheng, Y. Options of sustainable groundwater development in Beijing Plain, China. Phys. Chem. Earth 2012, 47–48, 99–113. [Google Scholar] [CrossRef]
- Ahmadi, H.; Sahak, A.S.; Ayoobi, A.W.; Pekkan, E.; Inceoğlu, M.; Karsli, F. Application of GIS-Based AHP Model for the Impact Assessment of COVID-19 Lockdown on Environment Quality: The Case of Kabul City, Afghanistan. J. Indian Soc. Remote Sens. 2023, 51, 439–452. [Google Scholar] [CrossRef]
- Ayoobi, A.W.; Ahmadi, H.; Inceoglu, M.; Pekkan, E. Seasonal impacts of buildings’ energy consumption on the variation and spatial distribution of air pollutant over Kabul City: Application of Sentinel—5P TROPOMI products. Air Qual. Atmos. Health 2021, 15, 73–83. [Google Scholar] [CrossRef]
- Zaryab, A.; Nassery, H.R.; Alijani, F. The effects of urbanization on the groundwater system of the Kabul shallow aquifers, Afghanistan. Hydrogeol. J. 2022, 30, 429–443. [Google Scholar] [CrossRef]
- Macrotrends, L. Kabul, Afghanistan Metro Area Population 1950–2023|MacroTrends. Available online: https://www.macrotrends.net/cities/20002/kabul/population (accessed on 2 August 2023).
- National Statistic and Information Authority (NSIA). Estimated Population of Afghanistan 2020–21; NSIA Authority: Kabul, Afghanistan, 2021.
- Mack, T.J.; Chornack, M.P.; Taher, M.R. Groundwater-level trends and implications for sustainable water use in the Kabul Basin, Afghanistan. Environ. Syst. Decis. 2013, 33, 457–467. [Google Scholar] [CrossRef]
- Ndlovu, M.S.; Demlie, M. Statistical analysis of groundwater level variability across KwaZulu-Natal Province, South Africa. Environ. Earth Sci. 2018, 77, 739. [Google Scholar] [CrossRef]
- Noori, A.R.; Singh, S.K. Spatial and temporal trend analysis of groundwater levels and regional groundwater drought assessment of Kabul, Afghanistan. Environ. Earth Sci. 2021, 80, 698. [Google Scholar] [CrossRef]
- Pathak, A.A.; Dodamani, B.M. Trend Analysis of Groundwater Levels and Assessment of Regional Groundwater Drought: Ghataprabha River Basin, India. Nat. Resour. Res. 2019, 28, 631–643. [Google Scholar] [CrossRef]
- Chen, J.; Zhang, H.; Qian, H.; Wu, J.; Zhang, X. Selecting proper method for groundwater interpolation based on spatial correlation. In Proceedings of the 2013 4th International Conference on Digital Manufacturing and Automation, ICDMA 2013, Shinan, China, 29–30 June 2013; pp. 1192–1195. [Google Scholar]
- Minnig, M.; Moeck, C.; Radny, D.; Schirmer, M. Impact of urbanization on groundwater recharge rates in Dübendorf, Switzerland. J. Hydrol. 2018, 563, 1135–1146. [Google Scholar] [CrossRef]
- Tubau, I.; Vázquez-Suñé, E.; Carrera, J.; Valhondo, C.; Criollo, R. Quantification of groundwater recharge in urban environments. Sci. Total Environ. 2017, 592, 391–402. [Google Scholar] [CrossRef]
- Vázquez-Suñé, E.; Sánchez-Vila, X.; Carrera, J. Introductory review of specific factors influencing urban groundwater, an emerging branch of hydrogeology, with reference to Barcelona, Spain. Hydrogeol. J. 2005, 13, 522–533. [Google Scholar] [CrossRef]
- Biswas, B.; Jain, S.; Rawat, S. Spatio-temporal analysis of groundwater levels and projection of future trend of Agra city, Uttar Pradesh, India. Arab. J. Geosci. 2018, 11, 278. [Google Scholar] [CrossRef]
- Choi, W.; Galasinski, U.; Cho, S.J.; Hwang, C.S. A Spatiotemporal Analysis of Groundwater Level Changes in Relation to Urban Growth and Groundwater Recharge Potential for Waukesha County, Wisconsin. Geogr. Anal. 2012, 44, 219–234. [Google Scholar] [CrossRef]
- Ibkar, A.; Mukherjee, A.; Didwania, N.; Rai, S. Impact of Urbanization on Groundwater in Changing Climatic Scenario: A Case Study. In Impacts of Urbanization on Hydrological Systems in India; Springer International Publishing: New York, NY, USA, 2023; pp. 323–343. [Google Scholar]
- Ismail, S.; Ahmed, M.F.; Bakar, M.Z.A. Assessing the impact of urbanization on groundwater quality of lahore region, Pakistan. Environ. Sci. Pollut. Res. 2023, 30, 83929–83949. [Google Scholar] [CrossRef] [PubMed]
- Jat, M.K.; Khare, D.; Garg, P.K. Urbanization and its impact on groundwater: A remote sensing and GIS-based assessment approach. Environmentalist 2009, 29, 17–32. [Google Scholar] [CrossRef]
- Anteneh, Z.S.; Awoke, B.G.; Reda, T.M.; Jothimani, M. Groundwater potential mapping using integrations of remote sensing and analytical hierarchy process methods in Ataye-watershed, Middle Awash Basin, Ethiopia. Sustain. Water Resour. Manag. 2022, 8, 183. [Google Scholar] [CrossRef]
- Bai, Z.; Liu, Q.; Liu, Y. Groundwater Potential Mapping in Hubei Region of China Using Machine Learning, Ensemble Learning, Deep Learning and AutoML Methods. Nat. Resour. Res. 2022, 31, 2549–2569. [Google Scholar] [CrossRef]
- Hasanuzzaman, M.; Mandal, M.H.; Hasnine, M.; Shit, P.K. Groundwater potential mapping using multi-criteria decision, bivariate statistic and machine learning algorithms: Evidence from Chota Nagpur Plateau, India. Appl. Water Sci. 2022, 12, 58. [Google Scholar] [CrossRef]
- Masoud, A.M.; Pham, Q.B.; Alezabawy, A.K.; Abu El-Magd, S.A. Efficiency of Geospatial Technology and Multi-Criteria Decision Analysis for Groundwater Potential Mapping in a Semi-Arid Region. Water 2022, 14, 882. [Google Scholar] [CrossRef]
- Melese, T.; Belay, T. Groundwater Potential Zone Mapping Using Analytical Hierarchy Process and GIS in Muga Watershed, Abay Basin, Ethiopia. Glob. Chall. 2022, 6, 2100068. [Google Scholar] [CrossRef]
- Aqili, S.W.; Hong, N.; Hama, T.; Suenaga, Y.; Kawagoshi, Y. Application of Modified Tank Model to Simulate Groundwater Level Fluctuations in Kabul Basin, Afghanistan. J. Water Environ. Technol. 2016, 14, 57–66. [Google Scholar] [CrossRef]
- Brati, M.Q.; Ishihara, M.I.; Higashi, O. Groundwater level reduction and pollution in relation to household water management in Kabul, Afghanistan. Sustain. Water Resour. Manag. 2019, 5, 1315–1325. [Google Scholar] [CrossRef]
- Jawadi, H.A.; Iqbal, M.W.; Naseri, M.; Farahmand, A.; Azizi, A.H.; Eqrar, M.N. Nitrate contamination in groundwater of Kabul Province, Afghanistan: Reasons behind and conceptual management framework discourse. J. Mt. Sci. 2022, 19, 1274–1291. [Google Scholar] [CrossRef]
- Singh, S.K.; Noori, A.R. Delineation of groundwater recharge potential zones for its sustainable development utilizing GIS approach in Kabul basin, Afghanistan. Arab. J. Geosci. 2022, 15, 213. [Google Scholar] [CrossRef]
- Saffi, M.H. National Alarming on Groundwater Natural Storage Depletion and Water Quality Deterioration of Kabul City and Immediate Response to the Drinking Water Crisis; DAACAR: Kabul, Afghanistan, 2019. [Google Scholar]
- Wafa, W.; Hairan, M.H.; Waizy, H. The Impacts of Urbanization on Kabul City ’ s Groundwater Quality. Int. J. Adv. Sci. Technol. 2020, 29, 10796–10809. [Google Scholar]
- Qutbudin, I.; Shiru, M.S.; Sharafati, A.; Ahmed, K.; Al-Ansari, N.; Yaseen, Z.M.; Shahid, S.; Wang, X. Seasonal drought pattern changes due to climate variability: Case study in Afghanistan. Water 2019, 11, 1096. [Google Scholar] [CrossRef]
- Jawadi, H.A.; Sagin, J.; Snow, D.D. A detailed assessment of groundwater quality in the kabul basin, afghanistan, and suitability for future development. Water 2020, 12, 2890. [Google Scholar] [CrossRef]
- Ahmadi, A.S.; Kajita, Y. Evaluation of urban land development direcction in kabul city, Afghanistan. World Acad. Sci. Eng. Technol. Int. J. Urban Civ. Eng. 2017, 11, 152–162. [Google Scholar]
- Hussaini, M.S.; Farahmand, A.; Shrestha, S.; Neupane, S.; Abrunhosa, M. Site selection for managed aquifer recharge in the city of Kabul, Afghanistan, using a multi-criteria decision analysis and geographic information system. Hydrogeol. J. 2022, 30, 59–78. [Google Scholar] [CrossRef]
- Houben, G.; Niard, N.; Tünnermeier, T.; Himmelsbach, T. Hydrogeology of the Kabul Basin (Afghanistan), part I: Aquifers and hydrology. Hydrogeol. J. 2009, 17, 665–677. [Google Scholar] [CrossRef]
- Ahmadi, H.; Uygucgil, H. Targeting iron prospective within the Kabul Block (SE Afghanistan) via hydrothermal alteration mapping using remote sensing techniques. Arab. J. Geosci. 2021, 14, 183. [Google Scholar] [CrossRef]
- Robert, E.B.; Amin, M.A.; Michael, P.C.; David, K.M. Inventory of Ground-Water Resources in the Kabul Basin, Afghanistan; USGS: Reston, VA, USA, 2005.
- Shroder, J.F.; Eqrar, N.; Waizy, H.; Ahmadi, H.; Weihs, B.J. Review of the Geology of Afghanistan and its water resources. Int. Geol. Rev. 2021, 64, 1009–1031. [Google Scholar] [CrossRef]
- Bohannon, R.G.; Turner, K.J. Geologic map of quadrangle 3468. Chak-e-Wardak (509) and Kabul (510) quadrangles. U.S. Geol. Surv. Sci. Investig. Rep. 2005. Available online: https://pubs.usgs.gov/of/2005/1107/A/ (accessed on 6 May 2024).
- Bohannon, R.G. Geologic and Topographic Maps of the Kabul North 30’ × 60’ Quadrangle, Afghanistan. U.S. Geol. Surv. Sci. Investig. Map 2010, 3120, 34. [Google Scholar]
- Abdullah, S.H.; Chmyriov, V.M.; Dronov, V.I. Geology and Mineral Resources of Afghanistan; British Geological Survey: Nottingham, UK, 2008; Volume 2.
- Oommen, T.; Misra, D.; Twarakavi, N.K.C.; Prakash, A.; Sahoo, B.; Bandopadhyay, S. An objective analysis of support vector machine based classification for remote sensing. Math. Geosci. 2008, 40, 409–424. [Google Scholar] [CrossRef]
- Hord, R. Digital Image Processing of Remotely Sensed Data; Acadamic Press: New York, NY, USA, 1982; p. 256. [Google Scholar]
- Jensen, J.R. Introductory Digital Image Processing: A Remote Sensing Perspective, 2nd ed.; Pearson: Upper Saddle River, NJ, USA, 2015; ISBN 0132058405. [Google Scholar]
- Lillesand, T.M.; Kiefer, R.W. Remote sensing and image interpretation. Remote Sens. Image Interpret. 1979, 146, 448–449. [Google Scholar] [CrossRef]
- Mountrakis, G.; Im, J.; Ogole, C. Support vector machines in remote sensing: A review. ISPRS J. Photogramm. Remote Sens. 2011, 66, 247–259. [Google Scholar] [CrossRef]
- Sain, S.R.; Vapnik, V.N. The Nature of Statistical Learning Theory. Technometrics 1996, 38, 409. [Google Scholar] [CrossRef]
- Pal, M.; Mather, P.M. Support vector machines for classification in remote sensing. Int. J. Remote Sens. 2005, 26, 1007–1011. [Google Scholar] [CrossRef]
- Dabija, A.; Kluczek, M.; Zagajewski, B.; Raczko, E.; Kycko, M.; Al-Sulttani, A.H.; Tardà, A.; Pineda, L.; Corbera, J. Comparison of support vector machines and random forests for corine land cover mapping. Remote Sens. 2021, 13, 777. [Google Scholar] [CrossRef]
- Chowdhury, M.S. Comparison of accuracy and reliability of random forest, support vector machine, artificial neural network and maximum likelihood method in land use/cover classification of urban setting. Environ. Chall. 2024, 14, 100800. [Google Scholar] [CrossRef]
- Khouni, I.; Louhichi, G.; Ghrabi, A. Use of GIS based Inverse Distance Weighted interpolation to assess surface water quality: Case of Wadi El Bey, Tunisia. Environ. Technol. Innov. 2021, 24, 101892. [Google Scholar] [CrossRef]
- Khawaldah, H.A.; Farhan, I.; Alzboun, N.M. Simulation and prediction of land use and land cover change using GIS, remote sensing and CA-Markov model. Glob. J. Environ. Sci. Manag. 2020, 6, 215–232. [Google Scholar] [CrossRef]
| Disclaimer/Publisher’s Note: The statements, opinions and data contained in all publications are solely those of the individual author(s) and contributor(s) and not of MDPI and/or the editor(s). MDPI and/or the editor(s) disclaim responsibility for any injury to people or property resulting from any ideas, methods, instructions or products referred to in the content. |
© 2024 by the authors. Licensee MDPI, Basel, Switzerland. This article is an open access article distributed under the terms and conditions of the Creative Commons Attribution (CC BY) license (https://creativecommons.org/licenses/by/4.0/).


 ,
, 

