Abstract
This paper presents a study of global Rayleigh wave attenuation and group velocity at a period of around 20 s using data from the International Seismological Centre (ISC) bulletin. Rayleigh waves at this period are sensitive to the crustal structure beneath continents and the uppermost mantle beneath oceans. Tomographic imaging reveals strong continental-ocean contrasts due to this. Oceanic group velocities are high but vary with seafloor depth, while oceanic attenuation shows mid-ocean ridges. Subduction zone regions display high attenuation but little velocity reduction, indicating scattering attenuation. Low attenuation regions are associated with the Earth’s major cratonic regions, but there are no associated velocity changes. This implies that intrinsic attenuation is low and scattering dominates. Cratonic crustal scatterers have been annealed. A new surface wave magnitude scale is constructed that is valid from near-source to near-antipode distances.
1. Introduction
Global Rayleigh wave attenuation and velocity play a crucial role in understanding the behavior of seismic waves propagating through the Earth’s interior. By studying the attenuation and velocity of these waves, we can gain insights into the composition, structure, and temperature of the crust and mantle. These properties play a significant role in understanding the dynamic processes occurring within the Earth, such as mantle convection, plate tectonics, and the formation of geological features. The amplitudes and velocity of Rayleigh waves are also crucial in assessing seismic hazards since understanding and accurately estimating the locations and magnitudes of seismic events is essential for characterizing global seismicity and improving our ability to predict earthquake-related ground motion. Furthermore, researching the worldwide attenuation and velocity of Rayleigh waves is crucial for seismic monitoring. Amplitudes play a key role in discerning the Mb/Ms ratio for discrimination and assessing yield in seismic events.
Most previous global tomographic studies of global Rayleigh waves used waveform and ambient noise data for periods of 40 s and above to image phase velocity and attenuation [1,2,3,4,5,6,7]. At these long periods, the mantle is imaged and shows both higher attenuation and lower velocity beneath the oceans. Midocean ridges and subduction zones show high attenuation, while continental cratons have low attenuation. At periods nearer to 20 s, midocean ridges, subduction zones, and cratons are still visible [2,8,9,10,11,12,13,14,15].
In this study, the International Seismological Centre (ISC) bulletin surface wave amplitude and group travel time data [16] collected at periods of around 20 s were used to image both global attenuation and group velocity using standard tomographic methods. For the continents, the wave velocities and attenuation are sensitive to crustal attenuation and velocity structure, but for the oceans, the sensitivity is within the top of the mantle. Ocean ridges, subduction zones, and cratons are imaged. Furthermore, the simultaneous use of both velocity and attenuation tomography allows intrinsic attenuation to be distinguished from scattering attenuation.
2. Methods
The basic tomographic method here uses great circle raypaths along with both event and station terms [17]. Geodesic rays on the ellipsoid were traced using the Vincenty [18] algorithm. For velocity tomography, the data is first inverted for the average slowness using the following equation:
where ti is the travel time for event i and is the distance. The equation is solved for the intercept, a, and the average slowness, , using standard least squares.
The residuals are then inverted using the following equation:
where tij is the residual travel time from station i to event j and is the distance the ray travels in cell k. The unknowns are the station delays, ai, the event delays bj, and is the slowness perturbation in cell k. The sum is over all cells crossed by the raypath, and in this study, five-degree cells are used. These equations are inverted on a latitude-longitude grid using great-circle raypaths. On a latitude-longitude grid, the cell sizes differ, especially near the poles. This is compensated for by using the following damped least squares solution:
where the model vector, m, is composed of the station delays, event delays, and slownesses, and the data vector, d, is composed of the travel times. Smoothing is performed with a Laplacian operator, D, and W is a diagonal weighting matrix with elements proportional to the area of the cell sizes. This equalizes the weighting per unit area. Without this, the solution will be overdamped at the poles. The LSQR conjugate-gradient algorithm was used to invert the data [19,20].
Tomography using the amplitudes proceeds much the same way as with velocity tomography. The operative attenuation equation is [21] as follows:
where A is the amplitude, Δ is the distance in degrees, v is the velocity, T is the period, and Q is the attenuation quality factor. The sine term is the geometrical spreading factor on a sphere. The factor represents the temporal spreading due to dispersion. According to Ewing et al. [21], k should be one-half for Rayleigh waves and one-third for Airy waves.
First, the log-amplitude data are fit to an attenuation function using the following equation:
Here, Ai is the amplitude of arrival i, and Msi is its event magnitude. The unknowns are the intercept, a, and the average attenuation, 1/Q. The log of the amplitude is corrected for event size by subtracting the magnitude, and then a spherical geometric spreading correction is added.
The residuals for this equation are then used for the tomographic equation
This is applied to the five-degree grid of cells, and the sum is over a great circle raypath. Here Aij is the residual reduced amplitude between event i and station j, and is the distance the ray travels in each cell. The unknowns are the station and event gains, ai and bj, and the attenuation in each cell k, . Because the station and event terms trade off, the average of the station terms is set to zero. The least-squared equations are then again solved using the LRSQ algorithm.
The formula used for converting the attenuation perturbation, to is given by solving for :
where is the Q value from the initial line fit to the data. Traditional checkerboard tests are performed to evaluate resolution and variance. The checkerboards consist of alternating squares of low and high. Rays are traced through this, an appropriate amount of noise is added, and the results are inverted in the same manner as the data. An approximate resolution width can be found by finding the smallest square size that can be reasonably imaged.
One source of error is the potential for focusing. Unfortunately, phase velocity is not available for these data, and thus focusing cannot be estimated using the methods of Dahlen and Tromp [22] and Dalton and Ekstrom [5]. This could create noise in the image. Another source of error is using great circle raypaths. As shall be seen, there are significant variations in velocity that cause refraction, especially along the coastlines. However, Dalton and Ekstrom [5] argue that the refraction effect is negligible at global scales. Bao et al. [23] compared different methods of accounting for focusing. They found that methods other than great-circle paths did improve the image, but the major features were visible without. Chen et al. [24] examined deviations from great circle raypaths and found errors in the phase velocity tomography of 1.5% at 30 s, with the effect increasing for shorter periods. This is a relatively small source of error. A final source of error includes not correcting for focal mechanisms, but with a minimum of 10 arrivals per event and station, this should average out. The above error sources are not directly represented in the checkerboard tests except as being included as random errors.
3. Results
Data is from the ISC bulletin [16] (International Seismological Centre, 2023) up until February 2020 for events of Ms > 4 and above and depths less than 50 km. There are several different designations for surface wave amplitude measurements in the bulletin for different stations at different times. This study used the measurements labeled LR, MLR, AMS, and IAMs_20. Only vertical components were used.
The time-distance curve for the travel time data is in Figure 1. Unlike most travel time data, the data fans out with distance. This is because of the dichotomy between the low continental velocities and the high oceanic velocities. In addition, there are mispicked Love wave phases forming a line at 4.0 km/s apparent velocity. These were cut out of the data set for both velocity and attenuation tomography. Travel time data were restricted to distances of 2 to 160 degrees based on Figure 1. Ten arrivals at each station and event were required, with a maximum residual of 1000 s. A total of 1,044,918 arrivals were used. The initial fit gave an average group velocity of 3.2 km/s but had a very large standard deviation of 65 s. The final inversion used cell sizes of five degrees, and the results are in Figure 2. There are small artifacts at the poles because the raypath tracing step size becomes comparable to the width of the cell; nevertheless, structure in the Arctic and Antarctica is still resolvable. Checkerboard test results show that 10-degree squares can be imaged (Figure S1).
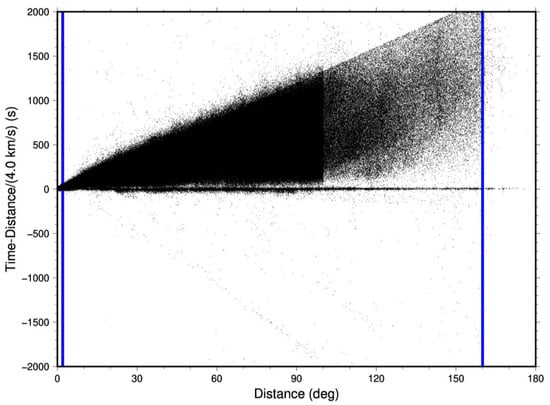
Figure 1.
Travel time data from ISC data. The apparent cutoff at 99 degrees corresponds to the far body-wave cutoff distance at the shadow zone. Many stations do not pick arrivals past this distance. The cutoff at 160 degrees corresponds to the far cutoff from the surface-wave magnitude definition. Only a few stations pick arrivals past this distance. Blue lines indicate the range of data used in the inversion (2 to 160 degrees). The Love wave arrivals at 4 km/s were cut out of the data.
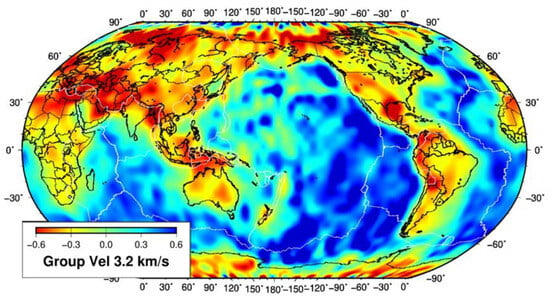
Figure 2.
Results of velocity tomography.
A normalized amplitude-distance curve after the geometrical spreading correction is shown in Figure 3. There is linearity in the data with no indication of the 1/(√Δ) curvature predicted by dispersion. Furthermore, adding the dispersion term gave average Q values that seemed too high. As a result, k was set to zero, and it is concluded that dispersion does not play a role in determining amplitude within the instrument bandwidth. Hearn et al. (2008) [25] made a similar conclusion for six-second period surface waves in China; however, this contrasts with Rezapour and Pearce (1998) [26], who did find a 1/∛Δ dependence in early ISC data. Amplitude data were restricted to 2 to 99 degrees, the body-wave cutoff, based on Figure 3. Only events with reported surface wave magnitudes were used. Amplitude data had a minimum of 10 arrivals at each station and event and a maximum residual of two magnitude units. The modern definition of Ms amplitude uses periods between 18 and 22 s, so data was restricted to this range. However, it was found that using the measured period in the inversion made no improvement in the fit, so 20 s was used in the inversion. The initial fit for the attenuation tomography gave an average 1/Q value of 1/275 with an rms of 0.23 magnitude units for 844,079 arrivals. The intercept was 0.75 magnitude units.
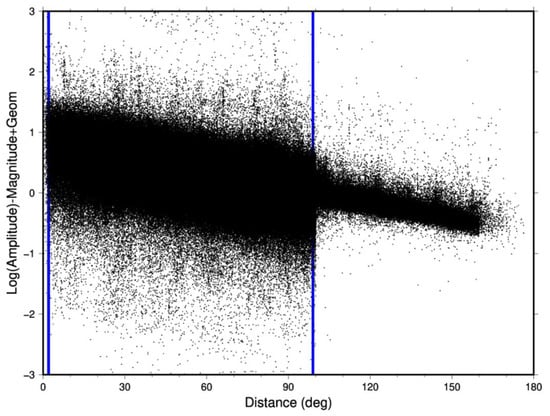
Figure 3.
Amplitude data from ISC data after correction for magnitude and geometric spreading. Note the apparent linearity. The discontinuity in the data at 100 degrees corresponds to the far Mb-magnitude cutoff distance. Blue lines indicate the range of data used (2 to 99 degrees).
From these results, a physics-based magnitude relation can be defined based on the following vertical amplitudes:
where R is the Earth’s radius of 6371 km. The factor 0.0086 is equal to times . Its residual plot is shown in Figure 4a. As can be seen, the formula is good for the nearly entire measured distance range. One-degree averages were made, and the first two bins had averages of over 0.1 magnitude units, so the formula was truncated at two degrees to avoid source and antipodal effects. The period is not required in this formula. The current effective ISC Ms magnitude formula is (isc.ac.uk/standards/magnitudes) as follows for vertical components:
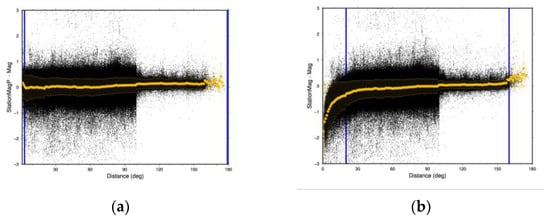
Figure 4.
(a) Magnitude residuals with distance for the physics-based magnitude scale Msp. Yellow dots represent 1-degree averages with standard deviations. (b) Magnitude residuals using the effective ISC Ms formula; note that these are only valid in the prescribed 20 to 160 degree range. Blue lines indicate the range of data for the magnitude scale.
The last term corrects for a slight measured bias of the average station ISC Ms magnitude residuals in the 20 to 60 degree range. This probably occurs because ISC is not using the exact same set of data to compute magnitude. Residuals for the Ms formula are plotted in Figure 4b. The standard Ms expression has a slight bias within its range, and it is clearly invalid for distances of less than 20 degrees. The two expressions yield the same value at 56 degrees for a 20 s period. The physics-based magnitude scale is calibrated to the current scale but with an extended range (Figure S2).
Attenuation tomography results are shown in Figure 5. Contrasts between the continents and oceans, subduction zones, and cratons can be observed. The checkerboard tests show resolution is at best 15 degrees wide (Figure S3). There are some places where focusing could occur; in particular, there are some patchy low attenuation zones in the Pacific that seem odd, and Russia seems patchy too; however, the overall results clearly correspond to major tectonic features.
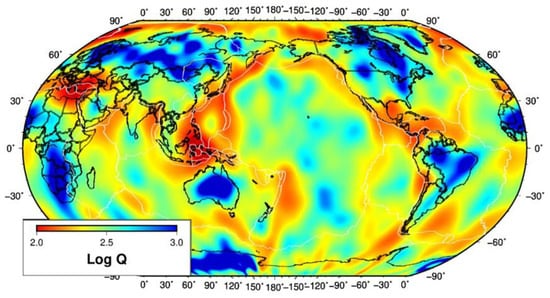
Figure 5.
Results of attenuation tomography.
4. Discussion
4.1. Other Studies
A similar study of global Rayleigh wave attenuation at 20 s was carried out by Selby et al. [27], where they imaged corrections to the surface wave magnitude equation. They used an independent data set of amplitudes measured for Ms magnitude determination. Their images show the low-velocity ridges and high-velocity cratons in similar positions as in the ISC image. A study of the global Rayleigh wave group velocity at 20 s was carried out by Ritzwoller [9]. In the oceans, he imagined the ocean depth as the ISC data does. His low velocity features match what was found with the ISC data, and no cratons were imaged. There are also regional studies of Rayleigh waves at 20 s period. Yanovskaya (2003) [10] found low group velocities beneath Tibet. Yang et al. [11] and Zhou et al. [28] were able to image low attenuation beneath the North China and South China Cratons along with the high attenuation Tarim Basin. The two cratons are too small to be resolved with the ISC data, but Mongolia is not. Zhou et al.’s China tomography also imaged Mongolia as a low-attenuation region with Q values approaching 1000, and this does match the ISC tomography. Bao et al. [13] imaged S wave velocities beneath China at 20 s. Most of the features he images are beneath the resolution of the ISC data (Figure S3); however, Tibet has low crustal velocities. Feng et al. [29] and Nascimento et al. [30] imaged South American group velocities at 20 s and found low velocities beneath the Andes but no apparent cratons.
Levshin et al. [8] imaged the Artic group velocity structure at 20 s and found patterns like the ISC tomography. In Asia, Levshin et al. [12] imaged the Rayleigh wave attenuation for Asia at 20 s. They image the low attenuation features in Mongolia, Russia, and the Arabian Plate, as does the ISC data. Their average attenuation value of about 300 agrees with the ISC data, but they have many values over 500. For South America, 20 s waves give an average group velocity of 2.97 km/s with some low velocities beneath the Andes, and this is similar to what the ISC data gives [30]. In comparison to the above results, which generally do not show many Q values greater than 1000, the ISC tomography shows that quite a few of the cratonic regions do have Q values above this. The checkerboard tests show that some of this may be due to some overshoot from the tomography, but that cannot completely explain the high Q values. This may be because other studies isolate the fundamental mode.
At a 25 s period, Babikoff and Dalton [14] imaged the US phase velocities and found a low velocity west and a high velocity east. The ISC tomography only has a resolution to roughly image that. At a 40 s period, Ma et al. [2] have images of both phase velocity and attenuation. They imaged the cratons in both images, but this would be at mantle depths. Studies of global Rayleigh wave attenuation and velocity at longer periods image solely at mantle depths and show low phase velocities [4,5,31,32,33] and shear wave velocities [15,34,35] and high attenuation beneath midocean ridges [1,4,6,12,36,37,38]. Group velocity maps at these periods are not available. Many of the same along-ridge variations in attenuation can be found in both the long-period tomography and the ISC tomography. Cratons are also imaged at longer periods in both velocity and attenuation and represent the deeper cratonic roots.
4.2. Interpretation
The most visible feature in both images is the contrast between the continents and oceans. Again, this occurs because 20 s waves are sensitive to the crust beneath the continents and sensitive to the mantle beneath the oceans. The contrast is particularly clear for the velocity images where the crust-to-mantle velocity contrast is high. To further explore the sensitivity with depth, sensitivity kernels from a two-layer continental and a three-layer oceanic model were made using the CPS software version 3.3 [39]. The kernels showed the oceanic mantle to have maximum sensitivity over the top 25 km of mantle and the continental crust to have sensitivity over the entire crustal column.
The average oceanic Rayleigh wave group velocity is around 3.6 km/s, and its pattern mimics the bathymetry, with the highest velocities near the ridge crests. Indeed, modeling shows that reducing the ocean depth by two kilometers of ridge height causes a 0.6 km/s difference—about the amount shown in the tomographic image. Any effects of mid-ocean ridge-related temperature are obscured by this. In contrast, modeling shows that ocean depth has little effect on phase velocity and attenuation, and this allows the image to show the effects of mid-ocean ridge cooling in the image with the highest attenuation along the ridge crest. However, this attenuation is not always consistent along the ridge crests, showing that temperature varies along the ridges. There is no obvious connection between ridge spreading rates and temperature, but it is interesting that the Arctic Ridge is both the hottest ridge and, also, one of the slowest spreading subduction zones.
Subduction zones are represented by high-attenuation regions. This occurs because subduction zones disrupt the oceanic wave guide with slabs, volcanism, and backarc spreading. Less attenuation occurs in the simpler subduction zones of South and North America, while the more complicated subduction zones of the South Pacific, Caribbean, West Pacific, and Mediterranean are very attenuative. In contrast, the velocity image does not show most subduction zones. It seems unlikely that attenuation can change by such an extreme amount without changing the velocity if the attenuation is intrinsic. Thus, the subduction zone attenuation must be due to scattering. At 20 s, the wavelength is 66 km, and there are many features at this scale within a subduction zone, including the subducted slab itself.
Continental crustal attenuation shows strong low attenuation features in the crust, with Q values over one thousand. Most of the low-attenuation regions are associated with the Australian, East Antarctica, North American, Amazon, West African, South African, Baltica, Siberian, and Greenland cratons. There are exceptions. The Rio de la Plata Craton in South America is barely visible. Zhou et al. (2020) [28] did image the North China Craton, but it is too small to be resolved in the present study. The India and Madagascar Cratons also seem unresolvable. The Australian low attenuation anomaly lies beneath the central Australian shield but excludes the western and northern cratons, forming an exception to the rule. Furthermore, not all low-attenuation regions are beneath cratons. Mongolia, central Russia, and the eastern USA have low attenuation zones even though they are not cratons.
The key to explaining the above observations is to note that the cratons are not visible in the velocity image. Modeling shows that increasing Q values to 1000 requires the whole crustal column to be involved. This cannot be due to a change in intrinsic attenuation because that would require a large change in temperature or rock type that would be seen in the velocity tomography. The only way to increase Q by that factor is if the intrinsic attenuation of the crust is small and that continental crustal attenuation is mainly due to scattering. The ancient Archean and Paleoproterozoic crust, originally hotter, was annealed, and the internal structure changed as a result. This is supported by receiver function studies, which show few internal boundaries in the Archean crust [40].
5. Conclusions
Global Rayleigh wave velocities and attenuation have been imaged for data near the 20 s period, and a new surface wave magnitude equation is derived that is valid from near-source to near-antipode distances. Only geometric spreading and attenuation are required to explain the data, and dispersion-related attenuation is not needed. In the 20 s period range, Rayleigh waves are sensitive to the top of the mantle beneath the oceans and to the crust beneath the continents. Continents and oceans have very different group velocities and attenuations because of this. In the oceans, group velocity is related to water depth, and the tomography images the bathymetry; however, the attenuation is not sensitive to water depth and shows mid-ocean ridges as high attenuation anomalies. These are interpreted as being intrinsic attenuations due to thermal anomalies. Subduction zones disrupt the wave guide and cause attenuation but do not affect the velocity much. This occurs because the attenuation is mostly due to scattering and is not intrinsic. Continental cratons stand out as low-attenuation regions but do not affect velocity tomography. This must occur due to a change in scattering attenuation, with intrinsic attenuation being low. It is concluded that the cratonic crust has been annealed, with the internal structures changed and scatterers removed.
Supplementary Materials
The following supporting information can be downloaded at: https://www.mdpi.com/article/10.3390/geosciences14020050/s1. Figure S1: Checkerboard pattern for velocity tomography; Figure S2: Magnitude corrections; Figure S3: Checkerboard pattern for attenuation tomography.
Funding
This research received no external funding.
Data Availability Statement
ISC Earthquake Bulletin data is from http://www.isc.ac.uk/ (accessed on 2 February 2024) [16]. Plate boundaries on maps are from Bird (2003) [41] at http://peterbird.name/publications/2003_pb2002/2003_pb2002.htm (accessed 2 February 2024).
Acknowledgments
Thank you to the International Seismological Centre and the thousands of workers who gathered the data. The CPS software (Herrmann, 2013; https://www.eas.slu.edu/eqc/eqccps.html (accessed 2 February 2024)) was used to model velocities and attenuations along with depth sensitivity plots. Thank you to two reviewers who greatly improved the manuscript.
Conflicts of Interest
The author declares no conflicts of interest.
References
- Adenis, A.; Debayle, E.; Ricard, Y. Seismic Evidence for Broad Attenuation Anomalies in the Asthenosphere beneath the Pacific Ocean. Geophys. J. Int. 2017, 209, 1677–1698. [Google Scholar] [CrossRef]
- Ma, Z.; Masters, G.; Mancinelli, N. Two-Dimensional Global Rayleigh Wave Attenuation Model by Accounting for Finite-Frequency Focusing and Defocusing Effect. Geophys. J. Int. 2016, 204, 631–649. [Google Scholar] [CrossRef]
- Billien, M.; Lévêque, J.; Trampert, J. Global Maps of Rayleigh Wave Attenuation for Periods between 40 and 150 Seconds. Geophys. Res. Lett. 2000, 27, 3619–3622. [Google Scholar] [CrossRef]
- Dalton, C.A.; Ekström, G. Constraints on Global Maps of Phase Velocity from Surface-Wave Amplitudes. Geophys. J. Int. 2006, 167, 820–826. [Google Scholar] [CrossRef]
- Dalton, C.A.; Ekström, G. Global Models of Surface Wave Attenuation. J. Geophys. Res. 2006, 111, 1–19. [Google Scholar] [CrossRef]
- Dalton, C.A.; Ekström, G.; Dziewoński, A.M. The Global Attenuation Structure of the Upper Mantle. J. Geophys. Res. 2008, 113, 1–24. [Google Scholar] [CrossRef]
- Magrini, F.; Boschi, L.; Gualtieri, L.; Lekić, V.; Cammarano, F. Rayleigh-Wave Attenuation across the Conterminous United States in the Microseism Frequency Band. Sci. Rep. 2021, 11, 10149. [Google Scholar] [CrossRef]
- Levshin, A.L.; Ritzwoller, M.H.; Barmin, M.P.; Villaseñor, A.; Padgett, C.A. New Constraints on the Arctic Crust and Uppermost Mantle: Surface Wave Group Velocities, Pn, and Sn. Phys. Earth Planet. Inter. 2001, 123, 185–204. [Google Scholar] [CrossRef]
- Ritzwoller, M.H. Global Surface Wave Diffraction Tomography. J. Geophys. Res. 2002, 107, 1–13. [Google Scholar] [CrossRef]
- Yanovskaya, T. 3D S-Wave Velocity Pattern in the Upper Mantle beneath the Continent of Asia from Rayleigh Wave Data. Phys. Earth Planet. Inter. 2003, 138, 263–278. [Google Scholar] [CrossRef]
- Yang, X.; Taylor, S.R.; Patton, H.J. The 20-s Rayleigh Wave Attenuation Tomography for Central and Southeastern Asia. J. Geophys. Res. 2004, 109, 2004JB003193. [Google Scholar] [CrossRef]
- Levshin, A.L.; Yang, X.; Barmin, M.P.; Ritzwoller, M.H. Midperiod Rayleigh Wave Attenuation Model for Asia: Rayleigh wave attenuation in Asia. Geochem. Geophys. Geosyst. 2010, 11. [Google Scholar] [CrossRef]
- Bao, X.; Song, X.; Li, J. High-Resolution Lithospheric Structure beneath Mainland China from Ambient Noise and Earthquake Surface-Wave Tomography. Earth Planet. Sci. Lett. 2015, 417, 132–141. [Google Scholar] [CrossRef]
- Babikoff, J.C.; Dalton, C.A. Long-Period Rayleigh Wave Phase Velocity Tomography Using USArray. Geochem. Geophys. Geosyst. 2019, 20, 1990–2006. [Google Scholar] [CrossRef]
- Zhou, Y.; Nolet, G.; Dahlen, F.A.; Laske, G. Global Upper-Mantle Structure from Finite-Frequency Surface-Wave Tomography. J. Geophys. Res. 2006, 111, B04304. [Google Scholar] [CrossRef]
- International Seismological Centre On-Line Bulletin 2023. Available online: https://www.isc.ac.uk (accessed on 2 February 2024).
- Hearn, T.M. Two-Dimensional Attenuation and Velocity Tomography of Iran. Geosciences 2022, 12, 397. [Google Scholar] [CrossRef]
- Vincenty, T. Direct and Inverse Solutions of Geodesics on the Ellipsoid with Application of Nested Equations. Surv. Rev. 1975, 22, 88–93. [Google Scholar] [CrossRef]
- Paige, C.C.; Saunders, M.A. Algorithm 583, LSQR: Sparse Linear Equations and Least-Squares Problems. ACM Trans. Math. Softw. 1982, 8, 43–71. [Google Scholar] [CrossRef]
- Paige, C.C.; Saunders, M.A. LSQR: An Algorithm for Sparse Linear Equations and Sparse Least Squares, Trans. ACM Trans. Math. Softw. 1982, 8, 195–209. [Google Scholar] [CrossRef]
- Ewing, W.M.; Jardetzky, W.S.; Press, F. Elastic Waves in Layered Media; McGraw-Hill Book Company: New York, NY, USA, 1957. [Google Scholar]
- Dahlen, F.A.; Tromp, J. Theoretical Global Seismology; Princeton University Press: Princeton, NJ, USA, 1998; ISBN 978-0-691-00116-6. [Google Scholar]
- Bao, X.; Dalton, C.A.; Ritsema, J. Effects of Elastic Focusing on Global Models of Rayleigh Wave Attenuation. Geophys. J. Int. 2016, 207, 1062–1079. [Google Scholar] [CrossRef]
- Chen, H.; Ni, S.; Chu, R.; Chong, J.; Liu, Z.; Zhu, L. Influence of the Off-Great-Circle Propagation of Rayleigh Waves on Event-Based Surface Wave Tomography in Northeast China. Geophys. J. Int. 2018, 214, 1105–1124. [Google Scholar] [CrossRef]
- Hearn, T.M.; Wang, S.; Ni, J.F.; Xu, Z.; Yu, Y.; Zhang, X. Uppermost Mantle Velocities beneath China and Surrounding Regions. J. Geophys. Res. 2004, 109, B11301. [Google Scholar] [CrossRef]
- Rezapour, M.; Pearce, R.G. Bias in Surface-Wave Magnitude Ms Due to Inadequate Distance Corrections. Bull. Seismol. Soc. Am. 1998, 88, 43–61. [Google Scholar] [CrossRef]
- Selby, N.D.; Bowers, D.; Marshall, P.D.; Douglas, A. Empirical Path and Station Corrections for Surface-Wave Magnitude, Ms, Using a Global Network. Geophys. J. Int. 2003, 155, 379–390. [Google Scholar] [CrossRef]
- Zhou, L.; Song, X.; Yang, X.; Zhao, C. Rayleigh Wave Attenuation Tomography in the Crust of the Chinese Mainland. Geochem. Geophys. Geosyst. 2020, 21, e2020GC008971. [Google Scholar] [CrossRef]
- Feng, M.; Assumpção, M.; Van Der Lee, S. Group-Velocity Tomography and Lithospheric S-Velocity Structure of the South American Continent. Phys. Earth Planet. Inter. 2004, 147, 315–331. [Google Scholar] [CrossRef]
- Nascimento, A.V.D.S.; França, G.S.; Chaves, C.A.M.; Marotta, G.S. Rayleigh Wave Group Velocity Maps at Periods of 10–150 s beneath South America. Geophys. J. Int. 2021, 228, 958–981. [Google Scholar] [CrossRef]
- Ekström, G.; Tromp, J.; Larson, E.W.F. Measurements and Global Models of Surface Wave Propagation. J. Geophys. Res. 1997, 102, 8137–8157. [Google Scholar] [CrossRef]
- Durand, S.; Debayle, E.; Ricard, Y. Rayleigh Wave Phase Velocity and Error Maps up to the Fifth Overtone. Geophys. Res. Lett. 2015, 42, 3266–3272. [Google Scholar] [CrossRef]
- Liu, K.; Zhou, Y. Global Rayleigh Wave Phase-Velocity Maps from Finite-Frequency Tomography. Geophys. J. Int. 2016, 205, 51–66. [Google Scholar] [CrossRef][Green Version]
- Zhou, Y.; Dahlen, F.A.; Nolet, G.; Laske, G. Finite-Frequency Effects in Global Surface-Wave Tomography. Geophys. J. Int. 2005, 163, 1087–1111. [Google Scholar] [CrossRef]
- Dalton, C.A.; Ekström, G.; Dziewonski, A.M. Global Seismological Shear Velocity and Attenuation: A Comparison with Experimental Observations. Earth Planet. Sci. Lett. 2009, 284, 65–75. [Google Scholar] [CrossRef]
- Selby, N.D.; Woodhouse, J.H. Controls on Rayleigh Wave Amplitudes: Attenuation and Focusing. Geophys. J. Int. 2000, 142, 933–940. [Google Scholar] [CrossRef]
- Selby, N.D. The Q Structure of the Upper Mantle: Constraints from Rayleigh Wave Amplitudes. J. Geophys. Res. 2002, 107, 2097. [Google Scholar] [CrossRef]
- Pilidou, S.; Priestley, K.; Gudmundsson, Ó.; Debayle, E. Upper Mantle S -Wave Speed Heterogeneity and Anisotropy beneath the North Atlantic from Regional Surface Wave Tomography: The Iceland and Azores Plumes. Geophys. J. Int. 2004, 159, 1057–1076. [Google Scholar] [CrossRef]
- Herrmann, R.B. Computer Programs in Seismology: An Evolving Tool for Instruction and Research. Seism. Res. Lettr. 2013, 84, 1081–1088. [Google Scholar] [CrossRef]
- Abbott, D.H.; Mooney, W.D.; VanTongeren, J.A. The Character of the Moho and Lower Crust within Archean Cratons and the Tectonic Implications. Tectonophysics 2013, 609, 690–705. [Google Scholar] [CrossRef]
- Bird, P. An Updated Digital Model of Plate Boundaries. Geochem. Geophys. Geosyst. 2003, 4, 2001GC000252. [Google Scholar] [CrossRef]
Disclaimer/Publisher’s Note: The statements, opinions and data contained in all publications are solely those of the individual author(s) and contributor(s) and not of MDPI and/or the editor(s). MDPI and/or the editor(s) disclaim responsibility for any injury to people or property resulting from any ideas, methods, instructions or products referred to in the content. |
© 2024 by the author. Licensee MDPI, Basel, Switzerland. This article is an open access article distributed under the terms and conditions of the Creative Commons Attribution (CC BY) license (https://creativecommons.org/licenses/by/4.0/).