Correction: Hoffmann-Abdi et al. Short-Term Meteorological and Environmental Signals Recorded in a Firn Core from a High-Accumulation Site on Plateau Laclavere, Antarctic Peninsula. Geosciences 2021, 11, 428

 ,
,  , , , and
 1. Text Correction
- In Section 1, fourth paragraph: In the sentence “Proxy Proxy data, such as glacio-chemical data from firn and ice cores, may partly compensate for the lack of direct observations.” the word “Proxy” should be deleted as it occurs twice. The sentence should have read: “Proxy data, such as glacio-chemical data from firn and ice cores, may partly compensate for the lack of direct observations.”.
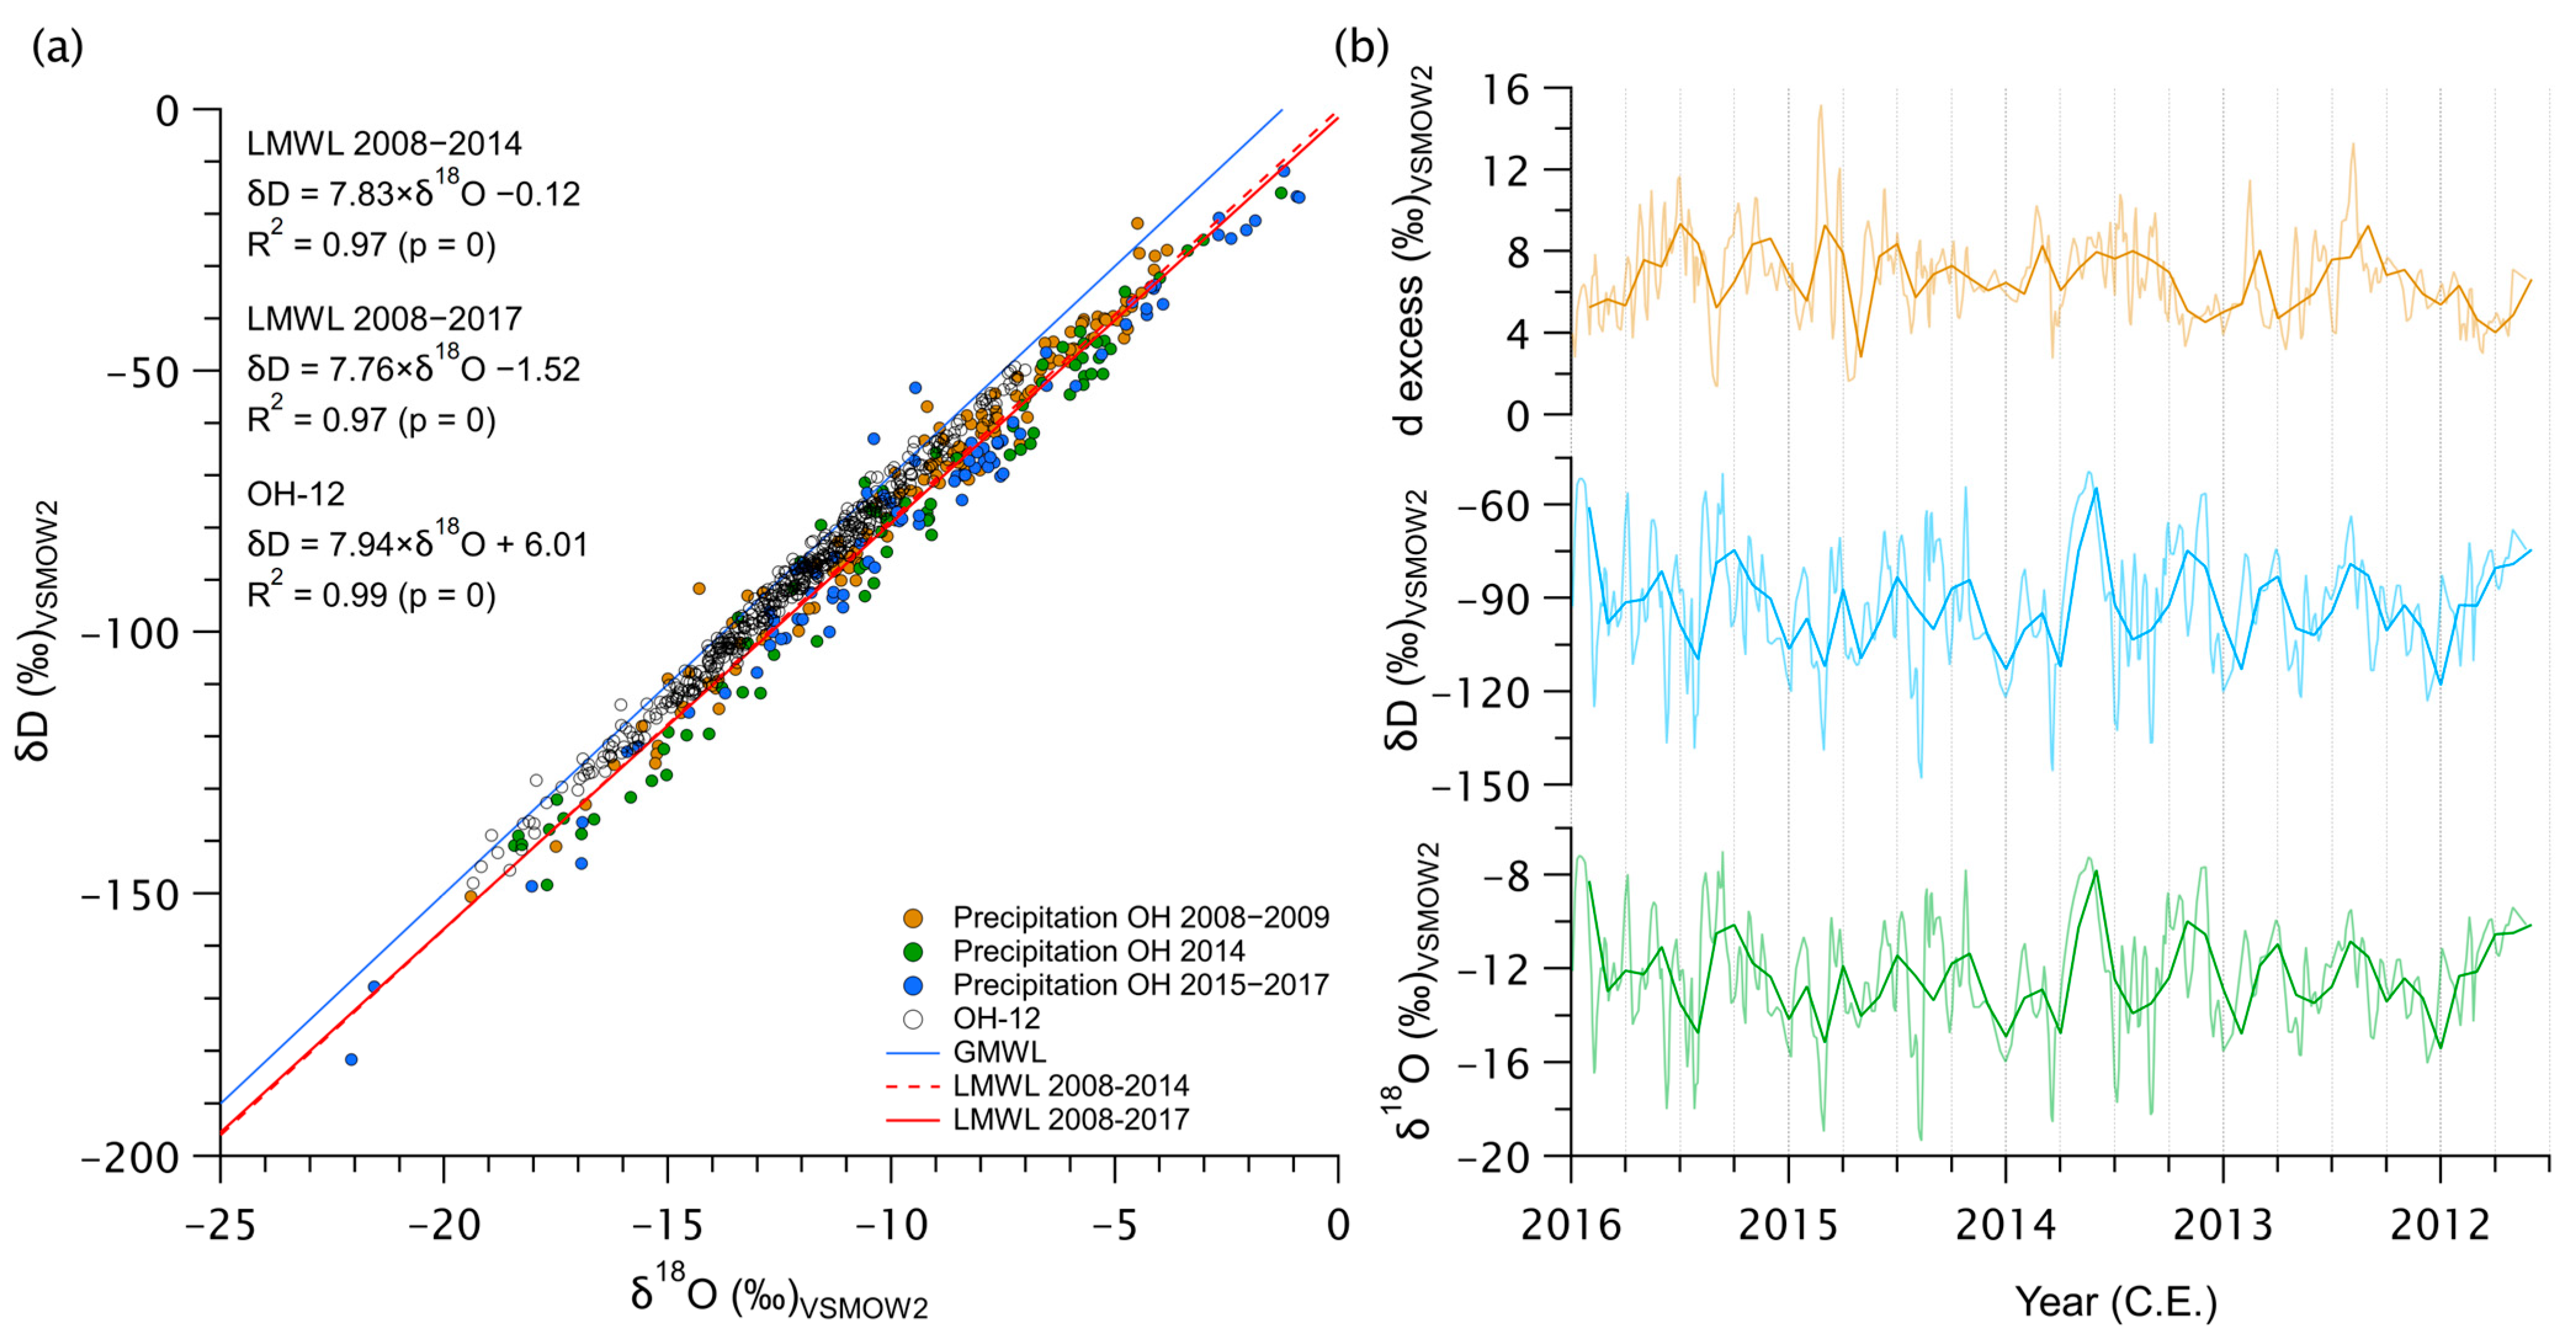
- In Section 3.4, second paragraph: In the sentence “The slope of the δ18O–δD relationship (7.94) is close to that of the Global Meteoric Water Line (GMWL) [49] and is of the same order of magnitude as the slope of the site-specific LMWL (m = 7.76).” the “m =” should be deleted before “7.76” and “, 8” should be inserted after “GMWL”. The sentence should have read: “The slope of the δ18O–δD relationship (7.94) is close to that of the Global Meteoric Water Line (GMWL, 8) [49] and is of the same order of magnitude as the slope of the site-specific LMWL (7.76).”.
- In Section 4.5, first paragraph: In the sentence “Figure 8c,e visualise the anti-correlation between MLT and SIE in both the Bellingshausen-Amundsen Sea and the Weddell Sea (r > −0.6, p = 0; Table 5).” the “>” in the parenthesis should be replaced by “=”. The sentence should have read: “Figure 8c,e visualise the anti-correlation between MLT and SIE in both the Bellingshausen-Amundsen Sea and the Weddell Sea (r = −0.6, p = 0; Table 5).”.
2. Error in Table

3. Error in Figure
Reference
- Hoffmann-Abdi, K.; Fernandoy, F.; Meyer, H.; Freitag, J.; Opel, T.; McConnell, J.R.; Schneider, C. Short-Term Meteorological and Environmental Signals Recorded in a Firn Core from a High-Accumulation Site on Plateau Laclavere, Antarctic Peninsula. Geosciences 2021, 11, 428. [Google Scholar] [CrossRef]
Disclaimer/Publisher’s Note: The statements, opinions and data contained in all publications are solely those of the individual author(s) and contributor(s) and not of MDPI and/or the editor(s). MDPI and/or the editor(s) disclaim responsibility for any injury to people or property resulting from any ideas, methods, instructions or products referred to in the content. |
© 2023 by the authors. Licensee MDPI, Basel, Switzerland. This article is an open access article distributed under the terms and conditions of the Creative Commons Attribution (CC BY) license (https://creativecommons.org/licenses/by/4.0/).
Share and Cite
Hoffmann-Abdi, K.; Fernandoy, F.; Meyer, H.; Freitag, J.; Opel, T.; McConnell, J.R.; Schneider, C. Correction: Hoffmann-Abdi et al. Short-Term Meteorological and Environmental Signals Recorded in a Firn Core from a High-Accumulation Site on Plateau Laclavere, Antarctic Peninsula. Geosciences 2021, 11, 428. Geosciences 2023, 13, 237. https://doi.org/10.3390/geosciences13080237
Hoffmann-Abdi K, Fernandoy F, Meyer H, Freitag J, Opel T, McConnell JR, Schneider C. Correction: Hoffmann-Abdi et al. Short-Term Meteorological and Environmental Signals Recorded in a Firn Core from a High-Accumulation Site on Plateau Laclavere, Antarctic Peninsula. Geosciences 2021, 11, 428. Geosciences. 2023; 13(8):237. https://doi.org/10.3390/geosciences13080237
Chicago/Turabian StyleHoffmann-Abdi, Kirstin, Francisco Fernandoy, Hanno Meyer, Johannes Freitag, Thomas Opel, Joseph R. McConnell, and Christoph Schneider. 2023. "Correction: Hoffmann-Abdi et al. Short-Term Meteorological and Environmental Signals Recorded in a Firn Core from a High-Accumulation Site on Plateau Laclavere, Antarctic Peninsula. Geosciences 2021, 11, 428" Geosciences 13, no. 8: 237. https://doi.org/10.3390/geosciences13080237
APA StyleHoffmann-Abdi, K., Fernandoy, F., Meyer, H., Freitag, J., Opel, T., McConnell, J. R., & Schneider, C. (2023). Correction: Hoffmann-Abdi et al. Short-Term Meteorological and Environmental Signals Recorded in a Firn Core from a High-Accumulation Site on Plateau Laclavere, Antarctic Peninsula. Geosciences 2021, 11, 428. Geosciences, 13(8), 237. https://doi.org/10.3390/geosciences13080237