


Comparing Flow-R, Rockyfor3D and RAMMS to Rockfalls from the Mel de la Niva Mountain: A Benchmarking Exercise

 ,
,  ,
,
Abstract
1. Introduction
- Rockfall susceptibility/indicative hazard evaluations;
- Quantitative rockfall hazard zoning;
- Detailed risk assessment related to rockfalls;
- Mitigation measure designs.
2. Benchmarking Approach
2.1. Flow-R 2.0.9 Methodology
2.2. Rockyfor3D 5.2.15 Methodology
2.3. RAMMS::ROCKFALL 1.6.70 Methodology
2.4. Localized Reach Probability and Hazard
3. Simulation Results and Analysis
- By how much do the simulations fail/succeed at reproducing the real events and at covering the mapped deposited rocks?
- How far/close do the parameter values need to be pushed beyond the previously anticipated realistic range of values for reproducing real events, and how does that translate when back analyses are not possible for a given site? In other words, is the model predictable, or should the previous range of parameter values be extended by precaution when back analyses are not possible?
- Do the results exaggerate the runout distances, involved energies and bounce heights leading to safe but costly/constraining susceptibility and hazard zoning, risk assessments and mitigation designs?
- Contrarily, can the results potentially lead to consequences in case of any eventuality due to underestimated simulated values?
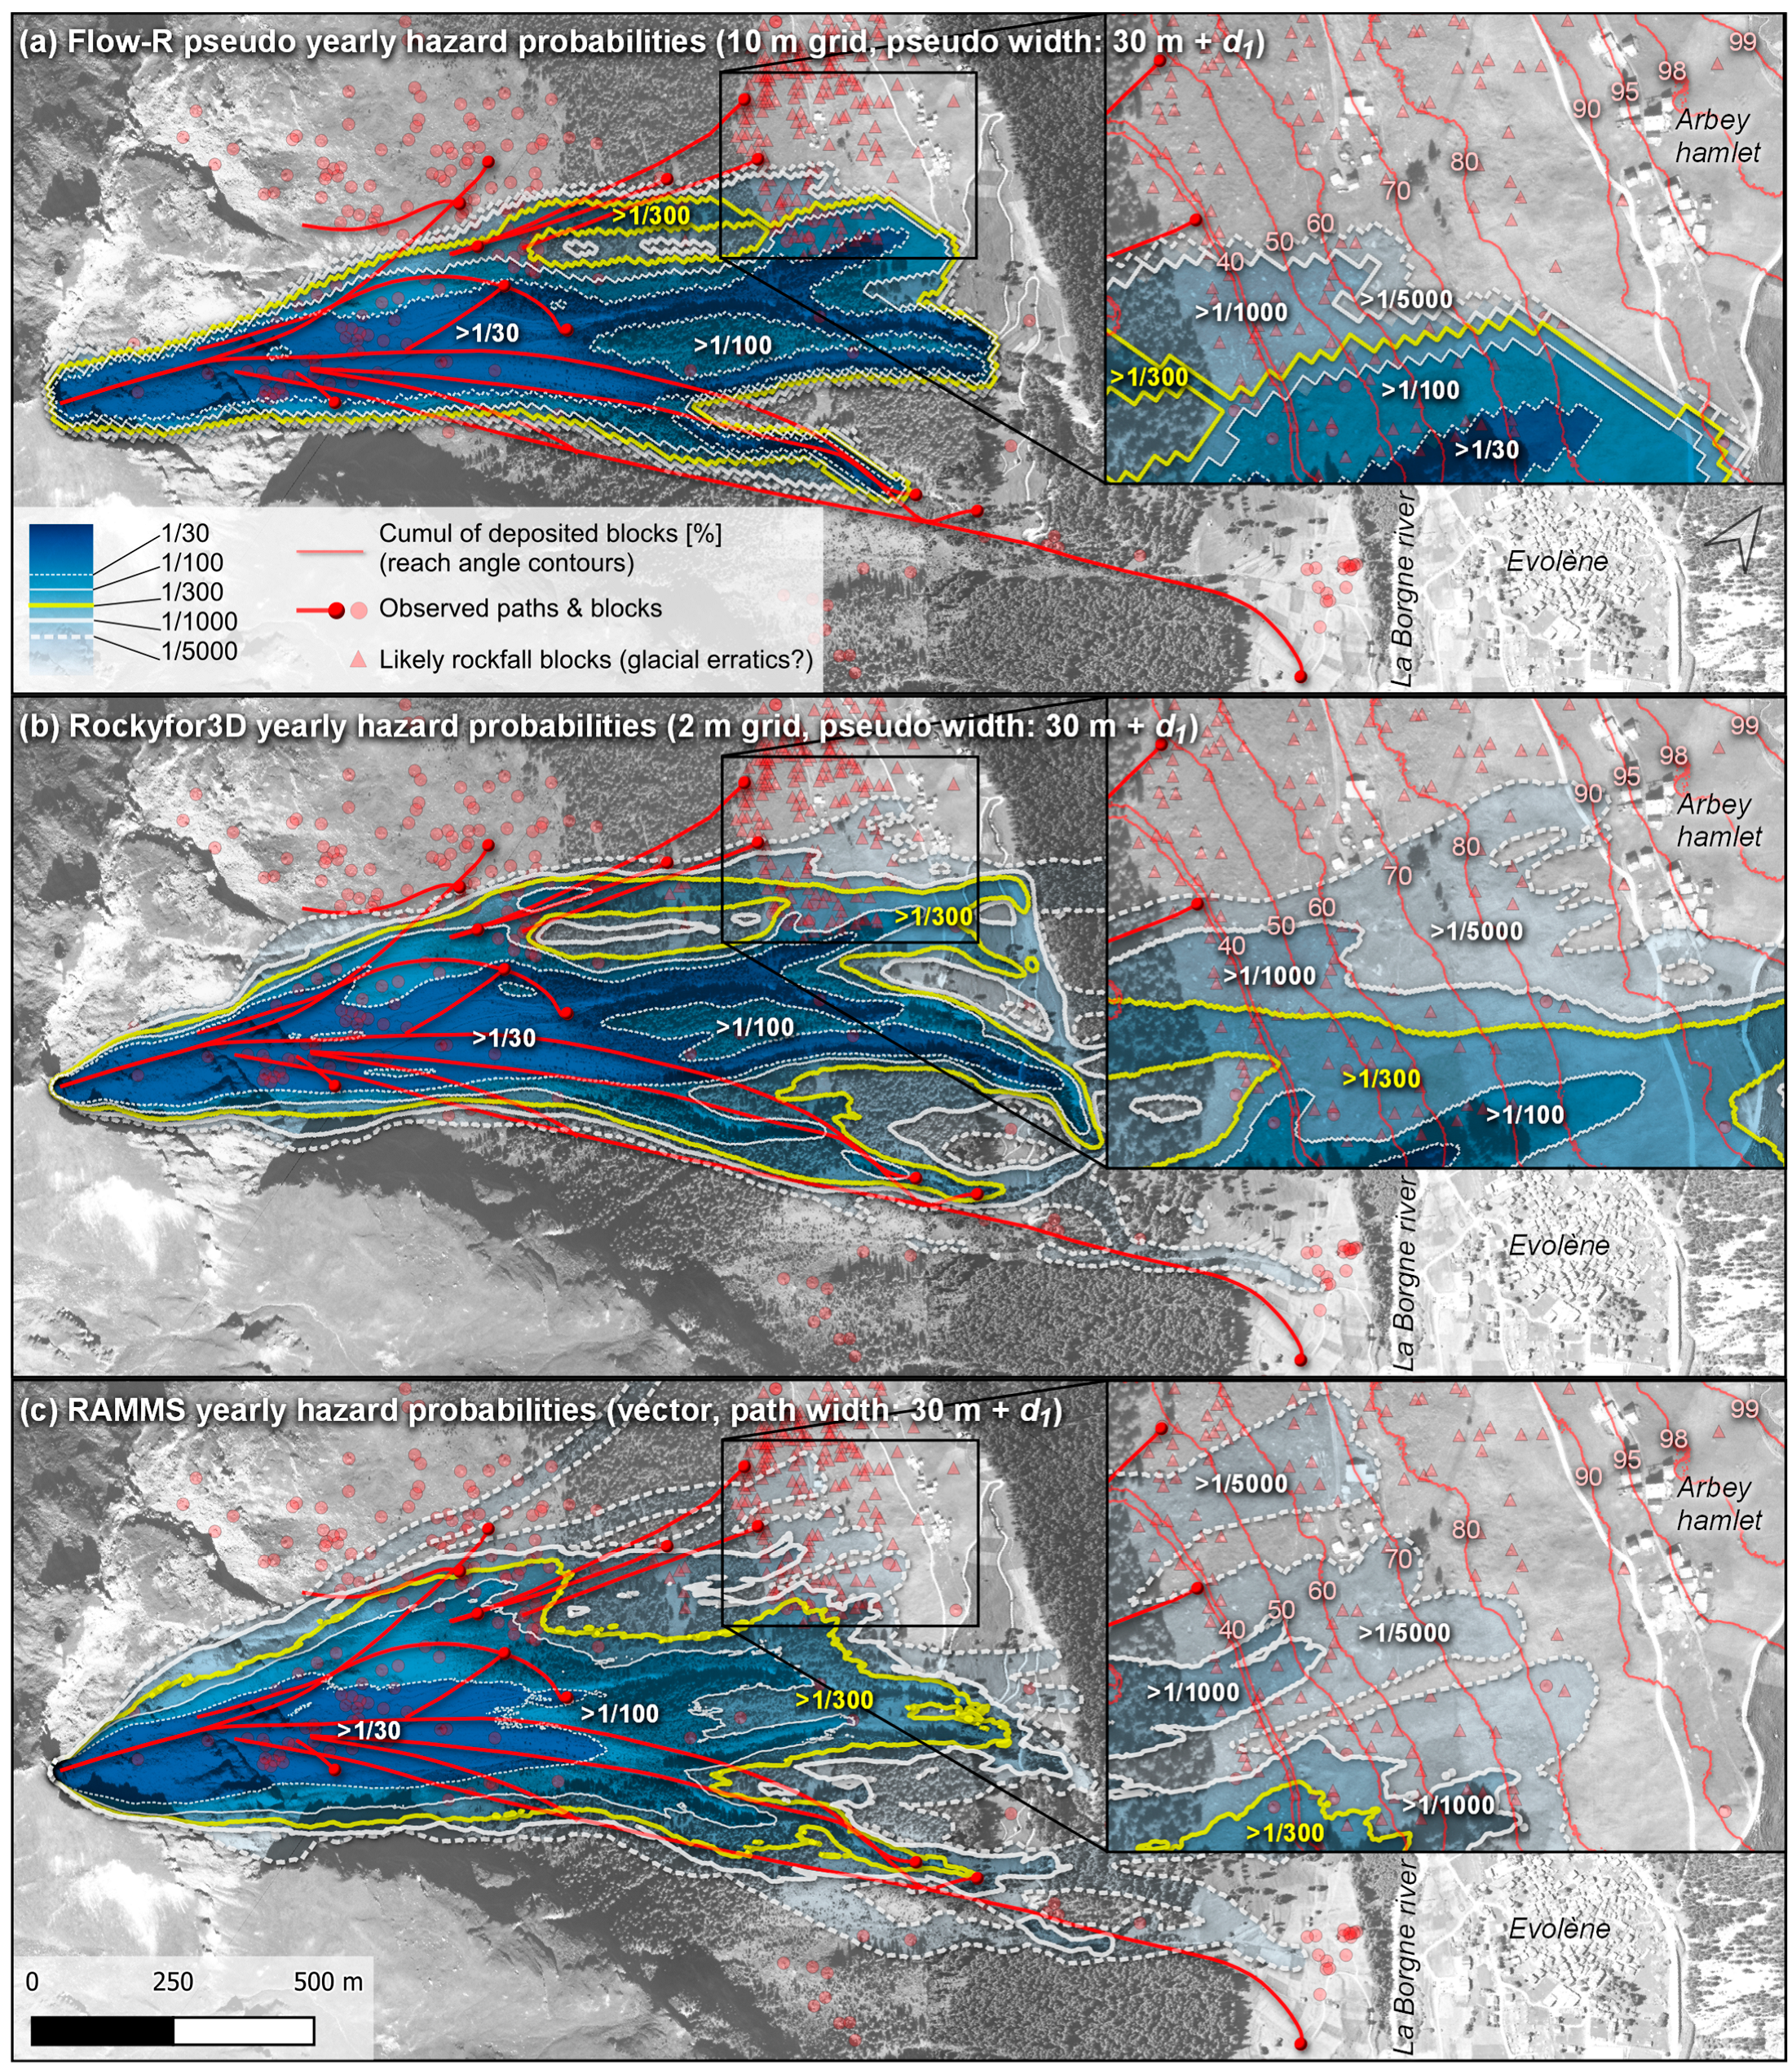
- Do the simulated paths unrealistically oscillate laterally compared to the observations, potentially leading to unrealistically undertaken paths and erroneous associated reach probabilities (e.g., the yellow vs. red paths in Figure 1a,b)?
- Do the small sets of simulated paths and their distribution fall close to the observations for similar paths so that the simulations are statistically representative (e.g., the yellow vs. red paths in Figure 1a,c)?
- Do the vaults or curvature of the simulated freefalling parabola segments and separating distances in between the impacts compare well with the observations so that the bounce heights are realistic for use of the simulation with mitigation design tasks?
- Do the simulated velocities or related energies compare well with those from the reconstructed trajectories so that intensities based on preset building vulnerabilities can be estimated for land planning zonation tasks, risk assessment studies or mitigation design tasks?
- Are the simulated velocities, bounce heights and deposited rocks matching with the reconstructed data? In other words, is it possible to obtain all those characteristics at once, or must simulations with different parameter values be performed in parallel for each desired piece of matching information?
- Does the simulated envelope cover most of the mapped deposited rocks suspected to come from the same source(s) so that the results could be used for guiding susceptibility/indicative hazard zoning (e.g., the yellow vs. red dotted envelopes in Figure 1a–c)?
- Would an additional buffer around the simulated paths and/or different parameter values be needed to increase the area covered by the envelope to catch most of the mapped deposited blocks?
- Are the simulated paths and deposited rocks overly channelized compared to the mapped observations, leading to unrealistic statistics for the reach probabilities (e.g., the yellow vs. red paths and blocks in Figure 1a,b)?
- Contrarily, are the simulated rocks deposited near mapped deposited ones in proportional numbers so that the simulations are statistically representative for quantitatively guiding hazard land use zonation and risk-assessment-related tasks (e.g., the yellow vs. red paths and blocks in Figure 1a,c)?
- Are the path widths properly considered to obtain statistically representative reach probabilities from the propagation probabilities (e.g., see the width influence on the reach probabilities in Figure 1d)?
3.1. Flow-R 2.0.9 Analysis
3.2. Rockyfor3D 5.2.15 Analysis
3.3. RAMMS::ROCKFALL 1.6.70 Analysis
4. Benchmark Summary and Recommendations
- One could quickly evaluate the normality/abnormality of a site and preliminary reachable zones by predictably tracing desired reach angle contours from effective and nongrid-biased geometric approaches with, for examples, CONEFALL or QPROTO GIS tools (Jaboyedoff and Labiouse, [17]; Žabota and Kobal, [68]; Scavia et al. [69]; Castelli et al. [70]). Lateral constraints can be roughly estimated from common empirically observed lateral deviations in the literature (Table 2).
- Then, the use of relatively predictable and time efficient models, such as Rockyfor3D, could be used to estimate the expected runout distances from parameters that can be measured in the field and/or with the conservative parameters with slope thresholds of the rapid automatic simulations.
- Finally, the realistic lateral extent and energies could be estimated from models, such as RAMMS::ROCKFALL, once its runouts are tuned to match those of the previous conservative/predictable simulations and the onsite observations. One must remember to adjust the energies if the mass of the simulated blocks is constrained by software limitations.
5. Conclusions
Supplementary Materials
Author Contributions
Funding
Data Availability Statement
Acknowledgments
Conflicts of Interest
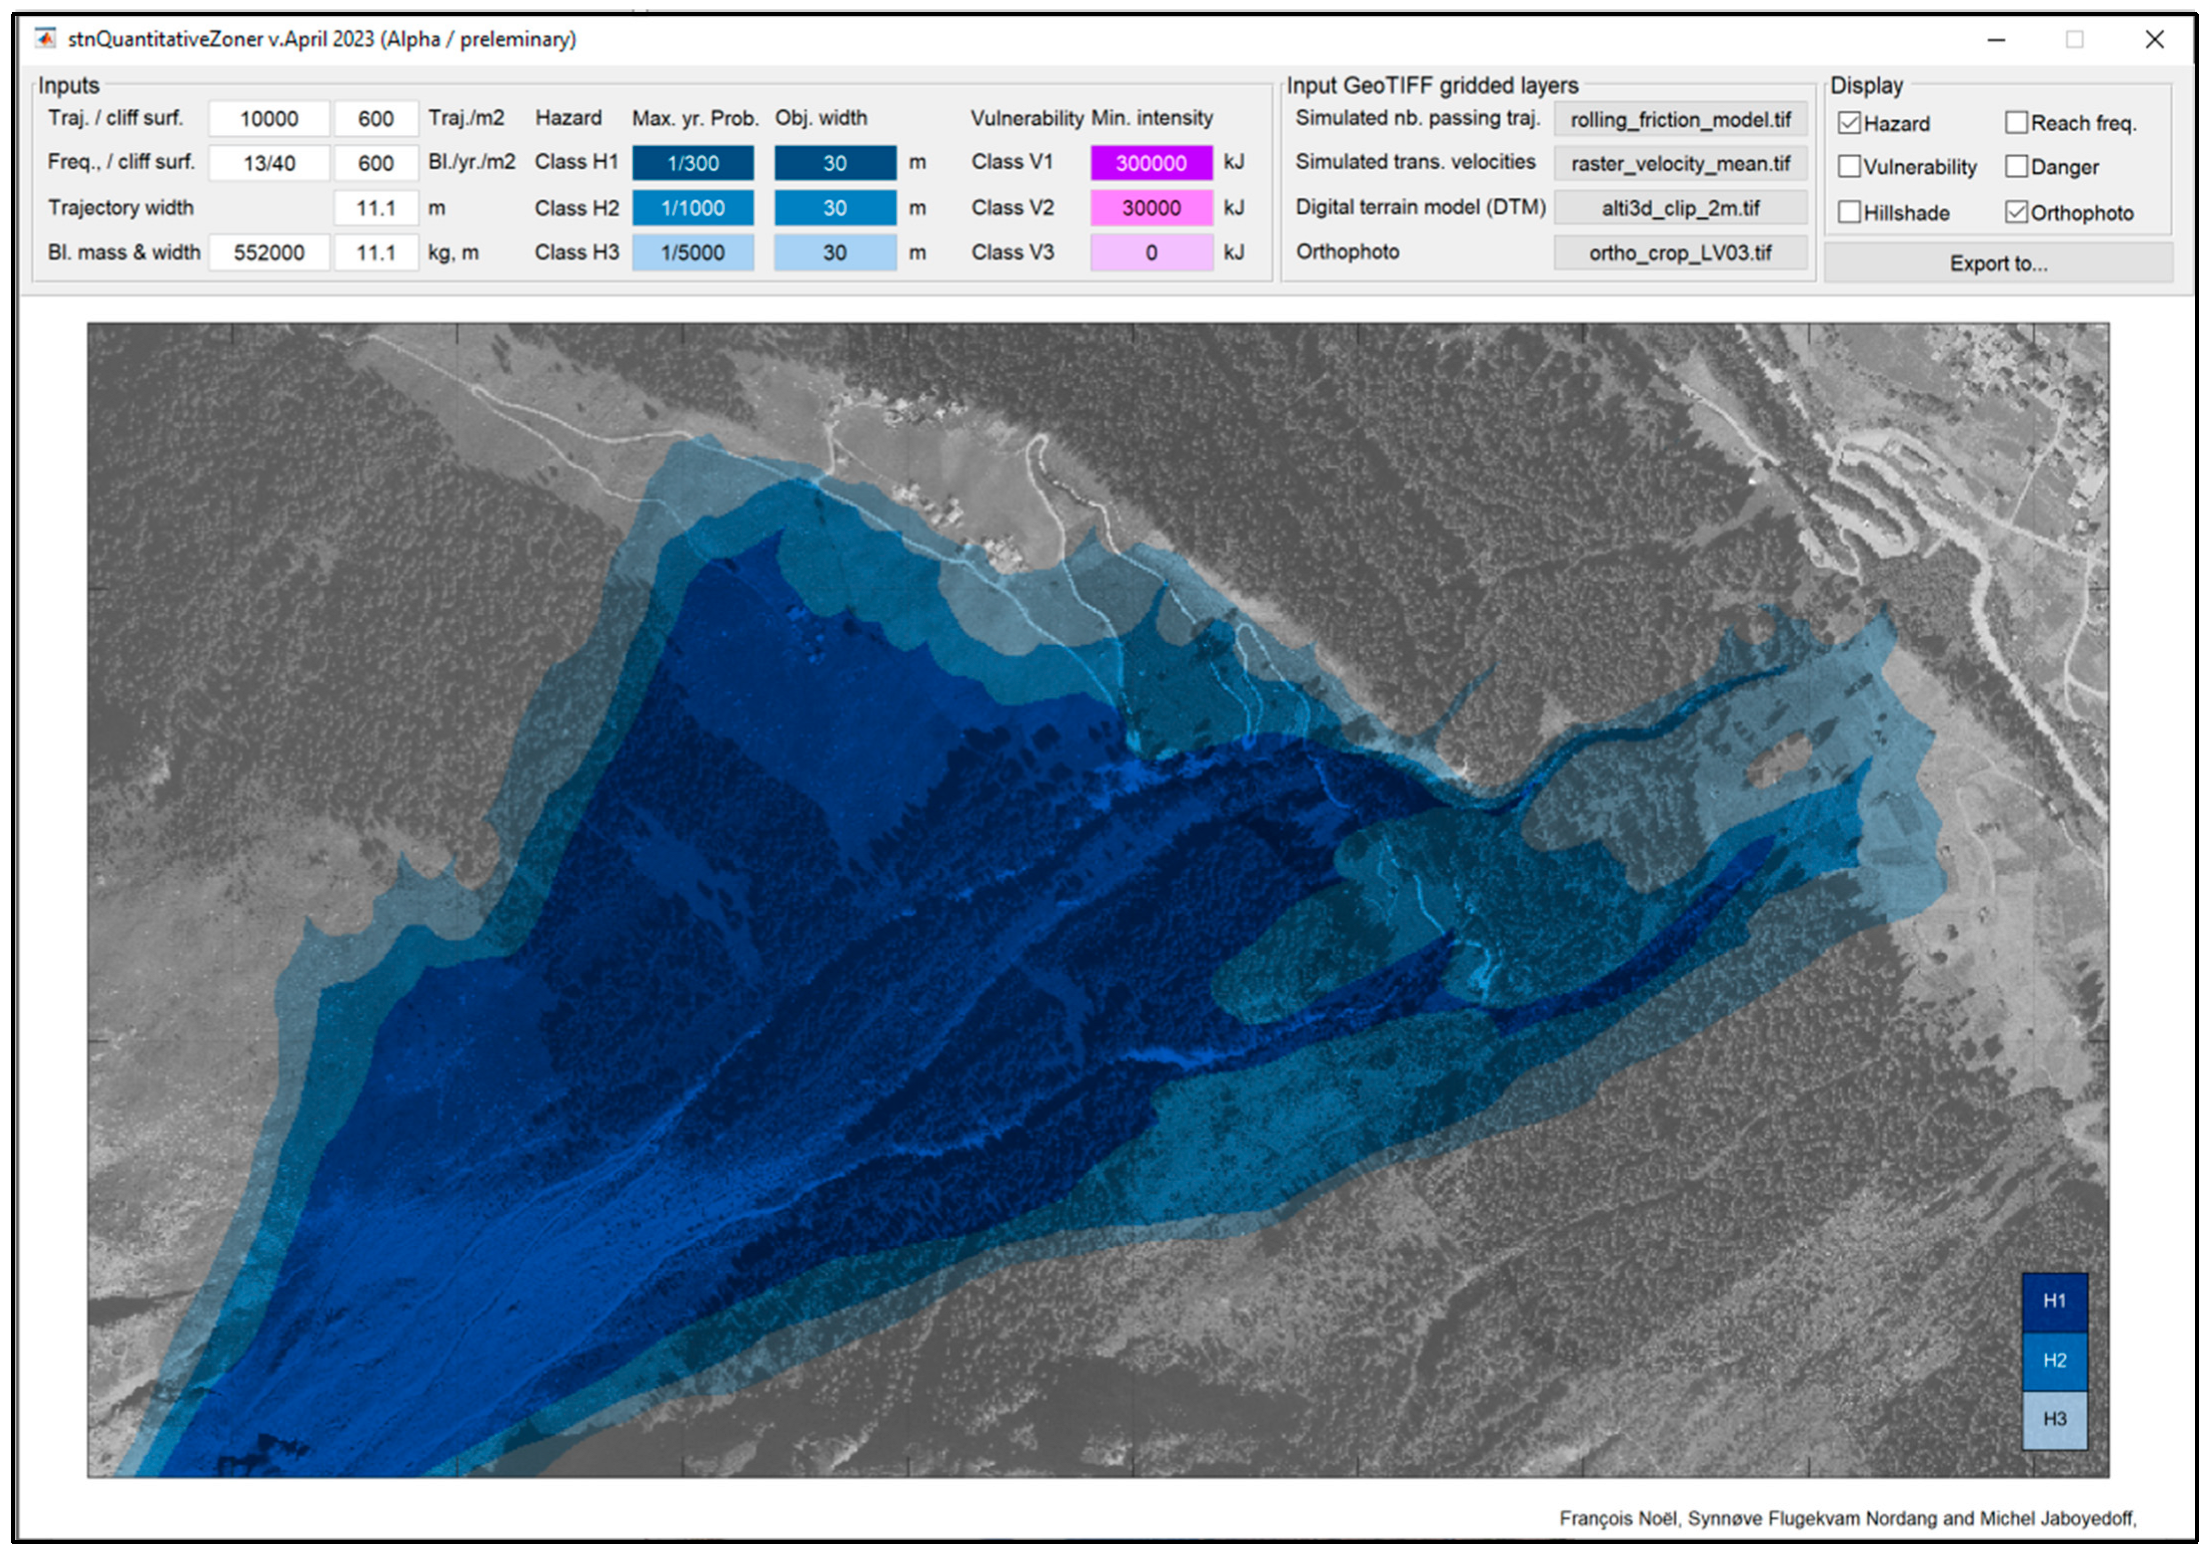
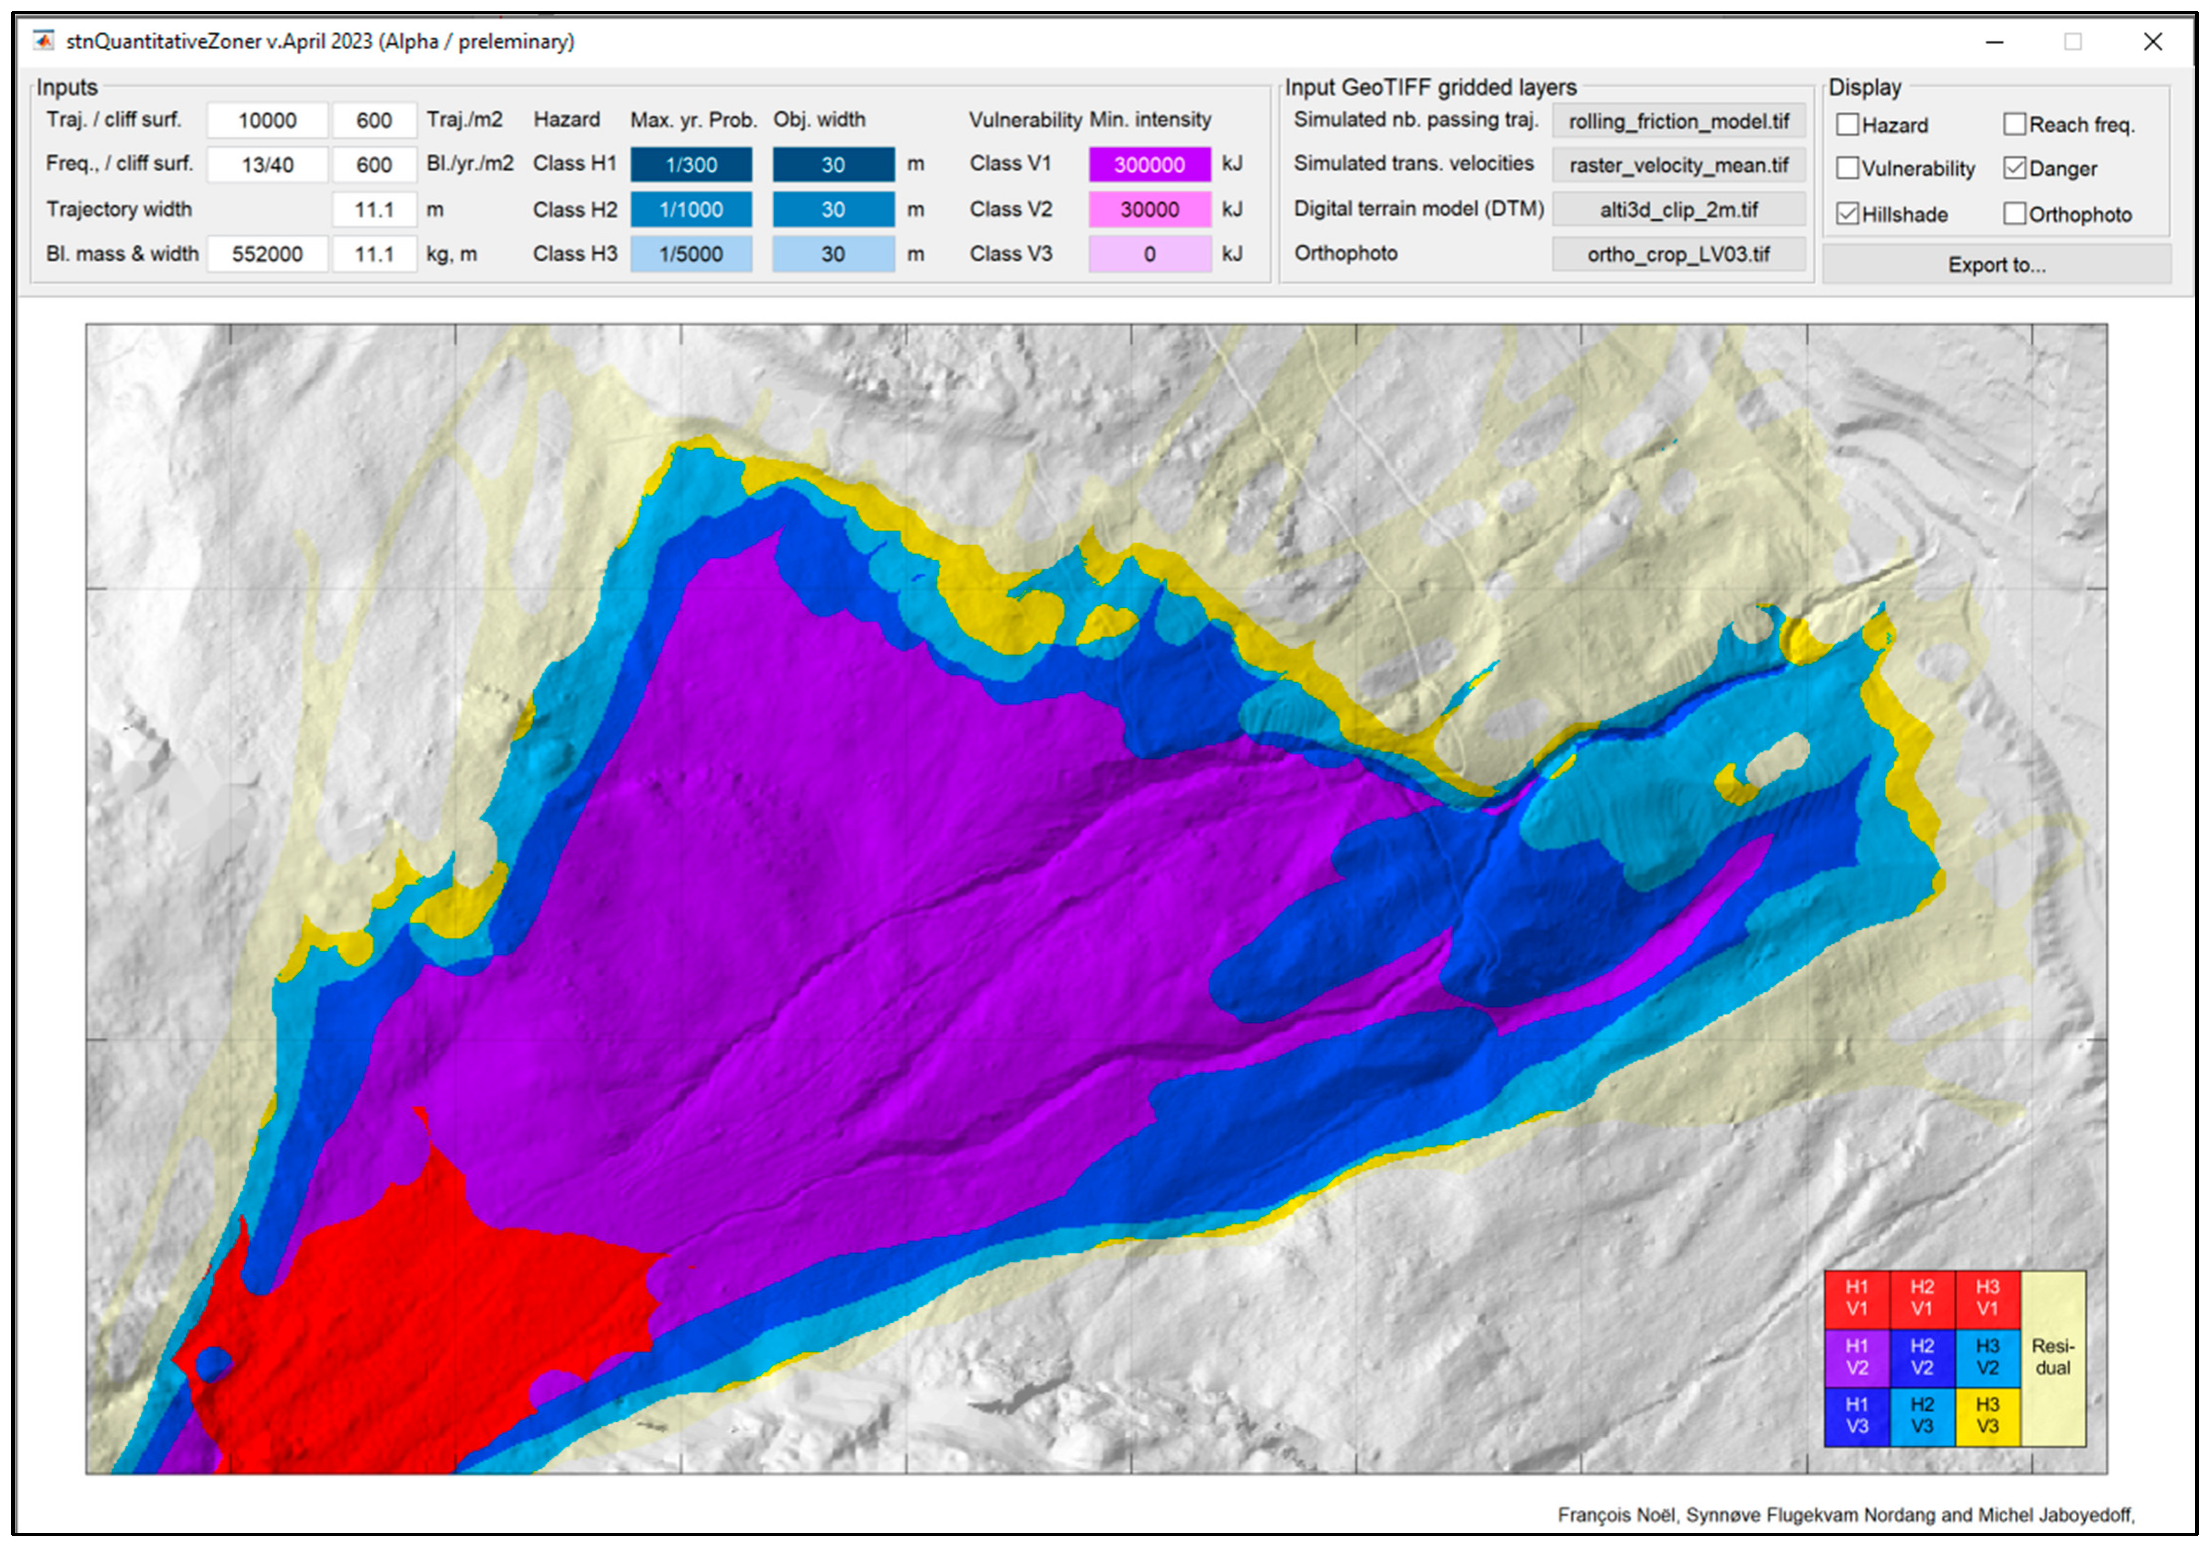
Appendix A. Quantitative Hazard Zoning Tool
- Cropping out the trajectory segments with energies/intensities below which the object is not vulnerable. This is done to only keep the “problematic” exceeding segments for a given class. A trajectory with multiple resulting segments should still be counted as one feature.
- Producing a grid of points spaced to the desired cell size of the end result with an extent that corresponds with the remaining trajectory segments (e.g., with the Create grid tool in QGIS [63]).
- Converting the points to circular polygons that would represent the hypothetical exposed objects in every location. This can be done by adding a buffer with a radius that corresponds to half of the combined width of the object and blocks.
- Counting the number of intercepting trajectories in each polygon (e.g., with the Sum line lengths tool in QGIS [63]).
- Reducing the size of the polygon to only correspond to the dimensions of the object (without the block).
- Rasterizing the polygons with a priority to the lowest overlaying value (to obtain a zonation valid for the boundaries of the objects) or from the polygon centroids (for a zonation valid for the center of the objects). The obtained raster grid corresponds to the number of reaches.
- The previous grid can be converted with raster calculations into expected reaching frequencies and hazard probabilities.
- Contours and/or polygonised contours can be extracted from the hazard probabilities for given hazard thresholds to produce the guiding zonation limits.


Appendix B. Rockyfor3D Velocity Cutoff Investigation
Appendix B.1. Method

Appendix B.2. Results


Appendix B.3. Concluding Remarks
- How much of a concern is this for sites involving series of small, stepped cliffs?
- What about if tall steep cliffs beyond 50 m are involved?
- Do the rockfalls initiated from such tall cliffs reach proper velocities at the end of their initial freefalling phases, ensuring proper following propagations?
- Should more than half of the simulated trajectories with shorter runouts be ignored in order to preserve mostly the outlier trajectories when cliffs are present? If so, how can one filter out the “good” trajectories from the “wrong” ones in a practical manner to obtain proper probabilities?
Appendix C. The Importance of Back Calculation
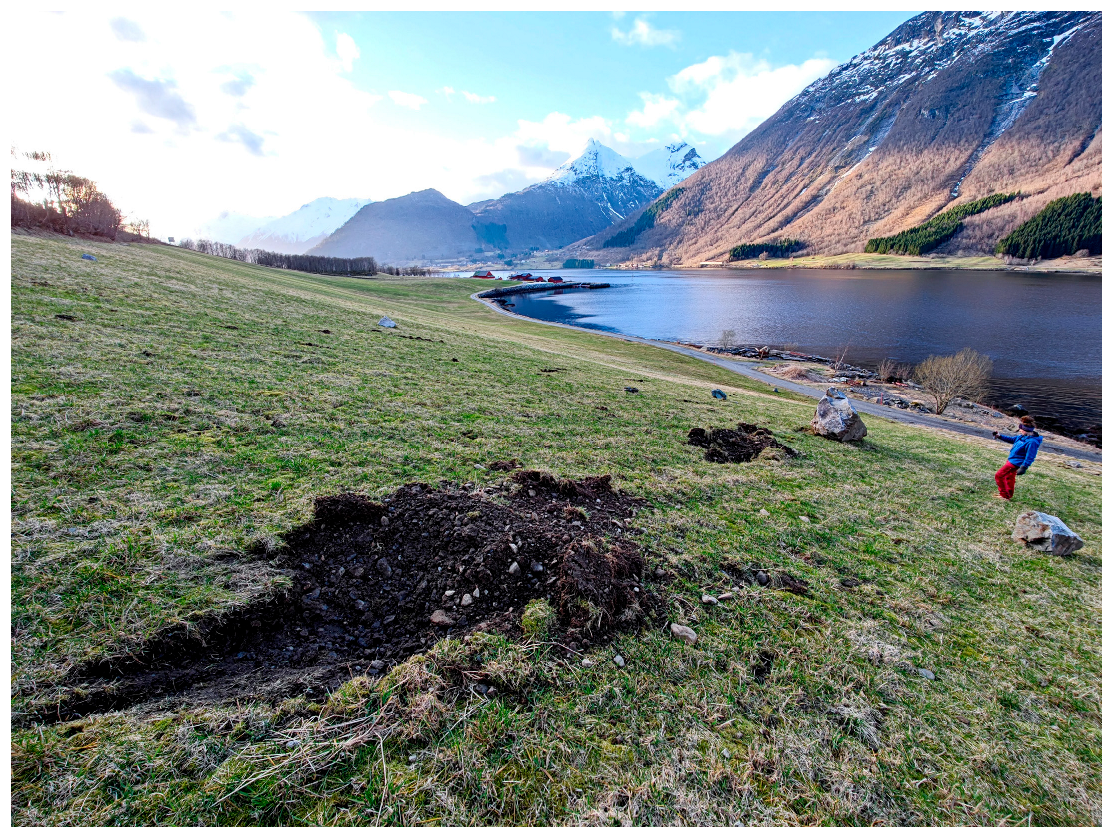
- Position of the deposited blocks beyond the foot of the scree slopes;
- Typical dimensions and shapes of those deposited blocks;
- Position of consecutive impact marks;
- Intermediate impact marks (e.g., on tree stems);
- Impact mark characteristics.
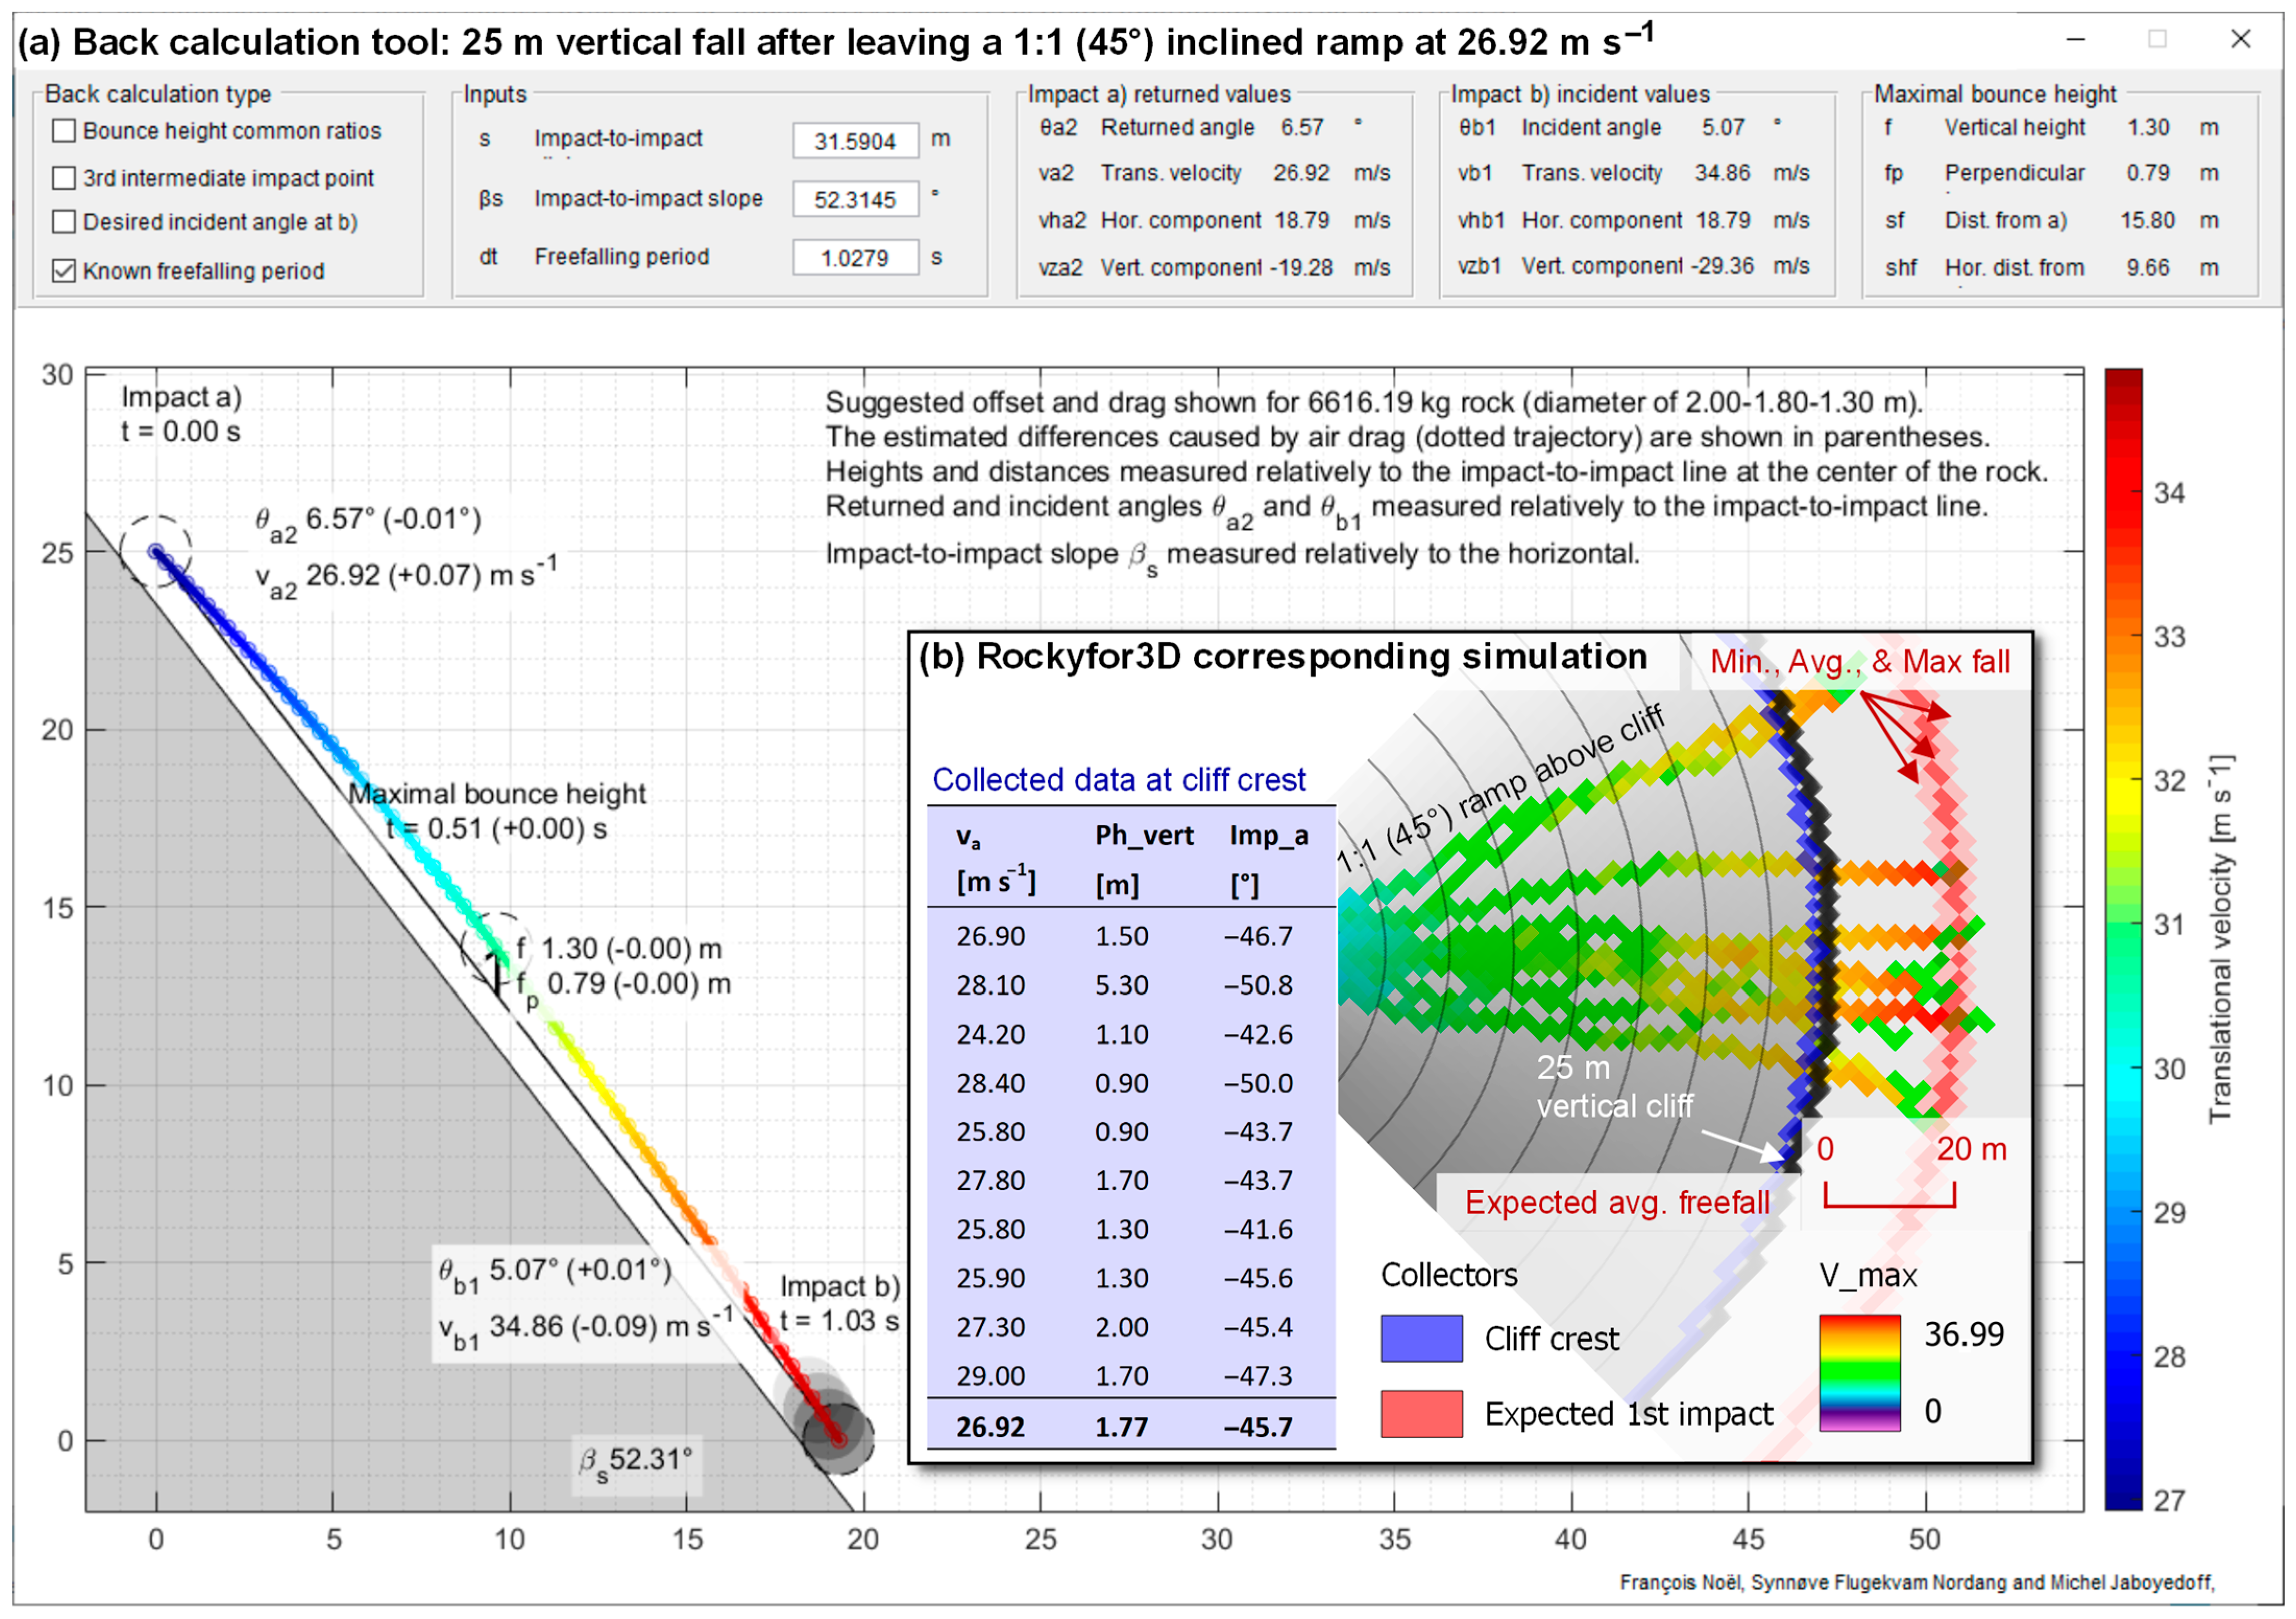
- As suggested by Volkwein et al. [6], Glover [78] and Gerber [42], it can be defined from a predefined vertical lumped mass bounce height () from common ratios (e.g., ) (Figure A8). In this case, with being the vertical acceleration component due to gravity (~−9.81 m s−2), the period is given by Equation (A1) as follows (Volkwein et al. [6]; Glover, [78]; Gerber, [42]):
- The freefalling parabola can be back calculated from an intermediate third impact point (e.g., on a tree stem), assuming no change in velocity or deviation occurs (Paronuzzi, [79]; Volkwein et al., [6]; Wyllie, [41]; Gerber, [42]). With a lumped mass vertical impact height at the third impact (), as shown in Figure A8, and a lumped mass distance from impact (a) () along the impact-to-impact line, one can find the related period by constraining the common ballistic equations (e.g., Descoeudres, [40]; Wyllie, [41]; Noël et al. [44]) to pass by the three impact points. Once isolated, the related period is given by Equation (A2) as follows:
- The freefalling parabola can also be reconstructed from known returned or incident angles (Domaas, [39]; Paronuzzi, [79]; Wyllie, [41]). This is usually done from the incident angle () at the impact (b) relative to the impact-to-impact line (Figure A8) because the entry point of an impact mark is usually much cleaner than the exit point due to the bulged and projected soil that affects the latter (Figure A9). This time, the common ballistic equations must be constrained by the incident trend angle of the incoming trajectory ( at ). Once isolated, the period in this third case is given by Equation (A3) as follows:
- It can finally be measured from video footage (e.g., Descoeudres, [40]; Glover, [78]; Gerber, [42]; Prades-Valls et al. [80]; Noël et al. [44]; Noël et al. [1]), seismic data (e.g., Hibert et al. [81]) or instrumented rocks (Volkwein and Klette, [82]; Gerber, [42]; Caviezel et al. [73]) in unlikely cases, in which past rockfalls were witnessed, filmed, instrumented and/or the site was instrumented.


Appendix D. Back Calculation Proofs
Appendix D.1. From Common f/s Ratios
Appendix D.2. From a 3rd Intermediate Impact Point
Appendix D.3. From a Desired Incident Angle
References
- Noël, F.; Nordang, S.F.; Jaboyedoff, M.; Travelletti, J.; Matasci, B.; Digout, M.; Derron, M.-H.; Caviezel, A.; Hibert, C.; Toe, D.; et al. Highly Energetic Rockfalls: Back Analysis of the 2015 Event from the Mel de La Niva, Switzerland. Landslides 2023, 1–22. [Google Scholar] [CrossRef]
- Jones, C.L.; Higgins, J.D.; Andrew, R.D.; Colorado Rockfall Simulation Program. 2000, p. 127. Available online: https://coloradogeologicalsurvey.org/publications/colorado-rockfall-simulation-program/ (accessed on 10 January 2021).
- Labiouse, V. Fragmental Rockfall Paths: Comparison of Simulations on Alpine Sites and Experimental Investigation of Boulder Impacts. In Landslides: Evaluation and Stabilization/Glissement de Terrain: Evaluation et Stabilisation, Set of 2 Volumes; CRC Press: Rio de Janeiro, Brazil, 2004; pp. 457–466. [Google Scholar]
- Berger, F.; Dorren, L.K.A. Objective Comparison of Rockfall Models Using Real Size Experimental Data. In Disaster Mitigation of Debris Flows, Slope Failures and Landslides; Marui, H., Matjaž, M., Eds.; Universal Academy Press: Tokyo, Japan, 2006; pp. 245–252. [Google Scholar]
- Berger, F.; Martin, R.; Auber, B.; Mathy, A. Etude Comparative, En Utilisant l’événement Du 28 Décembre 2008 à Saint Paul de Varces, Du Zonage de l’aléa Chute de Pierre Avec Différents Outils de Simulation Trajectographique et Différentes Matrices d’Aléa; Cemagref UREMGR: Grenoble, France, 2011; p. 226. [Google Scholar]
- Volkwein, A.; Schellenberg, K.; Labiouse, V.; Agliardi, F.; Berger, F.; Bourrier, F.; Dorren, L.K.A.; Gerber, W.; Jaboyedoff, M. Rockfall Characterisation and Structural Protection—A Review. Nat. Hazards Earth Syst. Sci. 2011, 11, 2617–2651. [Google Scholar] [CrossRef]
- Dorren, L.; Domaas, U.; Kronholm, K.; Labiouse, V. Methods for Predicting Rockfall Trajectories and Run-out Zones. In Rockfall Engineering; John Wiley & Sons, Inc.: Hoboken, NJ, USA, 2013; pp. 143–173. [Google Scholar]
- Valagussa, A.; Crosta, G.B.; Frattini, P.; Zenoni, S.; Massey, C. Rockfall Runout Simulation Fine-Tuning in Christchurch, New Zealand. In Engineering Geology for Society and Territory—Volume 2; Lollino, G., Giordan, D., Crosta, G.B., Corominas, J., Azzam, R., Wasowski, J., Sciarra, N., Eds.; Springer International Publishing: Cham, Switzerland, 2015; Volume 2, pp. 1913–1917. ISBN 978-3-319-09056-6. [Google Scholar]
- Bourrier, F.; Toe, D.; Garcia, B.; Baroth, J.; Lambert, S. Experimental Investigations on Complex Block Propagation for the Assessment of Propagation Models Quality. Landslides 2021, 18, 639–654. [Google Scholar] [CrossRef]
- Noël, F.; Cloutier, C.; Jaboyedoff, M.; Locat, J. Impact-Detection Algorithm That Uses Point Clouds as Topographic Inputs for 3D Rockfall Simulations. Geosciences 2021, 11, 188. [Google Scholar] [CrossRef]
- Hantz, D.; Corominas, J.; Crosta, G.B.; Jaboyedoff, M. Definitions and Concepts for Quantitative Rockfall Hazard and Risk Analysis. Geosciences 2021, 11, 158. [Google Scholar] [CrossRef]
- Jaboyedoff, M.; Dudt, J.P.; Labiouse, V. An Attempt to Refine Rockfall Hazard Zoning Based on the Kinetic Energy, Frequency and Fragmentation Degree. Nat. Hazards Earth Syst. Sci. 2005, 5, 621–632. [Google Scholar] [CrossRef]
- Loup, B.; Dorren, L.K.A. Utilisation de Modèles Pour l’Évaluation des Dangers de Chute de Pierres-Fiche d’Information; Office fédéral de l’Environnement (OFEV): Bern, Switzerland, 2022.
- Dorren, L.K.A. A Review of Rockfall Mechanics and Modelling Approaches. Prog. Phys. Geogr. Earth Environ. 2003, 27, 69–87. [Google Scholar] [CrossRef]
- Michoud, C.; Derron, M.-H.; Horton, P.; Jaboyedoff, M.; Baillifard, F.-J.; Loye, A.; Nicolet, P.; Pedrazzini, A.; Queyrel, A. Rockfall Hazard and Risk Assessments along Roads at a Regional Scale: Example in Swiss Alps. Nat. Hazards Earth Syst. Sci. 2012, 12, 615–629. [Google Scholar] [CrossRef]
- Domaas, U. Geometrical Methods of Calculating Rockfall Range; Norwegian Geotechnical Institute: Oslo, Norway, 1994; p. 33. [Google Scholar]
- Jaboyedoff, M.; Labiouse, V. Technical Note: Preliminary Estimation of Rockfall Runout Zones. Nat. Hazards Earth Syst. Sci. 2011, 11, 819–828. [Google Scholar] [CrossRef]
- Horton, P.; Jaboyedoff, M.; Rudaz, B.; Zimmermann, M. Flow-R, a Model for Susceptibility Mapping of Debris Flows and Other Gravitational Hazards at a Regional Scale. Nat. Hazards Earth Syst. Sci. 2013, 13, 869–885. [Google Scholar] [CrossRef]
- ONR 24810 Technical Protection against Rockfall-Terms and Definitions, Effects of Actions, Design, Monitoring and Maintenance. 2013. Available online: https://shop.austrian-standards.at/action/en/public/details/462231/ONR_24810_2013_01_15 (accessed on 6 August 2022).
- OFEV. Protection Contre Les Dangers Dus Aux Mouvements de Terrain. Aide à l’exécution Concernant La Gestion Des Dangers Dus Aux Glissements de Terrain, Aux Chutes de Pierres et Aux Coulées de Boue; Office Fédéral de l’Environnement: Bern, Switzerland, 2016; p. 100.
- Mölk, M.; Rieder, B. Rockfall Hazard Zones in Austria. Experience, Problems and Solutions in the Development of a Standardised Procedure. Geomech. Tunn. 2017, 10, 24–33. [Google Scholar] [CrossRef]
- DiBK. Regulations on technical requirements for construction works (TEK17) with guidance; Direktoratet for Byggkvalitet [Norwegian Building Authority]: Oslo, Norway, 2017; pp. 1–404.
- NVE. Veileder-Sikkerhet Mot Skred i Bratt Terreng-Kartlegging Av Skredfare i Reguleringsplan Og Byggesak; Norwegian Water Resources and Energy Directorate (NVE): Oslo, Norway, 2020.
- Frattini, P.; Crosta, G.B.; Carrara, A.; Agliardi, F. Assessment of Rockfall Susceptibility by Integrating Statistical and Physically-Based Approaches. Geomorphology 2008, 94, 419–437. [Google Scholar] [CrossRef]
- Noël, F. Cartographie Semi-Automatisée Des Chutes de Pierres Le Long d’infrastructures Linéaires. Master’s Thesis, Université Laval, Québec, QC, Canada, 2016. [Google Scholar]
- Dupire, S.; Toe, D.; Barré, J.-B.; Bourrier, F.; Berger, F. Harmonized Mapping of Forests with a Protection Function against Rockfalls over European Alpine Countries. Appl. Geogr. 2020, 120, 102221. [Google Scholar] [CrossRef]
- Kalsnes, B.; Solheim, A.; Sverdrup-Thygeson, K.; Dingsør-Dehlin, F.; Wasrud, J.; Indrevær, K.; Bergbjørn, K. Flom Og Skred-Sikringsbehov for Eksisterende Bebyggelse (FOSS): Beskrivelse Av Metodikk Og Resultater; NVE: Oslo, Norway, 2021; p. 89.
- Alvioli, M.; Santangelo, M.; Fiorucci, F.; Cardinali, M.; Marchesini, I.; Reichenbach, P.; Rossi, M.; Guzzetti, F.; Peruccacci, S. Rockfall Susceptibility and Network-Ranked Susceptibility along the Italian Railway. Eng. Geol. 2021, 293, 106301. [Google Scholar] [CrossRef]
- Alvioli, M.; De Matteo, A.; Castaldo, R.; Tizzani, P.; Reichenbach, P. Three-dimensional simulations of rockfalls in Ischia, Southern Italy, and preliminary susceptibility zonation. Geomat. Nat. Hazards Risk 2022, 13, 2712–2736. [Google Scholar] [CrossRef]
- Dorren, L.; Schaller, C.; Erbach, A.; Moos, C. Automated Delimitation of Rockfall Hazard Indication Zones Using High-Resolution Trajectory Modelling at Regional Scale. Geosciences 2023, 13, 182. [Google Scholar] [CrossRef]
- Pfeiffer, T.J.; Bowen, T.D. Computer Simulation of Rockfalls. Environ. Eng. Geosci. 1989, xxvi, 135–146. [Google Scholar] [CrossRef]
- Evans, S.G.; Hungr, O. The Assessment of Rockfall Hazard at the Base of Talus Slopes. Can. Geotech. J. 1993, 30, 620–636. [Google Scholar] [CrossRef]
- Raetzo, H.; Lateltin, O.; Bollinger, D.; Tripet, J.P. Hazard Assessment in Switzerland-Codes of Practice for Mass Movements. Bull. Eng. Geol. Environ. 2002, 61, 263–268. [Google Scholar] [CrossRef]
- Lambert, S.; Bourrier, F. Design of Rockfall Protection Embankments: A Review. Eng. Geol. 2013, 154, 77–88. [Google Scholar] [CrossRef]
- Lambert, S.; Toe, D.; Mentani, A.; Bourrier, F. A Meta-Model-Based Procedure for Quantifying the On-Site Efficiency of Rockfall Barriers. Rock Mech. Rock Eng. 2021, 54, 487–500. [Google Scholar] [CrossRef]
- Berger, F.; Corominas, J.; Lopez Carreras, C.; Brauner, M.; Kienholz, H.; Bartelt, P. Rock for Project-Efficiency of the Protective Function of Mountain Forest against Rockfall: Elements for Strategic Planning Tools Dedicated to a Forest Sustainable Mitigation against Rockfall; Centre National du Machinisme Agricole (CEMAGREF): Grenoble, France, 2004; p. 229. [Google Scholar]
- Garcia, B. Analyse Des Mécanismes d’Interaction Entre Un Bloc Rocheux et Un Versant de Propagation: Application à l’Ingénierie; Université Grenoble Alpes: Saint-Martin-d’Hères, France, 2019. [Google Scholar]
- C2ROP, A. participants of A. 3. 1 Benchmark Des Approches d’analyse Trajectographique Par Analyse Comparative de Simulations Prédictives et d’essais de Terrain. Rev. Fr. Géotech. 2020, 6, 12. [Google Scholar] [CrossRef]
- Domaas, U. Natural Rockfalls-Descriptions and Calculations; Norwegian Geotechnical Institute (NGI): Oslo, Norway, 1995. [Google Scholar]
- Descoeudres, F. Aspects Géomécaniques Des Instabilités de Falaises Rocheuses et Des Chutes de Blocs. Publ. Société Suisse Méc. Sols Roches 1997, 135, 3–11. [Google Scholar]
- Wyllie, D.C. Rock Fall Engineering: Development and Calibration of an Improved Model for Analysis of Rock Fall Hazards on Highways and Railways; The University of British Columbia: Vancouver, BC, Canada, 2014. [Google Scholar]
- Gerber, W. Naturgefahr Steinschlag-Erfahrungen Und Erkenntnisse; Eidg. Forschungsanstalt für Wald, Schnee und Landschaft WSL: Birmensdorf, Switzerland, 2019; Volume 74, p. 149. [Google Scholar]
- Caviezel, A.; Demmel, S.E.; Ringenbach, A.; Bühler, Y.; Lu, G.; Christen, M.; Dinneen, C.E.; Eberhard, L.A.; von Rickenbach, D.; Bartelt, P. Reconstruction of Four-Dimensional Rockfall Trajectories Using Remote Sensing and Rock-Based Accelerometers and Gyroscopes. Earth Surf. Dyn. 2019, 7, 199–210. [Google Scholar] [CrossRef]
- Noël, F.; Jaboyedoff, M.; Caviezel, A.; Hibert, C.; Bourrier, F.; Malet, J.-P. Rockfall Trajectory Reconstruction: A Flexible Method Utilizing Video Footage and High-Resolution Terrain Models. Earth Surf. Dyn. 2022, 10, 1141–1164. [Google Scholar] [CrossRef]
- Lambert, S.; Bourrier, F.; Toe, D. Improving Three-Dimensional Rockfall Trajectory Simulation Codes for Assessing the Efficiency of Protective Embankments. Int. J. Rock Mech. Min. Sci. 2013, 60, 26–36. [Google Scholar] [CrossRef]
- Dorren, L. Rockyfor3D (v5.2) Revealed-Transparent Description of the Complete 3D Rockfall Model; ecorisQ: Geneva, Switzerland, 2015; p. 31. [Google Scholar]
- Leine, R.I.; Schweizer, A.; Christen, M.; Glover, J.; Bartelt, P.; Gerber, W. Simulation of Rockfall Trajectories with Consideration of Rock Shape. Multibody Syst. Dyn. 2014, 32, 241–271. [Google Scholar] [CrossRef]
- Noël, F.; Nordang, S.F.; Jaboyedoff, M.; Travelletti, J.; Matasci, B.; Digout, M.; Vogel, A.; Mayoraz, R. Highly Energetic Rockfalls: Dataset of the 2015 Event from the Mel de La Niva, Switzerland. Zenodo 2023. [Google Scholar] [CrossRef]
- Lu, G.; Caviezel, A.; Christen, M.; Bühler, Y.; Bartelt, P. Modelling Rockfall Dynamics Using (Convex) Non-Smooth Mechanics. In Numerical Methods in Geotechnical Engineering IX; CRC Press: London, England, 2018; pp. 575–583. ISBN 978-1-138-33198-3. [Google Scholar]
- Corominas, J. The Angle of Reach as a Mobility Index for Small and Large Landslides. Can. Geotech. J. 1996, 33, 260–271. [Google Scholar] [CrossRef]
- Holmgren, P. Multiple Flow Direction Algorithms for Runoff Modelling in Grid Based Elevation Models: An Empirical Evaluation. Hydrol. Process. 1994, 8, 327–334. [Google Scholar] [CrossRef]
- Quinn, P.; Beven, K.; Chevallier, P.; Planchon, O. The Prediction of Hillslope Flow Paths for Distributed Hydrological Modelling Using Digital Terrain Models. Hydrol. Process. 1991, 5, 59–79. [Google Scholar] [CrossRef]
- Gamma, P. Dfwalk-Ein Murgang Simulationsprogramm Zur Gefahrenzonierung. 2000. Available online: https://worldcat.org/title/80872939 (accessed on 23 February 2021).
- Cloutier, C.; Locat, J.; Mayers, M.; Noël, F.; Jacob, C.; Dorval, P.; Bossé, F.; Gionet, P.; Jaboyedoff, M. An Integrated Management Tool for Rockfall Evaluation along Transportation Corridors: Description and Objectives of the ParaChute Research Project. In Proceedings of the Conférence Canadienne de Géotechnique GEOQuébec 2015, Québec, QC, Canada, 20–23 September 2015; p. 7. [Google Scholar]
- Cloutier, C.; Turmel, D.; Mayers, M.; Noël, F.; Locat, J. Projet ParaChute: Développement d’un Outil de Gestion Intégrée Des Chutes de Pierres Le Long d’infrastructures Linéaires; Université Laval: Québec, QC, Canada, 2017; p. 213. [Google Scholar]
- Corominas, J.; Copons, R.; Moya, J.; Vilaplana, J.M.; Altimir, J.; Amigó, J. Quantitative Assessment of the Residual Risk in a Rockfall Protected Area. Landslides 2005, 2, 343–357. [Google Scholar] [CrossRef]
- Agliardi, F.; Crosta, G.B. High Resolution Three-Dimensional Numerical Modelling of Rockfalls. Int. J. Rock Mech. Min. Sci. 2003, 40, 455–471. [Google Scholar] [CrossRef]
- Crosta, G.B.; Agliardi, F. Parametric Evaluation of 3D Dispersion of Rockfall Trajectories. Nat. Hazards Earth Syst. Sci. 2004, 4, 583–598. [Google Scholar] [CrossRef]
- EG4 Risk HY-STONE. Available online: http://www.eg4risk.com/en/home-page/ (accessed on 24 April 2022).
- Matas, G.; Lantada, N.; Corominas, J.; Gili, J.A.; Ruiz-Carulla, R.; Prades, A. RockGIS: A GIS-Based Model for the Analysis of Fragmentation in Rockfalls. Landslides 2017, 14, 1565–1578. [Google Scholar] [CrossRef]
- Abbruzzese, J.M.; Labiouse, V. New Cadanav Methodology for Rock Fall Hazard Zoning Based on 3D Trajectory Modelling. Geosciences 2020, 10, 434. [Google Scholar] [CrossRef]
- Lan, H.; Derek Martin, C.; Lim, C.H. RockFall Analyst: A GIS Extension for Three-Dimensional and Spatially Distributed Rockfall Hazard Modeling. Comput. Geosci. 2007, 33, 262–279. [Google Scholar] [CrossRef]
- QGIS. Development Team QGIS Geographic Information System. 2023. Available online: https://qgis.org/en/site/ (accessed on 5 January 2023).
- MEZAP Group. MEZAP Technical Guide. Caractérisation de l’aléa Rocheux Dans Le Cadre d’un Plan de Prévention Des Risques Naturels (PPRn) Ou d’un Porter à Connaissance (PAC); BRGM: Orléans, France, 2021. [Google Scholar]
- Dorren, L.K.A. Rockfall and Protection Forests–Models, Experiments and Reality; Universität für Bodenkultur: Bern, Switzerland, 2008. [Google Scholar]
- Leine, R.I.; Capobianco, G.; Bartelt, P.; Christen, M.; Caviezel, A. Stability of Rigid Body Motion through an Extended Intermediate Axis Theorem: Application to Rockfall Simulation. Multibody Syst. Dyn. 2021, 52, 431–455. [Google Scholar] [CrossRef]
- Jarsve, K.T. Uncertainties of Simulating Rockfalls and Debris Flows Using RAMMS; University of Oslo: Oslo, Norway, 2018. [Google Scholar]
- Žabota, B.; Kobal, M. A New Methodology for Mapping Past Rockfall Events: From Mobile Crowdsourcing to Rockfall Simulation Validation. ISPRS Int. J. Geo-Inf. 2020, 9, 514. [Google Scholar] [CrossRef]
- Scavia, C.; Barbero, M.; Castelli, M.; Marchelli, M.; Peila, D.; Torsello, G.; Vallero, G. Evaluating Rockfall Risk: Some Critical Aspects. Geosciences 2020, 10, 98. [Google Scholar] [CrossRef]
- Castelli, M.; Torsello, G.; Vallero, G. Preliminary Modeling of Rockfall Runout: Definition of the Input Parameters for the QGIS Plugin QPROTO. Geosciences 2021, 11, 88. [Google Scholar] [CrossRef]
- Ushiro, T.; Tsutsui, H. Movement of Rockfall and a Study on Its Prediction. In Proceedings of the International Symposium on Geotechnical & Environmental Challenges in Mountainous Terrain, Kathmandu, Nepal, 6–7 November 2001; pp. 366–375. [Google Scholar]
- Dorren, L.K.A.; Berger, F. Stem Breakage of Trees and Energy Dissipation during Rockfall Impacts. Tree Physiol. 2006, 26, 63–71. [Google Scholar] [CrossRef] [PubMed]
- Caviezel, A.; Ringenbach, A.; Demmel, S.E.; Dinneen, C.E.; Krebs, N.; Bühler, Y.; Christen, M.; Meyrat, G.; Stoffel, A.; Hafner, E.; et al. The Relevance of Rock Shape over Mass—Implications for Rockfall Hazard Assessments. Nat. Commun. 2021, 12, 5546. [Google Scholar] [CrossRef] [PubMed]
- Caviezel, A.; Demmel, S.E.; Bühler, Y.; Ringenbach, A.; Christen, M.; Bartelt, P. Induced Rockfall Dataset #2 (Chant Sura Experimental Campaign), Flüelapass, Grisons, Switzerland. EnviDat 2020. [Google Scholar] [CrossRef]
- Ringenbach, A.; Bebi, P.; Bartelt, P.; Rigling, A.; Christen, M.; Bühler, Y.; Stoffel, A.; Caviezel, A. Modeling Deadwood for Rockfall Mitigation Assessments in Windthrow Areas. Earth Surf. Dyn. 2022, 10, 1303–1319. [Google Scholar] [CrossRef]
- Noël, F. StnParabel. Available online: https://stnparabel.org/ (accessed on 28 April 2022).
- Labiouse, V.; Heidenreich, B. Half-Scale Experimental Study of Rockfall Impacts on Sandy Slopes. Nat. Hazards Earth Syst. Sci. 2009, 9, 1981–1993. [Google Scholar] [CrossRef]
- Glover, J.M.H. Rock-Shape and Its Role in Rockfall Dynamics; Durham University: Durham, UK, 2015. [Google Scholar]
- Paronuzzi, P. Rockfall-Induced Block Propagation on a Soil Slope, Northern Italy. Environ. Geol. 2009, 58, 1451–1466. [Google Scholar] [CrossRef]
- Prades-Valls, A.; Corominas, J.; Lantada, N.; Matas, G.; Núñez-Andrés, M.A. Capturing Rockfall Kinematic and Fragmentation Parameters Using High-Speed Camera System. Eng. Geol. 2022, 302, 106629. [Google Scholar] [CrossRef]
- Hibert, C.; Noël, F.; Toe, D.; Talib, M.; Desrues, M.; Wyser, E.; Brenguier, O.; Bourrier, F.; Toussaint, R.; Malet, J.-P.; et al. Machine Learning Prediction of the Mass and the Velocity of Controlled Single-Block Rockfalls from the Seismic Waves They Generate. Earth Surf. Dyn. 2022. Available online: https://doi.org/10.5194/egusphere-2022-522 (accessed on 23 September 2022). [CrossRef]
- Volkwein, A.; Klette, J. Semi-Automatic Determination of Rockfall Trajectories. Sensors 2014, 14, 18187–18210. [Google Scholar] [CrossRef]
- Kneib, F.; Bourrier, F.; Toe, D.; Berger, F. PlatRock. Available online: http://platrock.org/ (accessed on 3 May 2023).


| Flow-R 2.0.9 | ||||||||||||
| 1: Michoud et al. [15] | 2: Scenario 2 | 3: Scenario 3 | ||||||||||
| Reach Angle | 33° | 31° | 25° | |||||||||
| Pseudo velocity cutoff | ∞ | ∞ | 30 m s−1 | |||||||||
| Rockyfor3D 5.2.15 | ||||||||||||
| Slope | 1: Rapid automatic sim. | 2: Rough | 3: Rougher | |||||||||
| [°] | Soil type | Rg70 | Rg20 | Rg10 | Soil type | Rg70 | Rg20 | Rg10 | Soil type | Rg70 | Rg20 | Rg10 |
| 0–15 | 1 | 0.01 | 0.01 | 0.01 | 1 | 0.01 | 0.05 | 0.1 | 1 | 0.01 | 0.05 | 0.1 |
| 15–25 | 2 | 0.01 | 0.01 | 0.01 | 3 | 0.3 | 0.5 | 2 | 3 | 0.3 | 0.5 | 2 |
| 25–35 | 3 | 0.05 | 0.05 | 0.05 | 3 | 0.3 | 0.5 | 2 | 3 | 0.5 | 1 | 3 |
| 35–45 | 4 | 0.05 | 0.05 | 0.1 | 4 | 1 | 2 | 4 | 4 | 1 | 2 | 4 |
| 45–52 | 4 | 0.05 | 0.05 | 0.1 | 5 | 0 | 0.05 | 0.1 | 5 | 0 | 0.05 | 0.1 |
| 52–90 | 6 | 0 | 0 | 0 | 5 | 0 | 0.05 | 0.1 | 5 | 0 | 0.05 | 0.1 |
| RAMMS::ROCKFALL 1.6.70 | ||||||||||||
| Slope | 1: Lu et al. [49] | 2: Harder | 3: Harder (ellipsoid) | |||||||||
| [°] | Block 2 shape, 100 m3 | Block 2 shape, 100 m3 | Block 2 ellipsoid, 100 m3 | |||||||||
| 0–15 | Medium-hard | Medium | Medium | |||||||||
| 15–25 | Medium-hard | Medium-hard | Medium-hard | |||||||||
| 25–35 | Medium-hard | Hard | Hard | |||||||||
| 35–90 | Medium-hard | Extra-hard | Extra-hard | |||||||||
| Observation Type | Number | Shape | Volume or Mass | Lateral Deviation | Source |
|---|---|---|---|---|---|
| 2015 Mel de la Niva rockfall event | 2 blocks (largest) | Moderately to very flat and slightly elongated | ~200 m3, ~500 t | ±19° | Noël et al. [1] |
| Rockfall event | 2 rocks | Not flat, not elongated, ~ellipsoidal, d1 of 1.6 m and 2.5 m | ~1.4 m3 for the first rock, ~3750 kg and ~5600 kg | ±3.5° | Wyllie [41] |
| Full-scale forested experiment | 69 rocks | Natural and artificial rocks | 69 rocks, 16–200 kg | ±30°; 93% in ±15° | Ushiro and Tsutsui [71] |
| Full-scale forested and non-forested experiment | 218 rocks | Not flat, not elongated, ~spherical, mean d1 of 0.95 m | 0.1 to 1.5 m3 280 to 4200 kg | ±15° | Dorren and Berger [72] |
| Full-scale experiment with reinforced concrete rocks | 178 rocks | Not or moderately flat, not elongated | 45 to 2670 kg (All rocks) | ±19°; 94% in ±15° | Caviezel et al. [73] |
| 22 rocks | Not flat, not elongated | 45 kg | ±16° | ||
| 28 rocks | Not flat, not elongated | 200 kg | ±12° | ||
| 43 rocks | Not flat, not elongated | 800 kg | ±14° | ||
| 16 rocks | Not flat, not elongated | 2670 kg | ±7° | ||
| 4 rocks | Moderately flat, not elongated | 45 kg | ±3° | ||
| 23 rocks | Moderately flat, not elongated | 200 kg | ±15° | ||
| 23 rocks | Moderately flat, not elongated | 800 kg | ±16° | ||
| 19 rocks | Moderately flat, not elongated | 2670 kg | ±18° |
Disclaimer/Publisher’s Note: The statements, opinions and data contained in all publications are solely those of the individual author(s) and contributor(s) and not of MDPI and/or the editor(s). MDPI and/or the editor(s) disclaim responsibility for any injury to people or property resulting from any ideas, methods, instructions or products referred to in the content. |
© 2023 by the authors. Licensee MDPI, Basel, Switzerland. This article is an open access article distributed under the terms and conditions of the Creative Commons Attribution (CC BY) license (https://creativecommons.org/licenses/by/4.0/).
Share and Cite
Noël, F.; Nordang, S.F.; Jaboyedoff, M.; Digout, M.; Guerin, A.; Locat, J.; Matasci, B. Comparing Flow-R, Rockyfor3D and RAMMS to Rockfalls from the Mel de la Niva Mountain: A Benchmarking Exercise. Geosciences 2023, 13, 200. https://doi.org/10.3390/geosciences13070200
Noël F, Nordang SF, Jaboyedoff M, Digout M, Guerin A, Locat J, Matasci B. Comparing Flow-R, Rockyfor3D and RAMMS to Rockfalls from the Mel de la Niva Mountain: A Benchmarking Exercise. Geosciences. 2023; 13(7):200. https://doi.org/10.3390/geosciences13070200
Chicago/Turabian StyleNoël, François, Synnøve Flugekvam Nordang, Michel Jaboyedoff, Michael Digout, Antoine Guerin, Jacques Locat, and Battista Matasci. 2023. "Comparing Flow-R, Rockyfor3D and RAMMS to Rockfalls from the Mel de la Niva Mountain: A Benchmarking Exercise" Geosciences 13, no. 7: 200. https://doi.org/10.3390/geosciences13070200
APA StyleNoël, F., Nordang, S. F., Jaboyedoff, M., Digout, M., Guerin, A., Locat, J., & Matasci, B. (2023). Comparing Flow-R, Rockyfor3D and RAMMS to Rockfalls from the Mel de la Niva Mountain: A Benchmarking Exercise. Geosciences, 13(7), 200. https://doi.org/10.3390/geosciences13070200