Article

Automated Delimitation of Rockfall Hazard Indication Zones Using High-Resolution Trajectory Modelling at Regional Scale

School of Agricultural, Forest and Food Sciences BFH—HAFL, Bern University of Applied Sciences, 3052 Zollikofen, Switzerland
*
Author to whom correspondence should be addressed.
Geosciences 2023, 13(6), 182; https://doi.org/10.3390/geosciences13060182
Submission received: 6 March 2023 / Revised: 9 June 2023 / Accepted: 13 June 2023 / Published: 16 June 2023
(This article belongs to the Special Issue Rockfall Protection and Mitigation)

Abstract

:
The aim of this study was to delimit potential rockfall propagation zones based on simulated 2 m resolution rockfall trajectories using Rockyfor3D for block volume scenarios ranging from 0.05–30 m3, with explicit inclusion of the barrier effect of standing trees, for an area of approx. 7200 km2 in Switzerland and Liechtenstein. For the determination of the start cells, as well as the slope surface characteristics, we used the terrain morphology derived from a 1 m resolution digital terrain model, as well as the topographic landscape model geodataset of swisstopo and information from geological maps. The forest structure was defined by individual trees with their coordinates, diameters, and tree type (coniferous or broadleaved). These were generated from detected individual trees combined with generated trees on the basis of statistical relationships between the detected trees, remote sensing-based forest structure type definitions, and stem numbers from field inventory data. From the simulated rockfall propagation zones we delimited rockfall hazard indication zones (HIZ), as called by the practitioners (because they serve as a basis for the Swiss hazard index map), on the basis of the simulated reach probability rasters. As validation, 1554 mapped past rockfall events were used. The results of the more than 89 billion simulated trajectories showed that 94% of the mapped silent witnesses could be reproduced by the simulations and at least 82% are included in the delimited HIZ.

1. Introduction

Worldwide, residential areas and infrastructure that are built downslope from steep rock faces are threatened by rockfall hazards [1]. Rockfall is a general term which covers the release from rock faces and subsequent downslope movement of fragmented rock materials ranging from one or several particles following ballistic trajectories to millions of m3 constituting granular flow type movements. More precise definitions of the different types of rockfall can be found in [2]. The total damage caused by rockfall in Switzerland is much lower than that caused by floods (responsible for 88% of the total registered damage in the Swiss flood and landslide damage database), debris flows and landslides [3] since rockfall processes only cause very localised damage, whereas floods affect large areas. However, rockfall processes are much more significant regarding fatalities (22% of all fatalities related to natural hazards, [4]). Further analysis of the database presented in [3] showed that, between 2002 and 2016, 69% of the registered events are defined as particle fall and blockfall (fall of single blocs with an average dimension regarding height, width, and depth up to 0.5 m and larger than 0.5 m up to 4.6 m, respectively) [5]. Here it is important to mention that both types of rockfall can be the secondary result of a rock mass fall (i.e., volumes larges than 100 m3), which accounted for 31% of the events and the remaining 1% is bergsturz (volumes > 1 million m3) [5]. On road infrastructure, when accounting for indirect costs due to closure, rockfall causes the highest damage costs compared to other natural hazards [6].
The data on damage and loss presented above underpin the importance of the integrated risk management (IRM) strategy of Switzerland [7], which also applies to rockfall processes. The IRM strategy consists of three main, equally important, phases, being (1) response, (2) recovery and (3) preparedness. Prevention measures are part of the latter and can be prioritised in the following order:
  • Avoiding rockfall hazards using spatial planning based on hazard maps [8,9];
  • Biological measures (i.e., protection forests, [10,11]);
  • Technical/structural measures, such as rockfall dams [12] and flexible nets [13,14];
  • Organisational measures which can include rock scaling, i.e., cleaning [15,16,17], or monitoring of cliff faces [18,19] and subsequent closure or evacuation of the underlying damage potential.
Hazard maps not only form the basis for spatial planning, they also serve for setting priorities for object protection [20] and, in many cases for flood hazard management but not exclusively, for planning evacuation and rescue operations in residential areas [21]. In Switzerland and most other Alpine countries, hazard maps are generally produced by natural hazard consultancy firms for single hazard zones at communal scale or even smaller areas (single slopes), combining historical records, field surveys, terrain analysis, forest information, and numerical modelling [22]. The Swiss approach behind the creation of hazard maps combines the probability of occurrence (i.e., return period) of an event with its magnitude (called intensity; see [23]). Generally, Swiss hazard maps are only available for residential areas since they are costly to produce, especially for large communes. As an example, for the canton of Grisons (GR) in Switzerland, 10% of the area is covered by hazard maps [24].
In Switzerland, the the so-called hazard index map (cf. [23]) provides information in the areas that are not covered by the hazard maps and therefore serves as a complementary information source. The hazard index map shows the potential propagation areas of a given natural hazard process for entire regions, both in and outside residential areas. These maps, which are called susceptibility maps in the international literature (cf. [20,25,26], traditionally contain model-based estimates of the maximum propagation of an event of a given return period. Usually, they do not contain any information about the magnitudes, which, in the case of rockfall, is mostly expressed in the kinetic energies that occur within the propagation areas. Rockfall hazard index maps are generally created with simple modelling approaches, such as the energy line (also often referred to as geometric methods) [8,27,28,29] or other GIS-based approaches [30]. A first country wide rockfall hazard index map for Switzerland was generated using such a geometric method during the SilvaProtect-CH project, which served as a basis for a country-wide objective and uniform zoning of rockfall protection forests [31]. Although the SilvaProtect-CH data have been used widely in the Swiss hazard practice to complement the hazard maps in areas where no other information was available, they no longer meet the current requirements regarding quality and detail since the forest effect was not included in the modelling, the modelling was based on rasters with 10 m cellsize and only one block size (1 m3) was simulated. Therefore, we developed and tested an objective, automated, simulation-based methodology to produce zones that are susceptible to rockfall propagation and this for different block volumes, with and without the protective effect of forests. Although the return periods of the simulated block volumes are unknown for the large majority of the covered release areas in our study area, the produced zones are based on simulated reach probabilities and contain information on the simulated kinetic energies and passing heights. Therefore, we chose to define the resulting zones of our study as “hazard indication zones” (HIZ), since they provide indicative information on the intensity and partly on occurrence probability. In this paper, we present the developed methodology and assess the quality of the results using field mapped silent witnesses (i.e., past events; PE) provided by the offices responsible for rockfall hazard management in the study area.

2. Materials and Methods

2.1. Study Area

The study area covers the country of Liechtenstein (FL, officially the Principality of Liechtenstein) which has an area of 158 km2 and the Swiss canton of Grisons (GR), which has a total area of 7105 km2. Liechtenstein is situated in the Upper Rhine valley of the European Alps and is bordered to the east by the Austrian state of Vorarlberg, to the south by GR (see Figure 1). The Rhine river forms the entire western border of Liechtenstein. The highest point of Liechtenstein is the Grauspitz which has an altitude of 2599 m above sea level (a.s.l.). Liechtenstein lies entirely in the Rätikon, a mountain range that forms the geological border between the Eastern and Western Alps. The Rätikon mainly consist of sedimentary rocks (for a large part limestone), where the northern part is assigned to the Northern Limestone Alps, while the Southern part belongs to the Bündner Schist Nappe of the Western Alps, which runs towards the south-west into GR. The highest point of GR is the Piz Bernina (4049 m a.s.l.), which consists of Diorite and is part of a sub-Austroalpine nappe consisting of cristalline rocks. Further important tectonic zones and nappes in GR include the Aar- and Gotthardmassif, which consists of material from the original European tectonic plate (gneisses, schists, and amphibolites), and penninic nappes, which contain a wide range of rock varieties, such as sandstones, dolomites, as well as high grade metamorphic rocks, such as gneisses and slates. Both in GR and FL, Flysch type deposits are found. The presented details on the geology originate from [32,33]. The majority of the study area can be defined as steep mountainous terrain in which the protection of residential areas and infrastructure against rockfall and other natural hazards, not only for the local inhabitants but also for the many tourists that visit the area, is a challenging task [22]. The population in GR amounts to 202,509 (in 2022, i.e., 28.5 inhabitants km−2), in FL this amounts to 39,379 (in 2022, i.e., 249 inhabitants km−2).

2.2. Rockfall Trajectory Modelling

We used the probabilistic, process-based rockfall model Rockyfor3D (v5.2.15—for details on the algorithms and its development history see [34]) to simulate the propagation trajectories of individual blocks in three dimensions. Rockyfor3D evolved from the rockfall trajectory models presented in [30] and its development profited enormously from observations in the field (cf. [35]) and data from full-scale rockfall experiments presented in [36,37]. Rockyfor3D uses raster maps describing topography (Digital Elevation Model—DEM), rockfall source cells, the mechanical properties of the surface material and the slope surface roughness. Rockyfor3D considers flying and bouncing (rebounds on the surface) phases to simulate a rockfall trajectory. The main output of RockyFor3D used for this study consists of a raster map containing information on the reach probability (see Section 2.4). Rockyfor3D has been used in many case studies covering from local to national scale (e.g., [38,39,40,41,42]), but in this study we applied it for the first time to an area of more than 7000 km2, with 2 × 2 m cellsize input data and integrating detailed tree positions.
To do so, we divided the entire study area into 668 tiles, on the basis of watersheds, which covered on average an area of 22.3 km2 (min. area = 1.1 km2; max. area = 99.8 km2). All tiles overlapped the neighbouring ones with 50 m. The simulations were carried out per tile and the final result rasters were merged into single mosaics using a maximum value criterion.

2.2.1. Input Data: Topography, Source Areas and Block Scenarios

The simulations in RockyFor3D were run using the digital terrain model (DTM) SwissALTI3D from 2020 [43]. The original rasters which had a cell size of 0.5 × 0.5 m were aggregated to 2 m resolution for each simulation tile based on the arithmetic mean, whereby averaging the elevation of 16 0.5 m source cells per 2 m cell. Experience in the studies cited above showed that Rockyfor3D provides results that fit best to observed rockfall events if a DTM with 2 m resolution is used. The source areas for the simulated trajectories, represented by start cells in a raster, were determined based on a slope angle of ≥ 55 (cf., [28,44]) for cells classified as “rock”, “loose rock”, or “forest” in the Swiss Topographic Landscape Model (TLM). Thereby, the slope angle was calculated using the original swissALTI3D terrain model with the 0.5 m resolution and then aggregated to 2 m resolution using a maximum function to ensure that we captured small rock outcrops in the first step. We then selected the top row of all release areas based on a flow accumulation analysis in GIS—all remaining start cells had a flow accumulation value of 0. This was performed (1) to reduce the bias of the number release cells of flatter release areas (50 –60 ,) in comparison to the underrepresented number of start cell in semi-vertical rock faces in the DEM and (2) to reduce the total number of start cells. To avoid solitary start cells, we identified coherent start cell groups based on 8-connectivity and deleted groups with an area <8 m2 (i.e., unconnected 2 m resolution start cells). Additionally, we eliminated start cells next to roads, railways, and rivers since they were judged as mainly belonging to human-made structures, such as road embankments.
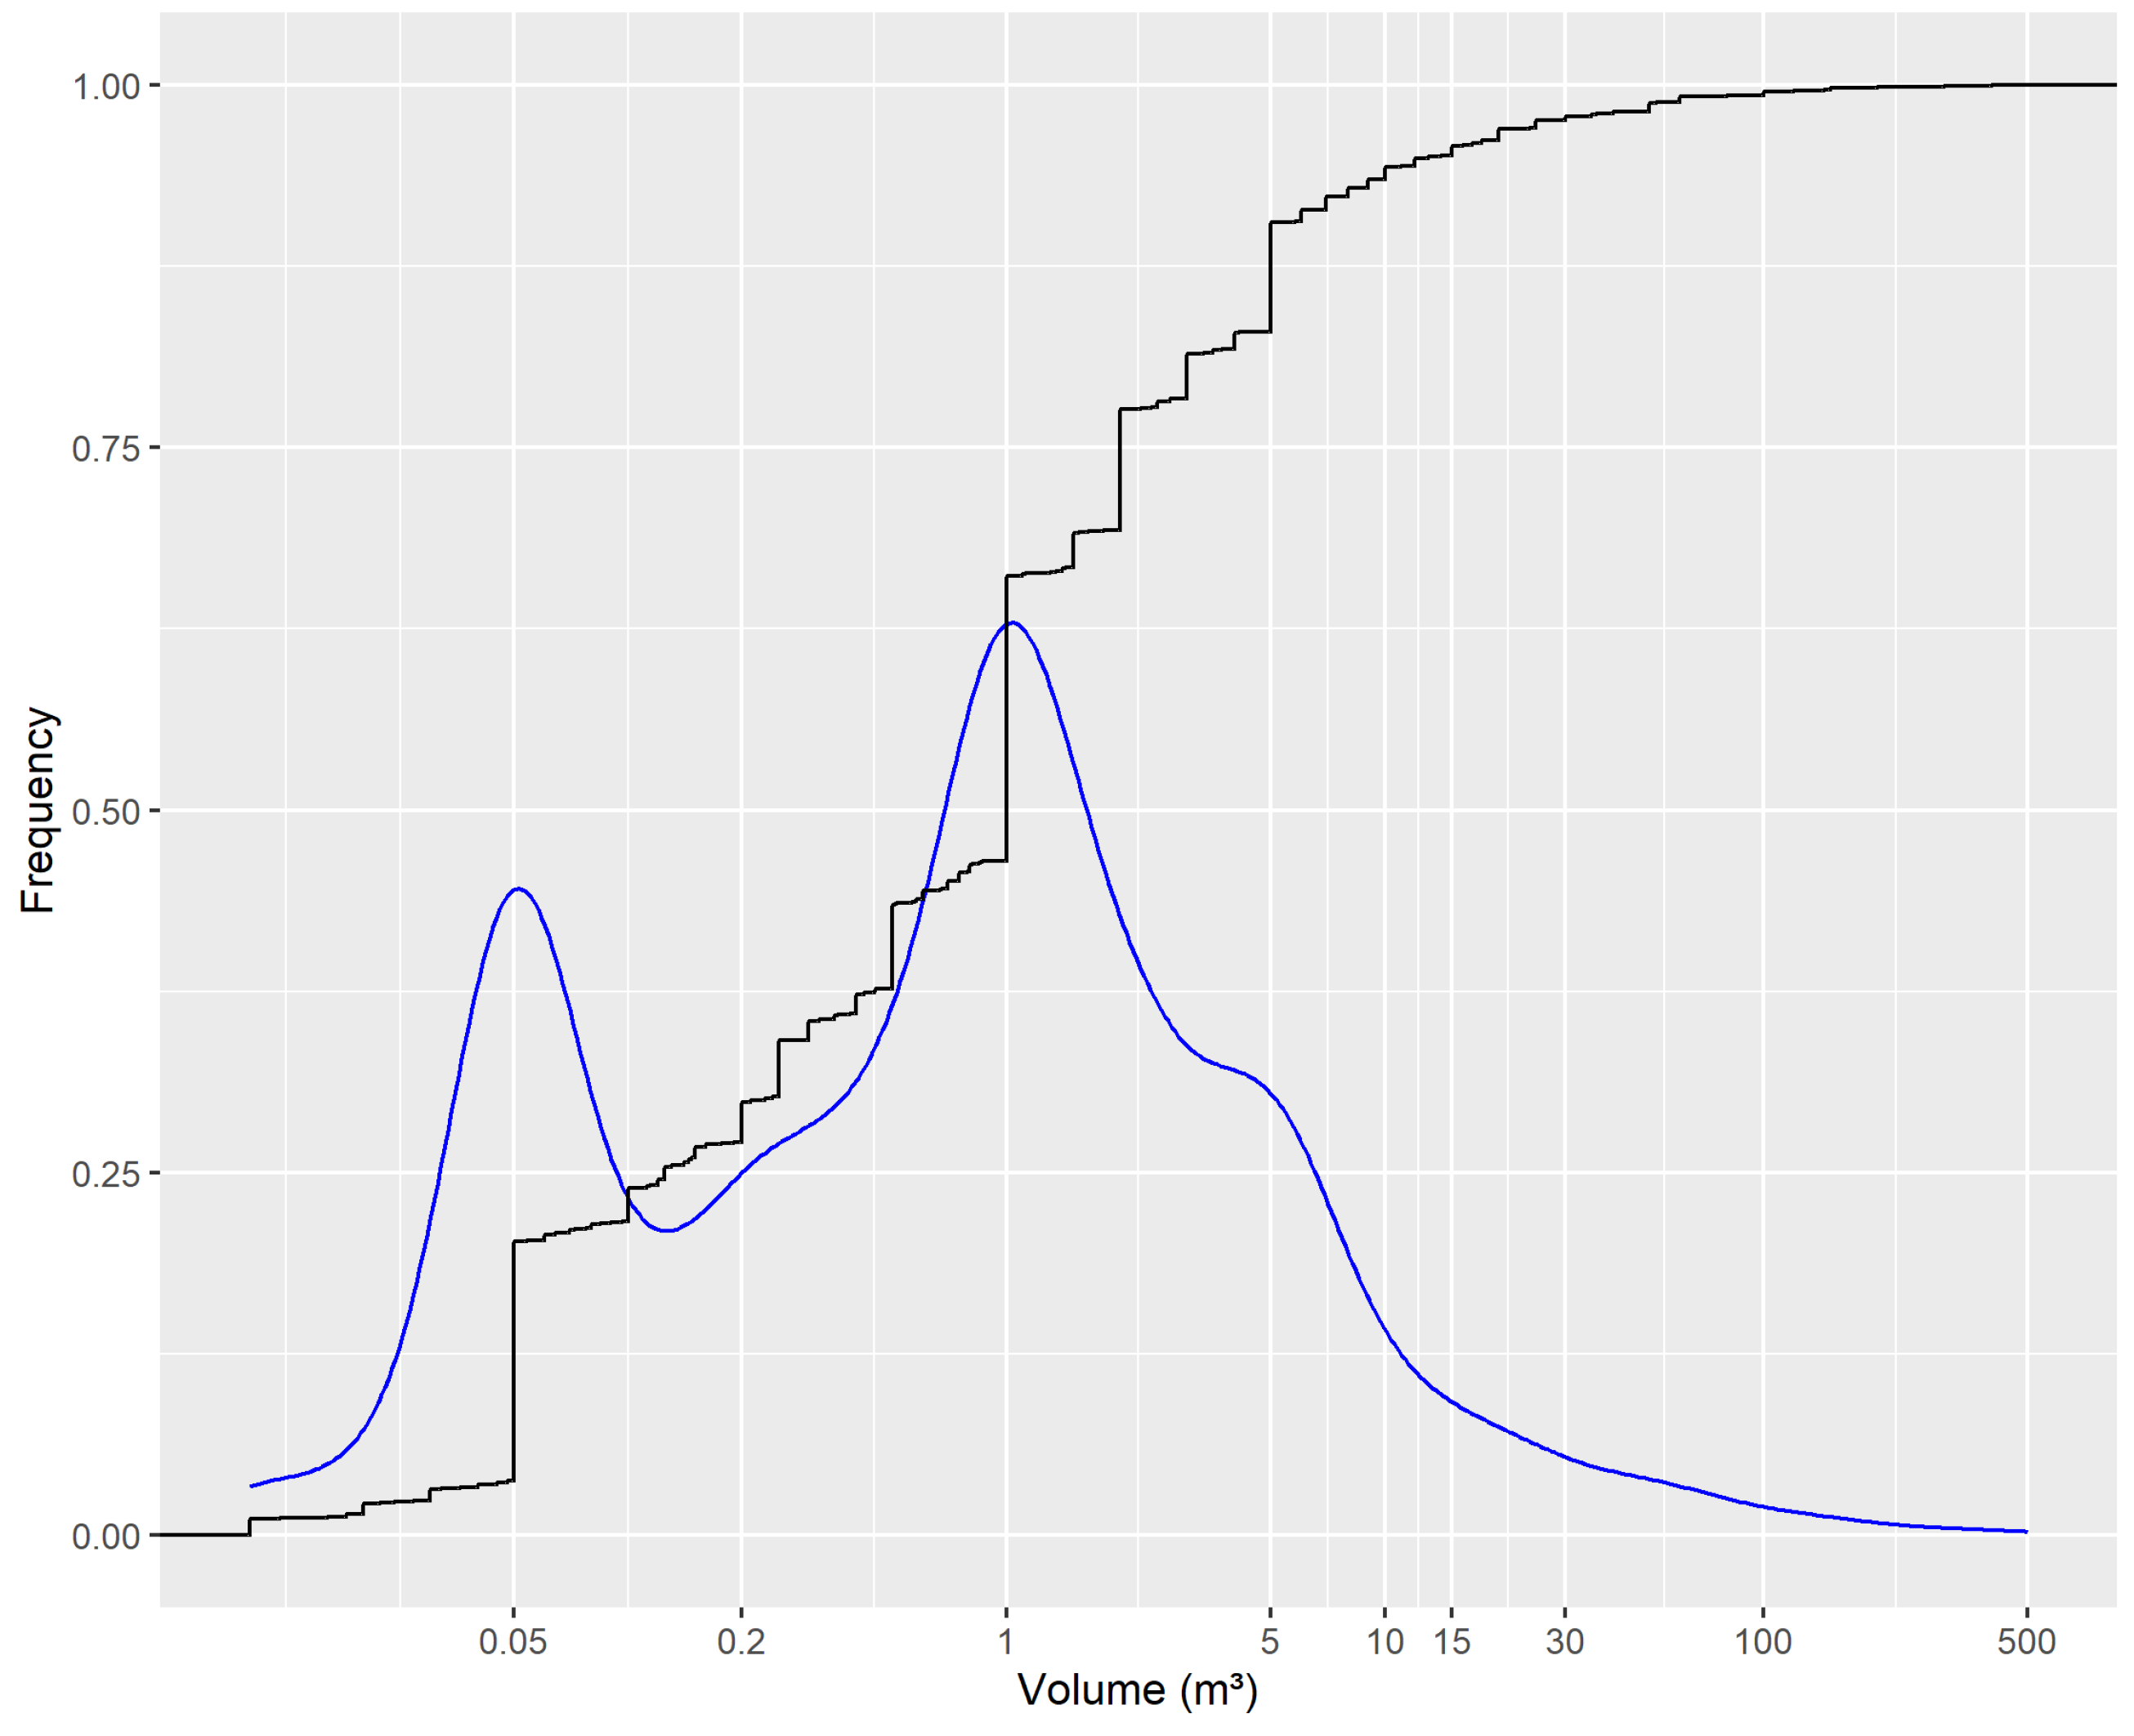
For each start cell, the trajectories of 100 individual rocks were simulated for each forest scenario (with and without trees) and for each block volume scenario, which included the following volumes: 0.05, 0.2, 0.5, 1, 5, and 10, 15 and 30 m3. These volumes were decided upon in collaboration with the persons responsible for rockfall hazard management in GR and FL, since they cover well the distribution of the registered volumes of the PE (cf. Figure 2), even though larger volumes of single blocks were observed.
Rockyfor3D allows for simulating rectangular and ellipsoidal shape rocks, where the exact simulated shape and volume is defined by three dimensions [34]. An ellipsoidal block shape with three identical dimensions results in a sphere. In case that one of the dimensions is smaller than 1/3 of the other two, a disc-shaped block is simulated. Explicit modelling of very detailed rock shapes is not possible. Since, firstly, the block shapes of the registered PE were not known and, secondly, we needed a systematic approach for the entire study area, we decided to use a cube as the block shape for all the simulations. This is because the behaviour of a cube in Rockyfor3D is closest to the polyhedron defined in [45]. The moment of inertia (I) of a cube-shaped block in Rockyfor3D is calculated as the following
I = m · d 2 6
where, m is the block mass (in kg) and d is the dimension (height = width = depth) of the block (in m).
This finally resulted in approx. 850,000 and 55 million start cells for FL and GR, respectively. With 100 simulated trajectories per start cell. In total, at least 89 billion trajectory simulations were carried out. The simulations were carried out on a Dell PowerEdge R640 server with two Intel Xeon Gold 6152 CPU (total 44 cores) and 448 GB memory. To simulate all block volumes and forest scenarios for all tiles took in total 4 days.

2.2.2. Input Data: Slope Material Characteristics

In Rockyfor3D, the dampening effect (represented by the normal coefficient of restitution; R n ) of the impacted slope material during a rebound is determined by eight soil types:
  • S o i l t y p e 0 = River, or swamp, or material in which a rock could penetrate completely ( R n = 0);
  • S o i l t y p e 1 = Fine soil material (depth > 100 cm; R n = 0.21–0.25);
  • S o i l t y p e 2 = Fine soil material (depth < 100 cm), or sand/gravel mix in the valley ( R n = 0.30–0.36);
  • S o i l t y p e 3 = Scree (material fragments with a mean diameter (Ø) < ~10 cm), or medium compact soil with small rock fragments, or forest road ( R n = 0.34–0.42);
  • S o i l t y p e 4 = Talus slope (material fragments with Ø > ~10 cm), or compact soil with large rock fragments ( R n = 0.39–0.47);
  • S o i l t y p e 5 = Bedrock with thin weathered material or soil cover ( R n = 0.21–0.25);
  • S o i l t y p e 6 = Bedrock ( R n = 0.48–0.58);
  • S o i l t y p e 7 = Asphalt road ( R n = 0.32–0.39).
These R n -value ranges originate from earlier work described by [46,47,48] and were applied as such in all Rockyfor3D-based studies cited before. At each impact the R n value is randomly chosen, following a uniform distribution, from the defined range corresponding to the S o i l t y p e defined for the respective raster cell. R n not only defines the reduction in the normal component of the kinetic energy of the simulated block, it also determines the density ρ (in kg·m3) of the underground material at the location of the rebound, following
ρ = 1200 · l n ( R n ) · 3300
as well as its indentation resistance R i (in MPa):
R i = 55 · 10 9 · R n 7
Both parameters affect the calculated penetration depth ( D p ) of the block during each impact (cf. [34,49]). The most impact factor determining the tangential energy loss is the surface roughness, which is represented by three raster maps (Rg70, Rg20, and Rg10; cf. [37]) with values between 0 and 100 m. These values represent deposited rocks and rock fragments covering the slope surface, which form “obstacles” for the falling block, and are defined as the “mean obstacle height” (given in m) that a falling block encounters in resp. 70%, 20%, and 10% of the cases during a rebound in a specific cell. The surface roughness does not change the geometry of the slope. The random chosen value (out of the three raster values with corresponding probabilities) for the roughness R g , in combination with the D p and its ratio to the radius of the simulated block R, determines the tangential coefficient of restitution ( R t ) at each impact following:
R t = 1 1 + ( R g + D p ) / R
In this study, the values for the Rg70, Rg20, Rg10, and soil-type rasters were determined by means of a general classification of the slope material characteristics based on geological, land cover, and topographical data (Table 1). Hereby, the surface roughness was represented based on four classes defined in Table 2.
Table 1 shows the data used for the terrain classification (Slope = slope derived from swissALTI3D with either 0.5 or 2 m resolution; TLM = topographic landscape model from Swisstopo; Flowacc = FlowAccumulation derived from swissALTI3D aggregated to 2 m; Geocover = geological vector datasets from Swisstopo), as well as the attributed roughness classes and the Soiltype values. The priority rules the importance of the layer in comparison to the others, i.e., the layer with priority 1 lies on top, priority 18 only plays a role where there is no information from the other datasources.

2.2.3. Input Data: Forest

To represent the forest, the model uses positions, tree-type (coniferous or braodleaved), and DBH (diameter at breast height) of individual trees to calculate energy loss during impacts against trees [37]. The tree positions are derived from airborne laser scanning (ALS)-based vegetation height models using individual tree detection algorithms and randomly generated trees within detailed forest polygons on the basis of forest inventory data. As such, Rockyfor3D can explicitly calculate the trajectory deviation and energy loss after impacts with trees depending on the tree DBH and tree type (coniferous or broadleaved), the horizontal and vertical impact position and angle on the stem, and the kinetic energy of the rock before the impact [34]. The model calculates if the tree is broken by the block, i.e., the kinetic energy of the block is higher than the amount of energy that can be dissipated by the tree. If so, there is no change of the fall direction of the block, if not, deviation takes place. The Rockyfor3D model considers a block to have stopped if its velocity is less than 0.5 m.s−1 after an impact on the ground, independent if the block impacted a tree just before or not. Therefore, if all kinetic energy of the block can be dissipated by a tree, the model simulates the block falling from the impact position down to the ground vertically along the tree stem.
The tree type is required by Rockyfor3D in the form of a grid indicating the coniferous proportion per cell in percent. The final type of a tree used in the energy loss algorithm is assigned using a random function based on the coniferous proportion in the respective cell—if the coniferous proportion in a given cell i is x%, then the random function, which is reactivated during every single tree impact, defines a broadleaved tree if the randomizer provides a number larger than x, if not, the tree is coniferous. The proportion of coniferous trees per cell was stored in a raster derived from a 10 m cell size raster with the dominant leaf type (DLT) [50], which was created using country-wide winter and summer Sentinel-1, as well as cloud-free summer Sentinel-2 satellite images [51].
The positions of the trees resulted mainly from individual tree detection as described by [52]. Trees with at least 4 m height within the forest boundaries defined by GR and FL were detected in the Canopy Height Models (CHM) which were derived from ALS point clouds. The detection was performed using a python implementation of the FINT Local-Maxima (LM)-based tree detection algorithm coupled with a statistical model based on forest structure variables [53,54]. The detected single trees, however, only represent the upper layer of the forest since LM-based detection in CHM can only detect dominant and co-dominant trees in the canopy. Therefore, the final individual tree dataset also included randomly generated trees representing the understory. The number of understory trees was estimated at forest stand level, based on a statistical regression model derived using field inventory data. The forest stands were delineated from the CHM using the forest stand segmentation algorithm TBk, as described by [55]. The regression model determined the basal area per ha and stem number per ha per diameter class (12 cm ≤ q D B H < 24 cm, 24 cm ≤ D B H < 36 cm, D B H ≥ 36 cm) per forest stand in function of the number of detected trees, as well as the DLT, the dominant top height, and the degree of cover [55]. The regression model was then used to predict the number of expected trees per diameter classes for each of the stands. Finally, the difference between the number of detected and predicted trees was used as input for generating the artificial tree points with RockyFor3D. This required (1) a raster with information on the desired stem number per ha per diameter class, (2) a raster indicating the mean DBH and (3) a raster with standard deviation of the DBH (see Table 3). Within forest gaps of at least 10 m × 10 m size, which were identified during the ALS based single tree detection, no additional trees were generated. The additional trees generated per diameter class were combined with the detected trees to form the final tree dataset (see Table 4).

2.3. Runout Raster and Automatic Delimitation of HIZ

The raster for determining the run-out and finally the rockfall HIZ is the one with reach probability ( R e a c h _ p r o b [given in %]) values, which was calculated as follows,
R e a c h _ p r o b = ( N r _ p a s s a g e s · 100 ) ( N r _ s i m s · N r _ s o u r c e c e l l s )
where N r _ p a s s a g e s is the number of simulated trajectories that passed through a given cell, N r _ s i m s is the number of simulated individual releases per source cell, which equals to 100 in this study and N r _ s o u r c e c e l l s is the number of start cells (or source cells) from which a trajectory passed through a given cell. The highest start cells have a R e a c h _ p r o b value of 100 and the cells in the extreme run-out zone have values between 2% and 1% (with 100 simulations per start cell, 1% is the min. value in a cell where a simulated rockfall trajectory passed. Based on the R e a c h _ p r o b values, we automatically delimited HIZ. We excluded all cells with low reach probability values by binarizing the raster using a threshold of 1.5% for FL and 1.3% for GR and then smoothed the binary raster based on focal statistics (using the majority operator with a round kernel with a radius of 9 cells resp. 18 m) to remove outliers and missing values for areas < 100 m2. The smoothed rasters were then transformed to polygons. The difference between the threshold levels reflects the difference in rockfall hazard mapping in FL and GR, as these threshold levels were defined by the practitioners responsible for rockfall hazard management in the two offices in GR and FL. This was performed on the basis of a qualitative comparison between existing communal rockfall hazard maps (only for those where information on the underlying block volume scnearios was available in the technical reports) and our simulated R e a c h _ p r o b rasters for the different block volume scenarios.

2.4. Comparison with Past Events

To obtain some measure of accuracy, we compared the results of the simulations with a total of 1577 PE from the event databases of GR and FL. For this purpose, the data were processed as deposition points of the rockfall trajectories and the corresponding block volumes as attributes. Incorrect or incomplete data, e.g., data without any information on the block volume, were manually deleted (99 out of 1405 PE for GR and 212 out of 483 PE for FL). Since the mapped events were mostly available as polygons, the lowest point was extracted in each case based on the digital terrain model. If there was no exact information on the block volume but an indication of the rockfall event type, a block volume of 0.05 m3 was assumed for the event class “particle fall—mean rock diameter < 0.5 m”, a volume of 1 m3 for the event class “blockfall—rock diameter of 0.5 to 2 m” and a volume of 5 m3 for the event class “rock mass fall—large blocks > 2 m”. Figure 2 gives an overview of the distribution of the block volumes of the registered PE. In total, 34 blocks had a volume larger than 30 m3, ranging from 35 m3 to 650 m3 (10 blocks with a volume between 100 m3 and 300 m3, 1 block with 400 m3 and 1 block with 650 m3). Data preparation was performed with QGIS (version 3.16).
The processed PE were then used to validate the simulation results. For this purpose, we firstly compared if the mapped PE was reproduced by the simulation, i.e., if the PE position was reached by a simulated rockfall trajectory of the block volume scenario that corresponded closest to the PE volume. To do so, for each PE point, the value of the respective R e a c h _ p r o b raster cell and its eight immediate neighbouring cells were evaluated. The event is considered to have been reached by the simulation if at least one of the nine cells has a value > 0. Secondly, we analysed which PE volumes and how many were reproduced by the simulations. Thirdly, we analysed how many PE lie within the automatically generated HIZ. Lastly, we assessed whether there is a relationship between the distribution of the mean R e a c h _ p r o b values and the different block volume scenarios. The mean R e a c h _ p r o b value represents the mean of the respective R e a c h _ p r o b raster cell and its eight neighbours. The analyses were performed using R (version 1.2.1320).

3. Results

The simulated run-out maps and automatically derived HIZ show, as expected, that the effect of the forest decreases with increasing rock volume. It is significant for the block volumes 0.05 m3 and 0.2 m3. For volumes of 1 m3 and bigger the barrier effect of the forest is less distinct. Figure 3 shows a typical example of the obtained results. Merely at locations with forested transit zones longer than several 100 m, a difference can be observed between the simulated run-out with and without forest for 1 m3. In some cases this is also true for 5 m3, but rarely for the bigger simulated volumes.
The qualitative comparison of existing hazard maps with the simulated run-out zones, which was only possible at locations where information on the underlying scenarios used for creating the hazard maps was documented in the technical report, showed that our results were generally more pessimistic but plausible. In other words, most simulated run-out zones and derived HIZ corresponded well to the existing hazard maps in the sense that the simulated run-out zones were lying in a similar range, although slightly longer. We did not observe extreme long, non-realistic run-out zones.

Comparison with Past Events

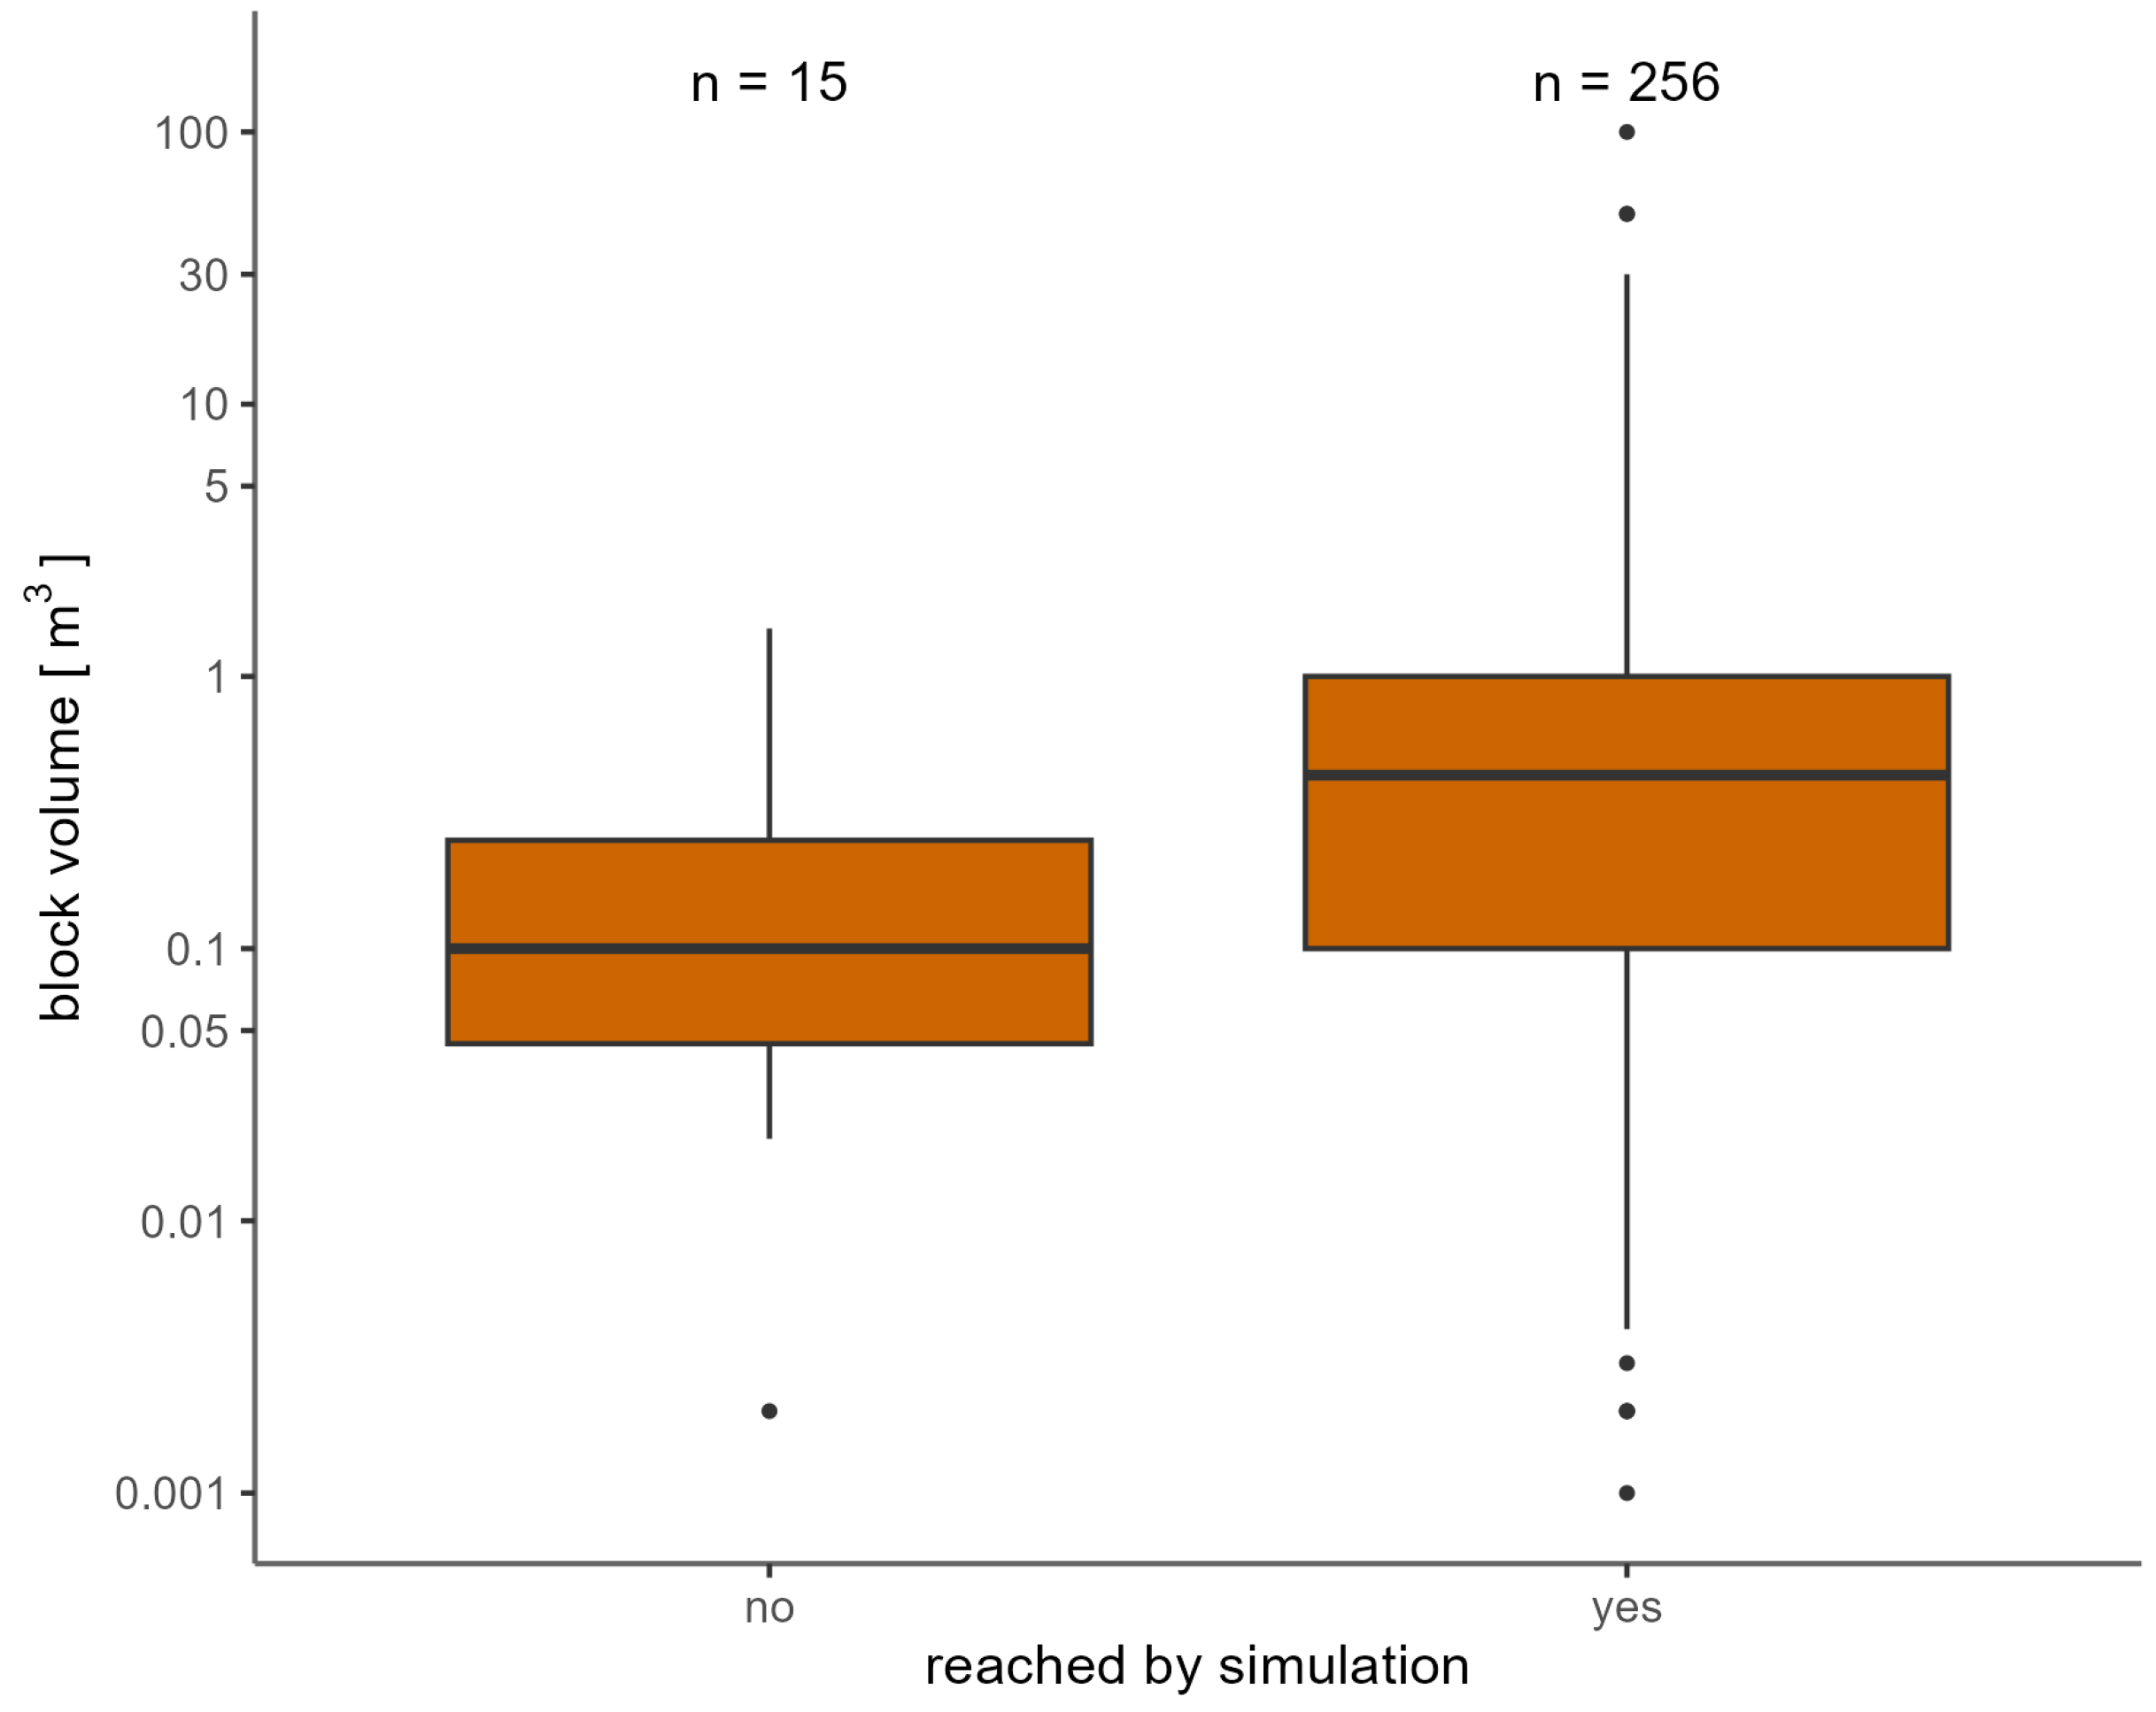
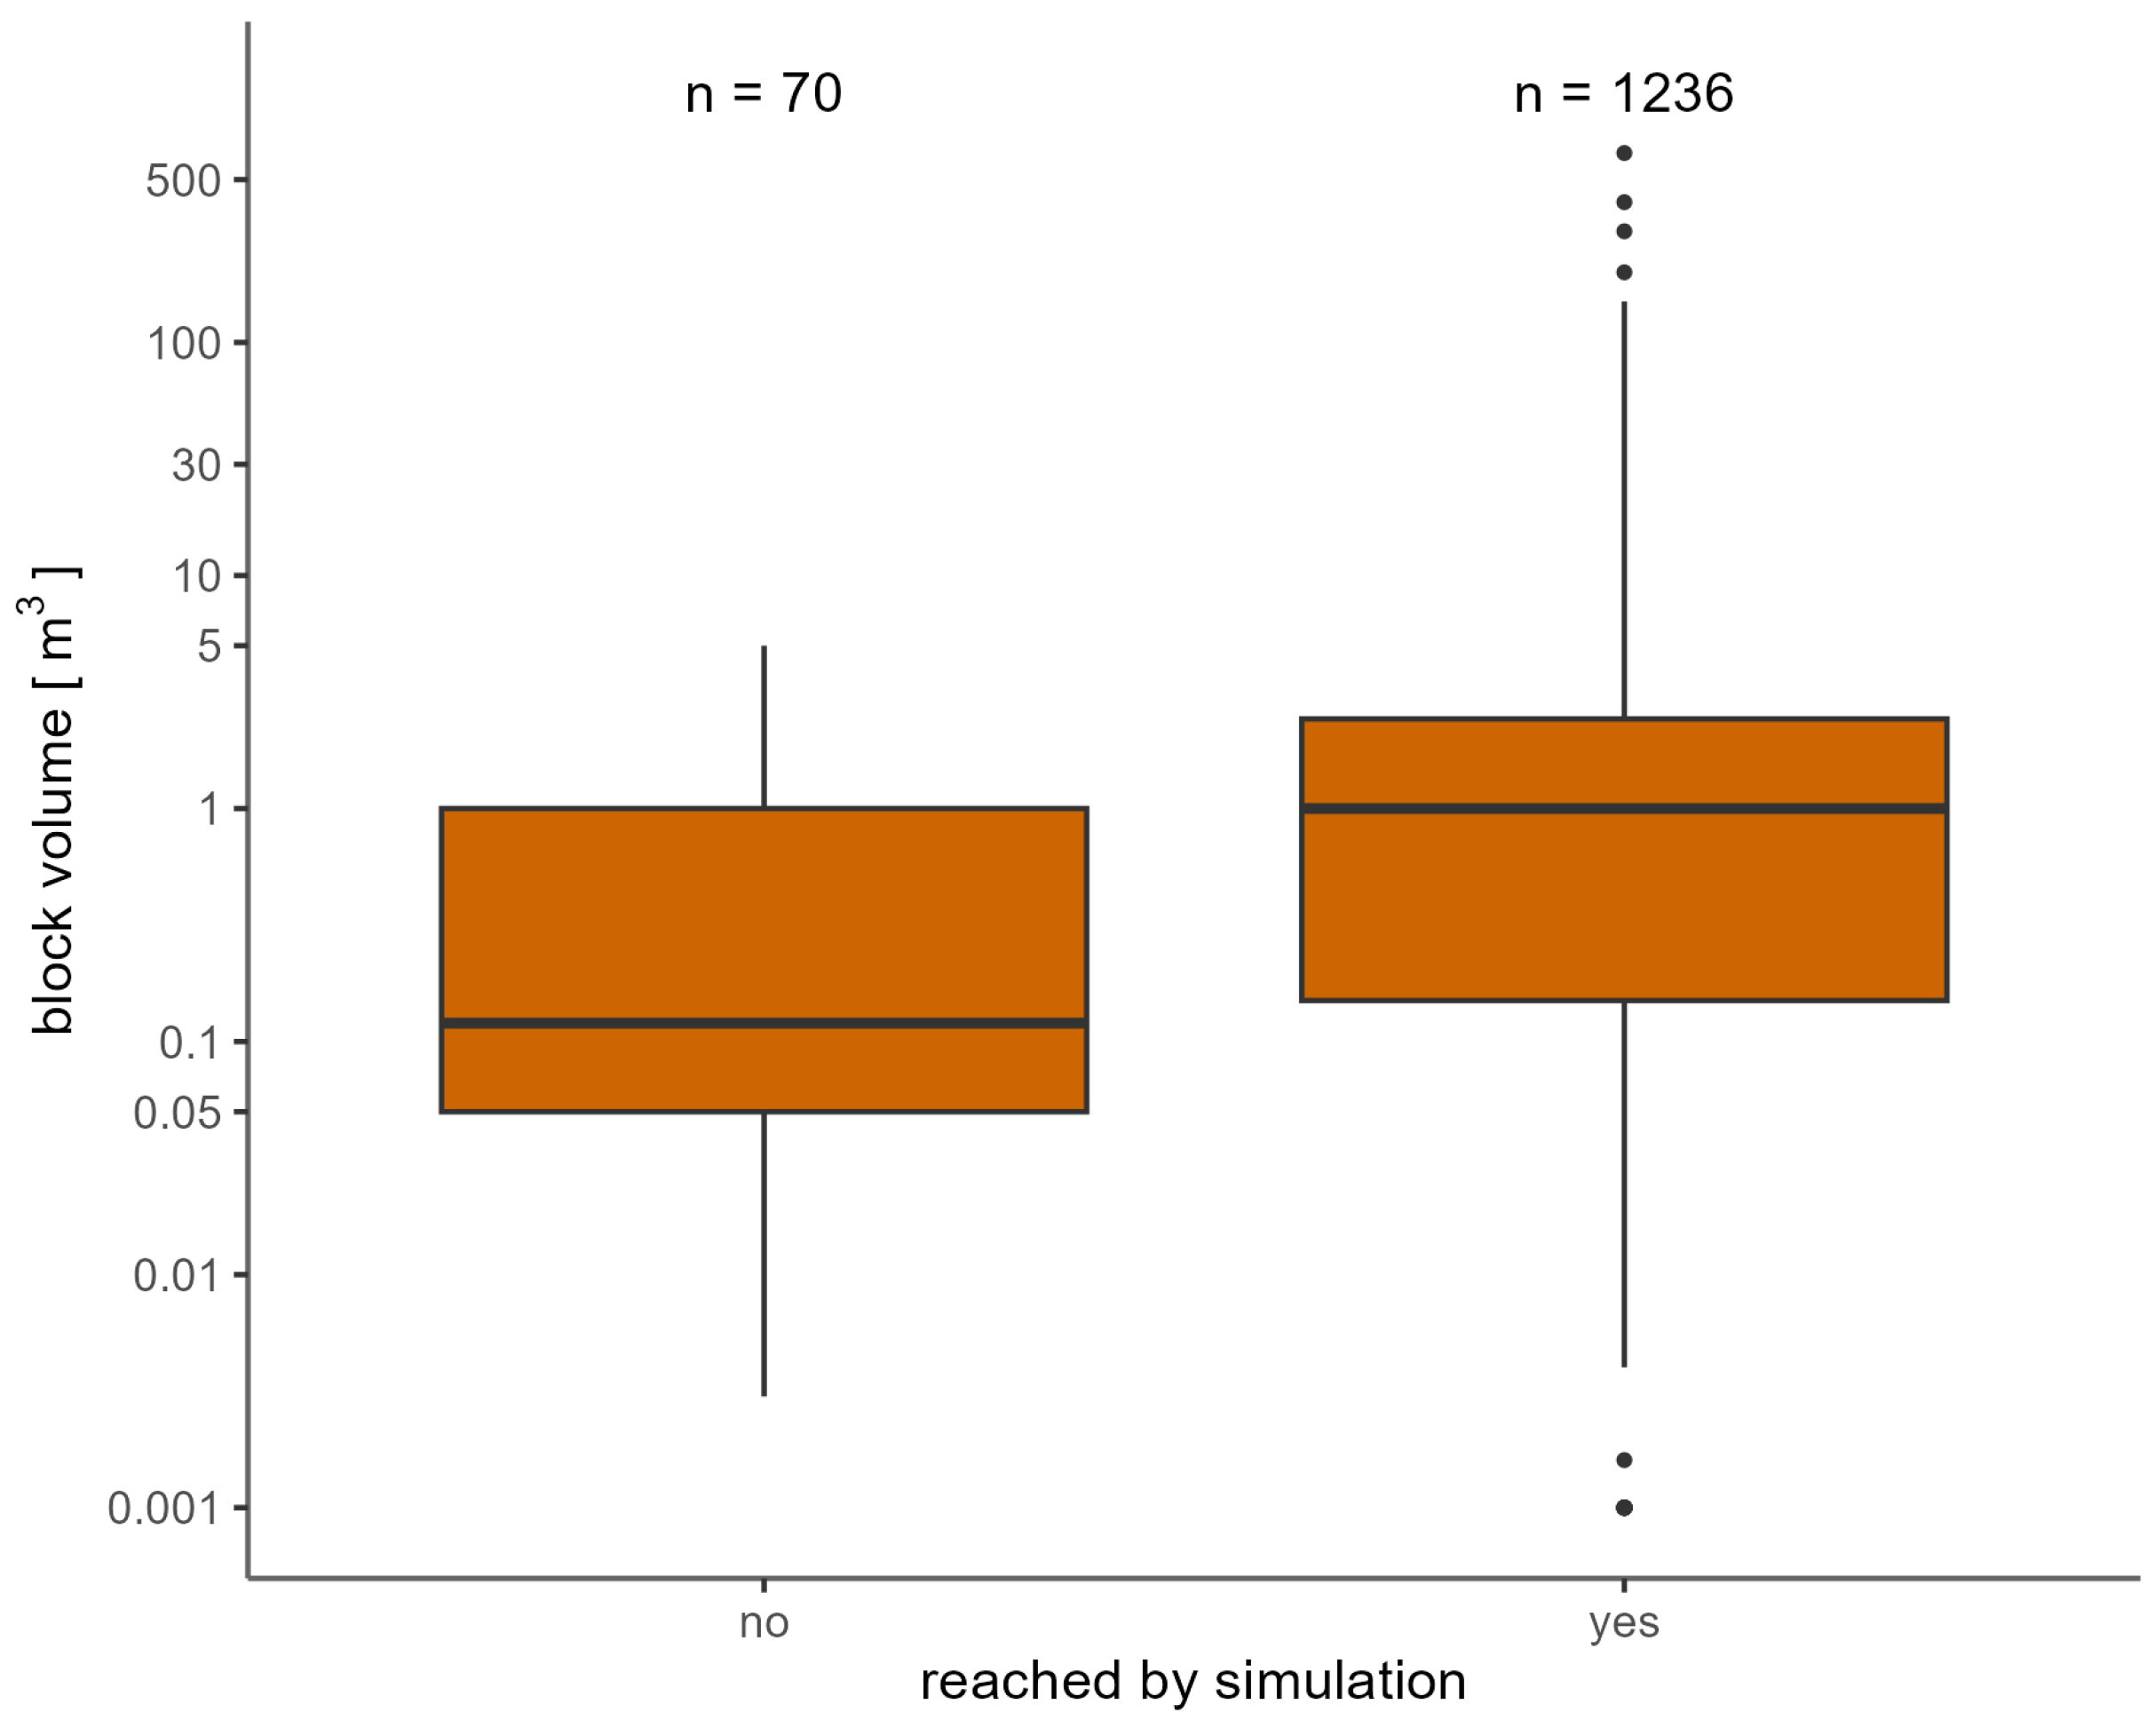
The analysis of the PE in FL showed that, 256 of the total of 271 events were reached by the simulation, meaning that 94.5% could be reproduced (see Figure 4). The median of the block volume of the PE that could not be reproduced by the simulations was 0.1 m3. For GR, 1236 of the 1306 PE were reached by the simulated trajectories, which results in a reproduction of 94.6% (see Figure 5) of the PE. Here, the median of the block volume of the PE that could not be reproduced by the simulations was 0.12 m3.
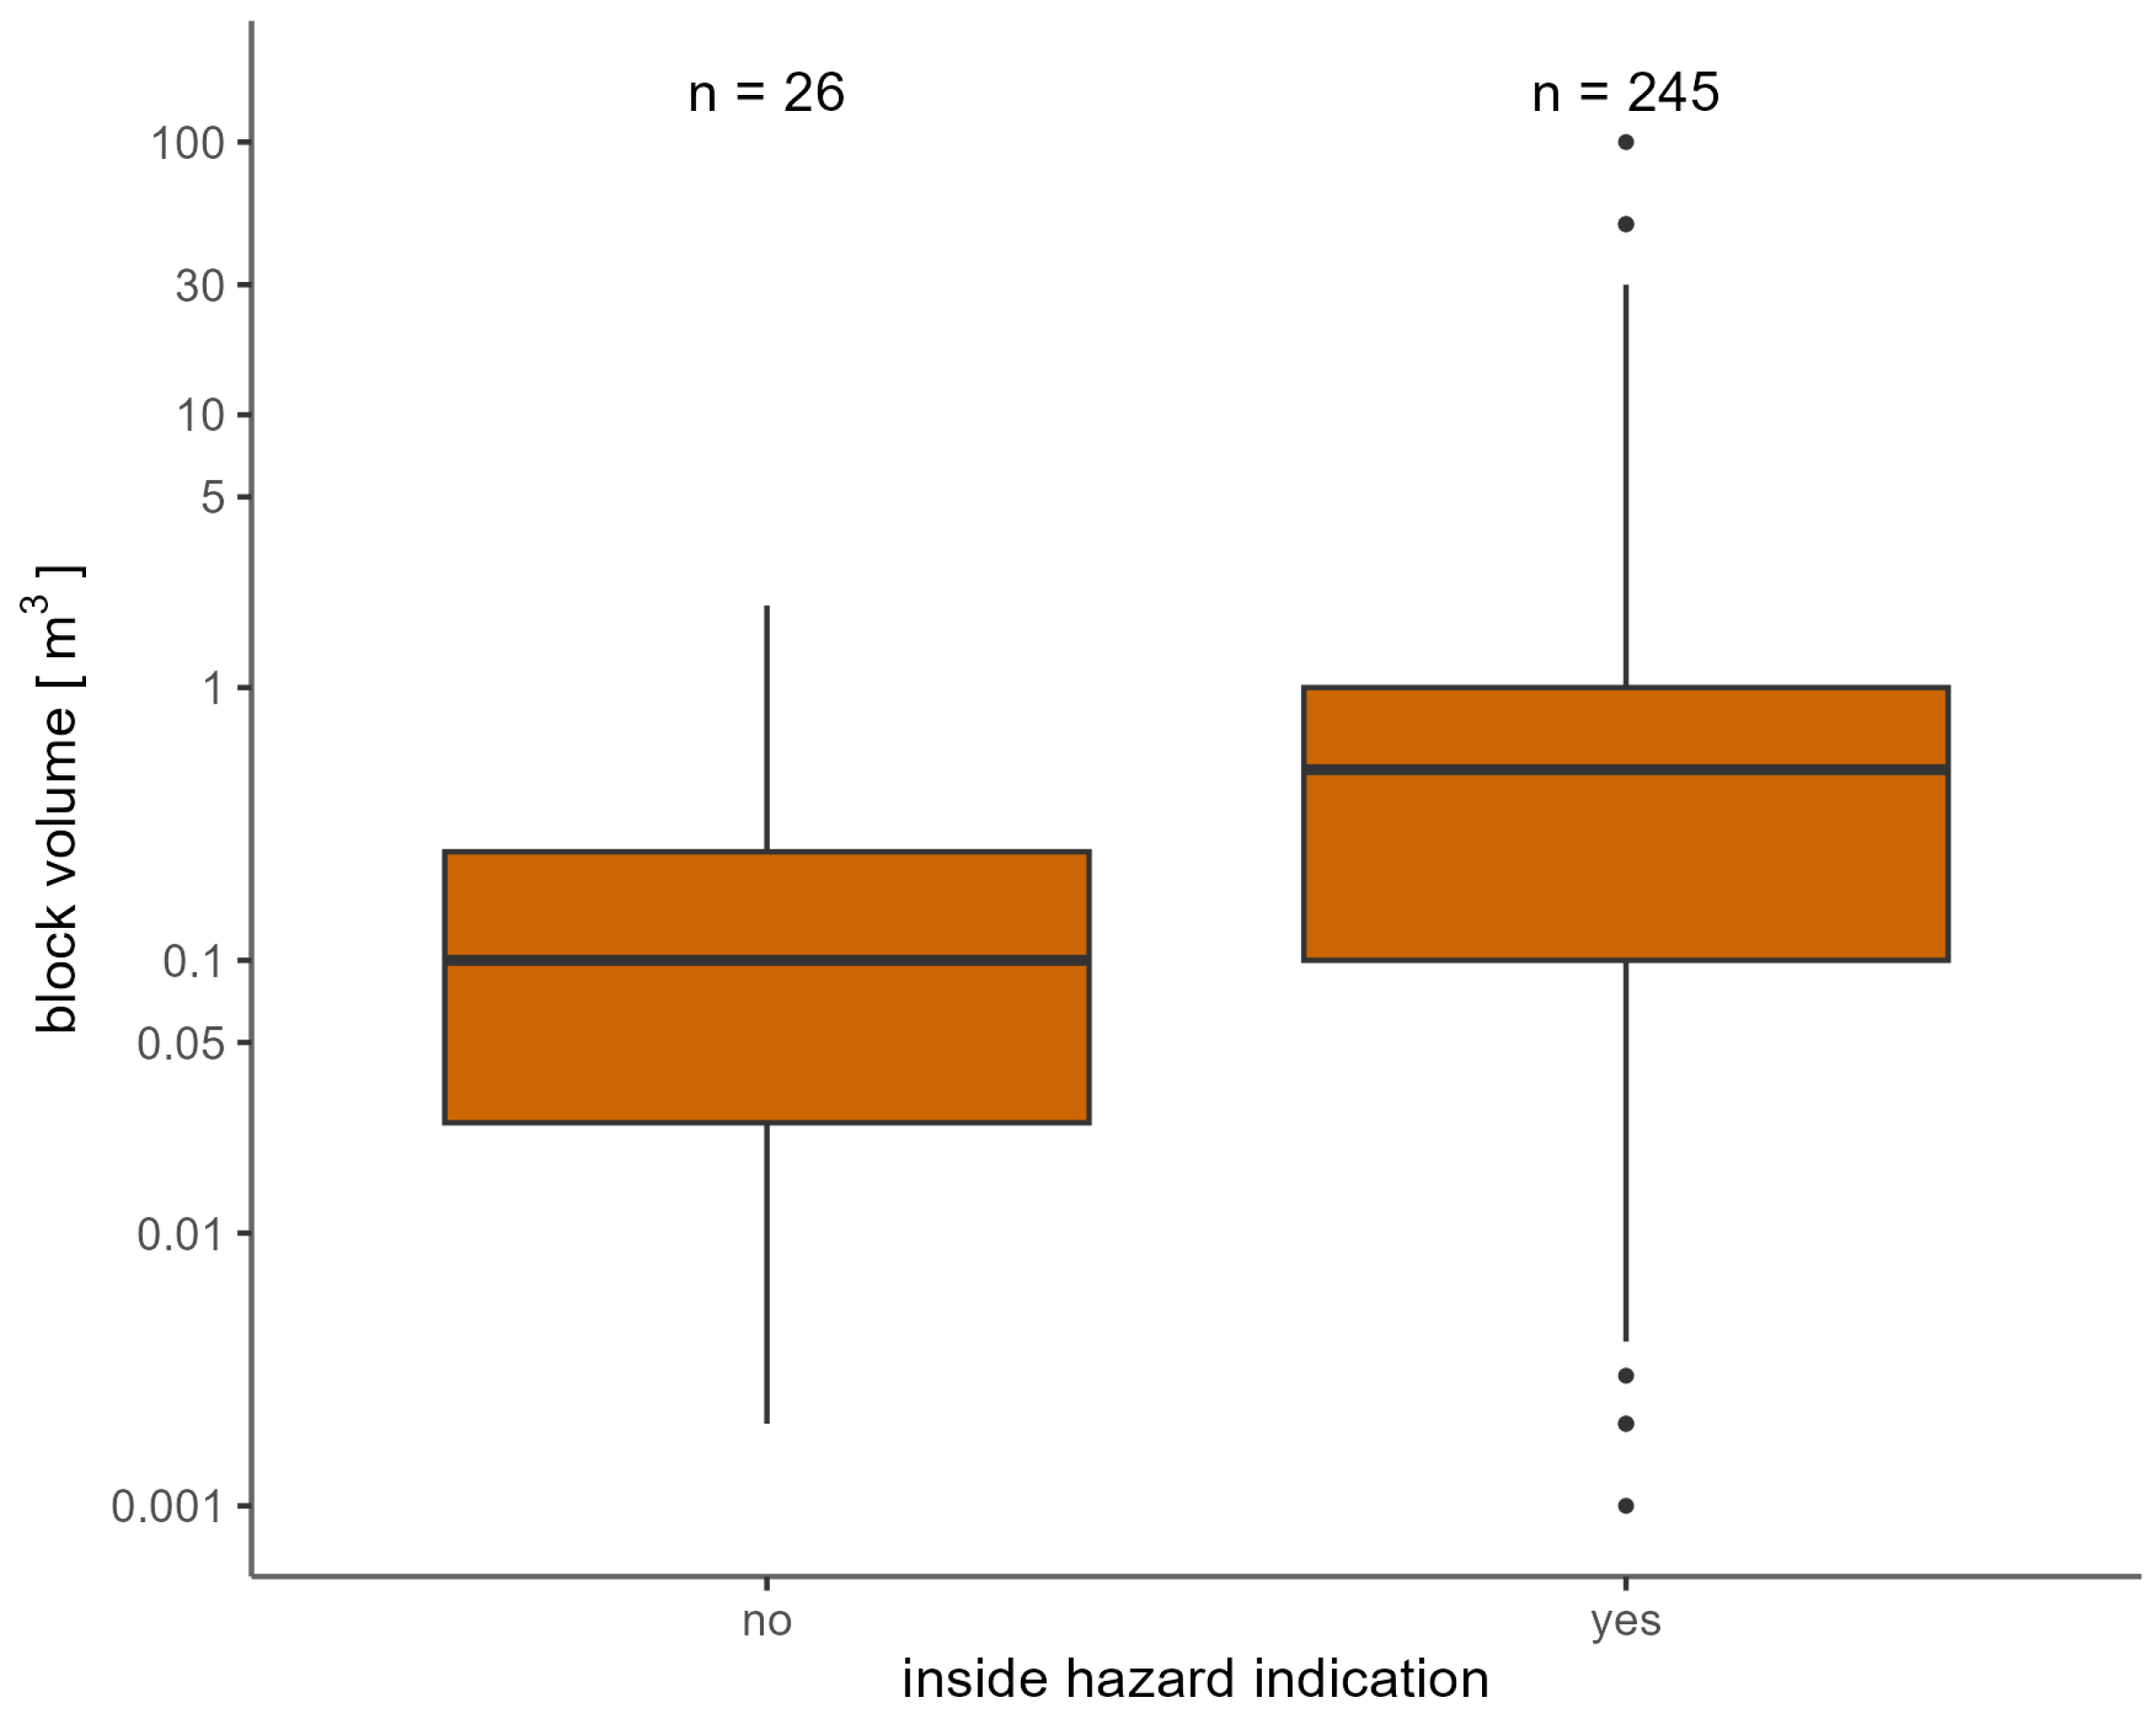
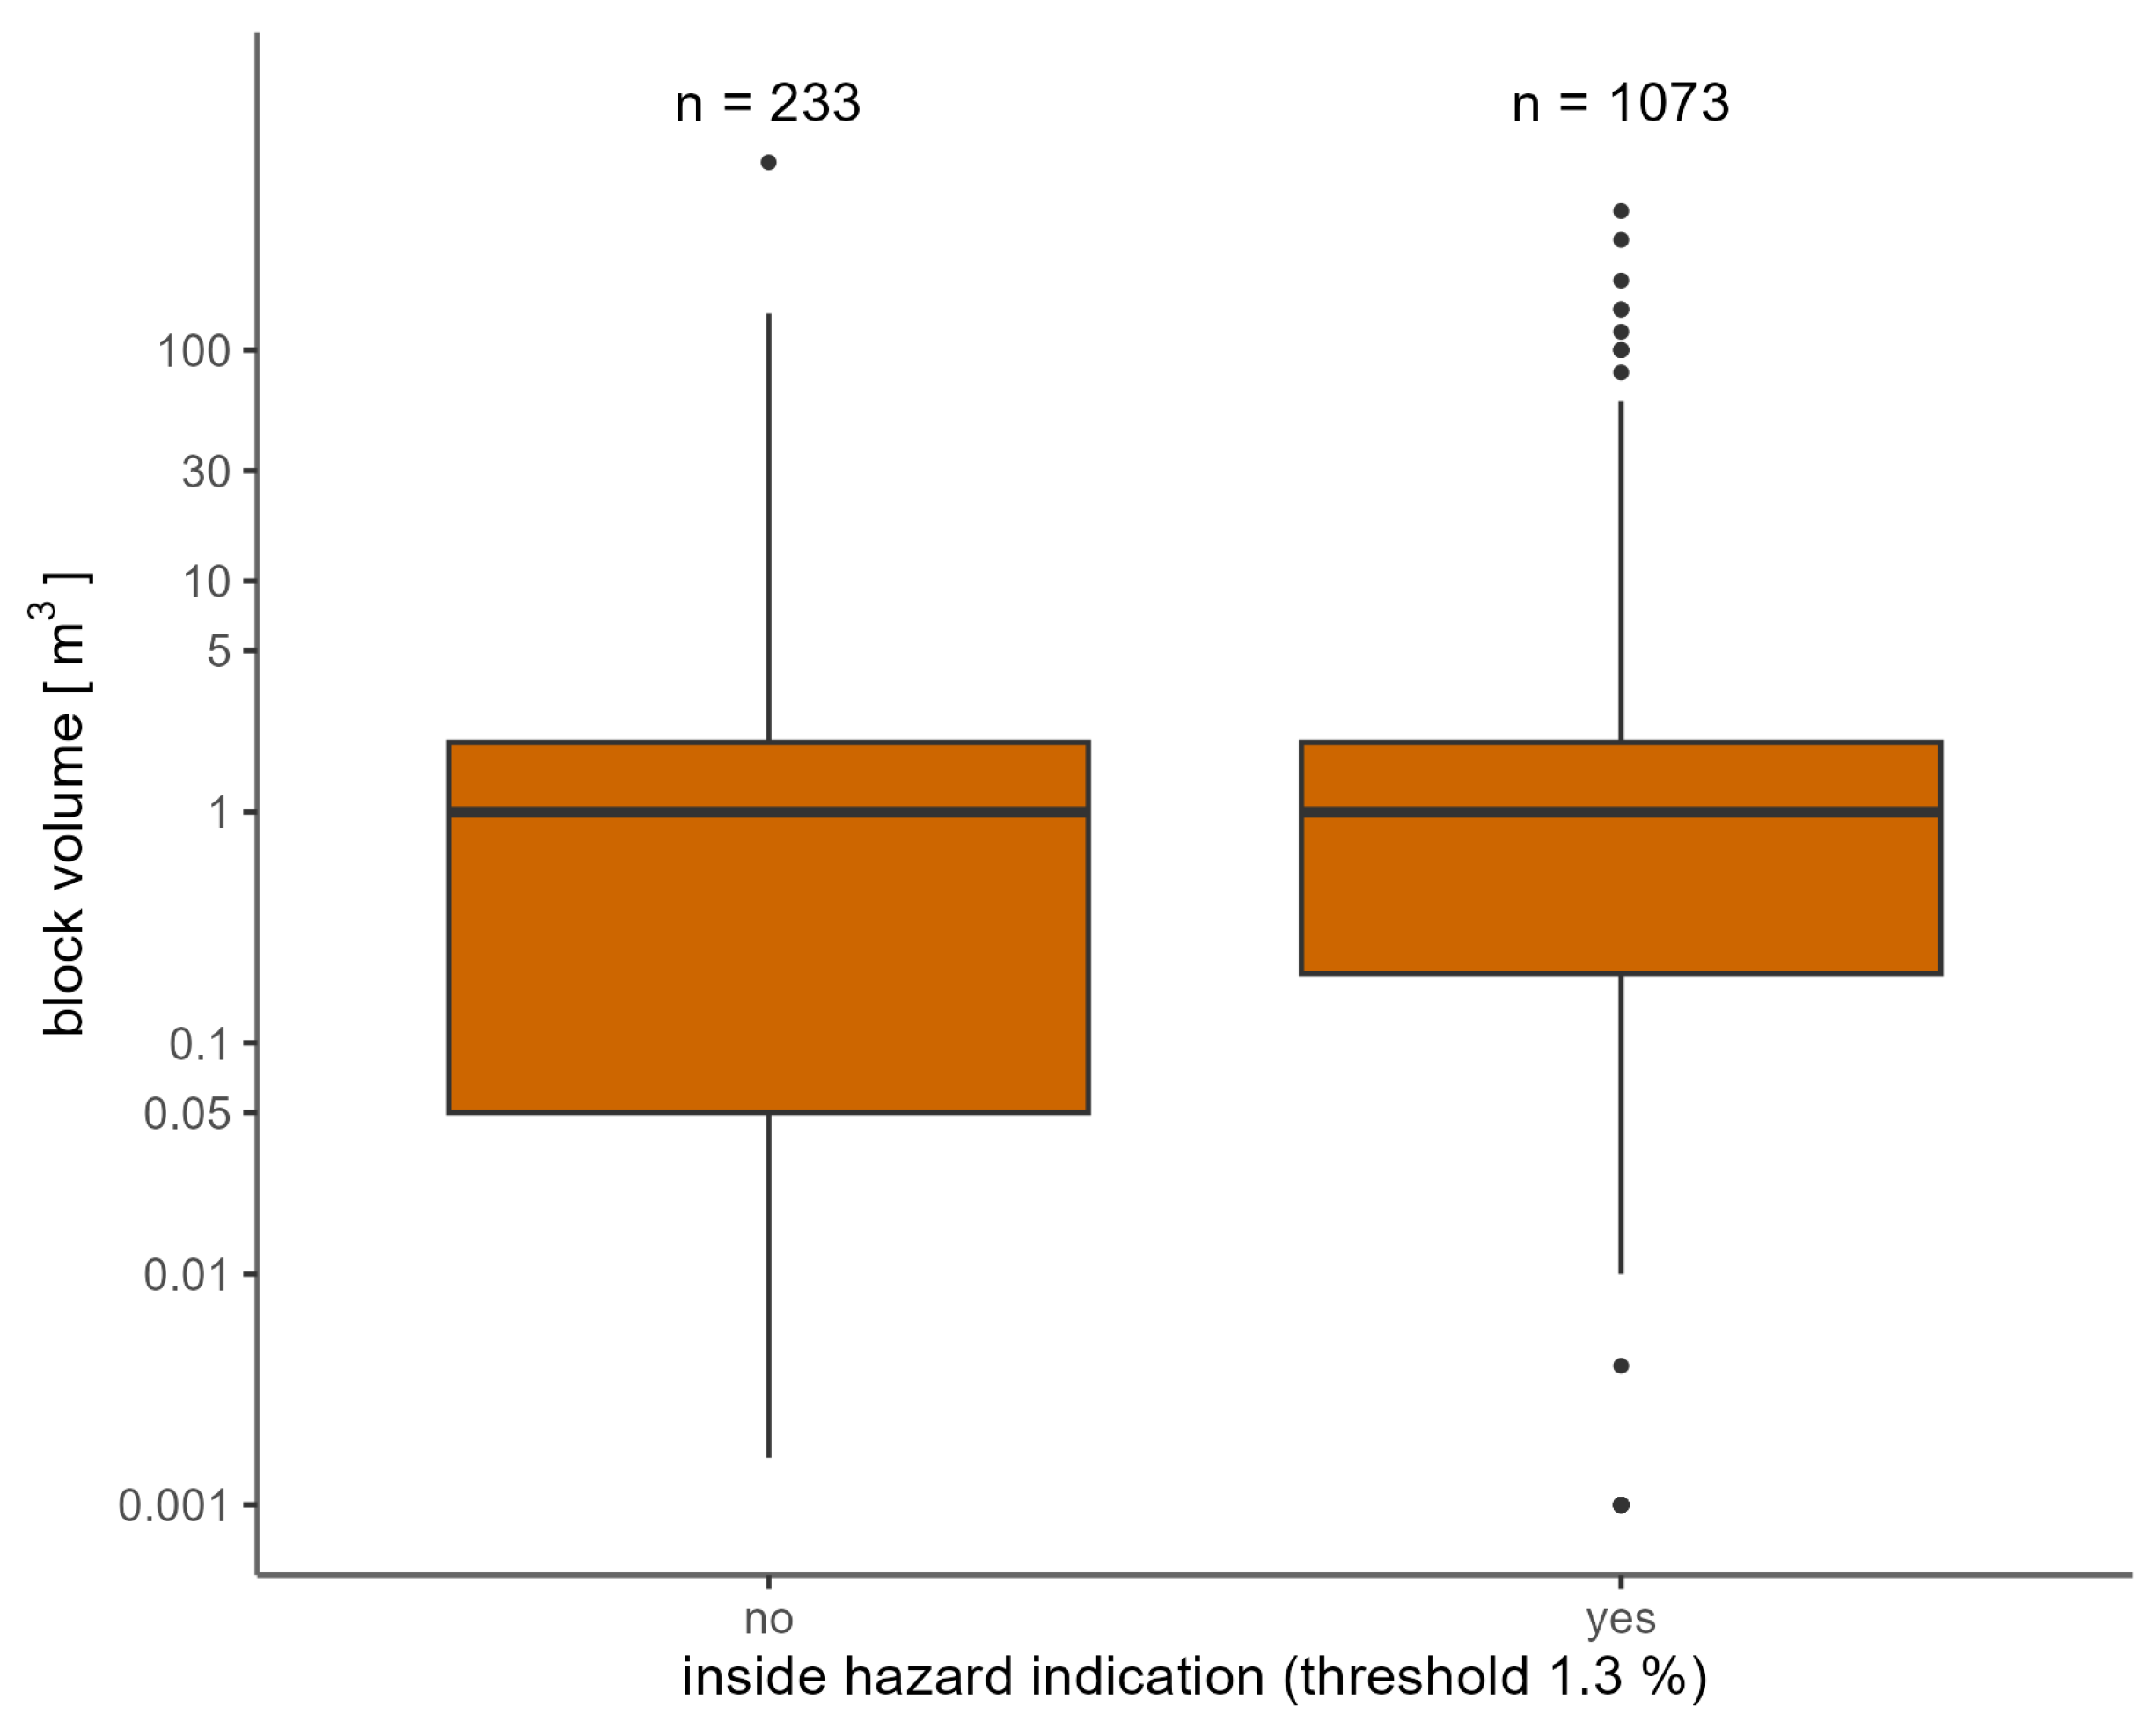
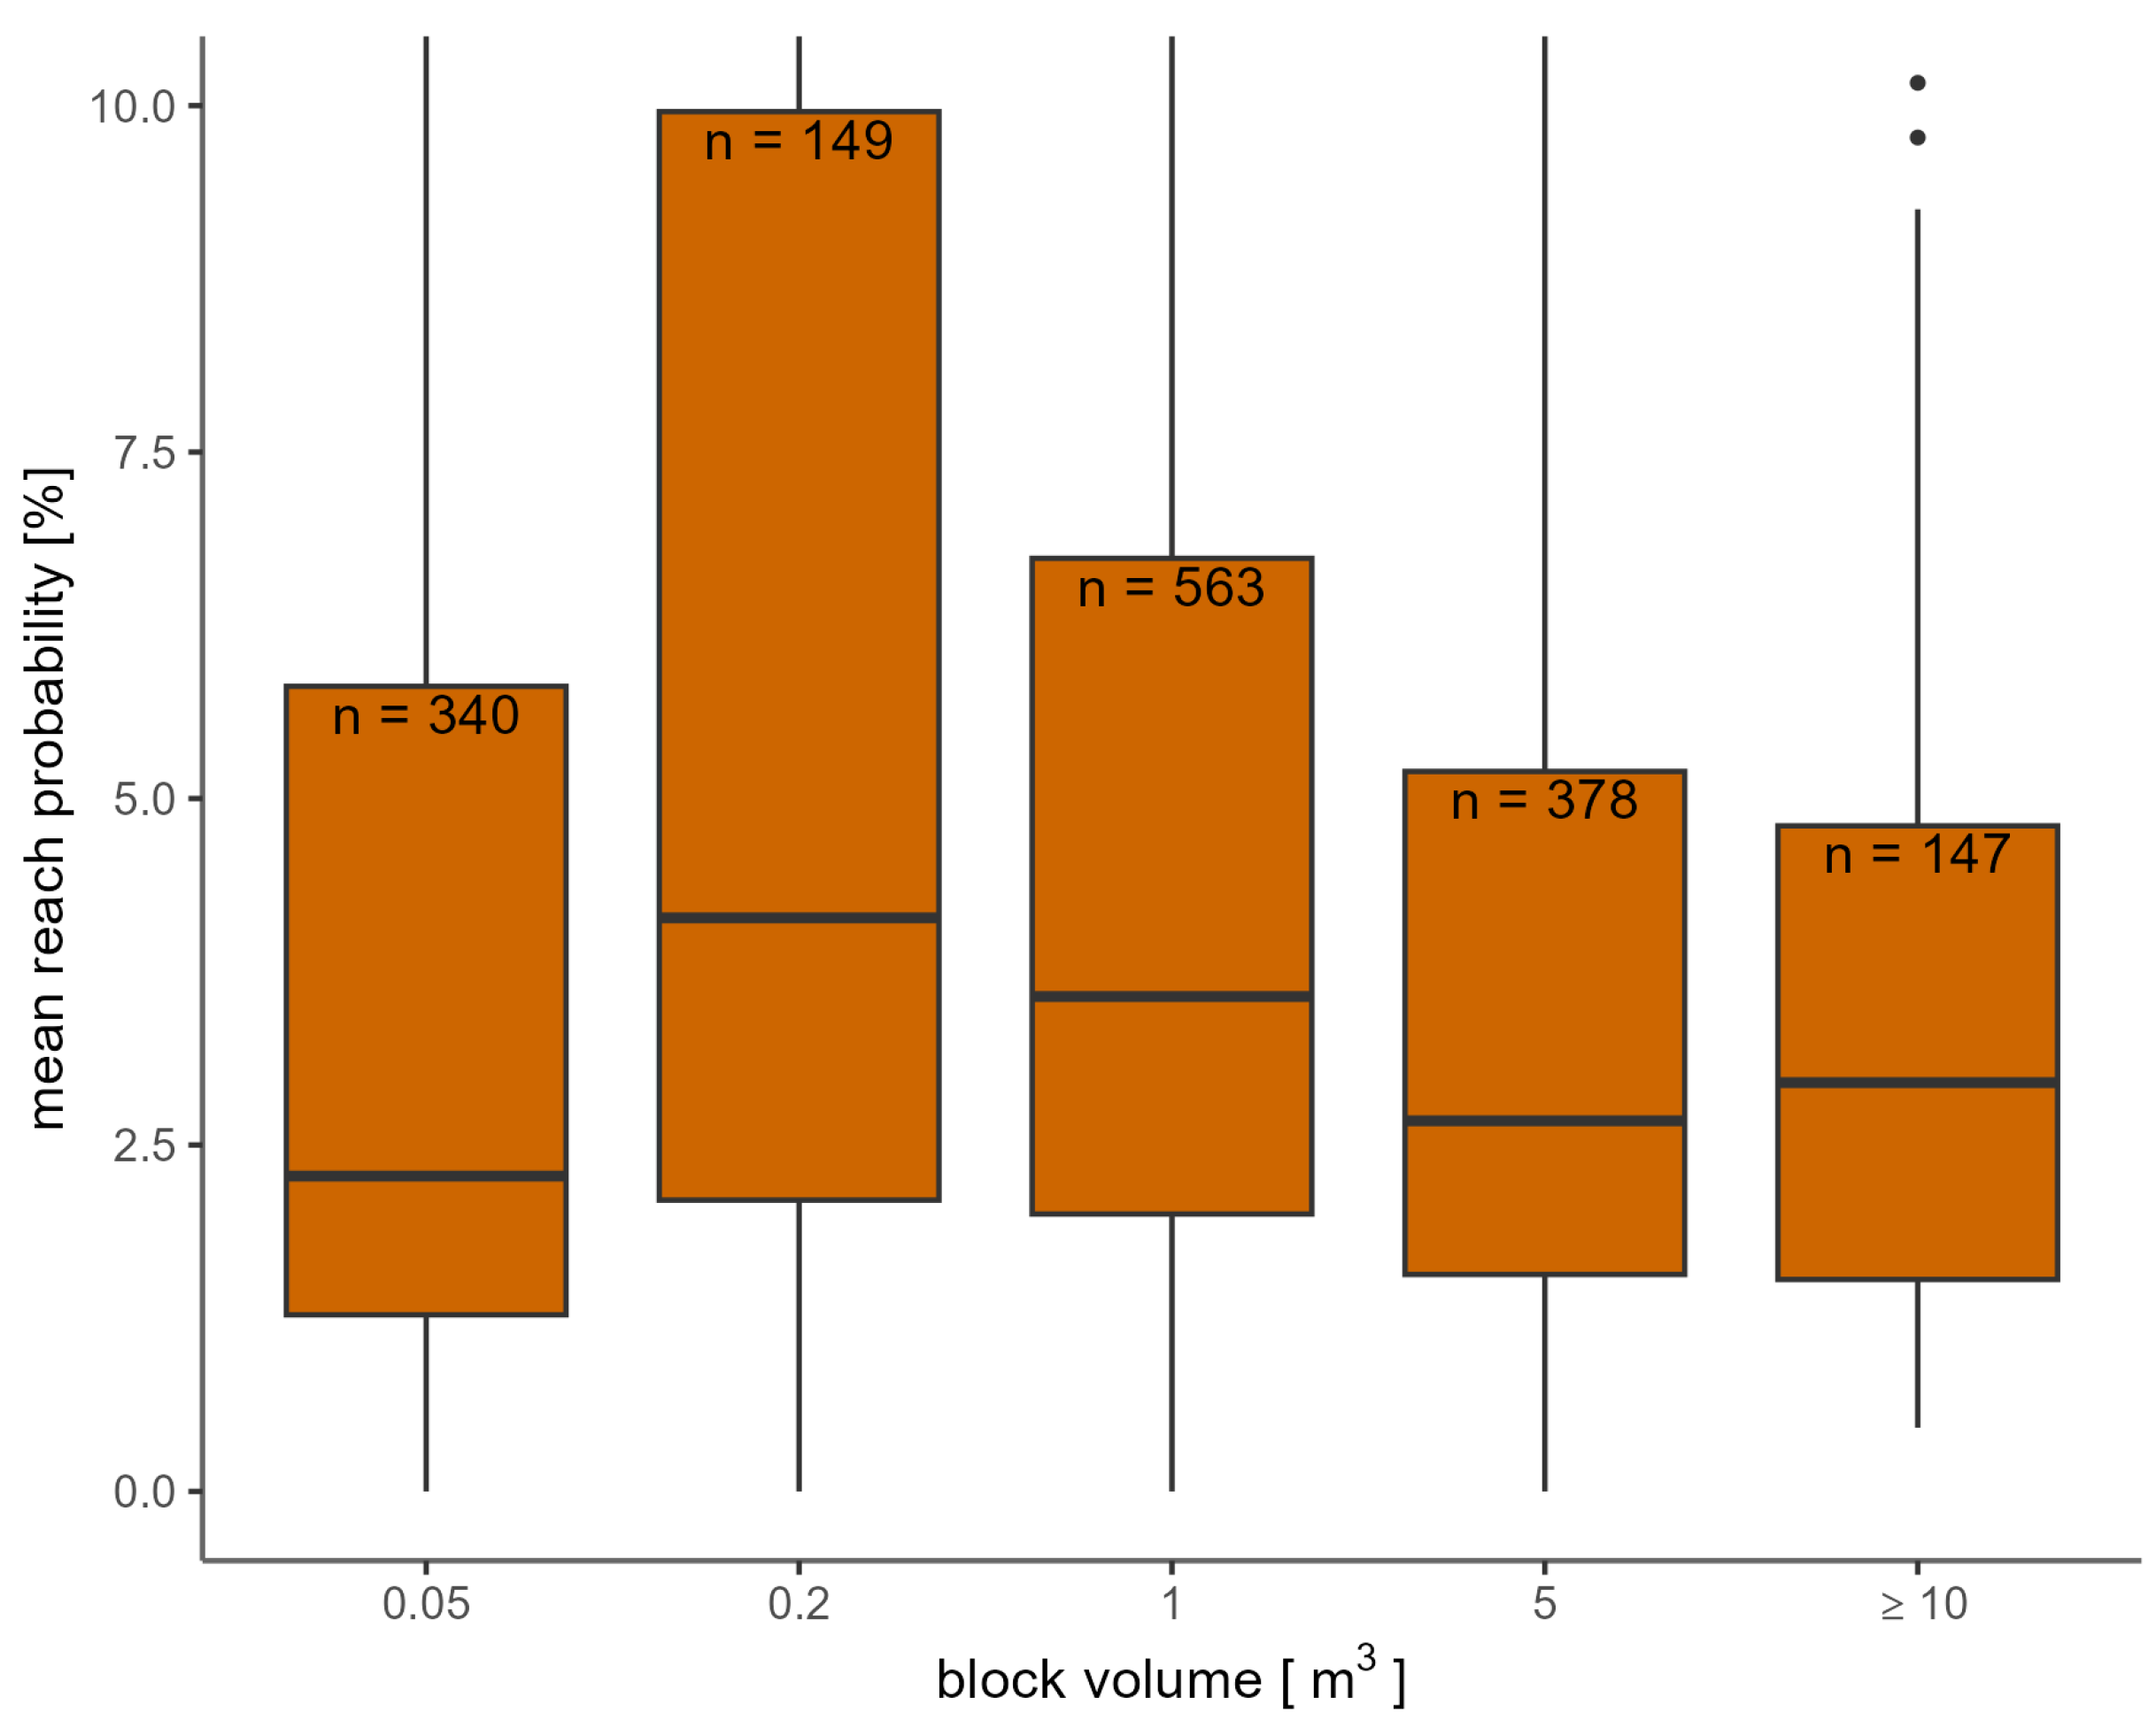
For FL, the proportion of P E that lie within the automatically delimited HIZ using a R e a c h _ p r o b threshold of 1.5% is 90.4% (Figure 6). For GR, a R e a c h _ p r o b threshold of 1.3% was used. Here, the proportion of P E that lie within the automatically delimited HIZ is 82.2% (Figure 7). The analysis on the distribution of the R e a c h _ p r o b values in relation to block volume classes showed no clear trend (see Figure 8). The median of the R e a c h _ p r o b is highest for the block volume class > 0.2 and 1 m3 with a value of 4.1% and lowest for the block volume class 0.05 m3 with a value of 2.3%. The median values differ only slightly between the block volume classes. The analysis shows that the range of R e a c h _ p r o b values between the 25th and 75th percentile tends to decrease with increasing block volume.

4. Discussion

The large-scale, process-based rockfall simulations conducted in this study provide a novel, reproducible basis for regional rockfall hazard index mapping. They include a detailed representation of the spatial variability, as well as the protective effect of trees, which distinguish them from other, e.g., simple topographic and/or empirically-based regional rockfall modelling approaches (e.g., [29,56,57]). By considering several block volumes, the simulation results enable preliminary hazard analyses for frequent and rare events, and thus go beyond mere rockfall susceptibility mapping. Assigning release frequencies to the block volume scenarios would allow for a quantification of the actual hazard (i.e., probability of occurrence of rockfall events at the elements at risk) [58].
The comparison with mapped rockfall events showed that the results are generally coherent. However, the exclusively remote sensing- and computer-based generated input data resulted in certain limitations, which have to be considered when interpreting the results. The used data model for the terrain classification and attribution of roughness classes lead to low roughness values over wide areas. In a “per-site” trajectory modelling-based hazard assessment, higher values would most likely be defined, based on the local field observations. The spatial variation in slope characteristics found in reality can only partially be represented by the approach presented here.
The qualitative comparisons with existing communal rockfall hazard maps suggests that the applied method can be defined as conservative realistic, which fits perfectly to the purpose of a conservative hazard index map (cf. [20]). A more realistic result would require further research and development of a methodology for describing the slope surface characteristics using, for example, machine learning based classification of landforms and roughness, based on terrain data derived from high density ALS-point clouds (e.g., [59,60,61,62]). In addition, continuous research on rockfall propagation and its simulation to better understand the controlling factors is required.
Rockfall trajectories and HIZ in the vicinity of residential areas where rated too pessimistic (i.e., too long) by the practitioners responsible for rockfall hazard management. The reason for this is that in reality, the most upslope buildings would act as barriers and potentially stop or attenuate falling rocks. Considering buildings as obstacles was principally feasible, but it does not correspond to the purpose of a conservative hazard index map, providing a basis for long-term spatial planning. Therefore, the buildings were not represented in the DTM and considered as a natural slope surface.
In addition to the R e a c h _ p r o b raster, Rockyfor3D provides also a raster with energy line angle (ELA) values, which correspond to the slope of a virtual line between the start cell and the stopping point calculated for each simulated block and registered as value in the stopping cell. These values, in addition to the calculated R e a c h _ p r o b values, allow an estimation of realistic run-out zones [63,64,65]. In this project, these values were not included in the delimitation of the HIZ, since it resulted in fragmentation of the delimited zones, leading to unreadable maps. When using the simulation results for delimiting run-out zones for individual cases in the practice, it certainly makes sense to additionally consider the ELA values. In this context, areas within HIZ with ELA values smaller than 26 should be considered as very critical (i.e., unrealistically long run-out zone). Rockfall events in the Alps with ELA values of 26 have been observed, but rather in exceptional cases. Values between 26 and 28 are possible and values greater than 28 are very plausible. Areas with ELA values smaller than 20 should not be considered at all (e.g., [28,66]). These represent very improbably long trajectories or blocks which almost or never left the start cells in the simulation due to an improbable parameter combination. In the latter case, a ELA value with the value 0 is generally found in the ELA output raster.
In order to represent the forest cover as detailed as possible, the detection results from [55] were used as a basis for the forest data. In addition to the detected trees, additional trees were generated for the representation of the non-detected trees in the middle and lower understory layers in the forests on the basis of the estimates of a statistical model. The statistical comparison between detected and additionally generated trees on the one hand and the inventory data on the other hand showed that the number of stems and the basal area were generally underestimated. At the same time, visual comparisons between orthophoto and the detected and additionally generated trees implied that the forest structure is well represented (see, e.g., Figure 9). The spatial distribution of tree heights and, related to this, also the mean DBH values, as well as the main horizontal structure of the forest (gaps and tree positions) were well represented with the used single tree data. Nevertheless, as expected, slight difference between real and reconstructed forest structures exist. An important aspect which lead to a pessimistic representation of the protective effect of the forest is due to the use of a linear regression between tree height and DBH per tree type. As a result, the variation in DBH found in reality is not represented and mainly trees with a large DBH are represented with a smaller DBH in the digital data. This leads to an underestimation of the energy dissipative capacity of the trees with wide stems.
Almost 95% of the considered PE were reached by the simulations that accounted for the current forest effect. This implies that the simulations were realistic, and at the same time not overly pessimistic since many of the mapped PE were located in the outer zones of the simulated run-out areas (i.e., low R e a c h _ p r o b values). The automatically derived HIZ included 90% of the PE in FL and 82% in GR, based on a threshold value of 1.5% and 1.3%, respectively. These threshold values were not a result of a scientific analysis focusing at a delimitation of HIZ which optimizes the balance between including as many registered PE as possible without creating too large, i.e., too pessimistic HIZ. These thresholds were defined by the practitioners responsible for rockfall hazard management in FL and GR. They based their decision on a qualitative comparison with existing hazard maps, as well as their proper experience. Nevertheless, we would not interpret the difference in the chosen values as a difference in risk acceptance. A clear difference between the two areas is the density of registered PE, being 3.1 km−2 in FL and 0.2 km−2 in GR. Since topography and rockfall activity are not very different (although GR clearly has more geological variability), the density in registered PE could possibly be explained by the large difference in population density. This could mean, that in GR, in addition to blocks reaching houses and infrastructure, only blocks with extremer run-out distances are noticed, resp. registered. In FL, possibly also blocks that are deposited in the transit area are included, which would explain why a higher threshold leads to more inclusion of registered PE.
The median values and volume distribution of the majority of the blocks not reached by any simulated trajectory suggest that these could be fragments of bigger blocks, but this hypothesis cannot be verified with the available data. In addition, it must be mentioned that in GR, many PE only contained a general information of the block volume of the event. These were represented by three rockfall event types, being (< 0.5 m3, 0.5–2 m3 and > 2 m3). These PE were compared to the simulated block volumes of, respectively, 0.05 m3, 1 m3 and 5 m3, which logically resulted in both underestimation and overestimation of the quality of our simulations. Without more precise volume data this could not be investigated further in detail.
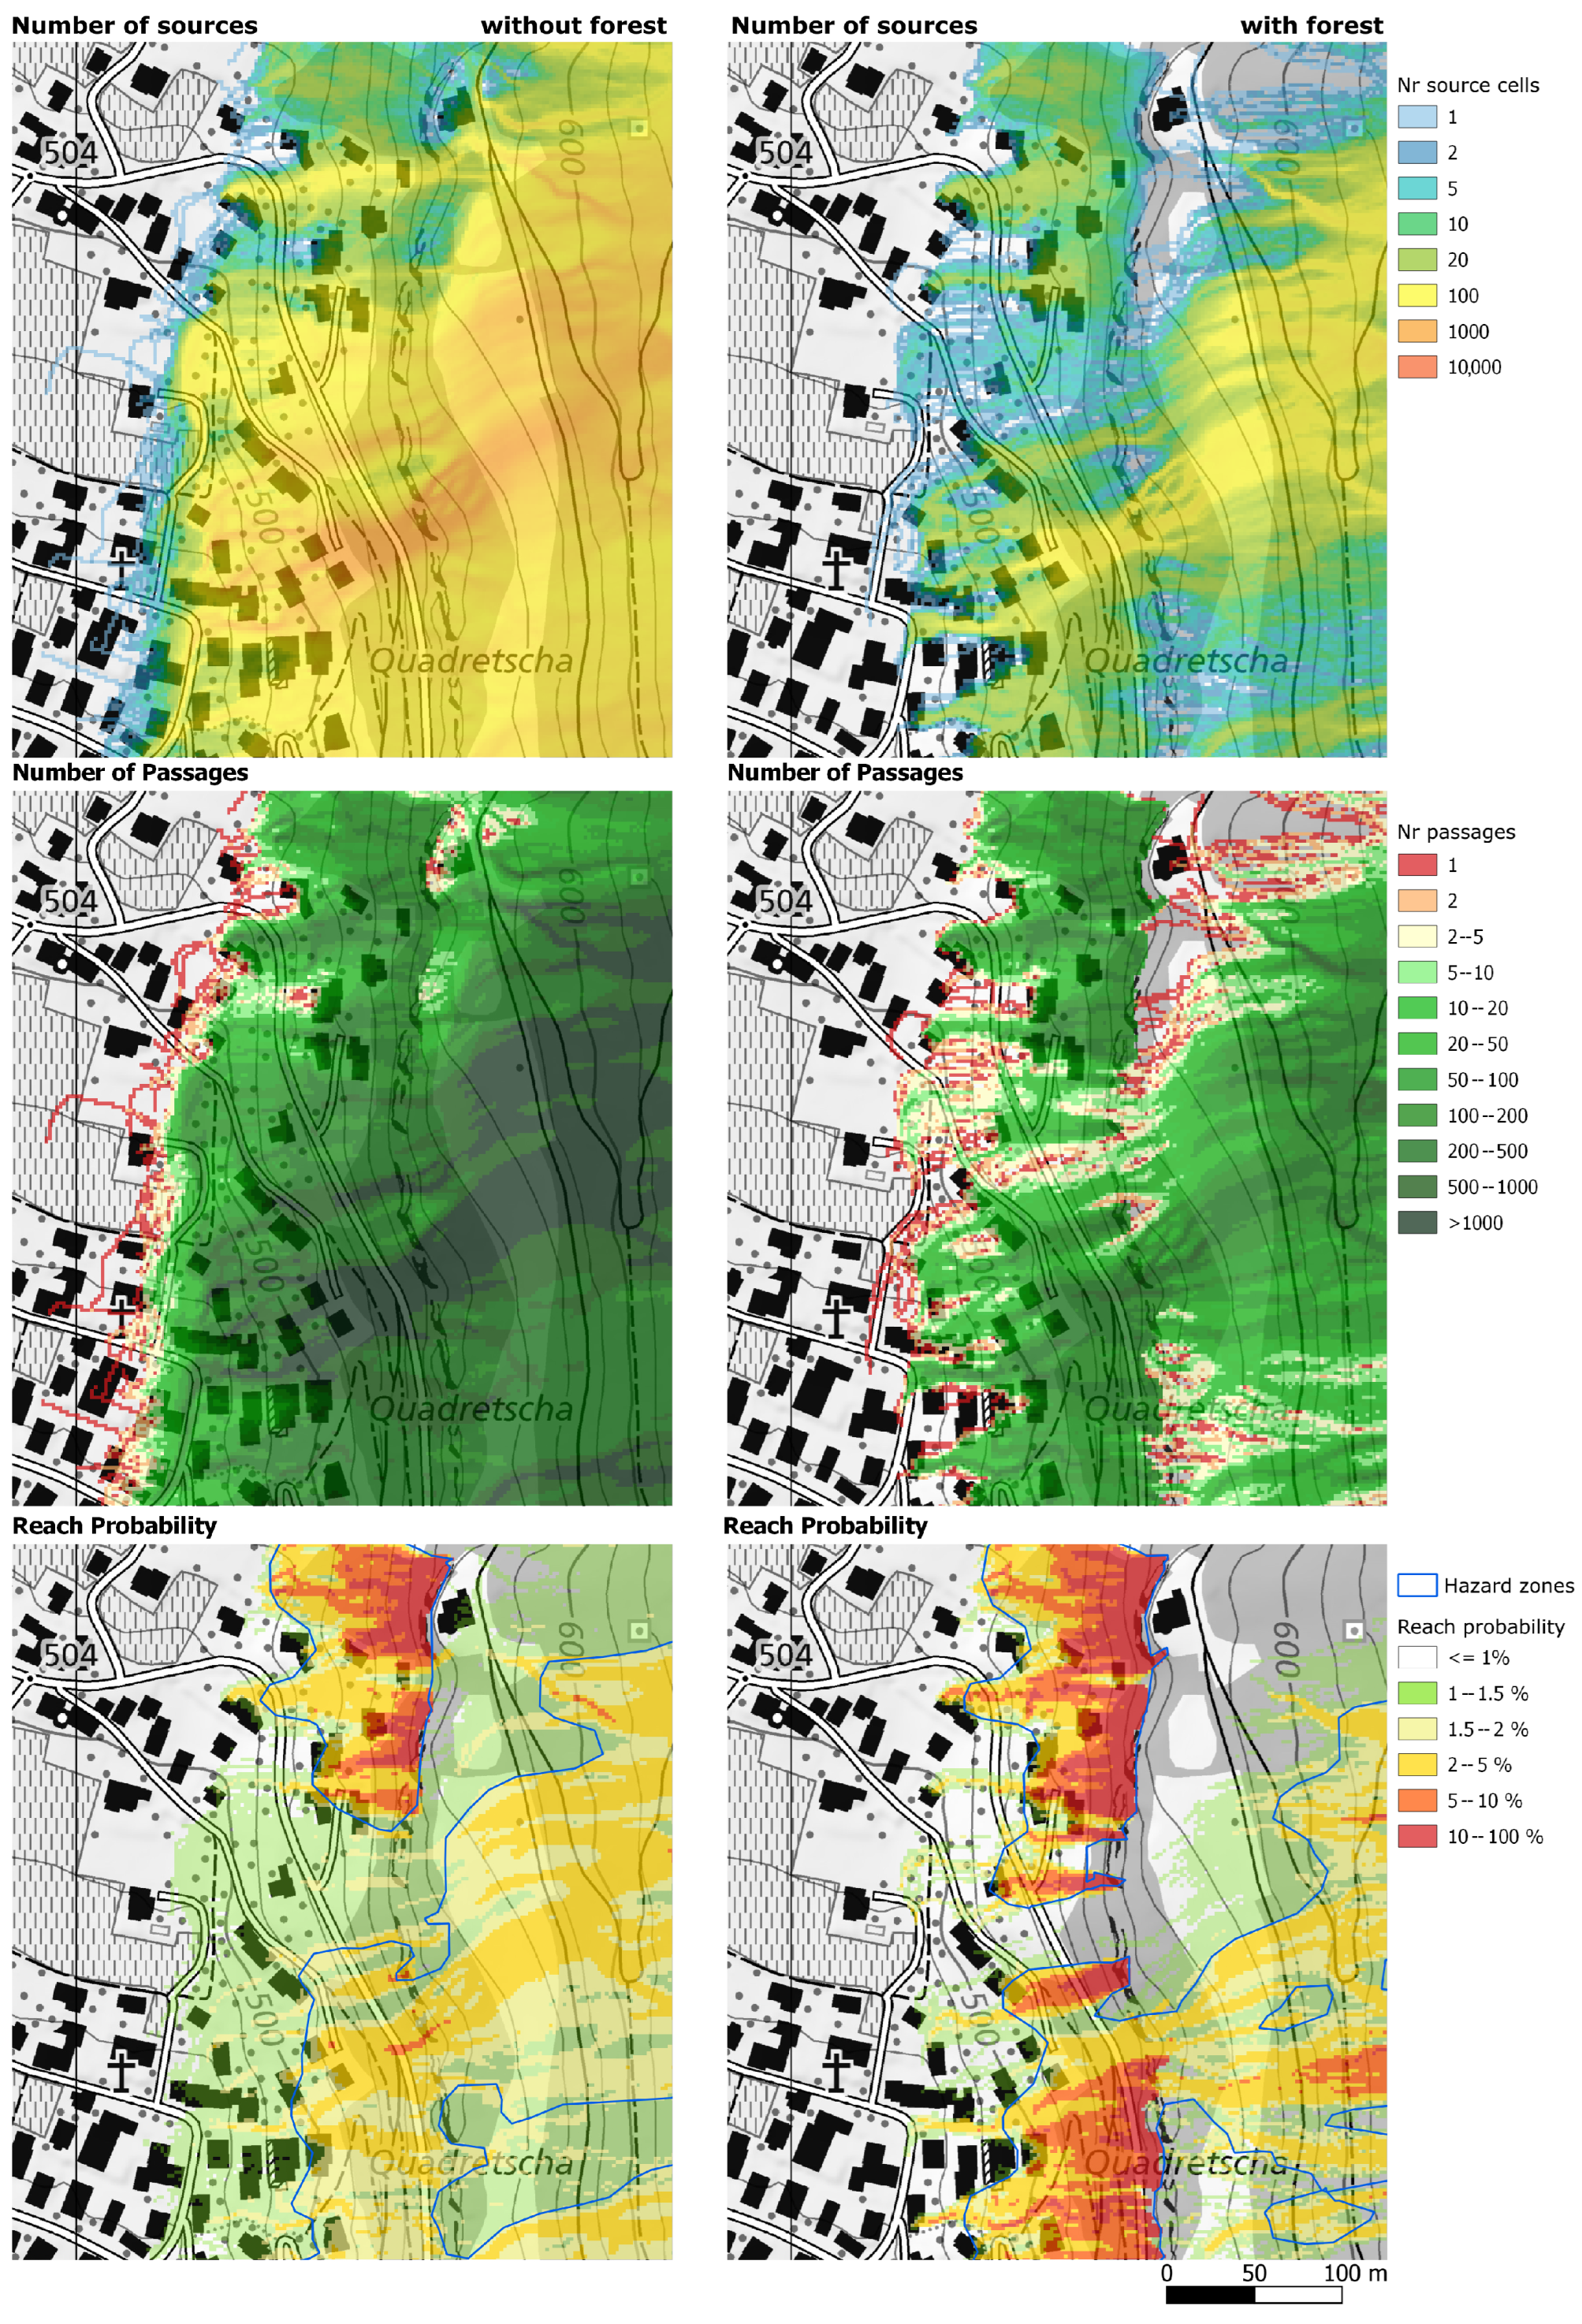
Generally, the HIZ of the simulations with forest are smaller or equal to those of the simulations without forest. Smaller exceptions to this rule may result from the stochastic nature of the simulations. Big exceptions may occur in situations with two or more overlying rock faces, such as those shown in Figure 10. Without forest, the rocks originating from the upper rock face (east of the lower rock face; not shown in this map) pass the lower rock face to a large extent, and then reach the settlement area, which is clearly visible in the higher values for the number of source cells and the number of passages. In the simulation with forest, the majority of rocks was stopped above the lower rock face, which lead to a lower number of sources and passages below the lower rock face. This influences the reach probability in a counter-intuitive way and leads to higher R e a c h _ p r o b values and consequently slightly larger HIZ in the variant with forest. Since the number of simulations was identical for both variants, the difference in reach probability was primarily due to the difference between the number of passing blocks and the number of source cells. For the variant without forest, the R e a c h _ p r o b value decreased due to the significantly higher number of source cells in relation to the passing blocks. The resultant value for larger areas below the lower rock face is lower than the rounding limit, which means that smaller HIZ were defined. This phenomenon is due to the calculation method of the reach probability and, thus, the result is considered ”mathematically” correct despite its counter-intuitive nature. This shows why additional local-scale simulations per rockfall source area are required for (1) detailed hazard mapping, (2) the dimensioning of local rockfall measures or (3) detailed risk analyses. Further work on the calculation of the R e a c h _ p r o b is required to improve the concept.
Overall, the HIZ produced in this study can inform decision-makers in natural hazard management by revealing potential rockfall hazard hot spots in areas where local-scale hazard assessments are missing or outdated. Based on an estimation of rockfall release frequencies per source area, a map with the expected occurrence frequencies could be derived in a next step. This would provide the basis for risk index maps, which relate the hazard to the potential consequences (i.e., expected damage).

5. Conclusions

  • The study provides an automated approach for delimiting HIZ based on process-based rockfall trajectory simulations with high spatial resolution and explicit consideration of the forest effect.
  • The comparison with past events, as well as existing hazard maps, implies that the indication maps are conservative realistic, which is mainly due to rather low roughness values based on the implemented data model of terrain characterization. An objective and transparent way to further differentiate the description of terrain characteristics for large areas still has to be developed.
  • The stem numbers of the detected and additionally generated trees generally underestimated the reality based on a comparison to forest inventory data. Visual evaluations showed, however, that the distribution of tree heights, as well as the horizontal structure of the forest (gaps and tree positions) are well represented in the forest data. The DBH values of large trees were generally underestimated, which added to the conservative representation of the hazard. The continuous research work on tree detection from ALS data worldwide will certainly decrease such under- but also overestimation.
  • When applying the automated approach, attention should be paid to overlying rock faces, which strongly influence generated reach probability values.
  • Since the HIZ were delimited on the basis of reach probability threshold values, there may be locally under- or overestimated. Therefore, in a site specific application of the HIZ, it makes sense to re-evaluate and where required adapt the realistic maximum run-out based on local observations and slope conditions as well as the local acceptance of residual hazard. For this purpose, reach probability values in the range >1% and <2.5% can be used and should be cross-checked with the simulated values in the energy line angle raster.

Author Contributions

Conceptualization, L.D.; methodology, L.D., A.E., C.S. and C.M.; software, L.D. and C.S.; data preparation, A.E. and C.S.; validation, A.E.; writing—original draft preparation, L.D., A.E. and C.S.; writing—review and editing, L.D., A.E., C.S. and C.M. All authors have read and agreed to the published version of the manuscript.

Funding

This research was funded by the Swiss canton of Grisons and the Principality of Liechtenstein.

Data Availability Statement

The used data on PE volumes and locations is available as geopackage under: https://zenodo.org/record/7938092 (accessed on 15 June 2023).

Acknowledgments

We greatly acknowledge the technical discussions with Andreas Huwiler (GR) and Stephan Wohlwend (FL) and their input from the hazard management practice. Further we would like to thank François Noël for his suggestions for improving this manuscript.

Conflicts of Interest

The authors declare no conflict of interest and funders had no role in the simulation, analyses, or interpretation of data; in the writing of the manuscript; or in the decision to publish the results.

Abbreviations

The following abbreviations are used in this manuscript:
ALSAirborne laser scanning
CHMCanopy height model
DBHDiameter at breast height
DEMDigital elevation model
DLTDominant leaf type expressed as % of coniferous trees
DTMDigital terrain model
FLThe principality of Liechtenstein
GISGeographic information system
GRGrisons (canton in Switzerland)
HIZHazard indication zones
IRMIntegrated risk management
LMLocal maxima
PEPast rockfall events stored in the event register
TLMTopographic landscape model; geodata set from swisstopo

References

  1. Rosser, N.; Massey, C. Rockfall hazard and risk. In Landslide Hazards, Risks, and Disasters; Elsevier: Amsterdam, The Netherlands, 2022; pp. 581–622. [Google Scholar]
  2. Bourrier, F.; Dorren, L.; Hungr, O. The use of ballistic trajectory and granular flow models in predicting rockfall propagation. Earth Surf. Process. Landforms 2013, 38, 435–440. [Google Scholar] [CrossRef]
  3. Hilker, N.; Badoux, A.; Hegg, C. The Swiss flood and landslide damage database 1972–2007. Nat. Hazards Earth Syst. Sci. 2009, 9, 913–925. [Google Scholar] [CrossRef] [Green Version]
  4. Badoux, A.; Andres, N.; Techel, F.; Hegg, C. Natural hazard fatalities in Switzerland from 1946 to 2015. Nat. Hazards Earth Syst. Sci. 2016, 16, 2747–2768. [Google Scholar] [CrossRef] [Green Version]
  5. Gerber, W.; Andres, N.; Badoux, A. Bergstürze, Steinschläge und andere Sturzereignisse in der Schweiz in den Jahren 2002 bis 2016. Schweiz. Z. Forstwes. 2017, 168, 329–332. [Google Scholar] [CrossRef] [Green Version]
  6. Arnold, P.; Dorren, L. The importance of rockfall and landslide risks on Swiss national roads. In Engineering Geology for Society and Territory; Lollino, G., Giordan, D., Thuro, K., Carranza-Torres, C., Wu, F., Marinos, P., Delgado, C., Eds.; Springer International Publishing: Cham, Switzerland, 2015; Volume 6, pp. 671–675. [Google Scholar]
  7. FOCP. Integrated Risk Management: Its Importance in Protecting People and Their Livelihoods; Federal Office for Civil Protection (FOCP): Bern, Switzerland, 2014; p. 18. [Google Scholar]
  8. Mölk, M.; Rieder, B. Rockfall hazard zones in Austria. Experience, problems and solutions in the development of a standardised procedure. Geomech. Tunn. 2017, 10, 24–33. [Google Scholar] [CrossRef]
  9. Prina Howald, E.; Abbruzzese, J.M.; Grisanti, C. An approach for evaluating the role of protection measures in rockfall hazard zoning based on the Swiss experience. Nat. Hazards Earth Syst. Sci. 2017, 17, 1127–1144. [Google Scholar] [CrossRef] [Green Version]
  10. Moos, C.; Dorren, L.; Stoffel, M. Quantifying the effect of forests on frequency and intensity of rockfalls. Nat. Hazards Earth Syst. Sci. 2017, 17, 291–304. [Google Scholar] [CrossRef] [Green Version]
  11. Scheidl, C.; Heiser, M.; Vospernik, S.; Lauss, E.; Perzl, F.; Kofler, A.; Kleemayr, K.; Bettella, F.; Lingua, E.; Garbarino, M.; et al. Assessing the protective role of alpine forests against rockfall at regional scale. Eur. J. For. Res. 2020, 139, 969–980. [Google Scholar] [CrossRef]
  12. Kanno, H.; Moriguchi, S.; Hayashi, S.; Terada, K. Development of a computational design optimization method for rockfall protection embankments. Eng. Geol. 2020, 284, 105920. [Google Scholar] [CrossRef]
  13. Lambert, S.; Toe, D.; Mentani, A.; Bourrier, F. A meta-model-based procedure for quantifying the on-site efficiency of rockfall barriers. Rock Mech. Rock Eng. 2021, 54, 487–500. [Google Scholar] [CrossRef]
  14. Douthe, C.; Girardon, C.; Boulaud, R. Sensitivity Analysis of the Global Response of Flexible Rockfall Barriers. Geosciences 2022, 12, 75. [Google Scholar] [CrossRef]
  15. Chen, Y.C.; Li, J.K.; Ran, L.G. A review of rockfall control measures along highway. Appl. Mech. Mater. 2013, 353, 2385–2391. [Google Scholar] [CrossRef]
  16. Mellies, G.; Nichols, J.; Matthew, M. A Review of Scaling as Rock Slope Remediation Method. In Proceedings of the 70th Highway Geology Symposium, Portland, OR, USA, 21–24 October 2019; pp. 591–609. Available online: https://www.highwaygeologysymposium.org/wp-content/uploads/70th_HGS-OPT.pdf (accessed on 15 June 2023).
  17. Laimer, H.J.; Müllegger, M.; Darsow, A. A New Engineering-Geological Classification Method for the Determination of Rock-Scaling Intervals Along Railways. Rock Mech. Rock Eng. 2022, 55, 1055–1067. [Google Scholar] [CrossRef]
  18. Farmakis, I.; Marinos, V.; Papathanassiou, G.; Karantanellis, E. Automated 3D jointed rock mass structural analysis and characterization using LiDAR terrestrial laser scanner for rockfall susceptibility assessment: Perissa area case (Santorini). Geotech. Geol. Eng. 2020, 38, 3007–3024. [Google Scholar] [CrossRef]
  19. Guerin, A.; Stock, G.M.; Radue, M.J.; Jaboyedoff, M.; Collins, B.D.; Matasci, B.; Avdievitch, N.; Derron, M.H. Quantifying 40 years of rockfall activity in Yosemite Valley with historical Structure-from-Motion photogrammetry and terrestrial laser scanning. Geomorphology 2020, 356, 107069. [Google Scholar] [CrossRef]
  20. Copons, R.; Vilaplana, J.M. Rockfall susceptibility zoning at a large scale: From geomorphological inventory to preliminary land use planning. Eng. Geol. 2008, 102, 142–151. [Google Scholar] [CrossRef]
  21. Merz, B.; Kuhlicke, C.; Kunz, M.; Pittore, M.; Babeyko, A.; Bresch, D.N.; Domeisen, D.I.; Feser, F.; Koszalka, I.; Kreibich, H.; et al. Impact forecasting to support emergency management of natural hazards. Rev. Geophys. 2020, 58, e2020RG000704. [Google Scholar] [CrossRef]
  22. Bühler, Y.; Bebi, P.; Christen, M.; Margreth, S.; Stoffel, L.; Stoffel, A.; Marty, C.; Schmucki, G.; Caviezel, A.; Kühne, R.; et al. Automated avalanche hazard indication mapping on a statewide scale. Nat. Hazards Earth Syst. Sci. 2022, 22, 1825–1843. [Google Scholar] [CrossRef]
  23. FOEN. Protection against Mass Movement Hazards: Guideline for the Integrated Hazard Management of Landslides, Rockfall and Hillslope Debris Flows; Federal Office for the Environment FOEN: Bern, Switzerland, 2016; Volume 1608, p. 97. [Google Scholar]
  24. Amt für Wald und Naturgefahren. Erfassungsbereiche. Available online: https://www.gr.ch/DE/institutionen/verwaltung/diem/awn/naturgefahren/naturgefahren-management/Seiten/3_1_2_erfassungsbereiche.aspx (accessed on 24 February 2023).
  25. Frattini, P.; Crosta, G.; Carrara, A.; Agliardi, F. Assessment of rockfall susceptibility by integrating statistical and physically-based approaches. Geomorphology 2008, 94, 419–437. [Google Scholar] [CrossRef]
  26. Hantz, D.; Corominas, J.; Crosta, G.B.; Jaboyedoff, M. Definitions and Concepts for Quantitative Rockfall Hazard and Risk Analysis. Geosciences 2021, 11, 158. [Google Scholar] [CrossRef]
  27. Heim, A. Bergsturz und Menschenleben; Fretz & Wasmuth: Zürich, Switzerland, 1932. [Google Scholar]
  28. Jaboyedoff, M.; Labiouse, V. Technical note: Preliminary estimation of rockfall runout zones. Nat. Hazards Earth Syst. Sci. 2011, 11, 819–828. [Google Scholar] [CrossRef] [Green Version]
  29. Torsello, G.; Vallero, G.; Milan, L.; Barbero, M.; Castelli, M. A Quick QGIS-Based Procedure to Preliminarily Define Time-Independent Rockfall Risk: The Case Study of Sorba Valley, Italy. Geosciences 2022, 12, 305. [Google Scholar] [CrossRef]
  30. Dorren, L.; Seijmonsbergen, A. Comparison of three GIS-based models for predicting rockfall runout zones at a regional scale. Geomorphology 2003, 56, 49–64. [Google Scholar] [CrossRef]
  31. Losey, S.; Wehrli, A. Schutzwald in der Schweiz: Vom Projekt Silvaprotect-ch zum Harmonisierten Schutzwald; Final Report; Bundesamt für Umwelt (BAFU): Bern, Switzerland, 2013; pp. 435–440. [Google Scholar]
  32. Swisstopo. Maps of Switzerland—Geology. 2023. Available online: https://s.geo.admin.ch/9f35b50614 (accessed on 10 May 2023).
  33. Pfiffner, O. Geologie der Alpen; Haupt Verlag: Bern, Switzerland, 2015; p. 400. [Google Scholar]
  34. Dorren, L. Rockyfor3D (v5.2) Revealed—Transparent Description of the Complete 3D Rockfall Model; ecorisQ Paper: Geneva, Switzerland, 2016; p. 33. Available online: https://www.ecorisq.org/publications/tools-manuals/rockyfor3d-user-manual/3-english/file (accessed on 15 June 2023).
  35. Dorren, L.; Maier, B.; Putters, U.; Seijmonsbergen, A. Combining field and modelling techniques to assess rockfall dynamics on a protection forest hillslope in the European Alps. Geomorphology 2004, 57, 151–167. [Google Scholar] [CrossRef]
  36. Dorren, L.; Berger, F.; le Hir, C.; Mermin, E.; Tardif, P. Mechanisms, effects and management implications of rockfall in forests. For. Ecol. Manag. 2005, 215, 183–195. [Google Scholar] [CrossRef]
  37. Dorren, L.; Berger, F.; Putters, U.S. Real-size experiments and 3-D simulation of rockfall on forested and non-forested slopes. Nat. Hazards Earth Syst. Sci. 2006, 6, 145–153. [Google Scholar] [CrossRef] [Green Version]
  38. Bourrier, F.; Dorren, L.; Nicot, F.; Berger, F.; Darve, F. Toward objective rockfall trajectory simulation using a stochastic impact model. Geomorphology 2009, 110, 68–79. [Google Scholar] [CrossRef] [Green Version]
  39. Corona, C.; Trappmann, D.; Stoffel, M. Parameterization of rockfall source areas and magnitudes with ecological recorders: When disturbances in trees serve the calibration and validation of simulation runs. Geomorphology 2013, 202, 33–42. [Google Scholar] [CrossRef]
  40. Cloutier, C.; Turmel, D.; Mayers, M.; Noël, F.; Locat, J. Projet ParaChute: Développement d’un Outil de Gestion intéGrée des Chutes de Pierres le Long D’infrastructures Linéaires; Rapport Technique 05-Rapport final LERN-ParaChute-2017-02; Laval University: Quebec, QC, Canada, 2017; p. 213. [Google Scholar]
  41. Kalsnes, B.; Solheim, A.; Sverdrup-Thygeson, K.; Dingsør-Dehlin, F.; Wasrud, J.; Indrevær, K.; Bergbjørn, K. Flom og Skred–Sikringsbehov for Eksisterende Bebyggelse (FOSS); Report nr.; NVE: Oslo, Norway, 2021; Volume 20, p. 87. [Google Scholar]
  42. Noël, F.; Cloutier, C.; Jaboyedoff, M.; Locat, J. Impact-Detection Algorithm That Uses Point Clouds as Topographic Inputs for 3D Rockfall Simulations. Geosciences 2021, 11, 188. [Google Scholar] [CrossRef]
  43. Bundesamt für Landestopografie; Swisstopo swissALTI3D: Wabern, Switzerland, 2020.
  44. Loye, A.; Jaboyedoff, M.; Pedrazzini, A. Identification of potential rockfall source areas at a regional scale using a DEM-based geomorphometric analysis. Nat. Hazards Earth Syst. Sci. 2009, 9, 1643–1653. [Google Scholar] [CrossRef]
  45. EOTA. ETAG 027—Guideline for European Technical Approval of Falling Rock Protection Kits; European Organisation for Technical Approvals: Brussels, Belgium, 2009. [Google Scholar]
  46. Pfeiffer, T.J.; Bowen, T.D. Computer simulation of rockfalls. Bull. Assoc. Eng. Geol. 1989, 26, 135–146. [Google Scholar] [CrossRef]
  47. Chau, K.T.; Wong, R.; Lee, C. Rockfall problems in Hong Kong and some new experimental results for coefficients of restitution. Int. J. Rock Mech. Min. Sci. 1998, 35, 662–663. [Google Scholar] [CrossRef]
  48. Dorren, L.; Heuvelink, G.B. Effect of support size on the accuracy of a distributed rockfall model. Int. J. Geogr. Inf. Sci. 2004, 18, 595–609. [Google Scholar] [CrossRef]
  49. Pichler, B.; Hellmich, C.; Mang, H.A. Impact of rocks onto gravel design and evaluation of experiments. Int. J. Impact Eng. 2005, 31, 559–578. [Google Scholar] [CrossRef]
  50. Waser, L.; Ginzler, C. Forest Type NFI. 2018. Available online: https://envidat.ch/#/metadata/forest-type-nfi (accessed on 15 June 2022).
  51. Waser, L.T.; Rüetschi, M.; Psomas, A.; Small, D.; Rehush, N. Mapping dominant leaf type based on combined Sentinel-1/-2 data—Challenges for mountainous countries. ISPRS J. Photogramm. Remote Sens. 2021, 180, 209–226. [Google Scholar] [CrossRef]
  52. Schaller, C.; Ginzler, C.; van Loon, E.; Moos, C.; Seijmonsbergen, A.C.; Dorren, L. Improving country-wide individual tree detection using local maxima methods based on statistically modelled forest structure information. Int. J. Appl. Earth Obs. Geoinf. 2023. in review. [Google Scholar]
  53. Dorren, L. FINT—Find Individual Trees; EcorisQ: Geneva, Switzerland, 2014; Available online: https://www.ecorisq.org/ecorisq-tools (accessed on 15 June 2023).
  54. Schaller, C.; Contributors. pyFINT: Python Implementation of FINT. 2022. Available online: https://zenodo.org/record/6543289 (accessed on 15 June 2023).
  55. Dorren, L.; Schaller, C.; Dumollard, G.; Erbach, A.; Horneber, H.; Kurt, M.; May, D.; Rosset, C.; Ginzler, C.; Fischer, C.; et al. FINT-CH (Find Individual Trees in CH)—Grossflächige Erfassung von Waldstrukturen und Dazugehörigen Kennzahlen Mittels Waldstrukturabgrenzung und Einzelbaumdetektion Basierend auf Luftgestützten Fernerkundungsdaten; Bern University of Applied Sciences—HAFL/WSL: Zollikofen/Birmensdorf, Switzerland, 2021. [Google Scholar]
  56. Loye, A.; Pedrazzini, A.; Jaboyedoff, M. Preliminary regional rockfall hazard mapping using lidar-based slope frequency distribution and conefall modelling. In Proceedings of the 4th Canadian Conference on Geohazards: From Causes to Management, Quebec, QC, Canada, 20–24 May 2008; Laval University Press: Quebec, QC, Canada, 2008. [Google Scholar]
  57. Wichmann, V. The Gravitational Process Path (GPP) model (v1. 0)–a GIS-based simulation framework for gravitational processes. Geosci. Model Dev. 2017, 10, 3309–3327. [Google Scholar] [CrossRef] [Green Version]
  58. Fell, R.; Corominas, J.; Bonnard, C.; Cascini, L.; Leroi, E.; Savage, W.Z. Guidelines for landslide susceptibility, hazard and risk zoning for land use planning. Eng. Geol. 2008, 102, 85–98. [Google Scholar] [CrossRef] [Green Version]
  59. Hollaus, M.; Aubrecht, C.; Höfle, B.; Steinnocher, K.; Wagner, W. Roughness mapping on various vertical scales based on full-waveform airborne laser scanning data. Remote Sens. 2011, 3, 503–523. [Google Scholar] [CrossRef] [Green Version]
  60. Du, L.; You, X.; Li, K.; Meng, L.; Cheng, G.; Xiong, L.; Wang, G. Multi-modal deep learning for landform recognition. ISPRS J. Photogramm. Remote Sens. 2019, 158, 63–75. [Google Scholar] [CrossRef]
  61. De Jong, M.G.; Sterk, H.P.; Shinneman, S.; Seijmonsbergen, A.C. Hierarchical geomorphological mapping in mountainous areas. J. Maps 2021, 17, 214–224. [Google Scholar] [CrossRef]
  62. Siqueira, R.G.; Veloso, G.V.; Fernandes-Filho, E.I.; Francelino, M.R.; Schaefer, C.E.G.; Correa, G.R. Evaluation of machine learning algorithms to classify and map landforms in Antarctica. Earth Surf. Process. Landforms 2022, 47, 367–382. [Google Scholar] [CrossRef]
  63. Volkwein, A.; Schellenberg, K.; Labiouse, V.; Agliardi, F.; Berger, F.; Bourrier, F.; Dorren, L.K.; Gerber, W.; Jaboyedoff, M. Rockfall characterisation and structural protection–A review. Nat. Hazards Earth Syst. Sci. 2011, 11, 2617–2651. [Google Scholar] [CrossRef] [Green Version]
  64. Castelli, M.; Torsello, G.; Vallero, G. Preliminary Modeling of Rockfall Runout: Definition of the Input Parameters for the QGIS plugin QPROTO. Geosciences 2021, 11, 88. [Google Scholar] [CrossRef]
  65. Žabota, B.; Repe, B.; Kobal, M. Influence of digital elevation model resolution on rockfall modelling. Geomorphology 2019, 328, 183–195. [Google Scholar] [CrossRef]
  66. Menk, J.; Berger, F.; Moos, C.; Dorren, L. Towards an improved rapid assessment tool for rockfall protection forests using field-mapped deposited rocks. Geomorphology 2023, 422, 108520. [Google Scholar] [CrossRef]
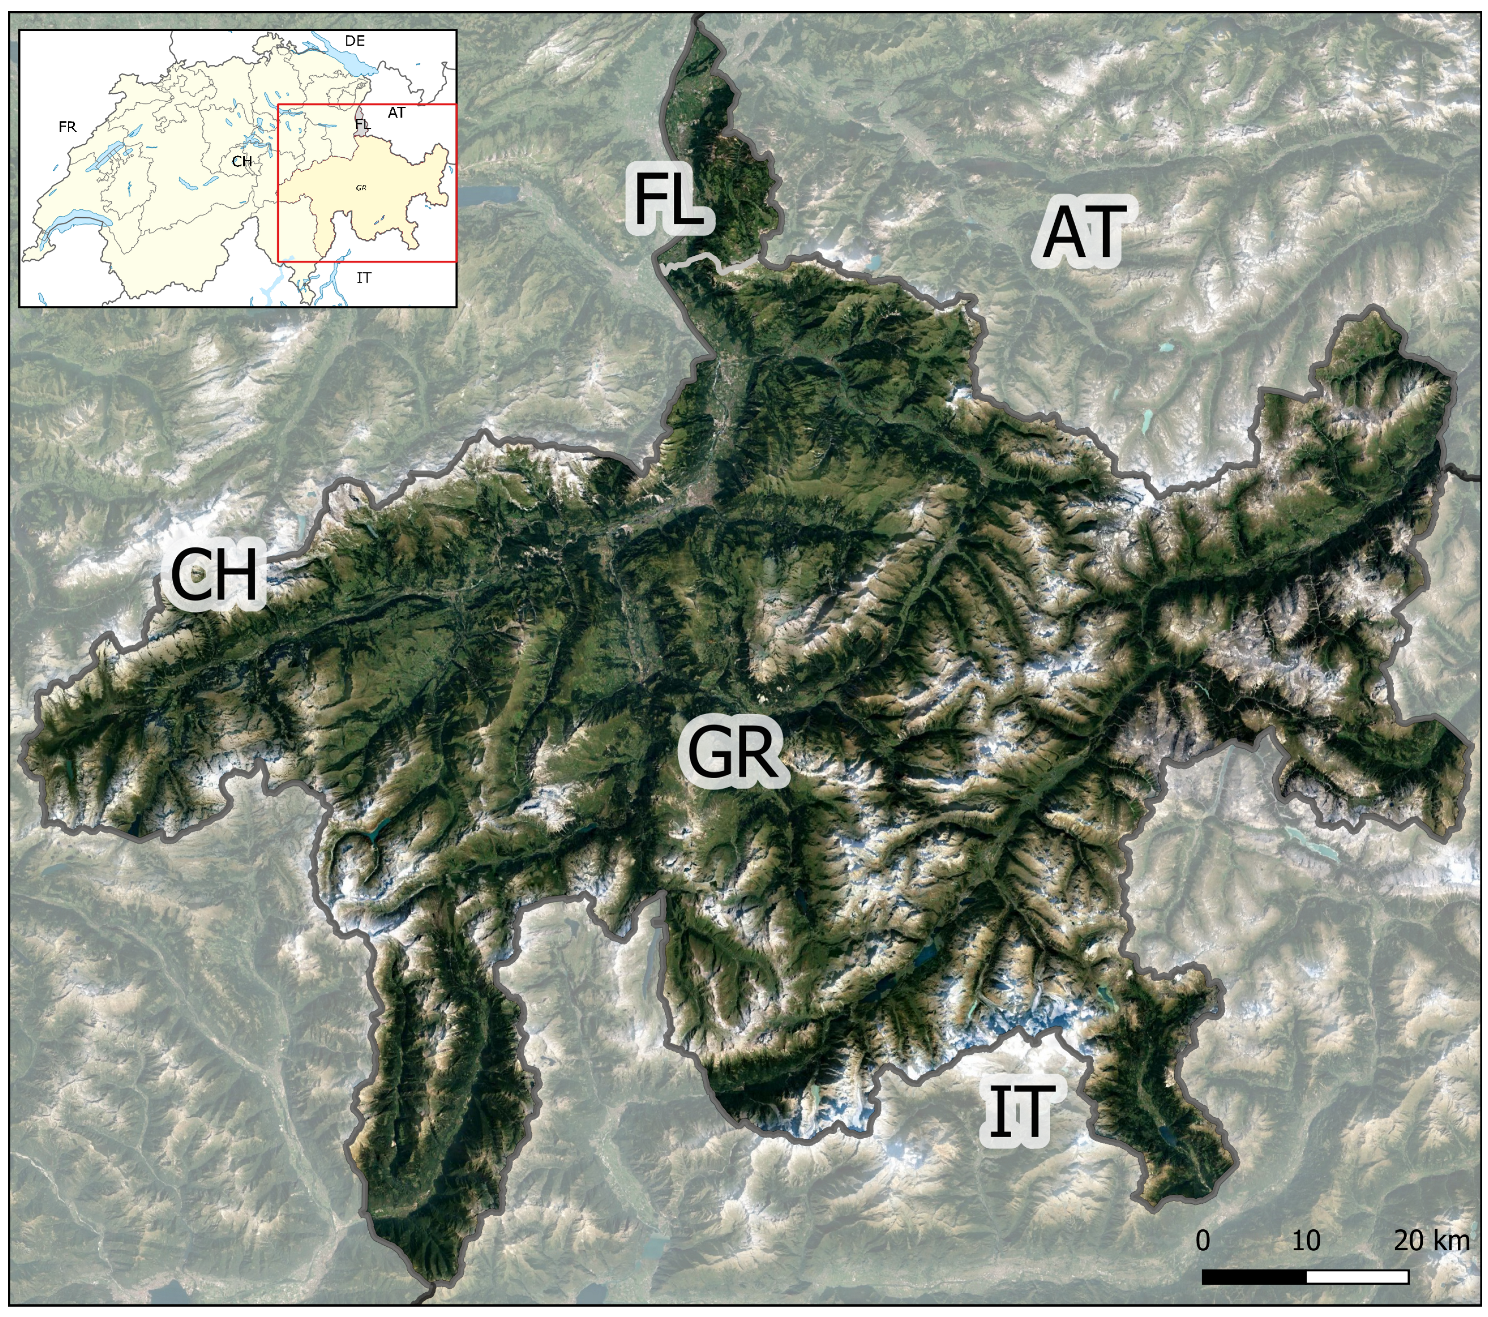
Figure 1. Map of the study area covering Liechtenstein (FL) and the canton GR in Switzerland (CH), surrounded by Austria (AT) and Italy (IT). Sources: Google satellite (Background); swisstopo boundaries and TLM for the lakes in the overview map.
Geosciences 13 00182 g001
Figure 2. Cumulative frequency (in black) and density (in blue) of the block volumes of the 1577 registered PE in the study area.
Geosciences 13 00182 g002
Figure 3. Examples of the simulated R e a c h _ p r o b rasters in the area around Sevgein in GR for three rock volume scenarios. Map (a) shows 0.2 m3 without forest and (b) with forest, (c) shows 1 m3 without forest and (d) with forest. Silent witnesses of the respective volumes are shown as pink points. Map (e) shows the cantonal rockfall hazard map with the high hazard zone in red and the residual hazard zone indicated by the hatched yellow stripes. The 300 yr return period (largest) block volume assumed for this hazard map was 3.5 m3—therefore, (f) shows the result of our 5 m3 simulation with forest to the right, as a comparison.
Geosciences 13 00182 g003
Figure 4. Distribution of block volumes in m 3 of PE from FL, distinguished according to whether they were reached by a simulated trajectory or not (yes/no).
Geosciences 13 00182 g004
Figure 5. Distribution of block volumes in m 3 of PE from GR, distinguished according to whether they were reached by a simulated trajectory or not (yes/no).
Geosciences 13 00182 g005
Figure 6. Distribution of block volumes in m 3 of PE from FL, distinguished according to whether they are located inside the generated HIZ or not (yes/no).
Geosciences 13 00182 g006
Figure 7. Distribution of block volumes in m 3 of PE from GR, distinguished according to whether they are located inside the generated generated HIZ delimited using a threshold of 1.3% or not (yes/no).
Geosciences 13 00182 g007
Figure 8. Distribution of the mean R e a c h _ p r o b values calculated at and around the position of mapped PE differentiated by volume classes (combined data from GR and FL).
Geosciences 13 00182 g008
Figure 9. Representation of the detected trees in Malans (GR; based on 2016 ALS data) with the 2022 aerial photograph from the swisstopo WMS server as background.
Geosciences 13 00182 g009
Figure 10. Visualisation of the emergence of low reach probability values below two or more superimposed release areas using simulations of the block volume 0.05 m3. Column left: Without forest, column right: With forest. Top row: number of source cells, middle row: number of simulated trajectories that passed per cell, bottom row: calculated reach probabilities. The corresponding explanation of the shown effect is given in the second last paragraph of the discussion.
Geosciences 13 00182 g010
Table 1. Data model for the slope material characterization.
Datasource and CriteriaSlope Material Characteristics
PriorityDatasource 1Datasource 2Datasource 3Roughness ClassSoil Type
1Start cells (Slope (0.5 m) ≥ 55 )Rock face, loose rock material or forest (TLM) no roughness6
2Roads (TLM)--no roughness7
3Railways (TLM)--low2
4Rock face (TLM)--no roughness6
5Loose rock material (TLM)Bergsturz deposits (Geocover)Slope (2 m) ≥ 25 medium4
6 Slope (2 m) < 25 high4
7 Scree and Talus deposits (Geocover)Slope (2 m) ≥ 25 low4
8 Slope (2 m) < 25 medium4
9Forest (TLM)Bergsturz deposits
(Geocover)
Slope (2 m) ≥ 25 medium4
10 Slope (2 m) < 25 high4
11 Scree and Talus deposits (Geocover)Slope (2 m) ≥ 25 low3
12 Slope (2 m) < 25 medium3
13Loose rock material (TLM)Alluvial fan (Geocover)-low3
14Forest (TLM)Alluvial fan (Geocover)-low3
15Rivers (TLM)--extreme0
16All other areasSlope (2 m) 0 –5 ,-no roughness1
17 Slope (2 m) 5 –25 ,-no roughness2
18 Slope (2 m) > 25 -no roughness3
Table 2. Used roughness classes defining the Rg-values.
Roughness ClassRg70 Value (in m)Rg20 Value (in m)Rg10 Value (in m)
no roughness000
low roughness0.050.10.2
medium roughness0.10.20.4
high roughness0.20.41.0
extreme roughness100100100
Table 3. Inputs for generating additional trees.
Diameter ClassMean DBH [cm]DBH Stddev [cm]
12 cm ≤ D B H < 24 cm181.6
24 cm ≤ D B H < 36 cm262
D B H ≥ 36 cm3810
Table 4. Content of tree files.
GRFL
Detected trees25,647,358844,696
Generated trees 12 cm D B H < 24 cm20,311,009792,410
Generated trees 24 cm D B H < 36 cm3,475,925121,951
Generated trees D B H 36 cm6,374,732156,162
Total trees in tree file55,809,0241,915,219
Disclaimer/Publisher’s Note: The statements, opinions and data contained in all publications are solely those of the individual author(s) and contributor(s) and not of MDPI and/or the editor(s). MDPI and/or the editor(s) disclaim responsibility for any injury to people or property resulting from any ideas, methods, instructions or products referred to in the content.