Abstract
As sea-level rise (SLR) and human-made interventions affect coastal currents and sediment transport, coastal barriers have become more vulnerable to the effect of storms, hurricanes, and climate variability. The response of each barrier is unique and depends on wave regime, coastline orientation, weather conditions, bathymetry, and type of human-made interventions, among other factors. In the Magdalena River deltaic barrier, located on the Colombian Caribbean coast, coastal erosion has caused the loss of hundreds of square kilometers of critical ecosystems, such as wetlands and lagoons, since the 1960s. This work aims to analyze the short-term drivers behind the observed loss of lagoons, particularly the drivers of lagoon breaching events and subsequent healing along the deltaic barrier. Lagoon breaching events and healings were detected using satellite imagery, and the timing of these events was related to prior local atmospheric, oceanographic, and fluvial conditions. The findings reveal that the dynamics of the lagoons are driven by extreme river discharges and energetic wave conditions associated with storms or hurricanes. Healing is driven by the sediment supplied by littoral currents and average waves punctuated by energetic events. The cumulative effect of breaching and healing has resulted in a deltaic barrier that has rolled over the lagoons, reducing their size over time. These findings provide a better understanding of the forces of coastal retreat and will help inform future management decisions of the coastal zone.
Keywords:
inlets; washouts; overwash; storms; cold fronts; lagoon; breaching events; Magdalena River; Colombian Caribbean; erosion; deltaic barrier 1. Introduction
Coastal barriers and their associated beach and dune systems are dynamic, unconsolidated sedimentary systems that respond to multiple forcers over various temporal scales, from episodic short-term events (e.g., wave energy and water level changes during storms) to longer-term processes (e.g., sea-level changes, storm pattern changes) [1]. These shore parallel landforms offer mainland protection against extreme events, and lagoons and wetlands, components of the back-barrier, are often highly productive ecologically [2,3]. Understanding the response of coastal barriers to drivers of change is key to explaining past behavior and forecasting potential paths of barrier evolution and the ecosystems that inhabit it.
Coastal barriers respond to changes in forcing processes by modifying their morphology and/or material composition [1]. The response of a coastal barrier to hydroclimatic disturbances is modulated by the frequency and intensity of the driver and the barrier geomorphology [4,5,6]. Particularly, the presence and relative location of foredunes and secondary dunes play a critical role in the response of a barrier to storms [6,7]. In the mid-term (decades to centuries), the fate of barrier islands—a type of coastal barrier—depends on their capacity to build upwards and landward to cope with SLR [8].
On barrier islands, two of the mechanisms that trigger their migration are overwashes and deposition of sand in flood-tidal deltas as a result of inlet formation [9,10,11]. These processes are caused by short-term events (e.g., storms), and their extent is generally less than 1 km2 [12]. Overwashes are wave-driven processes that trigger the flow of water and sediment over the beach berm or dune crest with no direct return to the ocean [11]. Inlet breachings refer to overwash events that, by generating a tidal inlet, open a temporal connection between the ocean and backbarrier landforms, such as lagoons, bays, marshes, and tidal creeks [13,14]. Inlet breachings and overwashes that are driven by oceanographic processes are both commonly caused by run-up above the highest cross-shore point of the beach profile due to a combination of tidal water level, barometric pressure variations, and the incoming wave field [5,11]; thus, both processes are considered genetically related [9] with overwashes generally taking place at lower storm thresholds than inlet breachings [15]. Due to this higher storm threshold and because the inlet remains open for periods of time ranging from months to years, cross-shore sediment transport tends to be larger during inlet breachings than during overwashes [15].
A second mechanism for inlet breaching coined washout, results from floodwaters flowing from the lagoon to the ocean [3]. Washouts occur when raised water levels in the backbarrier lagoon cause a hydraulic gradient and flow over the barrier in a seaward direction. Therefore, various mechanisms, acting either at the landward or seaward side of a coastal barrier to producing high run-up or raised lagoon water levels, might be responsible for breaching events. These mechanisms include onshore-offshore winds [16,17], storm-related waves [18,19,20,21], ocean-to-estuary hydrostatic head differences [3,21], and fluvial streamflows [22]. While overwash and inlet breaching (regardless of the mechanism) have been recognized as the main drivers of coastal barrier and lagoon morphodynamics elsewhere [1,3,9,15], the response of a landscape to these processes is not universal but site-specific [1], and their overall role in the long-term evolution of the barrier is poorly understood. The onshore displacement of sediment transfer resulting from the aforementioned mechanisms is fundamental to maintaining natural barrier resilience to rising sea levels and preventing the barrier from drowning [23].
Whether a coastal barrier recovers to its previous state following a disturbance or is altered permanently depends on characteristics such as barrier width, dune height, and distance to the mainland [24]. In the specific case of barrier breachings, recovery (i.e., healing time) varies according to local geomorphology and the interaction of waves, currents, and sediment supply [1]. It has been recognized that the height reduction in a barrier due to events such as storms increases vulnerability to new disturbances, which may prolong healing times if the storms are clustered in a short period of time [25,26]. Based on a study case in the Danube Delta (Black Sea), Zăinescu et al. [15] described a three-stage conceptual model of breach-healing following an oceanographic disturbance. Accordingly, the landward deposit near inlet openings may stabilize due to the establishment of pioneering vegetation and cause the shrinking of the lagoons [15]. For river-driven events, outwash deposits may provide a new sediment input to the coastline and a temporal outward building of the barrier.
Here we examine the lagoon breaching and healing processes of a deltaic barrier in the Colombian Caribbean. Using satellite imagery and 50 years of data on hydro-climatic variables, including wave and wind characteristics, river discharge, precipitation, and sea level pressure, we investigate (i) the drivers of lagoon breaching, (ii) conditions for lagoon healing, and (iii) the long term evolution of barrier width and lagoon shape. Determining the drivers of lagoon breaching and healing will provide insight into the process of coastal change and assist decision-making for the proper coastal management of retreating coastlines in the study site and other similar coastal barrier environments.
Regional Setting
The barrier and back-barrier lagoons that are the focus of this work are situated in a National Park on the Colombian Caribbean coast. The lagoons are located behind a narrow (1–800 m wide) sandy barrier surrounded by wetlands. From east to west, they are named Cuatro Bocas, Atascosa, Las Piedras, and El Torno (Figure 1).
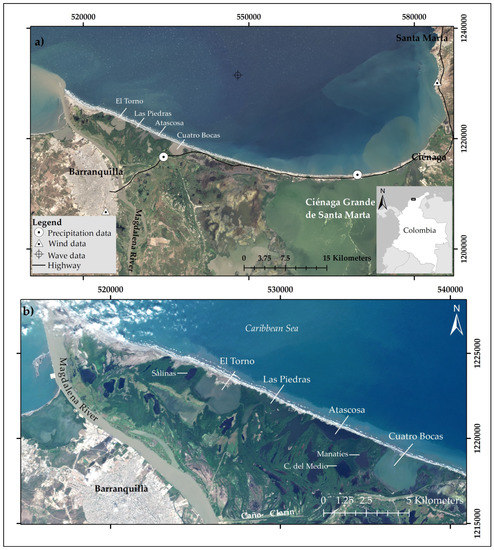
Figure 1.
Map of the Magdalena River delta and its marginal lagoons on the northeast coast of Colombia. (a) The coastline between the cities of Santa Marta and Barranquilla and the measuring stations are shown. (b) Zoom of lagoons that are the focus of this work, including from east to west: Cuatro Bocas, Atascosa, Las Piedras, and El Torno lagoons.
The Magdalena River, the largest fluvial system in Colombia, is connected to these lagoons via a network of natural channels. The mouth of the river is situated in a mixed-diurnal microtidal regime characterized by tides ranging between 0.13 and 0.40 m [27]. The small tidal ranges in the Caribbean Sea, at times, might be entirely masked by coupled meteorological and wave conditions [28]. No engineering structures have been made to control the freshwater flux out of the lagoons, but the flow is occasionally enhanced by dredging activities in one of the channels exiting the Cuatro Bocas lagoon; the most recent dredging operations were done in 2017 and 2020 [L. García, personal communication, March 2022]. Prior to the 1900s, this channel (known as Caño Clarín Viejo) was a natural navigational waterway used as a trade route [29], but after the 1920s, the ongoing engineering of the river mouth has produced a transition along the barrier from fluvial to marine-dominated conditions [30].
The hydro-climatology of the study area is influenced by the migration of the Intertropical Convergence Zone (ITCZ). The ITCZ defines a region where the trade winds of the Northern and Southern hemispheres converge, generating a low-pressure belt around the Equator that oscillates seasonally [31]. The weather in the Colombian Caribbean is controlled by the shift in the position of the ITCZ, resulting in a bimodal regime with two dry seasons (December–March and June–July) and two wet seasons (April–May, and August–November) [31]. Precipitation and river discharge can have substantial interannual variability [32] as a result of the influence of the cold (La Niña) or warm (El Niño) phases of the El Niño Southern Oscillation (ENSO). Specifically, there is a positive correlation between La Niña years and larger-than-average discharge values in the Magdalena River [31]. For instance, whereas the average discharge is around 7200 m3/s [32,33], an extreme water discharge of 16,463 m3/s was reported during the La Niña event of 2010 [27]. In contrast to the river discharge, the Caribbean trade winds are weakened during the La Niña years [33]. Aligned with the Caribbean trade wind system, northeasterly waves are predominant in the Colombian Caribbean, reaching their maximum significant wave heights between December–March and June–July [34]. Extreme wave conditions in the Colombian Caribbean are caused by either cold fronts or hurricanes [35,36,37]. Cold fronts are usually accompanied by heavy rains, gusty winds, and thunderstorms [38]. By increasing the atmospheric pressure gradient in the Caribbean Sea, cold fronts temporally increase wind speeds and wave heights in low-pressure areas along the front. In the Colombian Caribbean, cold fronts usually occur between December and May and peak in February [35]. Hurricanes, on the other hand, occur between June and November and follow a northwesterly path that usually hinders landfalls on the Continental Caribbean coast. Nonetheless, although uncommon, those hurricanes whose trajectory is in close proximity to the continental shore create the necessary fetch to produce energetic sea states that influence the morphodynamics of the Colombian Caribbean coast. For example, hurricanes Joan (October 1988), Lenny (November 1999) [37,39], Matthew (September–October 2016) [35,40], and Iota (November 2020) [35] created impactful forces on the Colombian Caribbean coast.
The volumes of long-shore sediment transport have not been quantified in the area, but the accumulation of sediment on the east side of groins built next to the Ciénaga Grande de Santa Marta mouth (Figure 1) indicates a predominant westward sediment transport [30,41]. Prior studies have revealed that the shoreline in the study site has been retreating at least since the early 1960s [29,30]. Peak values of coastal erosion have been reported along the stretch of coastline between the Cuatro Bocas and the La Atascosa lagoons [29,41], where most of the former parabolic dunes have been eroded (Figure 2). Local subsidence values of up to 1 cm/yr are considered a mid-term driver of coastal retreat [41]. An exception to the erosive trend takes place at the downdrift end of the littoral cell, along the stretch between the Magdalena River mouth and west of the El Torno lagoon [30].
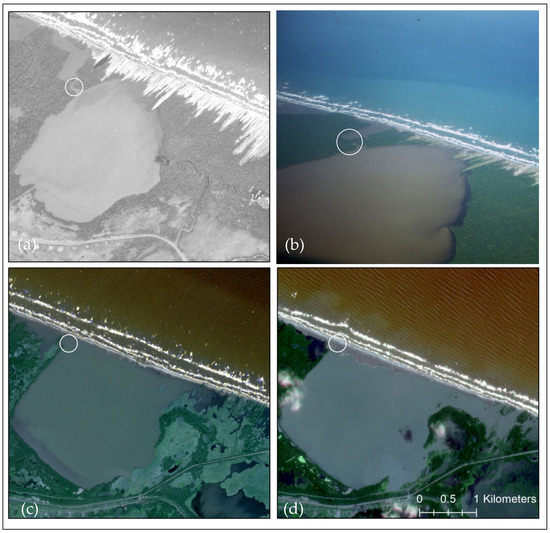
Figure 2.
Evolution of Cuatro Bocas lagoon as shown in (a) aerial photograph from 1954, (b) oblique aerial photograph from 1971, (c) Geoeye satellite image taken in 2011, and (d) Geoeye satellite image taken in 2020. The circle indicates the same location on each image. Geoeye imagery courtesy of Planet Labs.
2. Methodology
2.1. Hydro-Climatic Data
Time series of wave conditions, wind velocity and direction, precipitation, and river discharge were compiled in a database for the period 1973–2020 to examine their influence on lagoon breaching and healing. Hourly measurements of wind speed (WS) and direction (WD), precipitation (P), and river discharge (Q) were obtained from meteorological and flow gauging stations managed by the Colombian Institute of Hydrology, Meteorology and Environmental Studies (IDEAM). The location of the wind and precipitation gauges is shown in Figure 1; the river gauge, not shown in Figure 1, is located 109 km upstream of the Magdalena River mouth. No significant tributaries exist between this station and the Magdalena River mouth. Sea-level Pressure (SLP) was examined for the Caribbean Sea using the NCEP/NCAR reanalysis model provided by the National Oceanic and Atmospheric Administration (NOAA; https://psl.noaa.gov, accessed on 16 July 2022).
Modeled, gridded wave conditions for the Caribbean Sea based on wind data [42] obtained from the Japanese 55-year reanalysis (JRA-55) were gathered from an open-source database (https://digital.csic.es/handle/10261/241150, accessed on 6 October 2022) for the period 1973–2017. The same method used by Orejarena-Rondón et al. [42] was followed to obtain wave conditions for the period 2018–2020. From the wave-gridded data, time series of maximum daily significant wave height (Hs) and corresponding period (Tm) and wave direction were extracted for a virtual buoy offshore of the study site (location shown in Figure 1). Full details of the wave model simulation are given in Orejarena-Rondón et al. [42].
In order to account for the combined effect of significant wave height and period, the maximum daily wave energy flux was subsequently retrieved using the equation:
where WEF is the wave energy flux per unit of wave-crest length (kW/m) (hereafter wave energy), ρ is ocean water density (1023.6 kg/m3), and g is acceleration by gravity.
2.2. Coastal and Lagoon Changes, Breaching Events, and Recovery Period
Changes in lagoon size as well as the timing and extent of inlet breachings and duration of healings were tracked using satellite imagery for the period 1973–2020. The high periodicity of Landsat images (every 16 days) resulted in this dataset being the main source of information to track breaching and healing processes. In total, a dataset consisting of >100 Landsat 1, 4, 5, 7, and 8 scenes, spanning the years 1973 to 2020, was examined. When Landsat data were not available (e.g., between 1991–1995), temporal gaps were covered using other satellite platforms such as Ikonos (N = 5), SPOT (N = 4), or aerial photographs provided by the Colombian Survey Institute (IGAC) (N = 12). In addition, Planet Scope (N = 43) and RapidEye (N = 75) imagery, made available through the Planet Explorer platform (https://www.planet.com/explorer, accessed on 26 December 2022), supported the analysis of lagoon dynamics since December 2009. The imagery dataset was built with the aim of reducing the time span between consecutive images. Because of the combination of imagery from different platforms, pixel resolution differs in the dataset from as much as 60 m for the earliest Landsat images to 3 m for the most recent Planet Scope data.
The shape of the lagoons along the land-water limit was digitized manually, and changes in size and shape over time were assessed using STAMP, an ArcGIS-based tool [43] for spatial and temporal analysis of moving polygons. By carrying out a visual inspection of the imagery dataset, the timing of inlet breaches and the duration of healings were noted for the study period. Inlet breaching events were visually identified by the first appearance of a tidal inlet along the barrier. The end of a healing period was visually identified as the first image in which the barrier was connected again. A detailed analysis of inlet breachings was done for events where the availability of imagery enabled narrowing down the timing of the breaching event to within a period of fewer than three weeks. In other words, there is an overlaying assumption that inlet breaching is an episodic event that occurs prior to the detection of the inlet. In contrast, the healing of a lagoon was not considered episodic but rather a continuous process that can last months or even years.
Barrier width and coastline changes were quantified using a script for ArcGIS (Digital Shoreline Analysis System (DSAS)) [44] that allowed measuring the distance between the coastline and the seaward limit of the lagoons in 1973 and 2020. The barrier width for stretches of coast without lagoons was traced following the limit of the wetlands. Coastline changes were quantified using the Average Rate of Change (AOR) parameter of DSAS [44] for Landsat images taken on 2 January 1973, 2 September 1984, 26 June 2000, 20 May 2011, and 16 August 2020. The coastlines were manually traced along the wet-dry sand limit, which given the small tide range in the study area, provides a consistent measure of the Mean High Water Line (MHWL) [45,46,47].
2.3. Driver Analysis
Following Baileys et al. [48] and Rao et al. [49], we contrasted variations between event and non-event (background) hydro-climatic conditions to quantify the influence of the potential parameters on breaching and healing processes. Specifically, the potential role that wind and precipitation (representing local atmospheric conditions), sea-level pressure and wave energy (representing large-scale oceanographic drivers), and river discharge (representing fluvial input to the study area) play in the breaching or healing of any of the lagoons was analyzed by comparing average and event conditions for these variables. This exploratory analysis aimed to establish any causal relationship between episodic meteorological forces and their effect on the landscape.
Monthly non-event (background) conditions were established by calculating the median, 25th, and 75th percentile values of the data for each of the variables mentioned above. Similarly, event conditions were determined by calculating the median, 25th and 75th percentile for each variable prior to an event. Specifically, the percentiles for event conditions were calculated considering a five-day period within the 3 weeks prior to the first appearance of a breach in the imagery: the day with the peak values for each variable and two days before and after this peak value took place.
The difference between event and non-event (background) medians (DBM) was then expressed as a percentage of overall visual spread (OVS), where OVS is the range from the lowest to highest interquartile (25th and 75th quartiles). Assessing DBM as a percentage of OVS renders a quantification of distribution offset between event and non-event conditions for each of the hypothesized forcers [48] of lagoon breaching. Thus, large absolute values resulting from the DBM/OVS ratio (e.g., >20%) are indicative of conditions that are unlike average conditions for a particular month. The DBM/OVS ratios for the event and average conditions are contrasted using boxplots in conjunction with time series subsets of the parameters prior to specific events.
SLP variability for the Caribbean Sea preceding breaching events was analyzed based on daily reanalysis data provided by NOAA. A cross-section indicating the gradient in SLP across the Caribbean Sea supported the examination of this variable in lagoon breachings. Specifically, the rate of change (i.e., slope) of SLP along a profile starting by the Puerto Rico trench (north of Puerto Rico) and extending in a southwesterly direction to the study site was calculated for the day with the steepest gradient before the event. To exemplify this approach, Figure 3 illustrates the section (A-A’) used to quantify the gradient as well as SLP conditions on 26 May 1988.
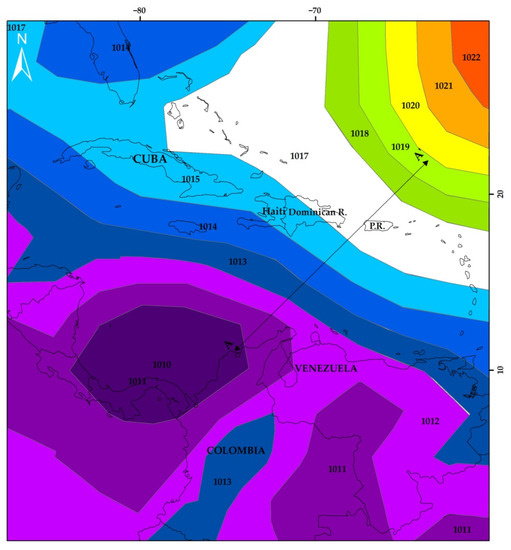
Figure 3.
Sea level pressure (mb) composite mean for 26 May 1988. Section A-A’ was traced to capture the gradient in SLP before a breaching event took place. Note that Puerto Rico was abbreviated as P.R. (Source of SLP values on https://psl.noaa.gov, accessed on 16 July 2022).
3. Results
3.1. Hydro-Climatic Conditions
The non-event (background) hydro-climatic conditions at the study site, as characterized by the median of all data for each month during the period 1970–2020 are shown in Figure 4. Winds predominantly from the north and northeast are highest (>5 m/s) in December-April and reach a minimum in September-November (Figure 4a,b). In tandem with maximum wind velocities, maximum values of SLP and wave energy occur between January and March, and a second peak takes place in June-July (Figure 4c,d). Minimum SLP and wave energy occur in September-November, coinciding with low wind speeds. Precipitation is lowest between December-March (dry season) and peaks (>160 mm/month) during the wet season in September-November (Figure 4e). Discharge values, as measured 109 km upstream of the Magdalena River mouth, are high (>8000 m3/s) in October-December and low in February-April following the dry season (Figure 4f). Figure 4g illustrates the Southern Oscillation Index (SOI) as retrieved from NOAA (https://www.cpc.ncep.noaa.gov/data/indices/soi, accessed on 24 May 2022). This index shows the timing of the ENSO circulation during the observation period with strong La Niña events (positive index) in 1971, 1975, 1989, 1996, 2000, 2009, 2011, 2018, and 2020.
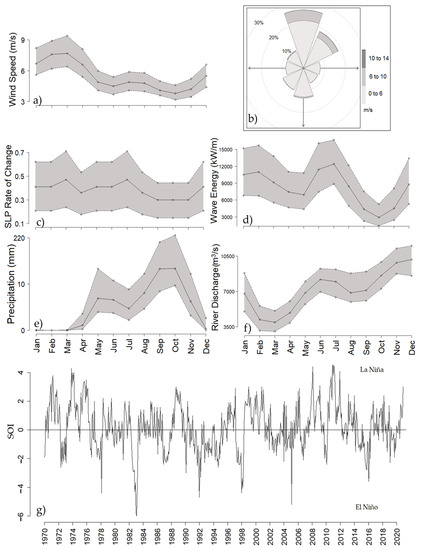
Figure 4.
Monthly median, 25th and 75th percentiles of (a) wind speed, (Barranquilla), (b) wind direction (Barranquilla), (c) sea-level pressure, (d) wave energy (virtual buoy), (e) precipitation (Barranquilla), (f) Magdalena River discharge (Calamar) and (g) yearly ENSO oscillations based on the SOI index. Note: Monthly SLP rates of change were assessed for the A-A’ profile shown in Figure 3.
3.2. Lagoon and Coastal Changes
Aerial extent and shape changes of four lagoons in the study area from 1973 to 2020 are illustrated in Figure 5. Forced by coastal retreat, the seaward limit of the lagoons has moved landward since 1973, resulting in a reduction in the areal extent of the water bodies of up to 2.00 km2 (51.4%), 0.74 km2 (30.5%), and 0.20 km2 (6.0%) for the lagoons La Atascosa, Las Piedras, and El Torno, respectively (Figure 5 and Supplementary Material S1).
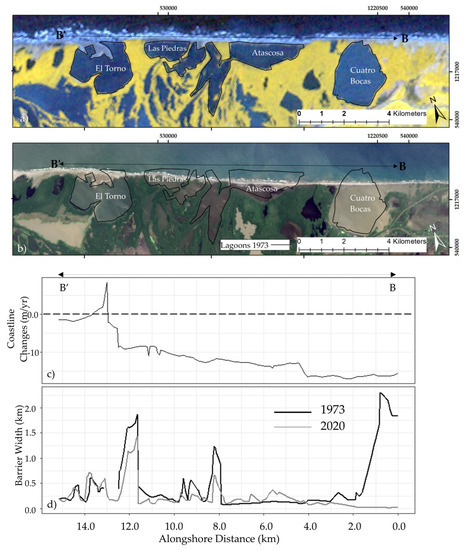
Figure 5.
Barrier and lagoon evolution as observed on (a) January 2, 1973, and (b) February 17, 2020; (c) average rate of coastline changes for 1973, 1984, 2000, 2011, and 2020 and (d) barrier width for transect B-B’ in 1973 and 2020.
Along the Cuatro Bocas lagoon, despite the landward retreat of the coastline, the water body has enlarged its area over time (by 2.3 km2/49.6% with respect to 1973) through encroaching adjacent wetlands (see Figure 5). In contrast, three small lagoons located at a distance away from the coast (i.e., Manatíes, Ciénaga del Medio, and Salinas) remained stable during the study period (Figure 1 and Figure 5). Overall, a general reduction in the barrier width has taken place from 1973–2020. The barrier width between the Cuatro Bocas and the La Atascosa lagoons has remained narrow through time, ranging from 0.05 to 0.250 km (Figure 5); the largest changes in the width occurred in areas that were occupied by mangrove forest (Figure 5).
3.3. Lagoon Breaching
A total of 33 breachings were discovered during the study period (13 for Cuatro Bocas, 10 for Atascosa, 10 for Las Piedras, and none for El Torno) (see Supplementary Material S2). Out of these 33 breaches, 13 events could be narrowed down to a span of at least three weeks since the last time that a lagoon was observed closed (Table 1). Previous work observed that El Torno Lagoon breached in 1967 [29], prior to our study period. Since the date of that breach cannot be restrained, it is not included in the breaches listed here. A comprehensive list of all the breachings and healings detected in this work, including those events which were not possible to bracket within a period of at least three weeks, is provided in Supplementary Material S2.

Table 1.
First appearance of lagoon breachings detected for the period 1973–2020. Maximum daily value and DBM/OVS expressed in percent in the three weeks prior to the first appearance for hydro-climatic variables. Note: Bold fonts indicate the variable(s) that likely caused the breaching event.
Table 1 indicates the maximum daily values of hydro-climatic variables in the 3 weeks prior to the event, together with the percentage of the ratio between DBM and OVS (see Methods). Positive percentages are indicative of conditions above the background condition; negative values are indicative of conditions below the background condition.
Apart from events 2, 5, and 13, all breachings occur following a period of increased wave energy, seven of which follow an increase larger than 35% (see DBM/OVS ratios for events 1, 3, 4, 6, 8, 9, and 12 in Table 1). Not all high-energy wave events correspond to periods of larger-than-average local wind speeds. For example, events 3 and 6 have values close to average wind speeds (DBM/OVS < 10%; Table 1), and event 4 has a lower-than-average wind speed preceding the breach. Only event 5 was preceded by wind speeds 53% stronger-than-average but lower-than-average wave energy. Five events occurred during periods of higher-than-average discharge, and eight occurred during periods of lower-than-average river discharge. Those lower-than-average discharge events coincided with periods of high-energy wave events. Of the 13 events, only event 11 was preceded by higher-than-average precipitation (DBM/OVS of 20%; Table 1); all other events occurred following periods corresponding with average (background) values. Aside from event 8, all the events were preceded by larger-than-average sea level pressure gradients along the transect A-A’ (Figure 3).
From all the potential triggering mechanisms of breachings considered in this work (regional wave energy and SLP, local wind forcing and precipitation, and river discharge), events appear to be either triggered by high regional wave fields or high river discharge, with local wind and precipitation playing no major role. The following subsections detail two events where high energy wave conditions were predominant (May 1988 and October 2016), and one event associated with high river discharge (May 2011).
3.3.1. High Wave Energy Breaching Event in May 1988 (Event 1)
High wave energy and northeasterly wind speeds of up to 12 m/s (55.6% and 42.1% DBM/OVS, respectively; Table 1) preceded the breaching of the Atascosa lagoon in May 1988 (Figure 6). Maximum wave energy conditions occurred on May 25th (25,024 kW/m) and were followed by three days of above-average wave energy levels. These conditions were associated with steep gradients in SLP between May 22 and 25, 1988, peaking on May 25 at values 42% higher than average values for May (see Figure 4c). Conversely, precipitation and river discharge values were average or below the average during May 1988 (0% and −10.2% DBM/OVS, respectively, Table 1). Nevertheless, a couple of showers affected the study area in late May (Figure 7c).
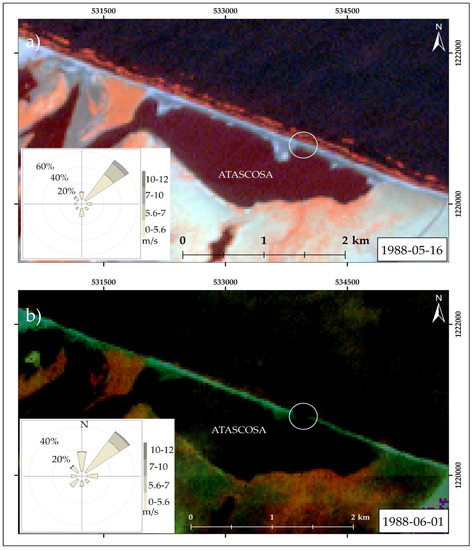
Figure 6.
Breaching process for Atascosa lagoon in May–June 1988. (a) The last image with no breach was taken on 16 May 1988. (b) The first image of the breach was taken on 1 June 1988. Wind roses indicate wind conditions two weeks prior to image acquisition. Landsat 4 images courtesy of U.S. Geological Survey. Images displayed combining bands 754.
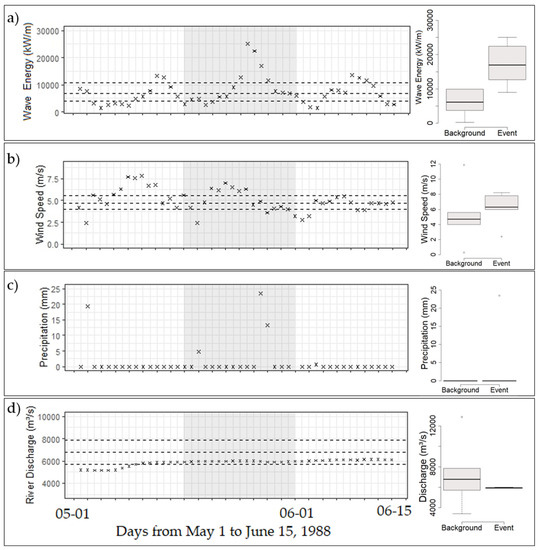
Figure 7.
Time series of potential drivers of a lagoon breaching in May 1988. The left panels indicate daily maximums for (a) wave energy, (b) wind speed, (c) precipitation, and (d) the Magdalena River discharge. Dashed lines show the 25th, 50th, and 75th percentiles for non-event conditions (background), and crosses indicate the conditions before, during (grey shaded area), and after a breaching event. Box plots on the right panels help visualize DBM/OVS ratios reported in Table 1.
3.3.2. High River Discharge Breaching Event in May 2011 (Event 5)
Four of the observed events experienced river discharge higher by >50% with respect to the expected background value (events 2, 5, 12, and 13 in Table 1). One of these events occurred in May 2011, resulting in a breach of the Las Piedras lagoon. The barrier was last observed closed on April 30, 2011 (Figure 8a), and an inlet and a plume of sediment extending from the wetlands adjacent to the lagoon towards the ocean are seen on the May 20, 2011, imagery (Figure 8b). Wave energy and wind speed in the three weeks prior to the detection of the breach fluctuated around average background values with few excursions above the 75th percentile (Figure 9b). The DBM/OVS values indicate overall lower-than-average wave conditions and above-average northerly winds. Precipitation occurs at the end of the month, but overall precipitation is not different from expected values (Figure 9c). Discharge, on the other hand, increased steadily and plateaued around mid-May and remained high for the rest of the month (Figure 9d).
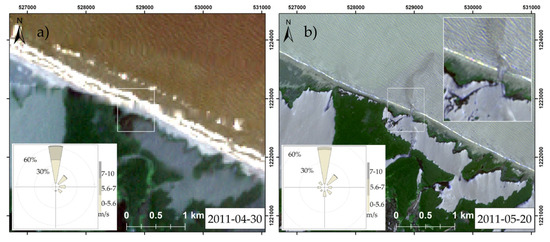
Figure 8.
Breaching process for Las Piedras lagoon in May 2011: (a) Last image with no breach taken on 30 April 2011. (b) The first image with the breach and sediment plume was taken on 20 May 2011. Wind roses indicate wind conditions two weeks prior to image acquisition. Rapideye imagery courtesy of Planet Labs.
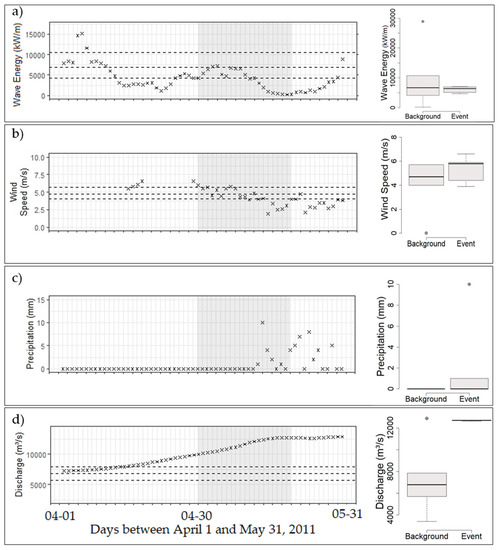
Figure 9.
Time series of potential drivers of a lagoon breaching in April–May 2011. The left panels indicate daily maximums for (a) wave energy, (b) wind speed, (c) precipitation, and (d) the Magdalena River discharge. Dashed lines show the 25th, 50th, and 75th percentiles for non-event conditions (background), and crosses indicate the conditions before, during (grey shaded area), and after a breaching event. Box plots on the right panels help visualize DBM/OVS ratios reported in Table 1.
3.3.3. High Wave Energy Breaching Event in October 2016 (Event 11)
By the time this event took place, the Cuatro Bocas and Atascosa lagoons had breached in April 2015 and February 2016, respectively (see events 6 and 9 in Table 1 and top panel in Figure 10). Nonetheless, the conditions prevailing during the event of October 2016 produced a second breach on the westernmost sector of the Atascosa lagoon, first seen on imagery from October 31, 2016 (bottom panel in Figure 10). Simultaneously with the appearance of this breach, a reduction in the width of the inlet in Cuatro Bocas from 262 to 161 m is observed (bottom panel in Figure 10). The evolution of this latter breach is detailed in Section 3.4.
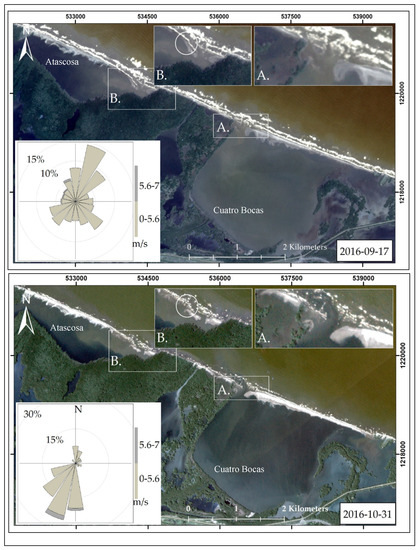
Figure 10.
Breaching process for the La Atascosa lagoon in October 2016. Top: the image was taken on 17 September 2016, showing prior breaches but an intact barrier otherwise. Bottom: image shows that a second breach was formed (circled area) in the Atascosa lagoon. Wind roses indicate wind conditions two weeks prior to image acquisition. Rapideye imagery courtesy of Planet Labs.
Between September and October 2016, the study site experienced the highest maximum wave energy, wind speed, and precipitation of all 13 events examined here, resulting in DBM/OVS = 97.6%, 76.9%, and 20.0%, respectively (Figure 11a–c, Table 1). River discharge measurements, on the other hand, indicated smaller-than-average conditions for October (DBM/OVS = −50.6; Table 1, Figure 11d). During the event, the maximum wave energy was more than double that of event 12, which experienced the second-highest maximum wave energy (Table 1). Specifically, wave energy peaked between November 30 and October 4, 2016 (Figure 11a). A switch from northeasterly to southwesterly wind direction is observed (Figure 10), and SLP gradients were above average by more than 50% (Table 1). This event matches the fading of Hurricane Matthew, which crossed the Caribbean Sea between 28 September and 16 October 2016 [50].
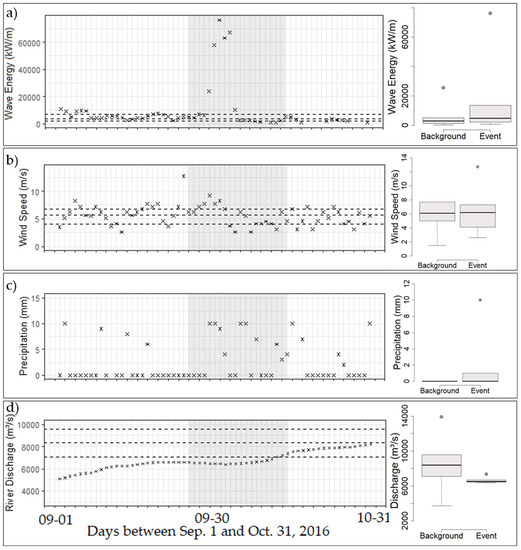
Figure 11.
Time series of potential drivers of a lagoon breaching in September–October 2016. The left panels indicate daily maximums for (a) wave energy, (b) wind speed, (c) precipitation, and (d) the Magdalena River discharge. Dashed lines show the 25th, 50th, and 75th percentiles of an average non-event (background), and crosses indicate the conditions before, during (grey shaded area), and after the event. Box plots on the right panels help visualize DBM/OVS ratios reported in Table 1.
3.4. Barrier Healing Processes
A summary of the 13 healing periods examined here is provided in Table 2. Note that the last detected breach (No. 13) was still open at the end of the observation period. Seven out of the thirteen healings were completed between January and May (Table 2). Out of these, some events (namely No. 1, 2, 5, 8, 10, 11, and 12 in Table 1 and Table 2) were breached for over 200 days. Breachings that took place after the first quarter of the year healed between April and July, less than 3 months after the lagoon had breached (namely No. 3, 4, 6, and 7 in Table 1 and Table 2). The shortest and longest span that a breach took to heal was in the La Atascosa lagoon, with 32 days (event 9) and 565 days (event 11), respectively. In the following, we will examine four sequential breaching-healing episodes in the Cuatro Bocas lagoon. The sequence started with a breach in the middle of the lagoon in April 2015; after the lagoon healed by July 2015, successive healings and breachings moved westward until April 2017, when the westernmost extreme of this lagoon was healed.
Table 2.
Lagoon healing conditions for the period 1973–2020.
Healing Processes between April 2015 and April 2017
After the first breaching of the Cuatro Bocas lagoon in April 2015 (Event 7 in Table 1), various breachings occurred, each westward from the previous event. The imagery of the two-year periods following the initial event and subsequent breaching and healing times are illustrated in Figure 12.
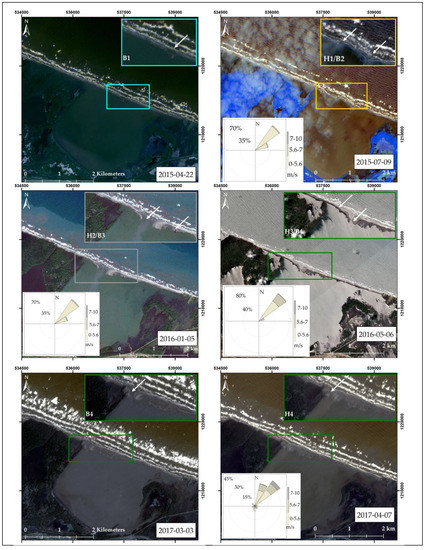
Figure 12.
The color-coded sequence of breaching (B)-healing (H) processes for Cuatro Bocas lagoon between April 2015 and April 2017. Wind Rose indicates wind conditions prior to the healing.
Healings typically took place during lengthy periods of fair weather that were at times interspersed by extreme wave energy events (Figure 13). For instance, no extreme conditions in wind speed, precipitation, or river discharge were observed during the healings highlighted in Figure 12 and Figure 13, and average wave energy values prevail most of the time during the healing periods (Figure 13a). Nonetheless, fair weather wave climate was punctuated by extremely high energy episodes in three of the four healings illustrated in Figure 12 (Figure 13, H1 (May–July 2015), H3 (November 2015–May 2016), and H4 (July 2016–April 2017)). Additionally, these healing processes were associated with northeasterly winds (Figure 12). Particularly, during the healing that occurred between July 2016 and April 2017 (H4), two high-energy wave pulses with values up to 40,000 kW/m and prevailing northeasterly winds underlie the last stages of the healing process (Figure 12 and Figure 13). By the beginning of March 2017, a peak of wave energy and northeasterly winds with speeds above 7.5 m/s occurred prior to a reduction in the inlet from 45 to 36 m (lower panel in Figure 12). Subsequently, another peak of wave energy occurred between 31 March and 6 April before the healing of the inlet (lower panel in Figure 12 and Figure 13a). Aside from some showers in October–November 2016, no increased precipitation was observed before the healings (Figure 13).
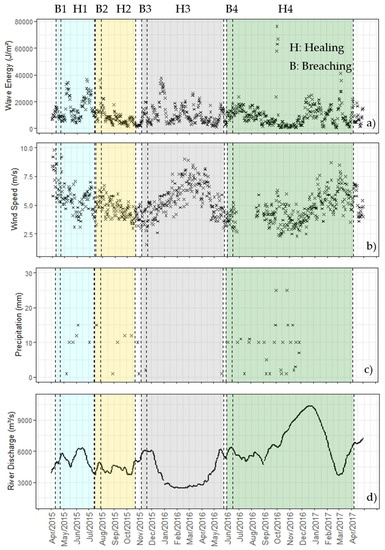
Figure 13.
Color-coded daily maximum of potential drivers of lagoon healing and breaching in Cuatro Bocas between April 2015 and April 2017. Panels indicate maximum daily values for (a) wave energy, (b) wind speed, (c) precipitation, and (d) the Magdalena River discharge. Vertical dashed lines indicate the ranges of breachings and healings.
3.5. Summary of Coastal Morphodynamics
A summary of the observed trends in coastline retreat, barrier and lagoon morphometry, and breaching and healing characteristics is provided in Figure 14 and Table 3. Accordingly, breaching occurs more often in the most erosive sector of the study area (i.e., along Cuatro Bocas), and on average, breachings along this sector also heal faster. High erosion rates in this sector also coincide with large changes in the area and shape of the Cuatro Bocas and La Atascosa lagoons for 1973–2020 (Figure 14 and Table 3). In contrast, the lower coastal erosion rates westward from La Atascosa are mirrored by smaller areal lagoon changes and a lower frequency of breachings in Las Piedras and El Torno lagoons. The largest inlet length was observed in the El Torno lagoon in January 1973 (Table 3).
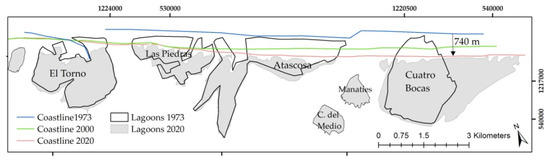
Figure 14.
Landward translation of coastlines and lagoons since 1973.
Table 3.
Distribution of average morphometry metrics for lagoons in the Magdalena River Deltaic Barrier for 1973–2020.
4. Discussion
Given the small number of events in this analysis (N = 13), we examined the importance of hydro-climatic parameters for lagoon breaching and healing by comparing the difference between event and non-event (background) conditions rather than performing a statistical analysis. Accordingly, extreme conditions of wave energy and/or river discharge coincided with the occurrence of the breachings and healings analyzed in this work (Table 1 and Table 2).
4.1. Drivers of Lagoon Breaching
4.1.1. Oceanographic Process Dominant
Most of the breaches analyzed in this work were preceded by increases in wave energy larger than 35% with respect to average conditions, which translated to wave heights larger than 2 m. These energetic sea states were often associated with northerly and northeasterly winds resulting from strong sea-level pressure gradients across the Caribbean Sea. In fact, with the exception of event 8, SLP was above average for all the events (Figure 4c and Table 1). Previous empirical evidence for other Caribbean sites has linked anticyclonic storm events to cold fronts [35,37,50,51]. Similarly, our findings indicate that the legacy of such events can be found in the breachings they trigger during high energy sea states that have traveled a distance from their source of generation; these storms are reflected in the local weather by sporadic showers and winds speeds above 6 m/s.
In addition to high wave energy resulting from cold fronts, high energy events associated with the passing of hurricanes in mid-August to late October may trigger the breaching of lagoons [3,20,21]. In the study area, hurricanes Lenny (November 1999) and Matthew (October-November 2016) enabled the breaching of the Atascosa lagoon (Event No. 11 in Table 1). Nonetheless, unlike the annual periodicity of cold fronts, extreme waves due to hurricanes rarely affect the Continental coast of Colombia [40].
4.1.2. River Process Dominant
Our analysis reveals that the Las Piedras and Atascosa lagoons are prone to washout coupled with river discharge values larger than 10,000 m3/yr. Such extreme discharges in the Magdalena River are common during La Niña years [31,33]. In fact, the four events with river discharge DBM/OVS percentages larger than 50% occurred during La Niña years (Figure 4g) between the months of May and September (i.e., 2000, 2011, 2018, 2020). As these increases are detected three weeks prior to the first detection of an event, it appears that there is a quick coupling between an increase in discharge at the upstream gauge station and a breach of the barrier (see the grey area in Figure 9d). Elsewhere, some examples of breachings associated with washouts have been reported on the Outer Banks of North Carolina [3,21], on the Ria Formosa Barrier Island in south Portugal [52], and on the Muni-Pomzadze lagoon in Ghana [53].
4.2. Lagoon Healing
Ten out of the 13 healing processes analyzed occurred during a period of increased wave energy, either during January–April or June–July (see Table 2). We detected that most of the breaches close within the next high-energy wave season and that only one breaching (No. 11 in Table 2) lasted over more than one wave season. High wave energy, therefore, might cause the lagoons to breach, but extreme energy events are also a driver of lagoon healing. Video-monitoring observations of shorelines and associated sandbars have shown that, depending on the absolute position of the sandbars and shoreline, the same level of high wave energy events can cause either erosion or accretion in different instances along a coastline [54]. Hurricane Matthew (September–October 2016) exemplified the mixed effect of an episode that breached the Atascosa lagoon while simultaneously reducing the size of an existing inlet in Cuatro Bocas (Figure 10). Previous reports of accretion due to elevated water levels associated with washovers have been described in the Skallingen Barrier, Denmark [23].
A spatial and temporal comparison of the distribution of historical and active inlets in the mid-Atlantic Bight on the U.S. East Coast found that, after being opened by storms, inlets along wave-dominated barrier islands migrate along the direction of longshore currents [55]. Similarly, our results show that once an inlet is formed, by trapping the sediment that otherwise would have traveled westward, a deficit of sediment downdrift is created downdrift. Thus, those areas located downdrift (i.e., westward) of an inlet are more prone to breach, and when there exist two simultaneous breachings, the easternmost (updrift) breach heals first (e.g., Event 5 in Table 2).
We postulate that the healing of breachings associated with oceanographic events has resulted in the landward displacement of the coastline observed and the shrinking of the lagoons (or encroachments onto the surrounding wetlands in the case of Cuatro Bocas). Similarly, the conceptual model developed by Zăinescu et al. [15] for the Danube Delta (Figure 15) shows aggradation and stabilization of the landward deposit following an oceanographic-driven breaching, resulting in a landward translation of the barrier. We extend this model to capture the coastline evolution following healings associated with washout (river driven) events (Figure 15d–f). Previous work points out that washouts provide a temporal setback to coastline transgression due to sediment depositing seaward from the barrier and contributing to short-term stabilization [3].
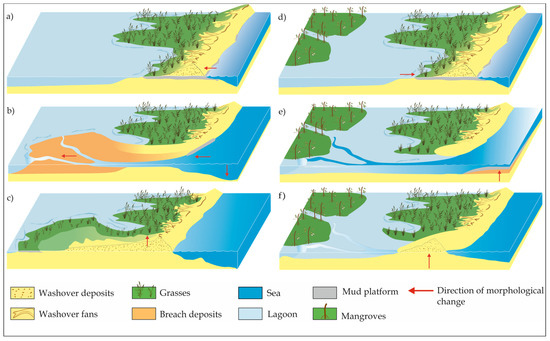
Figure 15.
Three-phase conceptual model of barrier evolution driven by an oceanographic breaching (left) and high discharge of river (right). Left side: (a) shoreline retreat and negative sediment balance prevail before the breaching; (b) depositional lobe results from the landward mobilization of sediment during the breaching, and (c) healing is followed by barrier aggradation and stabilization of the lagoon deposit, favored by colonizing vegetation species. Right side: (d) increased river discharge causes high lagoon water levels landward of the unbreached barrier; (e) breaching from the landward side causes subaqueous deposit seaward and aggradation of the shoreface, (f) followed by healing process and reduction in the lagoon size. Red arrows indicate the direction of significant morphological change (Modified from Zăinescu et al. [15]. (a–c) are reproduced from Zăinescu et al. [15], Figure 12).
In our study site, frequent breachings, particularly in the eastern portion, both triggered by oceanographic and river-driven events, complicates this conceptual model, where washout sediment may contribute to the aggradation of the shoreface, or sediment deposited landward may be disrupted from stabilizing by another breach. The long-lasting breach of the El Torno lagoon, which occurred prior to our study period and remained open for decades before healing, does point towards stabilization of the landward deposit; since the healing of this lagoon was completed in the mid-1980s [56], colonizing species (e.g., Sporobolus virginicus, Cyperus ligularis, and Sesuvium portulacastrum) have established over the barrier and developing embryo dunes [56].
4.3. Differential Evolution of the Deltaic Barrier
From the four lagoons analyzed in this study, the Cuatro Bocas and El Torno lagoons can be considered two end members with respect to the littoral transport and overall coastal dynamics (updrift/erosive regime and downdrift/accretive regime, respectively) [30,41]. Accordingly, the width of the barrier seaward of Cuatro Bocas and El Torno in 2020 was approximately 50 m and 700 m, respectively (Figure 5 and Figure 14 and Table 3). Interestingly, Cuatro Bocas increased in areal extent through encroaching adjacent wetlands, while the other lagoons decreased in size, with the largest shrinking occurring in the lagoons located just downdrift of Cuatro Bocas, where erosive regimes are predominant (Figure 5 and Figure 14). The variation in the barrier width is mirrored by the number of breaching events in each of these lagoons since 1973—13 and 0 for the Cuatro Bocas and El Torno lagoons, respectively—(Supplementary Material S2 and Table 3). Aagaard et al. [23] point out that, in relatively wide barriers (>400 m), overwash deposits and aeolian sediment is retained subaerially, whereas in narrow barriers, a significant volume of the overwash sediment is transported to backbarrier lagoons. As a result, narrow barriers will more often tend to migrate landward (i.e., through rollover), while wide barriers may recover through aggradation.
Even though alongshore sediment transport does not directly contribute to backbarrier evolution, it influences the evolution of a barrier by modulating its width and, consequently, the contribution of overwashes in the offshore-onshore transport of sediment [57]. The contribution of longshore sediment transport to the coastline morphodynamics was observed in the study area, where frequent breaching and healing have led to a landward displacement of the coastline, foredune erosion (Figure 2), and change in the shape of the lagoons (Figure 5) in updrift locations, whereas in the downdrift area, the coastline is accreting and no breachings were detected in the El Torno lagoon during the study period. Our findings of landward migration of the coastline through the landward displacement of sediment via breachings align with computer models that have identified that the landward migration of barrier islands (i.e., rollover) is supported by sediment delivered to the backbarrier through overwash [9,58] and breachings. As there is a critical barrier island width and height that needs to be met before waves overtop the dune/beach ridge and overwash reaches the backbarrier [58], a differential barrier response is expected based on the morphology. We observed average barrier widths equal to or less than 50 m before the breachings took place, but more systematic monitoring, using, for example, unmanned aerial vehicles, must be carried out to narrow down the critical width and elevation for the site-specific environmental conditions. Previous works have reported critical barrier widths of 122 m for overwashes to be effective in producing barrier island migration on the backbarrier shore of Assateague Island in Maryland [9], whereas a big breach on the Scalin Spit in the Danube Delta was preceded by a barrier width ranging between 50 and 150 m [15].
The general trend of barrier width reduction along the Deltaic Barrier (Figure 5) suggests that a further reduction in sediment supply resulting from, for example, building coastal defense structures updrift could trigger a breakdown of the longshore drift system and, as a result, drowning of the most vulnerable stretches of the barrier. To date, coastline retreat has taken place at the expense of the areal reduction in the lagoons, the Cuatro Bocas lagoon encroaching adjacent wetlands, as well as the erosion of foredunes (Figure 2) with possible implications for the sensitive wetland ecosystems. Recent government efforts to dredge and clean vegetation from some of the channels connecting the Magdalena River and the lagoons may help to strengthen the frequency of washouts. Although these interventions are aimed at restoring some of the former influence of the Magdalena River in the study area, they will likely not be able to account for the loss of sediment delivery to the study area since the early 1900s.
5. Conclusions
This work examines the hydro-climatic drivers behind lagoon breaching and healing and morphodynamic evolution along a deltaic barrier in the Colombian Caribbean. Our findings suggest that short-term drivers play a key role in the evolution of the deltaic barrier and may cause different effects along one stretch of coastline due to variations in morphology, sediment supply, and the driver behind the breaching event.
The lagoons analyzed in this work are along the Magdalena River deltaic barrier, though the river’s influence in the study area has been lessened due to engineering since the 1920s. The main triggers of the breaching of the barrier lagoons are storms, Magdalena River discharge oscillations, and, less frequently, hurricanes. Breachings are more prone to occur in narrow sectors of the barrier located updrift of the longshore sediment supply. Healing occurs following stormy conditions but may take several stormy seasons, particularly when the breached inlet is wide. Consequently, healing processes are driven by the interplay between peak wave energy events, fair weather conditions, and longshore sediment transport. Overall, the cumulative response of the lagoons to breachings and healings has resulted in the landward displacement of the coastline during at least the last 50 years—a reduction in barrier width and changes to the areal extent of the lagoons.
Supplementary Materials
The following supporting information can be downloaded at: https://www.mdpi.com/article/10.3390/geosciences13040118/s1, Supplementary Material S1 (videos of coastline and lagoon changes over time) and Supplementary Material S2 (comprehensive list of detected breachings and healings).
Author Contributions
J.F.G. performed the breaching-healing analysis with the support of E.K. J.F.G. performed coastal changes analysis with the assistance of I.J.W. A.F.O. developed and performed wave reanalysis models. All authors analyzed the results and contributed to the paper writing, editing, and revisions. All authors have read and agreed to the published version of the manuscript.
Funding
This project was supported by funding provided to EK through an NSERC Discovery Grant.
Acknowledgments
The authors thank the following individuals and institutions for their logistical and technical support: Emily Arvay, Evaristo Rada, Ismael Fernández, Santiago Otálora, Lina García, Oscar Alvarez-Silva, Jaime Ojeda, Luisa F. Ramírez, the program of Marine and Coastal Geosciences in Invemar, and the staff at Los Cocos office in Isla Salamanca National Park, Colombia. We gratefully acknowledge the valuable suggestions and comments provided by two anonymous reviewers.
Conflicts of Interest
The authors declare no conflict of interest.
References
- Cooper, J.A.G.; Green, A.N.; Loureiro, C. Geological constraints on mesoscale coastal barrier behaviour. Glob. Planet. Change 2018, 168, 15–34. [Google Scholar] [CrossRef]
- Davidson-Arnott, R. Introduction to Coastal Processes and Geomorphology, 1st ed.; Cambridge University Press: Cambridge, UK, 2010. [Google Scholar]
- Sherwood, C.R.; Andrew, C.R.; Over, J.R.; Kranenburg, C.J.; Warrick, J.A.; Brown, J.A.; Wright, C.W.; Aretxabaleta, A.L.; Zeigler, S.L.; Wernette, P.A.; et al. Sound-Side Inundation and Seaward Erosion of a Barrier Island During Hurricane Landfall. J. Geophys. Res. Earth Surf. 2023, 128, e2022JF006934. [Google Scholar] [CrossRef]
- Thieler, R.; Young, R. Quantitative Evaluation of Coastal Geomorphological Changes in South Carolina after Hurricane Hugo. J. Coast. Res. 1991, 8, 187–200. [Google Scholar]
- Sallenger, A.H., Jr. Storm impact scale for barrier islands. J. Coast. Res. 2000, 16, 890–895. [Google Scholar]
- Houser, C.; Hamilton, J.; Meyer-Arendt, K.; Oravetz, J. EOF Analysis of Morphological Response to Hurricane Ivan. Presented at the Coastal Sediments 2007. In Proceedings of the 6th International Symposium on Coastal Engineering and Science of Coastal Sediment Processes, American Society of Civil Engineers, New Orleans, Louisiana, 13–17 May 2007. [Google Scholar]
- Durán, R.; Guillén, J.; Ruiz, A.; Jiménez, J.A.; Sagristà, E. Morphological Changes, Beach Inundation and Overwash Caused by an Extreme Storm on a Low-Lying Embayed Beach Bounded by a Dune System (NW Mediterranean). Geomorphology 2016, 274, 129–142. [Google Scholar] [CrossRef]
- Ashton, A.D.; Lorenzo-Trueba, J. Morphodynamcis of Barrier Response to Sea-Level Rise. In Barrier Dynamics and Response to Changing; Moore, L.J., Murray, A.B., Eds.; Springer: Cham, Switzerland, 2018; pp. 277–304. [Google Scholar] [CrossRef]
- Leatherman, S.P. Migration of Assateague Island, Maryland, by inlet and overwash processes. Geology 1979, 7, 104–107. [Google Scholar] [CrossRef]
- Cowell, P.J.; Stive, M.J.F.; Niedoroda, A.W.; de Vriend, H.J.; Swift, J.P.; Kaminsky, G.M.; Capobianco, M. The Coastal-Tract (Part 1): A conceptual approach to aggregated modelling of low-order coastal change. J. Coast. Res. 2003, 19, 812–827. [Google Scholar]
- Donnelly, C.; Kraus, N.; Larson, M. State of Knowledge on Measurement Modeling of Coastal Overwash. J. Coast. Res. 2006, 22, 965–991. [Google Scholar] [CrossRef]
- Hudock, J.W.; Flaig, P.P.; Wood, L.J. Washover Fans: A Modern Geomorphologic Analysis and Proposed Classification Scheme To Improve Reservoir Models. J. Sediment. Res. 2014, 84, 854–865. [Google Scholar] [CrossRef]
- FitzGerald, D.M. Geomorphic variability and morphologic and sedimentologic controls on tidal inlets. J. Coast. Res. 1996, 23, 47–71. [Google Scholar]
- FitzGerald, D.M.; Fenster, M.S.; Argow, B.A.; Buynevich, I.V. Coastal Impacts Due to Sea-Level Rise. Annu. Rev. Earth Planet. Sci. 2008, 36, 601–647. [Google Scholar] [CrossRef]
- Zăinescu, F.I.; Alfred, V.-S.; Florin, T. The Formation and Closure of the Big Breach of Sacalin Spit Associated with Extreme Shoreline Retreat and Shoreface Erosion. Earth Surf. Process. Landf. 2019, 44, 2268–2284. [Google Scholar] [CrossRef]
- Morton, R.A.; Sallenger, A. Morphological impacts of extreme storms on sandy beaches and barrier. J. Coast. Res. 2003, 19, 560–573. [Google Scholar]
- Pierce, J.W. Tidal Inlets and Washover Fans. J. Geol. 1970, 78, 230–234. [Google Scholar] [CrossRef]
- El-Ashry, M.T.; Wanless, H.R. Birth and early growth of a tidal delta. J. Geol. 1965, 73, 404–406. [Google Scholar] [CrossRef]
- Aubrey, D.G.; Speeer, P.E. Updrift Migration of Tidal Inlets. J. Geol. 1984, 92, 531–545. [Google Scholar] [CrossRef]
- Hapke, C.J.; Brenner, O.; Hehre, R.; Reynolds, B.J. Coastal Change from Hurricane Sandy and the 2012-13 Winter Storm Season: Fire Island, New York (Report No. 1231); United States Geological Survey: Reston, VA, USA, 2013.
- Miselis, J.L.; Andrews, B.D.; Nicholson, R.S.; Defne, Z.; Ganju, N.K.; Navoy, A. Evolution of Mid-Atlantic Coastal and Back-Barrier Estuary Environments in Response to a Hurricane: Implications for Barrier-Estuary Connectivity. Estuaries Coasts 2016, 39, 916–934. [Google Scholar] [CrossRef]
- Rich, A.; Keller, E.A. A hydrologic and geomorphic model of estuary breaching and closure. Geomorphology 2013, 191, 64–74. [Google Scholar] [CrossRef]
- Aagaard, T.; Kroon, A. Decadal behaviour of a washover fan, Skallingen Denmark. Earth Surf. Process 2019, 44, 1755–1768. [Google Scholar] [CrossRef]
- Kombiadou, K.; Costas, S.; Carrasco, R.; Plomaritis, T.A.; Ferreira, O.; Matias, A. Bridging the Gap between Resilience and Geomorphology of Complex Coastal Systems. Earth-Sci. Rev. 2019, 198, 102934. [Google Scholar] [CrossRef]
- Ferreira, O. Prediction of the impact of cluster storms and their importance in coastal evolution, Coastal Engineering 2002. In Proceedings of the 28th International Conference, World Scientific Publishing Company, Cardiff, Wales, 7–12 July 2002. [Google Scholar] [CrossRef]
- Houser, C.; Hamilton, S. Sensitivity of post-hurricane beach and dune recovery to event frequency. Earth Surf. Process. Landforms 2009, 34, 613–628. [Google Scholar] [CrossRef]
- Ospino, S.; Restrepo, J.C.; Otero, L.; Pierini, J.; Alvarez-Silva, O. Saltwater Intrusion into a River with High Fluvial Discharge: A Microtidal Estuary of the Magdalena River, Colombia. J. Coast. Res. 2018, 34, 1273. [Google Scholar] [CrossRef]
- Kjerfve, B. Tides of the Caribbean Sea. J. Geophys. Res. 1981, 86, 4243–4247. [Google Scholar] [CrossRef]
- Von Erffa, A.F. Sedimentation, transport und erosion an der nordkuste kolumbiens zwischen Barranquilla und der Sierra Nevada de Santa Marta. Boletín Investig. Científicas Colombo-Alemán 1973, 7, 155–209. [Google Scholar]
- Gómez, J.F.; Byrne, M.L.; Hamilton, J.; Isla, F. Historical Coastal Evolution and Dune Vegetation in Isla Salamanca National Park, Colombia. J. Coast. Res. 2016, 33, 632. [Google Scholar] [CrossRef]
- Poveda, G. La hidroclimatología de Colombia: Una síntesis desde la escala inter-decadal hasta la escala diurna. Rev. De La Acad. Colomb. De Cienc. Exactas Físicas Nat. 2004, 28, 201–222. [Google Scholar]
- Restrepo, J.D.; Kjerfve, B. Magdalena River: Interannual Variability (1975–1995) and Revised Water Discharge and Sediment Load Estimates. J. Hydrol. 2000, 235, 137–149. [Google Scholar] [CrossRef]
- Hastenrath, S. Diagnostic and Prediction of Anomalous River Discharge in Northern South America. J. Clim. 1990, 3, 1080–1096. [Google Scholar] [CrossRef]
- Appendini, C.M.; Urbano-Latorre, C.P.; Figueroa, B.; Dagua-Paz, C.J.; Torres-Freyermuth, A.; Salles, P. Wave energy potential assessment in the Caribbean Low Level Jet using wave hindcast information. Appl. Energy 2015, 137, 375–384. [Google Scholar] [CrossRef]
- Ortiz-Royero, J.C.; Otero, L.J.; Restrepo, J.C.; Ruiz, J.; Cadena, M. Cold fronts in the Colombian Caribbean Sea and their relationship to extreme wave events. Nat. Hazards Earth Syst. Sci. 2013, 13, 2797–2804. [Google Scholar] [CrossRef]
- Otero, L.J.; Ortiz, J.C.; Ruiz-Merchan, J.K.; Higgins, A.E.; Henriquez, S.A. Storms or Cold Fronts: What is Really Responsible for the Extreme Waves Regime in the Colombian Caribbean Coastal Region? Nat. Hazards Earth Syst. Sci. 2016, 16, 391–401. [Google Scholar] [CrossRef]
- Bernal, G.; Osorio, A.F.; Urrego, L.; Peláez, D.; Molina, E.; Zea, S.; Montoya, R.D.; Villegas, N. Occurrence of energetic extreme oceanic events in the Colombian Caribbean coasts and some approaches to assess their impact on ecosystems. J. Mar. Syst. 2016, 164, 85–100. [Google Scholar] [CrossRef]
- Hsu, S.A. Coastal Meteorology; Academic Press: San Diego, CA, USA, 1988. [Google Scholar]
- Cueto, J.E.; Otero Díaz, L.J.; Ospino-Ortiz, S.R.; Torres-Freyermuth, A. The role of morphodynamics in predicting coastal flooding from storms on a dissipative beach with sea level rise conditions. Nat. Hazards Earth Syst. Sci. 2022, 22, 713–728. [Google Scholar] [CrossRef]
- Ortiz-Royero, J.C.; Cera, S.H.; Gomes, H. Coastal Meteo-marine Parameters of Hurricane Matthew along the Colombian Caribbean Coast: Establishing a Baseline of Knowledge. J. Coast. Res. 2021, 38, 66–76. [Google Scholar] [CrossRef]
- Gómez, J.F.; Kwoll, E.; Walker, I.J.; Shirzaei, M. Vertical Land Motion as a Driver of Coastline Changes on a Deltaic System in the Colombian Caribbean. Geosciences 2021, 11, 300. [Google Scholar] [CrossRef]
- Orejarena-Rondón, A.F.; Sayol, J.-M.; Hernández-Carrasco, I.; Cáceres-Euse, A.; Restrepo, J.C.; Orfila, A. Spatio-temporal variability of mean wave energy flux in the Caribbean Sea. J. Ocean Eng. Mar. Energy 2022, 9, 25–41. [Google Scholar] [CrossRef]
- Robertson, C.; Nelson, T.A.; Boots, B.; Wulder, M.A. STAMP: Spatial–temporal Analysis of Moving Polygons. J. Geogr. Syst. 2007, 9, 207–227. [Google Scholar] [CrossRef]
- Thieler, E.R.; Martin, D.; Ergul, A. The Digital Shoreline Analysis System: Shoreline Change Measurement Software Extension; for ArcView; Woods Hole Coastal and Marine Science Center: Barnstable, MA, USA, 2003; Report No. 03–076.
- Dolan, R.; Hayden, P.; May, P.; May, S. The Reliability of Shoreline Change Measurements from Aerial Photographs. Shore Beach 1980, 48, 42–49. [Google Scholar]
- Moore, L.J. Shoreline Mapping Techniques. J. Coast. Res. 2000, 16, 111–124. [Google Scholar]
- Dean, G.D.; Dalrymple, R.A. Coastal Processes with Engineering Applications, 1st ed.; Cambridge University Press: New York, NY, USA, 2004. [Google Scholar]
- Bailey, L.P.; Clare, M.A.; Rosenberger, K.J.; Cartigny, M.J.B.; Talling, P.J.; Paull, C.K.; Gwiazda, R.; Parsons, D.R.; Simmons, S.M.; Xu, J.; et al. Preconditioning by sediment accumulation can produce powerful turbidity currents without major external triggers. Earth Planet. Sci. Lett. 2021, 562, 116845. [Google Scholar] [CrossRef]
- Rao, J.S.; Liu, H. Discordancy Partitioning for Validating Potentially Inconsistent Pharmacogenomic Studies. Sci. Rep. 2017, 7, 15169. [Google Scholar] [CrossRef]
- Mendoza, T.; Trejo-Rangel, M.A.; Salles, P.; Appendini, C.M.; Lopez-Gonzalez, J.; Torres-Freyermuth, A. Storm Characterization and Coastal Hazards in the Yucatan Peninsula. J. Coast. Res. 2013, 65, 790–795. [Google Scholar] [CrossRef]
- Rey, W.; Salles, P.; Torres-Freyermuth, A.; Ruíz-Salcines, P.; Teng, Y.-C.; Appendini, C.M.; Quintero-Ibáñez, J. Spatiotemporal Storm Impact on the Northern Yucatan Coast during Hurricanes and Central American Cold Surge Events. J. Mar. Sci. Eng. 2019, 8, 2. [Google Scholar] [CrossRef]
- Matias, A.; Ferreira, O.; Vila-Concejo, A.; Garcia, T.; Dias, J.A. Classification of Washover Dynamics in Barrier Islands. Geomorphology 2008, 97, 655–674. [Google Scholar] [CrossRef]
- Davies-Vollum, K.S.; Zhang, Z.; Agyekumhene, A. Impacts of Lagoon Opening and Implications for Coastal Management: Case Study from Muni-Pomadze Lagoon, Ghana. J. Coast. Conserv. 2019, 23, 293–301. [Google Scholar] [CrossRef]
- Van de Lageweg, W.I.; Bryan, K.R.; Coco, G.; Ruessink, B.G. Observations of shoreline–sandbar coupling on an embayed beach. Mar. Geol. 2013, 344, 101–114. [Google Scholar] [CrossRef]
- McBride, R.A. Spatial and Temporal Distribution of Historical and Active Tidal Inlets: Delmarva Peninsula and New Jersey, USA. In Coastal Sediments 1999, 1505–1521; American Society of Civil Engineers: New York, NY, USA, 1999. [Google Scholar]
- Gomez, J.F. Dune and Coastal Evolution in Isla Salamanca National Park, Colombia. Master’s Thesis, Wilfrid Laurier University, Waterloo, ON, USA, 2015. [Google Scholar]
- Jiménez, J.A.; Sánchez-Arcila, A. A Long-Term (Decadal Scale) Evolution Model for Microtidal Barrier Systems. Coast. Eng. 2004, 51, 749–764. [Google Scholar] [CrossRef]
- Lorenzo-Trueba, J.; Ashton, A.D. Rollover, Drowning, and Discontinuous Retreat: Distinct Modes of Barrier Response to Sea-Level Rise Arising from a Simple Morphodynamic Model. J. Geophys. Res. Earth Surf. 2014, 119, 779–801. [Google Scholar] [CrossRef]


Disclaimer/Publisher’s Note: The statements, opinions and data contained in all publications are solely those of the individual author(s) and contributor(s) and not of MDPI and/or the editor(s). MDPI and/or the editor(s) disclaim responsibility for any injury to people or property resulting from any ideas, methods, instructions or products referred to in the content. |
© 2023 by the authors. Licensee MDPI, Basel, Switzerland. This article is an open access article distributed under the terms and conditions of the Creative Commons Attribution (CC BY) license (https://creativecommons.org/licenses/by/4.0/).