Abstract
This paper investigates the possibility to detect the short-time evolution of the slow-moving Vomice earth flow, located in the northeastern sector of the Calabria region (South Italy), by combining the information obtained from two different drone flights, carried out in February 2019 and June 2022, with field surveys. The obtained results consisted of delimiting all landslide bodies constituting the Vomice earth flow, detecting landslide types and the state of activity, as well as identifying spatial and volumetric changes. The obtained results showed that depletion and transition zones of the Vomice earth flow are active, while the accumulation zone appears prevalently dormant. Particularly, in the analyzed period, the depletion zone was characterized by local collapses of the main scarps where several slides evolving in earth flows caused more than 20 m of retrogressive fail upslope. The maximum elevation changes observed in these zones were about ±5 m. The volume of the material mobilized by mass movements was about 114.2 × 10³ m3, whereas the volume of the accumulated material was approximately 92.7 × 10³ m3. The transition zone was affected by several slow earthflows that re-mobilized the displaced material located in the middle portion of the landslide and reached the accumulation zone. Overall, the results of this study demonstrated the practicality and feasibility of using UAV tools for detecting the short-time evolution of a large landslide.
1. Introduction
Landslides are one of the most widespread geomorphic processes in many mountain regions and they play an important role in the present-day morphological evolution of mountain landscapes.
The evolution of a landslide is influenced by a complex interaction of geological, geomorphological, and hydrological processes, during which the formation of landslide crowns, trenches, and surface cracks could be observed [1]. Hence, identification, mapping, and monitoring of landslide areas are of high importance for a rigorous landslide analysis [2].
Owing to its geological, geomorphological, and climatic conditions [3,4,5,6,7], the Italian mountain landscape and, in particular, the southern Apennine chain (South Italy) is characterized by a high landslide density. A landslide typology recurrently occurring in this area is the slow-moving earthflow [4,8,9,10,11]. Such landslides may cause extensive damage to property and man-made structures [8,9,12].
The high concentration of earthflows in this sector of southern Italy is mainly linked to a widespread outcrop of clayey materials [13,14,15]. Earthflows involve plastic, clayey soils [16], and are generally morphologically defined by a wide amphitheater-shaped source area, a transport zone with a narrow and elongated shape, and a lobed deposition area characterized by numerous compressional features [5,15,17,18].
Displacements usually begin in the source areas with a sliding along well-defined basal and lateral surfaces [16] and then gradually progress with faster episodic events that alternate with slow motion or non-motion periods [16,19,20,21]. In some cases, the periods of more rapid surges can cause regression of the main scarp and the movement of the material as a downward flow; in other cases, they can cause more complex conditions with the formation of different types of landslides along the same slope [16,22,23]. In both cases, the precision mapping and the recognition of various landslide bodies are essential issues to accurately identify landslide morphological evolution [20] and to advance knowledge about landslide deformation mechanisms as well as to assess and manage landslide risk [24,25].
Despite recent advances, landslide analysis is still an open issue that requires new methods and techniques to better understand landslide dynamics and space–time evolution. Several recent techniques, such as the Global Positioning System (GPS) [26], Synthetic Aperture Radar Interferometry (InSAR) [27], Light Detection and Ranging (LiDAR) [28], and unmanned aerial vehicle (UAV) systems [29,30,31] have been largely applied for mapping and monitoring landslide evolution. In particular, the rapid development of UAV systems equipped with optical cameras has improved the capability to acquire 2D and 3D data to investigate geomorphological features and morphometry parameters, and quantify the landslide mobilized volume and velocity [32,33,34,35]. In addition, the combination between UAV photogrammetry products and geographic information system (GIS) analysis is an approach commonly used for landslide multi-temporal analysis and geomorphic process mapping. The main advantage of UAV use is the capability to obtain very detailed data in quasi real time that, if integrated with traditional fieldwork methods, can be profitably used in landslide monitoring [35,36,37].
A relatively recent and widely used technique for UAV-derived data is the structure from motion (SfM) algorithm [32,37,38,39,40,41,42,43]. The SfM-UAV technique, compared with other topographic acquisition techniques, is a low-cost, fast, and flexible technique which allows capturing photos of large areas, also in poorly accessible landslide-prone areas, and mapping and reconstruction of a three-dimensional topographic model of these areas, with a very high, sub-centimeter spatial resolution [35,44]. The time and cost-effectiveness of the SfM-UAV method enable conducting repeat surveys at regular time intervals to monitor the topographic changes that occur between different acquisitions. Further applications of the SfM-UAV techniques are the use of the derived Digital Elevation Models (DEMs) for multi-temporal detection of landslides and the estimation of displacement rates and/or the volumes of removed or accumulated material [35,45,46].
Several papers used multi-temporal acquisitions for landslide evolution detection and monitoring [32,47,48,49,50]. Some of these individuated the geomorphological features (in particular, fissures) as parameters for landslide multi-temporal evolution using manual and/or semi-automatic image correlation [47,49]. Others compared DEMs, stressing the importance of a good co-registration for obtaining good results and using benchmarks in areas not affected by morphological changes [32,48].
Godone et al. [50] carried out two different UAV flights, respectively, in 2017 and 2018, in order to describe the recent behavior of the Maierato landslide (South Calabria) and showed that no significant differences occurred in the analyzed period in terms of landslide dynamic; only some differences in terms of erosional processes and vegetation growth were noticed. This is due to the analyzed landslide typology and its state of activity.
Independently of the adopted procedure and the analyzed landslide typology, it is a common opinion that a sequence of UAV acquisition data over time can provide a useful support for assessing morphometric changes and monitoring landslide evolution [35,48,51].
In this context, the present paper explores the ability of the SfM-UAV technique coupled with GIS analysis to detect the geomorphological evolution, from 2019 to 2022, of a large earthflow, named the Vomice landslide, located in the NE sector of the Calabria region (southern Italy). In particular, the morphological features were recognized and mapped and the plano-altimetric variations of the Vomice landslide were evaluated using the data produced from the processing of aerial imagery acquired through two different UAV flights (February 2019 and June 2022), in association with field survey data. The UAV flights enabled the generation of two 3D models and to obtain orthophotos, DSMs and DTMs, with centimetric resolutions, of the entire landslide area.
2. Description of Study Area
The Vomice earthflow (Figure 1) is located in the NE sector of the Calabria region (southern Italy), on the right side of Straface River, between 4,425,354 N and 4,424,006 N of latitude and 629,573 E and 631,266 E of longitude (Figure 1a).
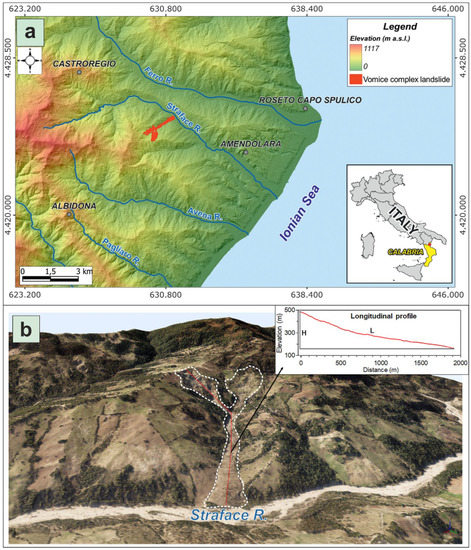
Figure 1.
Location of the study area. (a) Geographical location of the study area (source data of DTM: http://geoportale.regione.calabria.it/opendata, accessed on 16 March 2016); (b) Google Earth satellite image of the Vomice earthflow dated 2019; a longitudinal profile extracted from DTM referring to 2022 is also shown.
Previous investigations [11,52] showed that the study area has a typical Mediterranean climate characterized by hot and dry summers and mild and wet winters. The mean annual precipitation is about 745 mm, mainly concentrated in the autumn–winter period, with rainfall peaks between December and January; during dry and hot summers, the minimum rainfall is reached in the months between July and August.
The geological context is characterized by Mesozoic–Cenozoic sedimentary rocks of the Liguride and Sicilide Units [53,54,55,56]. The Liguride Unit outcrops in the SW portion of the area and is formed from turbidity sequences of the Saraceno and the Albidona Formations (Figure 2) with the first consisting mainly of calcarenites and calcilutites intercalated by clays and sandstones and the Albidona Formation consisting mainly of alternating sandstones, marls, clayey marls, and silty clays. The Sicilide Unit outcrops in the central and the NE portion of the area and consists of both strongly deformed pelagic sediments of the varicolored clay–shale formation and silty clays interlayered with quartz arenite levels of the Numidian Flysch Formation (Figure 2) [56,57,58,59]. The landslide area is dominated by the formation of varicolored clays that, according to the field observations, can be divided into “chaotic clayey” facies and “schistose” facies. The “chaotic clayey” facies outcrops from the bottom to the top of the slopes while the “schistose” facies locally outcrops in the lower part of the central sector of the landslide basin due to the water erosion.
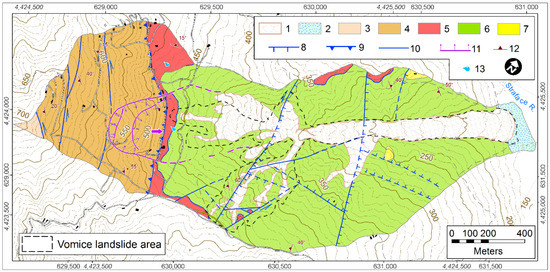
Figure 2.
Geostructural map of the study catchment with localization of mesostructural stations and synthesis of mesostructural data and a geological cross section of the slope. Legend: (1) Holocene landslide debris; (2) Holocene alluvial deposits; (3) Albidona Formation (Burdigalian); (4) Saraceno Formation (Upper Oligocene–Aquitanian); (5) Numidian Flysch (Lower Miocene); (6) lower varicolored clays (Cretaceous); (7) olistoliths of the Sant’Arcangelo Formation (Upper Cretaceous–Middle Eocene); (8) normal fault; (9) thrust; (10) tectonic contact; (11) deep-seated rock-slide; (12) attitude of strata; and (13) spring (from Conforti et al. [60], modified).
Regarding the tectonic setting, in the study area, the pristine Late Oligocene–Pliocene low-angle tectonic contacts between the Sicilide and Liguride Units were sliced by Pliocene–Quaternary high-angle strike-slip and extensional faults (Figure 2). Particularly, the southwest side of the study area is bordered by a WNW-ESE striking left lateral and transpressive strike-slip faults, linked to the Saraceno shear zone [61], which acted as left-lateral faults during the Pliocene–Quaternary (Figure 2). Quaternary high-angle extensional faults with N-S and E-W trending dip-slip have been observed on the central and north-eastern side of the Vomice catchment (Figure 2).
The Vomice landslide lies in a sector of the Straface catchment characterized by gentle to steep slopes. The zone is strongly affected by high activity and density of landslides, controlled mainly by the geological and structural setting [4,11,62]; in particular, the most common typology of mass movements are complex landslides and earthflows [4,11].
The investigated landslide currently covers an area approximately of 36.4 hectares and consists of a well-developed earthflow formed by two large source zones and a narrow, elongated body, which show a lobate shape in the toe part (Figure 1b). The maximum length (L) from the source zones to the toe is about 1.92 km, while the width ranges between 40 and 300 m. It develops from an elevation of about 490 m a.s.l. to 160 m a.s.l., which correspond to the top of the head scarp and the toe of the accumulation zone, respectively (Figure 1b). The total relief is 330 m and the height-to-length ratio (H/L) is equal to 0.17.
Conforti et al. [60] highlighted that the Vomice landslide has been periodically active since at least 1954. It has a complex behavior with seasonal surface variations and episodic failures mostly triggered by intensive rainfall and increased pore water pressures within the constituent geological materials. The earthflow has two source areas that were most likely active at different periods, causing retrogressing, advancing, and enlarging of the landslide area. In general, the kinematic of a landslide can be defined as a slow flow-like movement [19].
3. Materials and Methods
The work that led to characterize the short-time evolution of the Vomice landslide was carried out in several phases, which are summarized in in the flow chart in Figure 3.
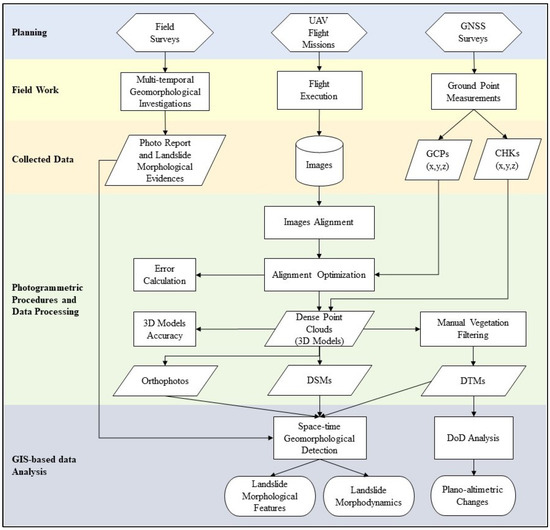
Figure 3.
Flow chart of the methodology used to assess the evolution of the Vomice landslide.
3.1. Data Acquisition and Pre-Processing
To investigate and map the geomorphological features and morpho-evolution between 2019 and 2022 of the landslide, two UAV flights and several field surveys were carried out. The UAV surveys were performed in three different steps: (1) UAV mission planning, (2) flight and photo acquisition, and (3) ground control point (GCP) acquisition. The UAV surveys were carried out in February 2019 and June 2022, using a “Parrot Anafi” quadcopter drone equipped with a red-green-blue (RGB) camera with a 1/2.4” CMOS sensor, which acquires photos with a 5344 × 4016 pixel resolution, mounted on a three-axis stabilized gimbal. The UAV system was also equipped with an on-board GNSS (Global Navigation Satellite System) for the accurate geolocation of the acquired images.
Drone flight missions were planned by using a user-friendly navigation software (Pix4d Capture - Android) that, through the delimitation of the study area, allowed us to define points of acquisition, altitude, and maximize timing of flights. Owing to the difficulties related to the extension, morphology, and height difference of the overflight of the area affected by landslide, it was necessary to conduct three flights with the same average flight altitude and frontal and side overlap. For both the UAV surveys (2019 and 2022), the flight paths were designed to have a front overlap of 85% and side overlap of 80%. The drone maintained an average flight altitude of approximately 130 m, which guaranteed a ground sample distance (GSD) of about 6.60 cm/pix (Table 1).

Table 1.
Data on the UAV surveys’ features.
The camera tilt was set perpendicular to the horizontal in order to capture photos with a nadiral view. Regarding the 2019 UAV survey, a total of 1122 photos were acquired on a surface of 127.4 ha, whereas the 2022 UAV survey covered a surface of 126.9 ha and a total of 1127 photos were taken (Table 1).
In addition, for photogrammetric orientation and georeferencing procedures of the UAV photos, a set of 45 ground points—located among the area of interest—were acquired using a Leica GNSS receiver in Real Time Kinematic (RTK) mode, with an X, Y, and Z accuracy between 1 and 2 cm. The used coordinate system was WGS84-UTM 33N. The ground points, uniformly distributed within the area of interest, correspond to building corners and/or road intersections, which can be easily recognized in the aerial images, and artificial targets placed on the ground during the UAV flights. Furthermore, 30 of these points were used as ground control points (GCPs) for the orientation and georeferencing process (Table 1), whereas the remaining 15 points were used as check points (CHKs) to evaluate the accuracy of the UAV-3D models.
3.2. Data Processing and Analysis of the Landslide
The photos collected in the two UAV flights taken in 2019 and 2022 were processed with the Pix4D mapper photogrammetry software (https://www.pix4d.com/product/pix4dmapper, accessed on 16 March 2016) and SfM algorithm [43,63,64,65,66], generating point clouds of the area of interest. The images acquired during the 2019 and 2022 UAV surveys returned a dense point cloud composed of about 66.5 million points and 72.7 million points, respectively. A global view of both dense 3D point clouds with related meshes and textures is shown in Figure 4.
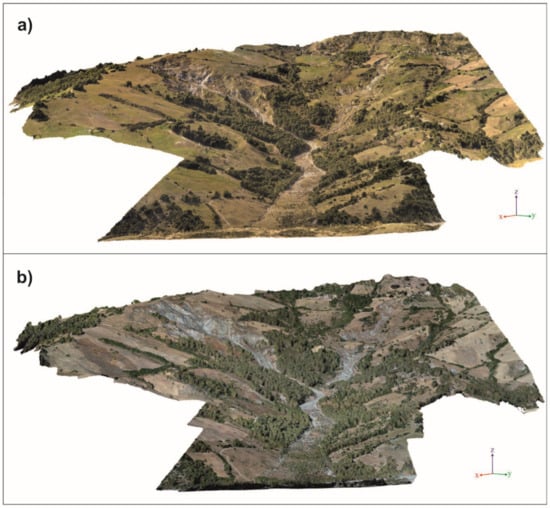
Figure 4.
3D model views (point cloud, texture, and mesh). (a) 2019 UAV survey; (b) 2022 UAV survey.
The point clouds were subsequently processed using Cloud Compare v2.11.3 software in order to generate the DSMs and DTMs of the area affected by the Vomice landslide [67]. The latter was obtained by DSMs using the manual vegetation filter.
Therefore, the image processing of the two UAV surveys allowed to obtain the following products: orthophotos, DSMs, and DTMs. All the produced data were implemented, managed, and analyzed in a GIS environment using the QGIS v.3.18 software (https://www.qgis.org, accessed on 16 March 2016).
In order to evaluate the accuracy of the 3D models, the root mean square errors (RMSE) were calculated using both the GCPs and CHKs. The RMSE were calculated using the following equations:
where n is the total number of GCPs or CHKs and Cm and Cg are the values of X, Y, and Z extracted from the 3D models and measured using a GNSS receiver, respectively.
The results of accuracy for the two 3D models are summarized in Table 2. The planimetric errors (XY) of both GCPs and CHKs varied from 0.05 to 0.11 m, while altimetric errors (Z) varied generally between 0.09 and 0.12 m.
Table 2.
Accuracy of the UAV 3D models.
The geomorphological investigation of the landslide area was performed for both years by a combination of orthophotos, DTMs, shaded relief maps produced by DSM raster data, and field surveys carried out in the same flight periods. The analyses allowed the identification and mapping in detail of the limits of the landslide in the two different periods and many morphological features related to the landslide evolution such as crowns, major and minor scarps, source areas, landslide bodies, cracks, trenches, counterslopes, and variations in the drainage network. In addition, within the landslide area, zones characterized by different landslide types (e.g., slide, flow) and states of activity were detected. Particularly, based on the morphological freshness of landslides [68,69] and following the methodology used by Conforti et al. [60], the recognized landslide bodies were classified as active, suspended, and dormant. A detailed inventory map containing all the landslide features detected by photo interpretation and field surveys was realized for each analyzed period. A GIS overlaying of these maps allowed us to study the evolution of the landslide area and identify zones of reactivation, expansion, or new activation of mass movements.
In order to detect the plano-altimetric changes in the landslide area between February 2019 and June 2022, a comparison of the two DTMs was performed using a DTM of difference (DoD) analysis [46,70,71,72]. The DoD elaboration, achieved by using geomorphic change detection (GCD) ArcGIS® software [73], enabled us to identify zones of uplift and subsidence within the landslide area, calculate average rates of vertical movements (depletion and accumulation rates), and evaluate the volumes of removed and/or accumulated material. According to the results of the DoD analysis, only values included within the 95% confidence level were taken into consideration in order to omit any errors and inaccuracies in the DTMs [60].
4. Results
4.1. Morphological Features of the Landslide
The analysis of the UAV data and fieldwork investigations provided the identification of the landslide-affected area, its boundaries, its morphological characteristics, its evolution, and the ongoing geomorphic processes. The results showed that, during the studied period, the surface affected by the landslide increase from 35.1 hectares in February 2019 to 36.4 hectares in June 2022, which denotes an increase of 3.7 %. The main landslide body emplaces within the Vomice channel and converges in the Straface river thalweg (Figure 5a). Based on geomorphic features, the landslide can be subdivided into a depletion zone, a transition zone, and an accumulation zone (Figure 5a). Referring to the results obtained by the UAV flight in 2022, it is worth noting that the average slope gradient of the landslide in the depletion zone is about 19.4 degrees, in the transition zone it is about 12.5 degrees, and it is approximately equal to 11.4 degrees along the accumulation zone (Figure 5b).
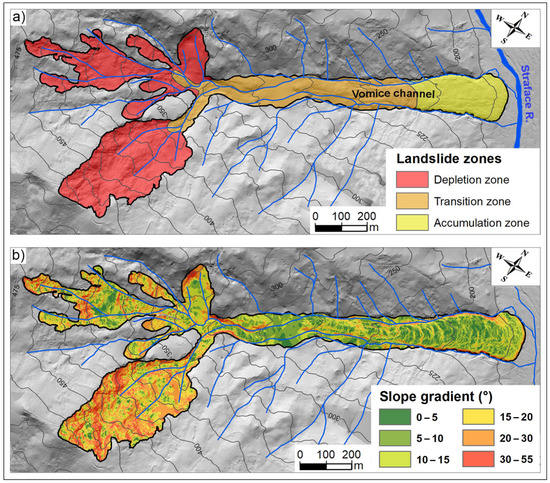
Figure 5.
(a) Identification of the Vomice landslide zones; (b) slope gradient map of landslide area.
The steepest slopes were observed on the main scarps and along the flanks of the depletion zone, where the slope gradients reach values of 55 degrees (Figure 5b).
The depletion zone is constituted from two source areas characterized by an elongated shape and a disorganized distribution of the surface irregularities which reflect the continued slides that affect the slopes (Figure 6a,b). The source area, located in the right side of the landslide, covers an area of about 10.9 hectares; the source area located in the left side covers an area of about 10.3 hectares. In the depletion zone, the arcuate form of the main and secondary scarps and the back-tilted ground surface suggest rotational or roto-translational slides that evolve downslope into earthflows. Detailed field investigations indicated extensional cracks and trenches often filled with collapsed material. Furthermore, tension cracks and lateral fissures were observed at the top of the slope highlighting retrogressive evolution of the main scarps. Specifically, between February 2019 and June 2022, several zones of the head scarps were progressively retracted upward more than 20 m (Figure 7a). Maximum head scarp retreat occurred in the headward direction; however, sideward enlargement was also observed. In addition, typical elements detected in the depletion zone, including some water-filled depressions, indicate the lack of well-developed drainage systems.
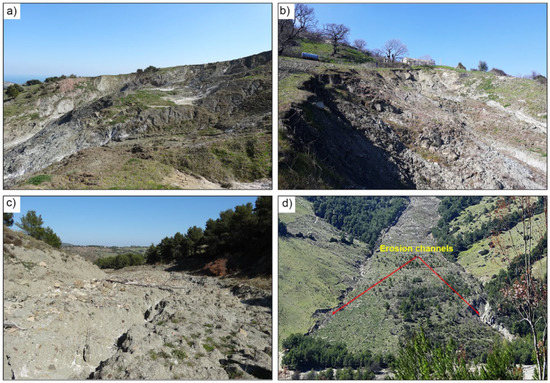
Figure 6.
(a) A sector of the uppermost location of the source area situated on the right side of the landslide area, affected by several slides; (b) detail of the active main scarp of the source area situated on the left side of the landslide area; (c) upper portion of the transition zone; and (d) toe sector of the landslide characterized by deep erosive channels along the right and left sides of the accumulation zone.
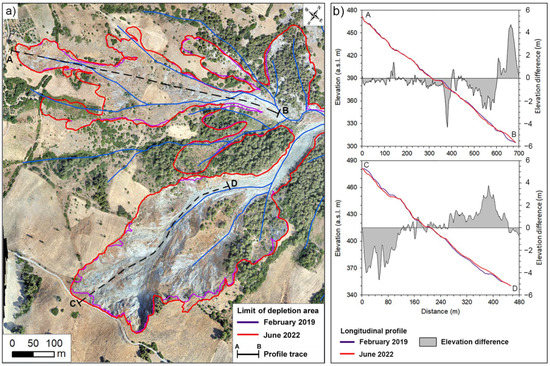
Figure 7.
(a) Overview of the extension of the depletion zone in February 2019 and June 2022; (b) two representative longitudinal profiles extracted from DTMs referring to 2019 and 2022, respectively, illustrating the topographic changes caused by landslides within source areas, producing the retreat and enlargement of the main scarps and the material accumulation downslope.
The transition zone is a narrow and elongated channel that represents the track area of the material displaced from the depletion area and mobilized downward to the accumulation zone (Figure 5a and Figure 6c). The upper part of this zone was affected by several coalescent masses of debris generated by slides and flow-like landslides active in the two source areas. Along the middle and lower parts of the transition zone, the morphology is smoother and is characterized by a complex combination of extensional (cracks) and compressional (folds) features, indicating the evolution of the mass movement into a slow earthflow.
The accumulation zone is 110 to about 200 m wide and is constituted from landslide deposits filling the lowermost part of the Vomice channel (Figure 5a). It shows a hummocky topography with a fan shape in the toe sector (Figure 6d). In this portion, the landslide was characterized by diffuse transverse cracks and corrugation of landslide deposits. In addition, narrow and deep channels affect the flanks of the accumulation zone causing the erosion of high volumes of landslide deposits (Figure 6d).
4.2. Morphodynamics of the Landslide
To understand the morphodynamics of the Vomice landslide area, during the investigated period, two landslide inventory maps related to 2019 and 2022 were compiled by a multi-temporal geomorphological analysis (Figure 8). The maps illustrate the distribution of the state of activity and the typology of the mass movements inside the landslide area (Figure 8). During the analyzed period, the landslide showed frequent geomorphological modifications, mainly occurring in the depletion zone and along the transition zone. Indeed, due to the triggering of many secondary mass movements over the main landslide body, multiple landslide types were recognized.
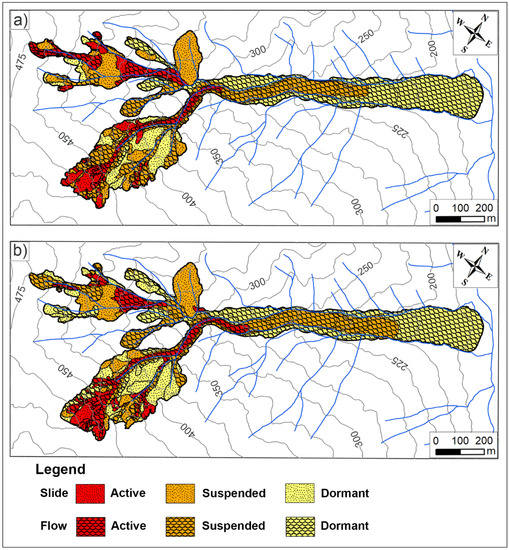
Figure 8.
Vomice landslide inventory map at February 2019 (a) and June 2022 (b).
Most of the mapped landslides have narrow and elongated shapes and tend to be channeled towards the transition zone; many landslide bodies are coalescent and seem to form a single phenomenon (Figure 8).
Referring to 2019, the geomorphological analysis outlines the occurrence of several active slides and earthflows (Figure 8a) that involved a surface of about 6.3 hectares, corresponding to about 18% of the whole study area (Table 3). These landslides reactivated several sectors of the depletion zone and partially the transition zone without affecting the accumulation zone (Figure 8a). As expected, most of the areas characterized by active mass movements occurred along the main scarps (Figure 8a), causing the retreat of the crown. In addition, landslides with a state of activity classified as suspended affected a surface of 14.5 hectares, whereas 14.3 hectares of the landslide area was mapped as dormant (Table 3).
Table 3.
Spatial distribution of the mass movements (in ha and in percentage with respect to the total area) in the Vomice landslide in 2019 and 2022.
Referring to 2022, the landslide inventory map (Figure 8b) showed a spatial distribution of a level of activity comparable to 2019. In further detail, the geomorphological analysis displayed that the portion of the landslide area classified as active occupies a surface of 5.9 hectares, corresponding to about 16.2% of the entire study area, whereas the mass movements characterized by suspended and dormant activity affect, respectively, 39% and 44.8% of the Vomice landslide (Table 3).
The inventory map highlights that, in 2022, the main scarps of the depletion area are affected by active and suspended rotational slides; the more obvious activity is located on the uppermost part of the source area developed on the right side of the landslide. Moreover, many places of the depletion area were reactivated by a series of slides evolving in earthflows and reaching the transition zone (Figure 8b). The latter was affected by several slow earthflows that remobilized the displaced material located in the middle portion of the landslide and reached the accumulation zone.
The results of the multi-temporal analysis displayed that, between February 2019 and June 2022, the landslide accumulation zone was less involved in the reactivation process compared with the depletion and transition zones. Consequently, the entire accumulation zone was mapped as dormant between periods (Figure 8).
The comparison of two inventory maps and the spatial analysis, performed in the GIS environment, is summarized in Table 3. The result showed that in the last 3 years, the portions of landslide activity decreased by 6.3% (Table 3) and the areas classified as suspended underwent a slight decrease (2.1%) (Table 3); however, the mass movements mapped as dormant showed an increase of 14% (Table 3).
4.3. Analysis of the Plano-Altimetric Changes in the Landslide between 2019 and 2022
In order to investigate the topographic surface changes of the Vomice landslide from February 2019 to June 2022, the DoD analysis was used. The analysis enabled us to determine the budget of the material displaced in the depletion zone, and its transport and deposition down to the accumulation zone. Figure 9 illustrates the elevation difference map of the study area, between February 2019 and June 2022, which allows identifying zones experiencing different vertical displacement values. The elevation differences vary from −4.66 m to 4.82 m, where the negative and positive values highlight a lowering and rising of the topography (Table 4). The result showed that the depletion and accumulation surfaces within the landslide area were significant. In total, an area of 19.8 hectares shows negative values (depletion), whereas an area of 16.6 hectares shows positive values (accumulation).
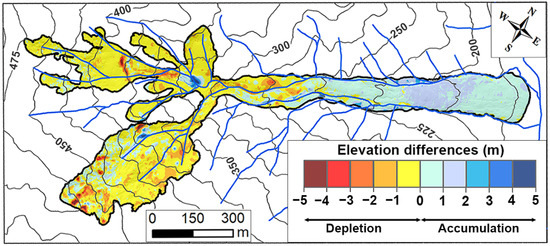
Figure 9.
Elevation differences map within the Vomice landslide area, calculated by the subtraction between the 2019 and 2022 DTMs.
Table 4.
Summary statistics of elevation differences between February 2019 and June 2022 DTMs.
Overall, for the whole analyzed period, the mean value of the depletion areas was −0.59 m, whereas, for the accumulation areas, the mean thickness of the landslide deposits was about 0.57 m (Table 4). The collected data allowed us to evaluate, for the time span considered, mean annual depletion and accumulation rates of −0.18 m/year and 0.17 m/year, respectively.
In the February 2019–June 2022 period, in the source areas, the DoD analysis evidenced the depletion in the upper portion (down to −3 m) and accumulation in the intermediate and lower portions of the same areas (Figure 9).
Regarding the lower part of the depletion area and the upper sector of the transition zone, a lowering of the surface that reaches -2 m was observed; this was caused by an advancement of a large volume of material to the lowermost part of the transition zone. (Figure 9).
An accumulation of the mobilized mass (up to +1 to +2 m) affected the lower portion of the transition zone and the toe zone (Figure 9). However, in the last three years, only a small amount of material mobilized from the landslides triggered in the source zones has reached the accumulation zone. In addition, along the accumulation zone, the depletion area was also observed, which is related to the deep channel erosion acting within the landslide deposit (Figure 9).
The significant plano-altimetric changes, as a consequence of mass movements, were also emphasized by the comparison of two representative longitudinal profiles extracted, respectively, from the 2019 and 2022 DTMs (Figure 7b). The longitudinal profiles A–B and C–D, tracked along the uppermost of the source areas, highlighted very well the intense activity of mass movements within the depletion zone. The analysis of these topographic profiles revealed a local collapse of the main scarps (Figure 7b—profile C–D) with an advancement and a deposition of material mobilized in the lowermost of the source areas, where a maximum elevation change of +4.8 m was reached (Figure 9).
The estimation of the volumetric changes, on the basis of the vertical displacement computations, revealed that between February 2019 and June 2022 the volume of the material mobilized by mass movements was about 114.2 × 10³ m3, whereas the volume of the accumulated material was approximately 92.7 × 10³ m3. The mass balance (the difference between positive and negative volumes) shows a deficit of 21.5 × 10³ m3 (18.8% volume loss).
5. Discussion
The recent and widespread availability of UAV tools with high resolution of cameras were successfully applied for the characterization and monitoring of landslides and provided a practical instrument for landslide risk assessment [29,31,32,35,48,74]. The present study employed multi-temporal UAV surveys for short-time evolution detection of an area affected by a large earthflow representative of a landslide typology recurrently occurring in south Italy [3,5,6,13,15,75]. Overall, planar (X,Y) and elevation (Z) errors obtained during the processing of each individual set of images were low (average RMSE ±0.10 m), which confirmed the good accuracy of 3D models. Moreover, these values of RMSE are comparable with that achieved in other works, e.g., [35,72,76,77]. However, high values of displacement with respect to the calculated errors allowed us to gather topographic changes of the landslide, while lower values were inconclusive [72].
The two 3D models produced allowed to generate orthophotos, DSMs, and DTMs with high pixel resolution and were suitable for use in qualitative and quantitative multi-temporal geomorphological investigation, as confirmed by a considerable number of studies [31,32,34,35,46]. In particular, the comparison between different DTMS or DSMs by using the DoD analysis was applied in many works in order to evaluate landslide evolution [31,32,34,35,46,60,72,76,78]. In this study, DTMs were obtained by DSMs using the manual vegetation filter. Thus, the DoD analysis was carried out using the DTMs, which allowed more precise evaluations of displacements and volumes of the landslide.
The analysis of multi-temporal orthophotos, DSMs, and DTMs allowed extracting detailed information regarding morphological changes, deformation, and vertical displacements within the landslide area that occurred between February 2019 and June 2022. The collected data were validated and improved by several field surveys.
The combination of orthophoto interpretation and periodic field surveys showed geomorphological evidence of the continuous activity of the landslide area. Therefore, numerous mass movements of different sizes, typologies, and states of activity affected the landslide area, causing quick changes in the morphology, mainly in the depletion and transition zones of the landslide. According to field evidence, the upper portion of source area is characterized by a chaotic dynamic, with several landslide scarps, tension cracks, trenches, and counter slopes. Along the main landslide scarps, the displaced material reaches a thickness of about 5 m. In addition, multi-temporal analysis highlighted that within the landslide area different sectors have been active at different times, which is typical behavior of large earthflows [15,18,79,80]. All of this collected information confirmed that large landslides exhibit a complex morphodynamic and composite arrangement of activity [3,15,60,75].
Between the February 2019–June 2022 period, the results of multi-temporal geomorphological analysis indicated a progressive increase in the landslide area from 35.1 to 36.4 hectares. This increase was caused by a progressive upslope migration of the main landslide scarps. Indeed, several slidings occurred in the upper sector of the depletion zone, which explained the topographic lowering in the two source areas with a consistent loss of material. Furthermore, the advancing of the landslide mass from the depletion zone toward the transition and accumulation zones explained the topographic uplift observed in some points. In addition, the material mobilization from the transition zone toward the accumulation zone justifies the topographic lowering observed in some points of the middle portion of this zone. However, for the accumulation zone, the comparison of the two DTMs did not show significant topographic variation (Figure 9).
Overall, taking into account the archived results, the Vomice landslide can be defined as an active earthflow affected by a significant retrogressive and enlarging evolution of the two source areas, while a slow advancing of the mass mobilized along the transition zone was detected until it reached the lower portion of accumulation zone. However, the topographic variations and displacement rate decreased, moving from the depletion zone in the direction of the lower portion of the accumulation zone, which is normally the last portion of the landslide to be reactivated [60,75]. Figure 9 also shows how most of the depleted material did not reach the accumulation zone, stopping in the transition zone. It would, therefore, seem possible to predict that a plausible evolution of the landslide may involve the completion of descent of this material as far as the landslide toe zone or reach the riverbed of the Straface River.
The estimated volume indicated a depleted mass of about 114.2 × 10³ m3, whereas the accumulated material was 92.7 × 10³ m3. The mass balance is negative, with approximately 18.8% volume loss. Negative mass balances were generally attributed to the removal of material by surface runoff or river erosion, or, in some cases, is the result of DTM errors [32,37,60,73]. In the present study, the multi-temporal analysis and field observations showed that part of the negative balance can be attributed to both the deep erosive processes, mainly gullies that act along the flanks of the accumulation zone, and the compaction of the slipped mass.
In agreement with other studies [35,48,72,77], the results of this work demonstrated the practicality and feasibility of using UAV tools for mapping and detecting the short-time evolution of a large landslide. A great advantage of the UAV technique is the repeatability of the flights in a relatively short time, with high resolution and low costs, especially when compared with other techniques such as terrestrial laser scanning [35]. Additionally, performing nadiral flights using a UAV instrument instead of using photographs taken at ground level (nearly horizontal shooting direction) enables the easy and uniform acquisition of high-resolution images over wide areas in a short time and reduces the shaded zones that can cause holes in the 3D model.
Overall, the research results suggest that the combined multi-temporal UAV images with field surveys can be employed as a valid approach for detailed landslide mapping, as well as for accurate analysis of their morphological evolution.
6. Conclusions
Identification, mapping, and monitoring of landslide areas and their spatial and temporal evolution represent the first step for landslide risk management. In the last years, it has been shown that a simple, effective, and repeatable way for monitoring and surveying landslides is represented by Unmanned Aerial Vehicle (UAV) systems.
The paper investigated the possibility to detect the short-time evolution of a slow-moving earthflow by combining the information obtained from two different drone flights with field surveys. The drone flights, as well as the field surveys, were carried out in February 2019 and June 2022.
The obtained results showed the ability of the proposed procedure in delimiting the landslide bodies of the Vomice earth flow, identifying landslide types and states of activity as well as performing detailed spatial and volumetric analyses. Particularly, in the analyzed period, the depletion zone showed signs of activity due to several slides evolving in earth flows that caused a local collapse of the main scarps with more than 20 m of retrogressive fail upslope. The transition zone was affected by several slow earth flows that re-mobilized the displaced material located in the middle portion of the landslide and reached the accumulation zone. The accumulation zone appeared prevalently dormant. The volumetric analyses showed that the overall mobilized landslide material has a volume of about 114.2 × 10³ m3, whereas the volume of the accumulated material is approximately 92.7 × 10³ m3.
The high-resolution topographic UAV-derived data coupled with field surveys advance the understanding of landslide dynamics and enable quantification of the displacement distribution within the landslide area, which is an essential issue in order to understand the response of landslide activity to climatic conditions.
Author Contributions
Conceptualization, M.C. (Massimo Conforti) and L.B.; UAV surveys and data processing, M.M.; data analysis and geomorphological investigation, M.C. (Massimo Conforti), M.M., and L.B.; formal analysis and data curation, M.C. (Massimo Conforti) and M.C. (Mariantonietta Ciurleo). All authors equally contributed to writing the text. All authors have read and agreed to the published version of the manuscript.
Funding
This research received no external funding.
Data Availability Statement
The data presented in this study are available upon request.
Acknowledgments
This work is also part of the Progetto DTA.AD003.487 “TIPIZZAN-Tipizzazione di frane su area vasta e su singolo versante” of the CNR—Department of “Scienze del sistema Terra e Tecnologie per l’Ambiente”.
Conflicts of Interest
The authors declare no conflict of interest.
References
- Morelli, S.; Pazzi, V.; Frodella, W.; Fanti, R. Kinematic reconstruction of a deep-seated gravitational slope deformation by geomorphic analyses. Geosciences 2018, 8, 26. [Google Scholar] [CrossRef]
- Ciurleo, M.; Mandaglio, M.C.; Moraci, N. A Quantitative approach for debris flow inception and propagation analysis in the lead up to risk management. Landslides 2021, 18, 2073–2093. [Google Scholar] [CrossRef]
- Revellino, P.; Grelle, G.; Donnarumma, A.; Guadagno, F.M. Structurally controlled earth flows of the Benevento Province (Southern Italy). Bull. Eng. Geol. Environ. 2010, 69, 487–500. [Google Scholar] [CrossRef]
- Conforti, M.; Muto, F.; Rago, V.; Critelli, S. Landslide inventory map of North-Eastern Calabria (South Italy). J. Maps 2014, 10, 90–102. [Google Scholar] [CrossRef]
- Conforti, M.; Pascale, S.; Sdao, F. Mass movements inventory map of the Rubbio Stream Catchment (Basilicata—South Italy). J. Maps 2015, 11, 454–463. [Google Scholar] [CrossRef]
- Bentivenga, M.; Palladino, G.; Caputi, A. Development of pietra maura landslide and interactions with the Marsico Nuovo Dam (Basilicata, Italy). Geogr. Fis. E Din. Quat. 2012, 35, 13–22. [Google Scholar] [CrossRef]
- Conforti, M.; Ietto, F. Modeling shallow landslide susceptibility and assessment of the relative importance of predisposing factors, through a GIS-based statistical analysis. Geosciences 2021, 11, 333. [Google Scholar] [CrossRef]
- Carrara, A.; Catalano, E.; Sorriso-Valvo, M.; Reali, C.; Osso, I. Digital terrain analysis for land evaluation. Geol. Appl. E Idrogeol. 1978, 13, 69–127. [Google Scholar]
- Merenda, L. Evoluzione franosa nel bacino del T. Ferro (Calabria). CNR-IRPI Geod. 1983, 17, 1–8. [Google Scholar]
- Guerricchio, A.; Melidoro, G. Problematiche di geologia applicata lungo la fascia costiera Del Golfo Di Taranto. In Proceedings of the Evoluzione dei Litorali. Problematiche Relative al Golfo di Taranto, Plicoro, Italy, 16–17 October 1986; pp. 4–29. [Google Scholar]
- Iovine, G.; Merenda, L. Nota illustrativa alla “carta delle frane e della mobilizzazione diastrofica, Dal 1973 Ad Oggi, Nel Bacino del Torrente Straface (Alto Jonio, Calabria). ” Geol. Appl. E Idrogeol. 1996, 31, 107–128. [Google Scholar]
- Cendrero, A.; Dramis, F. The contribution of landslides to landscape evolution in Europe. Geomorphology 1996, 15, 191–211. [Google Scholar] [CrossRef]
- Bentivenga, M.; Giocoli, A.; Palladino, G.; Perrone, A.; Piscitelli, S. Geological and geophysical characterization of the Brindisi Di Montagna Scalo Landslide (Basilicata, Southern Italy). Geomat. Nat. Hazards Risk 2019, 10, 1367–1388. [Google Scholar] [CrossRef]
- Cotecchia, F.; Vitone, C.; Santaloia, F.; Pedone, G.; Bottiglieri, O. Slope instability processes in intensely fissured clays: Case histories in the Southern Apennines. Landslides 2015, 12, 877–893. [Google Scholar] [CrossRef]
- Giordan, D.; Allasia, P.; Manconi, A.; Baldo, M.; Santangelo, M.; Cardinali, M.; Corazza, A.; Albanese, V.; Lollino, G.; Guzzetti, F. Morphological and kinematic evolution of a large earthflow: The Montaguto Landslide, Southern Italy. Geomorphology 2013, 187, 61–79. [Google Scholar] [CrossRef]
- Hungr, O.; Leroueil, S.; Picarelli, L. The varnes classification of landslide types, an update. Landslides 2014, 11, 167–194. [Google Scholar] [CrossRef]
- Keefer, D.K.; Johnson, A.M. Earth flows: Morphology, mobilization and movement. U.S. Geol. Surv. Prof. Pap. 1983, 1256, 56. [Google Scholar] [CrossRef]
- Bertolini, G.; Pizziolo, M. Risk Assessment strategies for the reactivation of earth flows in the Northern Apennines (Italy). Eng. Geol. 2008, 102, 178–192. [Google Scholar] [CrossRef]
- Cruden, D.M.; Varnes, D.J. Landslides: Investigation and mitigation. Chapter 3—Landslide types and processes. Transp. Res. Board Spec. Rep. 1996, 247, 36–75. [Google Scholar]
- Varnes, D.J. Slope movement types and processes. In Special Report 176: Landslides: Analysis and Control; Schuster, R.L., Krizek, R.J., Eds.; National Academy of Sciences: Washington, DC, USA, 1978; pp. 11–33. [Google Scholar]
- Bovis, M.J. Earthflows in the Interior Plateau, Southwest British Columbia. Can. Geotech. J. 1985, 22, 313–334. [Google Scholar] [CrossRef]
- Skempton, A.W. Residual strength of clays in landslides, folded strata and the laboratory. Géotechnique 1985, 35, 3–18. [Google Scholar] [CrossRef]
- Baum, R.L.; Reid, M.E. Ground water isolation by low-permeability clays in landslide shear zones. In Landslides in Research, Theory and Practice; Tedford: London, UK, 2000; Volume 1, pp. 139–144. [Google Scholar]
- Casson, B.; Delacourt, C.; Baratoux, D.; Allemand, P. Seventeen years of the “La Clapière” landslide evolution analysed from ortho-rectified aerial photographs. Eng. Geol. 2003, 68, 123–139. [Google Scholar] [CrossRef]
- Del Soldato, M.; Riquelme, A.; Bianchini, S.; Tomàs, R.; di Martire, D.; de Vita, P.; Moretti, S.; Calcaterra, D. Multisource data integration to investigate one century of evolution for the Agnone Landslide (Molise, Southern Italy). Landslides 2018, 15, 2113–2128. [Google Scholar] [CrossRef]
- Gili, J.A.; Corominas, J.; Rius, J. Using global positioning system techniques in landslide monitoring. Eng. Geol. 2000, 55, 167–192. [Google Scholar] [CrossRef]
- Yin, Y.; Zheng, W.; Liu, Y.; Zhang, J.; Li, X. Integration of GPS with InSAR to Monitoring of the Jiaju Landslide in Sichuan, China. Landslides 2010, 7, 359–365. [Google Scholar] [CrossRef]
- Jaboyedoff, M.; Oppikofer, T.; Abellán, A.; Derron, M.-H.; Loye, A.; Metzger, R.; Pedrazzini, A. Use of LIDAR in landslide investigations: A review. Nat. Hazards 2012, 61, 5–28. [Google Scholar] [CrossRef]
- Cignetti, M.; Godone, D.; Wrzesniak, A.; Giordan, D. Structure from motion multisource application for landslide characterization and monitoring: The Champlas Du Col Case Study, Sestriere, North-Western Italy. Sensors 2019, 19, 2364. [Google Scholar] [CrossRef]
- Antoine, R.; Lopez, T.; Tanguy, M.; Lissak, C.; Gailler, L.; Labazuy, P.; Fauchard, C. Geoscientists in the sky: Unmanned aerial vehicles responding to geohazards. Surv. Geophys. 2020, 41, 1285–1321. [Google Scholar] [CrossRef]
- Giordan, D.; Adams, M.S.; Aicardi, I.; Alicandro, M.; Allasia, P.; Baldo, M.; de Berardinis, P.; Dominici, D.; Godone, D.; Hobbs, P.; et al. The use of Unmanned Aerial Vehicles (UAVs) for engineering geology applications. Bull. Eng. Geol. Environ. 2020, 79, 3437–3481. [Google Scholar] [CrossRef]
- Turner, D.; Lucieer, A.; de Jong, S. Time series analysis of landslide dynamics using an Unmanned Aerial Vehicle (UAV). Remote Sens. 2015, 7, 1736–1757. [Google Scholar] [CrossRef]
- Balek, J.; Blahůt, J. A Critical evaluation of the use of an inexpensive camera mounted on a recreational unmanned aerial vehicle as a tool for landslide research. Landslides 2017, 14, 1217–1224. [Google Scholar] [CrossRef]
- Peppa, M.V.; Mills, J.P.; Moore, P.; Miller, P.E.; Chambers, J.E. Brief Communication: Landslide motion from cross correlation of UAV-derived morphological attributes. Nat. Hazards Earth Syst. Sci. 2017, 17, 2143–2150. [Google Scholar] [CrossRef]
- Rossi, G.; Tanteri, L.; Tofani, V.; Vannocci, P.; Moretti, S.; Casagli, N. Multitemporal UAV surveys for landslide mapping and characterization. Landslides 2018, 15, 1045–1052. [Google Scholar] [CrossRef]
- Tofani, V.; Segoni, S.; Agostini, A.; Catani, F.; Casagli, N. Technical note: Use of remote sensing for landslide studies in Europe. Nat. Hazards Earth Syst. Sci. 2013, 13, 299–309. [Google Scholar] [CrossRef]
- Borrelli, L.; Conforti, M.; Mercuri, M. Lidar and UAV system data to analyse recent morphological changes of a small drainage basin. ISPRS Int. J. Geoinf. 2019, 8, 536. [Google Scholar] [CrossRef]
- Immerzeel, W.W.; Kraaijenbrink, P.D.A.; Shea, J.M.; Shrestha, A.B.; Pellicciotti, F.; Bierkens, M.F.P.; de Jong, S.M. High-resolution monitoring of himalayan glacier dynamics using unmanned aerial vehicles. Remote Sens. Environ. 2014, 150, 93–103. [Google Scholar] [CrossRef]
- Lucieer, A.; de Jong, S.M.; Turner, D. Mapping landslide displacements using Structure from Motion (SfM) and image correlation of multi-temporal UAV photography. Prog. Phys. Geogr. Earth Environ. 2014, 38, 97–116. [Google Scholar] [CrossRef]
- Rippin, D.M.; Pomfret, A.; King, N. High resolution mapping of supra-glacial drainage pathways reveals link between micro-channel drainage density, surface roughness and surface reflectance. Earth Surf. Process Landf. 2015, 40, 1279–1290. [Google Scholar] [CrossRef]
- Tarolli, P. High-resolution topography for understanding earth surface processes: Opportunities and challenges. Geomorphology 2014, 216, 295–312. [Google Scholar] [CrossRef]
- Pellicani, R.; Argentiero, I.; Manzari, P.; Spilotro, G.; Marzo, C.; Ermini, R.; Apollonio, C. UAV and airborne LiDAR data for interpreting kinematic evolution of landslide movements: The case study of the Montescaglioso Landslide (Southern Italy). Geosciences 2019, 9, 248. [Google Scholar] [CrossRef]
- Ullman, S. Computational studies in the interpretation of structure and motion: Summary and extension. Mass. Inst. Technol. A.I. Memo 1983, 706, 1–25. [Google Scholar]
- Clapuyt, F.; Vanacker, V.; van Oost, K. Reproducibility of UAV-based earth topography reconstructions based on structure-from-motion algorithms. Geomorphology 2016, 260, 4–15. [Google Scholar] [CrossRef]
- Aucelli, P.P.C.; Conforti, M.; della Seta, M.; del Monte, M.; D’uva, L.; Rosskopf, C.M.; Vergari, F. Multi-temporal digital photogrammetric analysis for quantitative assessment of soil erosion rates in the landola catchment of the Upper Orcia Valley (Tuscany, Italy). Land Degrad. Dev. 2016, 27, 1075–1092. [Google Scholar] [CrossRef]
- Tanteri, L.; Rossi, G.; Tofani, V.; Vannocci, P.; Moretti, S.; Casagli, N. Multitemporal UAV survey for mass movement detection and monitoring. In Advancing Culture of Living with Landslides; Springer International Publishing: Cham, Switzerland, 2017; pp. 153–161. [Google Scholar]
- Niethammer, U.; James, M.R.; Rothmund, S.; Travelletti, J.; Joswig, M. UAV-based remote sensing of the Super-Sauze Landslide: Evaluation and results. Eng. Geol. 2012, 128, 2–11. [Google Scholar] [CrossRef]
- Giordan, D.; Hayakawa, Y.; Nex, F.; Remondino, F.; Tarolli, P. Review article: The use of Remotely Piloted Aircraft Systems (RPASs) for natural hazards monitoring and management. Nat. Hazards Earth Syst. Sci. 2018, 18, 1079–1096. [Google Scholar] [CrossRef]
- Travelletti, J.; Delacourt, C.; Allemand, P.; Malet, J.-P.; Schmittbuhl, J.; Toussaint, R.; Bastard, M. Correlation of multi-temporal ground-based optical images for landslide monitoring: Application, potential and limitations. ISPRS J. Photogramm. Remote Sens. 2012, 70, 39–55. [Google Scholar] [CrossRef]
- Godone, D.; Allasia, P.; Borrelli, L.; Gullà, G. UAV and structure from motion approach to monitor the Maierato Landslide evolution. Remote Sens. 2020, 12, 1039. [Google Scholar] [CrossRef]
- Zárate, B.A.; el Hamdouni, R.; Fernández, T. GNSS and RPAS integration techniques for studying landslide dynamics: Application to the areas of Victoria and Colinas Lojanas, (Loja, Ecuador). Remote Sens. 2021, 13, 3496. [Google Scholar] [CrossRef]
- Buttafuoco, G.; Caloiero, T.; Coscarelli, R. Spatial and temporal patterns of the mean annual precipitation at decadal time scale in Southern Italy (Calabria Region). Theor. Appl. Climatol. 2011, 105, 431–444. [Google Scholar] [CrossRef]
- ISPRA Carta Geologica d’Italia Alla Scala 1:50.000, Foglio 535 ‘Trebisacce’. Available online: http://www.isprambiente.gov.it/media/carg/535_TREBISACCE/foglio.html (accessed on 12 October 2017).
- Bonardi, G.; Amore, F.O.; Ciampo, G.; de Capoa, P.; Miconnet, P.; Perrone, V. Il “Complesso Liguride” Auct.: Stato delle conoscenze e problemi aperti sulla sua evoluzione appenninica ed i suoi rapporti con l’Arco Calabro. Mem. Della Soc. Geol. Ital. 1988, 41, 17–35. [Google Scholar]
- Vezzani, L. Distribuzione facies e stratigrafia della formazione del saraceno (Albiano-Daniano) nell’area compresa fra Il Mare Jonio e Il Torrente Frido. Geol. Romana 1968, 7, 229–275. [Google Scholar]
- Ogniben, L. Schema introduttivo alla geologia del confine Calabro-Lucano. Mem. Della Soc. Geol. Ital. 1969, 8, 453–763. [Google Scholar]
- Hsü, K.J. Principles of mélanges and their bearing on the franciscan-knoxville paradox. Bull. Geol. Soc. Am. 1968, 79, 1063–1074. [Google Scholar] [CrossRef]
- Cowan, D.S.; Darrel, S. Structural styles in mesozoic and cenozoic mélanges in the Western Cordillera of North America. Geol. Soc. Am. Bull. 1985, 96, 451–462. [Google Scholar] [CrossRef]
- Cowan, D.S.; Pini, G.A. Disrupted and chaotic rock units. In Anatomy of an Orogen: The Apennines and Adjacent Mediterranean Basins; Springer Netherlands: Dordrecht, The Netherlands, 2001; pp. 165–175. [Google Scholar]
- Conforti, M.; Mercuri, M.; Borrelli, L. Morphological changes detection of a large earthflow using archived images, LiDAR-Derived DTM, and UAV-based remote sensing. Remote Sens. 2021, 13, 120. [Google Scholar] [CrossRef]
- Ferranti, L.; Santoro, E.; Mazzella, M.E.; Monaco, C.; Morelli, D. Active transpression in the Northern Calabria Apennines, Southern Italy. Tectonophysics 2009, 476, 226–251. [Google Scholar] [CrossRef]
- Rago, V.; Conforti, M.; Muto, F.; Critelli, S. Landslide susceptibility assessment in the Ferro Torrent (Calabria, South Italy) using GIS-based conditional analysis method. Rend. Online Della Soc. ‘ Geol. Ital. 2013, 24, 257–259. [Google Scholar]
- la Salandra, M.; Miniello, G.; Nicotri, S.; Italiano, A.; Donvito, G.; Maggi, G.; Dellino, P.; Capolongo, D. Generating UAV high-resolution topographic data within a FOSS photogrammetric workflow using high-performance computing clusters. Int. J. Appl. Earth Obs. Geoinf. 2021, 105, 102600. [Google Scholar] [CrossRef]
- Duarte, L.; Teodoro, A.C.; Moutinho, O.; Gonçalves, J.A. Open-source GIS application for UAV photogrammetry based on MicMac. Int. J. Remote Sens. 2017, 38, 3181–3202. [Google Scholar] [CrossRef]
- Sanz-Ablanedo, E.; Chandler, J.; Rodríguez-Pérez, J.; Ordóñez, C. Accuracy of Unmanned Aerial Vehicle (UAV) and SfM photogrammetry survey as a function of the number and location of ground control points used. Remote Sens. 2018, 10, 1606. [Google Scholar] [CrossRef]
- Rupnik, E.; Daakir, M.; Pierrot Deseilligny, M. MicMac—A free, open-source solution for photogrammetry. Open Geospat. Data Softw. Stand. 2017, 2, 14. [Google Scholar] [CrossRef]
- Lague, D.; Brodu, N.; Leroux, J. Accurate 3D comparison of complex topography with terrestrial laser scanner: Application to the rangitikei canyon (N-Z). ISPRS J. Photogramm. Remote Sens. 2013, 82, 10–26. [Google Scholar] [CrossRef]
- Rib, H.T.; Liang, T. Recognition and identification. In Landslide Analysis and Control: Transportation Research Board Special Re-port, 176; Schuster, R.L., Krizek, R.J., Eds.; National Academy of Sciences: Washington, DC, USA, 1978; pp. 34–80. [Google Scholar]
- Keaton, J.R.; DeGraff, J.V. Surface observation and geologic mapping. In Landslides: Investigation and Mitigation; Turner, A.K., Schuster, R.L., Eds.; National Academy Press: Washington, DC, USA, 1996. [Google Scholar]
- Peternel, T.; Kumelj, Š.; Oštir, K.; Komac, M. Monitoring the Potoška Planina Landslide (NW Slovenia) using UAV photogrammetry and tachymetric measurements. Landslides 2017, 14, 395–406. [Google Scholar] [CrossRef]
- Huang, H.; Long, J.; Lin, H.; Zhang, L.; Yi, W.; Lei, B. Unmanned aerial vehicle based remote sensing method for monitoring a steep mountainous slope in the Three Gorges Reservoir, China. Earth Sci. Inform. 2017, 10, 287–301. [Google Scholar] [CrossRef]
- Fernández, T.; Pérez, J.; Cardenal, J.; Gómez, J.; Colomo, C.; Delgado, J. Analysis of landslide evolution affecting olive groves using UAV and photogrammetric techniques. Remote Sens. 2016, 8, 837. [Google Scholar] [CrossRef]
- Wheaton, J.M.; Brasington, J.; Darby, S.E.; Sear, D.A. Accounting for uncertainty in DEMs from repeat topographic surveys: Improved sediment budgets. Earth Surf. Process Landf. 2010, 35, 136–156. [Google Scholar] [CrossRef]
- Yao, H.; Qin, R.; Chen, X. Unmanned aerial vehicle for remote sensing applications—A review. Remote Sens. 2019, 11, 1443. [Google Scholar] [CrossRef]
- Guerriero, L.; Revellino, P.; Coe, J.A.; Focareta, M.; Grelle, G.; Albanese, V.; Corazza, A.; Guadagno, F.M. Multi-temporal maps of the montaguto earth flow in Southern Italy from 1954 to 2010. J. Maps 2013, 9, 135–145. [Google Scholar] [CrossRef]
- Lindner, G.; Schraml, K.; Mansberger, R.; Hübl, J. UAV monitoring and documentation of a large landslide. Appl. Geomat. 2016, 8, 1–11. [Google Scholar] [CrossRef]
- Ilinca, V.; Șandric, I.; Chițu, Z.; Irimia, R.; Gheuca, I. UAV applications to assess short-term dynamics of slow-moving landslides under dense forest cover. Landslides 2022, 19, 1717–1734. [Google Scholar] [CrossRef]
- Conforti, M.; Ietto, F. An integrated approach to investigate slope instability affecting infrastructures. Bull. Eng. Geol. Environ. 2019, 78, 2355–2375. [Google Scholar] [CrossRef]
- Borgatti, L.; Corsini, A.; Barbieri, M.; Sartini, G.; Truffelli, G.; Caputo, G.; Puglisi, C. Large reactivated landslides in weak rock masses: A case study from the Northern Apennines (Italy). Landslides 2006, 3, 115–124. [Google Scholar] [CrossRef]
- Mackey, B.H.; Roering, J.J. Sediment yield, spatial characteristics, and the long-term evolution of active earthflows determined from airborne LiDAR and historical aerial photographs, Eel River, California. Geol. Soc. Am. Bull. 2011, 123, 1560–1576. [Google Scholar] [CrossRef]


Disclaimer/Publisher’s Note: The statements, opinions and data contained in all publications are solely those of the individual author(s) and contributor(s) and not of MDPI and/or the editor(s). MDPI and/or the editor(s) disclaim responsibility for any injury to people or property resulting from any ideas, methods, instructions or products referred to in the content. |
© 2023 by the authors. Licensee MDPI, Basel, Switzerland. This article is an open access article distributed under the terms and conditions of the Creative Commons Attribution (CC BY) license (https://creativecommons.org/licenses/by/4.0/).