Article

Laboratory-Scale Investigation on Shear Behavior of Non-Persistent Joints and Joint Infill Using Lattice-Spring-Based Synthetic Rock Mass Model

Department of Mining and Explosives Engineering, Missouri University of Science and Technology, Rolla, MO 65409, USA
*
Author to whom correspondence should be addressed.
Geosciences 2023, 13(2), 23; https://doi.org/10.3390/geosciences13020023
Submission received: 11 November 2022 / Revised: 6 January 2023 / Accepted: 17 January 2023 / Published: 20 January 2023
(This article belongs to the Special Issue Advanced Numerical Modelling and Analysis in Geotechnical Engineering)

Abstract

:
Discontinuities mainly control the mechanical behavior of rock mass and cause a significant reduction in the rock mass strength. Joint persistency and joint infill conditions are considered the most significant joint parameters that control the mechanical response of rock mass. In this study, numerical and statistical analyses were performed on pre-cracked specimens with two flaws to investigate the effect of joint persistence parameters on shear strength. In addition, an extensive study was conducted to explore the effect of infilled mineral strength, infill thickness, and infill wall roughness on shear strength. The Lattice-Spring-Based Synthetic Rock Mass (LS-SRM) approach was utilized to perform the numerical models. The results showed that the tensile crack propagation is limited at higher normal stresses as tensile damage is largely suppressed. The increases in rock bridge angle slightly increased the shear strength and caused a change in the failure mechanisms of the rock bridge from tensile to shearing. The results of the models with infilled minerals revealed that infilled minerals mainly controlled the shear strength of specimens when the infill thickness was 4.0 mm or greater. The infill wall roughness had no apparent effect on the shear strength. In contrast, it governed the failure mechanisms; cracks initiated at the asperity of the rough filling wall and propagated through the hosted rock mass.

1. Introduction

The rock mass is primarily composed of intact rock and discontinuities. These discontinuities, such as cracks, fractures, joints, faults, and bedding planes, affect rock mass strength and complicate assessing the deformable and mechanical behavior of jointed rock mass. Thus, this significantly influences evaluations of rock mass stabilities in geotechnical structures such as tunnels, rock slopes, quarries, and mines.
The failure mechanisms in a rock mass can be divided into three major groups: (i) shearing failure along persistent discontinuities, (ii) the combination of shearing failure, partially along non-persistent discontinuities and partially through the intact rock bridges, and (iii) tensile cracking-driven failures along the tip of existing discontinuities in the zone of the intact part of the rock mass. Lee and Jeon [1] illustrated the mechanism of microcracks growing in a pre-cracked sample where microcracks begin to form at or near the ends of pre-existing discontinuities and propagate in the main principal stress direction until they coalesce with other cracks.
A substantial number of studies have been performed to explore the mechanism of microcrack initiation, propagation, and the coalescence of the pre-existing joints in specimens made of natural rocks or rock-like materials, as well as the impact of rock bridge on the mechanical behavior of pre-cracked specimens under uniaxial compressive load [2,3,4,5,6,7,8]. The mechanism of brittle failure modes in pre-cracked rocks was also investigated under biaxial compressive loads [9,10,11]. The impact of rock bridges on the deformability and strength of pre-cracked rock specimens under triaxial compressive loads was recently evaluated by various researchers [12,13,14,15]. In addition, a few laboratory experiments were conducted in order to assess the failure behaviors of joints and rock bridges in jointed rock masses under shear loading [16,17]. According to the previous studies, microcracks were propagated in pre-cracked specimens in two forms (as illustrated in Figure 1): (a) Wing cracks were formed at the initial phase of failure and classified as tensile cracks originating at the tips of pre-existing joints and then propagated in a curved line towards the major principal stress; (b) Secondary cracks were classified as shear cracks that initiated from the tips of pre-existing joints in two possible ways: (1) coplanar to the joints and (2) a curved shape with the opposite direction with wing cracks.
In the past few decades, numerical techniques have been extensively used to simulate the experimental results of rock mass. Numerical techniques are favored over experimental ones because they are flexible, inexpensive, safe, and efficient in simulating small and large rock volumes [18]. Numerous numerical techniques, such as the discrete element method (DEM), boundary element method (BEM), and synthetic rock mass (SRM), have demonstrated the capability of stimulating brittle failure behavior through a rock bridge in pre-cracked specimens. Vesga et al. [19] utilized the discrete element method (DEM) to simulate crack initiation in clay samples under uniaxial compressive loading conditions. Duan et al. [13] studied the brittle failure behaviors in sandstone samples under true triaxial compression testing conditions using the DEM approach. Particle Flow Code (PFC) was used to investigate the brittle failure mechanisms in pre-cracked rock specimens with different flaws under uniaxial and biaxial loading conditions [20], and their study concluded that the crack initiation angles became steeper as confinement stress increased. Besides that, the grain-based model (GBM) has been widely used to identify crack propagation in brittle rock specimens [21,22,23,24].
The LS-SRM is a new code from Itasca that efficiently simulates the mechanical behaviors of intact rock, discontinuities, and their interactions in the rock mass. Bastola and Cai [2] utilized LS-SRM to investigate pre-cracked marble’s mechanical properties and failure behaviors with coplanar or noncoplanar cracks. Bastola et al. [25] adopted the same approach to explore the brittle failure mechanism sequence in coplanar and noncoplanar cracked granite specimens under uniaxial compressive loading conditions. Gottron and Henk [26] compared the LS-SRM modeling approach with continuum and empirical approaches for fractured rock mass simulation. They concluded that the LS-SRM approach allows predictions to be specifically conducted on rock mass interaction and the design of a wide range of geotechnical applications.
The LS-SRM is formulated in a small strain that does not require the detection and updating of contacts; the fast-computational time is one of the significant advantages of the LS-SRM approach, which is up to 10 times faster than other BBM or BPM tools. Moreover, the LS-SRM code does not require the calibration of some micro-scale parameters as it has some built-in calibration factors. Some of the desired macroscale parameters, such as tensile strength, can be provided as direct model inputs. Introducing and incorporating the non-persistent and non-planar joints is much more straightforward in LS-SRM, and the code allows explicit representations of them to study crack evolution. Despite the promising features mentioned above, LS-SRM also has certain limitations. The major limitation is that the user should select either parallel bonds, which leads to a significantly higher σct, or flat joint contacts that cause an unrealistically low rock matrix Poisson’s ratio. Also, the visualization of the lattice detachment is not possible with the LS-SRM.
A few studies have evaluated the impact of four key parameters on the crack coalescence behavior, including the pre-existing joint roughness coefficient (JRC). Saadat and Taheri [23] investigated the effect of the JRC on the asperity damage and shear mechanisms of rock joints in Aue granite specimens under constant normal loading and constant normal stiffness conditions.
In this study, the experimental work of Asadizadeh et al. [16] was utilized as a base for calibrating and validating the LS-SRM models. The calibrated mechanical properties of pre-cracked specimens were used to study the impact of the JRC, rock bridge angle (γ), rock bridge length (L), and normal stress (σn) parameters on the shear strength and shear failure behavior. In addition, the influence of infilled mineral, thickness, and infill wall roughness on the shear strength of the Amphibolite specimens was investigated. Since the Response Surface Methodology (RSM) method has an advantage over other statistical methods in reducing the number of required models, the models were built with this method.

2. Model Development

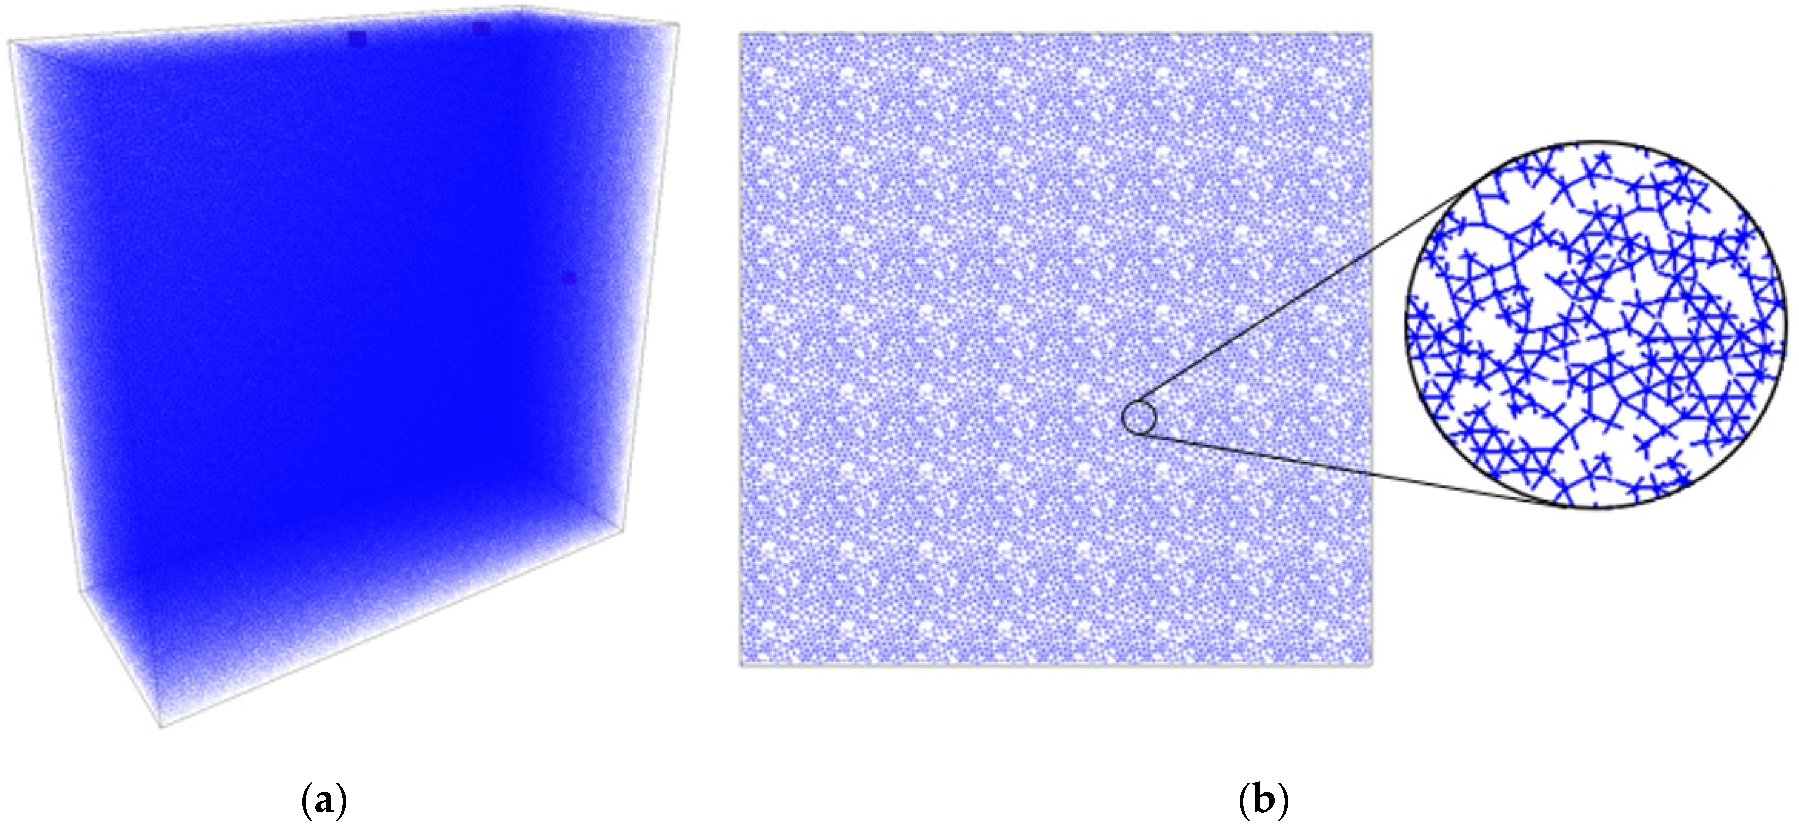
2.1. Lattice-Spring-Based Synthetic Rock Mass Model (LS-SRM)
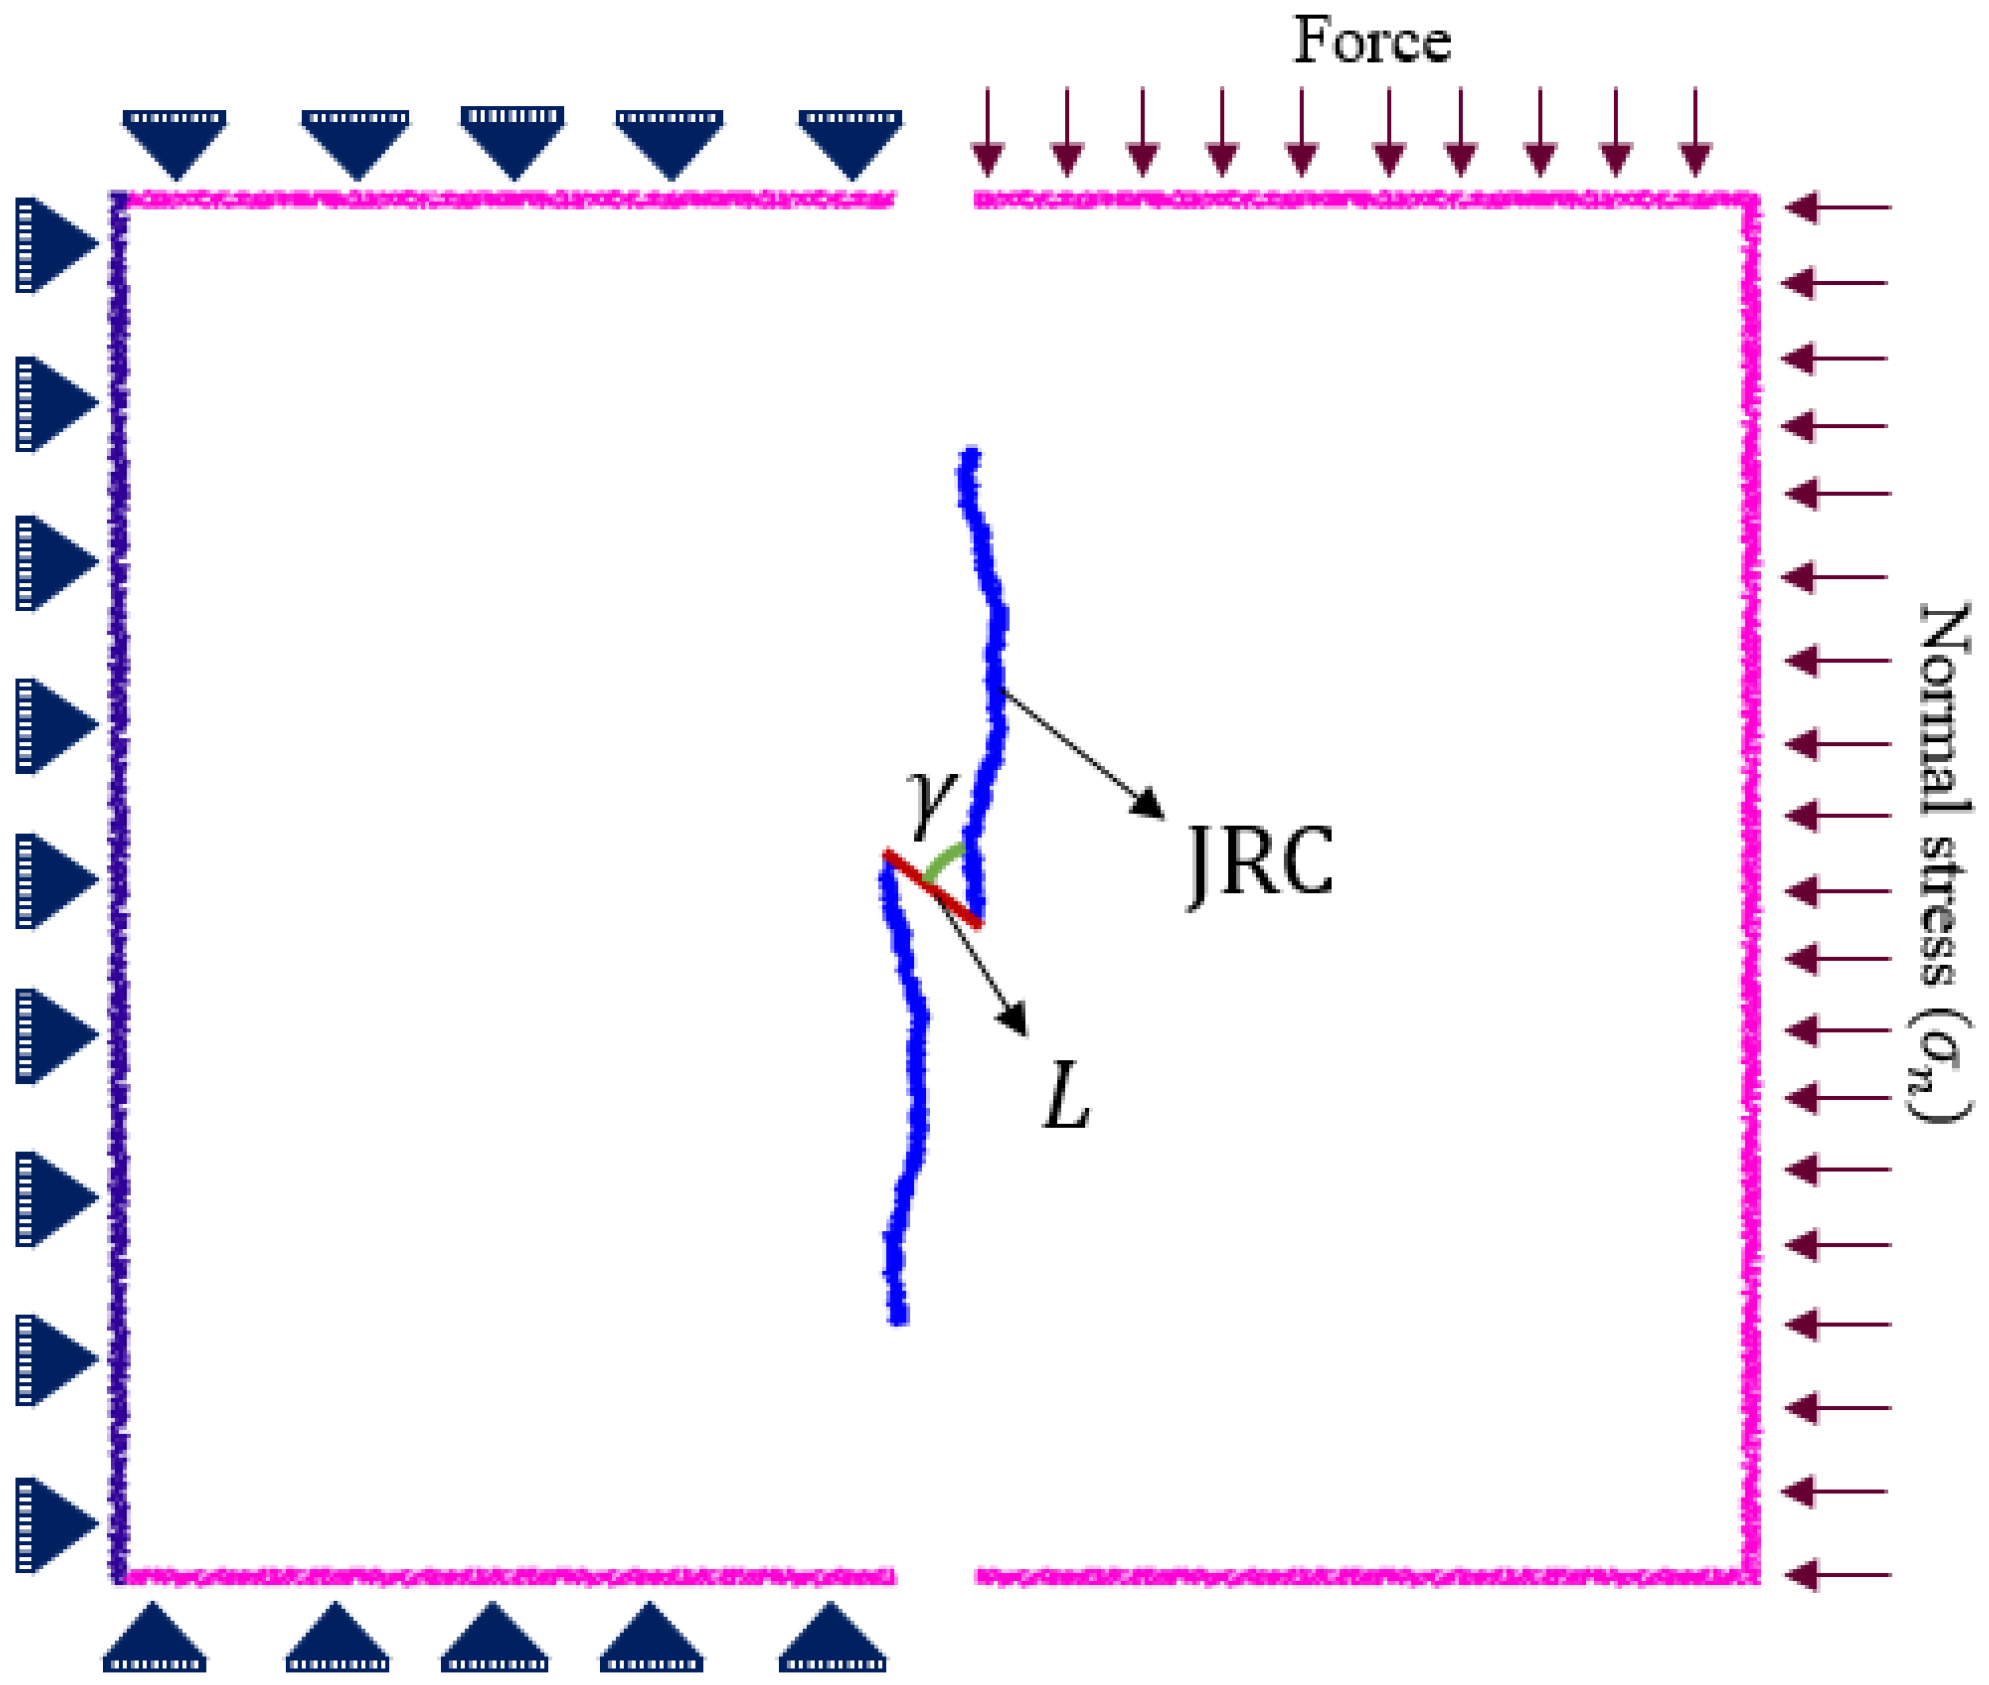
The LS-SRM code was developed as part of the large open pit project administered by the Commonwealth Scientific and Industrial Research Organization (CSIRO) in Brisbane, Australia. In LS-SRM, the intact rock can be represented as assemblages of nodes connected by massless and unsmooth springs with both normal and shear directions. The intact rock formation in LS-SRM is similar to the Bonded-Particle Model (BPM) approach in PFC [27], except those spherical particles in PFC were replaced by nodes located at the particle’s center. Newton’s second law of motion was employed to estimate translational and rotational displacement components for the node masses, and a linear force–displacement relationship was used for the springs [28]. During the simulation process, the translational and rotational displacement components of nodes were determined using central differential equations:
ν i t + Δ t 2 = ν i t Δ t 2 + F i t Δ t / m
u i t + Δ t = u i t + ν i t + Δ t 2 Δ t  
where and are the velocity and position of component i (i = 1, 2, 3) at time t, ∑Fi is the sum of all force components acting on the node of mass (m) within time step (Δt) including local damping force. The angular velocities, ωi, of component i (i = 1, 2, 3) at a time (t) were determined from the following central differential equation:
ω i t + Δ t 2 = ω i t Δ t 2 + M i t I Δ t  
where ∑Mi is the sum of all moment components acting on the node with the moment of inertia I.
The LS-SRM can simulate the initiation, propagation, and coalescence of microcracks through the intact rock. Figure 2a illustrates that when the shear or tensile strength of the spring is exceeded, the spring can break, slide, or separate, and then the broken spring is replaced with a microcrack. As a result of the coalescence of microcracks, a failure plane will develop through the intact rock in the direction of crack propagation. Discontinuity in LS-SRM is represented by a discrete fracture network (DFN) and is superimposed on the lattice springs, as illustrated in Figure 2b. The LS-SRM model can efficiently simulate the coplanar and non-planar discontinuities [28].
The contact in the LS-SRM approach can be represented as parallel bonds or flat joint contacts similar to “Flat Joint” in PFC. There are two disadvantages of using parallel bonds in simulating the brittle failure in the intact rock: (1) a significantly higher ratio of uniaxial compressive strength to tensile strength (σct); and (2) a low macroscale intact rock friction angle (maximum is around 30°). When parallel bonds are employed, the particles can roll relative to each other without resistance after the parallel bond breaks. On the other hand, when flat joint contacts (FJ) are utilized, each spring splits into sub-springs, and these sub-springs allow resistance to rotation via normal forces in the sub-springs even after the springs are broken (see Figure 2c). This provides realistic compressive strength and the acceptable compressive to tensile strength ratios of the intact rock.

2.2. Model Setup

2.2.1. Models with Two Pre-Existing Flaws

In this study, lattice-spring-based synthetic rock mass (LS-SRM) models were built using the SRMTools of Itasca. These models were designed based on the experimental data of the direct shear test on coplanar and noncoplanar jointed specimens from Asadizadeh et al. [16]. Response Surface Methodology (RSM) was employed to design the LS-SRM models. Twenty-nine models were created to investigate the impact of the JRC, γ, L, and σn on the shear behavior of rock-like pre-cracked specimens. The specimens with 120 × 300 × 300 mm3 dimensions comprised 496,832 lattice nodes connected by 2,535,371 lattice springs and were utilized as depicted in Figure 3. After considering the sample size, a lattice spring length of 3.0 mm was assigned to the models as a reasonable lattice resolution. For realistic simulations of σct of rock-like material, a flat joint was applied with a disk radius multiplier of 0.9 with three contact points.
The RSM model geometry is illustrated in Figure 4. The base geometry was kept constant for all models. The model had two roughness flaws and various JRC profiles, L, γ, and σn. Boundary conditions are presented in Figure 4; constant σn was applied on the right-side boundary of the shear sample, and a velocity was applied on the top right boundary of the sample with the increment of 0.01 m/s. The left, top left, and bottom left boundaries were fixed to prevent movement.

2.2.2. Models with Infilled Joints

In order to investigate the effect of the mechanical properties and the thickness of infill mineral on the shear strength and shear failure behavior of the direct shear specimen, the models were utilized with dimensions of 50 × 100 × 100 mm3. A lattice spring length (resolution) of 1.0 mm was used in these shear models to simulate the infill behavior efficiently. As shown in Figure 5, the shear models contain a single persistent joint with various infill minerals, thicknesses, and JRCs.
It should be noted that all infill minerals used in this study were weaker compared with the hosted rock (Amphibolite). The micro- and macro-mechanical properties of the infilled minerals and hosted rock are listed in Table 1. The mechanical properties of amphibolite and quartz were determined from available input rocks in the LS-SRM. The calcite, mudstone, and clay properties were taken from published studies [29,30,31] and calibrated based on the method illustrated in Section 3.

3. Model Calibration

Unlike other DEM codes, the calibration procedure is less complicated in LS-SRM because fewer micro parameters require calibration. A series of unconfined and confined compressive strength tests and direct shear tests were performed on the LS-SRM to calibrate the mechanical properties of the intact rock and joints. The loading rate and lattice spring length utilized in calibration studies were constant (0.01 m/s and 2.0 mm, respectively).

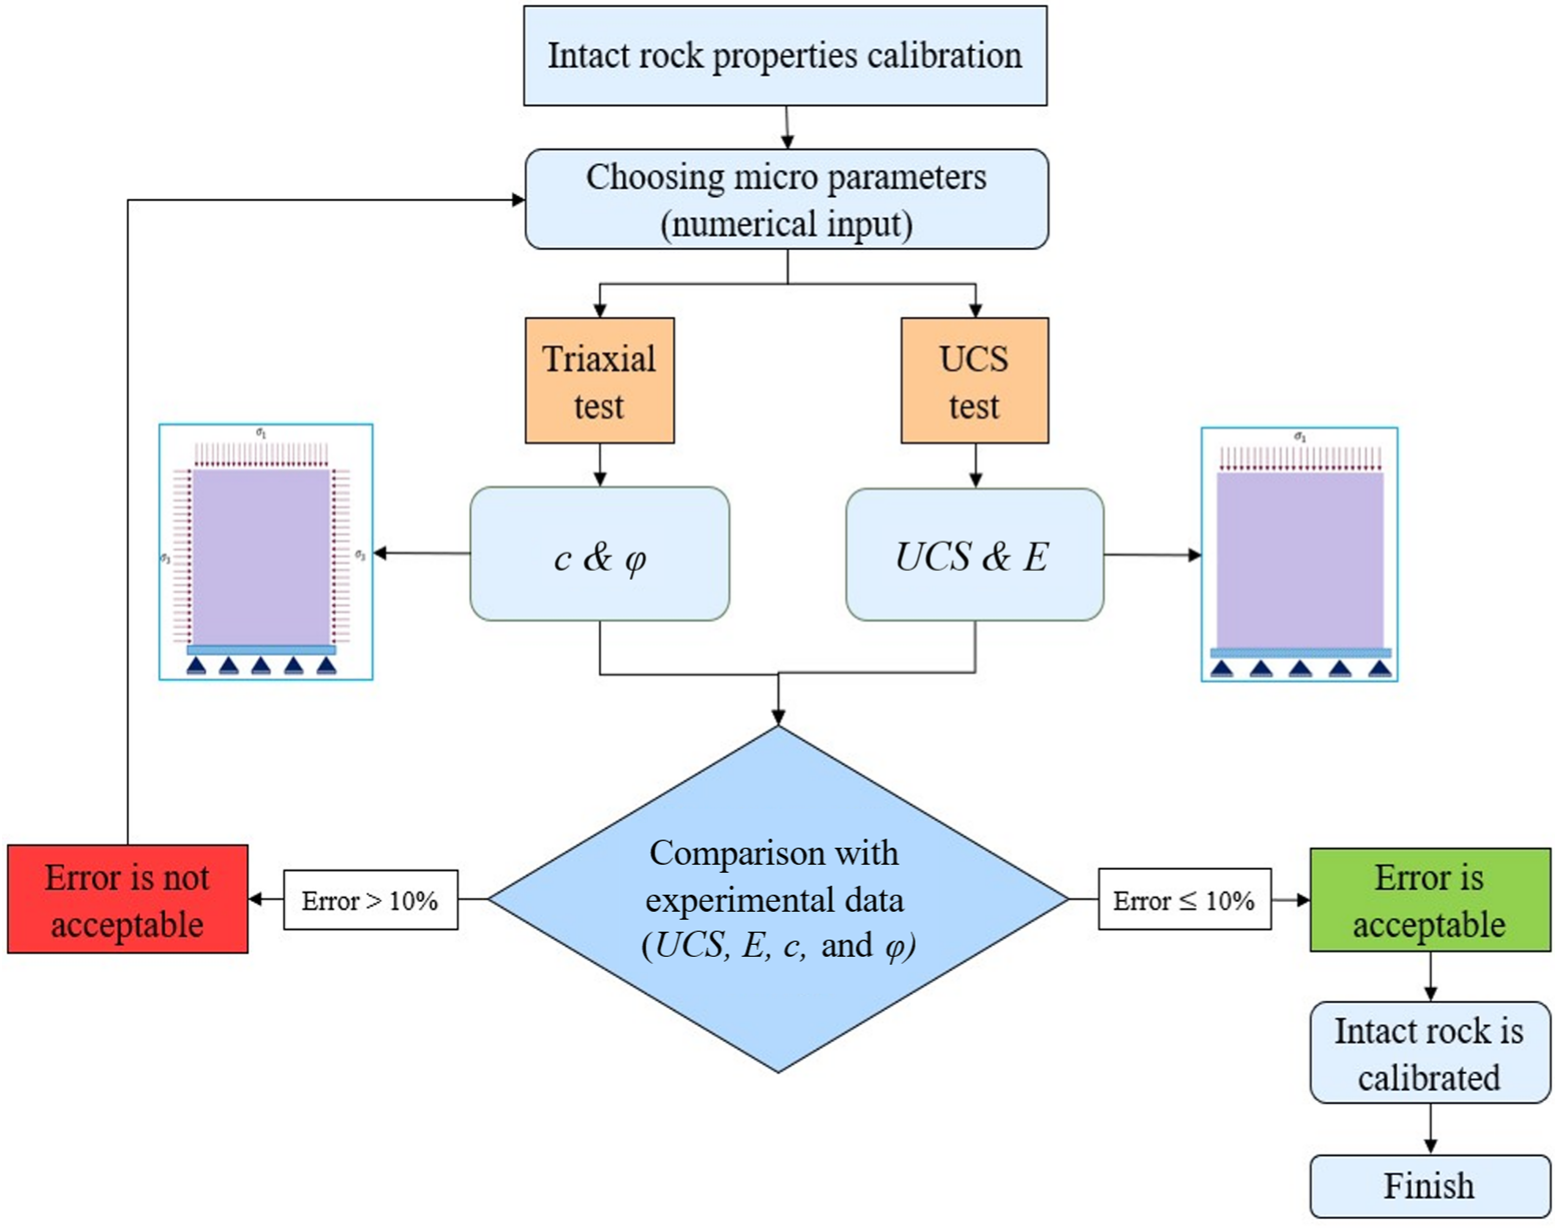
3.1. Calibration of Rock-like Specimens

The behavior of the lattice spring model is controlled by elastic and strength micro-properties such as the deformable modulus (E), UCS, and flat joint friction angle. These micro-properties require calibration to simulate the exact macro-properties of the rock-like specimens tested in the laboratory. The flow chart in Figure 6 demonstrates the calibration procedure of the rock-like specimens. For rock-like specimen calibration, equations presented by Al-E’Bayat et al. [32] were used for the initial micro parameter estimation. Since the careful selection of the micro-scale input parameters is required to simulate the actual behavior of the laboratory-scale specimens in the numerical simulation, fine calibration is performed by regular trial-and-error iterations to achieve less than a 10% difference between the models and experiments. A cubical specimen, the exact dimensions as the laboratory specimens, 54 × 54 × 122 mm3, was used in the unconfined and confined compressive tests. Although the calibration results in Table 2 showed that the micro and macro values of the E and UCS were close together, the unconfined compression stress–strain curves of the laboratory and LS-SRM did not match perfectly (Figure 7a). The reason is due to the initial curvature of the crack closure in the laboratory specimens. Bastola and Cai [33] also report a similar response.
The internal friction angle and cohesion were calibrated by conducting a confined compressive test with low confining pressures of 2, 4, and 6 MPa. The LS-SRM results were compared with the laboratory results, as presented in Figure 7b. The peak friction angle of the flat joint (φfjp) was calibrated to obtain an optimal internal friction angle (φ). In the lattice spring models, the target tensile strength (experimental value) always corresponds to t)mic [33]. Table 2 summarizes the micro- and macro-mechanical properties of the rock-like materials.

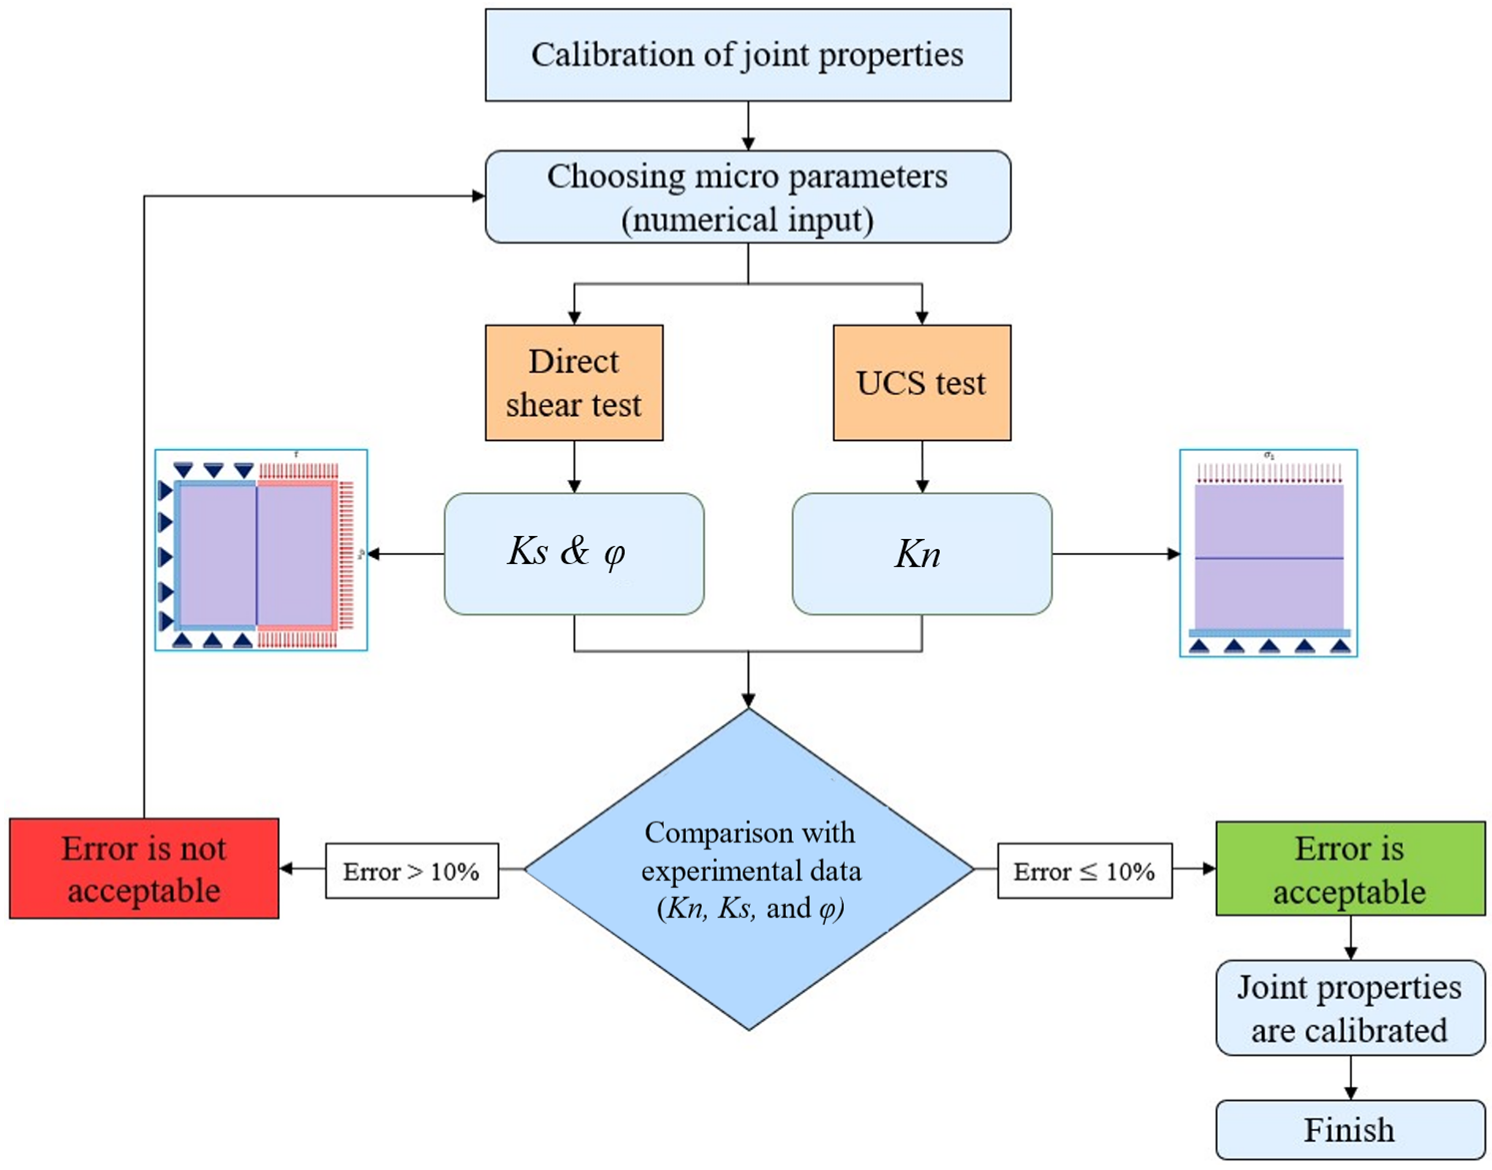
3.2. Calibration of Mechanical Parameters of Joints

The procedure for calibrating joint parameters is illustrated by a flowchart in Figure 8. An unconfined compression test was performed to calibrate the deformability of the specimen with a single horizontal joint perpendicular to the axial load, as shown in Figure 9a. The micro normal stiffness of the joint was adjusted to achieve the closest value of the macro deformability of the system, in which the final micro normal stiffness of the joint was 5.5 GPa/m. The direct shear tests were then executed on specimens containing a persistent joint at the center of the specimen and perpendicular to the σn (see Figure 9b) to calibrate the joint shear stiffness and joint friction angle. The micro- and macro-mechanical properties of the joint are summarized in Table 3.

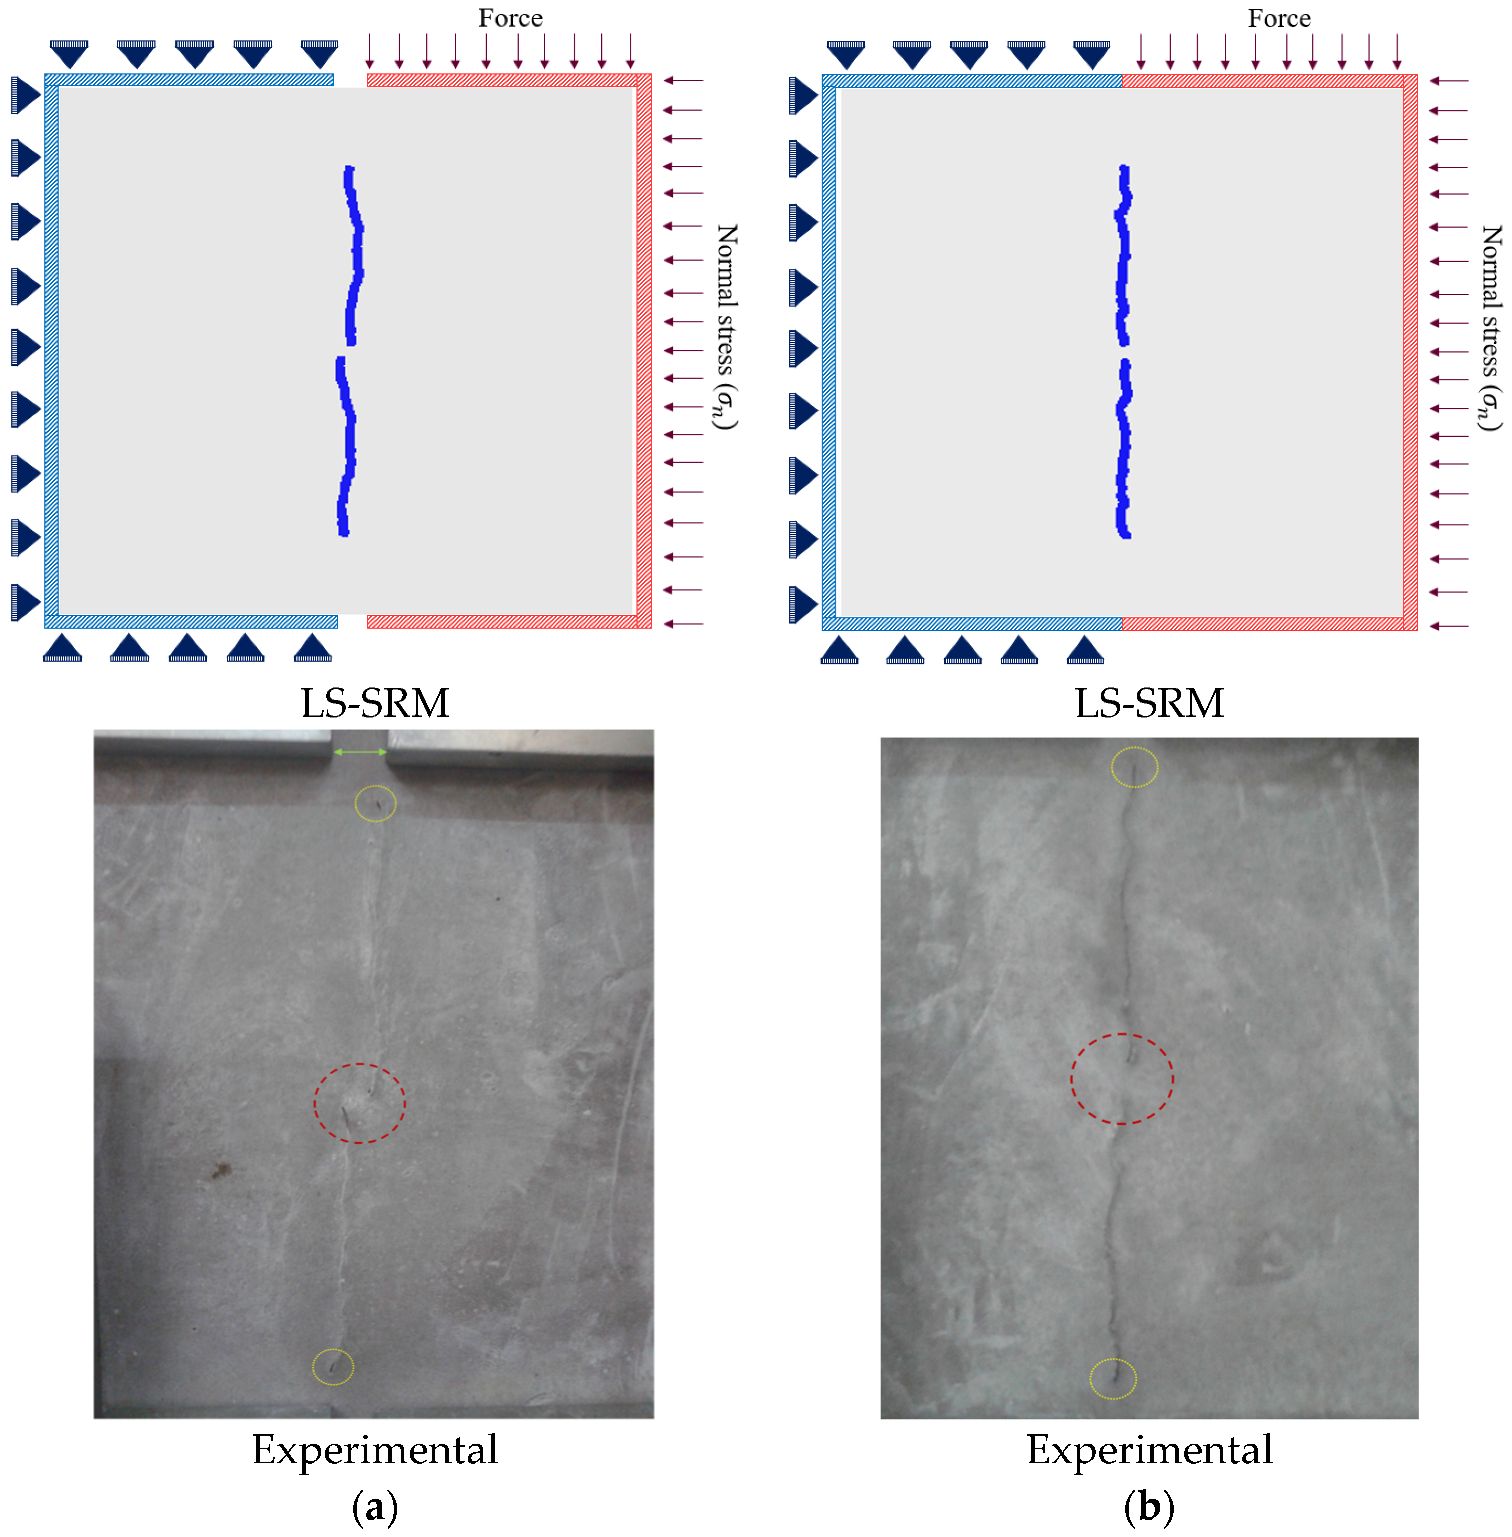
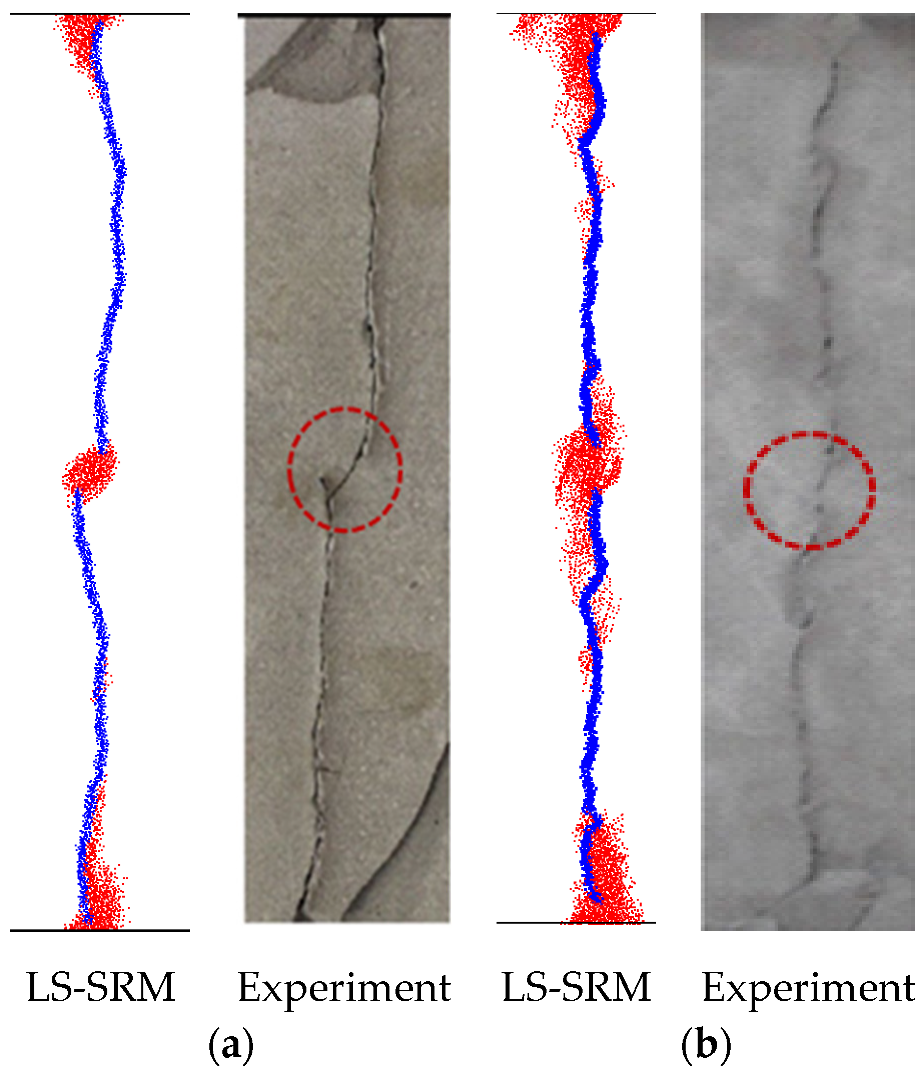
3.3. Validation of LS-SRM Models

Due to the LS-SRM method being relatively new, the capability of the LS-SRM approach to simulate the shear strength value and failure mode of the rough pre-cracked specimens that were experimentally performed by Asadizadeh et al. [16] was validated in this section. Two experimental direct shear tests were selected and rebuilt in LS-SRM using the calibrated parameters. The first specimen contains two noncoplanar flaws with an γ of 120° and L of 10 mm (Figure 10a). The second specimen (Figure 10b) contains two coplanar flaws with an L of 10 mm. The loading rate of both specimens was 0.01 m/s, and constant normal stresses of 1.33 and 3.00 MPa were applied at the right side of the noncoplanar and coplanar specimens, respectively.
Figure 11 illustrates the failure mode of the LS-SRM models and laboratory specimens. The LS-SRM model predicts brittle failure in coplanar and noncoplanar rock bridges, providing a close match to the experimental specimens. Also, the shear strength values of the LS-SRM models were close to the experimental results, as shown in Table 4.

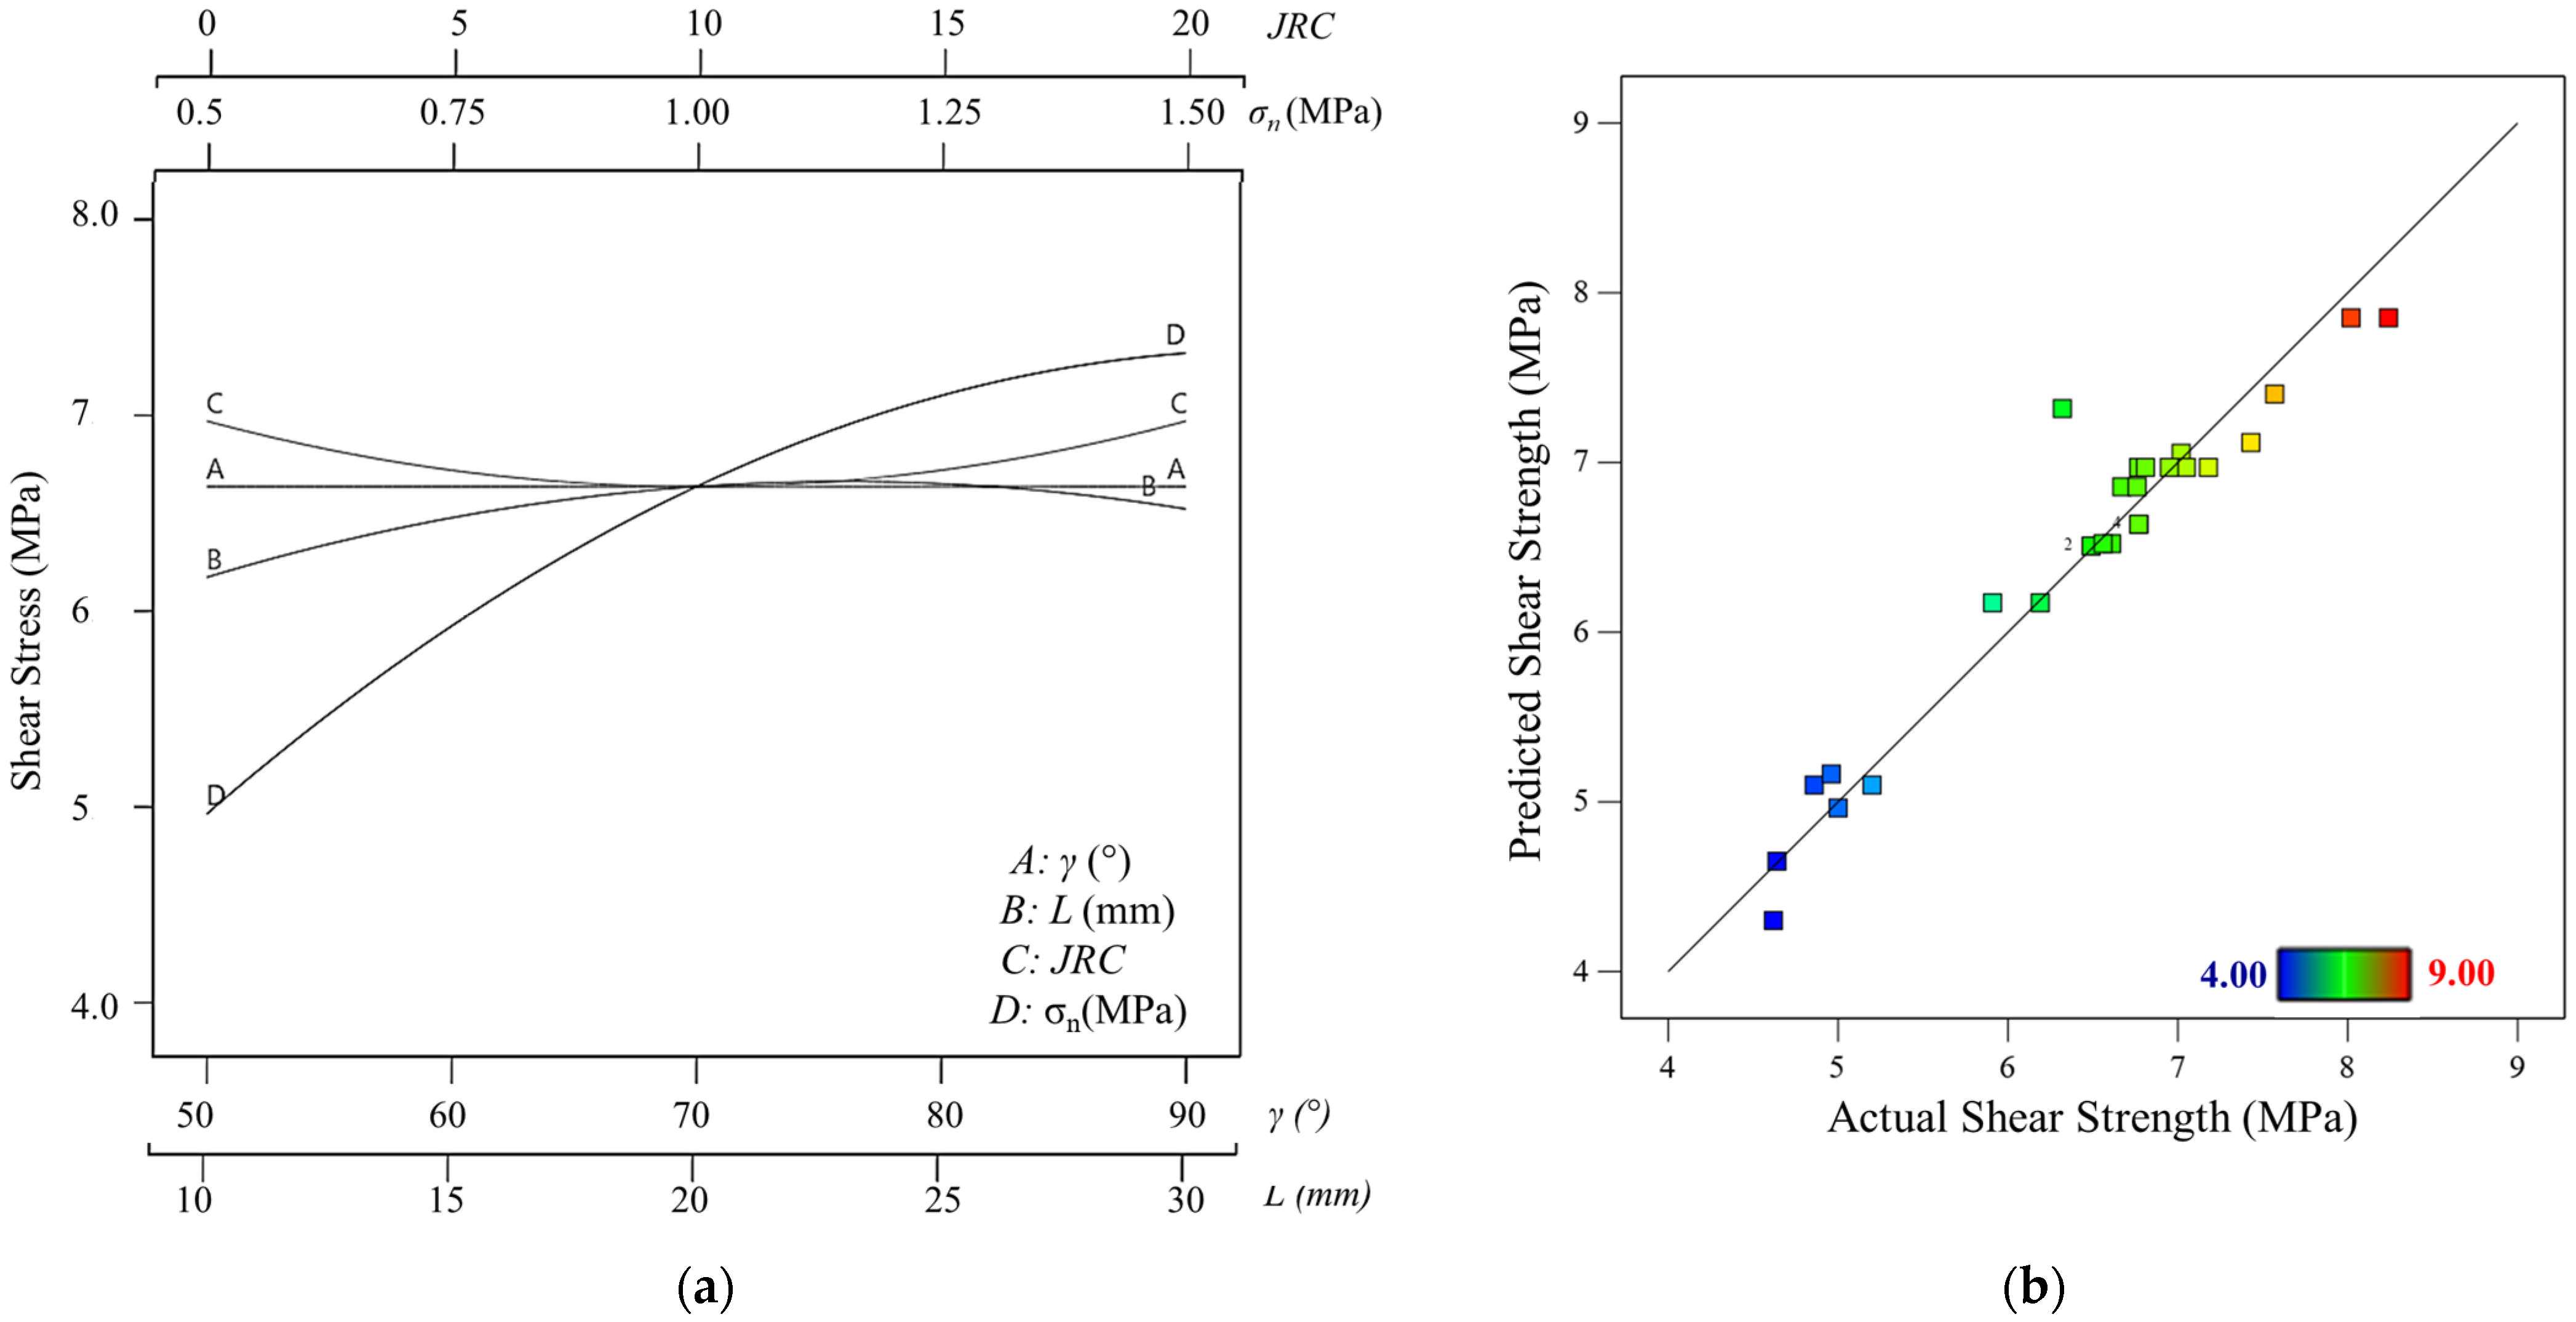
4. Design of Experiments Based on Response Surface Methodology

Response surface methodology (RSM) is the most common optimization technique developed by Box et al. [34]. Response surface methodology is a set of mathematical and statistical tools used to design a functional relationship between input parameters and response variables. Box–Behnken design can significantly minimize the number of experimental sets without reducing the accuracy of the optimization. It was used efficiently to minimize the number of computationally expensive models in FEM and DEM codes [35]. The RSM technique uses a combination of statistical and mathematical approaches to identify the relationship between the response (output) and the model parameters (input), which is not explicitly known [36].
The RSM technique was executed in five steps as follows:
(1)
Defining the independent variables that have a significant impact on the model response;
(2)
Choosing the experimental design and performing the tests in accordance with the experimental matrix chosen;
(3)
The mathematical statistical analysis of the generated experimental data by the fitting of a polynomial function;
(4)
Assessing the model’s performance;
(5)
Selecting the optimum values for each studied parameter [37].
Response surface methodology was adopted in this study, in which the JRC, γ, L, and σn were the independent variables, and the shear strength and shear stiffness were the response variables. The responses were expressed using Equation (4), as follows [16,38,39]:
y = β 0 + i = 1 3 β i X i + i = 1 3 β i i X i 2 + i = 1 3 j = i + 1 3 β i j X i X j
where y is a response variable, βii, βij, βi, and β0 are the regression coefficients, and Xi and Xj are the independent variables coded in a program according to:
X i = x i + x 0 Δ x
where x0 is the value of xi at the center point, and Δx is the variation interval.
According to Box–Behnken’s design, the minimum and maximum ranges for the four independent parameters were demonstrated in terms of coded symbols in Table 5.
Based on the Box–Behnken design, 29 direct shear tests were conducted numerically using the LS-SRM approach, and the shear strength and shear stiffness of the samples were calculated. The model results are presented in Table 6.
The functional relationship between the dependent parameters (shear stress and shear stiffness) and the independent parameters (γ,L, JRC, and σn) were determined. The mathematical model was presented for shear stress (τ) and shear stiffness (ks) as follows:
τ = 0.00597 + 0.17695 × L 7.76468 × σ n 0.00618 × γ × σ n 0.00399 × L 2 0.00013 × J R C 2 + 2.4303 × σ n 2
k s = 0.746 + 0.1457 × γ 0.0729 × L + 1.2605 × σ n   0.025 × γ × σ n 0.001 × γ 2 + 0.0015 × L 2 + ( 0.0004 × J R C 2 + 0.4604 × σ n 2
where A and B code for γ and L, respectively. C codes for JRC and D codes for σn. These equations demonstrated that all independent parameters affect rock samples’ shear strength and stiffness. Shear stress and stiffness can be predicted for rock-like shear samples with known γ, L, JRC, and σn values using the proposed equations (Equations (6) and (7)) in a reasonable agreement with the adjusted R2 of 0.91 and 0.83, respectively. Figure 12 illustrates how Equation (6) can predict the shear strength of pre-cracked specimens with varying γ, L, JRC, and σn. The relationships between Equation (6) and the RSM results are discussed in detail in the following section.
The Analysis of Variance (ANOVA) tables for the shear strength and shear stiffness responses of pre-cracked shear samples are illustrated in Table 7 and Table 8, respectively. For the variables, p-values (last column) lower than 0.05 indicate that the model terms are significant, while values greater than 0.1 indicate that the model terms are insignificant.
Table 7 shows that the σn and γ have a primary role in the shear strength while the p-value < 0.05. Shear stiffness was also affected by the σn, γ, and L of the rock bridge (Table 8).

5. Results and Discussion

5.1. Results of Pre-Cracked Shear Specimens

According to the shear strength results in Table 6, the presence of two noncoplanar joints significantly reduced the sample’s shear strength compared with the intact sample. In all the models, the shear strength of the flawed samples containing two noncoplanar joints was lower than that of the intact sample. Figure 12a illustrates the relationship between each parameter of the noncoplanar joints with the shear strength. The peak shear strength of the intact sample under 1.5 MPa normal stress was 13.92 MPa. On the other hand, as given in Table 6, the shear strength of the pre-cracked samples ranged from 4.62 MPa (γ = 50°, L = 10 mm, JRC = (10–12), and σn = 0.5 MPa) to 8.24 MPa (γ = 50°, L = 20 mm, JRC = (0–2), and σn = 1.5 MPa). The average shear strength of all the pre-cracked samples was approximately 6.46 MPa, which is approximately half of the intact model shear strength. In contrast, the percentage difference between the maximum and minimum values and the average value was about 26 % of the intact model shear strength. The scatter plot of the model results against the values predicted by Equation (6) are presented in Figure 12b.

5.1.1. Effect of Normal Stress on the Pre-Cracked Shear Specimens

Figure 12a illustrates the relationship between the σn and the shear strength of pre-cracked samples, as it is known that the shear strength increases when σn increases. The RSM results showed that the shear strength at higher σn (above 1.33 MPa) remained relatively constant with a slight decrease. The reason for the decrease was the interlocking cracks at the asperities of the joints with high JRC profiles; asperity interlocking caused tensile cracking and decreased the shear strength.
Figure 13 shows the shear stress–shear displacement curves of pre-cracked samples with constant values of γ (90°), L (20 mm), and JRC of 10–12 in three constant σn. The failure patterns in the rock bridge area in the samples were identical. As presented on the shear stress–shear displacement curves, the first wing crack initiation at the inner tip of the pre-existing joints caused a drop in the shear strength at points A and A′. Cracks continued to propagate until they coalesced with the other wall of the pre-existing joint. This caused a brittle failure in the rock bridge without coalescence at the inner tip of the pre-existing joints, leading to peak failure at points B and B′, shown on the curves. After that point, wing cracks are initiated at the outer tip of the pre-existing joints, propagate curvilinearly for a distance, then grow parallel to the shear loading direction. Finally, secondary cracks formed and propagated from the specimen wall toward the outer tip of the pre-existing joints until the specimen failed at points C and C′. Although the failure mechanism at the rock bridge area looked similar in both specimens, the wing cracks at the edge of the specimens under low σn dipped steeply in the direction of σn. Another observation was that the specimens tested with lower σn had relatively higher cracks than those under higher σn. The higher σn restricted the propagation of tensile wing cracks.

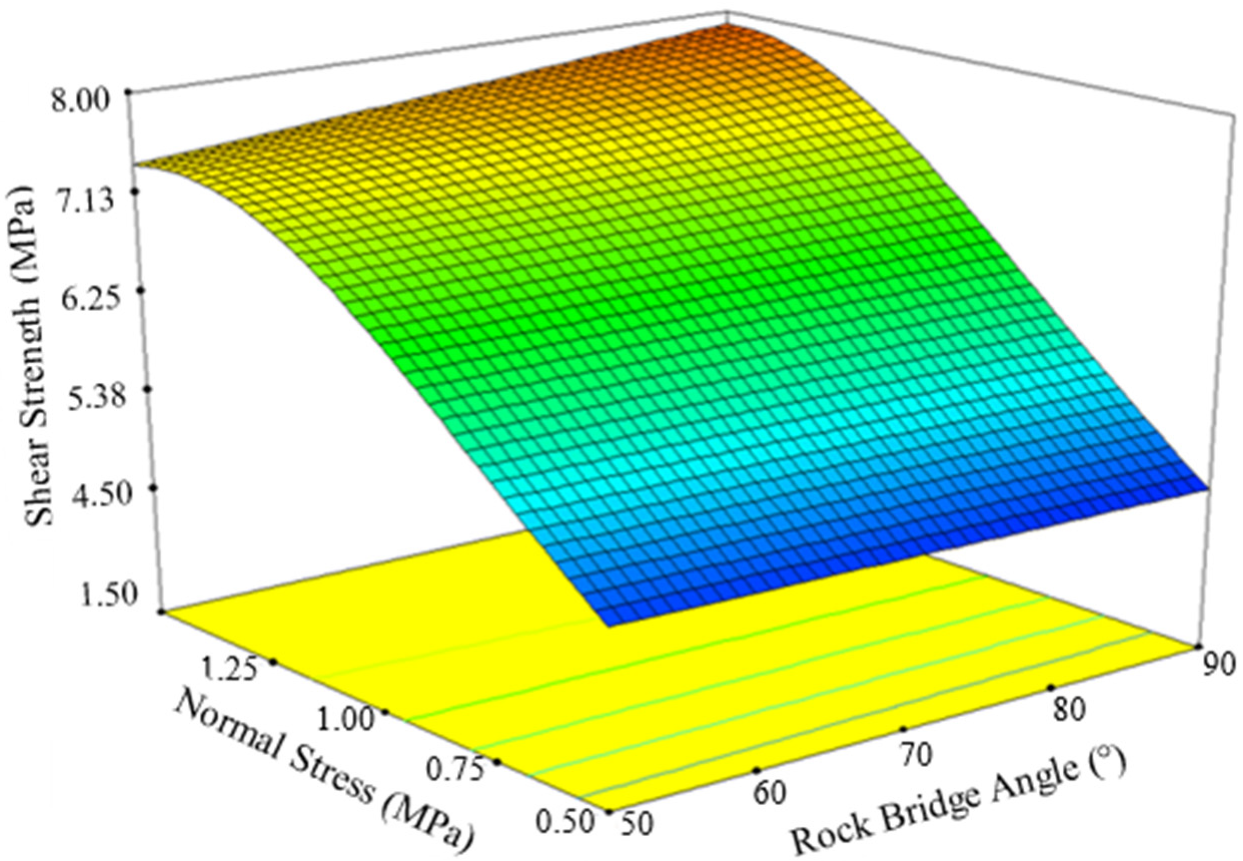
5.1.2. Effect of Rock Bridge Angle on the Pre-Cracked Shear Specimens

Figure 14 depicts the RSM findings in a 3D surface plot to better understand the mutual interactions on the peak shear strength, γ, and σn of pre-cracked specimens. The results showed that the shear strength decreased by around 10% when the γ changed from 90 to 50° under 1.5 MPa σn. A monotonic shear strength increase was observed for specimens having γ = 90°, whereas shear strength reached a constant at the lower values of σn for any γ < 90°. Figure 12b shows the shear strength results calculated from RSM and Equation (6). The plot illustrates that the estimations by Equation (6) are close to the RSM results, having an error of less than 5%.
Although the γ slightly affected the shear strength of the pre-cracked specimens, the spatial distribution of the microcracks in failed specimens with different γ could reflect various failure patterns, as shown in Figure 15. Under specific (plane stress) conditions, cracks form in two types: wing cracks and shear cracks. Wing cracks were classified as tensile cracks, initiated at the tip of pre-existing joints after the slip has occurred along the pre-existing joints and propagated in a stable manner in a curvilinear path towards the loading direction. Shear cracks were observed after wing cracks, which were initiated at the edges of the specimens. It should be noted that in a 3D condition, tearing mode could generate another type of crack than tensile and shearing.
In a specimen with γ of 50° (see Figure 15a), the tensile wing cracks started at the inner tip of joints and propagated toward the other joint wall through the rock bridge area. Haeri [40] also reported a similar failure pattern in specimens with overlapping pre-existing joints. In contrast with overlapping pre-existing joints, the S-shaped crack was observed in the specimen without joint overlapping (γ = 90°) (see Figure 15b). It should be noted that the S-shaped crack is classified as a shear-tensile crack [16].

5.1.3. Effect of Rock Bridge Length on the Pre-Cracked Shear Specimens

The effect of L on the shear strength of noncoplanar pre-cracked specimens can be seen in Figure 12a. The results demonstrated that increases in L (from 10 to 20 mm) increased shear strength by approximately 10%. This result was expected since increases in L increased the intact rock bridge size, enhancing the strength of the rock specimens. However, increases of L of more than 25 mm led to a decrease in the shear strength. In cases where L is over 25 mm, the shear strength decreases due to a decrease in microcrack density that increases the cohesion and decreases the rock bridge’s friction angle [41].

5.1.4. Effect of Joint Roughness Coefficients on the Pre-Cracked Shear Specimens

The effect of the JRC on the shear strength of noncoplanar pre-cracked specimens is illustrated in Figure 12a. According to Barton’s [42] formula expressed in Equation (8), the JRC significantly affects the shear strength of specimens with a fully persistent rough joint. Nevertheless, the RSM results could not capture the impact of the JRC on the shear strength of non-persistent pre-cracked specimens.
τ = σ n tan φ r + J R C log 10 J C S σ n  
where τ is the peak shear strength, σn is the effective normal stress, φr is the residual friction angle of the joint, and JCS is the joint wall compressive strength.
In order to emphasize the influence of the JRC on pre-cracked shear specimens, coplanar shear models with a varying JRC and joint continuity factor (k), given by Equation (9), were performed. A high resolution of 1 mm lattice spring length was used to ensure that the asperity of joint roughness was captured. The results in Figure 16 agree with the RSM results in Figure 12. They indicated that the JRC had no apparent impact on the shear strength and shear behavior of noncoplanar and coplanar pre-existing joints.
It is common knowledge that joint roughness significantly impacts shear strength and the shear behavior of rock discontinuities. However, this fact is overshadowed in our models due to the non-persistency of the joints. Joint persistency impacts the shear strength response much more than the joint roughness, and the JRC impact can only be captured by models having fully persistent joints.
k = L j L j + L r
where Lj and Lr are the lengths of the joint and of the rock bridge, respectively.

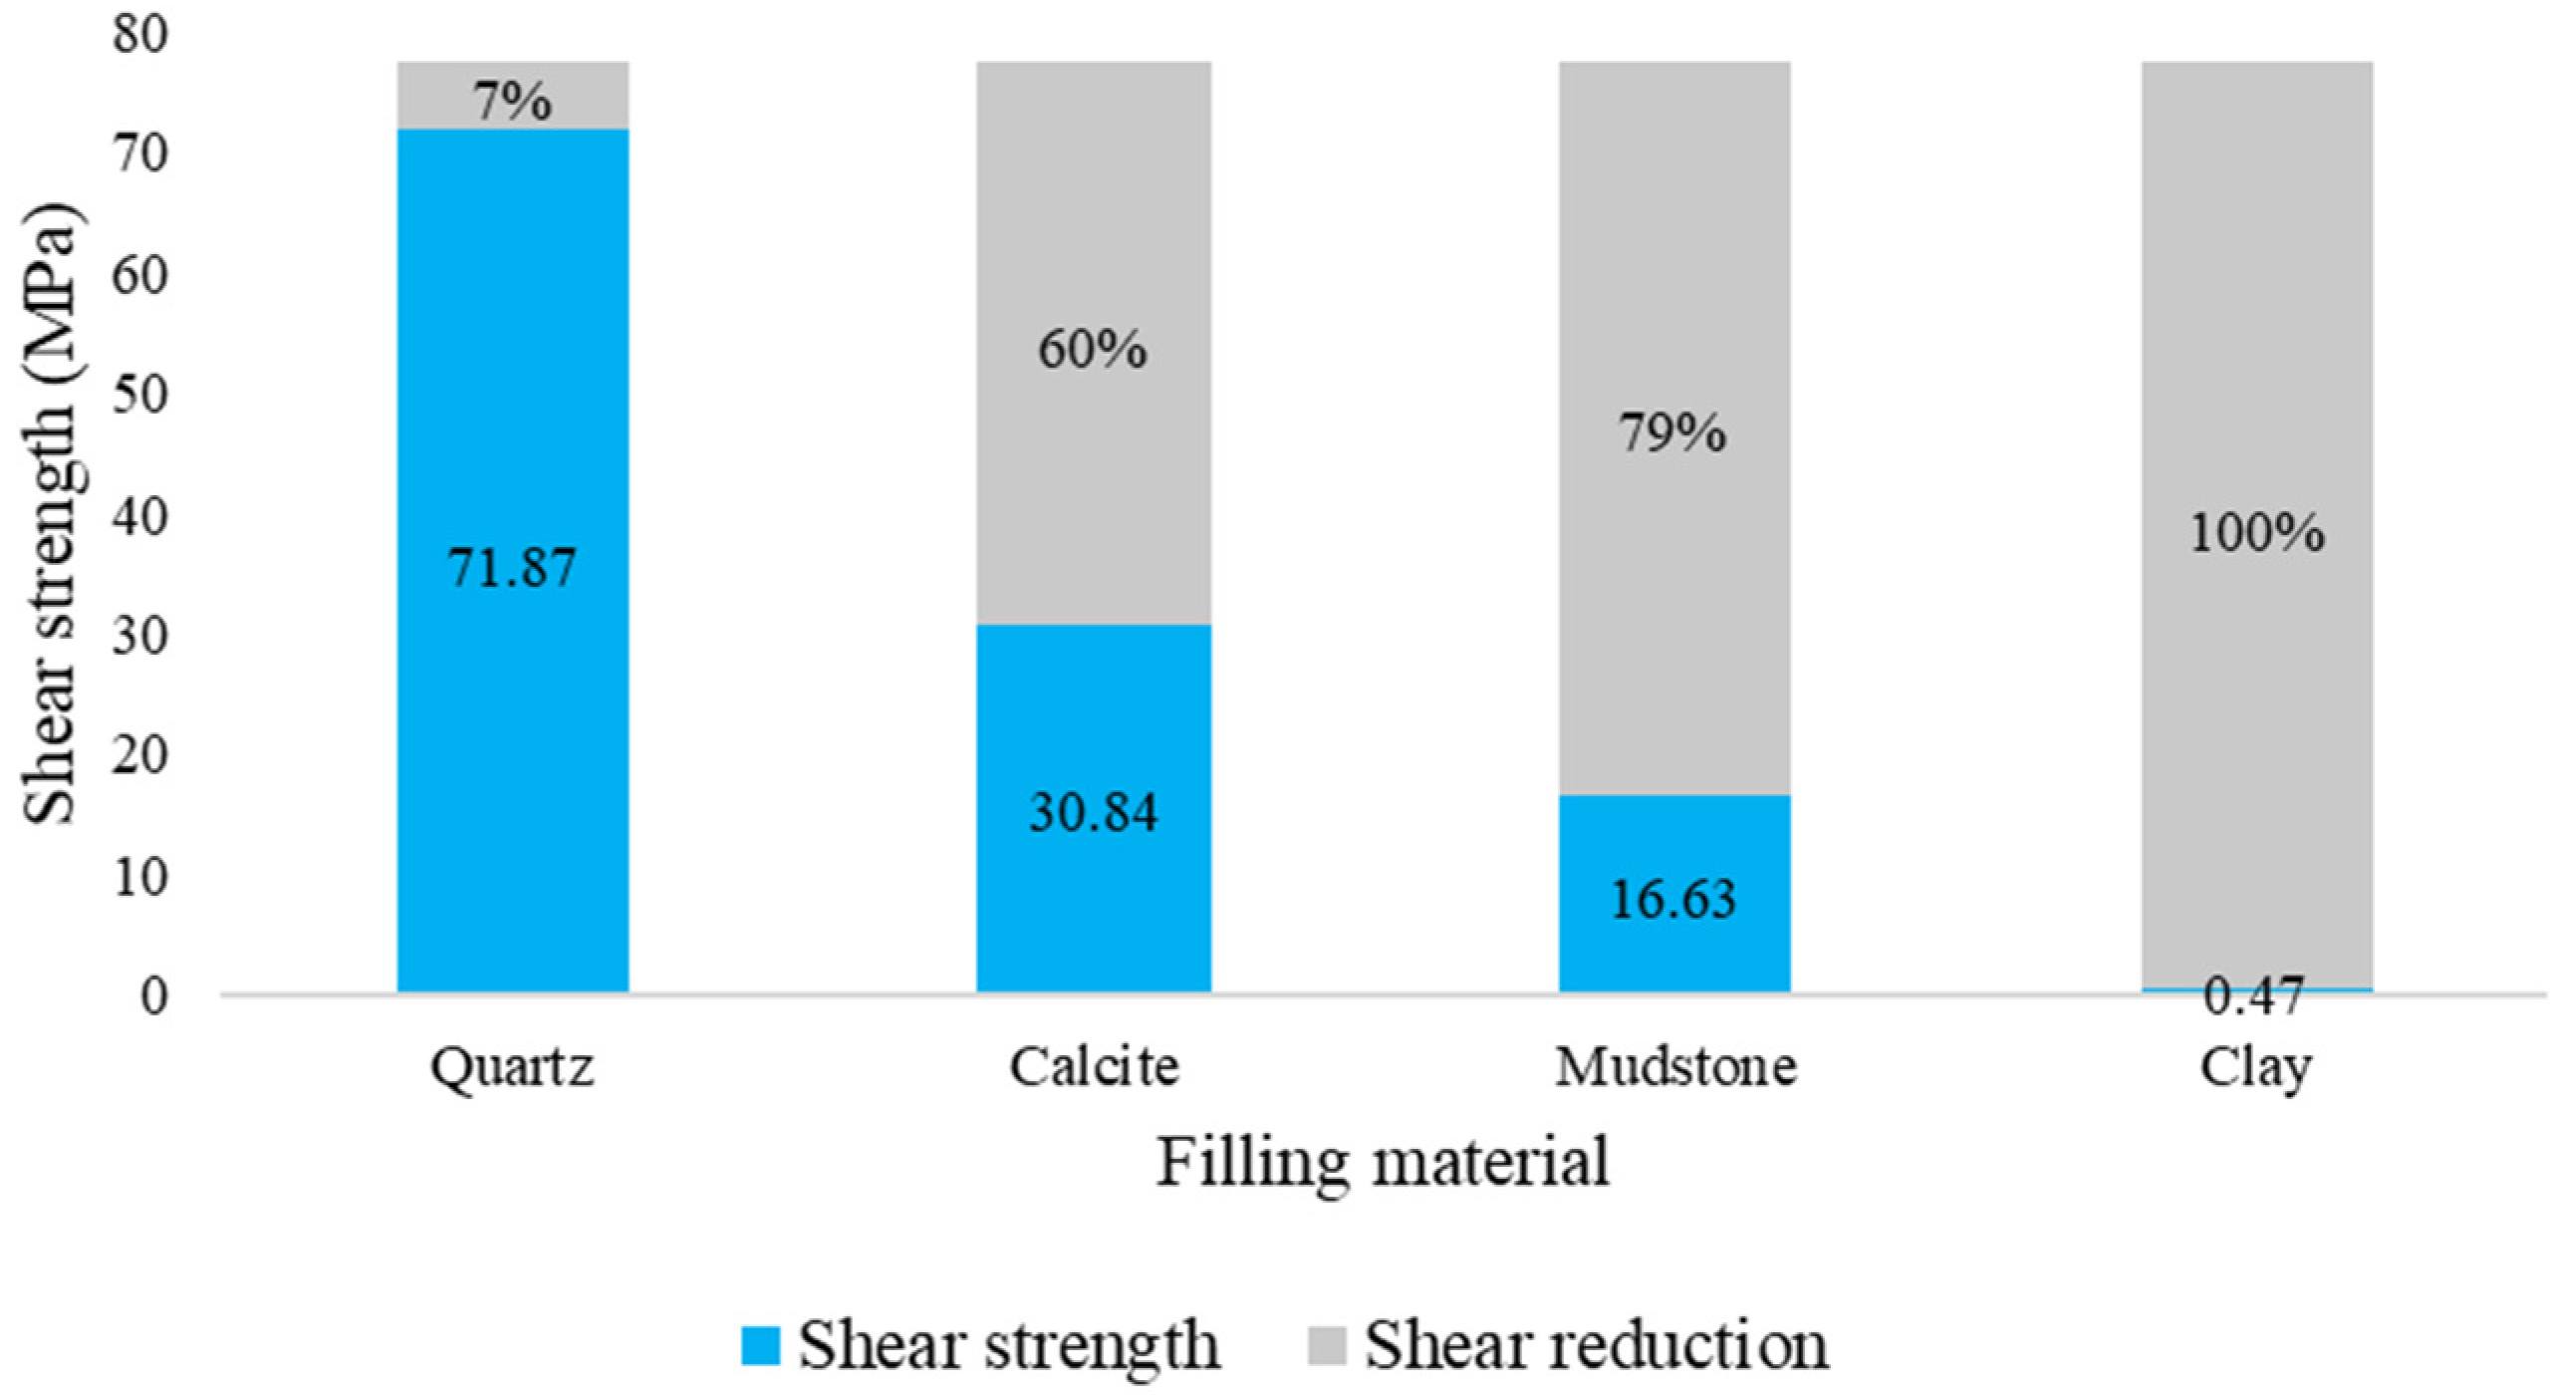
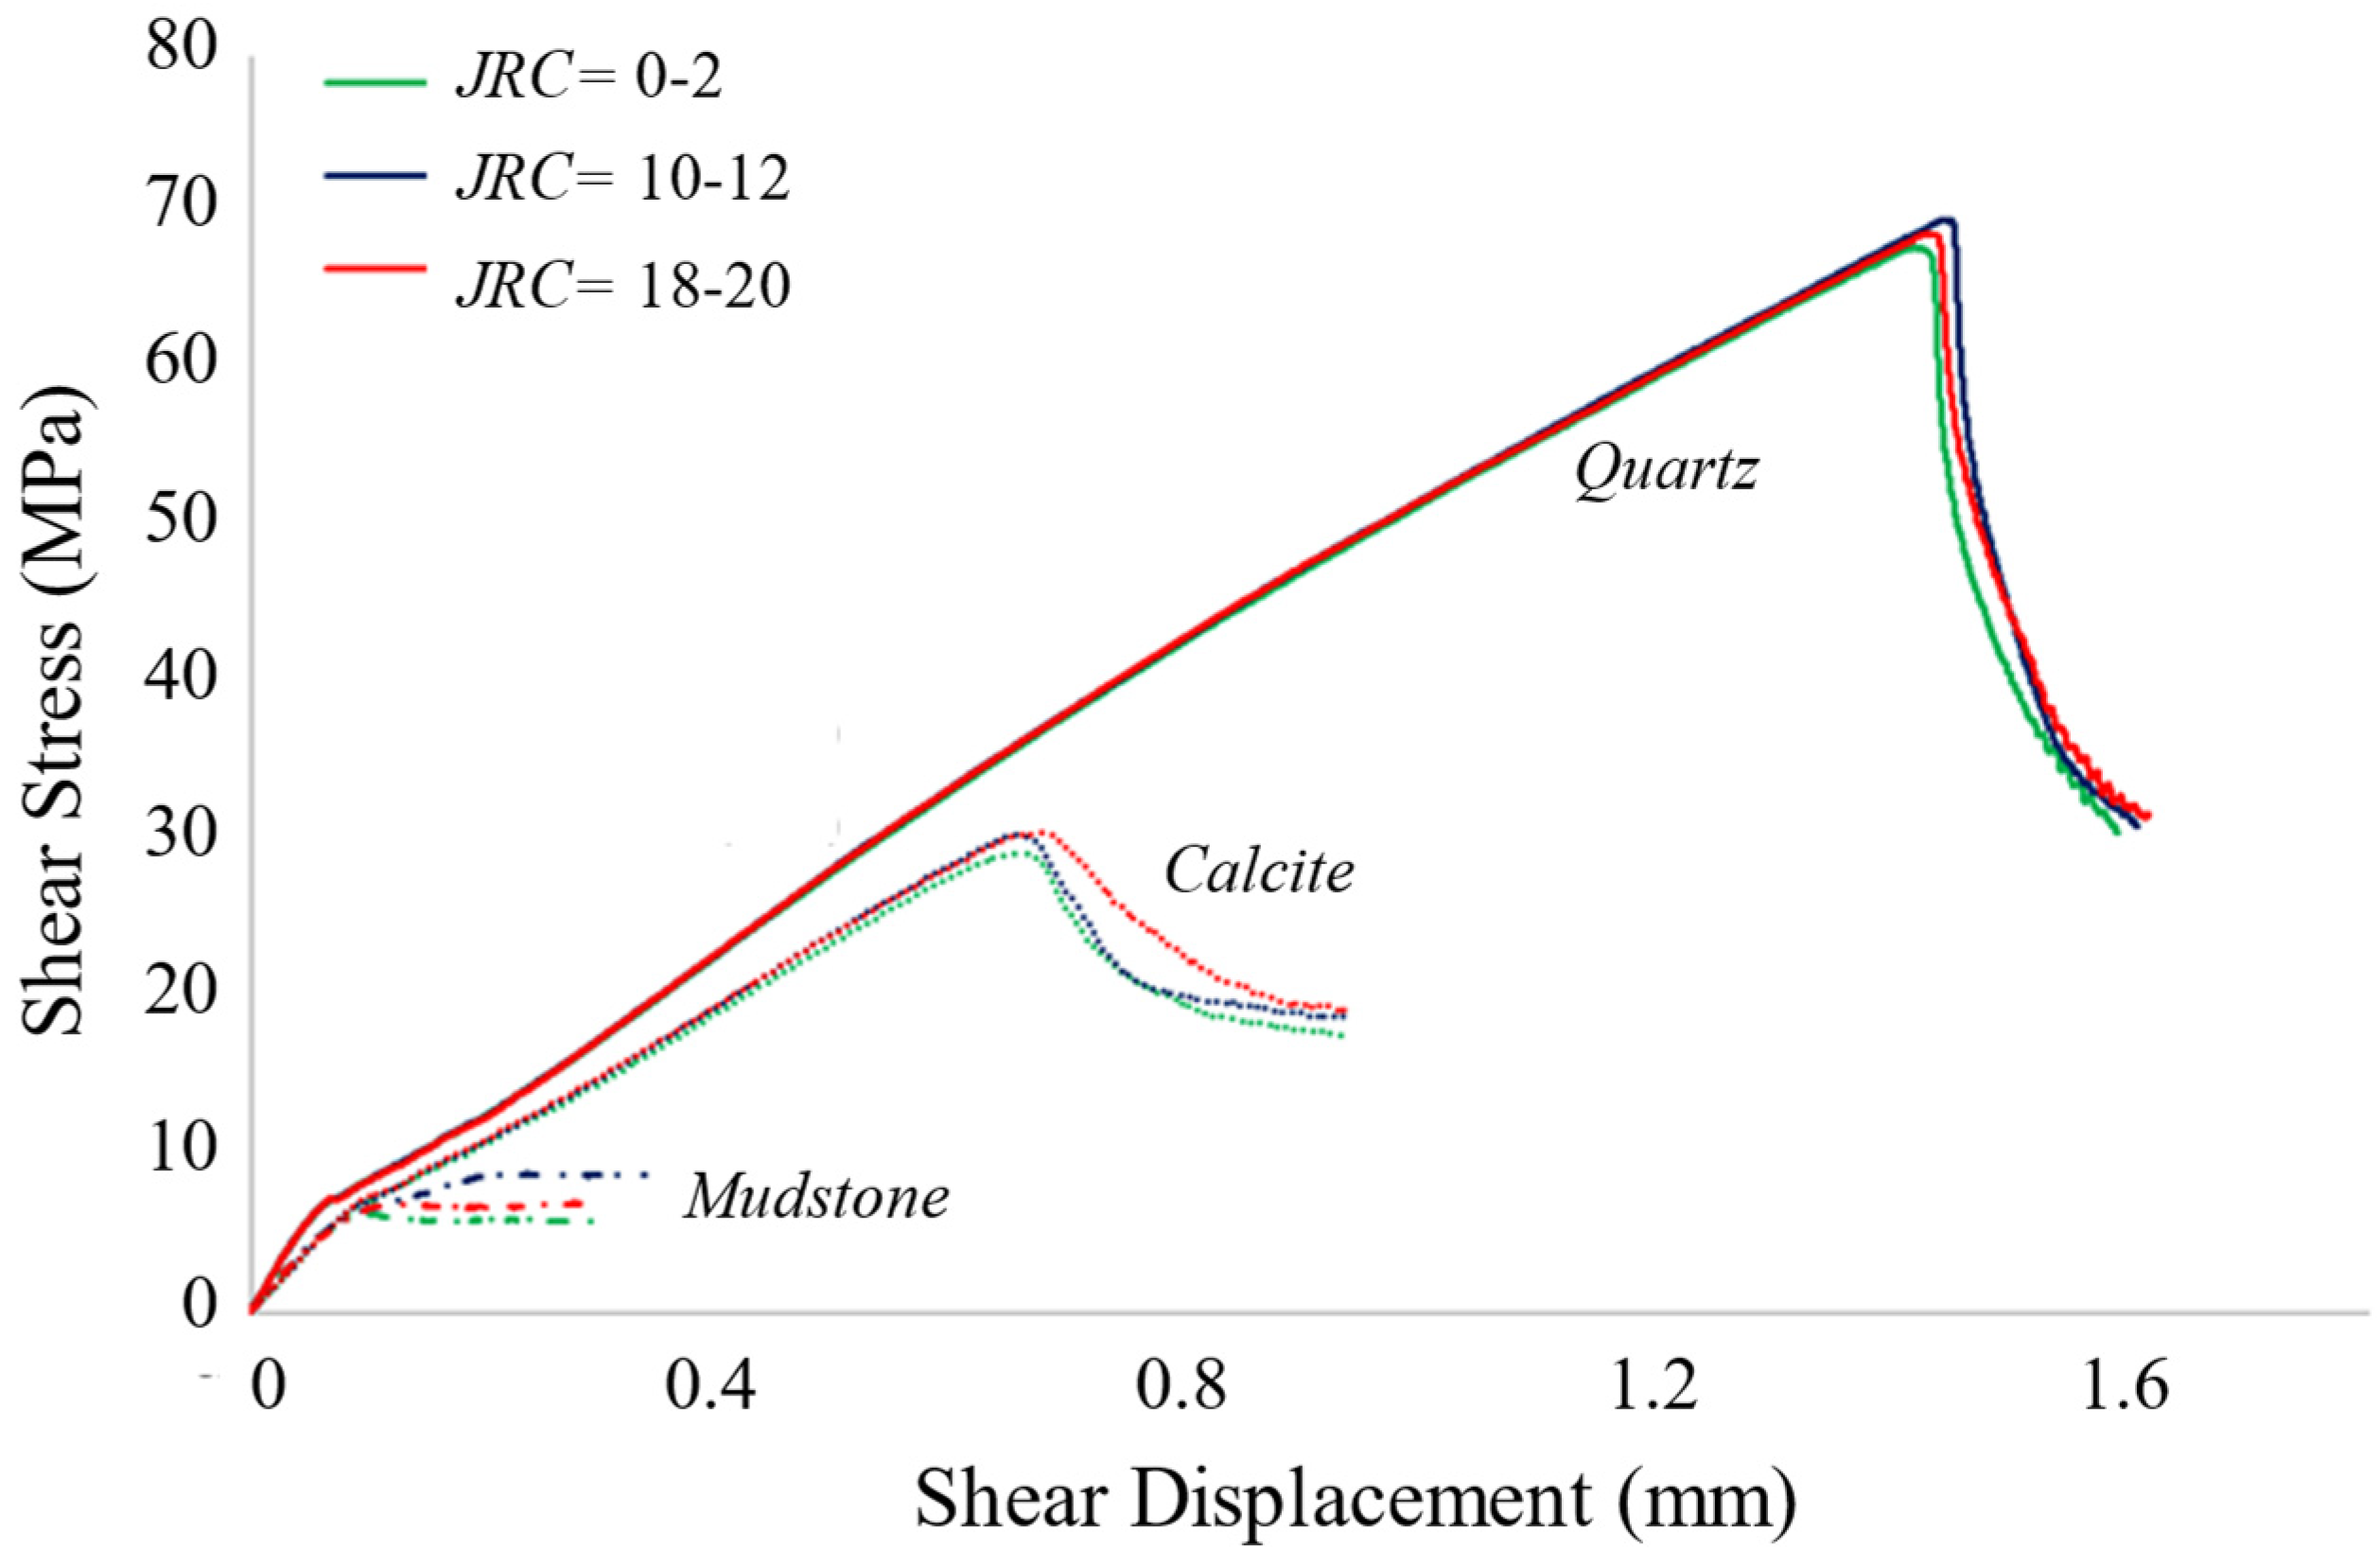
5.2. Results of Shear Specimens with Infill Mineral

The chemical and physical weathering processes cause a gradually weathered joint wall. Therefore, fine-grained infill minerals may accumulate between joint walls over time. These minerals may increase or decrease the shear strength of the rock based on the mineralogy, thickness, and roughness of the infilled wall. This section quantifies the effect of infilled minerals, infill thickness (aperture), and the infilled wall roughness on the shear strength of amphibolite specimens. All the LS-SRM models were conducted at a constant σn of 1.5 MPa and a constant loading rate of 0.01 m/s. The lattice spring length (1.0 mm) is small enough to ensure that at least four lattice springs were placed within the infill thickness of 4.0 mm.

5.2.1. Effect of Rock Bridge Length on the Pre-Cracked Shear Specimens

Figure 17 illustrates the peak shear strength of amphibolite specimens with different infill minerals. It is apparent that the infill minerals’ strength controlled the specimens’ peak shear strength. The results demonstrated that the shear strength decreased as the infill mineral strength decreased. The minimum shear strength reduction of the amphibolite specimen (77.46 MPa for no filling condition) was 7% in the quartz-infilled specimen, and the maximum shear strength reduction was 99.5% in the clay-infilled specimen.
The specimen with no infill failed after shear cracks initiated and propagated, following wing cracks from the edge of the specimen toward the center in a parallel direction with the loading axis (see Figure 18a). A similar failure pattern was observed in a quartz-infilled specimen, except the failure path was developed partly through the infill and partly through the host rock since the quartz strength (231 MPa) was close to the host rock strength (298 MPa). Shear bands cut through the infilled mineral parallel to the shear zone boundaries. Notable tensile wing cracks were observed in the host rock with medium (calcite, UCS = 90 MPa) and weak (mudstone, UCS = 43 MPa) infilled minerals. A pure shear failure occurred through the clay-infilled joints, representing a very soft mineral (UCS = 0.2 MPa).
In the case of specimens with infill minerals and having a 10% rock bridge, the peak shear strength increased compared to fully persistent infilled cases (see Figure 19). The shear strength of a quartz-infilled specimen increased by 1% due to the percent of rock bridge, while the shear strength was increased more than 8 times in a specimen with soft infill (clay), as illustrated in Figure 19.

5.2.2. Effect of the Infill Thickness on the Shear Specimens

In order to investigate the impact of infill thickness, three amphibolite shear specimens with calcite infill thicknesses of 4.0, 8.0, and 12.0 mm were modeled under σn of 1.5 MPa. These thickness values were selected to ensure that at least four lattice springs were placed within the infill area with a resolution of 1.0 mm, where the recommended resolution in LS-SRM is 2.0 mm [2]. The results illustrated that the infill thickness had no apparent effects on shear strength, where the shear strength of the filling specimens was about 30 MPa, which is close to that of the intact calcite specimen (32.87 MPa). Therefore, it is concluded that the infill mineral controls the entire specimen’s shear strength rather than infill thickness.
Figure 20 shows the failure mechanisms of calcite-infilled specimens with different infill thicknesses. The failure mechanisms were almost identical in three different infill thicknesses. Tensile wing cracks were initiated at the edge of the specimen and propagated through the hosted rock; then, shear cracks were initiated and propagated through the infilled minerals and formed shear bands. Generally, shear bands were formed in a thin layer of rock weaker than the surrounding rock. The results indicated that the intensity of the shear bands increased as the infill thickness decreased.

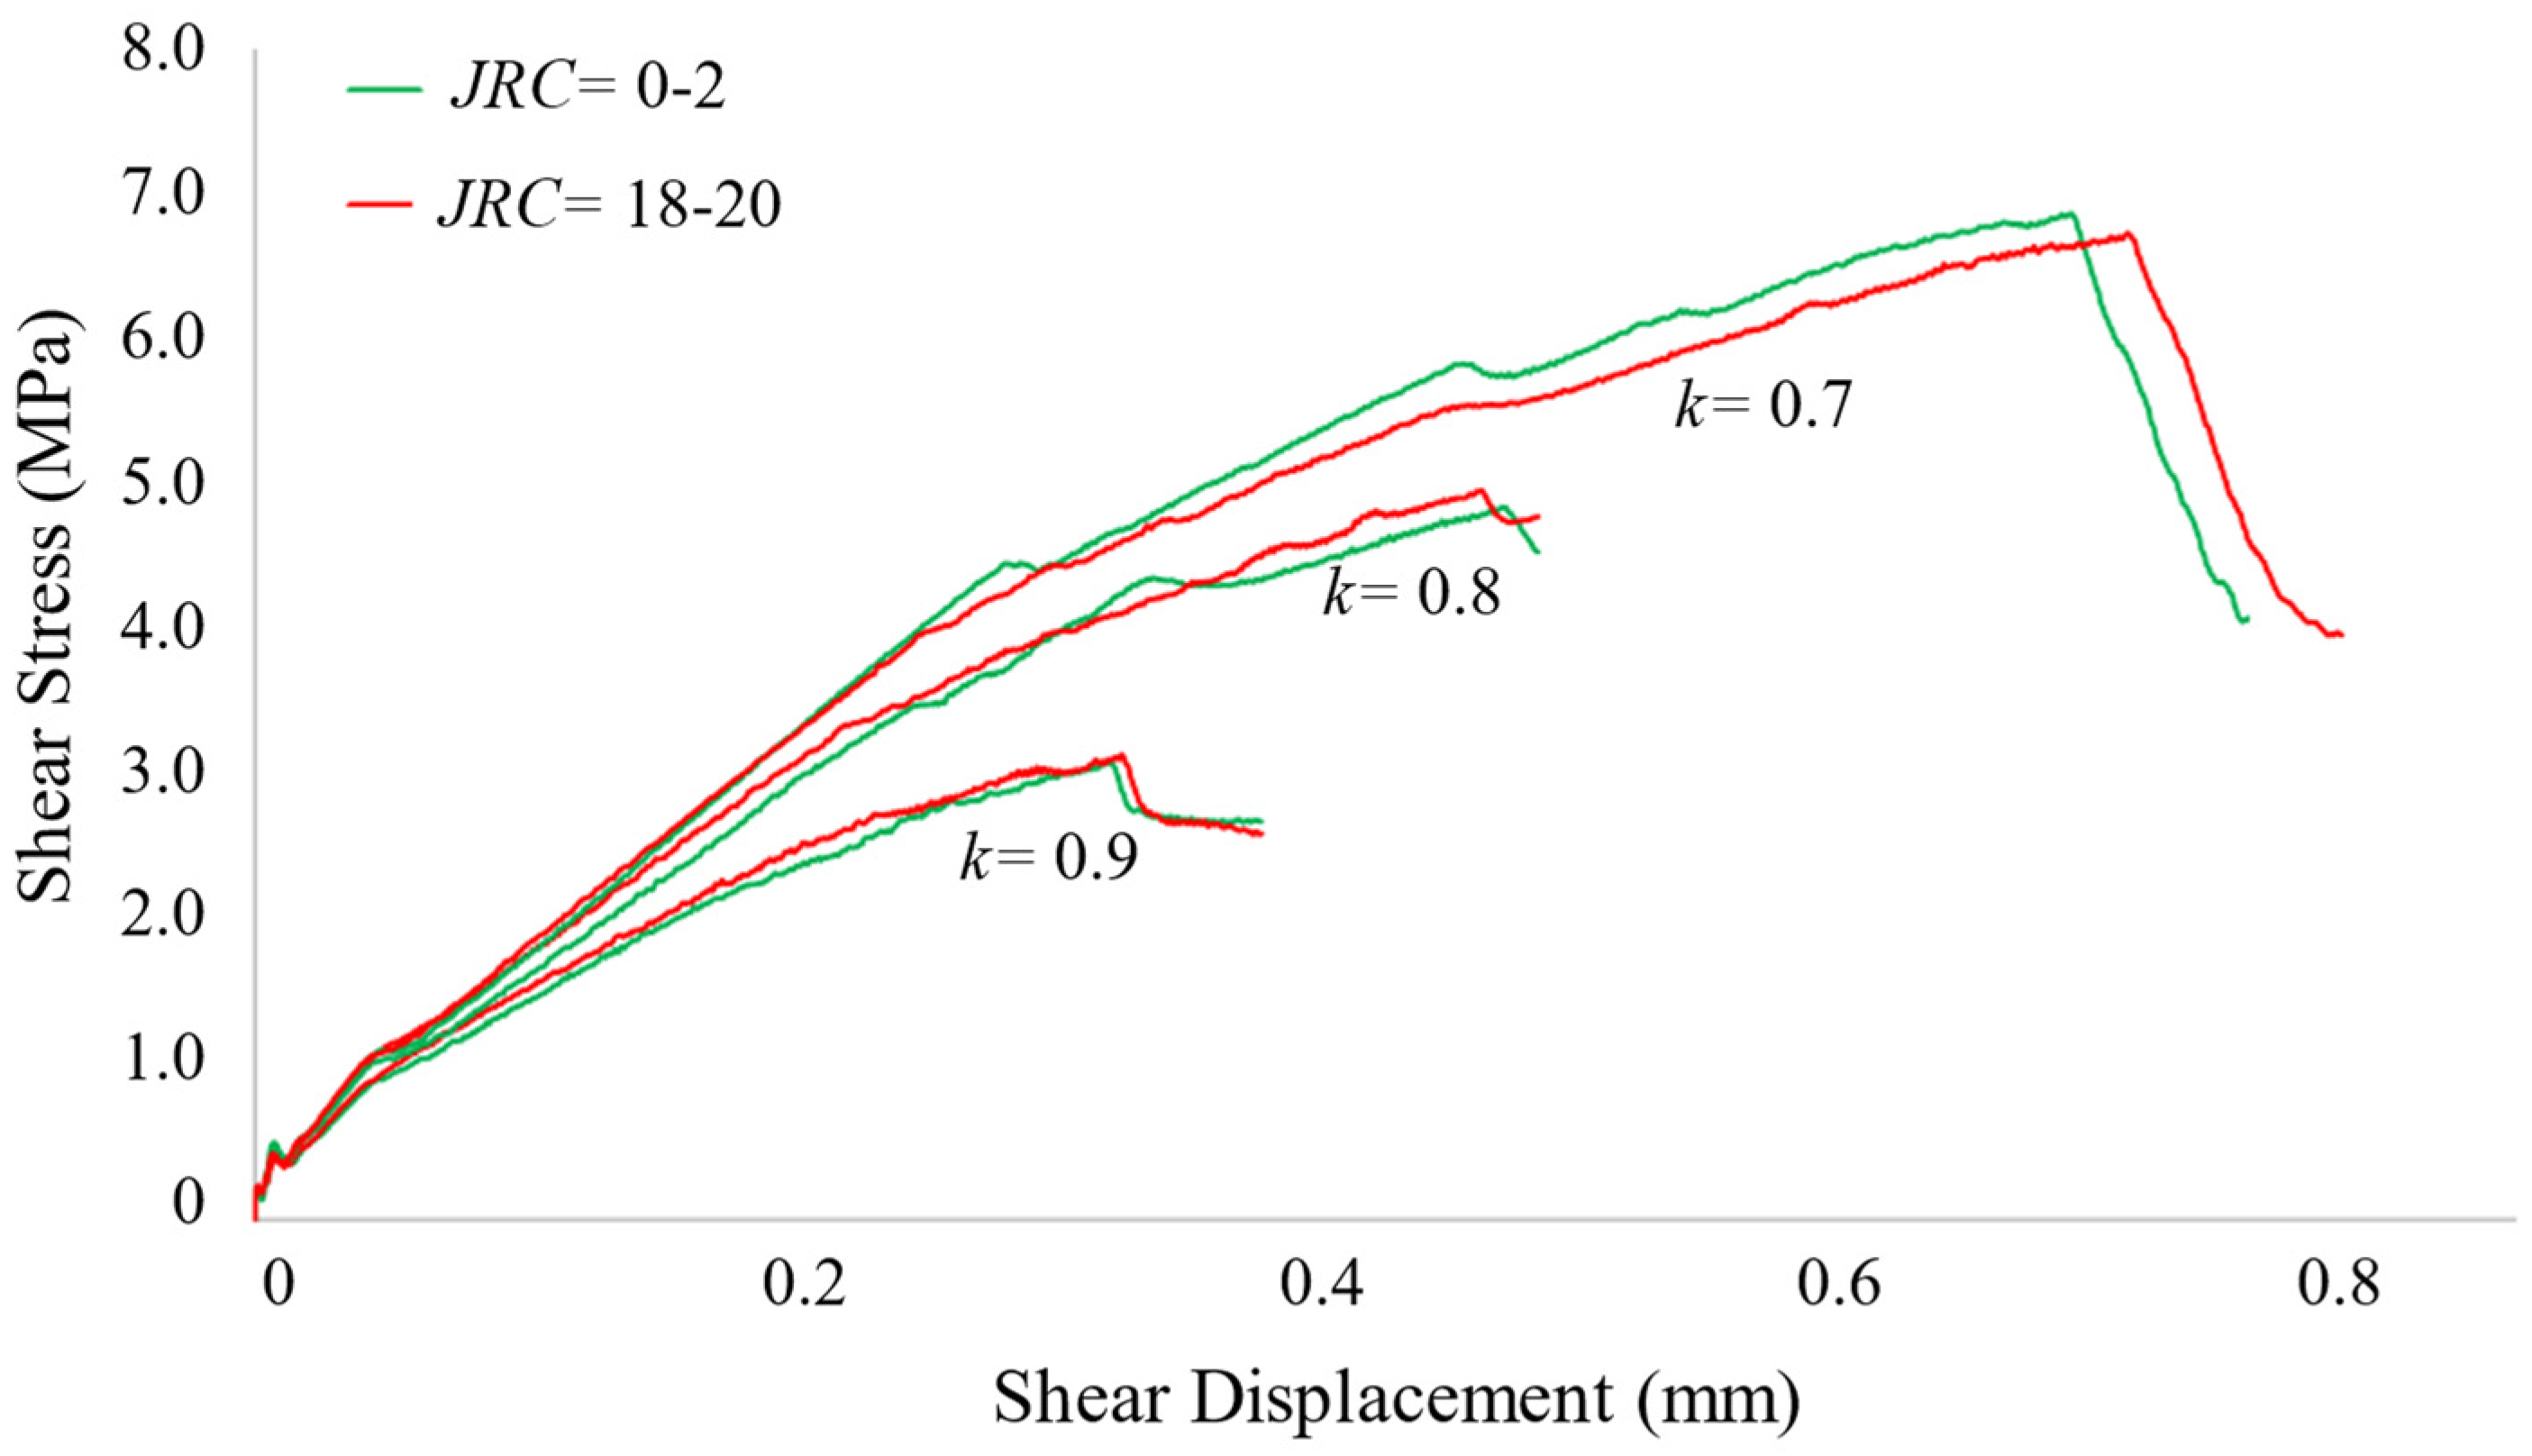
5.2.3. Effect of Infill Waviness on the Shear Specimens

In order to quantify the effect of the JRC on the strength of infilled specimens, nine shear models were generated (quartz, calcite, and mudstone-infilled joints with three different JRC profiles). The results, presented in Figure 21 demonstrated that the infill wall roughness had no apparent effect on the shear strength of specimens for the same infilled minerals. In contrast, the type of mineral considerably impacted the shear strength of specimens: joints having strong mineral infill had higher shear strength, as illustrated in Section 5.2.1. Figure 22 illustrates the failure mechanisms of shear specimens with strong mineral infill (calcite). The shear bands were clearly observed throughout the infilled mineral in all specimens. In addition, some cracks were initiated at the asperity of rough filling walls and propagated through the hosted rock.

6. Conclusions

In this study, the effects of non-persistent joint and infill parameters on shear strength and shear failure behavior were investigated by numerical modeling. The available experimental results were utilized for calibrating and validating the Lattice-Spring-Based Synthetic Rock Mass (LS-SRM) models. The calibrated mechanical properties of pre-cracked specimens were used to study the impact of the JRC, rock bridge angle (γ), rock bridge length (L), and normal stress (σn) parameters on shear strength and shear failure behavior. In addition, the influence of infilled mineral thickness and infilled wall roughness on the shear strength of Amphibolite specimens was investigated. Since the Response Surface Methodology (RSM) method has an advantage over other statistical methods in reducing the number of required models, the models were built with this method.
The LS-SRM models indicated that the failure mechanisms were approximately the same in pre-cracked specimens where tensile wing cracks started at inner flaw tips and propagated in the rock bridge in a stable manner in a curvilinear path toward the loading direction. Then, secondary shear cracks initiated at the outer flaw tips toward the edge of the specimen and coalesced with the other wing cracks.
The obtained results show that σn was the most significant parameter affecting the shear strength and stiffness of pre-cracked specimens, as expected. As σn increased, the shear strength and stiffness increased. The second parameter that affected the shear strength and failure pattern was γ, where the shear strength slightly increased as overlapping percentiles increased. For L, shear strength increased 10% when L increased from 10 to 20 mm. A different failure mechanism was observed in specimens with L over 25 mm: since the cohesion of the rock bridge increased and the friction angle decreased due to the reduced intensity of cracks, shear strength decreased.
The presence of rock bridges in non-persistent pre-cracked specimens restricted the effect of the JRC on shear strength and behavior. The results indicated that the increased joint continuity factor (K) significantly increased the shear strength of pre-cracked specimens compared with the JRC effect.
The presence of joint infill decreased the shear strength. This decrease depended on the strength of the infilled mineral, where the decrease was significantly more in specimens with a soft infill mineral. Although the infill wall roughness had no apparent effect on shear strength, the failure mechanism was affected by infill wall roughness.

Author Contributions

Conceptualization, M.A.-E. and T.S.; methodology, T.S. and D.G.; software, M.A.-E. and D.G.; validation, M.A.-E. and D.G.; writing—original draft preparation, D.G. and M.A.-E.; writing—review and editing, D.G.; visualization, M.A.-E. and D.G.; supervision, T.S. All authors have read and agreed to the published version of the manuscript.

Funding

This research received no external funding.

Data Availability Statement

Not applicable.

Conflicts of Interest

The authors declare no conflict of interest.

References

  1. Lee, H.; Jeon, S. An experimental and numerical study of fracture coalescence in pre-cracked specimens under uniaxial compression. Int. J. Solids Struct. 2011, 48, 979–999. [Google Scholar] [CrossRef] [Green Version]
  2. Bastola, S.; Cai, M. Investigation of mechanical properties and crack propagation in pre-cracked marbles using lattice-spring-based synthetic rock mass (LS-SRM) modeling approach. Comput. Geotech. 2019, 110, 28–43. [Google Scholar] [CrossRef]
  3. Bobet, A.; Einstein, H.H. Fracture coalescence in rock-type materials under uniaxial and biaxial compression. Int. J. Rock Mech. Min. Sci. 1998, 35, 863–888. [Google Scholar] [CrossRef]
  4. Li, Y.P.; Chen, L.Z.; Wang, Y.H. Experimental research on pre-cracked marble under compression. Int. J. Solids Struct. 2005, 42, 2505–2516. [Google Scholar] [CrossRef]
  5. Manouchehrian, A.; Marji, M.F. Numerical analysis of confinement effect on crack propagation mechanism from a flaw in a pre-cracked rock under compression. Acta Mech. Sin. 2012, 28, 1389–1397. [Google Scholar] [CrossRef]
  6. Marji, M.F.; Gholamnejad, J.; Eghbal, M. On the Crack Propagation Mechanism of Brittle Rocks Under Various Loading Conditions; International Multidisciplinary Scientific GeoConference SGEM: Sofia, Bulgaria, 2011; pp. 561–568. [Google Scholar]
  7. Mughieda, O.; Alzo’ubi, A.K. Fracture mechanisms of offset rock joints—A laboratory investigation. Geotech. Geol. Eng. 2004, 22, 545–562. [Google Scholar] [CrossRef]
  8. Park, C.H.; Bobet, A. Crack initiation, propagation and coalescence from frictional flaws in uniaxial compression. Eng. Fract. Mech. 2010, 77, 2727–2748. [Google Scholar] [CrossRef]
  9. Brown, E.T. Fracture of rock under uniform biaxial compression. In Proceedings of the Third Congress of the International Society for Rock Mechanics, Washingon, DC, USA, 1–7 September 1974; pp. 111–117. [Google Scholar]
  10. Papamichos, E.; Labuz, J.F.; Vardoulakis, I. A surface instability detection apparatus. Rock Mech. Rock Eng. 1994, 27, 37–56. [Google Scholar] [CrossRef]
  11. Sahouryeh, E.; Dyskin, A.V.; Germanovich, L.N. Crack growth under biaxial compression. Eng. Fract. Mech. 2002, 69, 2187–2198. [Google Scholar] [CrossRef]
  12. Chang, C.; Haimson, B. Non-dilatant deformation and failure mechanism in two Long Valley Caldera rocks under true triaxial compression. Int. J. Rock Mech. Min. Sci. 2005, 42, 402–414. [Google Scholar] [CrossRef]
  13. Duan, K.; Kwok, C.Y.; Ma, X. DEM simulations of sandstone under true triaxial compressive tests. Acta Geotech. 2017, 12, 495–510. [Google Scholar] [CrossRef]
  14. Zhang, Y.; Liu, S.; Kou, M.; Wang, Z. Mechanical and failure characteristics of fissured marble specimens under true triaxial compression: Insights from 3-D numerical simulations. Comput. Geotech. 2020, 127, 103785. [Google Scholar] [CrossRef]
  15. Zhao, Y.; Wang, Y.; Wang, W.; Tang, L.; Liu, Q.; Cheng, G. Modeling of rheological fracture behavior of rock cracks subjected to hydraulic pressure and far field stresses. Theor. Appl. Fract. Mech. 2019, 101, 59–66. [Google Scholar] [CrossRef]
  16. Asadizadeh, M.; Moosavi, M.; Hossaini, M.F.; Masoumi, H. Shear Strength and Cracking Process of Non-persistent Jointed Rocks: An Extensive Experimental Investigation. Rock Mech. Rock Eng. 2018, 51, 415–428. [Google Scholar] [CrossRef]
  17. Shang, J.; West, L.J.; Hencher, S.R.; Zhao, Z. Tensile strength of large-scale incipient rock joints: A laboratory investigation. Acta Geotech. 2018, 13, 869–886. [Google Scholar] [CrossRef] [Green Version]
  18. Jing, L. A review of techniques, advances and outstanding issues in numerical modelling for rock mechanics and rock engineering. Int. J. Rock Mech. Min. Sci. 2003, 40–43, 283–353. [Google Scholar]
  19. Vesga, L.F.; Vallejo, L.E.; Lobo-Guerrero, S. DEM analysis of the crack propagation in brittle clays under uniaxial compression tests. Int. J. Numer. Anal. Methods Geomech. 2008, 32, 1405–1415. [Google Scholar] [CrossRef]
  20. Manouchehrian, A.; Sharifzadeh, M.; Marji, M.F.; Gholamnejad, J. A bonded particle model for analysis of the flaw orientation effect on crack propagation mechanism in brittle materials under compression. Arch. Civ. Mech. Eng. 2014, 14, 40–52. [Google Scholar] [CrossRef]
  21. Peng, J.; Ngai, L.; Wong, Y.; Ing, C. Effects of grain size-to-particle size ratio on micro-cracking behavior using a bonded-particle grain-based model. Int. J. Rock Mech. Min. Sci. 2017, 100, 207–217. [Google Scholar] [CrossRef]
  22. Saadat, M.; Taheri, A. A numerical approach to investigate the effects of rock texture on the damage and crack propagation of a pre-cracked granite. Comput. Geotech. 2019, 111, 89–111. [Google Scholar] [CrossRef]
  23. Saadat, M.; Taheri, A. A cohesive grain-based model to simulate shear behaviour of rock joints with asperity damage in polycrystalline rock. Comput. Geotech. 2020, 117, 103254. [Google Scholar] [CrossRef]
  24. Saadat, M.; Taheri, A. Modelling micro-cracking behaviour of granite during direct tensile test using cohesive GBM approach. Eng. Fract. Mech. 2020, 239, 107297. [Google Scholar] [CrossRef]
  25. Bastola, S.; Cai, M.; Damjanac, B. Slope stability assessment of an open pit using lattice-spring-based synthetic rock mass (LS-SRM) modeling approach. J. Rock Mech. Geotech. Eng. 2020, 12, 927–942. [Google Scholar] [CrossRef]
  26. Gottron, D.; Henk, A. Upscaling the Mechanical Properties of a Fractured Rock Mass Using the Lattice-Spring-Based Synthetic Rock Mass (LS-SRM) Modeling Approach—Comparison of Discontinuum, Continuum and Empirical Approaches. Geosciences 2022, 12, 343. [Google Scholar] [CrossRef]
  27. Itasca. PFC (Particle Flow Code); Itasca Consulting Group, Inc.: Minneapolis, MN, USA, 2022. [Google Scholar]
  28. Cundall, P.A. Continuum and Distinct Element Numerical Modeling in Geomechanics: Lattice method for modeling brittle, jointed rock. In Proceedings of the 2nd International FLAC/DEM Symposium, Melbourne, Australia, 14–16 February 2011; pp. 14–16. [Google Scholar]
  29. Gulli, D.; Pellegri, M.; Marchetti, D. Mechanical behaviour of Carrara marble rock mass related to geo-structural conditions and in-situ stress. In Proceedings of the ISRM Regional Symposium—8th South American Congress on Rock Mechanics, Buenos Aires, Argentina, 15–18 November 2015; pp. 253–260. [Google Scholar]
  30. Meng, Z.; Zhang, J.; Peng, S. Influence of sedimentary environments on mechanical properties of clastic rocks. Environ. Geol. 2006, 51, 113–120. [Google Scholar] [CrossRef]
  31. Elarabi, H. Verification of Numerical and Analytical methods of Analysis of Tunnel. In Proceedings of the 8th European Conference on Numerical Methods in Geotechnical Engineering, Delft, Netherlands, 18–20 June 2014. [Google Scholar]
  32. Al-E’Bayat, M.; Sherizadeh, T.; Guner, D.; Asadizadeh, M. Lattice-spring-based synthetic rock mass model calibration using response surface methodology. Geomech. Eng. 2022, 31, 529–543. [Google Scholar]
  33. Bastola, S.; Cai, M. Simulation of Stress-Strain Relations of Zhenping Marble Using Lattice-Spring-Based Synthetic Rock Mass Models. In Proceedings of the 52nd US Rock Mechanics/Geomechanics Symposium, Seattle, DC, USA, 17–20 June 2018. [Google Scholar]
  34. Box, G.E.; Hunter, J.S.; Hunter, W.G. Statistics for Experimenters: Design, Innovation, and Discovery; Wiley-Interscience: New York, NY, USA, 2005; Volume 2. [Google Scholar]
  35. Heidarzadeh, S. Probabilistic Stability Analysis of Open Stopes in Sublevel Stoping Method by Numerical Modeling. Ph.D. Dissertation, University of Quebec, Quebec City, QC, Canada, 2018. [Google Scholar]
  36. Wong, F.S. Slope reliability and response surface method. J. Geotech. Eng. 1985, 111, 32–53. [Google Scholar] [CrossRef]
  37. Bezerra, M.A.; Santelli, R.E.; Oliveira, E.P.; Villar, L.S.; Escaleira, L.A. Response surface methodology (RSM) as a tool for optimization in analytical chemistry. Talanta 2008, 76, 965–977. [Google Scholar] [CrossRef]
  38. Babanouri, N.; Asadizadeh, M.; Hasan-Alizade, Z. Modeling shear behavior of rock joints: A focus on interaction of influencing parameters. Int. J. Rock Mech. Min. Sci. 2020, 134, 104449. [Google Scholar] [CrossRef]
  39. Li, D.; Chen, Y.; Lu, W.; Zhou, C. Stochastic response surface method for reliability analysis of rock slopes involving correlated non-normal variables. Comput. Geotech. 2011, 38, 58–68. [Google Scholar] [CrossRef]
  40. Haeri, H. Simulating the Crack Propagation Mechanism of Pre-Cracked Concrete Specimens Under Shear Loading Conditions. Strength Mater. 2015, 47, 618–632. [Google Scholar] [CrossRef]
  41. Shang, J. Persistence and tensile strength of incipient rock discontinuities. In Proceedings of the ISRM International Symposium-EUROCK 2020, Trondheim, Norway, 14–19 June 2020; International Society for Rock Mechanics and Rock Engineering: Salzburg, Austria; pp. 1–20. [Google Scholar]
  42. Barton, N. Review of a new shear-strength criterion for rock joints. Eng. Geol. 1973, 7, 287–332. [Google Scholar] [CrossRef]
Figure 1. A simplified crack pattern in pre-cracked specimens of rock materials [3].
Geosciences 13 00023 g001
Figure 2. (a) Fractured lattice replaced broken spring, (b) discontinuity plane superimposed in the lattice springs, (c) Flat joint contact logic (modified after [28]).
Geosciences 13 00023 g002
Figure 3. Illustrating (a) the LS-SRM intact model with monitoring points of force and displacement in z and x directions, (b) a vertical cross-section at the center of the spring lattice model.
Geosciences 13 00023 g003
Figure 4. Pre-cracked direct shear specimen illustrating the studied parameters γ, L, σn, and JRC.
Geosciences 13 00023 g004
Figure 5. The geometry of the direct shear test sample with an infill thickness of 4 mm.
Geosciences 13 00023 g005
Figure 6. A schematic of the intact rock UCS & TCS calibration procedure for the LS-SRM model.
Geosciences 13 00023 g006
Figure 7. (a) stress-strain plot of unconfined compression tests, and (b) σ1–σ3 plot of conventional triaxial tests.
Geosciences 13 00023 g007
Figure 8. A schematic of the direct shear calibration procedure for the LS-SRM model.
Geosciences 13 00023 g008
Figure 9. The specimen for (a) the unconfined compression test for normal stiffness calibration and (b) the direct shear test.
Geosciences 13 00023 g009
Figure 10. The geometry of direct shear specimens of (a) noncoplanar rock bridge specimens and (b) coplanar rock bridge specimens.
Geosciences 13 00023 g010
Figure 11. The failure mechanism of LS-SRM and experimental of (a) noncoplanar rock bridge specimens and (b) coplanar rock bridge specimens.
Geosciences 13 00023 g011
Figure 12. (a) Effect of noncoplanar joint parameters on the shear strength of specimens with the same joint length (2a = 10 mm). (b) Predicted vs. actual shear strength scatterplot of RSM results (Equation (6)).
Geosciences 13 00023 g012
Figure 13. Shear strength–shear displacement curve for pre-cracked specimens under the σn of 0.5 and 1.5 MPa.
Geosciences 13 00023 g013
Figure 14. The RSM result for impacting γ on the shear strength of noncoplanar pre-cracked samples.
Geosciences 13 00023 g014
Figure 15. Failure mechanism in pre-cracked shear specimens with γ of (a) 50° and (b) 90°. Microcracks shown by the light blue dots.
Geosciences 13 00023 g015
Figure 16. Shear stress–shear displacement curves for specimens varied in K and JRC.
Geosciences 13 00023 g016
Figure 17. Effect of infilled mineral on the peak shear strength of rock specimens.
Geosciences 13 00023 g017
Figure 18. Failure mechanisms in shear specimens with (A) no infill, (B) quartz infill, (C) calcite infill, (D) mudstone infill, and (E) clay infill.
Geosciences 13 00023 g018
Figure 19. Peak shear strength of rock specimens with fully persistent filling and having 10% rock bridge.
Geosciences 13 00023 g019
Figure 20. Failure mechanisms in calcite-infilled specimens with calcite-infill thicknesses of (A) 4 mm, (B) 8 mm, and (C) 12 mm.
Geosciences 13 00023 g020
Figure 21. Shear strength of quartz, calcite, and mudstone–infilled specimens with varying infill JRC under 0.5 MPa σn.
Geosciences 13 00023 g021
Figure 22. Failure mechanisms in calcite-infilled specimens with (A) 0-2 JRC profile, (B) 10-12 JRC profile, and (C) 18-20 JRC profile.
Geosciences 13 00023 g022
Table 1. Micro- and macro-mechanical properties of the hosted rock and infilled minerals.
Mechanical
Properties
Hosted RockInfilled Minerals
AmphiboliteQuartzCalciteMudstoneClay
Density (kg/m3)30012650270024601600
Young’s modulus
(GPa)
micro110.078.029.014.01.0
macro880.0528.073.011.20.9
UCS
(MPa)
micro225.0175.075.025.00.2
macro298.0231.090.043.00.4
Tensile strength
(MPa)
micro22.5017.508.002.000.20
macro22.517.508.002.100.20
Friction angle
(°)
micro26.5626.5630.0045.0026.00
macro26.5632.8032.0036.4018.70
Table 2. Experimental and numerical mechanical properties of the rock-like material.
Intact Rock PropertiesExperimentalNumerical
Micro-PropertiesMacro-Properties
Density (Kg/m3)161016101610
Young’s modulus (GPa)10.0314.0010.19
UCS (MPa)31.3226.0030.71
Tensile strength (MPa)3.433.433.43
Internal friction angle (°)26.9533.0025.04
Table 3. Experimental and numerical mechanical properties of joint.
Joint PropertiesUnitExperimentalNumerical
Micro-PropertiesMacro-Properties
Friction angle (°)(Degree)54.1545.0052.09
Deformability of the system(GPa)4.035.503.97
Shear stiffness (GPa/m)(GPa/m)1.191.051.18
Table 4. Experimental and numerical results on specimens of the noncoplanar and coplanar rock bridge.
SpecimenMethodShear Strength (MPa)
Noncoplanar rock bridgeExperiment5.34
LS-SRM5.98
Coplanar rock bridgeExperiment8.61
LS-SRM9.2
Table 5. Coded independent variables and their corresponding levels obtained from Box–Behnken design.
Variable/Parameter/FactorCodeLevel
−101
Rock bridge angle (°)A507090
Rock bridge length (mm)B102030
Joint roughness coefficientC01020
Normal stress (MPa)D0.51.01.5
Table 6. Numerical Simulation results and their corresponding parameters.
γLJRCNormal StressShear StrengthShear Stiffness
(°)(mm)(MPa)(MPa)(GPa/m)
Intact sample1.513.96-
50100–21.06.495.95
10–120.54.625.01
1.57.026.10
18–201.06.496.00
200–20.55.205.27
1.58.246.07
10–121.06.775.07
18–200.54.865.36
1.58.026.49
300–21.06.765.75
10–120.54.645.03
1.57.575.64
18–201.06.675.39
701010–121.05.915.73
200–21.07.185.95
10–120.55.005.03
1.56.325.72
18–201.06.955.80
3010–121.06.615.47
901012–121.06.195.05
200–21.07.055.08
10–120.54.965.13
1.57.434.95
18–201.06.815.07
3010–121.06.564.95
Table 7. ANOVA for response surface quadratic model for shear strength.
SourceSum of Squaresdf *Mean SquareF Valuep-Value
Model23.7663.9647.77<0.0001
B: rock bridge length0.36410.3644.390.0479
D: normal stress11.63111.63140.27<0.0001
AD0.2810.283.380.049
B20.545510.54556.580.0177
C20.734310.73438.860.007
D21.6011.6019.340.0002
Residual1.82220.0829
Lack of Fit0.000453190.096
* df = degree of freedom.
Table 8. ANOVA for response surface quadratic model for shear stiffness.
SourceSum of Squaresdf *Mean SquareF Valuep-Value
Model4.7880.596918.22<0.0001
A: rock bridge angle0.322810.32289.860.0052
B: rock bridge length0.21610.2166.60.0183
D: normal stress1.4311.4343.61<0.0001
AD0.432510.432513.210.0017
A20.810310.810324.74<0.0001
B20.417510.417512.750.0019
C21.3411.3440.920.0001
D20.315810.31589.640.0056
Residual0.6551200.0328
Lack of Fit0.6551170.0385
* df = degree of freedom.
Disclaimer/Publisher’s Note: The statements, opinions and data contained in all publications are solely those of the individual author(s) and contributor(s) and not of MDPI and/or the editor(s). MDPI and/or the editor(s) disclaim responsibility for any injury to people or property resulting from any ideas, methods, instructions or products referred to in the content.

