Abstract
On 3 March 2021, an important seismic sequence started in northern Thessaly, Greece. The Damasi Seismic Sequence (DSS) deformed the western sector of the Tyrnavos Graben, which includes a major blind normal fault and the Titarisios River Graben (TRG). In this contribution, we provide fieldwork observations across the TRG and satellite radar interferometry of the faults controlling the graben. In addition, we provide a map of the active faults exposed in the TRG and palaeoseismological analyses of the Mesochori Fault, which together contribute to unravelling the seismic history of the area. DInSAR provides clear evidence of the Mesochori Fault surface rupture during the main shocks, while our palaeoseismological analyses document a long seismic history of the fault, with a mean recurrence interval of 1.0–1.5 ka and a mean slip per event of ~15 cm for the last four events reactivating the scarp. Quantitative geomorphological analyses based on real-time kinematic (RTK) measurements with global navigation satellite system (GNSS) receivers and data from UAV flight campaigns also provide evidence of postseismic activity across the Mesochori Fault. Based on these results showing that (at least) the Mesochori Fault has been reactivated several times in the latest Quaternary the seismotectonics of the TRG are discussed.
1. Introduction
On the 3 March 2021, an important seismic sequence started in northern Thessaly, Central Greece, characterized by six Mw > 5.0 events and an Mw = 6.3 main shock; to cover the whole epicentral area, hereinafter we will refer to it as the Damasi Seismic Sequence (DSS) (Table 1). In particular, the DSS affected the westernmost sector of the Tyrnavos Graben, where a seismic gap has been purported to have occurred [1]. This crustal-scale tectonic basin is bordered to the south by two major NNE-dipping right-stepping, partially overlapping dip-slip normal faults (the Larissa and Tyrnavos faults) [2,3,4] and similarly to the north by two SSW-dipping right-stepping, partially overlapping dip-slip normal faults (the Rodia and Gyrtoni faults) [5,6,7].
The epicentre of the main shock is located in the westernmost sector of the north Thessalian graben within the surface projection of the Tyrnavos seismogenic source as reported in the Greek Database of Seismogenic Sources (GreDaSS [8]), and during the first few days after the earthquakes, this was initially assumed to be the causative source. However, given that most of the broader epicentral area of the DSS progressively extended further to the W and NW, and given in particular the results of the DInSAR technique, it was soon clear that the major seismogenic rupture affected a mainly blind fault and most of the coseismic displacement occurred on a north-northeast dipping low-angle dip-slip normal surface that was previously unmapped [9,10,11], among others; this conclusion was also in agreement with the focal plane solutions (e.g., GCMT) and the aftershocks relocations that were progressively published [10,11,12,13].

Table 1.
Major events (Mw > 5.0) during the 2021 DSS, data from [14].
Table 1.
Major events (Mw > 5.0) during the 2021 DSS, data from [14].
| Date | Time | Lat (°) | Long (°) | Depth | Mw | Strike | Dip | Rake |
|---|---|---|---|---|---|---|---|---|
| 3 March 2021 | 10:16:08.58 | 39.7349 | 22.1908 | 9.5 | 6.3 | 314 | 36 | −88 |
| 3 March 2021 | 11:45:45.70 | 39.6909 | 22.2025 | 8.29 | 5.2 | 310 | 47 | −74 |
| 3 March 2021 | 18:24:08.72 | 39.7225 | 22.0813 | 10 | 5.1 | 319 | 38 | −62 |
| 4 March 2021 | 18:38:17.46 | 39.7799 | 22.1252 | 12 | 6.0 | 329 | 41 | −88 |
| 4 March 2021 | 19:23:51.18 | 39.8224 | 21.9313 | 7.86 | 5.1 | 287 | 30 | −91 |
| 12 March 2021 | 12:57:50.14 | 39.8281 | 22.0150 | 3.34 | 5.5 | 286 | 53 | −92 |
Even the intensive post-event field surveys conducted by several research teams, i.e., [11,15,16], could not document the occurrence of clear ground ruptures directly associated with the upward propagation of the coseismic sliding up to the topographic surface as expected by a 6.3 magnitude event [17,18]. Indeed, most of the observed seismically related natural features were represented by site effects induced by liquefaction phenomena [15,16,19].
Notwithstanding the poor and somewhat controversial morphological expression of the seismogenic sources, the authors of [20] have clearly documented the occurrence of systematic ground ruptures within the epicentral area, though not aligned with the up-dip projection of the reactivated north-dipping low-angle normal fault as modelled by the analysis of satellite images. These coseismic features were observed and mapped in detail along the Titarisios Valley (Figure 1). Indeed, the central reach of the Titarisios River is entrenched within the Palaeozoic crystalline basement and the lower Mesozoic carbonate rocks of the Pelagonian Zone [21], and its valley floor is bordered for more than 10 km by two antithetic normal faults, therefore generating a narrow NW-trending tectonic graben referred to as the Titarisios River Graben (TRG) in [20] (Figure 1).
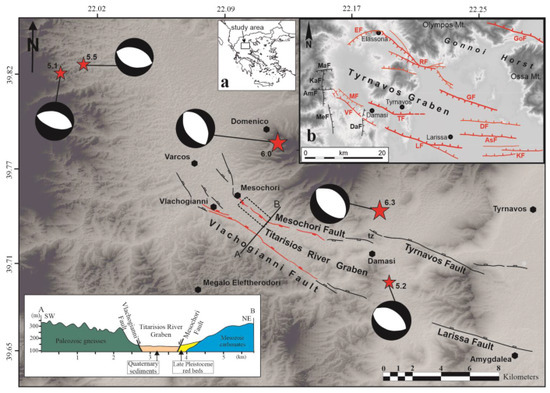
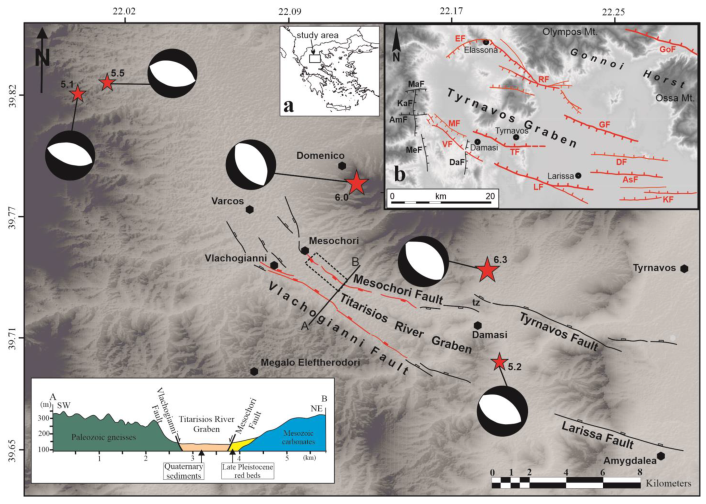
Figure 1.
Traces of the active faults in the epicentral area of the Damasi 2021 seismic sequence. Red lines represent reactivated segments. Stars represent the location of the main earthquake events. The dashed box indicates the area enlarged in Figure 6. “tz” indicates the transfer zone between the Tyrnavos and Mesochori faults. Inset (a) shows the location of the study area, and inset (b) shows the geotectonic setting of the study area in the Tyrnavos Graben.
Although seismic activity is quite intense in the broader Aegean region, and many active faults have been clearly mapped in Thessaly for several decades [6], strong earthquakes in this sector of Central Greece are relatively rare, and the historical record is likely to be incomplete [22]. On the other hand, the most recent historical and especially instrumental events primarily affected the southern sector of Thessaly, impelling the author of [1] to suggest that the Tyrnavos Basin in northern Thessaly represents a large seismic gap. In this regard, the burgeoning of palaeoseismological studies across fault scarps in recent decades has largely improved our knowledge and understanding of faulting activity during the Holocene and the latest Pleistocene (i.e., [18,23,24,25]).
To unravel the seismotectonic role played by the Titarisios River Graben, in the present paper, we focus on its border structures. For this purpose, (i) devoted morphotectonic field surveys have been carried out along the composite scarps associated with the Vlachogianni and Mesochori border faults; (ii) several RTK GNSS elevation profiles have been performed across the same scarps; (iii) three palaeoseismological trenches across the 2021 ground ruptures have been excavated and investigated; (iv) repeated UAV flight campaigns have been completed in order to separate the coseismic amount of slip from the postseismic contribution occurring during the year after the earthquakes; (v) new detailed DInSAR analyses have been performed focusing on the Titarisios River Graben to verify and quantify the differential subsidence characterizing the area within the two border faults.
The methods and results for all these analyses are described and discussed in the following sections, allowing us to clearly document that both the Vlachogianni and Mesochori faults have been reactivated during the DSS, generating a piece of clear morphotectonic evidence. Above all, the present results document that (at least) the Mesochori Fault has been reactivated several times in the latest Quaternary.
2. Materials and Methods
2.1. The Titarisios River Graben (TRG)
As mentioned above, the Titarisios River Graben border faults are the Vlachogianni Fault and the Mesochori Fault on the SW and NE sides, respectively (Figure 1).
In particular, the Vlachogianni Fault is a northeast-dipping structure that could be mapped for about 16.5 km; for most of its trace, it separates the Palaeozoic gneiss and schists from the Quaternary alluvial deposits of the Titarisios River, showing a mean trend of 120–125° N. Towards the northwest, the structure progressively evolves into an articulated fault array bordering to the west the southernmost sector of the lignite-bearing Potamia Basin with branches oriented 135–145° N (Figure 1). Towards the southeast, the fault trace slightly turns to 105° N and enters the carbonate Mesozoic rocks of the Pelagonian succession, thus suggesting a progressively decreasing displacement towards the ESE.
It is worth mentioning that though the Vlachogianni Fault is perfectly aligned with the active Larissa Fault [3], the latter fault remained inactive during the DSS. The Vlachogianni Fault had already been recognized and mapped for some time (e.g., [1,25]), but its (degree of) recent activity was not clear enough and/or sufficiently resolved for it to be included in GreDaSS [8]. On the other hand, the 3–4 km wide geometric gap separating the Vlachogianni Fault from the Larissa Fault, corresponding with the wind gap south of Damasi village and connecting the present-day Titarisios River and the Pinios River [26], suggests that they are two distinct tectonic structures likely to be behaving independently.
Before the DSS, the Mesochori Fault was not recognized at all as an active tectonic structure, and it was introduced for the first time by [20] in the seismotectonic framework of the area (Figure 1). This was probably due to the limited cumulative displacement and its parallelism with a branch of the Titarisios River being misinterpreted as a possible fluvial erosional feature. Nevertheless, this structure was clearly reactivated during the DSS, producing a cumulative linear ground rupture of ca. 5 km [20] (Figure 2 and Figure 3).
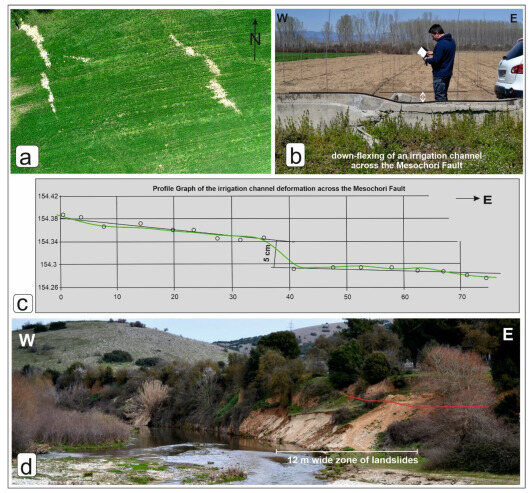
Figure 2.
(a) En echelon zone of liquefaction across the northwestern tip of the Mesochori Fault. Drone capture at a flight height of 120 m. The width of the photo is approximately 100 m. (b) Damaged concrete irrigation channel across the fault trace at the northwestern tip area of the Mesochori Fault. (c) RTK GNSS elevation profile across an irrigation channel damaged by the earthquake. (d) The west-facing fault scarp near the NW tip of the Mesochori Fault. The red line represents the mapped rupture of the fault during the Damasi earthquakes. Note also the landslide zone mapped parallel to the Mesochori Fault.
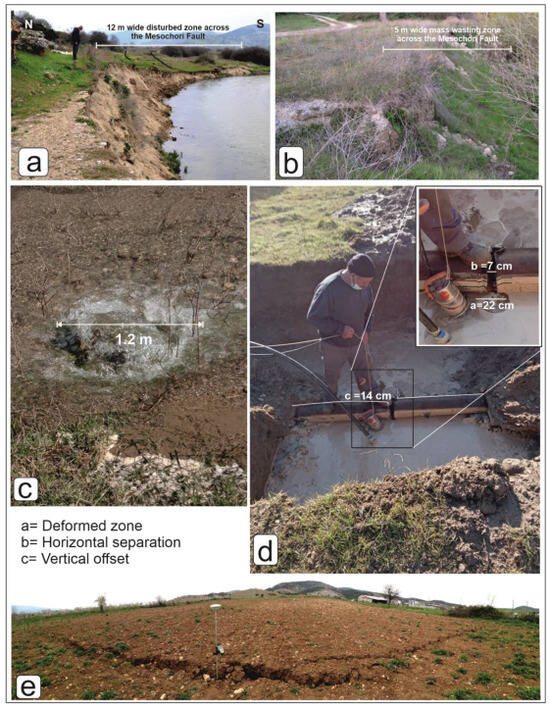
Figure 3.
Key outcrops showing mesoscopic features of the deformation related to the Mesochori Fault. (a) A 20 m wide zone of strong deformation related to the Damasi earthquakes. The two black lines represent ruptures mapped in parallel with the main rupture of the Mesochori Fault. The photo is looking east. (b) Surface offset associated with the main shock east of Mesochori village. The maximum observed displacement is up to 28 cm and documents a south-dipping fault plane with normal kinematics. Opening values are up to 10 cm. The photo is looking west. (c) Water pipe leakage observed in a farmed area just after the main event on the earth’s surface. The location of the leakage is above the location where an inspective trench (d) was excavated. (d) Subsurface damage to a Φ 300 mm steel water pipe following the Mw 6.3 earthquake as exposed in the excavated trench. Note that the part where the technician stands documents about 14 cm of normal sense of movement. Photos (c,d) of the destroyed pipe and details regarding the deformation of the offset were provided by a municipality technician, Kostas Brouzas, whom we acknowledge. (e) Panoramic view of the surface rupture across the Mesochori Fault. The view is looking northeast.
As mentioned above, for the purposes of this paper we conducted additional detailed morphotectonic investigations, allowing us to fully characterize the Mesochori Fault as a south-southwest-dipping structure. Based on the analysis of the composite morphological scarp (Figure 1), it was possible to map it for a total length of ca. 13.1 km. The fault trace shows a curved shape varying from 100° N to almost N–S (150–170° N) in the southeastern and northwestern sectors, respectively. Similar to the Vlachogianni Fault, the Mesochori Fault seems to branch out towards the NW, where it progressively loses its surface expression and possibly disappears under the Quaternary sediments paving the Potamia Basin (Figure 1). On the ESE termination, it is likely that the structure enters the stress shadow of the antithetic NNE-dipping Tyrnavos Fault, which represents a major border element of the Tyrnavos Basin [1,2]. Accordingly, north of Damasi any morphotectonic evidence of the Mesochori Fault rapidly disappears. According to [27], the area interposed between the two tectonic structures forms a conjugate divergent overlapping transfer zone, and the outcropping Mesozoic limestones support the long-term localized uplift (Figure 1).
2.2. Coseismic Evidence along the TRG: Field Observations
The western end of the Mesochori Fault includes two antithetically dipping fault strands (Figure 2). The western strand dips to the east and defines a half-metre-high broad fault scarp (Figure 2b,c). During the Damasi earthquakes, the Quaternary sediments close to the fault trace were liquefied, forming an en echelon array of ground ruptures and associated ejecta (Figure 2a). An irrigation channel running across the broad fault scarp was destroyed during the earthquakes (Figure 2b,c). The eastern fault strand dips towards the west and defines a predominant several meters high west-facing fault scarp. Due to its N–S strike, it is likely that the latter structure belongs to the fault array of the pre-Pleistocene Potamia Basin and is only geometrically linked to the Mesochori Fault. Whatever the case, during the earthquakes, this segment was sympathetically reactivated close to the bridge connecting the villages of Mesochori and Vlachogianni (Figure 2c).
Southeast of Mesochori village along the northern flank of the Titarisios Valley, a continuous surface rupture was systematically mapped, quite constantly in terms of throw and amount of opening (Figure 3a,b). Although some hydrodynamic control by the river is also possible (i.e., erosional), at several places it is clear that the fault scarp (i.e., tectonics) conversely controls the Titarisios River path, along which common mass wasting has been mapped after the DSS (Figure 2c and Figure 3a).
Of particular importance for understanding the role of the Mesochori Fault during the Damasi earthquakes was the testimony of more than five witnesses. Indeed, witnesses confirm that the surface rupture we mapped along the Mesochori Fault was caused by the stronger earthquake on the 3 March 2021. Three of these witnesses are technicians from the local community, and the other two are farmers working in the area close to the seismically induced surface features.
2.3. Coseismic Evidence along the TRG: DInSAR Results
The surface evidence of the DSS was also investigated using the SAR interferometry (InSAR) technique with particular attention being paid to the contribution of the different events that affected the westernmost sector of the Tyrnavos Graben. In particular, the short acquisition times (6 days) of satellite images of the same area of interest taken by the European Space Agency’s pair of Sentinel-1A-B satellites allowed us to separately evaluate the effects of the main shock Mw 6.3, which occurred on 3 March, and the “equivalent” main shock Mw 6.0 on 4 March.
In order to isolate and investigate the two events separately, exploiting the combined use of all the SAR images from Sentinel-1 available for that area, only the data from the ascending orbit were used, and interferograms were produced showing the coseismic displacement of each event. Interferometric pairs were processed using SARscape software V. 5.6.2 (SARMAP, Caslano, Switzerland) according to the standard two-pass interferometry approach [28].
InSAR processing was performed using Sentinel-1 images (Path 102) relating to 25 February and 3 and 9 March in TopSAR acquisition mode and with VV polarization. A multilook factor 1 × 4 along the range and azimuth direction was applied, obtaining final ground resolution equal to 15 m. The ALOS-3D digital elevation model (30 m) was then used to remove the topographic contribution and to georefer all products. Goldstein filtering [29] with a window width of 64 pixels was used to improve the visibility of the fringes and reduce the noise caused by temporal or baseline decorrelation. To unwrap the phase and remove the residual orbital phase from the interferogram, a minimum-cost flow algorithm [30], using a quadratic polynomial fitting, was employed. The unwrapped phase was converted to displacement and geocoded in the WGS84 reference system. Furthermore, a mask filter was applied to the obtained displacement maps (Figure 4), starting from coherence values higher than 0.5 to increase the accuracy of the deformations.
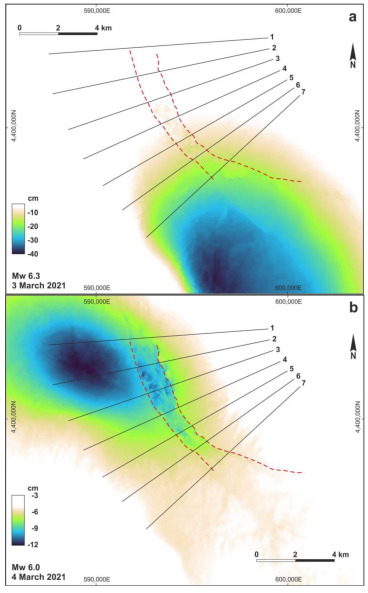
Figure 4.
Distribution of the LOS (ascending) displacement as obtained from DInSAR analyses for the epicentral areas of the 3 March (a) and 4 March (b) major seismic events. Numbered black lines are the traces of the profiles shown in Figure 5. Red dashed lines indicate the Mesochori and Vlachogianni faults bordering the Titarisios River Graben.
Based on the DInSAR analyses, our results clearly document and confirm that the TRG was reactivated during the DSS. In particular, following the main shock (Figure 4a), mainly the central sector of the graben seems to have been reactivated along both border faults, generating several centimetres of displacement. However, in the second interferogram, which includes the major aftershock (Figure 4b), the reactivation has undoubtedly affected the two fault traces along their entire length with maximum displacements of up to almost 10 cm (Figure 5).
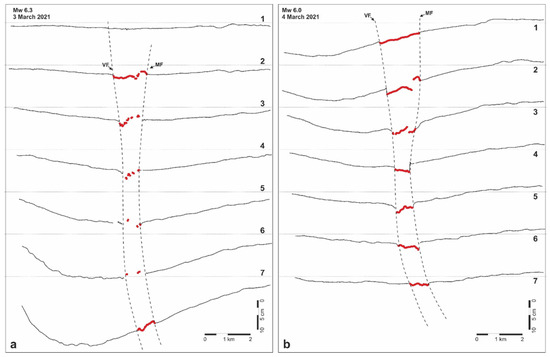
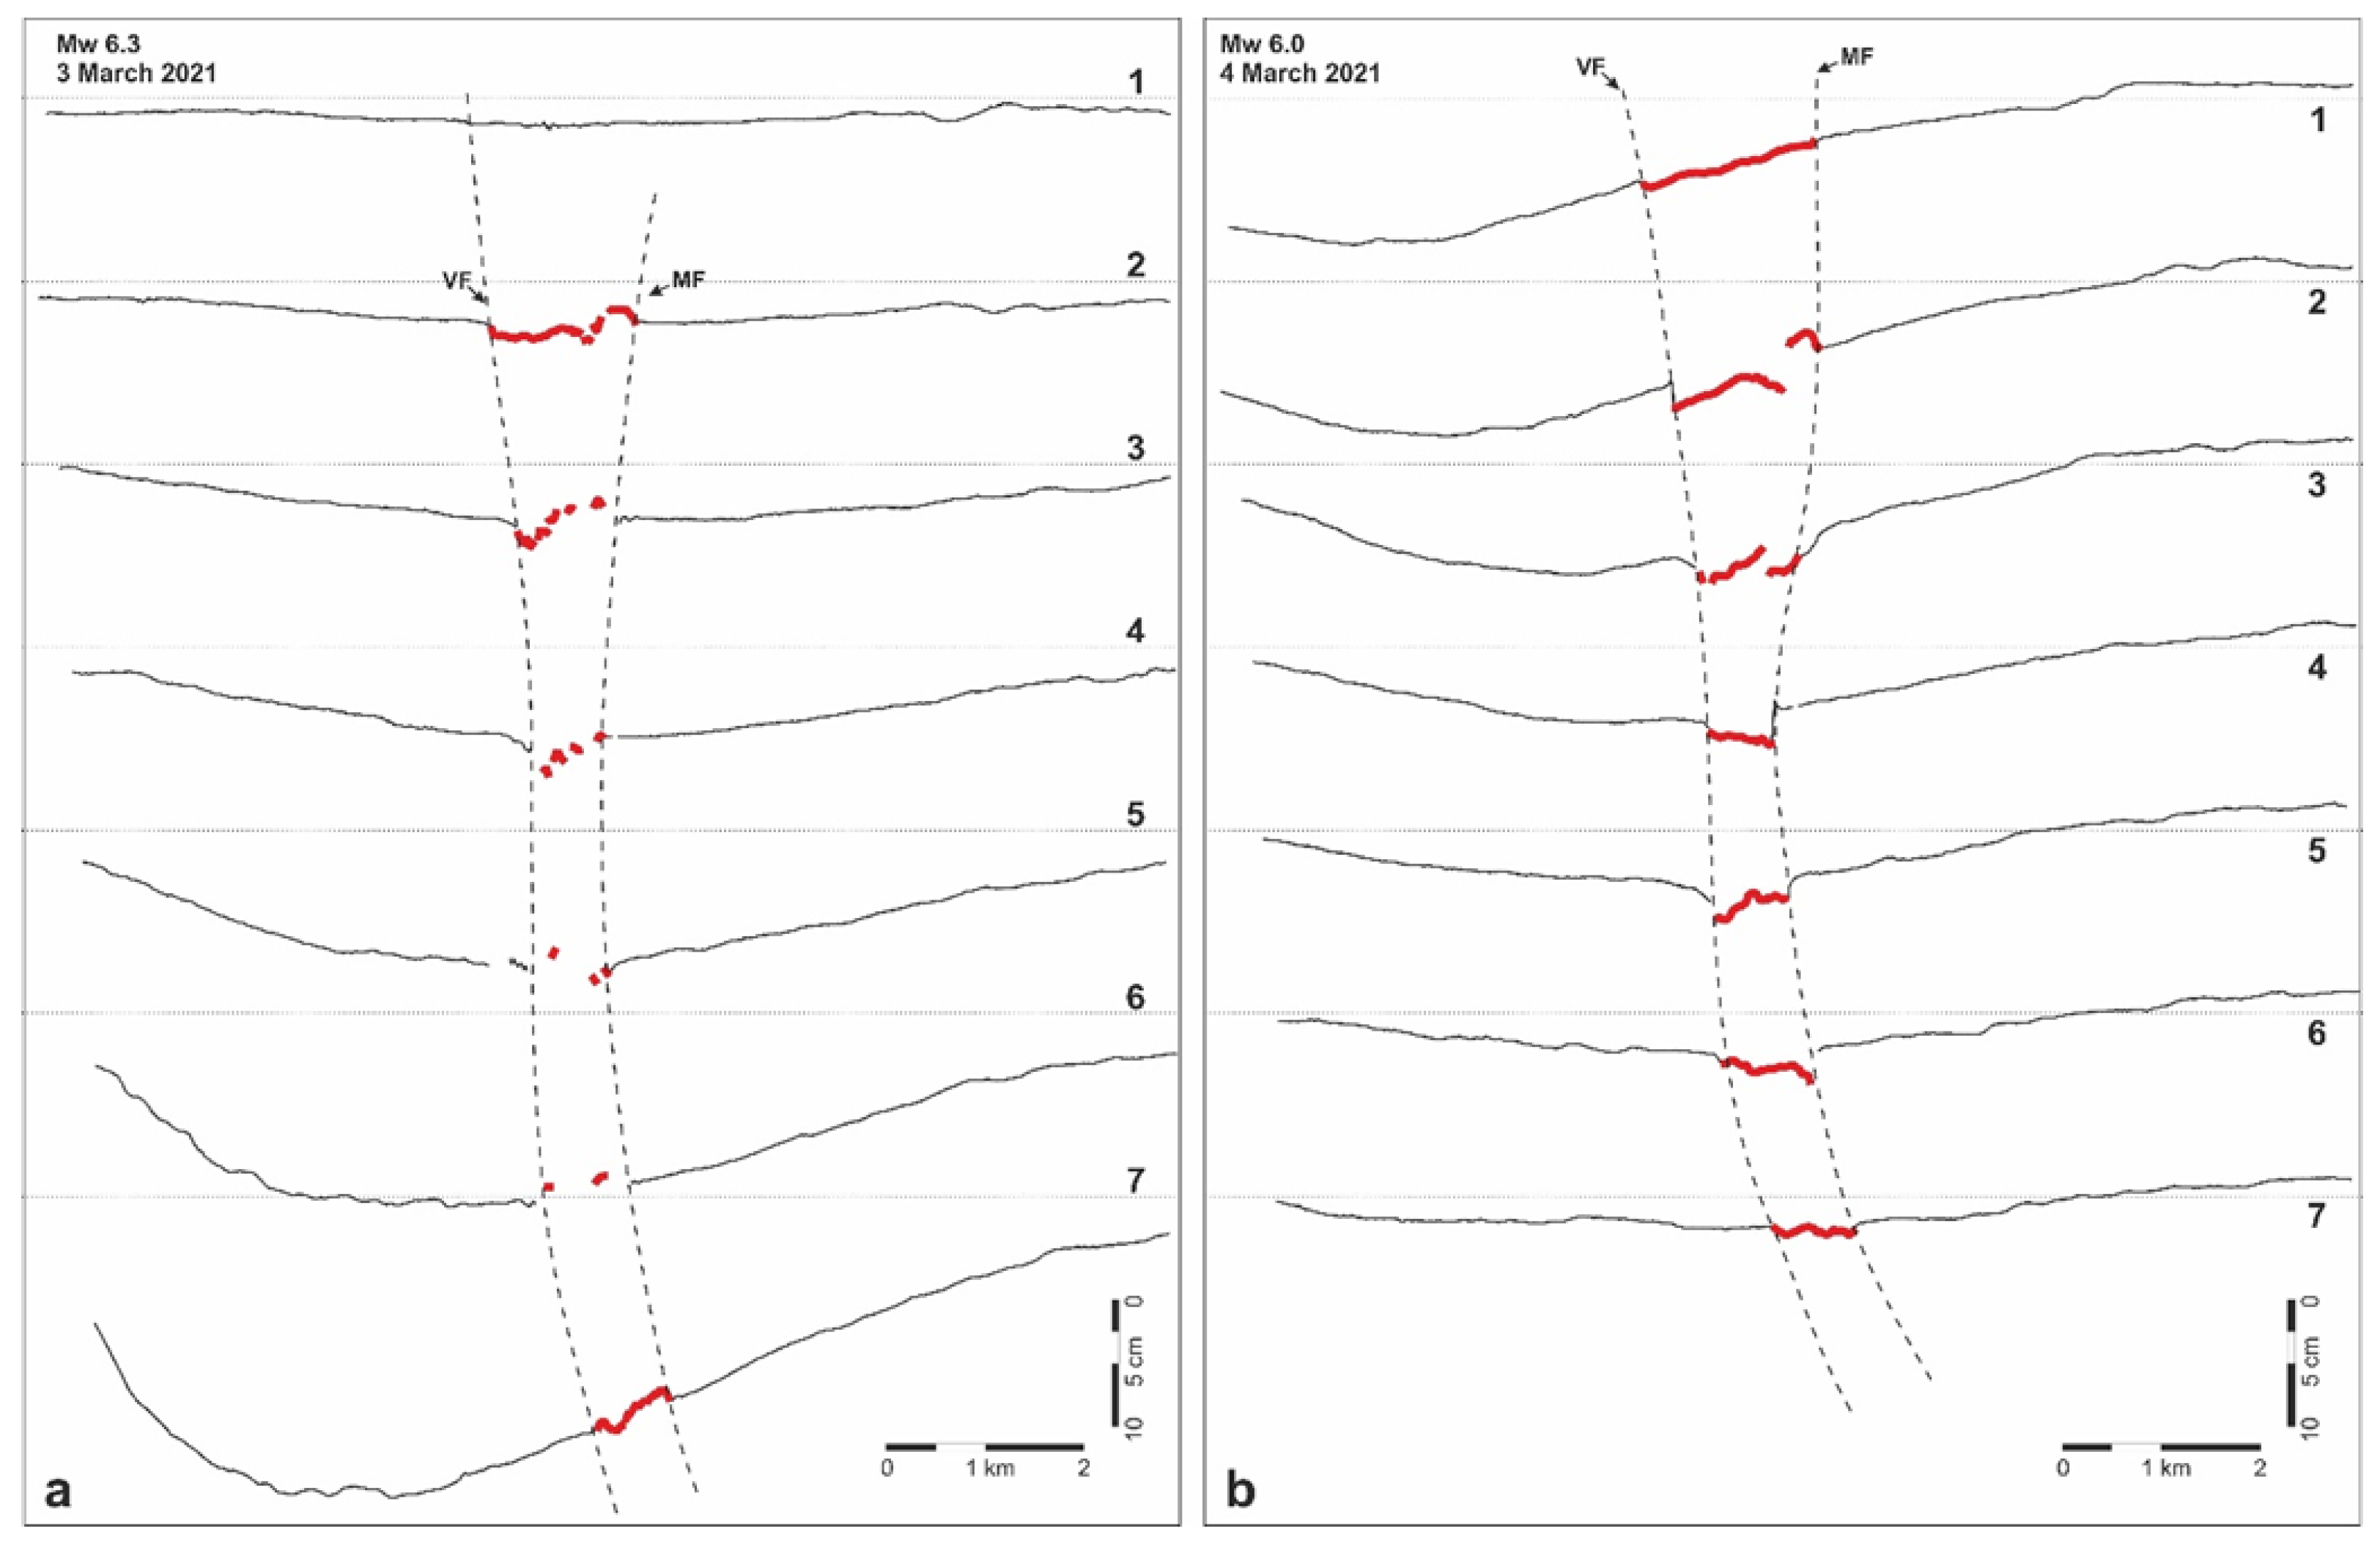
Figure 5.
Profiles across the Titarisios River Graben representing the LOS ascending displacement resulting from the DInSAR analyses and documenting the differential reactivation of both the Mesochori and the Vlachogianni faults as a consequence of the 3 March (a) and 4 March (b) major seismic events.
3. Palaeoseismology across the Mesochori Fault
Palaeoseismology, the study of past earthquakes, is a technique based on trenches excavation across simple or composite fault scarps and colluvial tectonostratigraphy investigations. Trenches for studying past earthquakes are generally excavated across fault traces where instrumental or historical surface-rupturing earthquakes of the past centuries are documented or at least suspected (e.g., [23,24,31]). However, it remains common that, even after strong earthquakes, surface ruptures are not always considered a direct expression of the upward fault rupture and slip started at depth. In such cases, although some faults have a marked morphological expression (i.e., an escarpment), doubt could persist as to whether they are active or not. Some debated examples are the Edgecumbe Fault in New Zealand [32], the Jericho Fault as part of the Dead Sea Fault Zone [33], the Fili Fault [34] or the Nisi Fault [35] in Attica and the Peloponnese, respectively. The palaeoseismological approach has been applied worldwide, as well as in Greece, including northern Thessaly, where the major active faults have been excavated in the past, documenting their association with linear morphogenic earthquakes [18] and above all their recent seismogenic behaviour [4,7,31] and this study.
As regards the Mesochori Fault, the palaeoseismological investigation was conducted in the area where the surface displacement shows its maximum amount along its trace (Figure 6). We excavated three trenches in this sector across the seismically induced surface rupture. All three trenches were single-slot “California style”, following the standard trenching methods outlined by [23]. Due to overall similar results being obtained, in the following we focus on and describe in detail one of the trenches which exposed the best stratigraphy (Figure 7). The excavation was 10 m long and 4 m wide, while its maximum depth was about 3 m. The trench walls were cleaned and mapped manually using a 1 × 1 m reference grid of non-stretch string. A photomosaic of the trench was also composed using the image processing software Agisoft Metashape software (v. 2.0.1., Agisoft LLC, St. Petersburg, Russia) (see Supplementary Materials Figure S1 and S2).

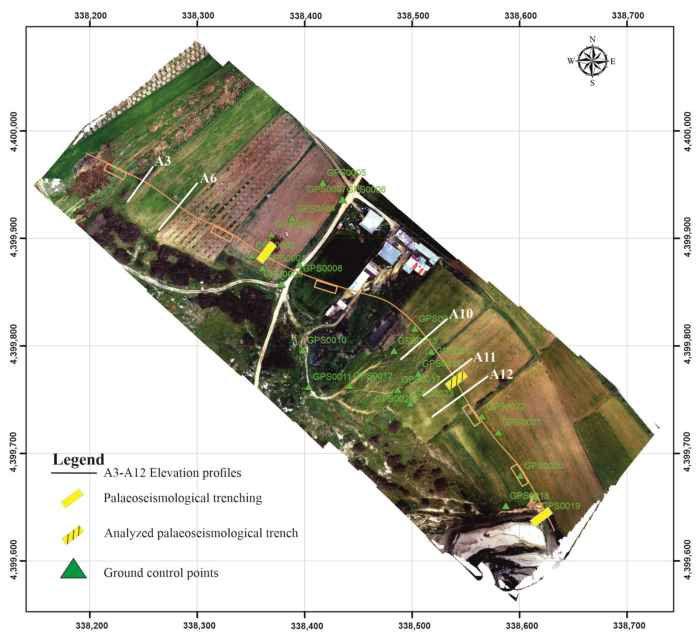
Figure 6.
Map of the central sector of the Mesochori Fault showing the location of the scarp, the location of the palaeoseismological trenches, and the topographic profiles obtained from UAV-acquired digital elevation models (DEMs).
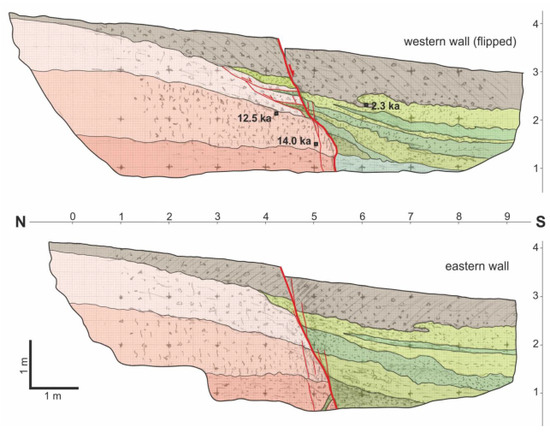
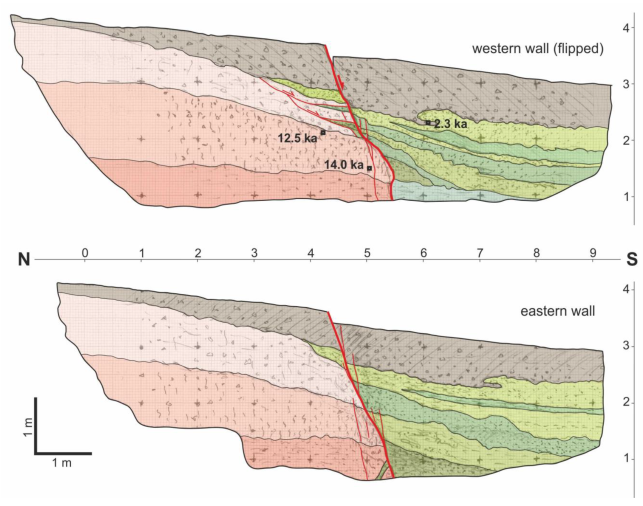
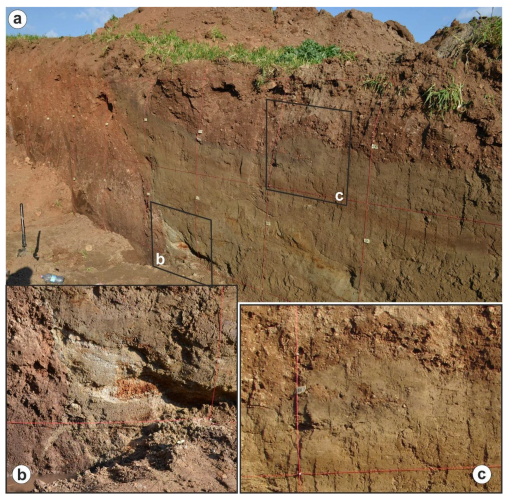
Figure 7.
Logs of the palaeoseismological trench walls excavated across the Mesochori Fault trace. The pinkish colours correspond to the latest Pleistocene Red Beds subunits, while the greenish ones to the Holocene fluvial-related subunits. The brown layer unconformably covers both sedimentary successions. See text for description.
In all three trenches, it is clearly possible to recognize a relatively sharp high-angle shear zone directly connected to the coseismic surface rupture. In the logs, the observed deformational band includes open voids and a dense array of cracks forming a half-metre-wide zone separating the hanging-wall block from the footwall block.
Based on a detailed log and analysis of the trench walls, it was possible to reconstruct the outcropping stratigraphic successions (Figure 7). Overall, the sedimentary units of the footwall block are markedly different from those of the hanging-wall block (Figure 8).

Figure 8.
(a) Eastern wall of the Mesochori trench; see detailed log in Figure 7. (b) Detail of the fluid injection feature observed at the base of the excavation and of a clear colluvial wedge. (c) Example of deformational structure (i.e., convolution) associated with a liquefaction process.
In the former sector, the deposits consist of heterogeneous materials with an abundant clay component and poorly rounded clasts up to a few centimetres in dimension. A diffuse and intense bioturbation affects the whole unit. No clear sedimentary boundaries can be recognized, but only a subtle layering suggesting a south-dipping setting of 10°–15°. The dominant colour of these deposits is reddish-brown, though from top to bottom the brownish component progressively increases. The intermediate “layer” is also characterized by numerous thin whitish concretions likely to be associated with caliche-like water evaporation and carbonate precipitation generating a general hardening of the deposits. A comparison with other trenches investigated in Thessaly [4,7,36] as well as in the broader Aegean region reveals that the footwall block sedimentary succession clearly belongs to the well-known Red Beds commonly attributed to the latest Pleistocene and particularly associated with the fading of the Last Glacial Maximum event (e.g., [22]).
As regards the stratigraphy of the hanging-wall block, layering is much more evident, making it possible to distinguish several depositional events. The eastern and the western walls reveal in detail some differences in sedimentary successions; however, on both sides of the trench, which are 4 m apart, deposits consist of prevailing clastic materials, alternating sandy and silty clay layers locally containing very small pebbles and sometimes intraclasts. The geometry of the layer’s boundaries is seldom linear in section view, and it is commonly wavy or irregular, showing clear evidence of post-depositional convolutions. According to the lithological content of each layer, colours vary from yellowish to grey and from slightly greenish to yellow-reddish (Figure 8a).
Overall, the hanging-wall succession is essentially associated with a fluvial environment, including overbank deposits and the wash-out from the nearby riverbanks. In this regard, the present-day alluvial plain of the Titarisios River is less than 100 m away, and the low-water level stands at an altitude of only 3–4 m lower than the coseismic surface rupture. As a consequence, the succession observed within the hanging-wall block of the trench could easily have been deposited during flooding events.
Some additional crucial features should be also noted: firstly, the presence of a possible colluvial wedge in the lower portion of the western wall (square C/5–6; Figure 7); secondly, the slight thinning of sedimentary units in both fault blocks towards the shear zone; and, thirdly, a decametric-scale bending affecting either the hanging-wall or footwall sequences, suggesting the occurrence of a drag phenomenon.
It is also worth noting that, close to the bottom of the eastern wall, we recognized a silty sand dyke-like structure affecting the lowermost portion of the footwall block (Figure 8b). Due to its position close to the lower excavation limit of the trench, it is not clear whether the observed sand is the result of an upward injection phenomenon or the gravitational infilling of a temporarily open fissure. In either case, the structure is clearly associated with, and induced by, a local liquefaction process directly related to the Titarisios River Graben faults.
Although the stratigraphic successions in the two blocks are essentially distinct as mentioned above, it should be emphasized that three (in the western wall) and one (in the eastern wall) of the sedimentary units that are well defined in the hanging-wall block have a likely lithological correspondence within the footwall block, where they rapidly pinch out, disappearing at 1–2 m distance from the fault zone. Overall, they describe palaeo on-lap geometries of the fluvial deposits on the lowermost sector of the progressively evolving morphotectonic scarp. The apparent interfingering with thin slices of materials belonging to the Red Beds succession is likely to be due to small-scale gravitational sliding phenomena affecting the repeatedly uplifted scarp-generating local erosion (Figure 7, top image). In line with these observations, each of the layers correlated on the two sides of the fault represents an event horizon [23].
On top of both fault blocks, we could also distinguish a laterally uniform brown soil characterized by a progressive increase in organic material upwards. The formation of this soil suggests a relatively stable environmental setting no longer directly affected by the river deposition. Considering that this reach of the Titarisios River stands on the footwall block of, and close to, the Tyrnavos Fault (Figure 1), one of the major tectonic active structures bordering the Tyrnavos Graben [6], it is likely that the riverbed was affected by entrenching due to the regressive erosion induced by the continuous uplift. The soil observed in the trench obviously represents the 2021 event horizon, which has been affected by coseismic displacement.
As mentioned above, most layers characterizing the fluvial sedimentary succession of the hanging-wall block reveal diffuse liquefaction evidence. In this regard, it should be noted that, firstly, the liquefaction features affecting the uppermost sandy–silty layer involve materials also belonging to the overlying soil horizon, and, secondly, the sandy–silty unit was dry when we excavated the trench, that is to say, only seven days after the earthquake. The lack of one of the compelling conditions (i.e., water saturation) for the triggering of liquefaction processes definitely indicates that the causative event of these secondary effects occurred certainly after the uppermost fluvial deposition, but much before the 2021 event. As a matter of fact, these features document a palaeoliquefaction event. On the other hand, no liquefaction phenomena were observed along the northern side of the Titarisios River following the DSS, probably because of unfavourable geological and hydrogeological conditions at the time.
As regards the offsets of recognized past events, the slip at the topographic surface associated with the 2021 earthquake was 15–17 cm. To unravel previous events, we could take into account the three sedimentary units stratigraphically correlated on both sides of the shear zone (Figure 7) and measure their cumulative throw (ca. 30, ca. 45, and ca. 55–60 cm, respectively). By progressively subtracting from each value the younger vertical displacements, it is possible to estimate single-event offsets of ca. 13–15, 15, and 10–15 cm, respectively, all being quantitatively comparable to the 2021 observations. Further analysing the same trench logs, it is possible to infer additional older events, inasmuch as the top of the Red Beds unit recognized in the footwall does not appear in the hanging-wall block. By tentatively and conservatively assuming that the same stratigraphic horizon could be just below the trench bottom on the southern side of the fault, the cumulative throw would be ca. 120–140 cm. Based on the above observations in relation to the four most recent linear morphogenic events [18], we could tentatively assume for the Mesochori Fault a behaviour resembling a characteristic earthquake model. Although this recurrence/reactivation model has been largely questioned in the literature (e.g., in [37]), as a very first approximation we could also consider for these older events a coseismic throw corresponding to the mean value of the four younger earthquakes (ca. 14–15 cm). Accordingly, and without taking into account the younger component of the cumulative offset (ca. 60 cm), it is, therefore, possible to infer the occurrence of (at least) 4–6 additional events reactivating the Mesochori Fault since the deposition of the Red Beds unit; overall, this would correspond to 8–10 events till the present.
In order to chronologically constrain the above-described evolution, samples were collected from the trench walls for radiocarbon dating. AMS radiometric analyses were performed at the Laboratory of Ion Beam Physics, ETH Zurich, Switzerland. Due to the nature of the exposed sediments, only three samples returned an age (Figure 7). Although these laboratory data do not allow us to determine a singular date for each of the previously inferred earthquakes, it is however possible to chronologically constrain the whole geometric and kinematic picture described so far.
First of all, the youngest available age (2.3 ka BP) is relative to the lowermost portion of the soil, which we recall was involved in a younger but pre-2021 liquefaction process. Secondly, the other two dated samples belong to the Red Beds unit and are coherent in documenting the stratigraphic younging of this sedimentary succession. They also confirm that the fading of the effects (and associated environmental conditions) of the Last Glacial Maximum event (see, e.g., [25]) occurred during the latest Pleistocene. In summary, based on all available data, and particularly the possible number of inferred events that affected the excavated site since the present (8–10) and the time period for their occurrence (10–12 ka), a very rough estimate suggests a mean recurrence interval of 1.0–1.5 ka.
4. Postseismic Activity along the TRG
Recurring linear morphogenic earthquakes that rupture the Earth’s surface and repeatedly offset preexisting landforms, like slopes, river channels or banks, alluvial fans, etc., commonly produce cumulative scarps over geological timescales [38,39,40,41]. Scarp height is typically used as a proxy for minimum coseismic vertical displacement [42] and indicates the deformation style and magnitude of the earthquake(s) associated with the analysed fault. Precise vertical displacements can be inferred from topographic profiles reconstructed across a fault scarp by observing the mismatch of the undeformed portions of the slope on either side of the scarp and measuring the offset in-between. Nowadays, these profiles could also be obtained by means of remote sensing technologies and UAV-acquired digital elevation models (DEMs) (e.g., [43,44] and references therein). Although UAV DEMs which use ground control points are of high resolution (≤5 cm), the best practice for the calculation of the vertical displacement across a morphological scarp is a manual process with the use of real-time kinematic positioning (RTK) global navigation satellite system surveying devices (e.g., [45]). The RTK GNSS measurements were performed with a Leica GS08 sensor, as described in detail in [46].
In the present study, we also performed five transects using an RTK GNSS device across the Mesochori Fault trace, taking into account the same start and end points for each transect during the different measuring campaigns. We subsequently compared these results with cross-sections derived from the UAV DEM (Figure 6). These high-resolution elevation profiles and the UAV acquisition DEMs provide similar profiles systematically showing topographic jumps (viz. large-scale deformation) across the Mesochori Fault scarp. Along the investigated profiles for March 2021, the dip angle of the slope in correspondence with the morphotectonic scarp was between 40° and 70°, while the inclination of the original surface outside this sector affected by the fault-induced deformation was 5° to 7° (Figure 9).
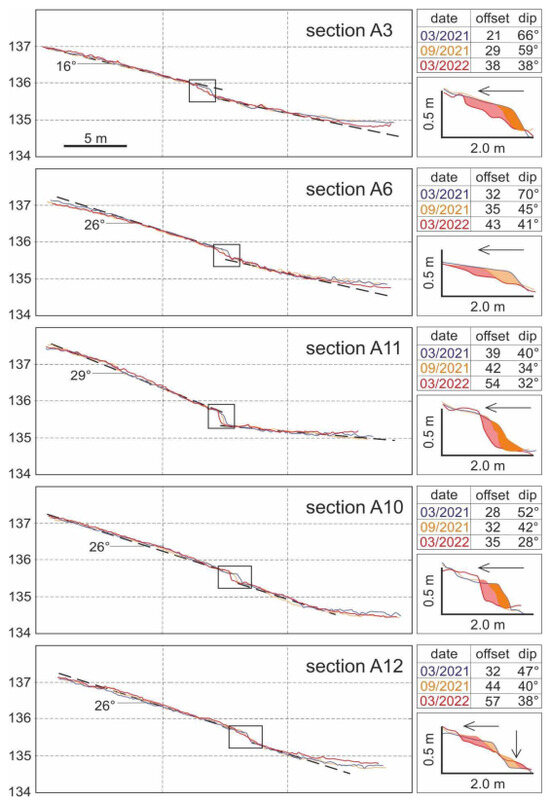
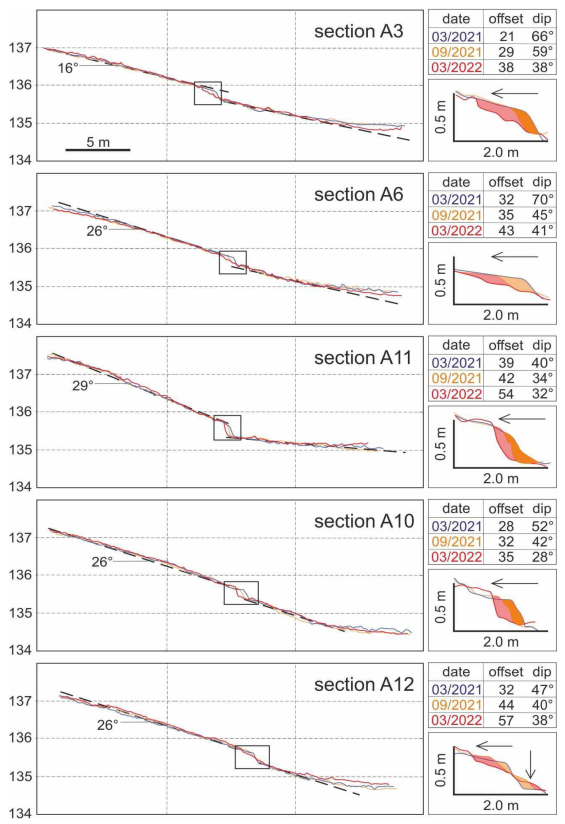
Figure 9.
Detailed topographic profiles obtained from UAV-acquired digital elevation models show the scarp evolution during the year after the DSS thus emphasizing the postseismic contribution to the cumulative scarp height. Numbers on the left of the graphs are altitudes in metres. On the right are reported the numerical values of the slope offset (in cm) and the maximum dip angle at the scarp, as well as the enlarged view of the scarp emphasizing the processes of retreat and colluvial wedge accumulation (arrows). Curves and dates colours correspond. Different colours of curves represent different dates.
In order to investigate the possible occurrence of a postseismic component of fault-related relaxation of the scarp (and to quantify its amount), we also conducted the remote sensing investigations repeatedly over one year after the DSS.
By picking the fault scarp and processing the collected elevation data, we then compared the diachronic profiles produced along the same path. In order to minimize possible inconsistencies—due mainly to vegetation growth and/or local-scale phenomena and potentially leading to errors in the scarp height calculation—we repeated the profiles using the same starting and ending points based on RTK GNSS data. The results of the three profiling campaigns show that the average dip angle of the slope in correspondence with the Mesochori Fault scarp decreased everywhere to 28°–41° (Figure 9).
The inferred offset across the fault scarp in the five profiles (Figure 6) was 21–39 cm in March 2021. It progressively increased up to 29–44 cm in September 2021, while in March 2022 the measured offset further increased to 35–57 cm (Figure 9). Accordingly, the one-year postseismic increase in the broader scarp was ca. 15 cm on average. Based on the trench observations, this postseismic offset is likely to have been distributed off-fault and does not seem to have played a role within the narrow shear zone observed in the trench. Similar relaxation processes associated with past events could have contributed to the plurimetric-scale drag geometry observed in the trench wall.
The ratio between the coseismic offset discussed in Section 3 (15–17 cm) and the cumulative offset including the postseismic component (35–57 cm) should, however, be carefully considered when applying empirical relationships to obtain, for example, the magnitude of past events solely based on topographic and morphotectonic measurements. The latter discussion confirms the importance of geometrical and kinematic observations within palaeoseismological trenches for seismic hazard assessment purposes.
For the same analysed period, we have reconstructed in detail the fault scarp geometry along the five profiles (insets in Figure 9). In all cases, it is possible to observe a general retreat of the crest, and only in one case was the lower part of the scarp characterized by the formation of a colluvial wedge (profile A12; Figure 9). These superficial variations in the scarp occurred within a strip of about 2 m in width (Figure 9). Of particular interest is the fact that similar retreat phenomena (i.e., the small-scale gravitational sliding) and colluvial wedge formation, both described in Section 5, were also recognized within the excavated palaeoseismological trenches (Figure 7).
5. Conclusions
Seismological and primarily InSAR data used for investigating the 2021 seismic sequence indicate that the central-eastern sector of the seismogenic volume was affected by a major blind N-dipping low-angle fault. Nevertheless, DInSAR analyses and coseismic field evidence suggest that the Vlachogianni Fault [20] has also acted as a high-angle synthetic splay structure, likely to have borne some amount of coseismic slip. Parallel to, aligned with, and a few kilometres ESE of the termination of the Vlachogianni Fault is the Larissa Fault, a major NNE-dipping dip-slip normal fault (Figure 1). This tectonic structure describes a right-stepping partially overlapping geometry with the Tyrnavos Fault, and together they border to the south the Middle–Late Pleistocene crustal-scale Tyrnavos Graben [1].
The present paper clearly documents that within this dominantly NNE-dipping seismotectonic framework characterizing the southern sector of the Tyrnavos Graben the antithetic (i.e., SSW-dipping) high-angle dip-slip Mesochori Fault must play a kinematic and dynamic role within the same seismogenic volume. Indeed, not only was the Mesochori Fault affected by a linearly continuous coseismic surface rupture during the 2021 DSS [20] —setting aside the remote hypothesis of a gravitational sliding—but, above all, the results of our palaeoseismological investigation bear a clear record of repeated reactivations in the latest Pleistocene–Holocene times with millennial-scale recurrence intervals.
Furthermore, field evidence suggests cumulative displacement along the morphological scarp, essentially confirming the trenching data and particularly confirming a long-lasting and repeated activity and not just an occasional event. It is thus clear that the Mesochori Fault is somehow directly related to the seismogenic processes occurring at depth, possibly associated with the westward propagation of the Tyrnavos Graben (see also the two epicentres in the NW end of the map in Figure 1). In this regard, and taking into account the overall tectonic setting of the area (Figure 1, inset b), the Mesochori Fault possibly represents an antithetic structure of the Vlachogianni Fault which is likely to accommodate some down-dip geometrical irregularity inherited by older tectonic events (Figure 10).
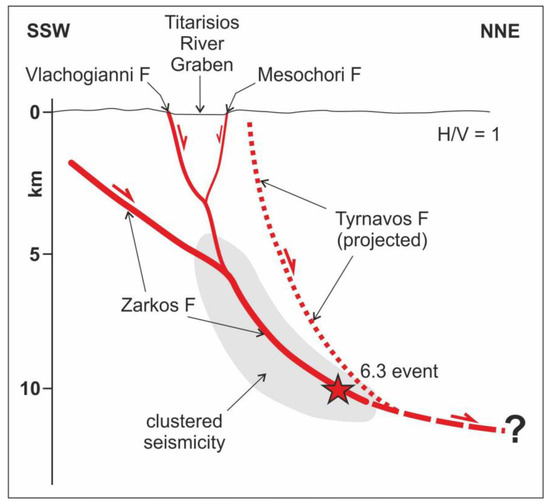
Figure 10.
Simplified section showing the proposed seismotectonic model for the DSS and the 3 March 2021 earthquake (red star). Red lines represent the reactivated faults while the dotted line represents the active Tyrnavos Fault which was not reactivated during the DSS. Clustered seismicity from [47].
Another geometrical irregularity and/or the existence of an inherited structure could have also favoured the partitioning of the dynamic slip distribution partly accommodated by a distinct up-dip path of the seismogenic rupture during its propagation along the low-angle blind segment which in turn was the main causative source of the 2021 main shock (Figure 10).
We do not know whether, in concomitance with past M > 6 earthquakes, the upwards rupture propagation always affected the same 2021 blind segment or whether instead the propagation sometimes followed the higher angle Vlachogianni Fault (Figure 10), there generating coseismic surface ruptures along its trace as documented by morphological evidence [20]. Indeed, several combinations of slip partitioning along the blind Zarkos, the Vlachogianni, and the Mesochori faults could obviously have occurred in the past, but certainly some amount of strain (viz. slip) was also repeatedly released on the latter tectonic structure as recorded by our palaeoseismological trenches.
Notwithstanding the secondary role of the Mesochori Fault in the overall kinematics and strain release of this seismogenic crustal volume corresponding to the western sector of the Tyrnavos Graben, as a final comment we wish to stress how the investigation of these apparently secondary tectonic structures can provide crucial information on the complex seismotectonics of the region and contribute to the improvement of future seismic hazard assessment analyses.
Supplementary Materials
The following supporting information can be downloaded at: https://www.mdpi.com/article/10.3390/geosciences13110331/s1, Figure S1: Photomosaic of the eastern wall of the palaeoseismological trench composed using the image processing software Agisoft; Figure S2: Photomosaic of the western wall of the palaeoseismological trench composed using the image processing software Agisoft.
Author Contributions
Conceptualization, I.K.K., R.C. and K.G.N.; methodology, I.K.K., R.C., K.G.N. and N.A.F.; software, N.A.F. and A.K.; validation, I.K.K., R.C., K.G.N. and N.A.F.; formal analysis, I.K.K., R.C., K.G.N. and N.A.F.; investigation, I.K.K. and R.C.; resources, I.K.K. and R.C.; data curation, all co-authors; writing—original draft preparation, I.K.K. and R.C.; writing—review and editing, I.K.K., R.C., K.G.N. and N.A.F.; visualization, I.K.K. and R.C.; supervision, I.K.K. and R.C.; project administration, I.K.K.; funding acquisition, I.K.K. and R.C. All authors have read and agreed to the published version of the manuscript.
Funding
This research received no external funding.
Data Availability Statement
Data available on request due to restrictions. The data presented in this study are available on request from the corresponding author.
Acknowledgments
The authors would like to express their gratitude to Nikolaos Gatsas, Mayor of the municipality of Elassona, and to local residents for their support during the field work. We also express our gratitude to our colleague Alexandros Belesis for his support during the field work.
Conflicts of Interest
The authors declare no conflict of interest.
References
- Caputo, R. Inference of a seismic gap from geological data: Thessaly (Central Greece) as a case study. Ann. Geofisica 1995, 38, 1–19. [Google Scholar] [CrossRef]
- Caputo, R. Morphotectonics and kinematics along the Tyrnavos Fault, northern Larissa Plain, mainland Greece. In Neotectonics and Active Faulting; Stewart, I., Vita-Finzi, C., Owen, L.A., Eds.; Borntraeger: Stuttgart, Germany, 1993; Volume 94, pp. 167–185. [Google Scholar]
- Caputo, R.; Piscitelli, S.; Oliveto, A.; Rizzo, E.; Lapenna, V. The use of electrical resistivity tomographies in active tectonics: Examples from the Tyrnavos Basin, Greece. J. Geodyn. 2003, 36, 19–35. [Google Scholar] [CrossRef]
- Caputo, R.; Helly, B.; Pavlides, S.; Papadopoulos, G. Palaeoseismological investigation of the Tyrnavos Fault (Thessaly, Central Greece). Tectonophysics 2004, 394, 1–20. [Google Scholar] [CrossRef]
- Caputo, R. The Rodia Fault: An active complex shear zone (Larissa Basin, Central Greece). Bull. Geol. Soc. G. 1993, 18, 447–456. [Google Scholar]
- Caputo, R.; Pavlides, S. Late Cainozoic geodynamic evolution of Thessaly and surroundings (Central-Northern Greece). Tectonophysics 1993, 223, 339–362. [Google Scholar] [CrossRef]
- Caputo, R.; Helly, B. The Holocene activity of the Rodia Fault, Central Greece. J. Geodyn. 2005, 40, 153–169. [Google Scholar] [CrossRef]
- Caputo, R.; Pavlides, S. The Greek Database of Seismogenic Sources (GreDaSS), Version 2.0.0: A Compilation of Potential Seismogenic Sources (Mw > 5.5) in the Aegean Region. 2013. Available online: http://gredass.unife.it/ (accessed on 30 July 2023). [CrossRef]
- Tolomei, C.; Caputo, R.; Polcari, M.; Famiglietti, N.A.; Maggini, M.; Stramondo, S. The use of Interferometric Synthetic Aperture Radar for isolating the contribution of major shocks: The case of the March 2021 Thessaly, Greece, seismic sequence. Geosciences 2021, 11, 191. [Google Scholar] [CrossRef]
- De Novellis, V.; Reale, D.; Adinolfi, G.M.; Sansosti, E.; Convetito, V. Geodetic Model of the March 2021 Thessaly Seismic Sequence Inferred from Seismological and InSAR Data. Remote Sens. 2021, 13, 341. [Google Scholar] [CrossRef]
- Ganas, A.; Valkaniotis, S.; Briole, P.; Serpetsidaki, A.; Kapetanidis, V.; Karasante, I.; Kassaras, I.; Papathanassiou, G.; Karamitros, I.; Tsironi, V.; et al. Domino-style earthquakes along blind normal faults in Northern Thessaly (Greece): Kinematic evidence from field observations, seismology, SAR interferometry and GNSS. Bull. Geol. Soc. G. 2021, 58, 37–86. [Google Scholar] [CrossRef]
- Papadopoulos, G.A.; Agalos, A.; Karavias, A.; Triantafyllou, I.; Parcharidis, I.; Lekkas, E. Seismic and Geodetic Imaging (DInSAR) Investigation of the March 2021 Strong Earthquake Sequence in Thessaly, Central Greece. Geosciences 2021, 11, 311. [Google Scholar] [CrossRef]
- Kassaras, I.; Kapetanidis, V.; Ganas, A.; Karakostantis, A.; Papadimitriou, P.; Kaviris, G.; Kouskouna, V.; Voulgaris, N. Seismotectonic analysis of the 2021 Damasi-Tyrnavos (Thessaly, Central Greece) earthquake sequence and implications on the stress field rotations. J. Geodyn. 2022, 150, 101898. [Google Scholar] [CrossRef]
- Karakostas, V.; Papazachos, C.; Papadimitriou, E.; Foumelis, M.; Kiratzi, A.; Pikridas, C.; Kostoglou, A.; Kkallas, C.; Chatzis, N.; Bitharis, S.; et al. The March 2021 Tyrnavos, central Greece, doublet (Μw6.3 and Mw6.0): Aftershock relocation, faulting details, coseismic slip and deformation. Bull. Geol. Soc. Greece 2021, 58, 131–178. [Google Scholar] [CrossRef]
- Valkaniotis, S.; Papathanassiou, G.; Ganas, A.; Kremastas, E.; Caputo, R. Preliminary Report of Liquefaction Phenomena Triggered by the March 2021 Earthquakes in Central Thessaly, Greece. Available online: https://zenodo.org/record/4608365#.YFD0mp1KhhE (accessed on 20 August 2023).
- Lekkas, E.; Agorastos, K.; Mavroulis, S.; Kranis, C.; Skourtsos, E.; Carydis, P.; Gogou, M.; Katsetsiadou, K.-N.; Papadopoulos, G.; Triantafyllou, I.; et al. The early March 2021 Thessaly Earthquake Sequence. Newsl. Environ. Disaster Crises Manag. Strateg. 2021, 22. [Google Scholar] [CrossRef]
- Pavlides, S.; Caputo, R. Magnitude versus faults’ surface parameters: Quantitative relationships from the Aegean Region. Tectonophysics 2004, 380, 159–188. [Google Scholar] [CrossRef]
- Caputo, R. Ground effects of large morphogenic earthquakes. J. Geodyn. 2005, 40, 113–118. [Google Scholar] [CrossRef]
- Papathanassiou, G.; Valkaniotis, S.; Ganas, A.; Stampolidis, A.; Rapti, D.; Caputo, R. Floodplain evolution and its influence on liquefaction clustering: The case study of March 2021 Thessaly, Greece, seismic sequence. Eng. Geol. 2022, 298, 106542. [Google Scholar] [CrossRef]
- Koukouvelas, I.K.; Nikolopoulos, K.G.; Kyriou, A.; Caputo, R.; Mpelesis, A.; Zygouri, V.; Verroios, S.; Apostolopoulos, D.; Tsentzos, I. The March 2021 Damasi earthquake sequence, Central Greece: Reactivation evidence across the westward propagating Tyrnavos Graben. Geosciences 2021, 11, 328. [Google Scholar] [CrossRef]
- Doutsos, T.; Pe-Piper, G.; Boronkay, K.T.; Koukouvelas, I. Kinematics of the central Hellenides. Tectonics 1993, 12, 936–953. [Google Scholar] [CrossRef]
- Caputo, R.; Helly, B. Archaeological evidences of past earthquakes: A contribution to the SHA of Thessaly, Central Greece. J. Earthq. Eng. 2005, 9, 199–222. [Google Scholar] [CrossRef]
- McCalpin, J.P. (Ed.) Paleoseismology; Academic Press: San Diego, CA, USA, 1996; p. 588. [Google Scholar]
- Koukouvelas, I.K.; Zygouri, V.; Papadopoulos, G.A.; Verroios, S. Holocene record of slip-predictable earthquakes on the Kenchreai Fault, Gulf of Corinth, Greece. J. Struct. Geol. 2017, 94, 258–274. [Google Scholar] [CrossRef]
- Caputo, R. Geological and structural study of the recent and active brittle deformation of the Neogene-Quaternary basins of Thessaly (Central Greece). In Scientific Annals; Aristotle University of Thessaloniki: Thessaloniki, Greece, 1990; p. 255. [Google Scholar]
- Caputo, R.; Helly, B.; Rapti, D.; Valkaniotis, S. Late Quaternary hydrographic evolution in Thessaly (Central Greece): The crucial role of the Piniada Valley. Quat. Int. 2021, 635, 3–19. [Google Scholar] [CrossRef]
- Morley, C.K.; Nelson, R.A.; Patton, T.L.; Munn, S.G. Transfer zones in the East African rift system and their relevance tohydrocarbon exploration in rifts. Bull. Am. Ass. Petrol. Geol. 1990, 74, 1234–1253. [Google Scholar]
- Massonnet, D.; Feigl, K.L. Radar interferometry and its application to changes in the Earth’s surface. Rev. Geophys. 1998, 36, 441–500. [Google Scholar] [CrossRef]
- Goldstein, R.M.; Werner, C.L. Radar interferogram filtering for geophysical applications. Geophys. Res. Letts. 1998, 25, 4035–4038. [Google Scholar] [CrossRef]
- Rosen, P.A.; Hensley, S.; Zebker, H.A.; Webb, F.H.; Fielding, E.J. Surface deformation and coherence measurements of 623 Kilauea Volcano, Hawaii, from SIR-C radar interferometry. J. Geophys. Res. Planets. 1996, 101, 23109–23125. [Google Scholar] [CrossRef]
- Tsodoulos, I.M.; Stamoulis, K.; Caputo, R.; Koukouvelas, I.; Chatzipetros, A.; Pavlides, S.; Gallousi, C.; Papachristodoulou, C.; Ioannides, K. Middle-Late Holocene earthquake history of the Gyrtoni Fault, Central Greece: Insight from optically stimulated luminescence (OSL) dating and paleoseismology. Tectonophysics 2016, 687, 14–27. [Google Scholar] [CrossRef]
- Nairn, I.A.; Beanland, S. Geological setting of the 1987 Edgecumbe earthquake, New Zealand. N. Z. J. Geol. Geophys. 1989, 32, 1–13. [Google Scholar] [CrossRef]
- Lazar, M.; Ben-Avraham, Z.; Garfunkel, Z.; Porat, N.; Marco, S. Is the Jericho Escarpment a Tectonic or a Geomorphological Feature? Active Faulting and Paleoseismic Trenching. J. Geol. 2010, 118, 261–276. [Google Scholar] [CrossRef]
- Ganas, A.; Pavlides, S.B.; Sboras, S.; Valkaniotis, S.; Papaioannou, S.; Alexandris, G.A.; Plessa, A.; Papadopoulos, G.A. Active fault geometry and kinematics in Parnitha Mountain, Attica, Greece. J. Struct. Geol. 2004, 26, 2103–2118. [Google Scholar] [CrossRef]
- Zygouri, V.; Koukouvelas, I.; Kokkalas, S.; Xypolias, P.; Papadopoulos, G.A. The Nisi Fault as a key structure for understanding the active deformation of the NW Peloponnese, Greece. Geomorphology 2015, 237, 142–156. [Google Scholar] [CrossRef]
- Caputo, R.; Helly, B. The European Palaeoseismological Museum of Tyrnavos, Central Greece. In Proceeding of the EGU General Assembly, Vienna, Austria, 16–20 April; 2007. [Google Scholar]
- Jackson, D.D.; Kagan, Y.Y. Characteristic Earthquakes and Seismic Gaps. In Encyclopedia of Solid Earth Geophysics; Encyclopedia of Earth Sciences Series; Gupta, H.K., Ed.; Springer: Dordrecht, The Netherlands, 2011. [Google Scholar] [CrossRef]
- Wallace, R.E. Profiles and ages of young fault scarps north-central Nevada. Geol. Soc. Am. Bull. 1977, 88, 1267–1281. [Google Scholar] [CrossRef]
- Avouac, J.-P. Analysis of Scarp Profiles: Evaluation of Errors in Morphologic Dating. J. Geophys. Res. 1993, 98, 6745–6754. [Google Scholar] [CrossRef]
- Hetzel, R.; Xu, Q.; Hampel, A.; Wolff, R. Slip rate of the Danghe Nan Shan Thrust fault from 10BE exposure dating of folded river terraces: Implications for the strain distribution in northern Tibet. Geol. Soc. Am. Abstr. Progr. 2022, 54. [Google Scholar] [CrossRef]
- Caputo, R.; Sboras, S.; Pavlides, S.; Chatzipetros, A. Comparison between single-event effects and cumulative effects for the purpose of seismic hazard assessment. A review from Greece. Earth Sci. Rev. 2015, 148, 94–120. [Google Scholar] [CrossRef]
- Morewood, N.C.; Roberts, G.P. Comparison of surface slip and focal mechanism slip data along normal faults: An example from the eastern Gulf of Corinth, Greece. J. Struct. Geol. 2001, 23, 473–487. [Google Scholar] [CrossRef]
- Talebian, M.; Copley, A.C.; Fattahi, M.; Ghorashi, M.; Jackson, J.A.; Nazari, H.; Sloan, R.A.; Walker, R.T. Active faulting within a megacity: The geometry and slip rate of the Pardisan thrust in central Tehran, Iran. Geophys. J. Int. 2016, 207, 1688–1699. [Google Scholar] [CrossRef]
- Koukouvelas, I.K.; Zygouri, V.; Nikolakopoulos, K.; Verroios, S. Treatise on the tectonic geomorphology of active faults: The significance of using a universal digital elevation model. J. Struct. Geol. 2018, 116, 241–252. [Google Scholar] [CrossRef]
- Delvaux, D.; Kervyn, F.; Macheyeki, A.S.; Temu, E.B. Geodynamic significance of the TRM segment in the East African Rift (W-Tanzania): Active tectonics and paleostress in the Ufipa plateau and Rukwa basin. J. Struct. Geol. 2012, 37, 161–180. [Google Scholar] [CrossRef]
- Nikolakopoulos, K.G.; Soura, K.; Koukouvelas, I.K.; Argyropoulos, N.G. UAV vs classical aerial photogrammetry for archaeological studies. J. Archaeol. Sci. Rep. 2017, 14, 758–773. [Google Scholar] [CrossRef]
- Papadimitriou, E.; Karakostas, V.; Papazachos, C.; Foumelis, M.; Kiratzi, A.; Pikridas, C.; Bonatis, P.; Kostoglou, A.; Kourouklas, C.; Scordilis, E.; et al. The seismogenic structure of March 2021 Tyrnavos (central Greece) doublet (Mw 6.3 and Mw 6.0), constrained by aftershock locations and geodetic data. Geophys. J. Int. 2023, 235, 644–689. [Google Scholar] [CrossRef]


Disclaimer/Publisher’s Note: The statements, opinions and data contained in all publications are solely those of the individual author(s) and contributor(s) and not of MDPI and/or the editor(s). MDPI and/or the editor(s) disclaim responsibility for any injury to people or property resulting from any ideas, methods, instructions or products referred to in the content. |
© 2023 by the authors. Licensee MDPI, Basel, Switzerland. This article is an open access article distributed under the terms and conditions of the Creative Commons Attribution (CC BY) license (https://creativecommons.org/licenses/by/4.0/).