1. Introduction
Rockfalls are quick and extremely dangerous natural phenomena consisting of the rapid descent of a single or a cluster of rock blocks along a steep slope [
1,
2]. The quantification of rockfall risk over a certain portion of land represents an extremely challenging task because of the several uncertainties in the definition of block volumes, the magnitude–frequency relationship, and boulder behavior during the falling motion (e.g., interaction with soil and obstacles) [
3,
4,
5,
6,
7]. Nevertheless, the quantification of rockfall risk represents the key point to protect the land from losses in terms of human lives, structures, infrastructure, and economic activities [
2,
8].
Risk analysis can be carried out at different levels of detail (or reference scales) characterized by specific input data, procedures, and objectives [
9,
10]. Several authors proposed different classifications for the scales of observation, mainly based on geographic or administrative considerations [
10,
11,
12,
13]. Referring to Fell et al. (2008), four scales can be used: detailed, large, medium, and small. The detailed scale (>1:5000), involves a limited portion of land (i.e., a single slope) and usually includes the design of protection works. At this scale, indepth hazard analysis by means of a stochastic approach in a 2D or 3D environment is required. In addition, each element at risk must be considered singularly with its proper characteristics, vulnerability, and type of response to specific hazard scenarios. At a large scale (from 1:5000 to 1:25,000), wider portions of land are generally investigated, and some degree of detail is inevitably lost. Here, several spatial approximations can be introduced. For instance, the territory can be divided into homogeneous areas characterized by the same geological conditions, exposure, type of elements at risk, etc. The purpose of large-scale risk analyses is to address the territorial planning by highlighting critical areas where more detailed analyses should be carried out. Generally, this type of analyses can be easily implemented in GIS software where a large amount of data can be easily stored [
13,
14]. This work proposes a risk analysis procedure at a large scale completely developed in a GIS environment using open-source software and tools. The procedure is introduced with reference to a case study located in the Sorba Valley (northwestern Italian Alps). The study was entirely carried out using data (e.g., DTM, topographic raster files, land cover vector files) that were freely available in geodatabases of the Italian public administration. Starting from the analysis of the site and the identification of the danger scenarios, the assessment of a time-independent spatial hazard was performed with QGIS plugin QPROTO [
15,
16,
17,
18,
19,
20] that applies the 3D cone method [
16] and the energy-angle approach [
17,
18] via viewshed analysis of the territory. The following evaluation of the elements at risk, their vulnerability and exposure, and the final quantification of the risk were performed through the IMIRILAND methodology [
19,
21]. The final results are several risk maps related to different design scenarios that can be useful for territorial administrators to plan and prioritize adequate countermeasures, and identify areas where more detailed analyses should be carried out.
2. Materials and Methods
The risk assessment procedure proposed and applied in this work is divided into two main phases. First, the assessment of a hazard is performed by means of simplified propagation analysis with the QGIS QPROTO plugin on the basis of the global parameters representative of block–ground interaction. In this work, a hazard is defined as a time-independent spatial hazard because, in many preliminary risk assessment analyses, no detailed information about the return period of a given scenario is available. Subsequently, the remaining components of the risk are defined, processed, and assembled using the procedure proposed by the IMIRILAND method. The following sections describe the main aspects of these two tools.
2.1. The QPROTO QGIS Plugin
The Q-GIS Predictive ROckfall Tool (QPROTO) plugin is a QGIS tool was developed by Politecnico di Torino and Arpa Piemonte [
13], and is based on the cone method [
16]. The cone-method parameters define the extension of the visibility cone and should be representative of the global rock block behavior along the slope.
As described in detail in [
20], hazard analyses with the QPROTO plugin require an association to each source point a set of information related both to the expected rockfall scenario and the slope conditions.
The three following angles are defined for each cone on the basis of the geomorphological condition of the area and the assumed block characteristics:
: dip direction, which defines the orientation of the cone with respect to the north;
EA: energy angle defining the cone amplitude in the vertical plane;
LA: lateral spreading angle defining the cone amplitude in the horizontal plane.
The QPROTO plugin allows for the preliminary estimation of the effects of a rockfall phenomenon over large slope sectors in terms of invasion area, velocity, and energy. The calculation procedure is implemented in a QGIS environment and consists synthetically of the application of a visibility function (GRASS GIS function r.viewshed) to a digital terrain model (DTM) of the area of interest. According to the cone method, the source points of the rockfall phenomenon are considered to be viewpoints, and a visibility cone is associated with each of them, so that the intersection between the cone and the DTM surface defines the limit of the propagation zone. The latter represents the set of raster map cells visible from the source point, that is, the set of cells where the motion of a block started from that source can impact.
An energy balance equation is then used to compute the block velocities and kinetic energies within the runout area.
2.2. IMIRILAND Method
A multidisciplinary methodology aimed at risk assessment in the case of landslides was proposed in the framework of the Impact of Large Landslides in the Mountain Environment: Identification and Mitigation of Risk (IMIRILAND) Project [
21]. At a large scale, the risk assessment provides a useful model for the identification of the most critical areas where more indepth analyses aimed at the design of protective works should be carried out. All the risk components are numerically expressed and spatially represented using mathematical operations and a matrix approach within a GIS environment. Starting from the damage, the total risk for a certain hazard scenario is given by the triple product of hazard, vulnerability and worth of the element at risk. Therefore, the risk analysis can be summarized in the following three phases:
hazard analysis;
damage analysis;
risk calculation.
The IMIRILAND method allows for performing quantitative risk analyses, but such analyses require the detailed characterization of all risk components, including temporal aspects. When the available information is limited, the method can be used to perform semiquantitative, time-independent risk analyses. This is the case of the application proposed in this work.
2.2.1. Hazard Analysis
Rockfall hazard is defined as the probability of impact of a rock block with a given energy in a given area. Hazard components are: the invasion area, the process intensity (rockfall energy) and the probability of occurrence. Within the IMIRILAND method, such components are managed independently:
the invasion area is used to define the element at risk;
rockfall energy is used to define the vulnerability of the element at risk;
the probability of occurrence can be used at the end of the calculation to directly compute the risk.
In this work, invasion area and phenomenon intensity are the results of the QPROTO analyses, provided as raster maps that can be easily combined with the available geographical databases.
2.2.2. Damage Analysis
The quantification of damage within the affected areas is performed on the basis of the intensity distributions and the areal distribution of the elements at risk. The following steps are required:
Identification and assessment of the elements at risk
For each analyzed scenario, it is necessary to overlap the intensity maps with geotopographic data. In particular, in the IMIRILAND methodology, the elements at risk are classified according to various categories to which a relative hierarchical value can be assigned. Risk analyses refer to each category with the advantage to independently manage people, structures and infrastructures, economic activities, and environmental assets. Four categories of value were defined:
- -
Physical: value of structures and infrastructures based on the repairing or reconstruction costs.
- -
Economic: value linked to commercial and economic activities.
- -
Social: value related to the presence of people (e.g., number of inhabitants and their fragility).
- -
Environmental: value given by the flora or fauna and the historical, cultural, or architectural value of the given area.
Vulnerability assessment
Vulnerability expresses the degree of loss that the elements at risk can suffer if affected by an event. Once again, it is possible to distinguish four categories of vulnerability:
- -
Physical, which considers the damage induced by the phenomenon on a structure or infrastructure. It depends on the intensity of the event and the type, strength, and deformation capacity of the structure.
- -
Economic, which considers economic losses due to the disruption of industrial, touristic, and transport activities.
- -
Social, related to the possibility of the injury and death of people. It considers the resilience of population to an event with a given magnitude.
- -
Environmental, which considers the negative effects of the event on environmental assets, taking into account the degree of resistance of anthropic structures or re-population capacity of natural species.
Calculation of the expected damage
The damage is expressed for each of the categories listed above as the product between the worth of the element at risk (
W) and the vulnerability (
V):
2.2.3. Risk Computation
The risk is obtained by combining the time-independent spatial hazard (H) and the expected damage (D). Nevertheless, a preliminary operation provides a quantitative expression of the exposure of each element at risk (E) for any element involved in the risk assessment procedure. Exposure represents the probability that a given element at risk E is exposed to the occurrence of an event of a given magnitude in a given area and period of time. That is, the probability that an element is subjected to a certain hazard. This operation is performed with reference to each risk category.
Each risk component assumes different values in different locations in the analyzed area. As a consequence, the risk is expressed using raster maps containing one value for each DTM cell. The computation of risk results in a simple productfor each
i-th component of the risk, of exposure, time-independent spatial hazard, and damage:
The process for calculating the risk leads to its definition through the following categories: physical, economic, social, and environmental (see
Section 3). Each must be investigated for each of the identified scenarios. Thus, it is possible to obtain the total risk for a given scenario by summing the different risk categories (physical, economic, social and environmental) obtained for that scenario.
where the final value is normalized with respect to the maximal obtainable risk. Otherwise, it is possible to obtain the total risk of all scenarios together for a given category (for example, the total physical risk).
The result of this calculation (Equation (
3)) acquires the meaning of the probability to have damage in a given location in a given period of time. If no information is available to assess the temporal probability of occurrence of different rockfall scenarios over large areas, the computed risk acquires the meaning of “specific risk”, where temporal factors are not included (time-independent spatial hazard).
The management of numerous data is effectively possible through geographic information systems (GISs) that allow for the superposition of various levels of spatial information, and the development of mathematical operations between the various parameters in a rapid and automatic manner.
3. Case Study
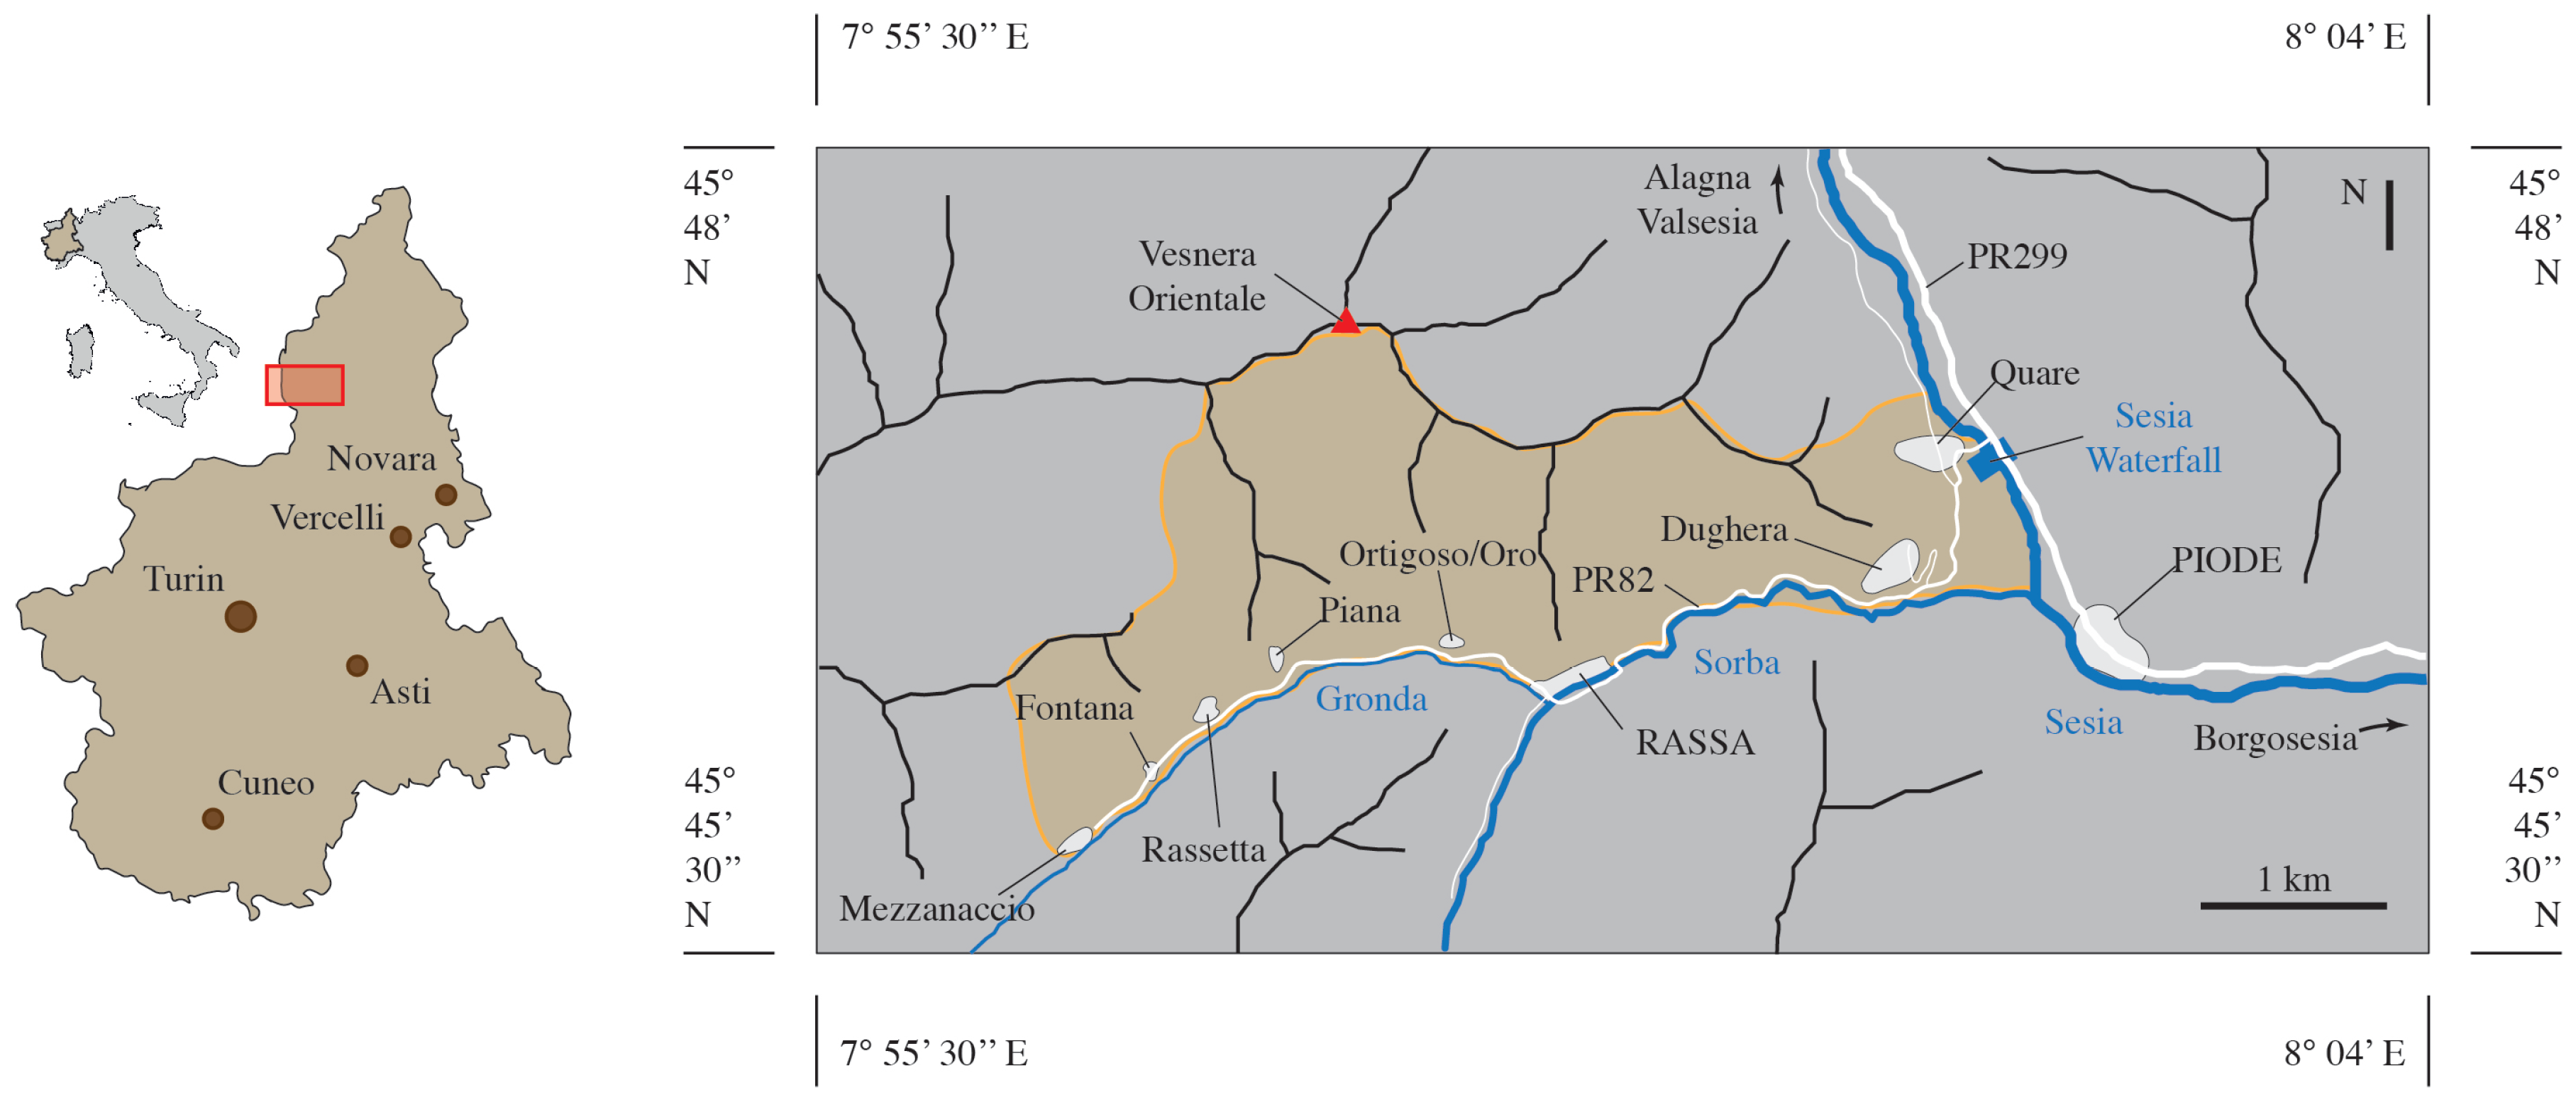
In this work, the proposed methodology encompassing hazard analysis by the QPROTO plugin, and the risk analysis by IMIRILAND approach was applied to a case study in the Sorba Valley (Italy). The valley is located in the northwestern Italian Alps and is crossed by the Sorba creek, a right-bank tributary of Sesia River that is one of the main rivers in North Piemonte. The main hamlet within the investigated area is Rassa (UTM: 5068797.367 423261.553 32T), which is located at an altitude of 917 m a.s.l. on the left hydrographical bank of the Sorba creek right at the junction with its main tributary, the Gronda creek (
Figure 1). Rassa is a small village with only tens of inhabitants mainly present during the summer season. The territory of its municipality covers the majority of Sorba Valley, especially in the highest part of the valley, while the lower part belongs to the territory of Piode. Rassa is connected to Piode, and thus to the main Sesia Valley, by Provincial Road 82 (PR82). The valley splits into two just west of Rassa: the main branch goes south until it reaches the source of the Sorba creek, while the northern one continues westwards as the tributary of Gronda Valley. In this latter branch, some little hamlets (i.e., Ortigoso, Oro, Piana, Rassetta, Fontana, and Mezzanaccio) can be reached through a dirt road.
Here, we investigate the entire left hydrographical bank of the Sorba Valley between Rassa and Piode, and the first part of the Gronda basin (its left bank). The site involves an area of about 10 km2 with altitudes ranging from the 750 m a.s.l. of the Sesia Waterfall up to the 2035 m a.s.l. of the Vasnera Orientale peak. From a geological point of view, the valley is composed of alluvial deposits with widespread gneiss outcrops. Rock faces are generally pseudovertical with limited heights i.e., 10–20 m at maximum, and are extensively diffused all over the slopes in the investigated area. The slopes are almost entirely forested, with vegetation consisting of mixed broad-leaved forests, with the prevalence of chestnuts, oaks, hazels, birches, and white alders.
Historically, the site has been prone to rockfall events that have involved both the hamlets and some sections of the PR82. In past centuries, only a few events have been recorded, sometimes not well-classified regarding landslide type. For instance, on 14 October 1755, a massive flood destroyed most of the bridges over the Sorba at Rassa, and some unidentified landslides hit the houses. The same occurred in September 1857 and August 1868. In September 1948, the road connecting Piode and Rassa was invaded by mud and rock debris in different sections. In 1961, some landslides involved the inhabited area of Rassa without causing structural damages, while in April 1980 and June 1981, two rockfall events hit two buildings at Rassa with some structural damage. In 1983, the PR82 was damaged by a fallen block some kilometers eastwards of Rassa. In the night between 29 and 30 October 2018, a 0.1 m
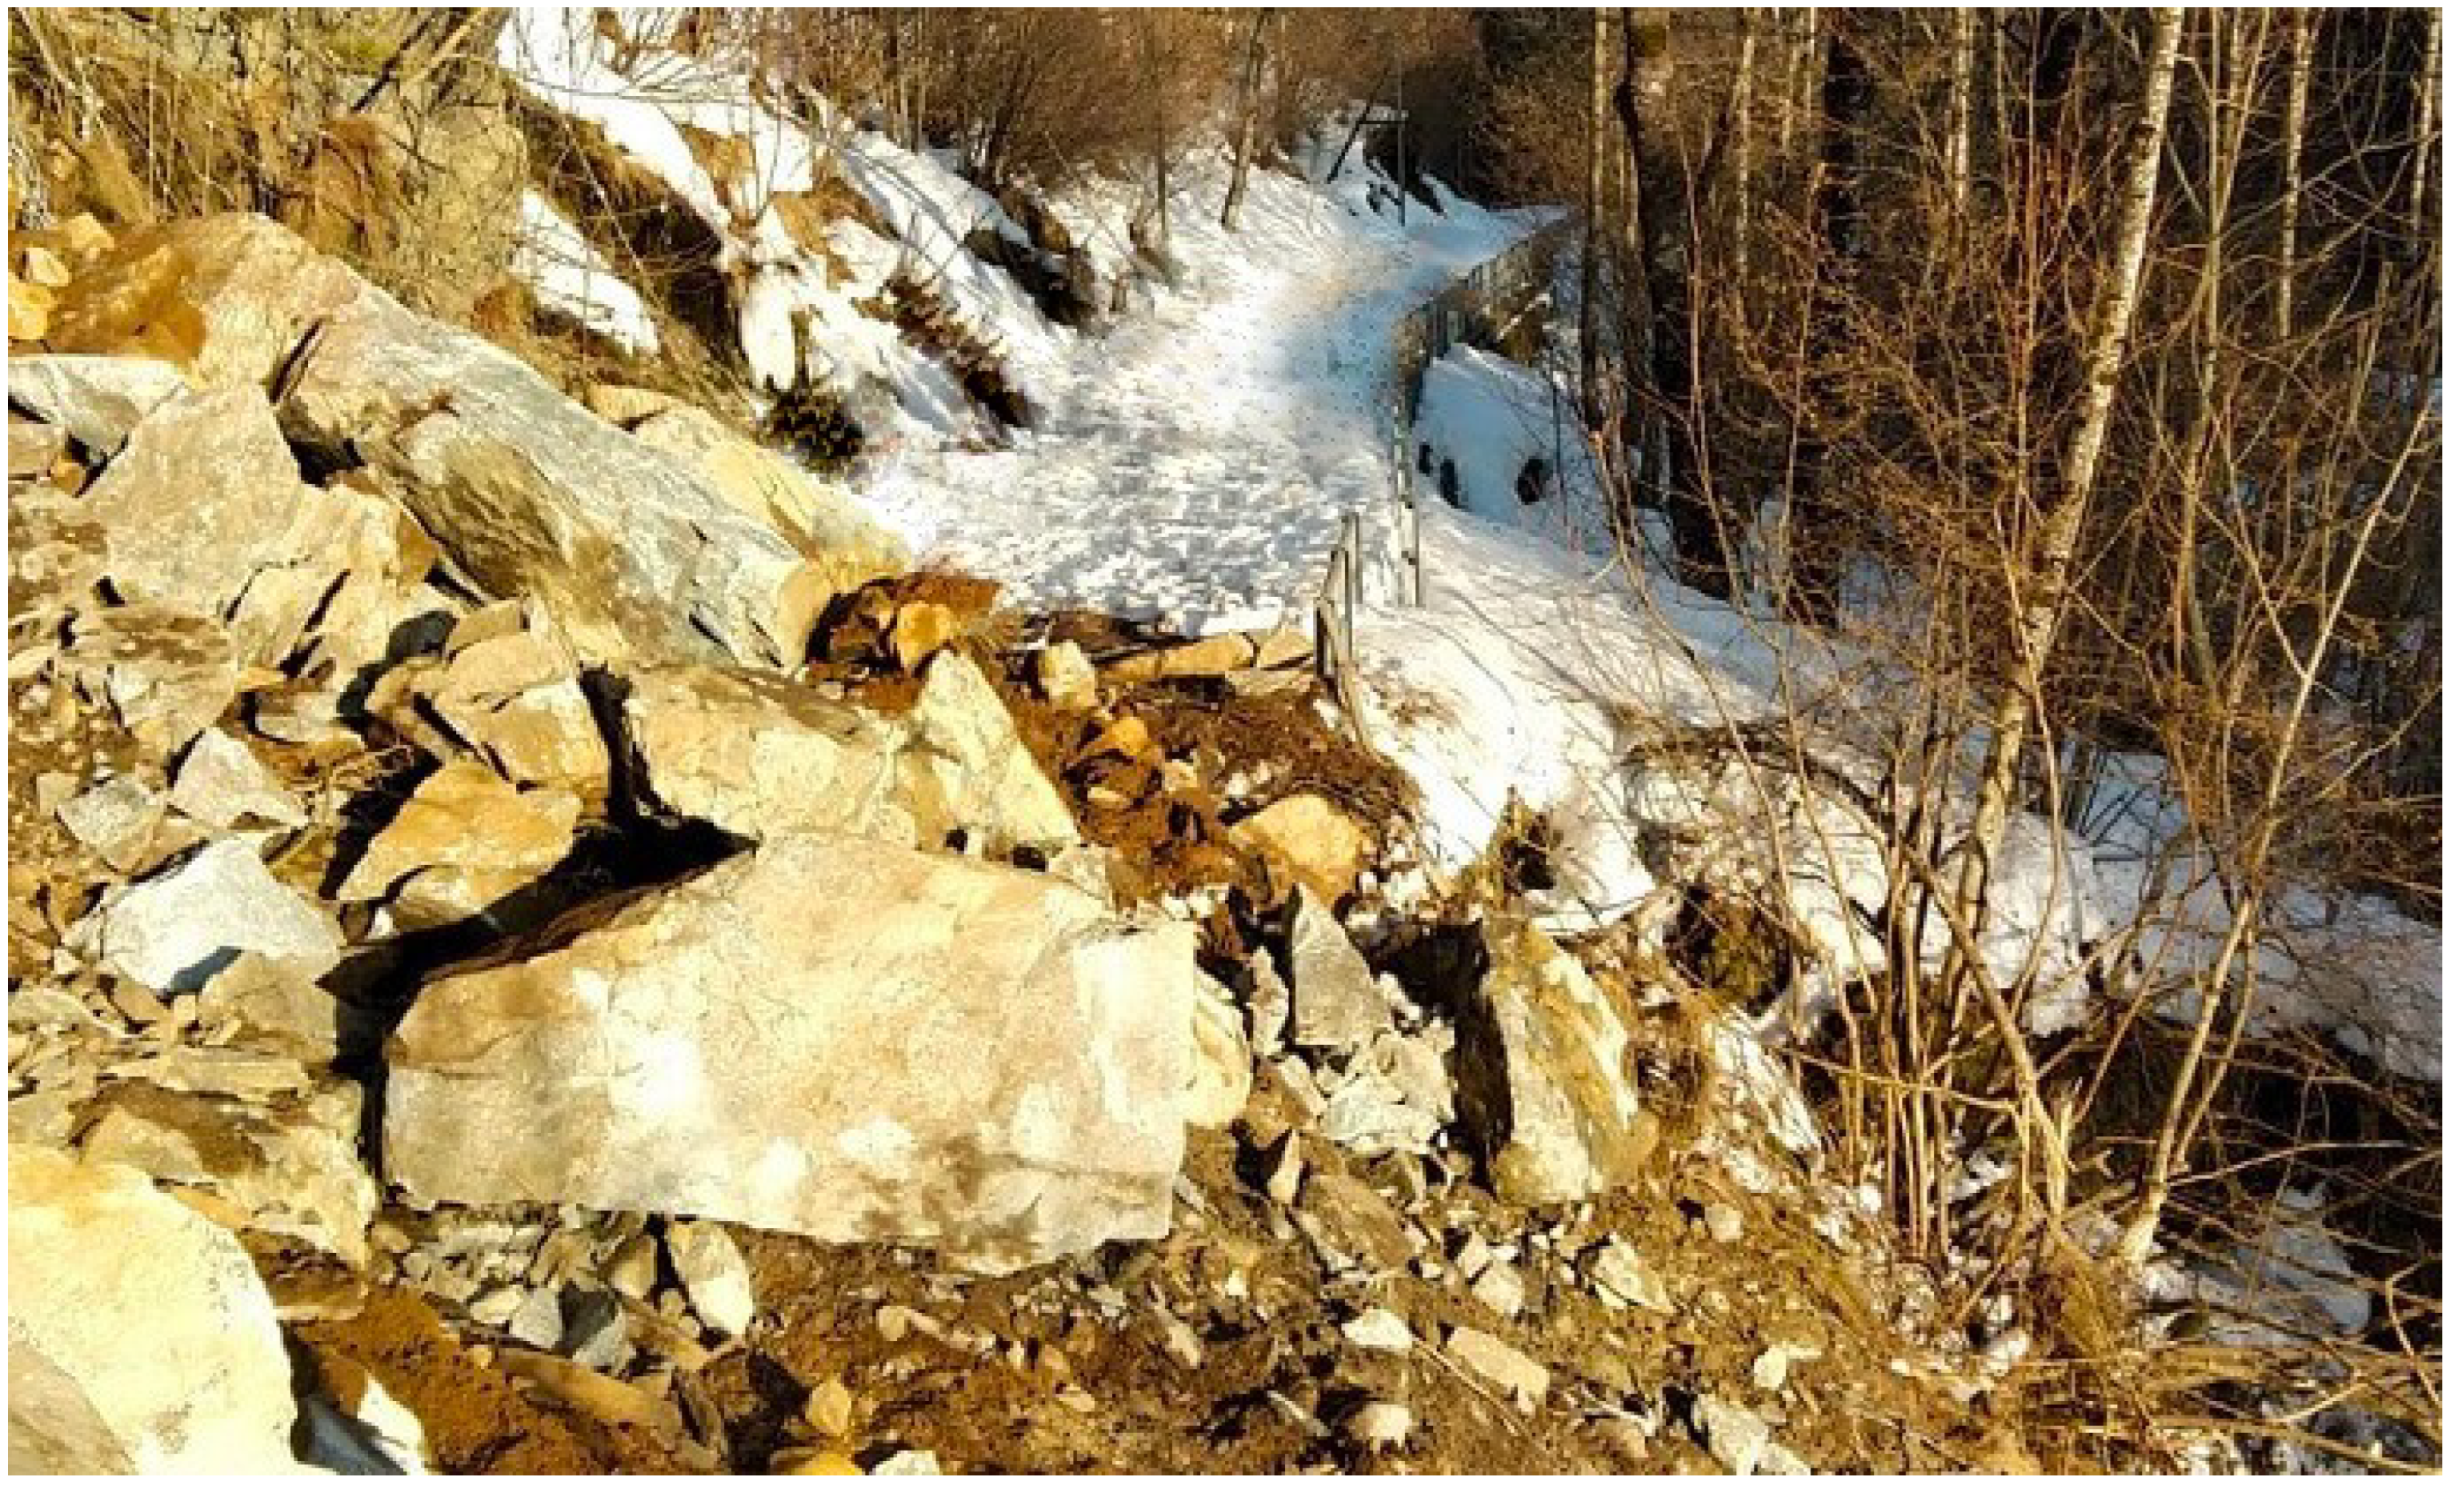
3 rock block detached from a height of about 990 m a.s.l. and traveled 100 m until reaching the courtyard of the parish church of Rassa without causing any sort of structural damage. On 21 February 2021, a rockfall event destroyed the snow-covered road that leads from Rassa to the hamlets of Piana and Rassetta. Several blocks fell down, and the average characteristic block volume was about 1 m
3 (
Figure 2).
It is possible to deduce that no complete information about the landslide volume and typology could be drawn.
4. Results and Discussion
This section presents the application and some general results of the proposed methodology to the Sorba Valley case study.
4.1. Hazard Assessment
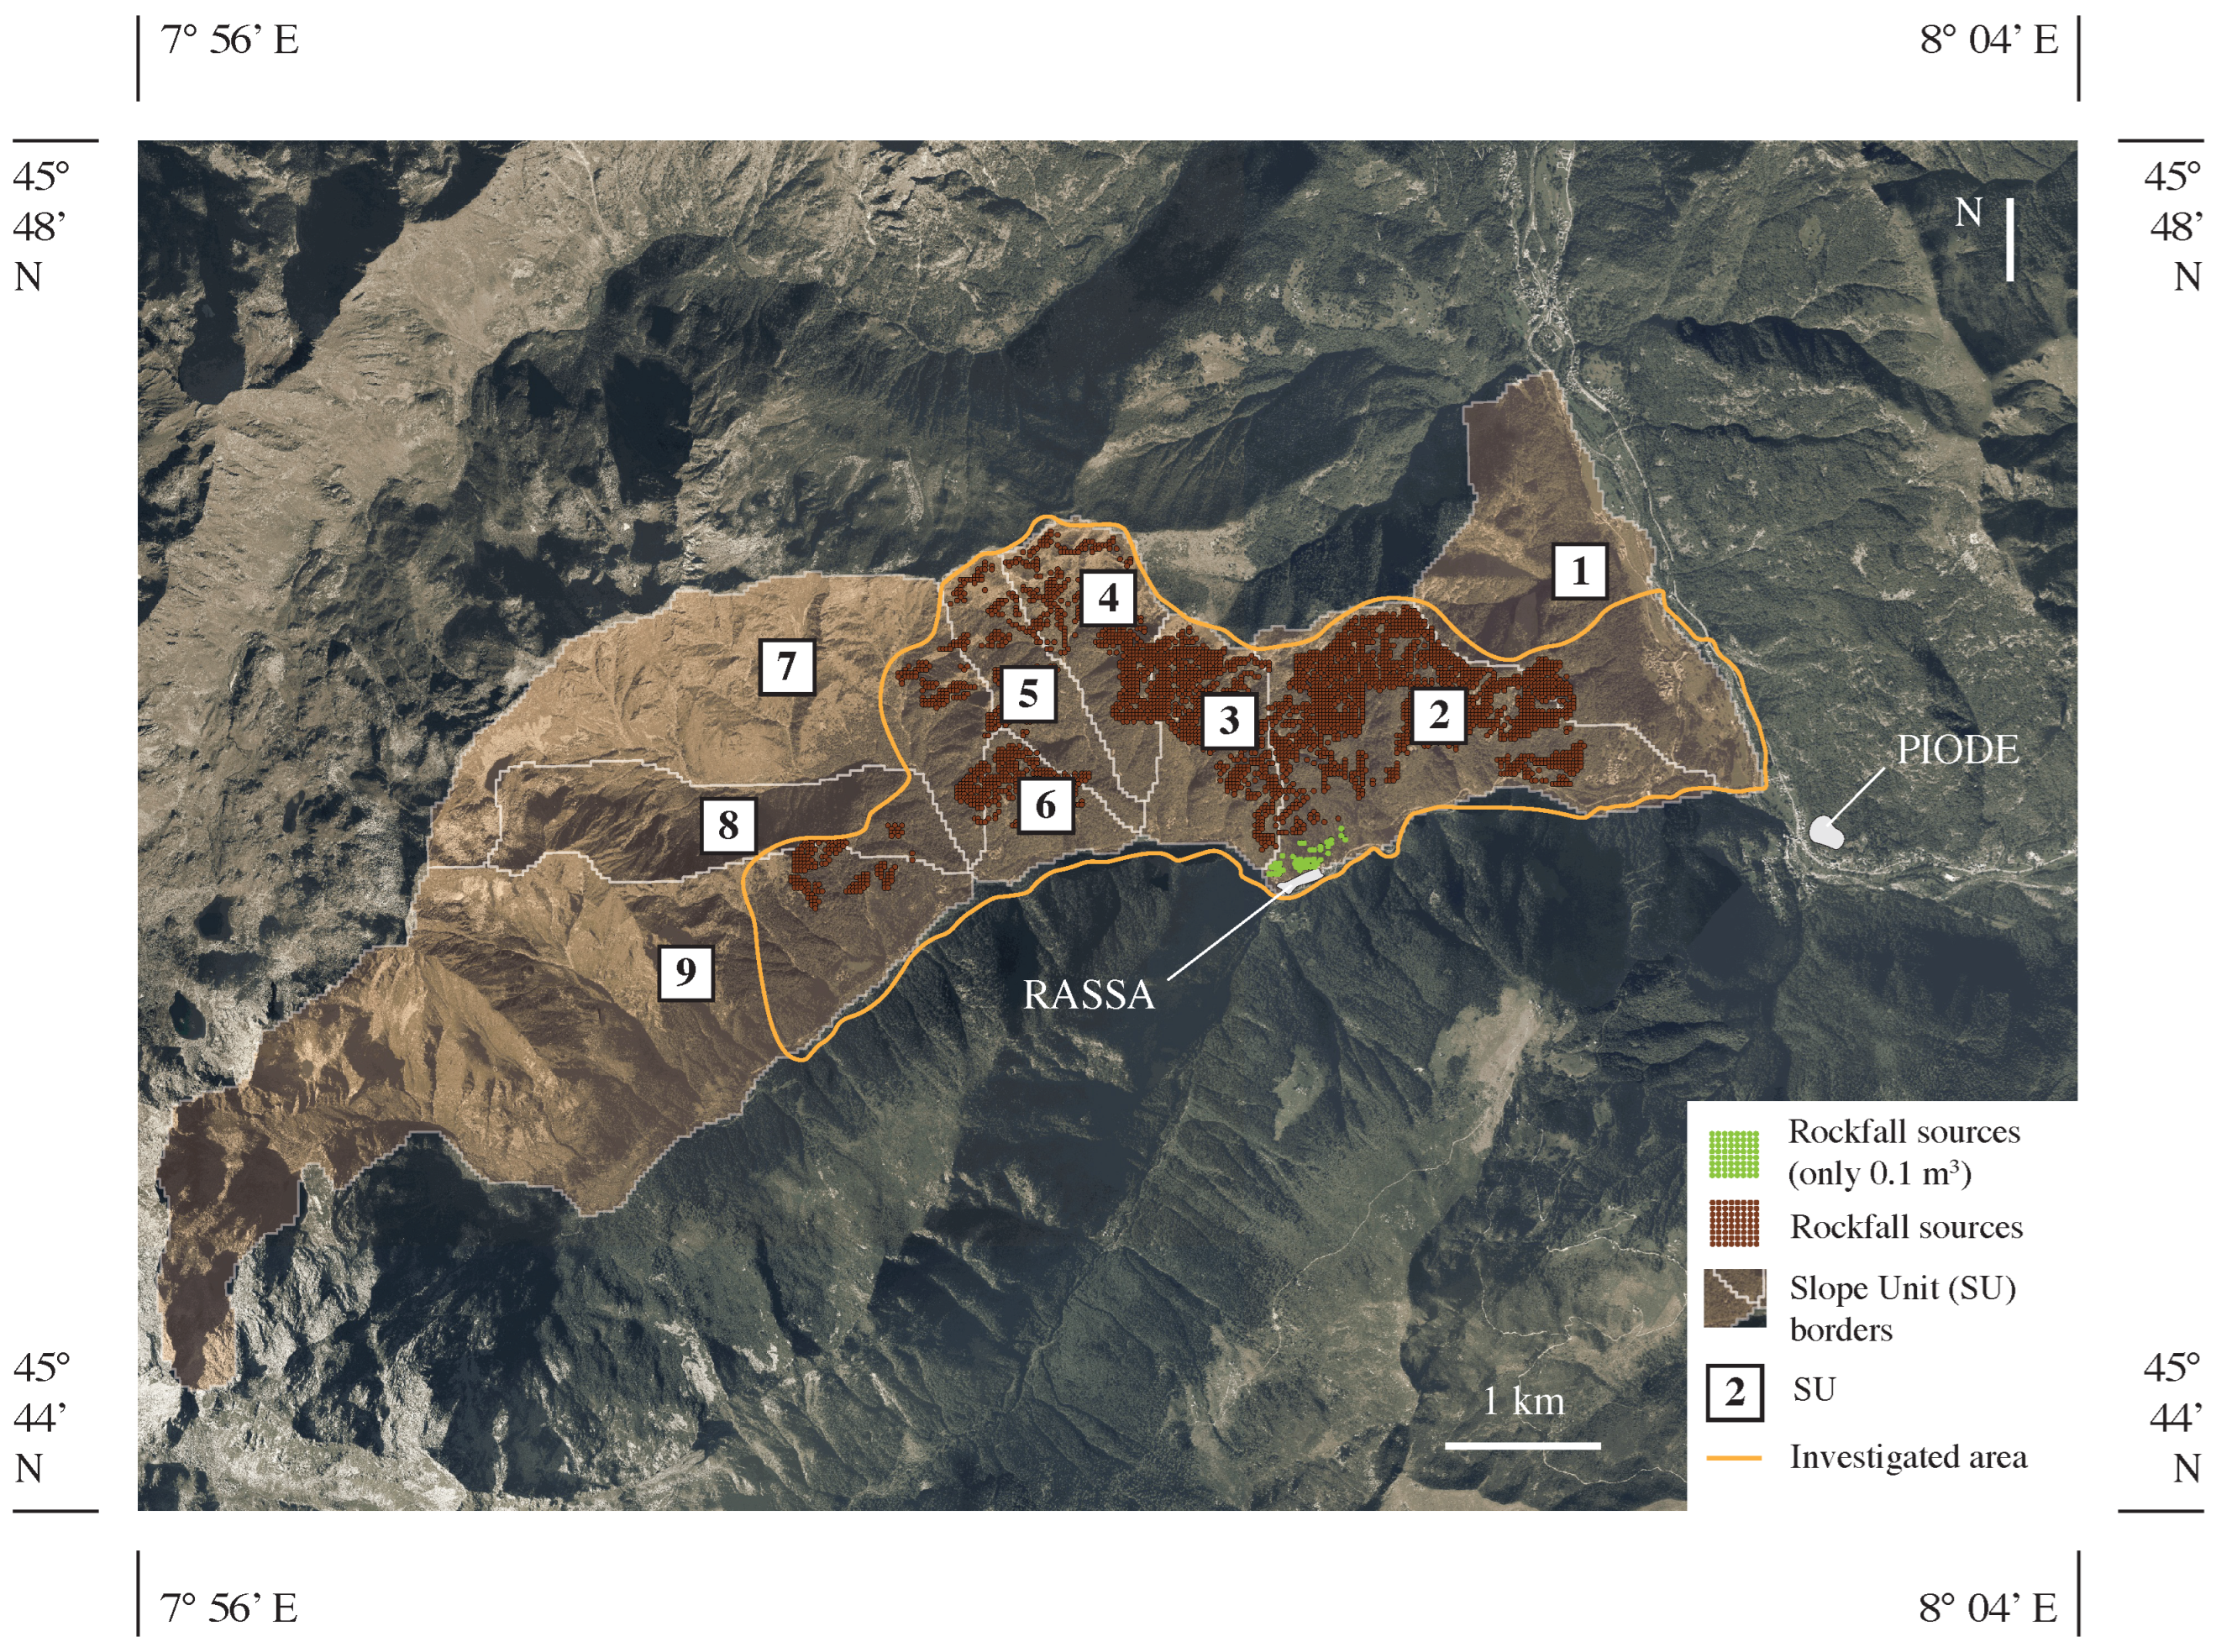
Hazard analyses and risk calculation were performed with reference to three design scenarios that differed in the volume of the design block associated with the detachment sources. The design volumes were assumed according to the size of the blocks lying on the slope, on its toe, and those involved in the recorded past events near Rassa village. The source areas were identified by combining the results of a morphological analysis and direct observations on-site (
Figure 3). Two source areas were identified: one located just above the village of Rassa, and one located at higher altitudes on the slope overlooking the town and the provincial road.
The three analyzed scenarios are:
Scenario 1: volume of the design block equal to 0.1 m3 for all the source points considered.
Scenario 2: volume of the design block equal to 0.1 m3 for the source points just above Rassa and 0.5 m3 elsewhere.
Scenario 3: design block volume equal to 0.1 m3 for the source points just above Rassa and 1 m3 elsewhere.
As described in detail in [
20], hazard analyses with the QPROTO plugin require the association to each source point of the corresponding values of elevation, aspect, block mass, energy angle, lateral spreading angle and visibility distance. The elevation and aspect values were determined by analyzing the DTM of the area under examination, available on the geoportal of the Regione Piemonte in 5 × 5 m raster format. Block mass values were assigned with reference to the three scenarios described above. The value of the energy angle was defined for each source point according to the procedure proposed by [
20]. The value of the lateral spreading angle was assigned to be equal to 10° for all the source points. This choice was based on the results obtained by [
20], which showed a negligible influence of LA on the QPROTO results, and that a value equal to 10° almost always provides good results.
Lastly, the visibility distance was set to 999 m for all source points, i.e., the maximal value that could be entered in QPROTO, as the difference in height between the source points and the elements at risk (provincial road and Rassa village) was in some cases very high, exceeding 1000 m.
4.1.1. Identification and Characterization of Rockfall Sources and Propagation Areas
The identification of rockfall-prone source areas at a medium–large scale is a challenge [
11]. Among the methods that can be used for this purpose, it is possible to detail two classes. The first one concerns the specific and detailed statistical analyses of the morphology using high-resolution DEM (HRDEMs), field surveys, orthophoto interpretation, etc., aimed at identifying probabilistic active prone areas [
22,
23]. The second is a simplified morphological procedure aimed at identifying a slope threshold from which unstable areas may be extrapolated [
24].
These two approaches can be referred to at different scales as they are based on the different quantities and qualities of required information. In this study, reference was according to the large scale, and no detailed information was available. While detecting the rockfall source areas, the following items were then considered:
DTM cells showing a slope threshold greater than 45° were considered as potential rockfall source areas.
Source points were sharpened, choosing only those that, through orthophotoanalysis, were in rocky outcrops without vegetation.
A set of points with slope lower than 45° were added to the source dataset to account for some historical information and a geostructural analysis, which indicates the possibility of block detachment in the area above Rassa village.
One source point at 20 m was considered to reduce the computation time for the application at large scale. Moreover, this choice was based on the observation that some test analyses carried out using other distances (e.g., 5 and 10 m) provided negligible differences in the results with reference to the adopted 20 m simulations.
As a result, for the entire site of the Sorba Valley, with an extension of about 11 km2, 3671 rockfall source points were considered. Such points can be clustered into homogeneous source areas with constant cone parameters according to geomorphological conditions of the slope.
According to [
20], the following step is the definition, the characterization of homogeneous areas, and the association with the energy angle. The angle is a function of several parameters defining the slope (i.e., inclination and forest density) and the block (i.e., volume and shape). For the definition of homogeneous areas, slope unit polygons (SUs) proposed by [
25] were referenced here using r.slopeunits software (a GRASS GIS module). The procedure led to the optimization of the algorithm for the terrain subdivision of Italy into SUs by means of a comparison among terrain elevation, slope, drainage density, and lithology. The potentiality of the method is the ability to divide a large and complex landscape into a mosaic of SUs using only terrain information that can be obtained from a DEM. In the analyzed area, nine SUs could be identified (
Figure 3); the slope of the source areas and those included under the sources for each SU were analyzed. The median was chosen as the characteristic value for the slope angle. Subsequently, for each volume scenario, the energy angle was calculated using the results reported in [
20] for each median SU slope inclination and for a forested slope (
Table 1).
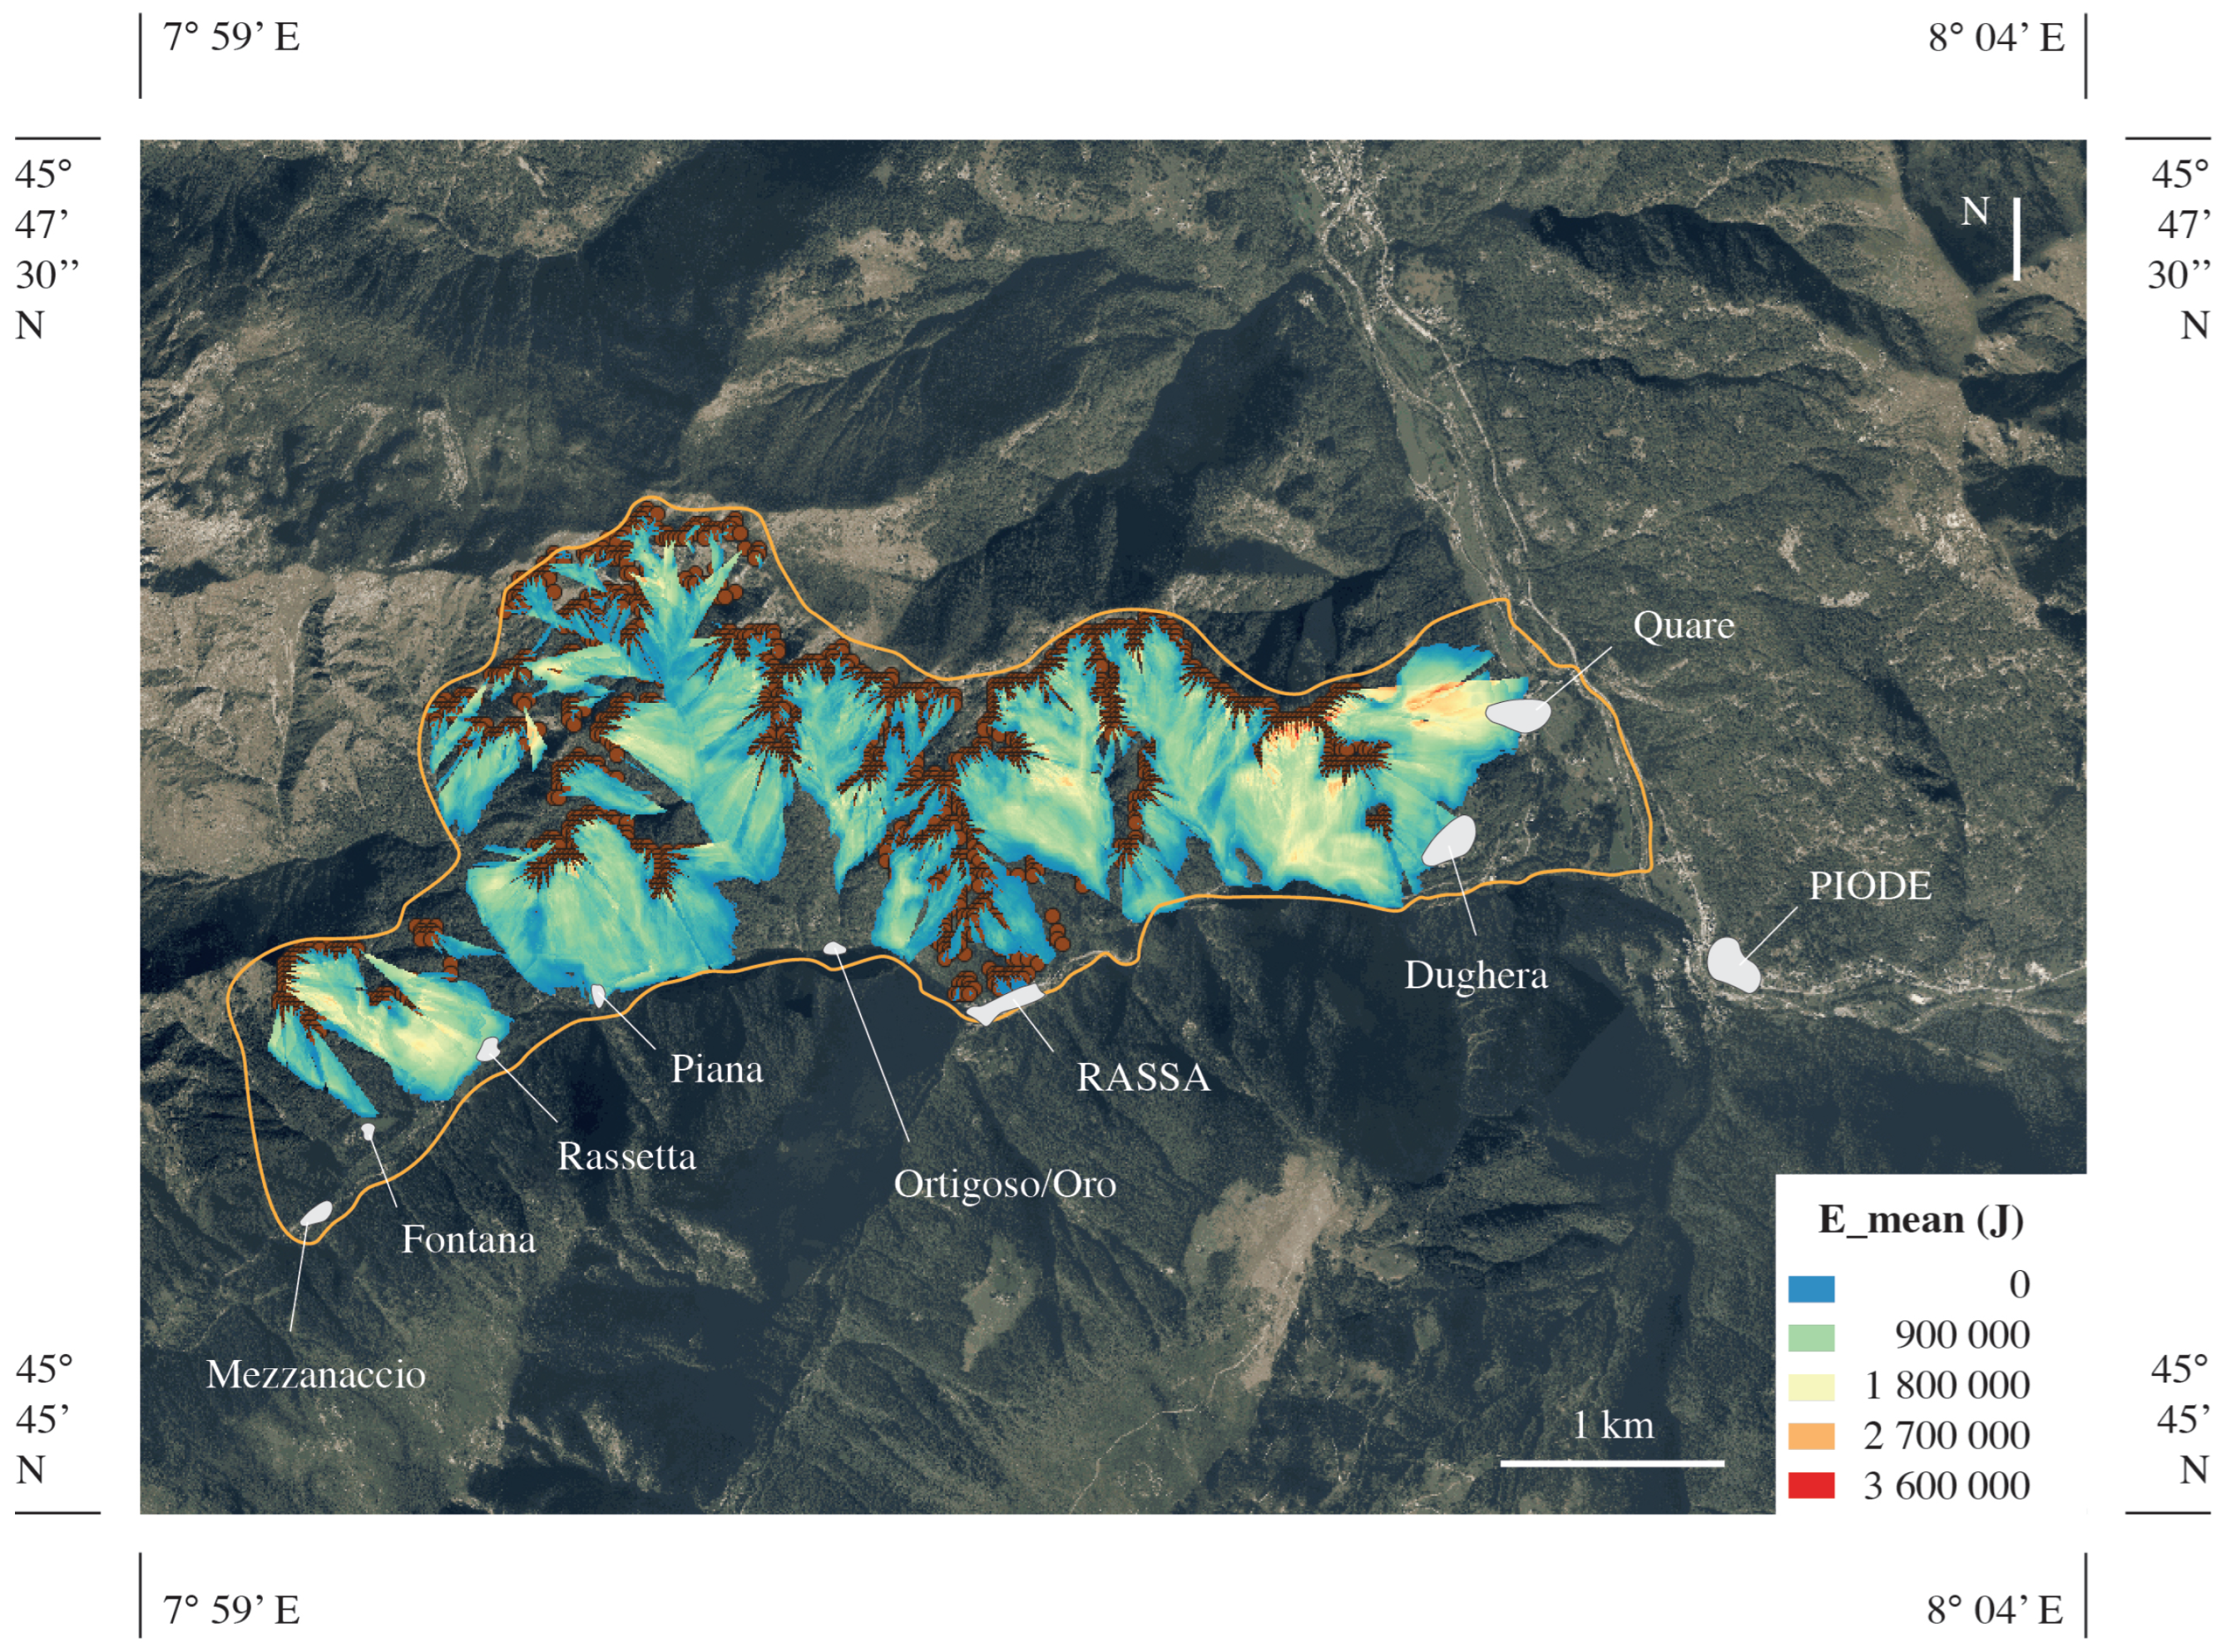
4.1.2. Computation of Time-Independent Spatial Hazard
The results are reported here with reference to Scenario 3. The map of the mean energy involved in the phenomenon (E_mean) in
Figure 4 shows that the most affected zones were Rassetta, Piana, Dughera, Quare, and the stretch of PR82 road between Rassa and Dughera. The Rassa Valley is hit with energies lower than 50 kJ, according to the October 2018 event.
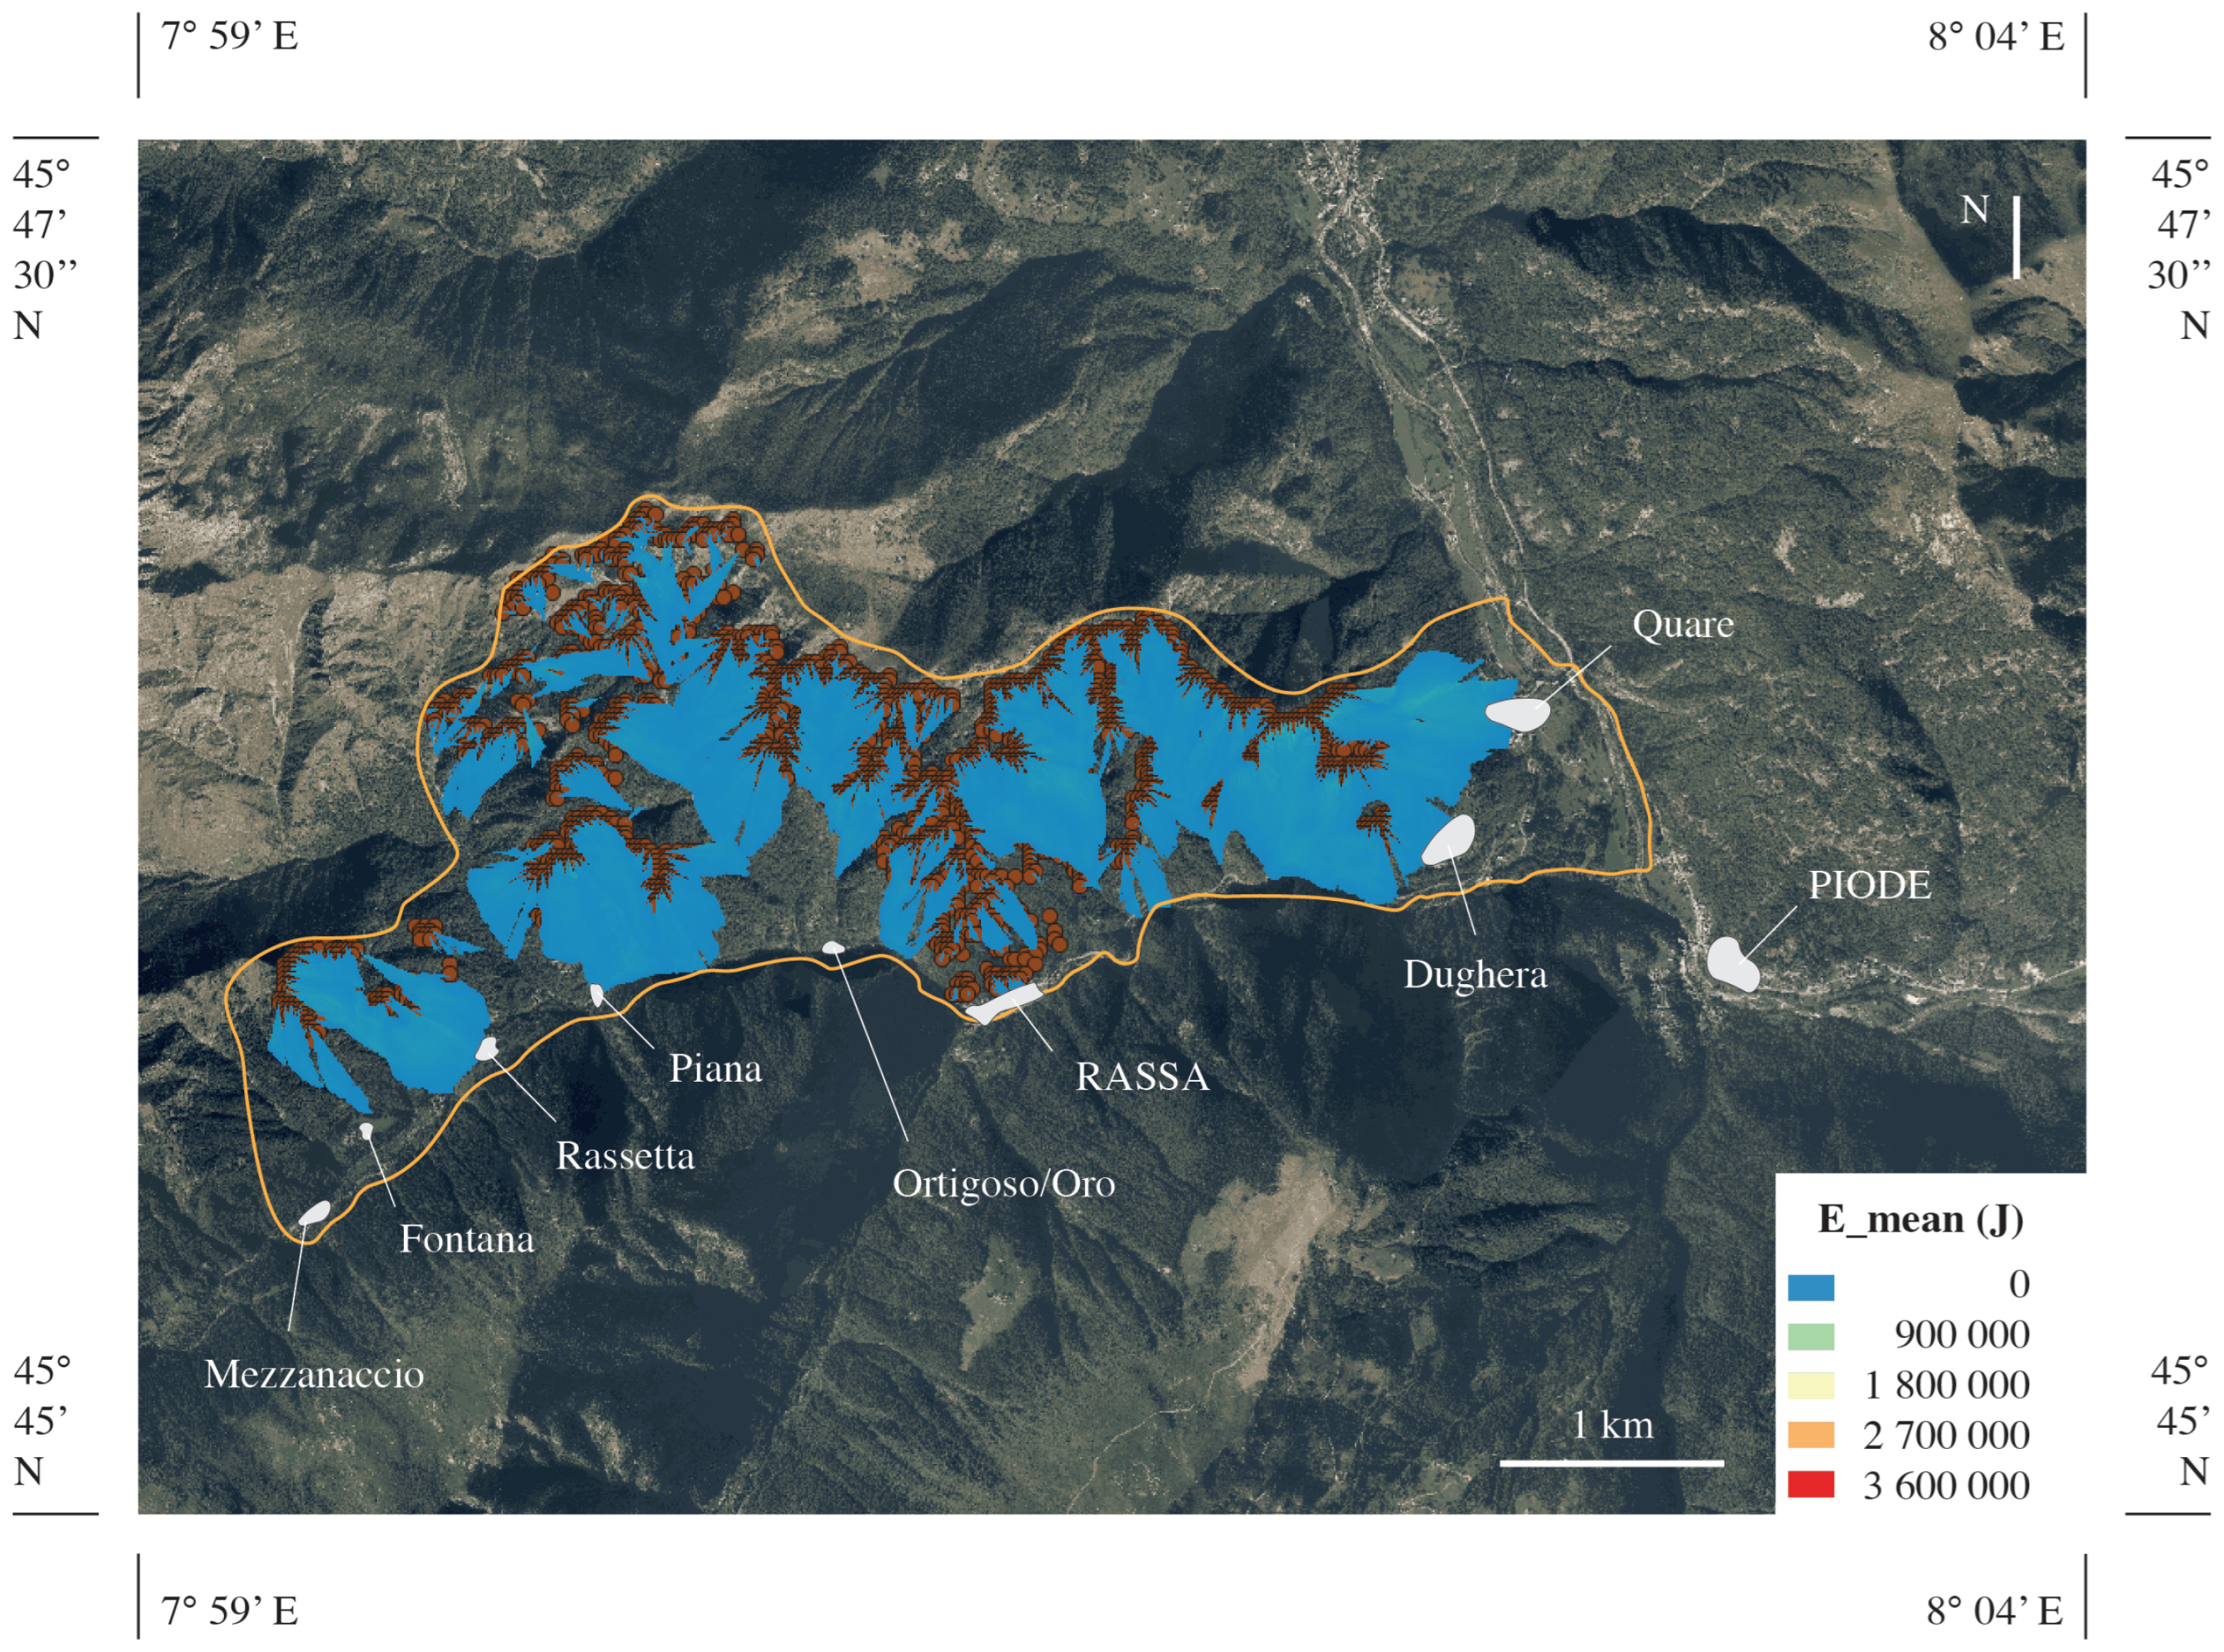
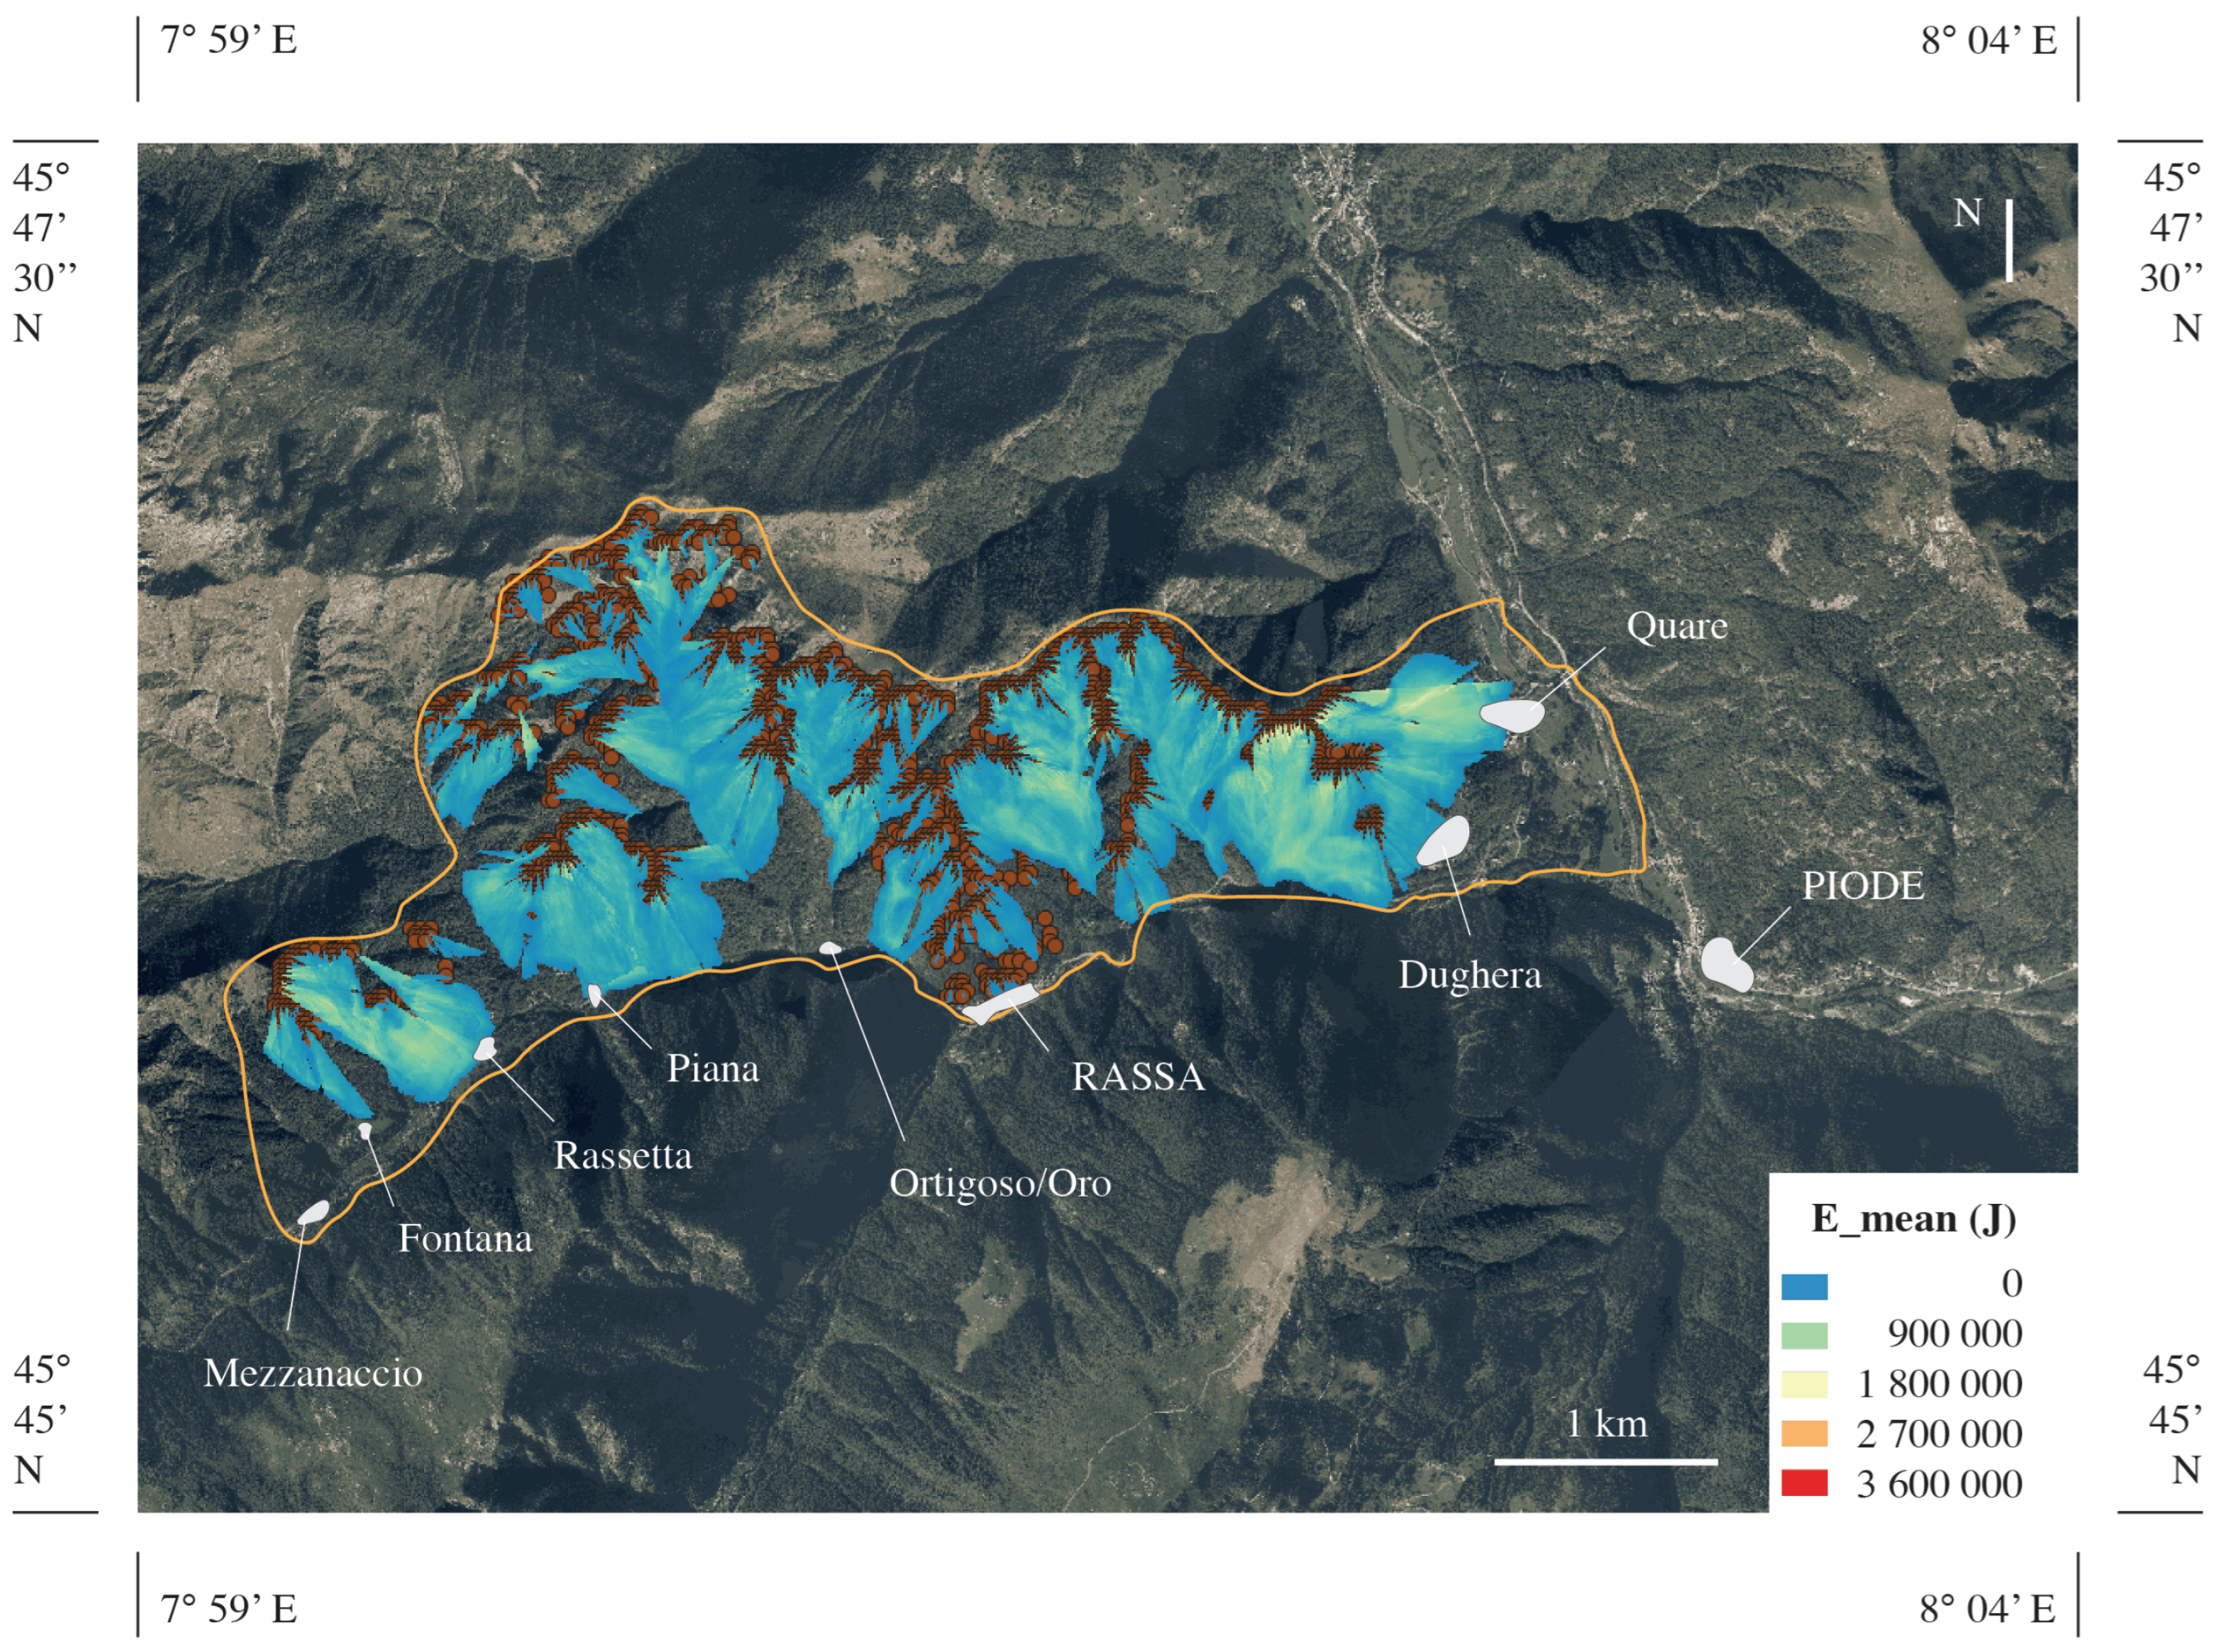
Figure 5 and
Figure 6 show the results related to the other two scenarios. In general, the difference was mainly in terms of mean kinetic energy, whereas the invasion zones were about the same.
4.2. Damage Analysis and Risk Assessment
This section presents the computation of physical, social, and total risks over the examined area according to the IMIRILAND methodology. For each scenario, the runout map was used to define the involved area and elements at risk. They were recognized using territorial data, such as the land use maps provided by the Regione Piemonte Geoportal. Exposed elements were classified according to the intended use (
Table 2 and Table 5).
In this work, no consideration was given to the environmental aspects of risk, as no significant environmental elements were found. Economic aspects of risk were not considered, as the small number of economic activities present in the area under examination and the limited information available in this regard did not allow for the execution of an appropriate multidisciplinary detailed study.
4.2.1. Physical Risk
The physical (or structural) risk was computed here starting from the assessment of the physical worth of the element at risk, and its exposure and vulnerability. Within the investigated area the physical risk mainly refers to the buildings (main centers and their hamlets) and to the roads (main paved and dirt roads).
The physical worth was identified by assigning an index to each typology of element identified in land use map BDTRE—Regione Piemonte (
Table 2).
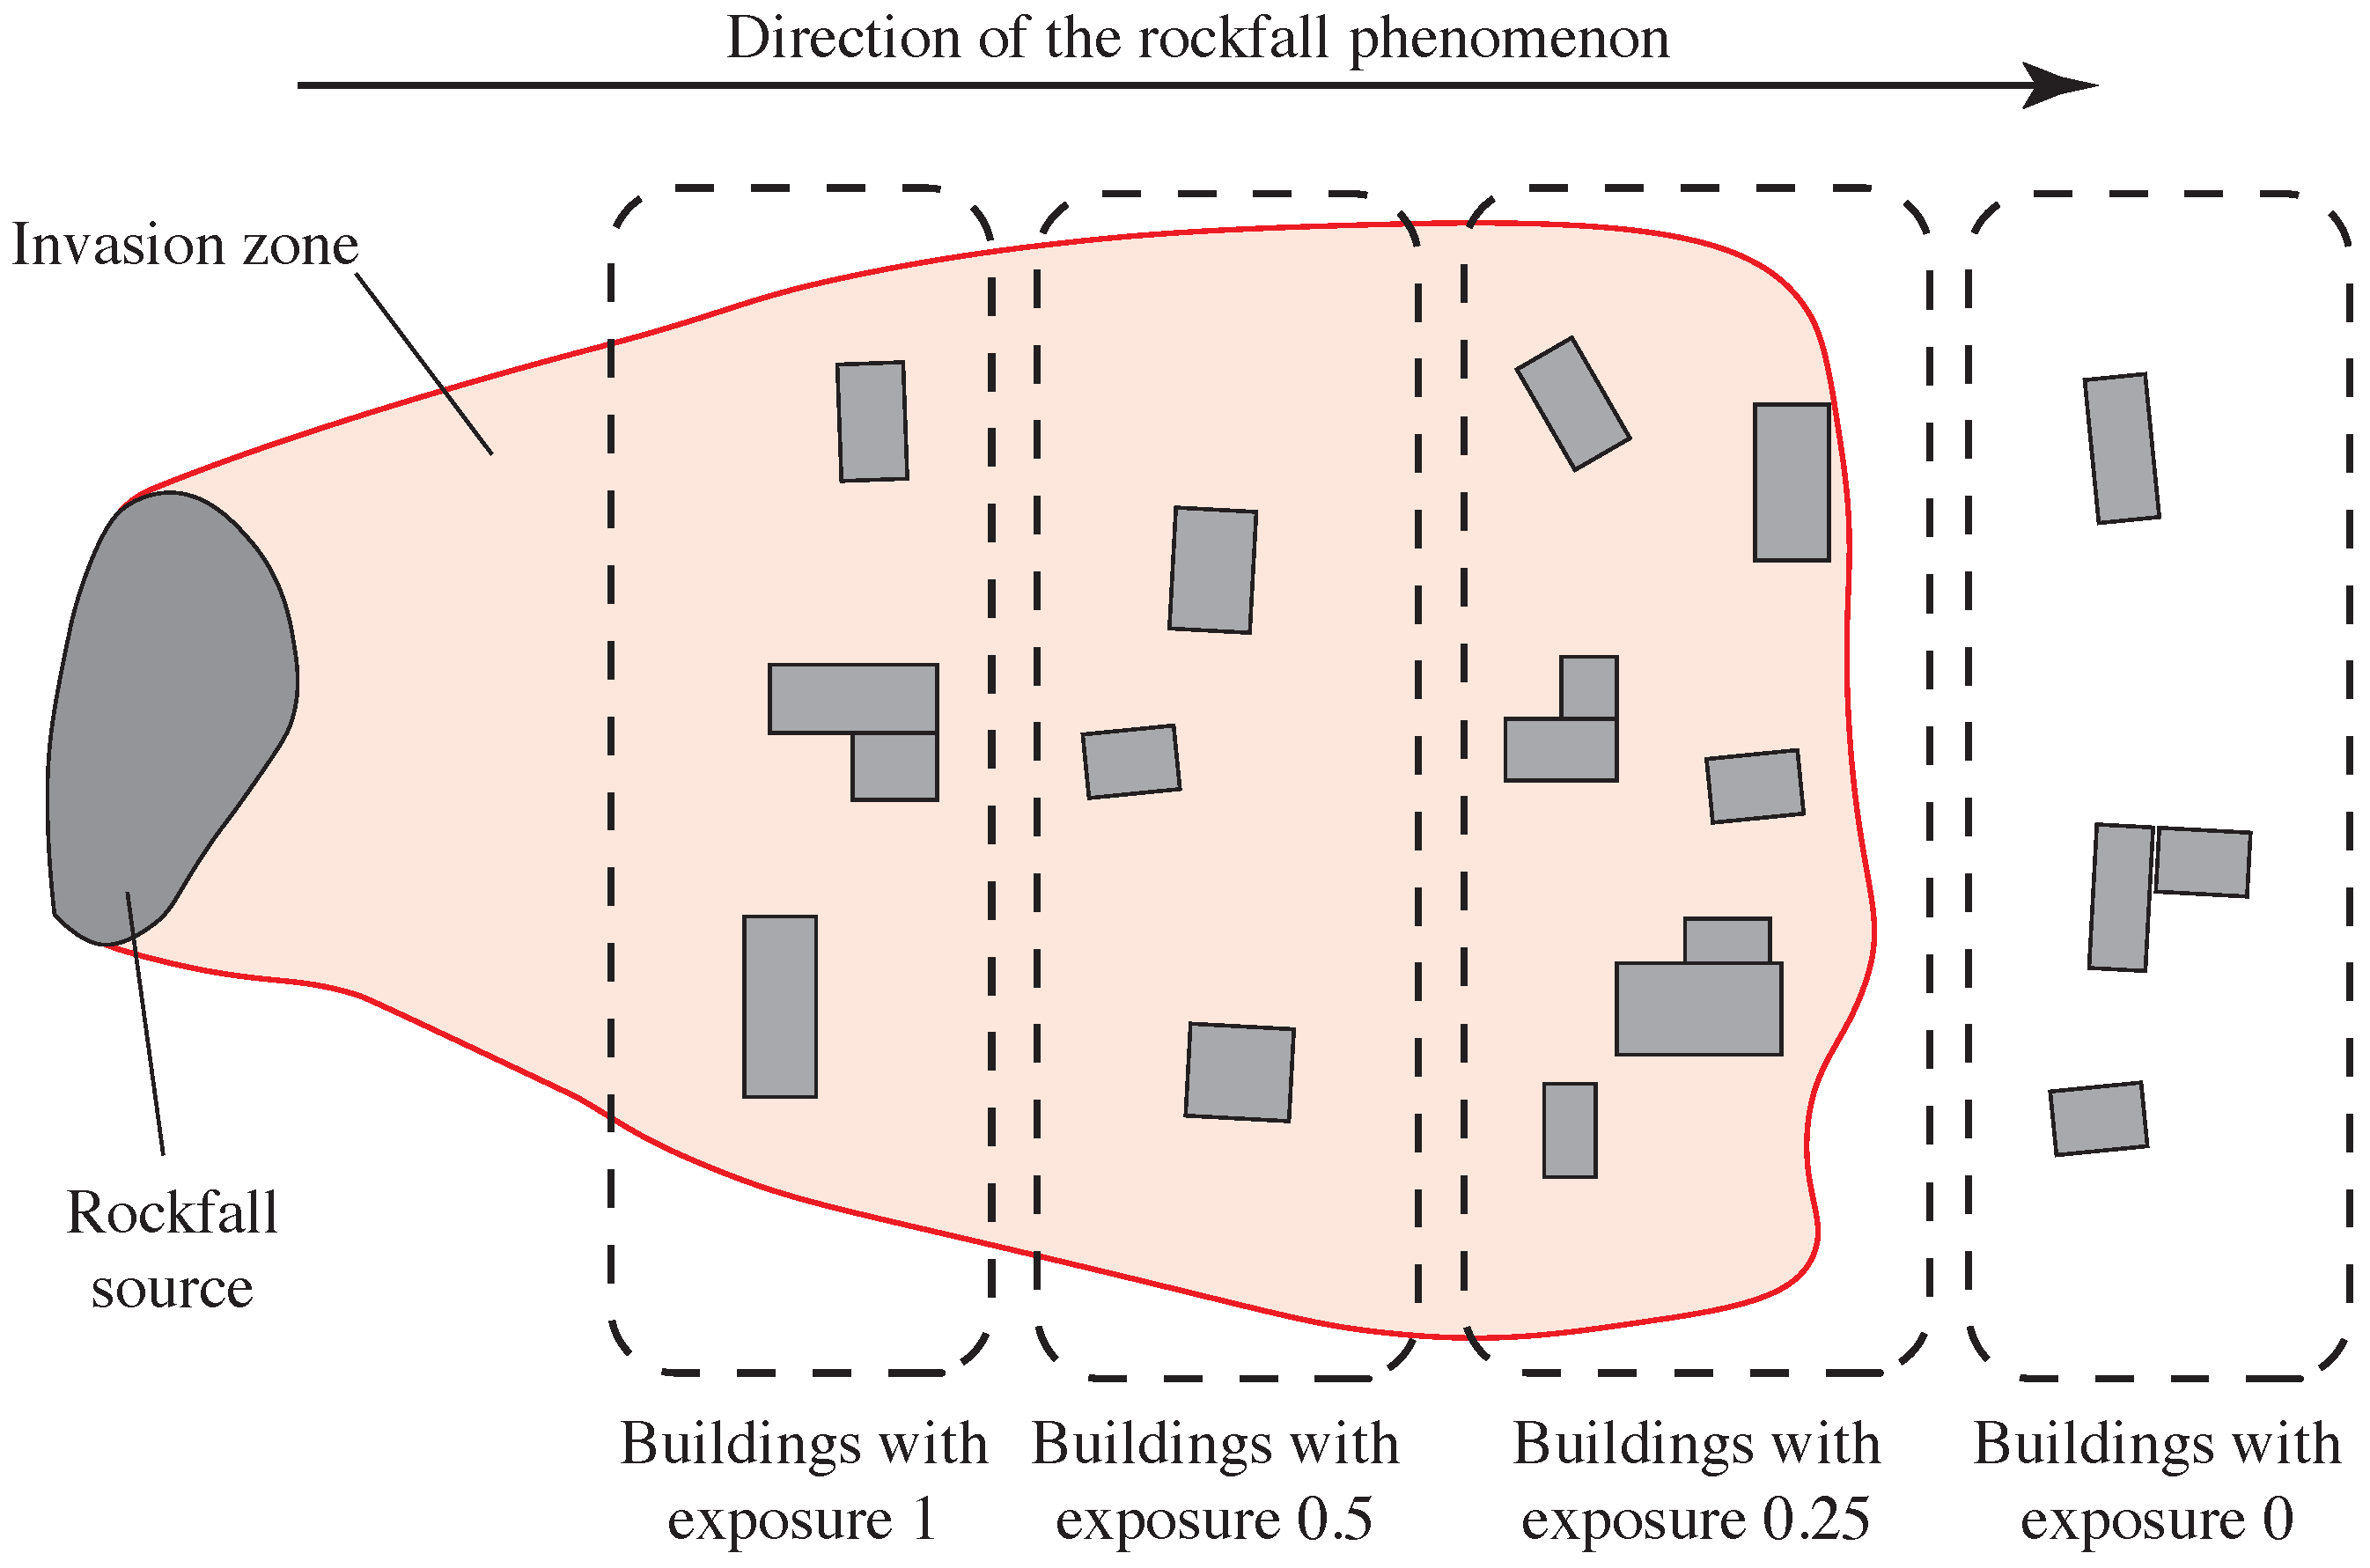
Physical exposure was defined for each hazard scenario with reference to the computed runout area. For both buildings and roads, those located outside the invasion zone were assigned nil exposure. The buildings located within the invasion area were characterized by maximal exposure (i.e., 1) if they were directly seen by the rockfall sources (i.e., buildings are the closest starting from the rock face, in the first row of distance). The buildings that were partially hidden by others with respect to the rockfall source were characterized with 0.5 exposure if they were hidden by a single row of structures, or 0.25 if they were hidden by two or more rows of other buildings. In this way, the distance of the building from the rockfall source and he mitigation effect of other structures directly influence the exposure (
Figure 7).
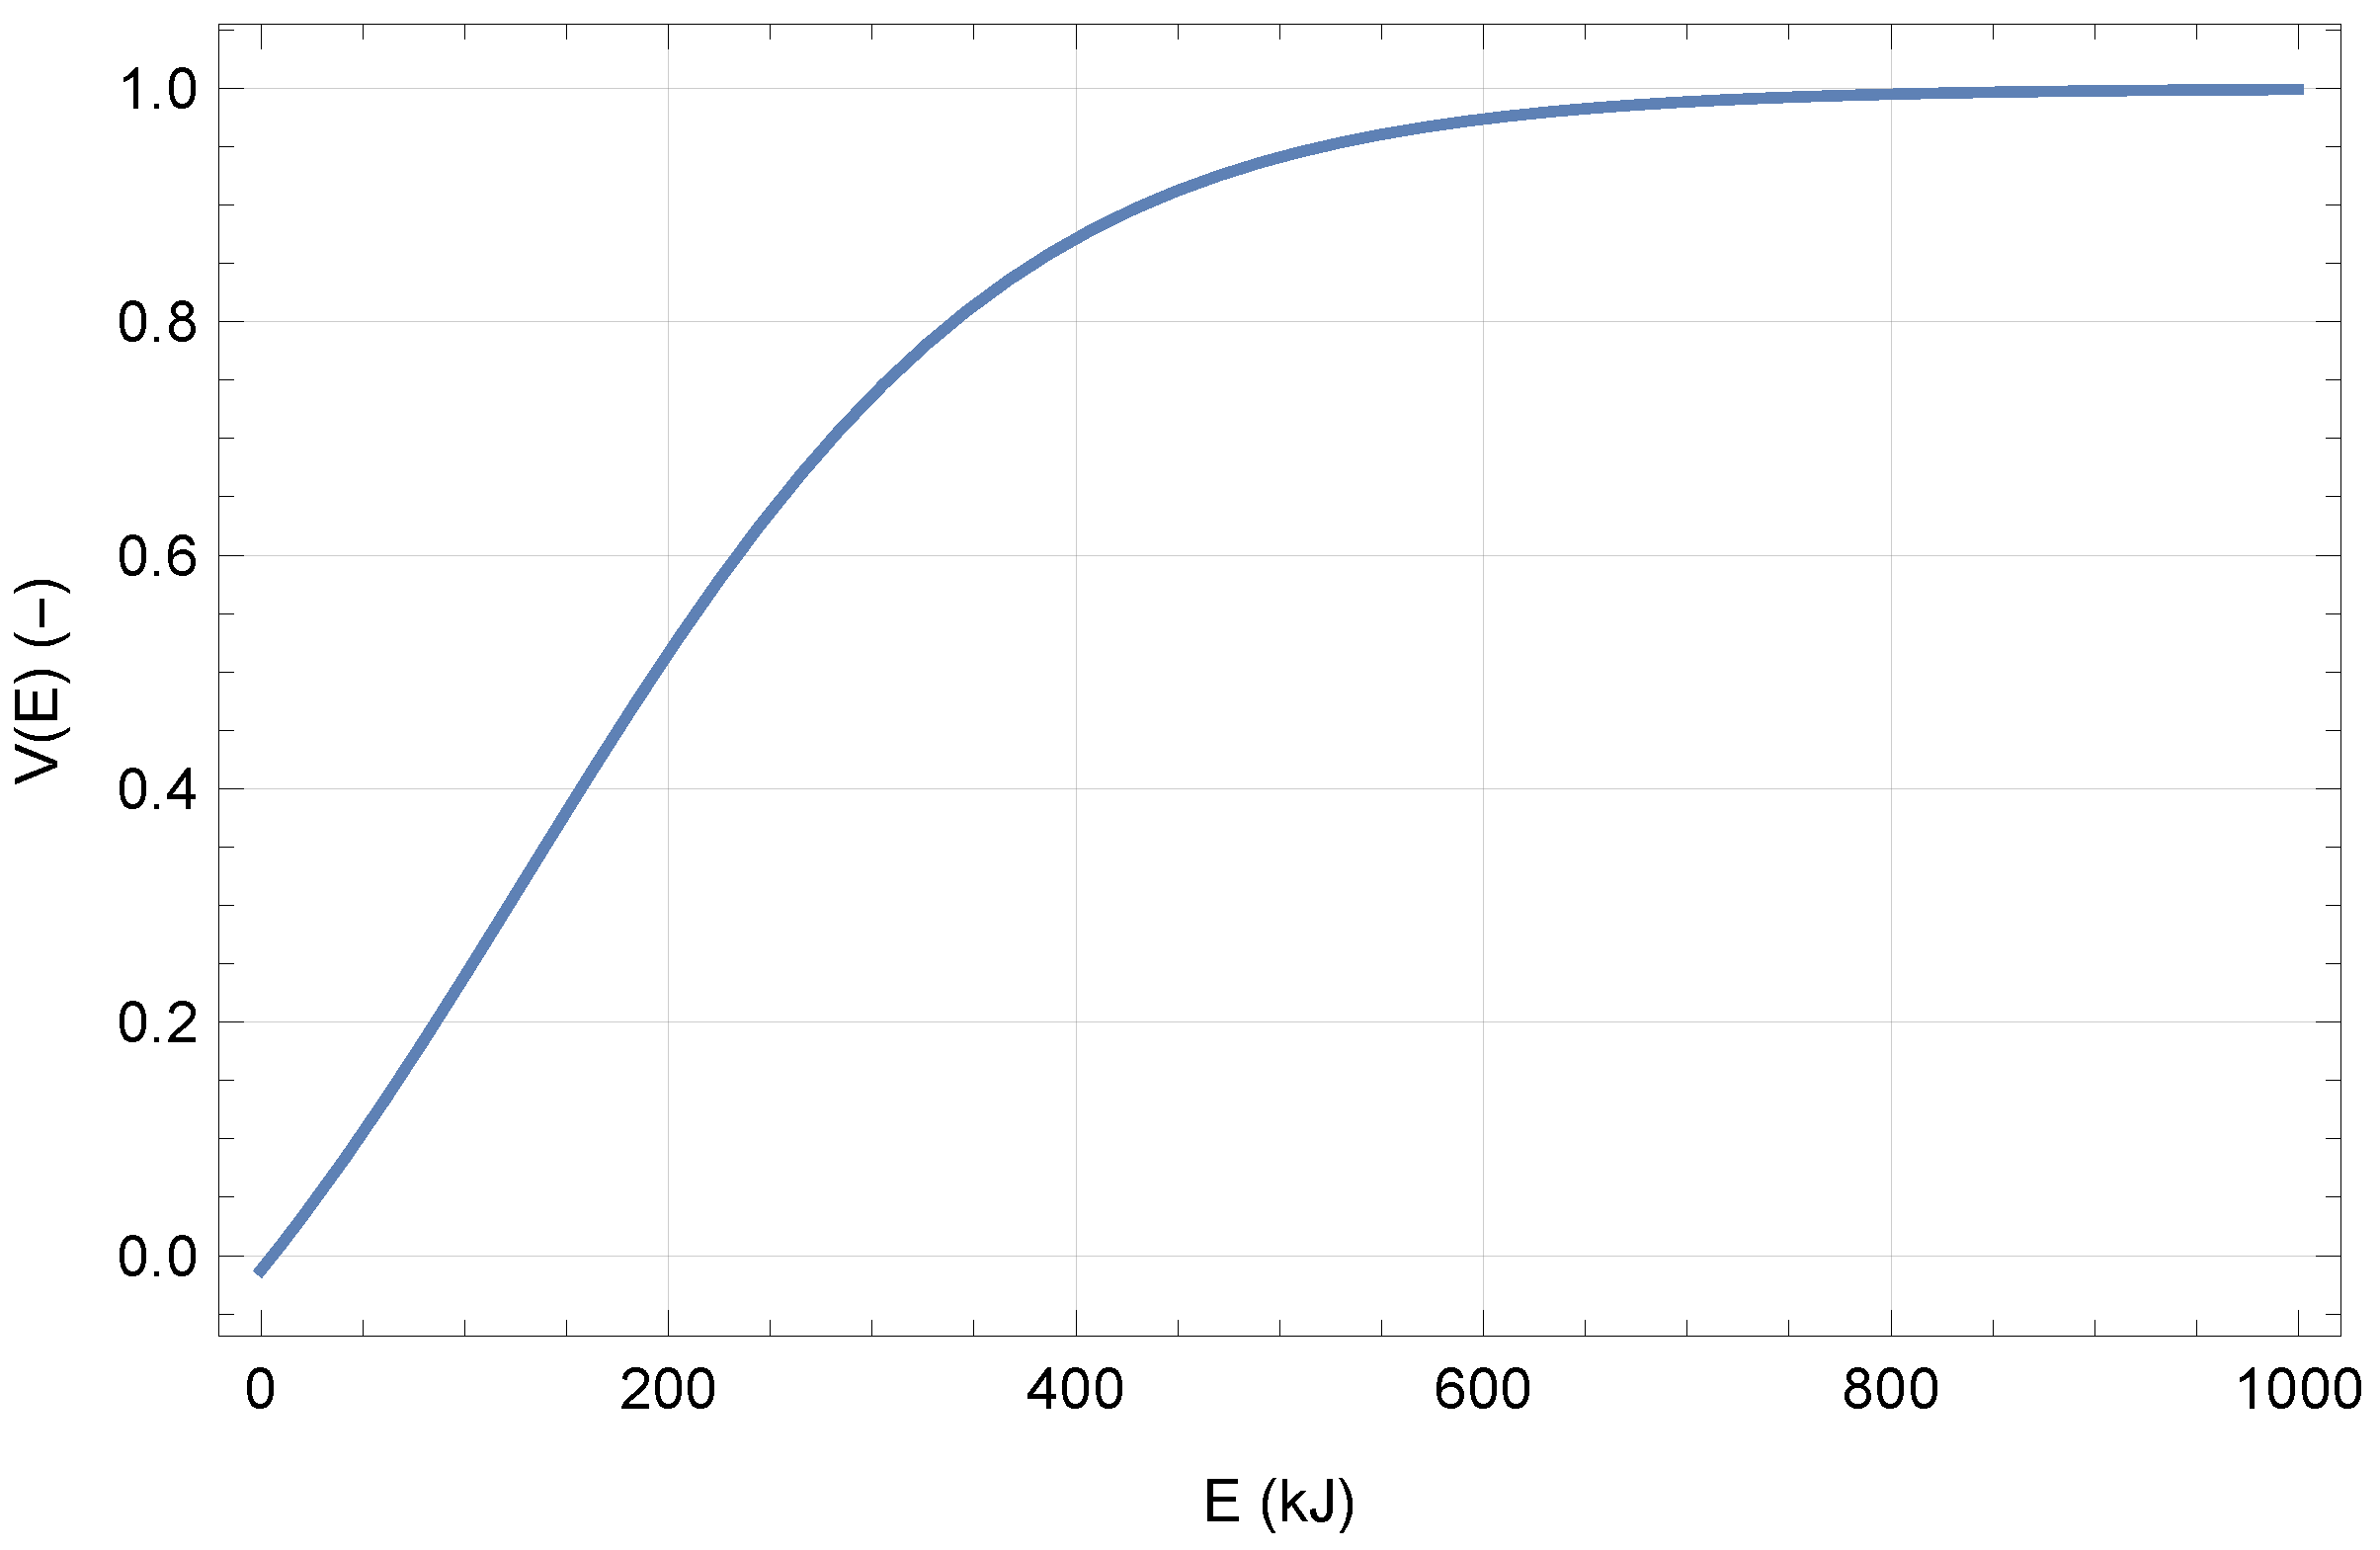
The physical vulnerability was computed in different ways depending on the typology of the element at risk. In the case of buildings, the empirical vulnerability function elaborated by [
26] was used:
where
E is the kinetic energy (in J), and
the corresponding physical vulnerability.
Figure 8 shows the graph of this function that was elaborated starting from on-site observations of the structural degree of loss with reference to the case study of the Fiumelatte rockfall event (Lecco, Italy, 2004). The model fits a certain number of data, and establishes a direct dependence between vulnerability and impact energy. This function was chosen because the typology of buildings in Rassa and Fiumelatte, and the kinetic energy obtained in propagation models of the two sites were similar. Five levels of physical vulnerability were considered in this work, as shown in
Table 3. No structural damage is expected for impact energy lower than 50 kJ, while the global collapse of the structure happens for energy greater than 400 kJ. In the case of buildings that fell into cells with different energy values, the maximum was selected to define the building vulnerability. The same approach was followed for the social vulnerability.
Regarding roads, a simple elastic impact model was adopted to calculate the height of the scar produced by the impact of a rock block on the asphalt with a given impact energy. Adopting Clapeyron’s theorem of linear elasticity and using a Winkler model for the contact soil–road foundation (with the modulus of substrate reaction
MPa/m), the vulnerability classes reported in
Table 4 were defined. To be conservative, a vulnerability equal to 1 was used for dirt roads, regardless of energy level. This assumption was due to the consideration that dirt roads are easily damaged even with related low-intensity phenomena.
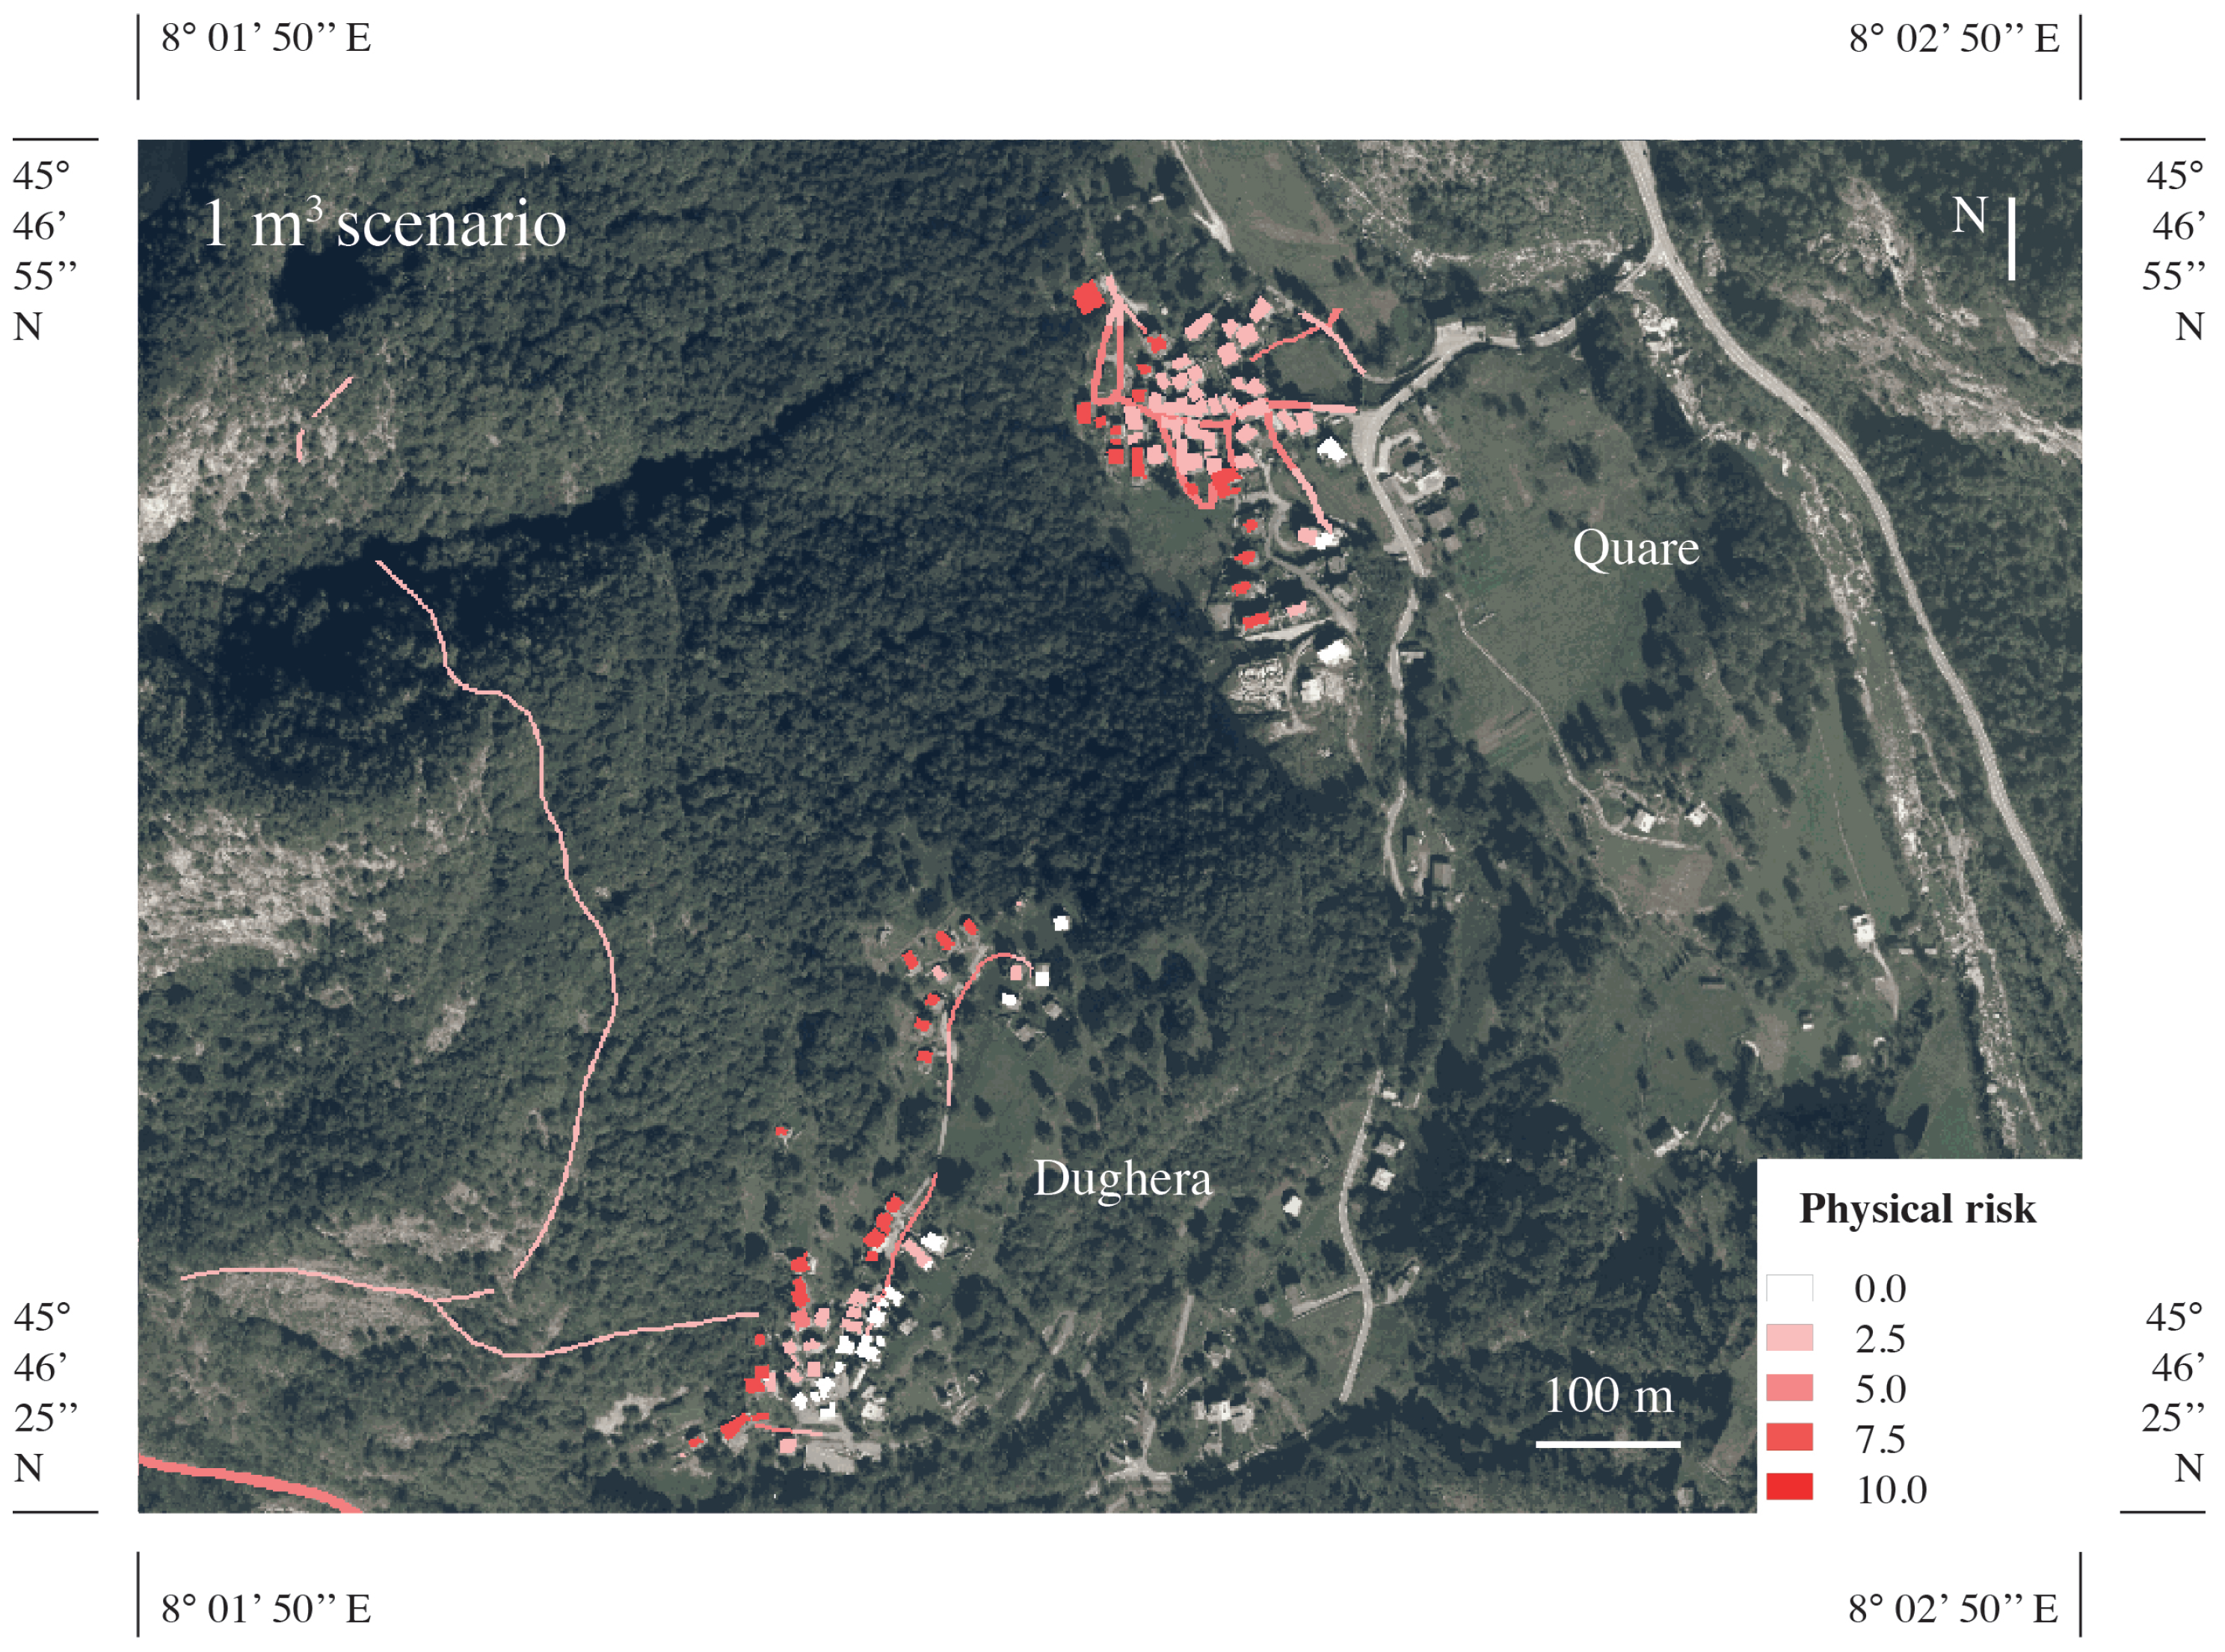
A detailed map of the physical risk for the hamlets of Dughera and Quare is provided in
Figure 9 with reference to the 1 m
3 scenario.
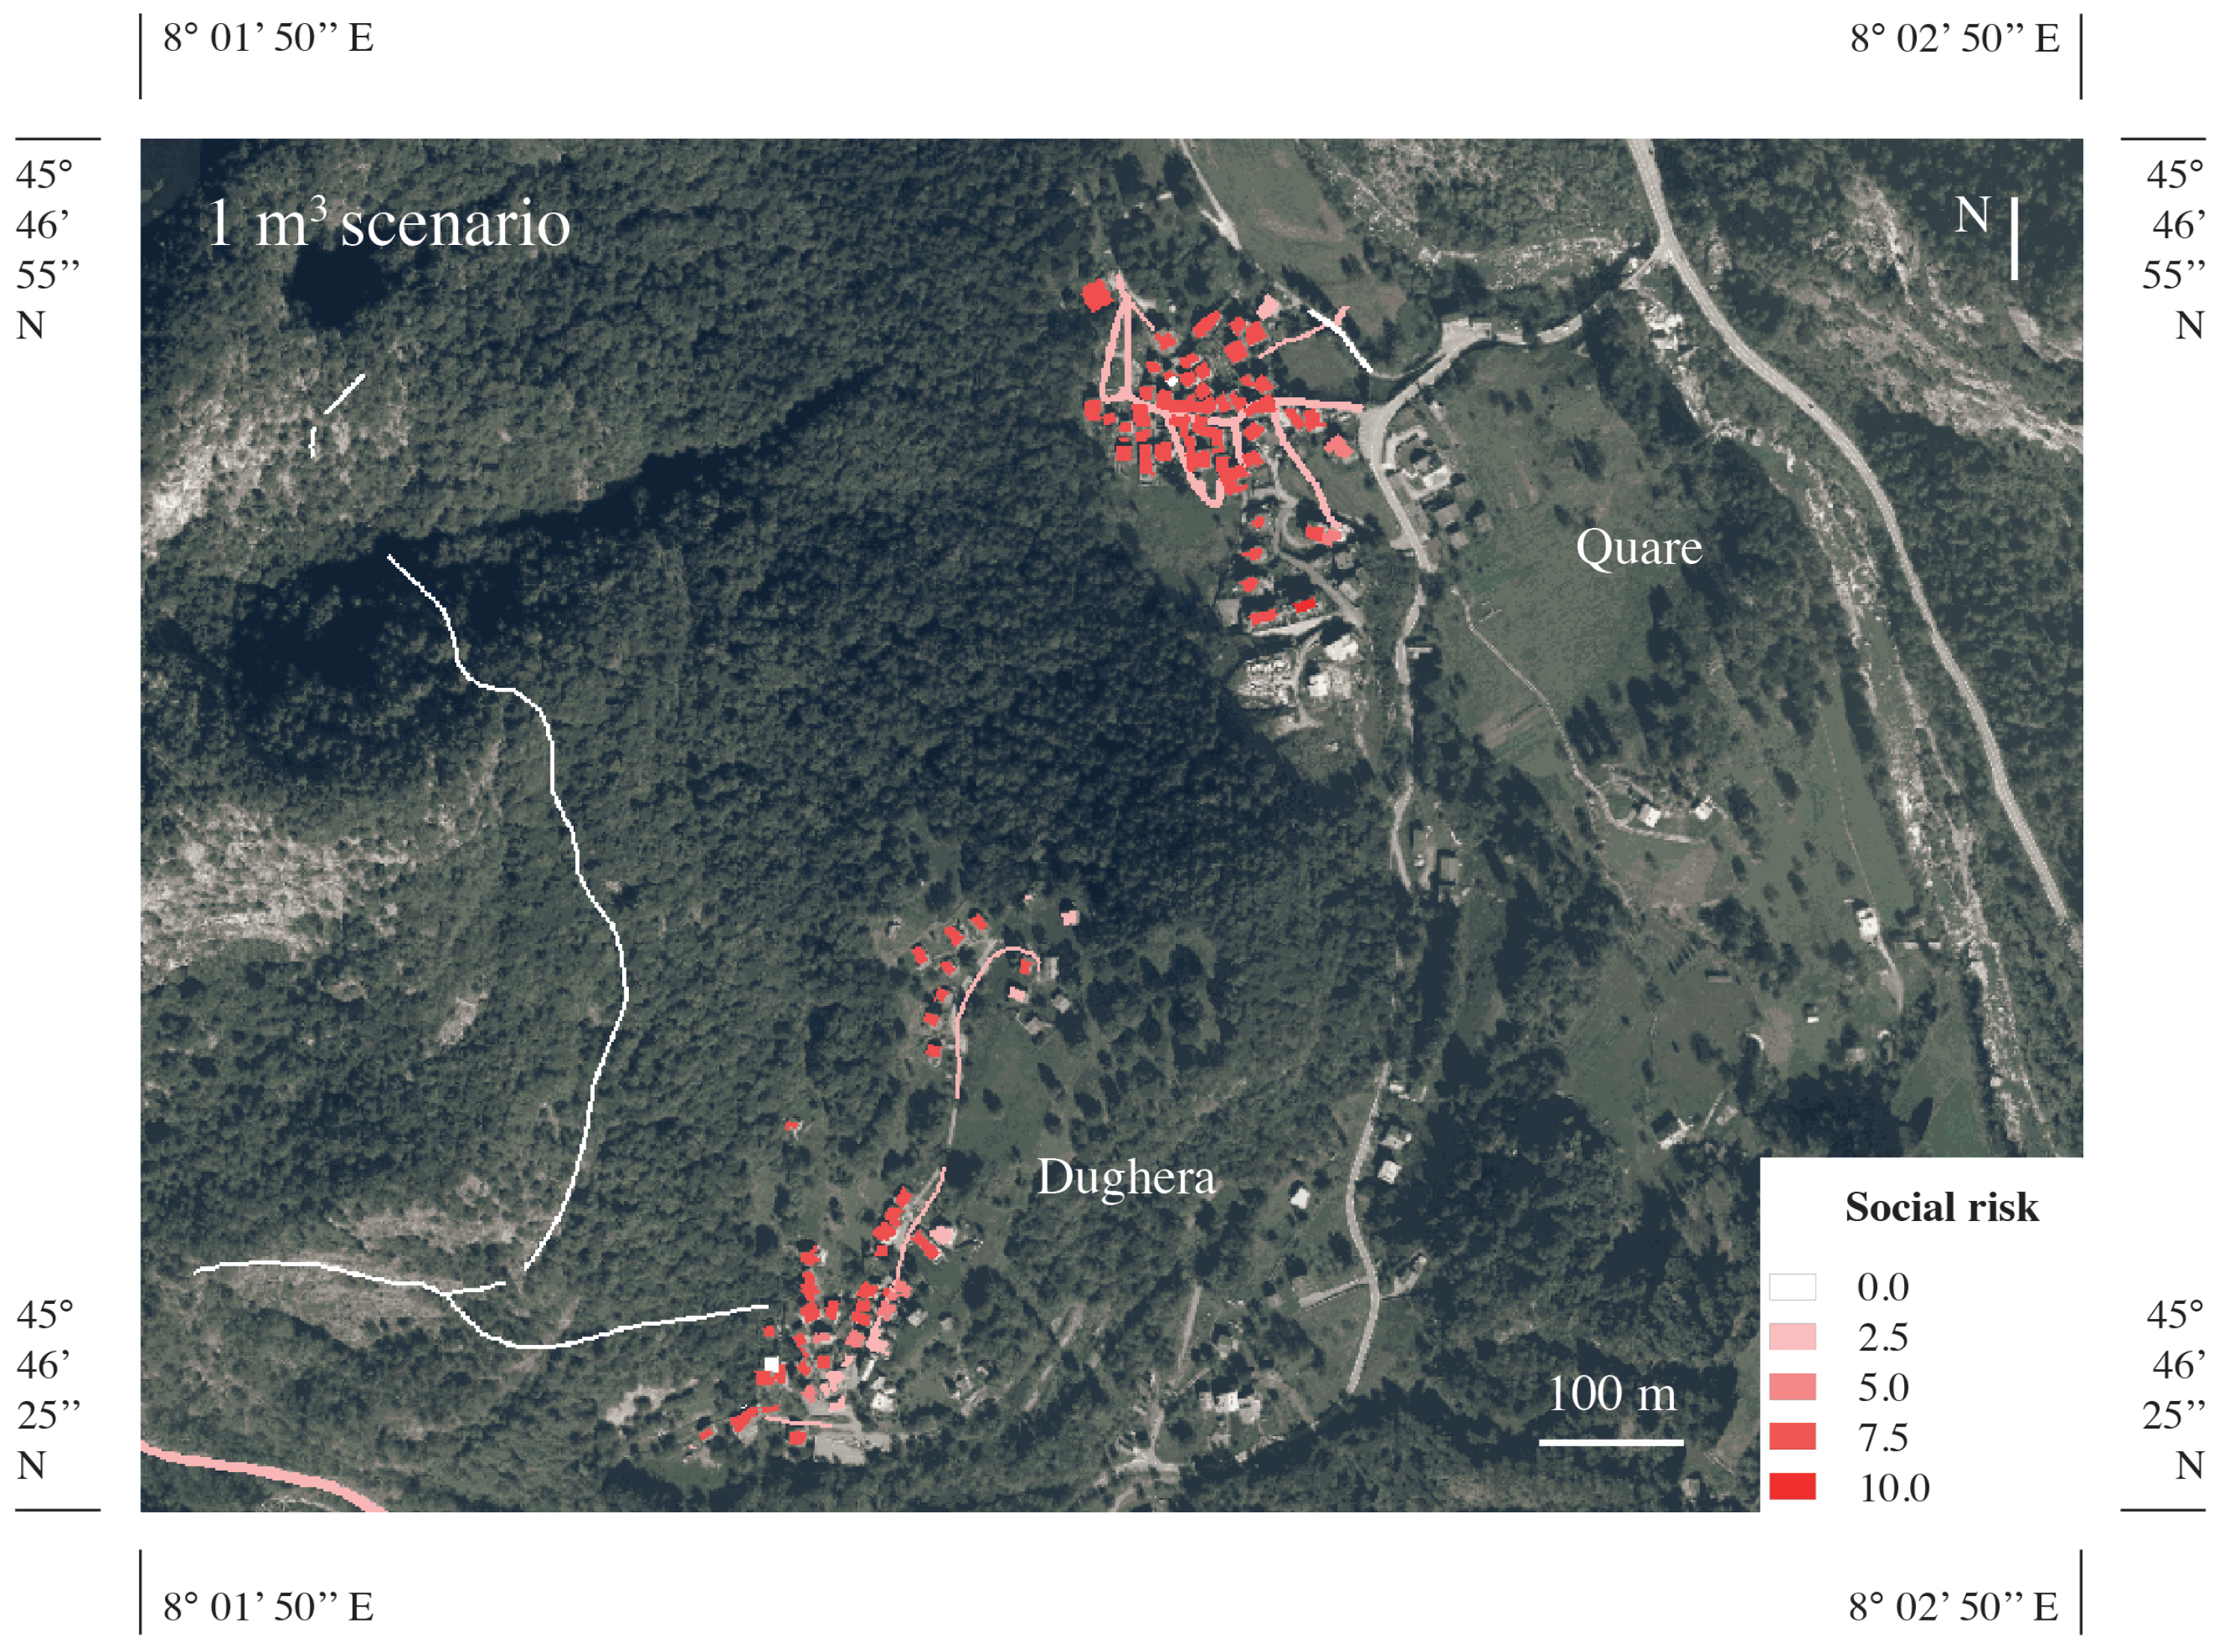
4.2.2. Social Risk
The value of social risk relates to the physical and psychological consequences of the impact of rockfall on people, i.e., injuries, deaths, and stress due to the evacuation or loss of homes or subsequent disability. The general criteria to determine the social vulnerability are based on the phenomenon intensity, the population sensitivity depending on its age and capacity to anticipate a landslide, and awareness [
19]. In the framework of our large-scale study, a simplified method was used to evaluate social worth, vulnerability, and exposure again based on an index approach (
Table 5 and
Table 6).
The social worth based on a subdivision of the exposed elements according to the land use (BDTRE—Regione Piemonte), ranges between 1 and 10, and is a function of the number of people occupying the exposed element. The values chosen in this example are related to the case study and must be evaluated case by case, according to the scale of interest, the available information, and the degree of detail required by the risk assessment.
The social exposure here is a function of the number of hours that at least one person spends in each type of building. The starting point is the presence of at least one person who spends 24 h in a house, leading to an exposure value of 1. Other intended uses of buildings, e.g., schools and city hall, have exposure values lower than 1 as a function of the assumed number of hours during which buildings are occupied by people. The exposure of vehicular traffic can be referred to as the time required to cross a potential invasion area. Using data from BDTRE, it is possible to obtain the average daily traffic (number of vehicles per day) and average travel speed. The road sections involved were calculated on the basis of the major invasion areas resulting in the three analyzed scenarios. The same assumptions were used for calculating the exposure of pedestrians transiting through dirt roads (
Table 5).
The social vulnerability is defined for each hazard scenario with reference to the computed runout area and the value of physical vulnerability. For buildings, the social vulnerability was generally computed by increasing the physical vulnerability value by 0.25. This choice was in order to assign higher fragility to social risk, as it involves human lives. To take into account the psychological impact on the citizens that a block impacting a building can bring, a social vulnerability of 0.25 was assigned to impacted buildings but without physical damage. With regard to dirt and vehicular roads, a social vulnerability of 1 was assigned if impacted, and 0 if not, assuming a total loss if a falling block hit a car or a pedestrian passing on such roads (
Table 6).
A detailed map of the social risk for the hamlets of Dughera and Quare is provided in
Figure 10 with reference to the 1 m
3 scenario.
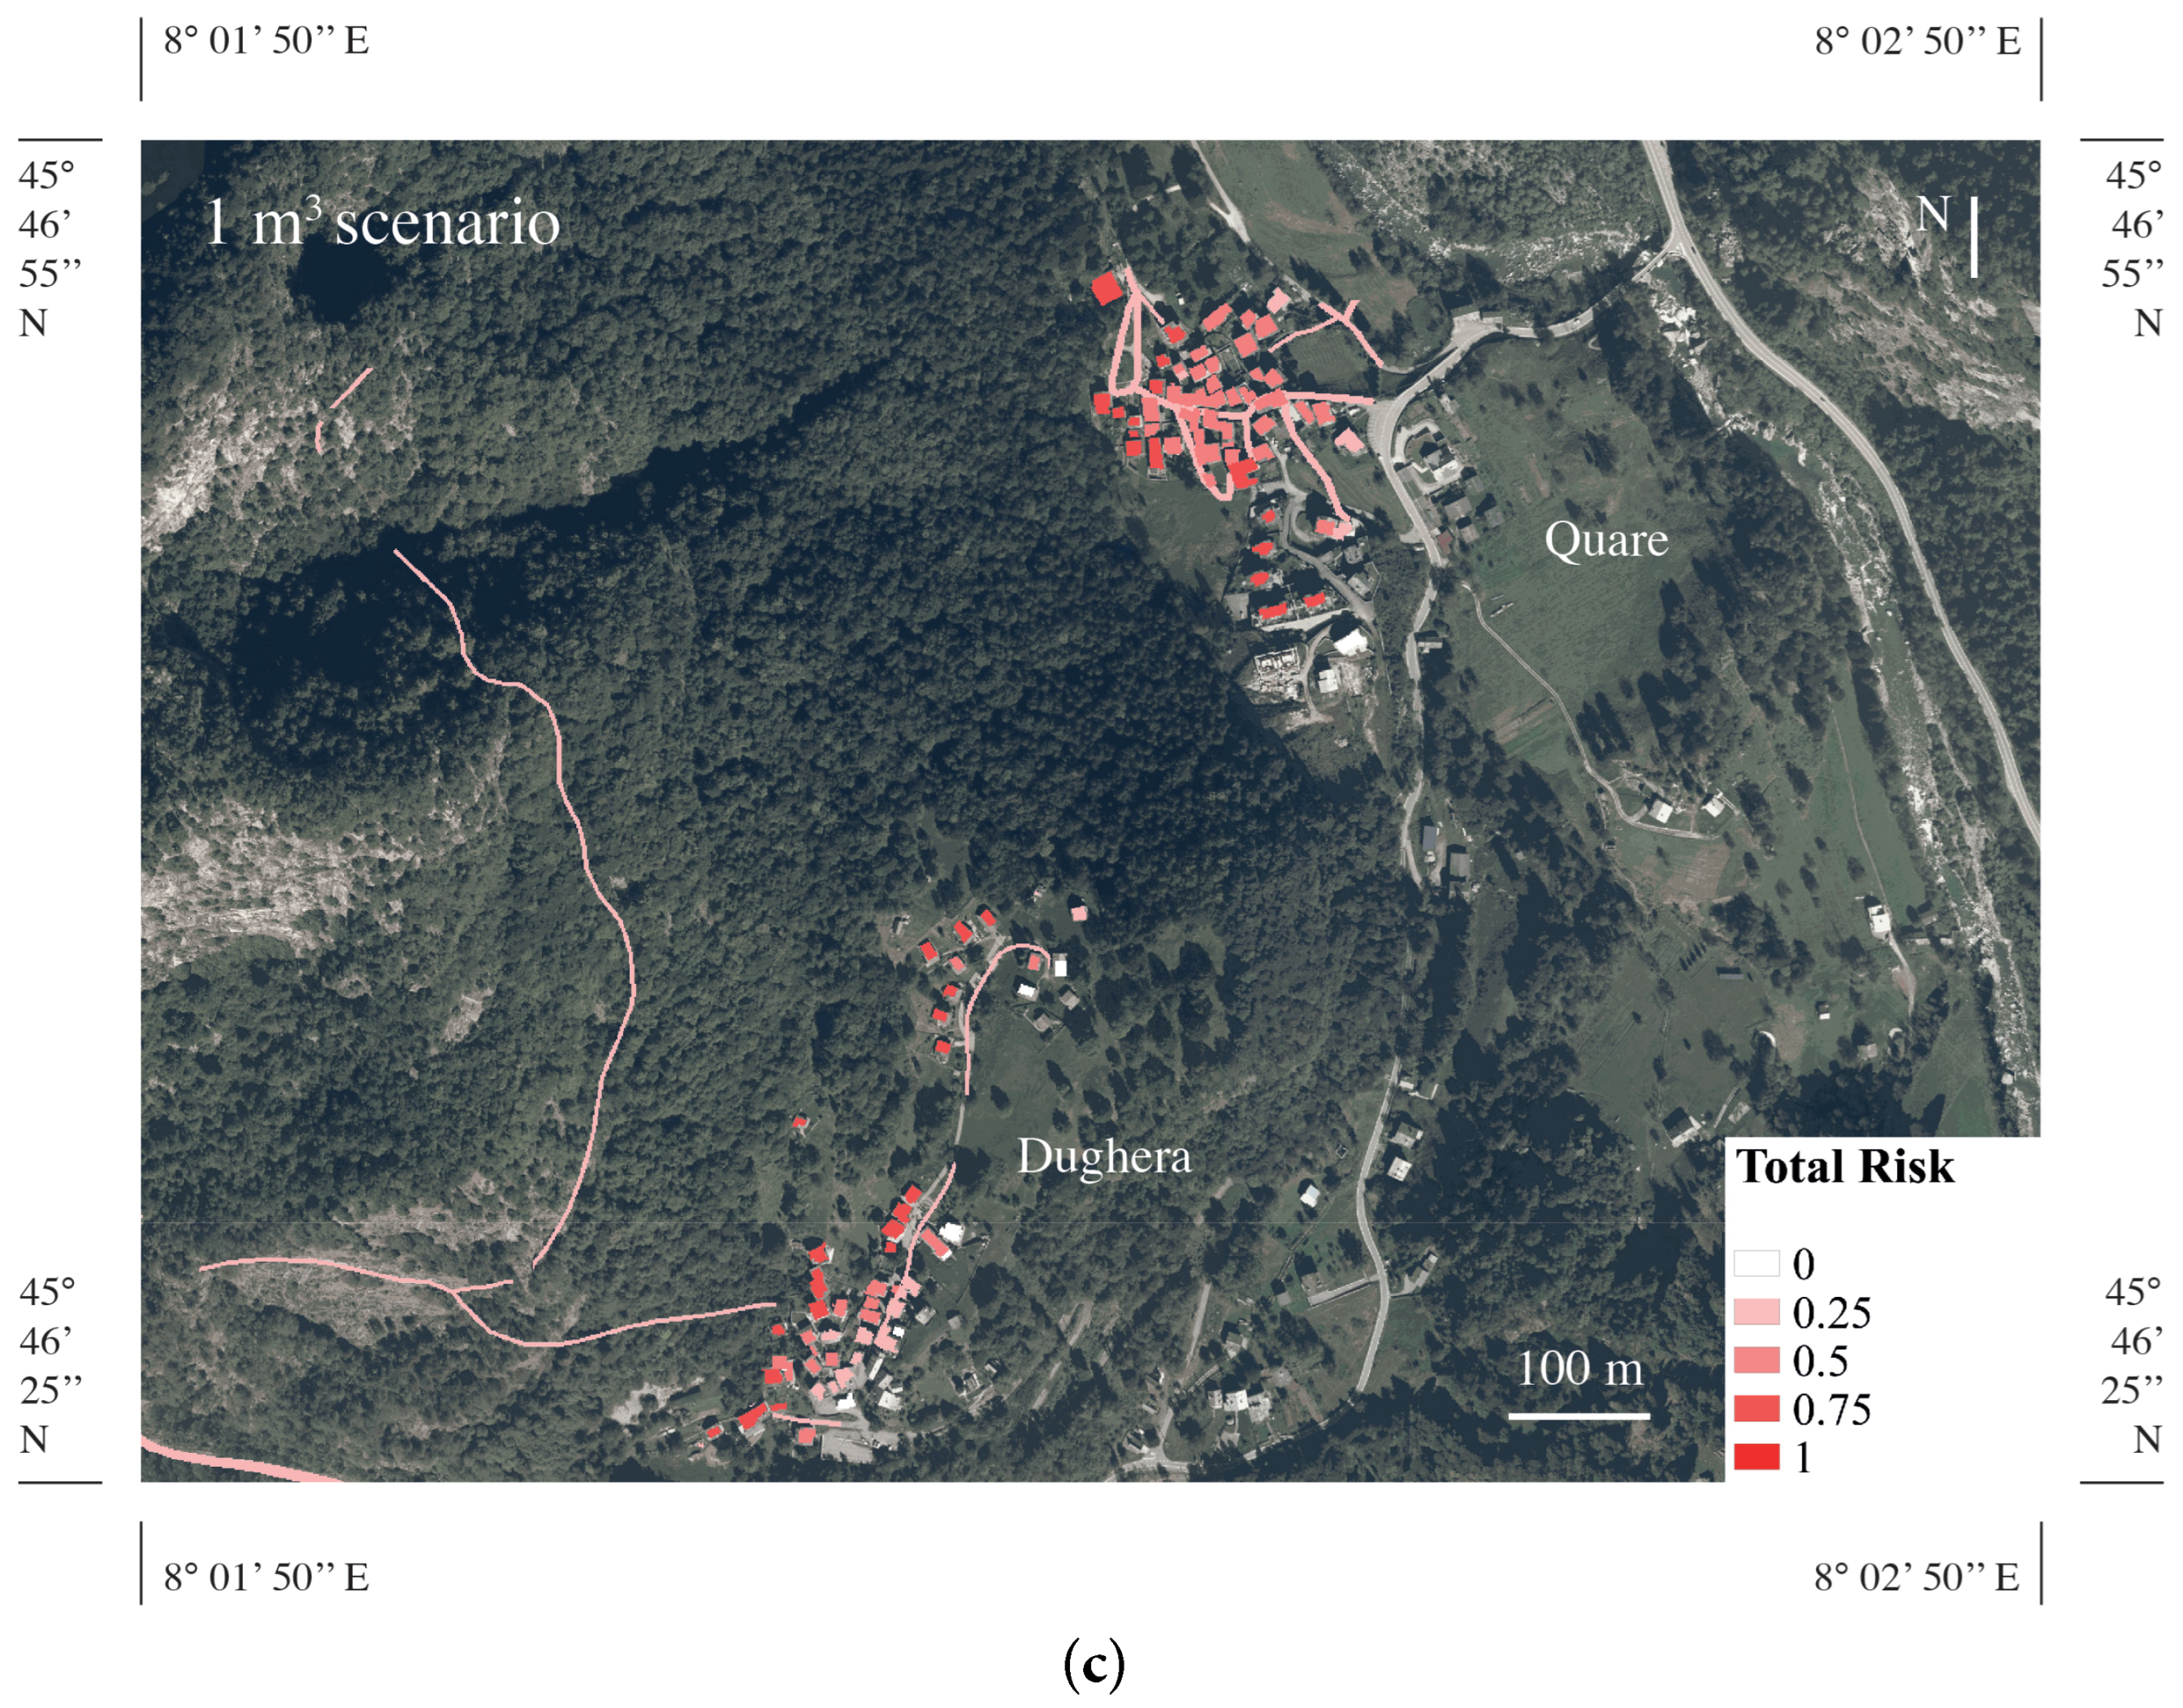
4.2.3. Total Risk
After the computation of the four risk values (related to the four categories), the total risk (R
tot) can be expressed as shown in Equation (
3). Generally, using the IMIRILAND method with a scale from 0 to 10 for each risk category, the maximal risk that can be obtained is equal to 40. However, the economic and environmental categories are null here; thus, the normalizing term R
max was set to be equal to 20. The calculated risk did not take into account the temporal recurrence of the phenomenon, as no sufficient information was available on past rockfall events. When the available information allows for the estimation of a time probability of occurrence, this must multiply the risk. In this way, each scenario is associated with a time recurrence, and the correspondent risk is corrected accordingly.
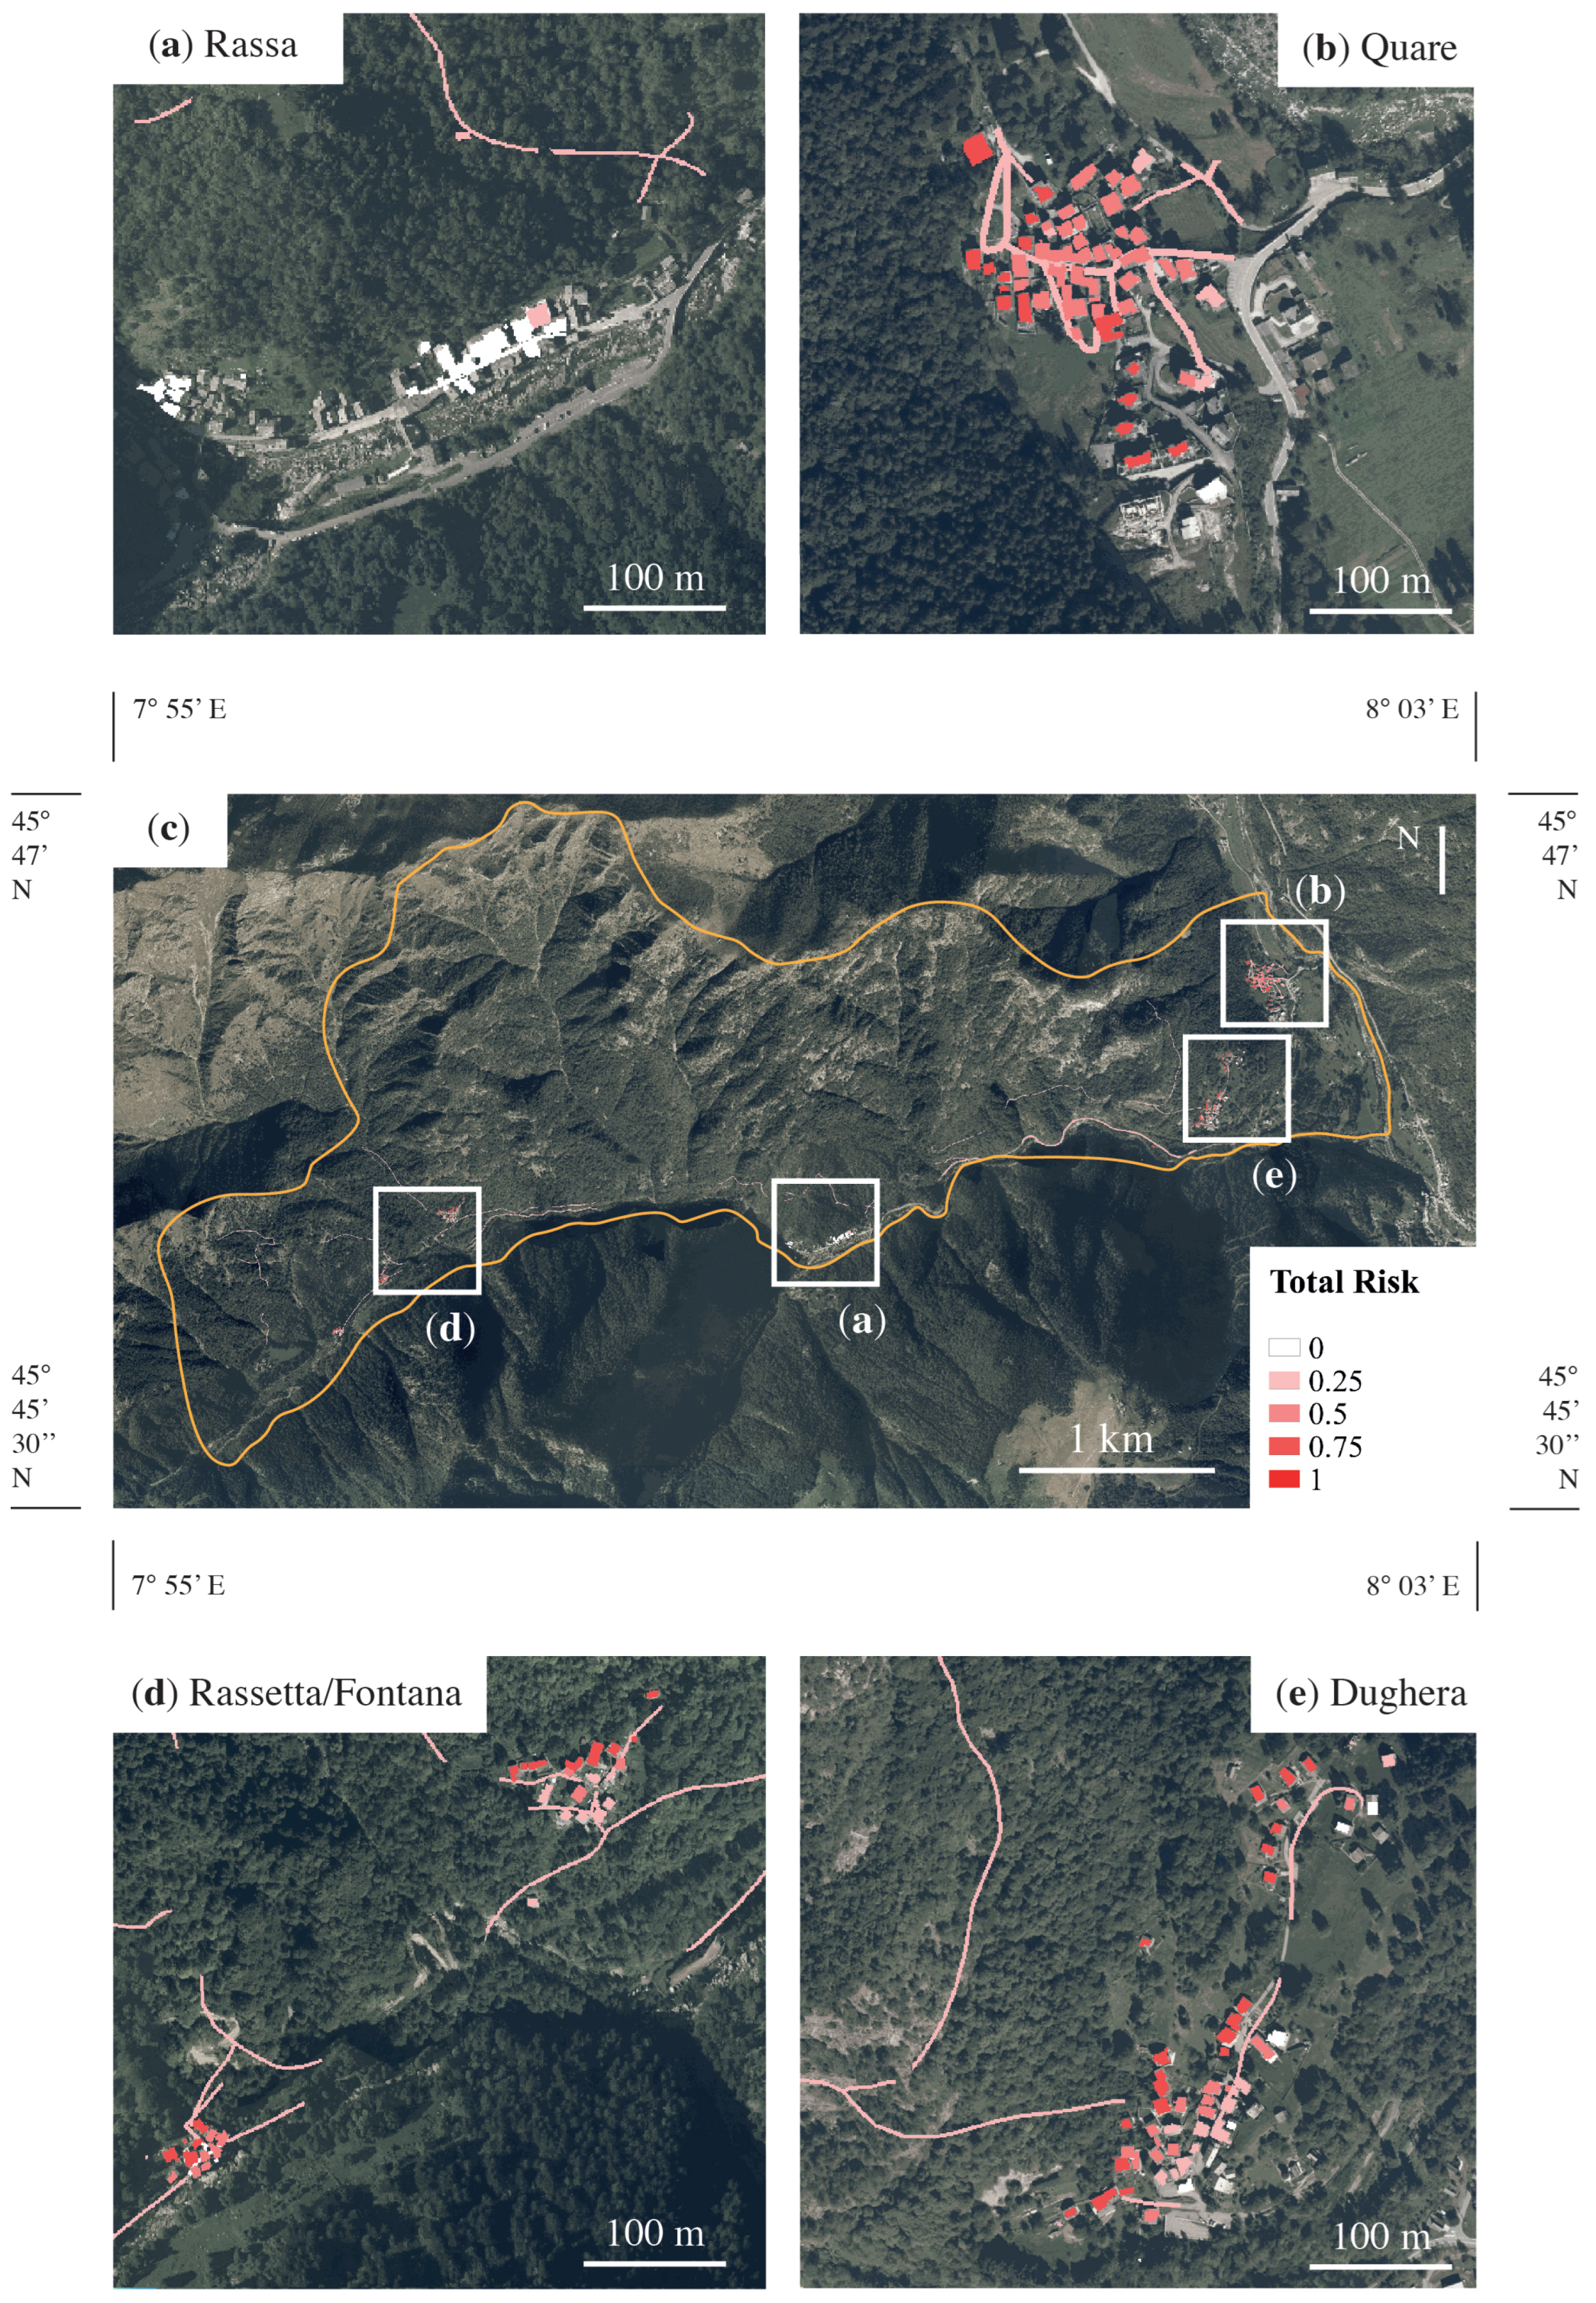
Following the definition in Equation (
3), the total risk map for the entire site is reported in
Figure 11. The highest risk is concentrated in the eastern part of the site, i.e., in the inhabited areas of Dughera and Quare. The site of Rassa is characterized by the lowest rockfall magnitude (i.e., the volume of the fallen blocks) and intensity (kinetic energy resulting from runout simulations), according to the geological conditions of the site and the historical data. Moreover, some portions of the road that connects Quare and Rassa are characterized by medium total risk (i.e., 0.4–0.5). This result is also in good agreement with on-site observations that report a certain number of landslides in this area (as reported in
Section 3).
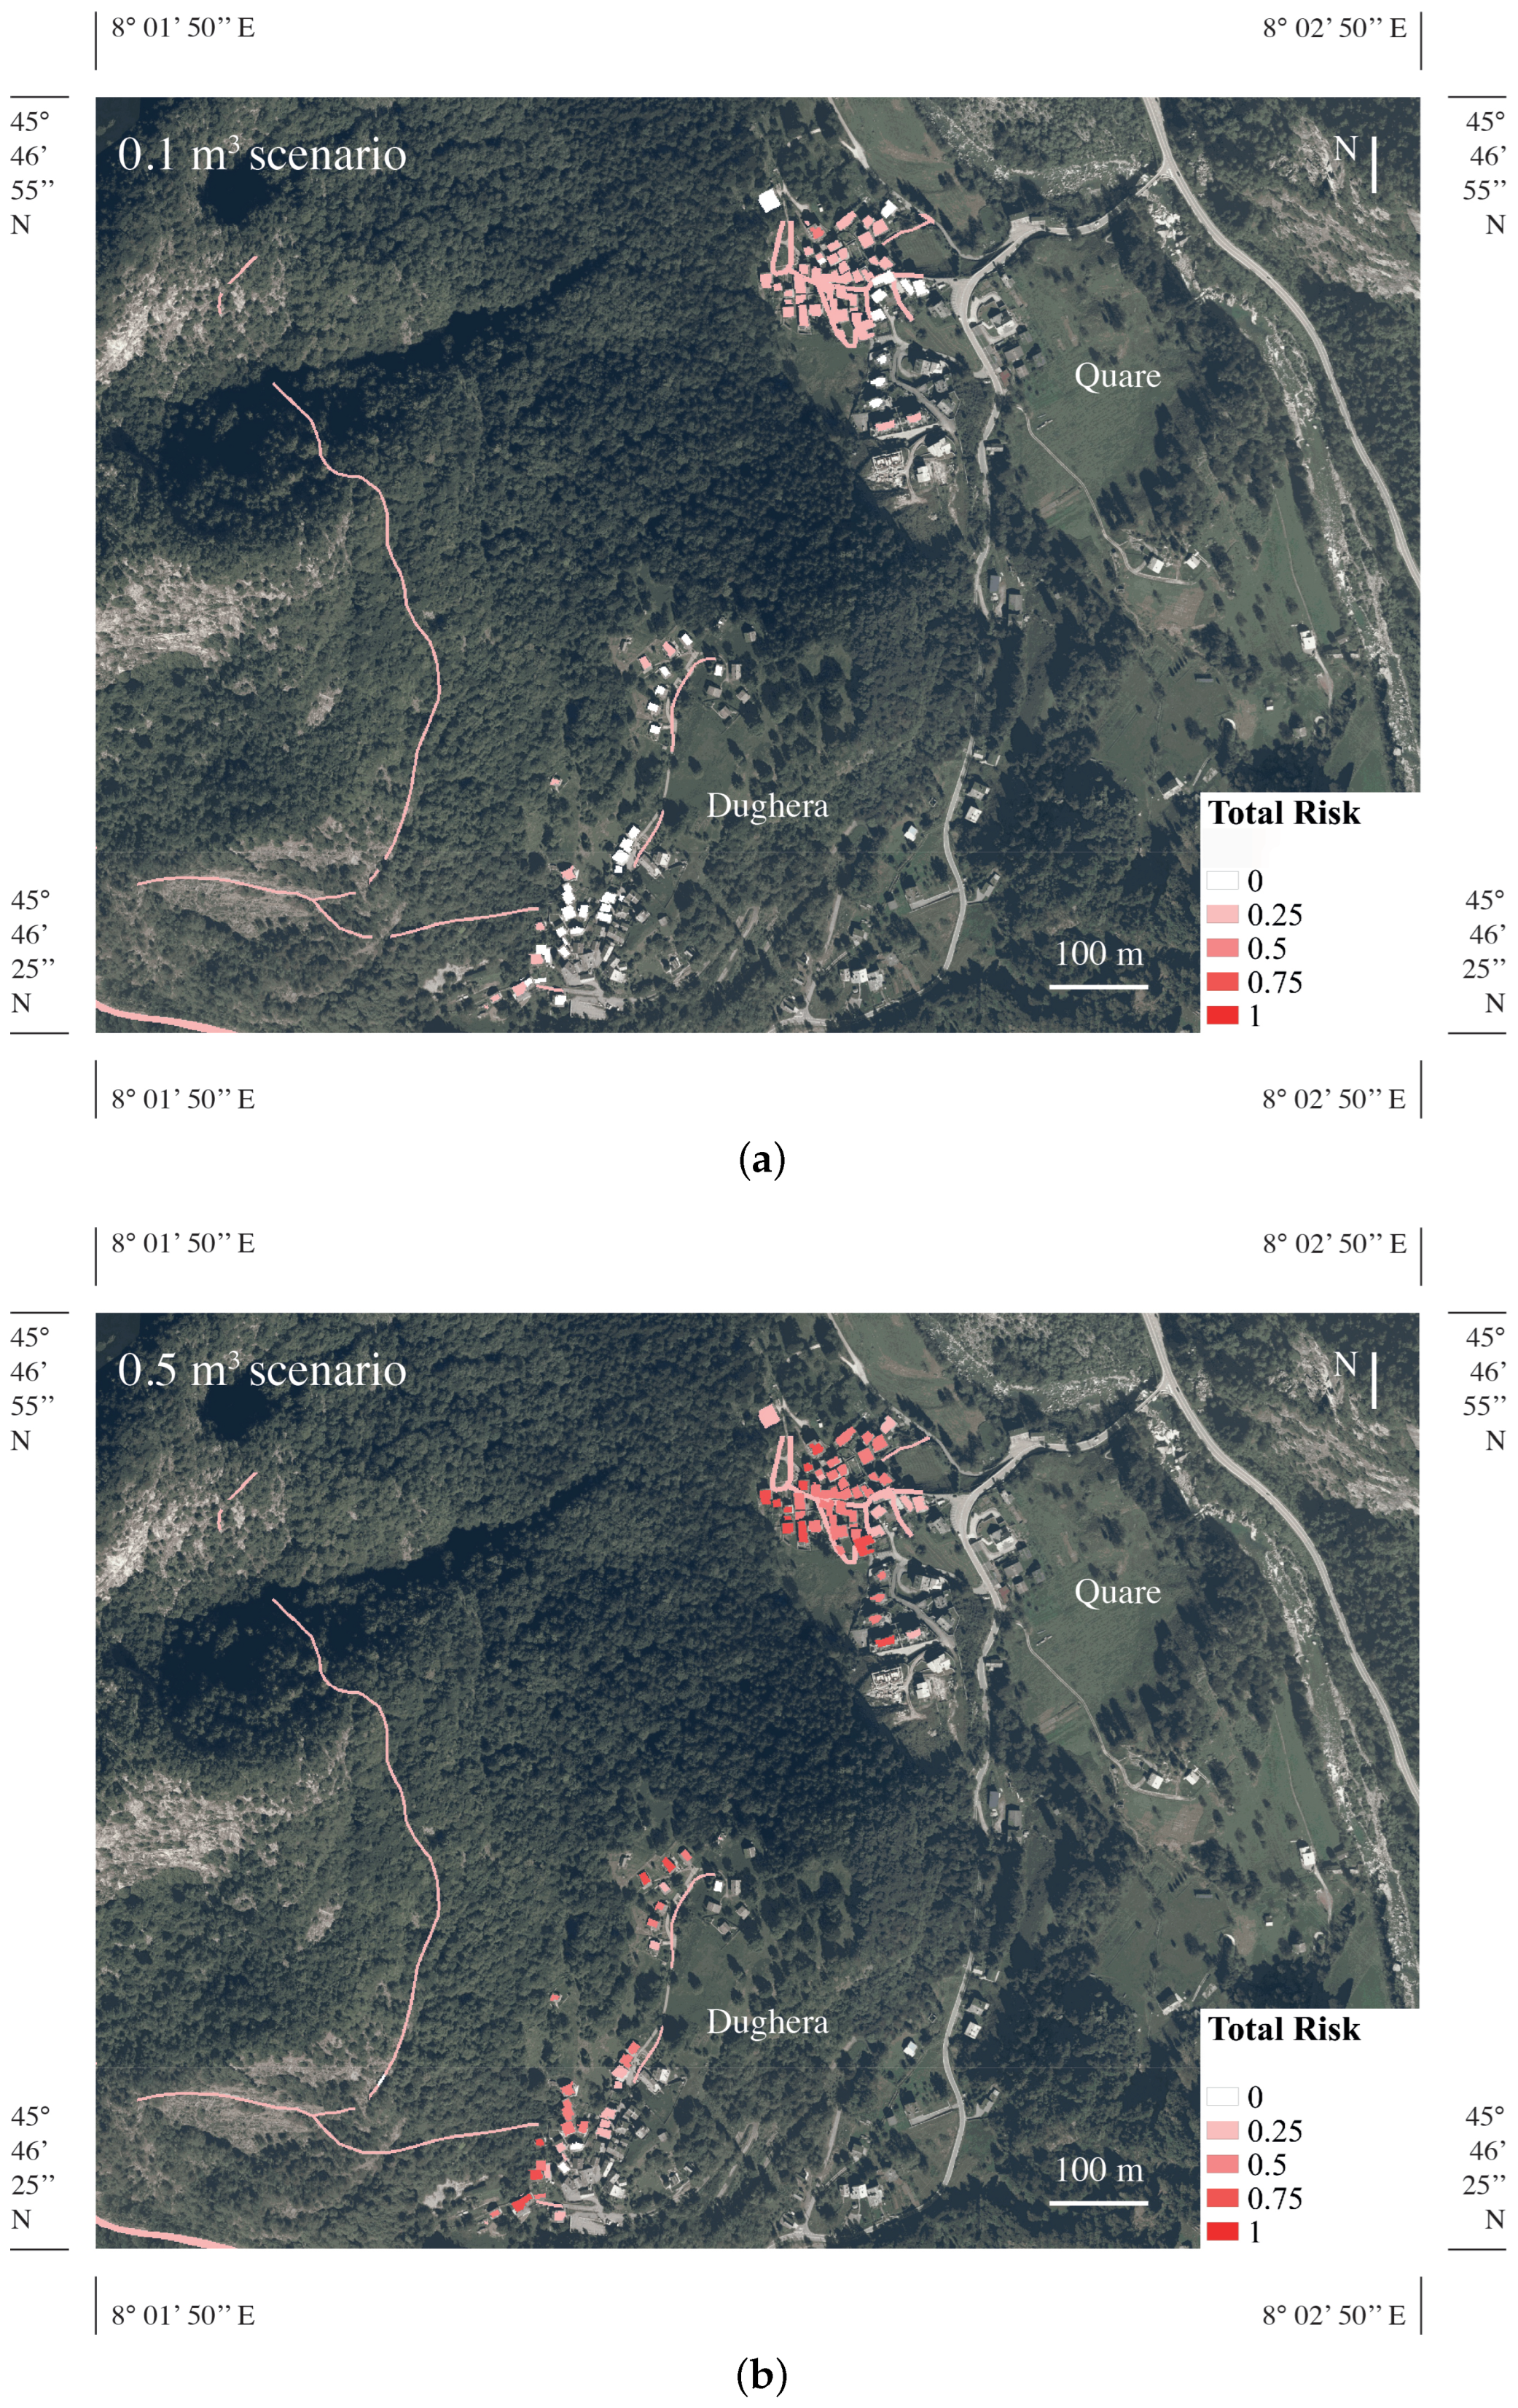
At the macroscopic scale, the difference between the three scenarios is barely visible, whereas, in the zoomed images, the three risk maps are clearly distinguished.
Figure 12 shows the results related to the three scenarios for the hamlets of Quare and Dughera; as expected, the lower mass is associated with the lower risk.
5. Conclusions
In this article, a quick procedure for the assessment of large-scale risk maps associated with diffused rockfall phenomena was presented and applied. The procedure, fully developed in open GIS environment, allows for quickly identifying the most critical areas of extended slopes and valleys, and can be used for land-planning purposes.
The suggested method is suitable to investigate large areas because it requires a reduced amount of information on the analyzed site. The temporal occurrence probability is not taken into account, providing a time-independent risk assessment as the final output. This is a limit due to the usual lack or total absence of data on past events. However, the time-independent analysis provides very useful results for the management of rockfall risk.
This is the case of the proposed application in which the lack of records of past collapse events did not allow for the definition of an occurrence probability for the three considered volumetric scenarios. The scenarios are characterized by different design block volumes estimated on the basis of considerations on the characteristics of the site: structure of the rock mass in the source areas, sizes of previously fallen blocks deposited along the slopes, and testimonies of local inhabitants on past phenomena. The result is a risk map based on the considered volumetric scenario with an undefined temporal probability of occurrence.
While comparing the developed methodology and other methods available in the literature ([
10,
27,
28,
29]), an important potentiality of the proposed approach can be indicated. The latter allows for carrying out reliable large-scale rockfall risk analyses while neglecting some typical aspects of the detailed studies. The consideration of these aspects would certainly render the analyses more accurate and increase the computing time, and the purpose of the analyses would lose significance in the framework of a quick approach. Analyzing the obtained results, it was possible to identify the most critical portions of the PR82 and the main differences between the consequences of the three design scenarios in terms of invasion area and involved energies. This result can be particularly useful for the administrators of large areas subject to rockfall phenomena in the orientation and prioritization of detailed analyzes and local risk mitigation interventions.
A minor limitation of the application presented in this paper is that constant detachment propensity was considered over the analyzed area. This consideration could lead to thinking that the proposed methodology should only be applied in areas that are homogeneous in temporal release frequency. However, the proposed methodology actually envisages considering the detachment propensity of each source zone. In fact, if detailed information about the spatial variation of the detachment propensity was available, it could be implemented in the method using the detachment propensity (DI) input parameter within the QPROTO plugin. This parameter allows for one to assign different weights to the analysis results depending on the propensity of each source area to generate detachments. In this case, areas characterized by source zones with different fracturing degrees and detachment propensities can be analyzed. In this regard, the authors are conducting research with the aim to define a quick procedure for reliable DI estimation over large areas. Pending the results of this study, in the application presented in this paper, a simplified hypothesis of constant propensity detachment for all sources was performed.
Lastly, the detail of the risk map increases as the number of information on the site increases. Furthermore, more accurate models for the estimation of the vulnerability of the elements at risk (such as roads and buildings) could certainly increase the accuracy of the final product. As an example, models for the definition of vulnerability for some building types (e.g., the method proposed by [
30] for masonry buildings) could be applied.
Author Contributions
Conceptualization, G.T., L.M. and G.V.; methodology, G.T., L.M. and G.V.; software, G.T., L.M. and G.V.; validation, G.T., L.M. and G.V.; formal analysis, G.T., L.M. and G.V.; investigation, G.T., L.M. and G.V.; resources, G.T., L.M. and G.V.; data curation, G.T., L.M. and G.V.; writing—original draft preparation, G.T., L.M. and G.V.; writing—review and editing, G.T., L.M., G.V., M.C. and M.B.; visualization, G.T., L.M. and G.V.; supervision, M.C. and M.B.; project administration, M.C. and M.B. All authors have read and agreed to the published version of the manuscript.
Funding
This research received no external funding.
Institutional Review Board Statement
Not applicable.
Informed Consent Statement
Not applicable.
Data Availability Statement
Data supporting reported results can be obtained upon request to the authors.
Acknowledgments
The authors gratefully address their thanks to G. Cavagnino (Tecnosesia) for the concession of the data related to the study case.
Conflicts of Interest
The authors declare no conflict of interest.
References
- Hungr, O.; Leroueil, S.; Picarelli, L. The Varnes classification of landslide types, an update. Landslides 2014, 11, 167–194. [Google Scholar] [CrossRef]
- Volkwein, A.; Schellenberg, K.; Labiouse, V.; Agliardi, F.; Berger, F.; Bourrier, F.; Dorren, L.K.; Gerber, W.; Jaboyedoff, M. Rockfall characterisation and structural protection—A review. Nat. Hazards Earth Syst. Sci. 2011, 11, 2617–2651. [Google Scholar] [CrossRef] [Green Version]
- Dussauge-Peisser, C.; Helmstetter, A.; Grasso, J.R.; Hantz, D.; Desvarreux, P.; Jeannin, M.; Giraud, A. Probabilistic approach to rock fall hazard assessment: Potential of historical data analysis. Nat. Hazards Earth Syst. Sci. 2002, 2, 15–26. [Google Scholar] [CrossRef]
- Wang, X.; Frattini, P.; Crosta, G.; Zhang, L.; Agliardi, F.; Lari, S.; Yang, Z. Uncertainty assessment in quantitative rockfall risk assessment. Landslides 2014, 11, 711–722. [Google Scholar] [CrossRef]
- De Biagi, V.; Napoli, M.L.; Barbero, M.; Peila, D. Estimation of the return period of rockfall blocks according to their size. Nat. Hazards Earth Syst. Sci. 2017, 17, 103–113. [Google Scholar] [CrossRef] [Green Version]
- Lu, G.; Caviezel, A.; Christen, M.; Demmel, S.E.; Ringenbach, A.; Bühler, Y.; Dinneen, C.E.; Gerber, W.; Bartelt, P. Modelling rockfall impact with scarring in compactable soils. Landslides 2019, 16, 2353–2367. [Google Scholar] [CrossRef]
- Barbero, M.; Castelli, M.; Cavagnino, G.; De Biagi, V.; Scavia, C.; Vallero, G. Application of a Statistical Approach for the Assessment of Design Block in Rockfall: A Case Study in Sesia Valley (Northern Italy). In Proceedings of the Geotechnical Research for Land Protection and Development, Lecco, Italy, 3–5 July 2019; Calvetti, F., Cotecchia, F., Galli, A., Jommi, C., Eds.; Springer International Publishing: Cham, Switzerland, 2020; pp. 621–629. [Google Scholar]
- De Biagi, V.; Napoli, M.L.; Barbero, M. A quantitative approach for the evaluation of rockfall risk on buildings. Nat. Hazards 2017, 88, 1059–1086. [Google Scholar] [CrossRef]
- Van Westen, C.J.; Castellanos, E.; Kuriakose, S.L. Spatial data for landslide susceptibility, hazard, and vulnerability assessment: An overview. Eng. Geol. 2008, 102, 112–131. [Google Scholar] [CrossRef]
- Ferlisi, S.; Gullà, G.; Nicodemo, G.; Peduto, D. A multi-scale methodological approach for slow-moving landslide risk mitigation in urban areas, southern Italy. Euro-Mediterr. J. Environ. Integr. 2019, 4, 1–15. [Google Scholar] [CrossRef] [Green Version]
- Flentje, P.N.; Miner, A.; Whitt, G.; Fell, R. Guidelines for landslide susceptibility, hazard and risk zoning for land-use planning. Eng. Geol. 2008, 102, 99–111. [Google Scholar]
- Corominas, J.; van Westen, C.; Frattini, P.; Cascini, L.; Malet, J.P.; Fotopoulou, S.; Catani, F.; Van Den Eeckhaut, M.; Mavrouli, O.; Agliardi, F.; et al. Recommendations for the quantitative analysis of landslide risk. Bull. Eng. Geol. Environ. 2014, 73, 209–263. [Google Scholar] [CrossRef]
- Scavia, C.; Barbero, M.; Castelli, M.; Marchelli, M.; Peila, D.; Torsello, G.; Vallero, G. Evaluating Rockfall Risk: Some Critical Aspects. Geosciences 2020, 10, 98. [Google Scholar] [CrossRef] [Green Version]
- Jaboyedoff, M.; Labiouse, V. Preliminary assessment of rockfall hazard based on GIS data. In Proceedings of the 10th ISRM Congress, Sandton, South Africa, 8–12 September 2003; OnePetro: Richardson, TX, USA, 2003. [Google Scholar]
- Castelli, M.; Torsello, G.; Vallero, G. Rockfall Hazard Analysis at Small Scale: A Numerical Study for the Estimation of Representative Slope Parameters. In Proceedings of the International Conference of the International Association for Computer Methods and Advances in Geomechanics, Torino, Italy, 30 August–2 September 2021; Springer: Cham, Switzerland, 2021; pp. 431–438. [Google Scholar]
- Jaboyedoff, M.; Labiouse, V. Technical Note: Preliminary estimation of rockfall runout zones. Nat. Hazards Earth Syst. Sci. 2011, 11, 819–828. [Google Scholar] [CrossRef] [Green Version]
- Evans, S.; Hungr, O. The assessment of rockfall hazard at the base of talus slopes. Can. Geotech. J. 1993, 30, 620–636. [Google Scholar] [CrossRef]
- Corominas, J. The angle of reach as a mobility index for small and large landslides. Can. Geotech. J. 1996, 33, 260–271. [Google Scholar] [CrossRef]
- Castelli, M.; Scavia, C. A multidisciplinary methodology for hazard and risk assessment of rock avalanches. Rock Mech. Rock Eng. 2008, 41, 3–36. [Google Scholar] [CrossRef]
- Castelli, M.; Torsello, G.; Vallero, G. Preliminary Modeling of Rockfall Runout: Definition of the Input Parameters for the QGIS Plugin QPROTO. Geosciences 2021, 11, 88. [Google Scholar] [CrossRef]
- Bonnard, C.; Forlati, F.; Scavia, C. Identification and Mitigation of Large Landslide Risks in Europe: Advances in Risk Assessment; CRC Press: Boca Raton, FL, USA, 2004. [Google Scholar]
- Loye, A.; Jaboyedoff, M.; Pedrazzini, A. Identification of potential rockfall source areas at a regional scale using a DEM-based geomorphometric analysis. Nat. Hazards Earth Syst. Sci. 2009, 9, 1643–1653. [Google Scholar] [CrossRef]
- Rossi, M.; Sarro, R.; Reichenbach, P.; Mateos, R.M. Probabilistic identification of rockfall source areas at regional scale in El Hierro (Canary Islands, Spain). Geomorphology 2021, 381, 107661. [Google Scholar] [CrossRef]
- Toppe, R. Terrain models: A tool for natural hazard mapping. IAHS Publ. 1987, 162, 629–638. [Google Scholar]
- Alvioli, M.; Guzzetti, F.; Marchesini, I. Parameter-free delineation of slope units and terrain subdivision of Italy. Geomorphology 2020, 358, 107124. [Google Scholar] [CrossRef]
- Agliardi, F.; Crosta, G.; Frattini, P. Integrating rockfall risk assessment and countermeasure design by 3D modelling techniques. Nat. Hazards Earth Syst. Sci. 2009, 9, 1059–1073. [Google Scholar] [CrossRef] [Green Version]
- Moos, C.; Fehlmann, M.; Trappmann, D.; Stoffel, M.; Dorren, L. Integrating the mitigating effect of forests into quantitative rockfall risk analysis—Two case studies in Switzerland. Int. J. Disaster Risk Reduct. 2018, 32, 55–74. [Google Scholar] [CrossRef]
- Hantz, D.; Corominas, J.; Crosta, G.B.; Jaboyedoff, M. Definitions and concepts for quantitative rockfall hazard and risk analysis. Geosciences 2021, 11, 158. [Google Scholar] [CrossRef]
- Farvacque, M.; Lopez-Saez, J.; Corona, C.; Toe, D.; Bourrier, F.; Eckert, N. How is rockfall risk impacted by land-use and land-cover changes? Insights from the French Alps. Glob. Planet. Chang. 2019, 174, 138–152. [Google Scholar] [CrossRef]
- Vallero, G.; De Biagi, V.; Barbero, M.; Castelli, M.; Napoli, M.L. A method to quantitatively assess the vulnerability of masonry structures subjected to rockfalls. Nat. Hazards 2020, 103, 1307–1325. [Google Scholar] [CrossRef]
| Publisher’s Note: MDPI stays neutral with regard to jurisdictional claims in published maps and institutional affiliations. |
© 2022 by the authors. Licensee MDPI, Basel, Switzerland. This article is an open access article distributed under the terms and conditions of the Creative Commons Attribution (CC BY) license (https://creativecommons.org/licenses/by/4.0/).


