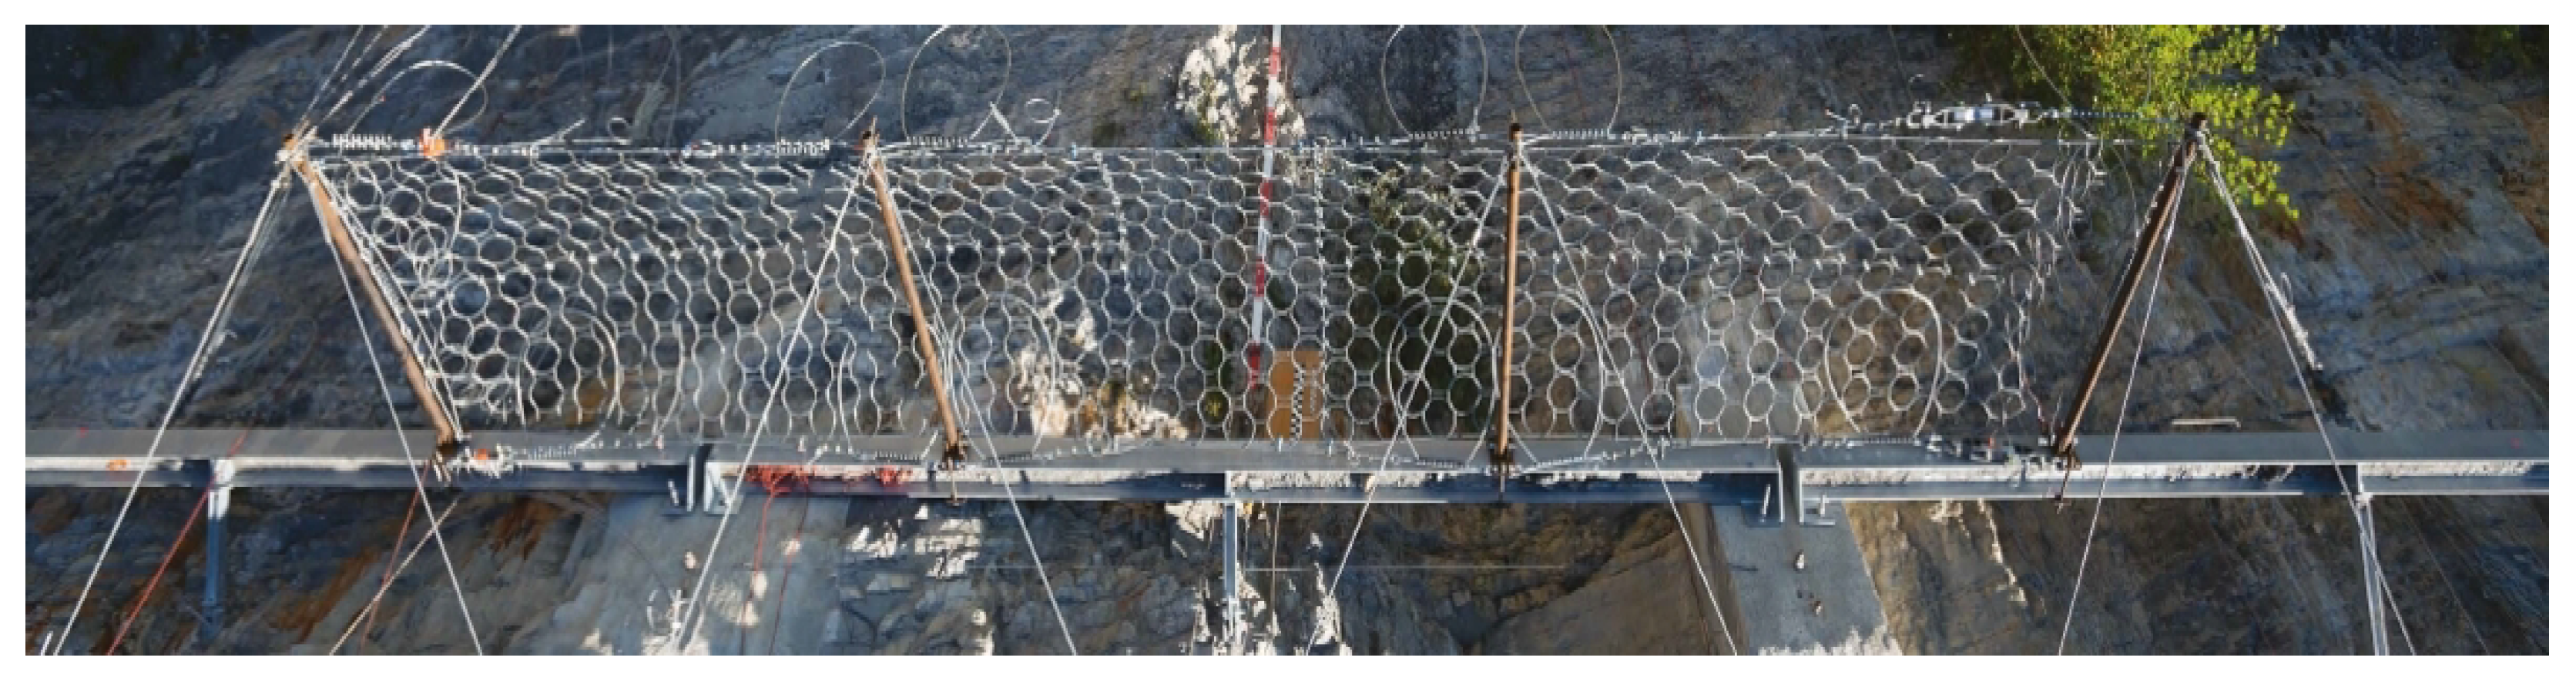
Figure 1.
Top view of the experimental set-up (by courtesy of the NGE Foundation).
Figure 1.
Top view of the experimental set-up (by courtesy of the NGE Foundation).
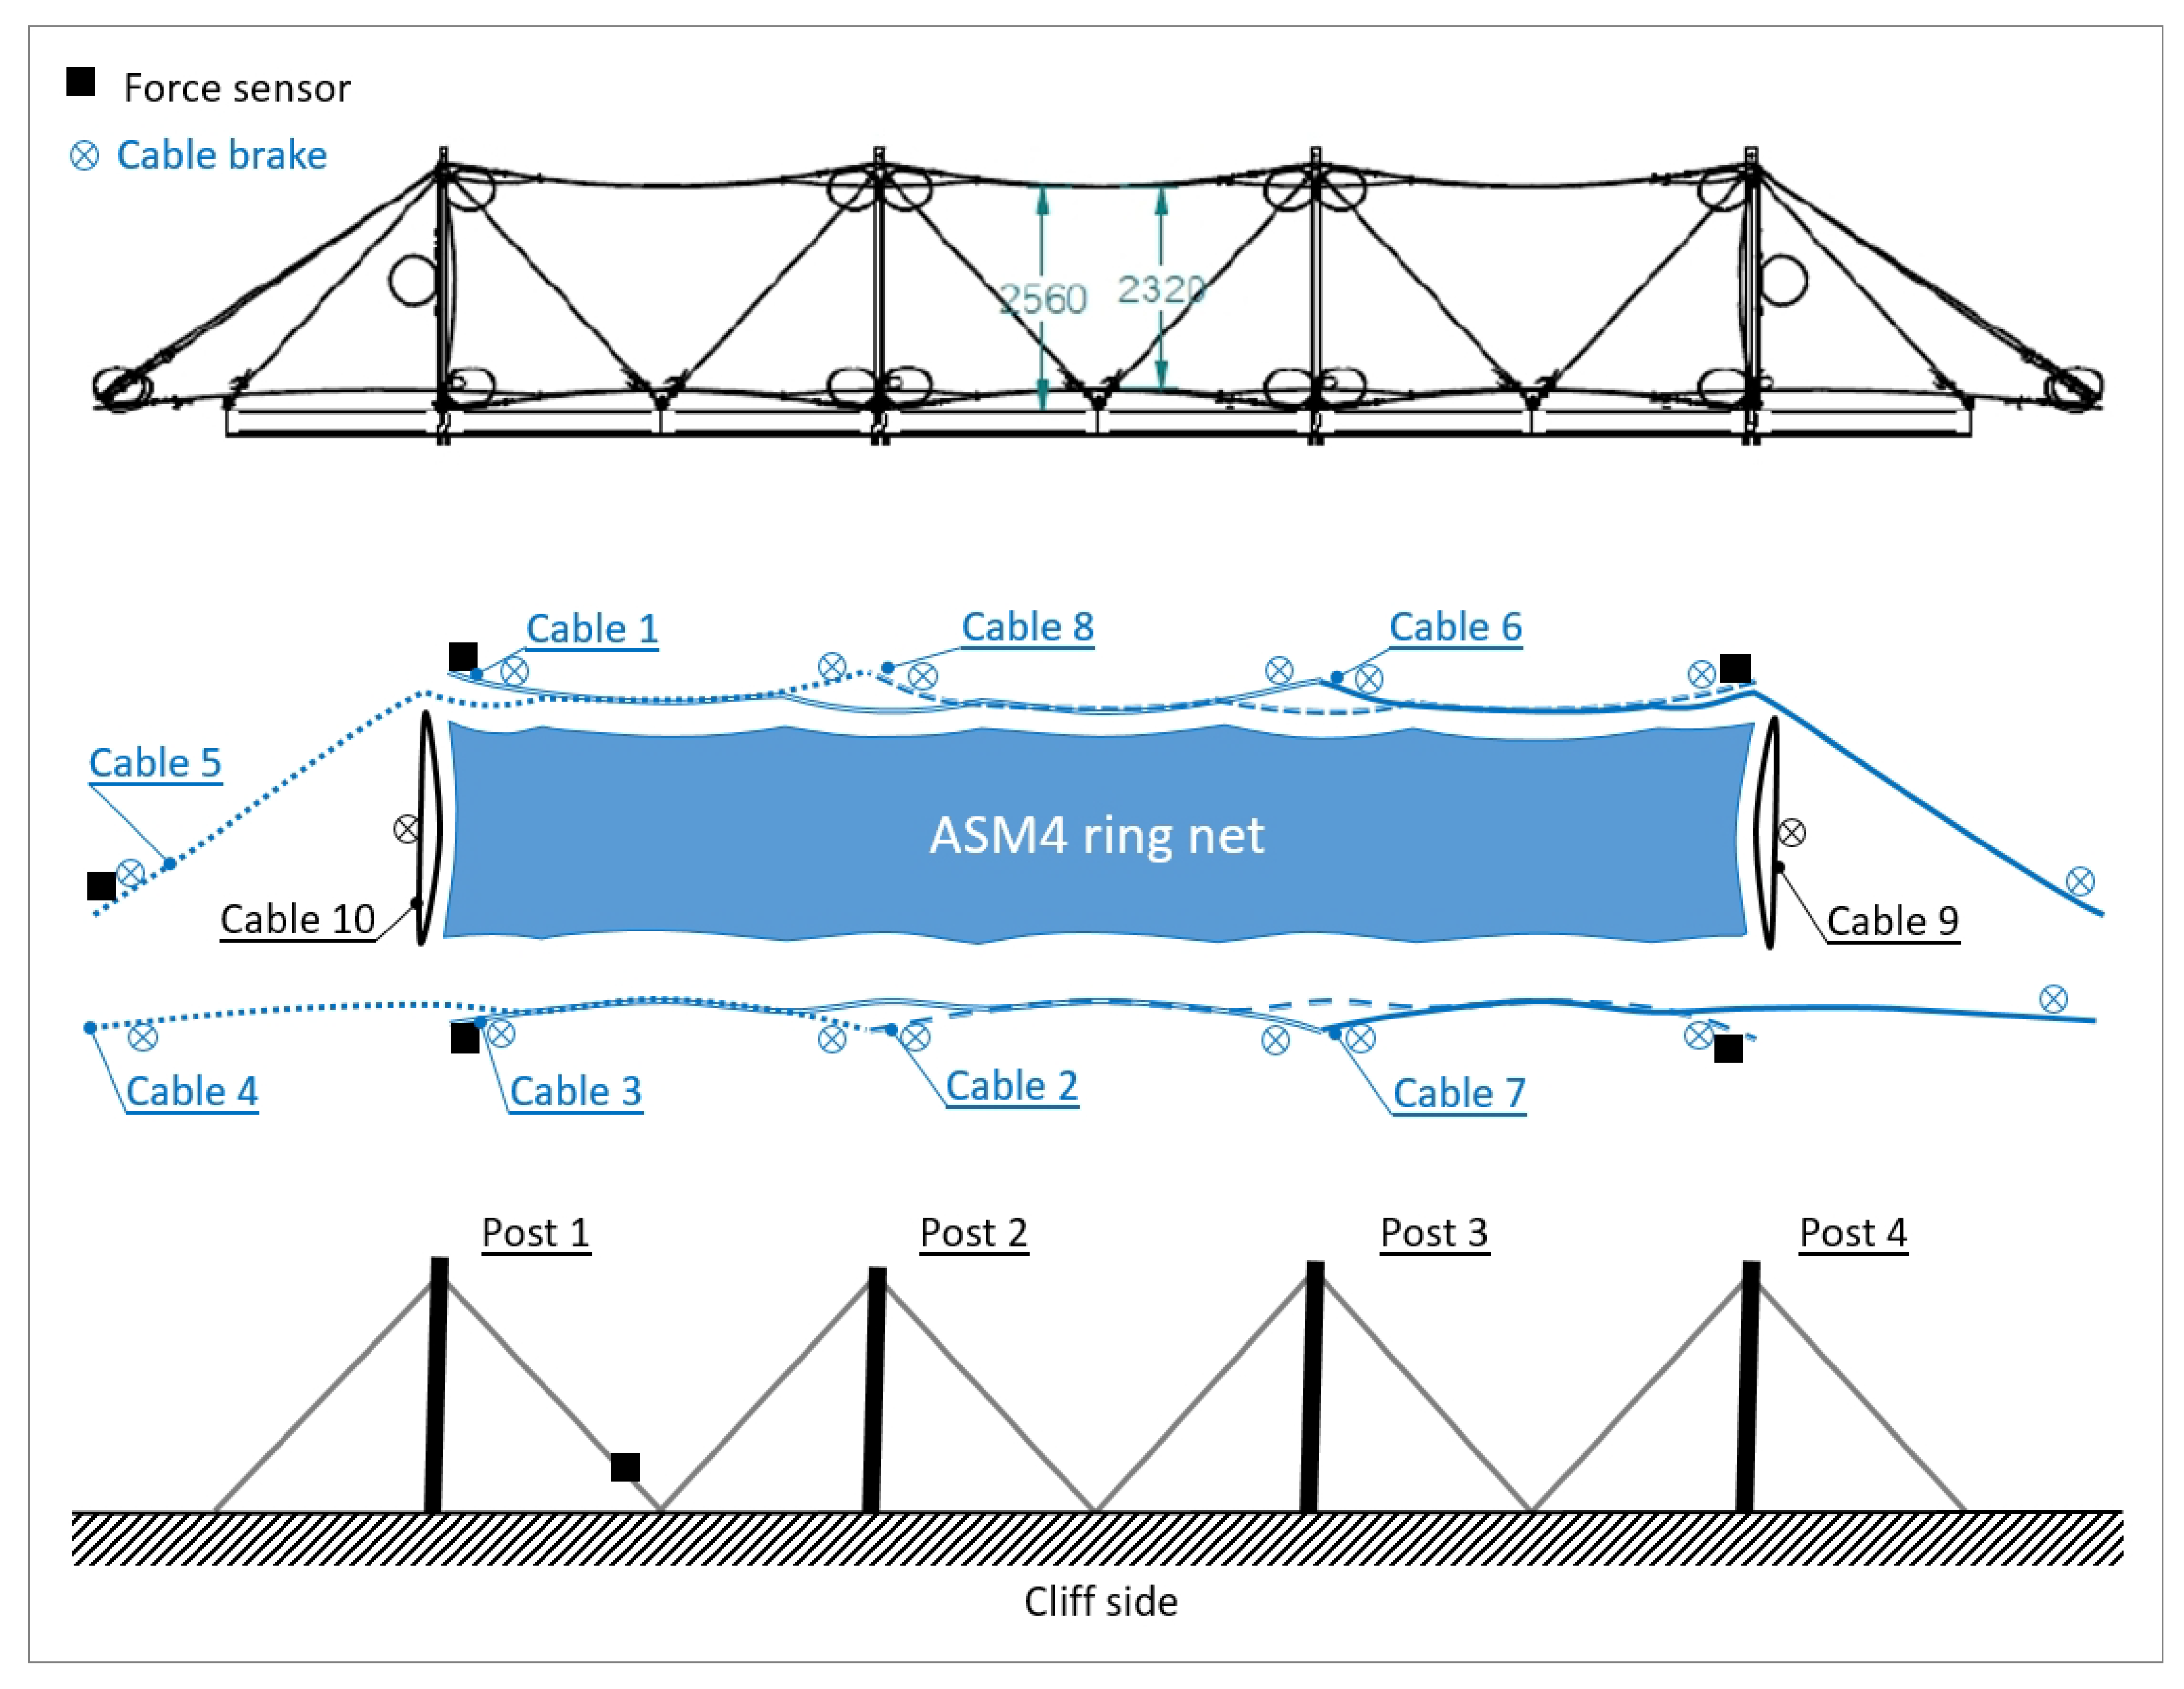
Figure 2.
Architecture of the experimental flexible-barrier. Top: Technical drawing from above of the barrier by courtesy of the NGE Foundation. Middle: Decomposition of the supporting cable and of their weaving with the ASM4 ring net. The circle at the cables end represent the brakes (“snake” brake provided by the NGE Foundation), and the black square represents the force sensors. Bottom: Supporting structures made of post and struts.
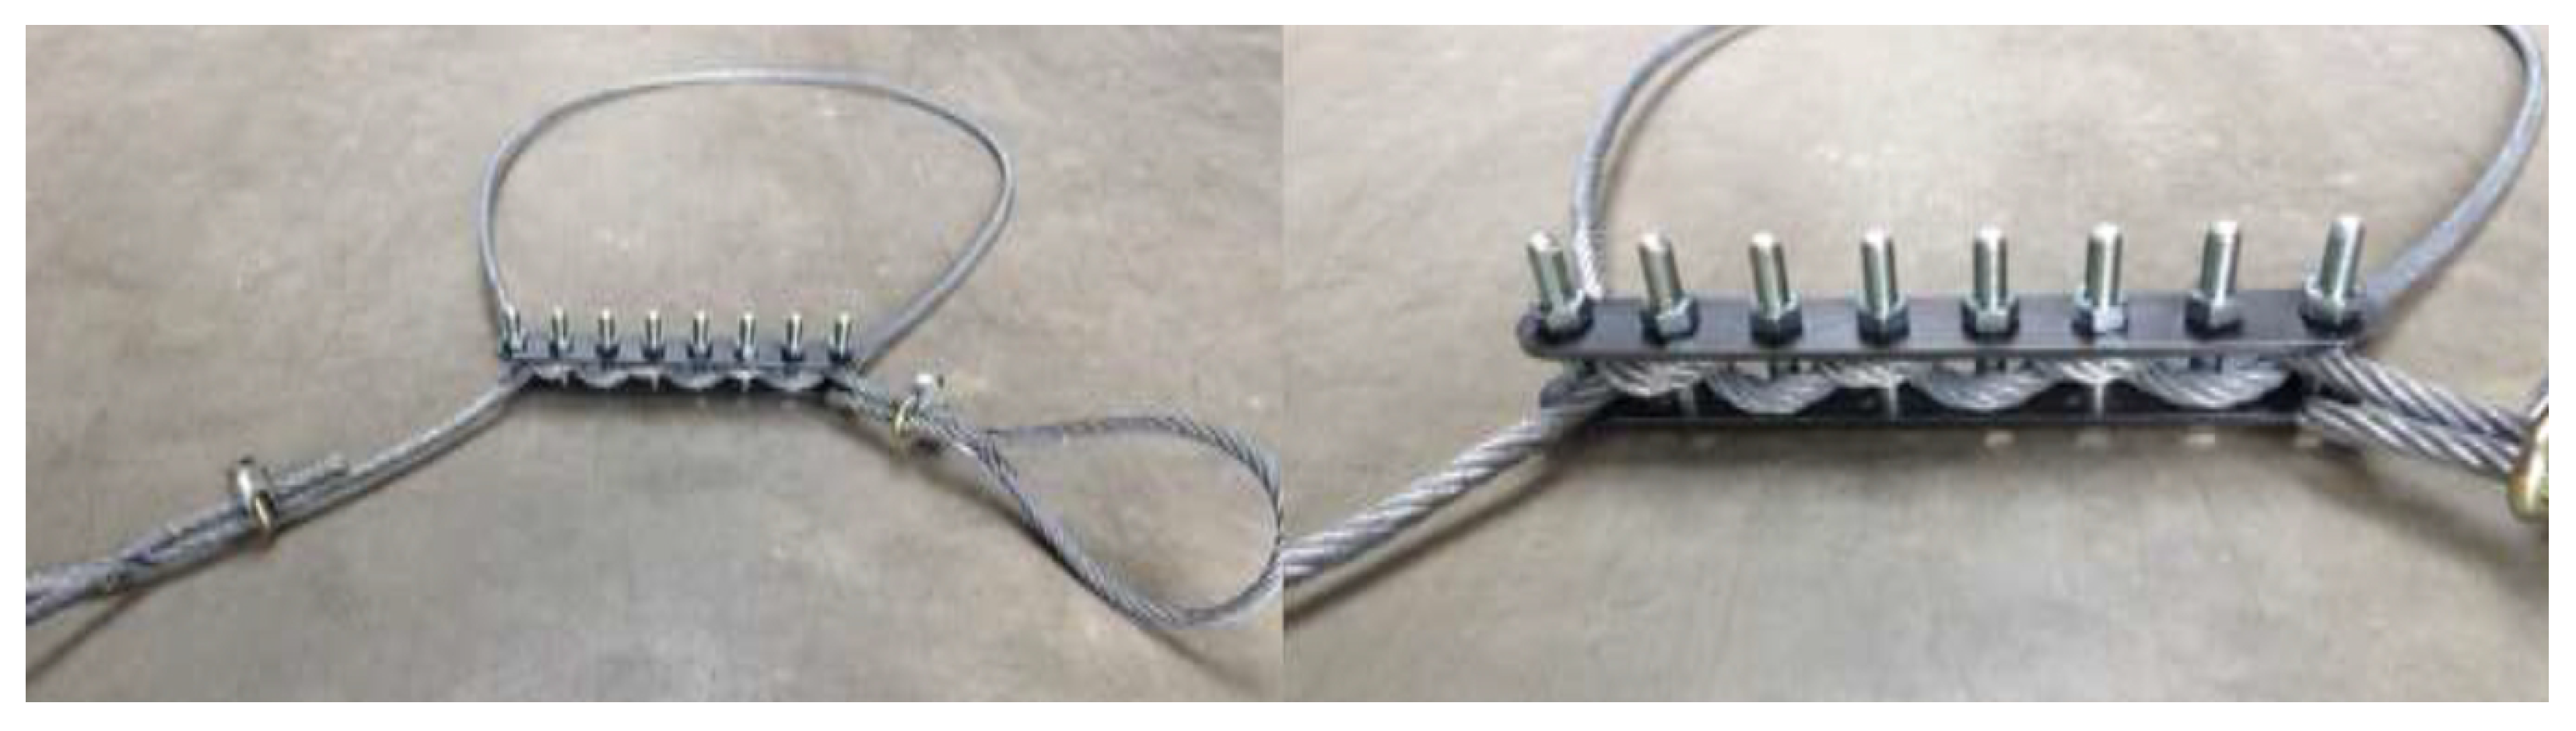
Figure 3.
Image of the snake brake provided by the NGE Foundation: it is made of two steel plates connected by a series of bolts through which a cable is braided at both ends of the loop (by courtesy of the NGE Foundation).
Figure 3.
Image of the snake brake provided by the NGE Foundation: it is made of two steel plates connected by a series of bolts through which a cable is braided at both ends of the loop (by courtesy of the NGE Foundation).
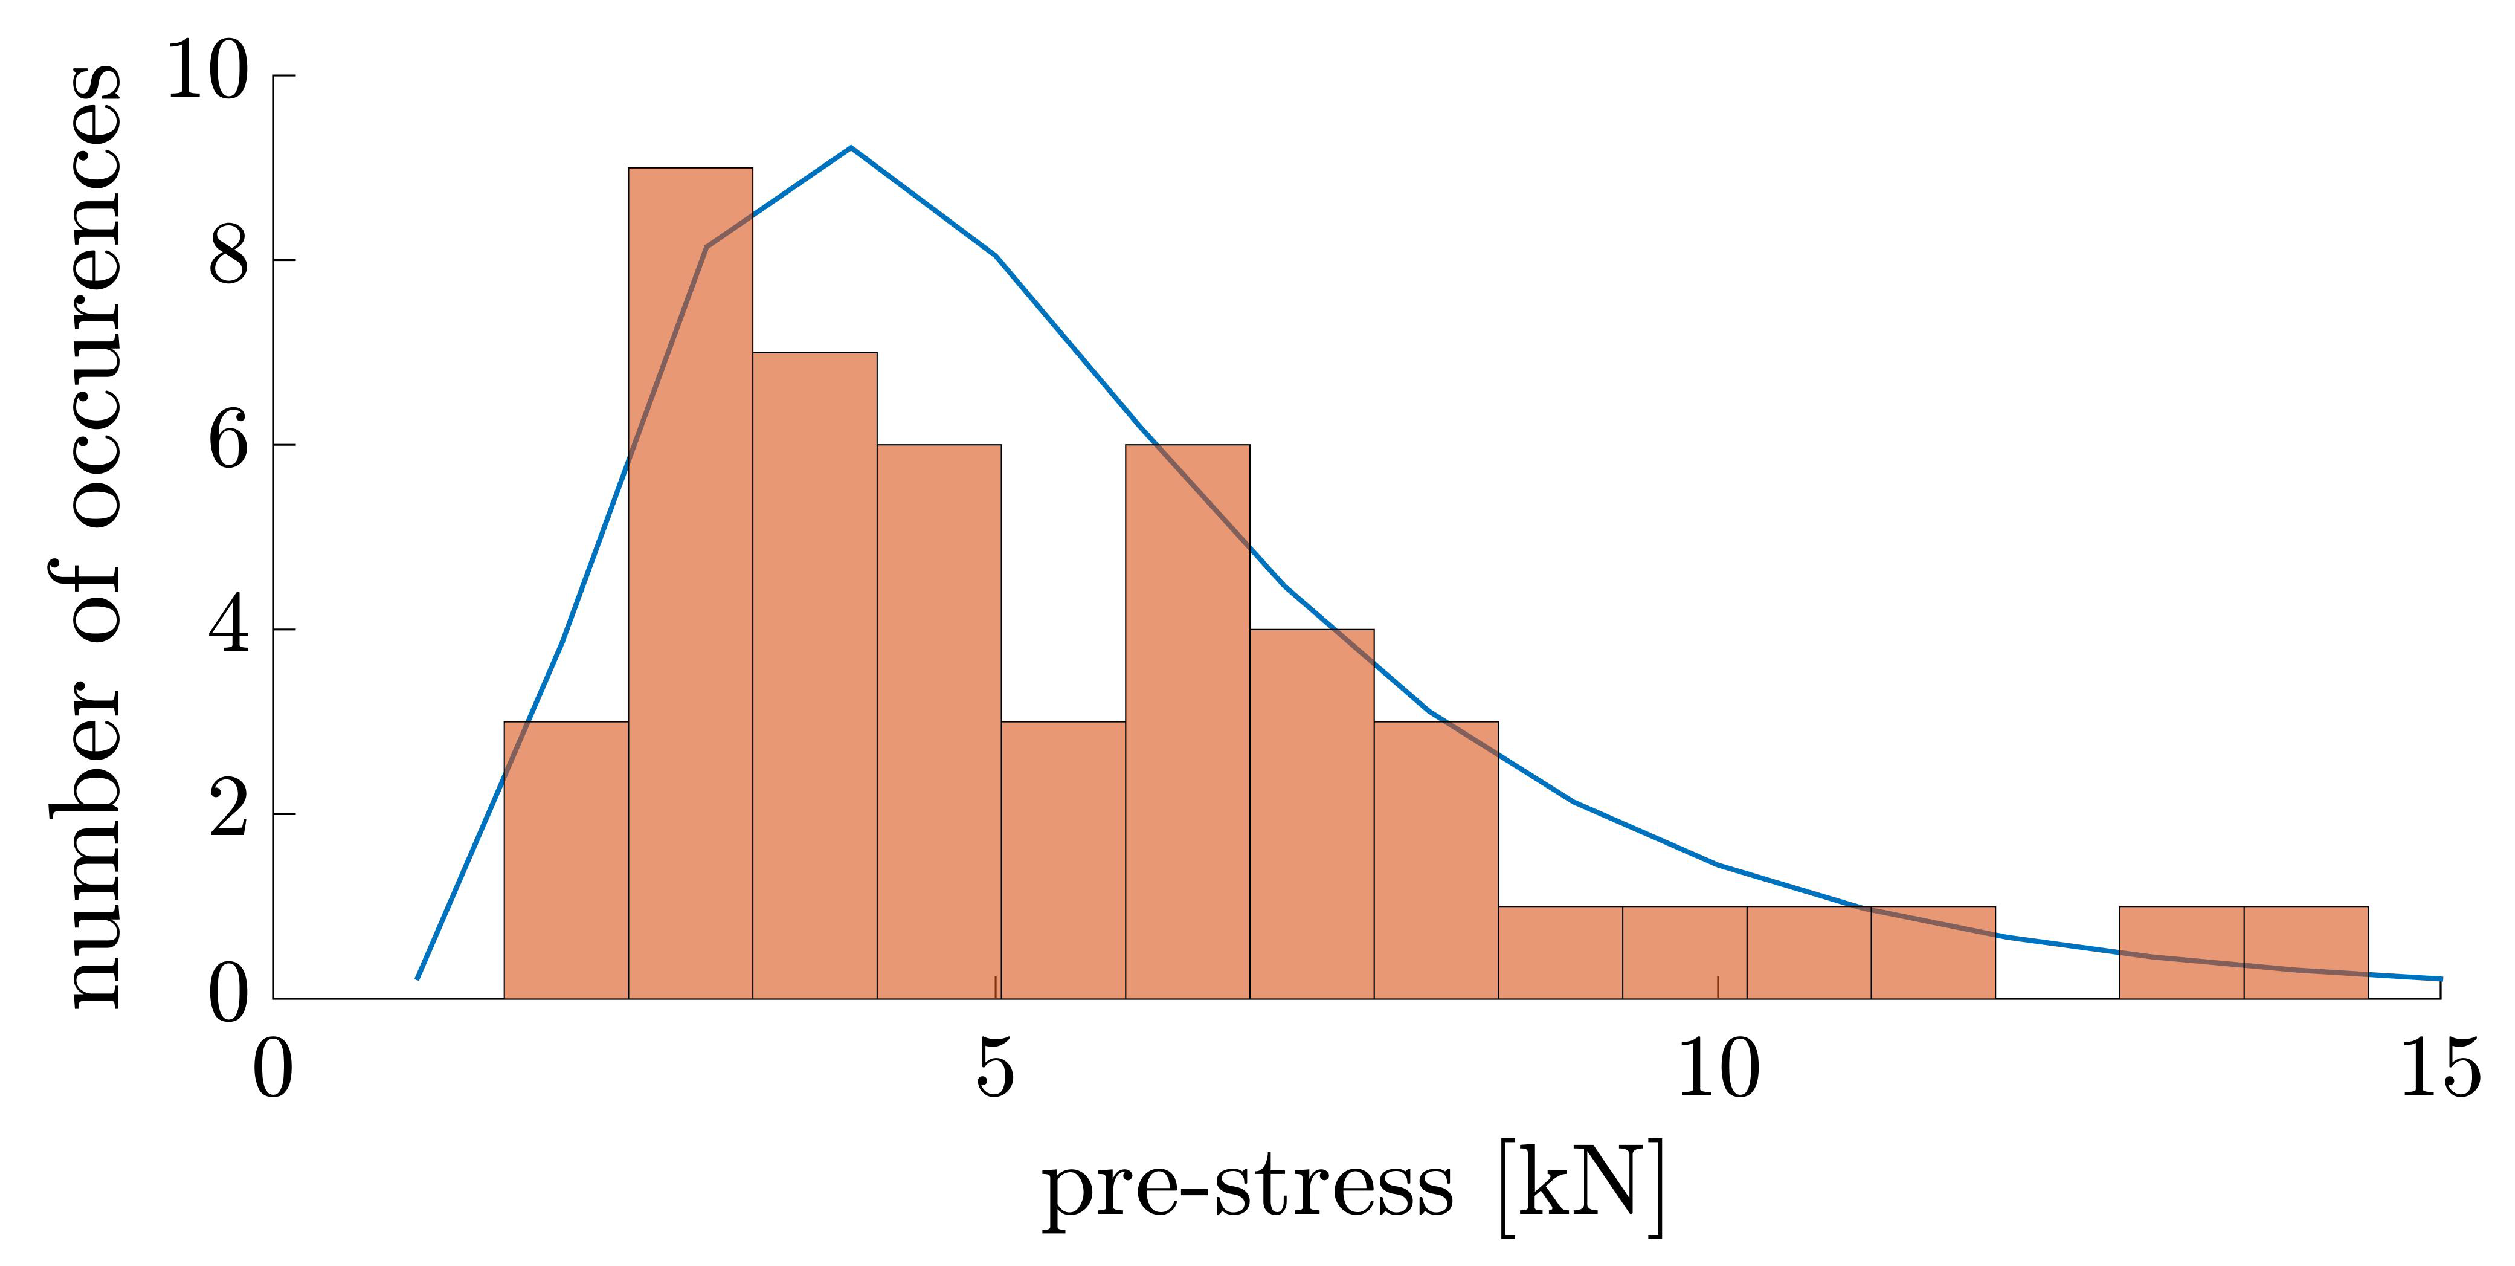
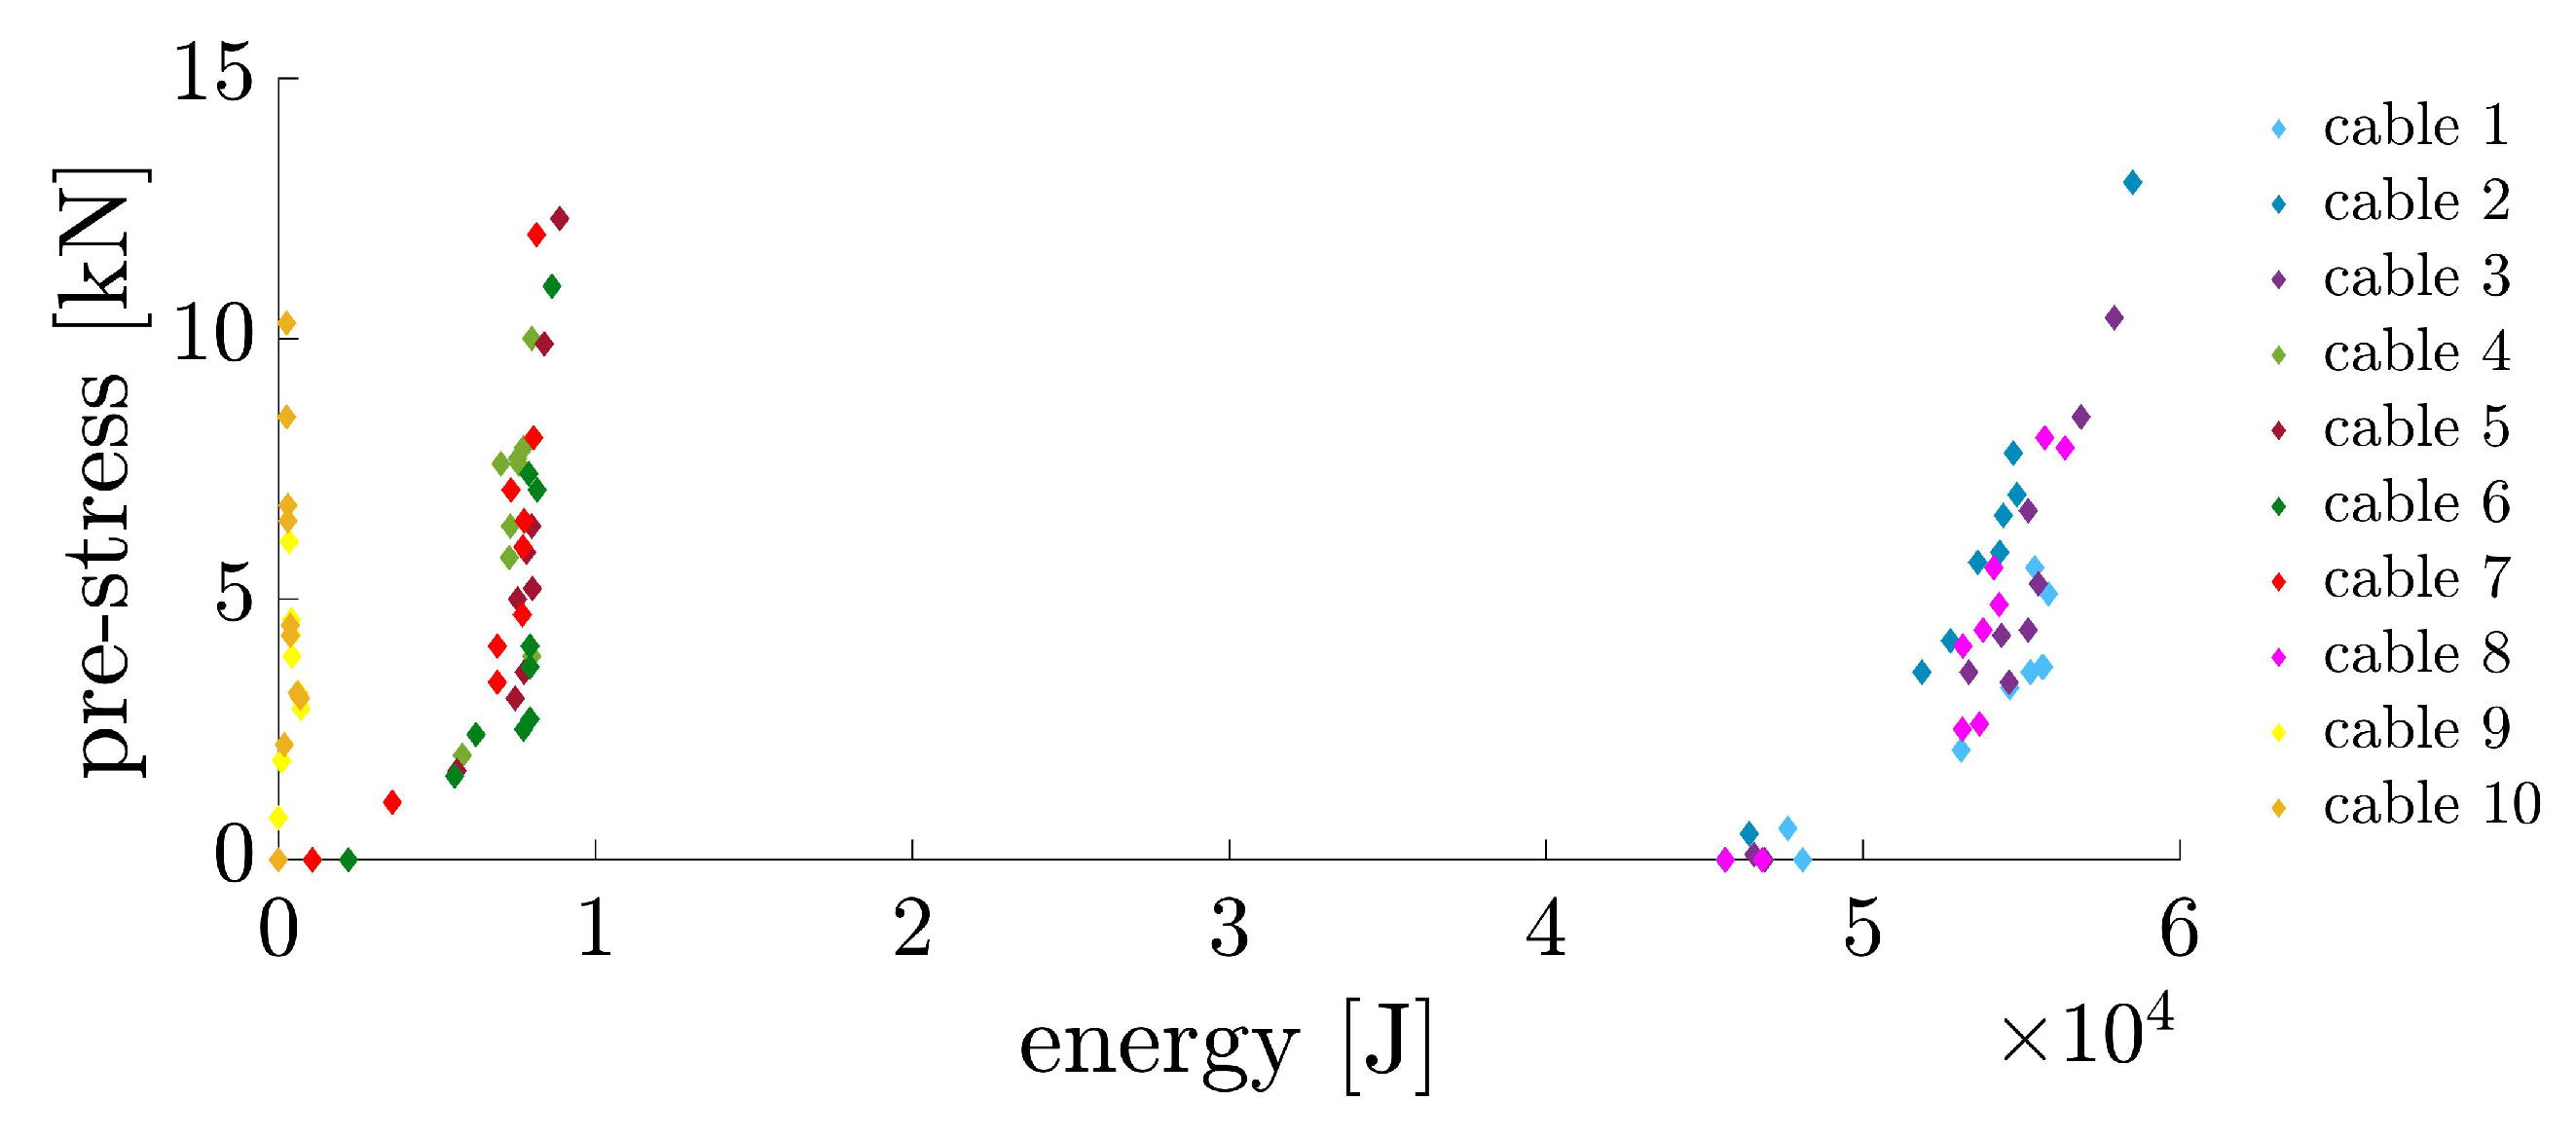
Figure 5.
Distribution of experimentally measured prestressing forces in all the cables.
Figure 5.
Distribution of experimentally measured prestressing forces in all the cables.
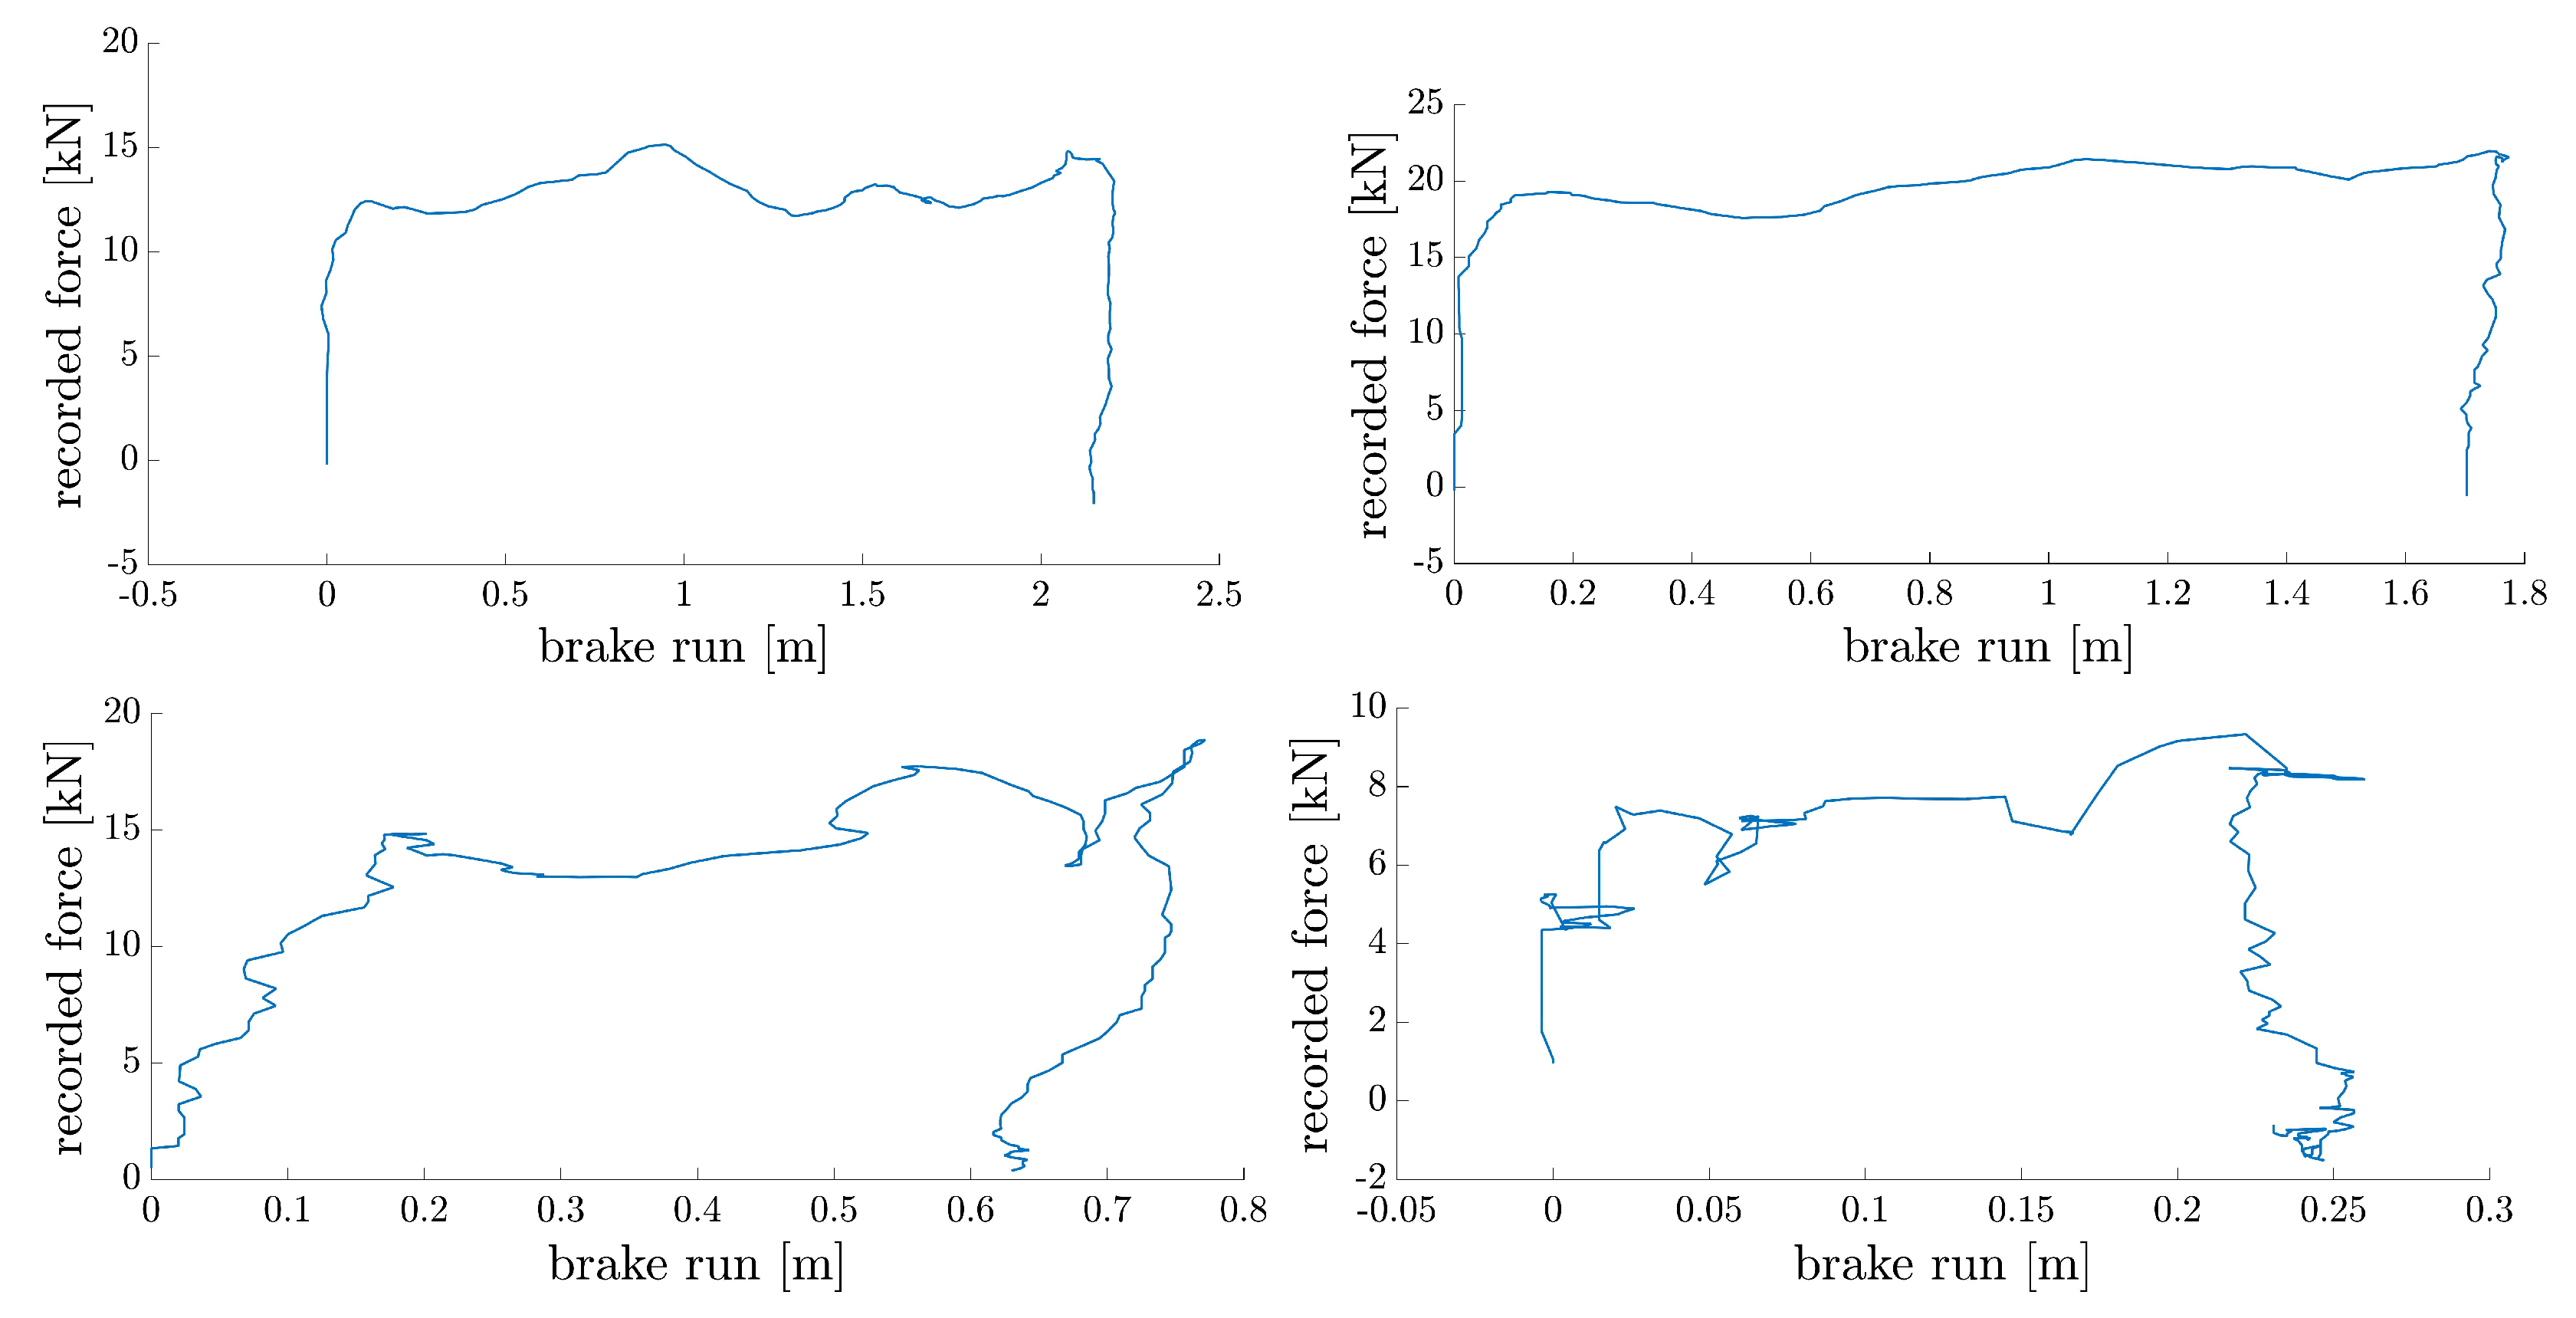
Figure 6.
Four force–displacement diagrams used to determine brake-activation thresholds. For left to right and top to bottom: Off-centred impact, cable 3; off-centred impact, cable 1; lateral impact, cable 2; consecutive impact, cable 8. –pre-stress was taken into account.
Figure 6.
Four force–displacement diagrams used to determine brake-activation thresholds. For left to right and top to bottom: Off-centred impact, cable 3; off-centred impact, cable 1; lateral impact, cable 2; consecutive impact, cable 8. –pre-stress was taken into account.
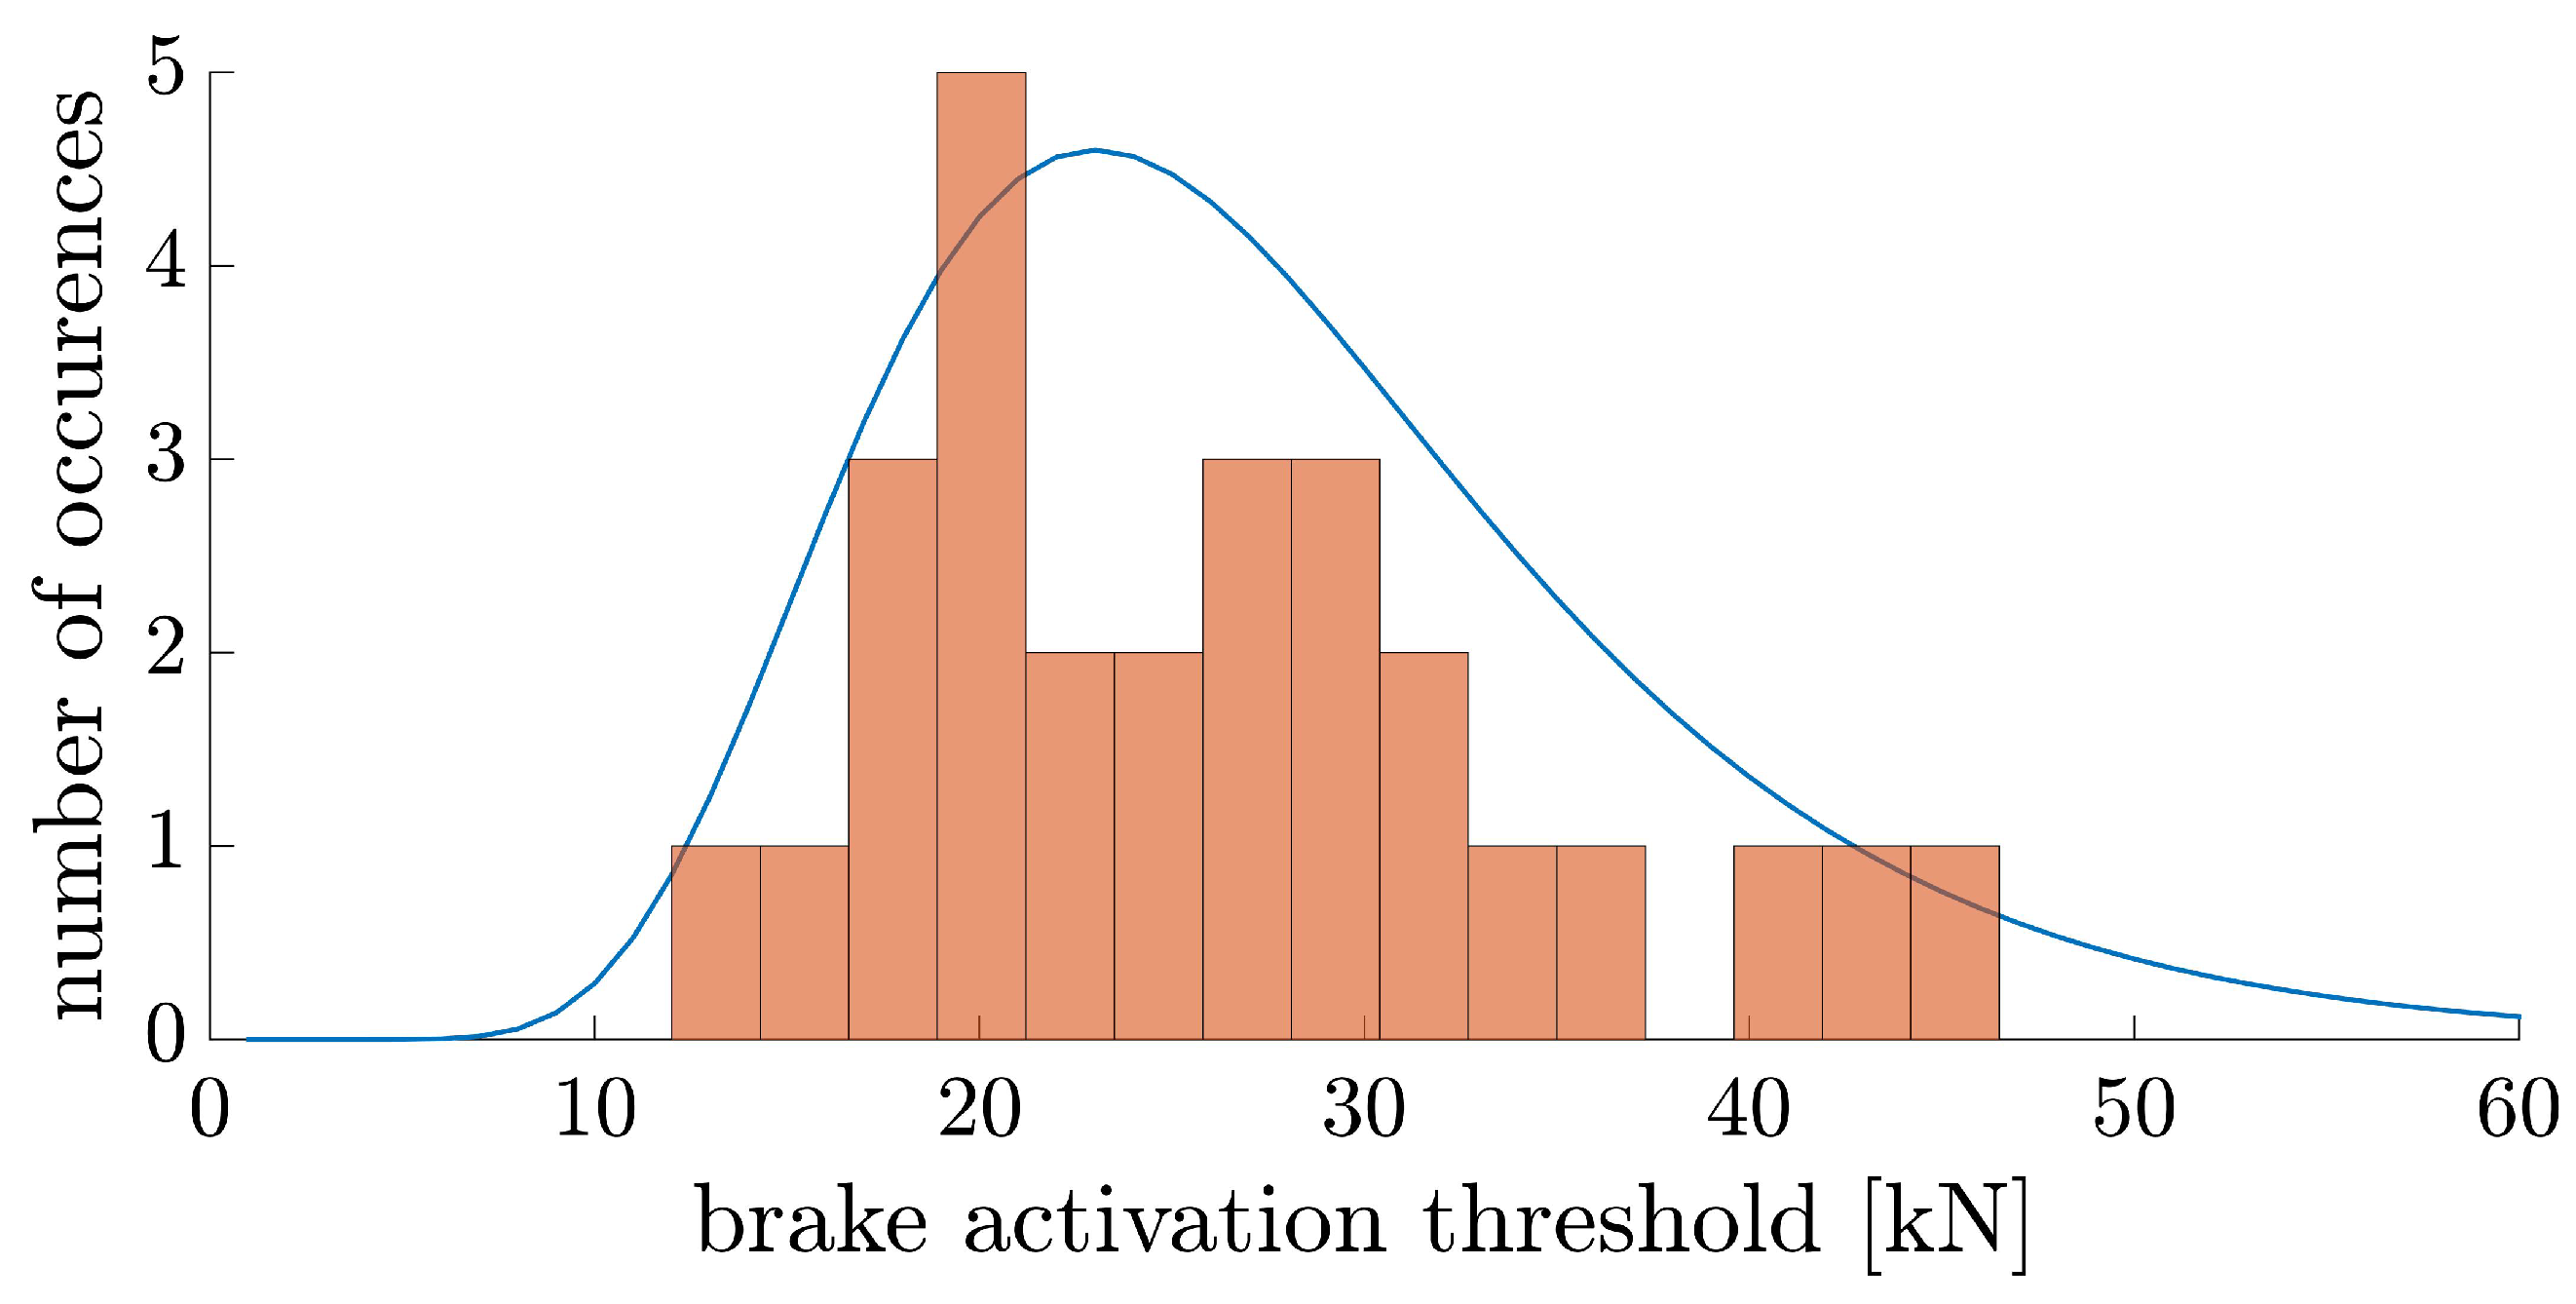
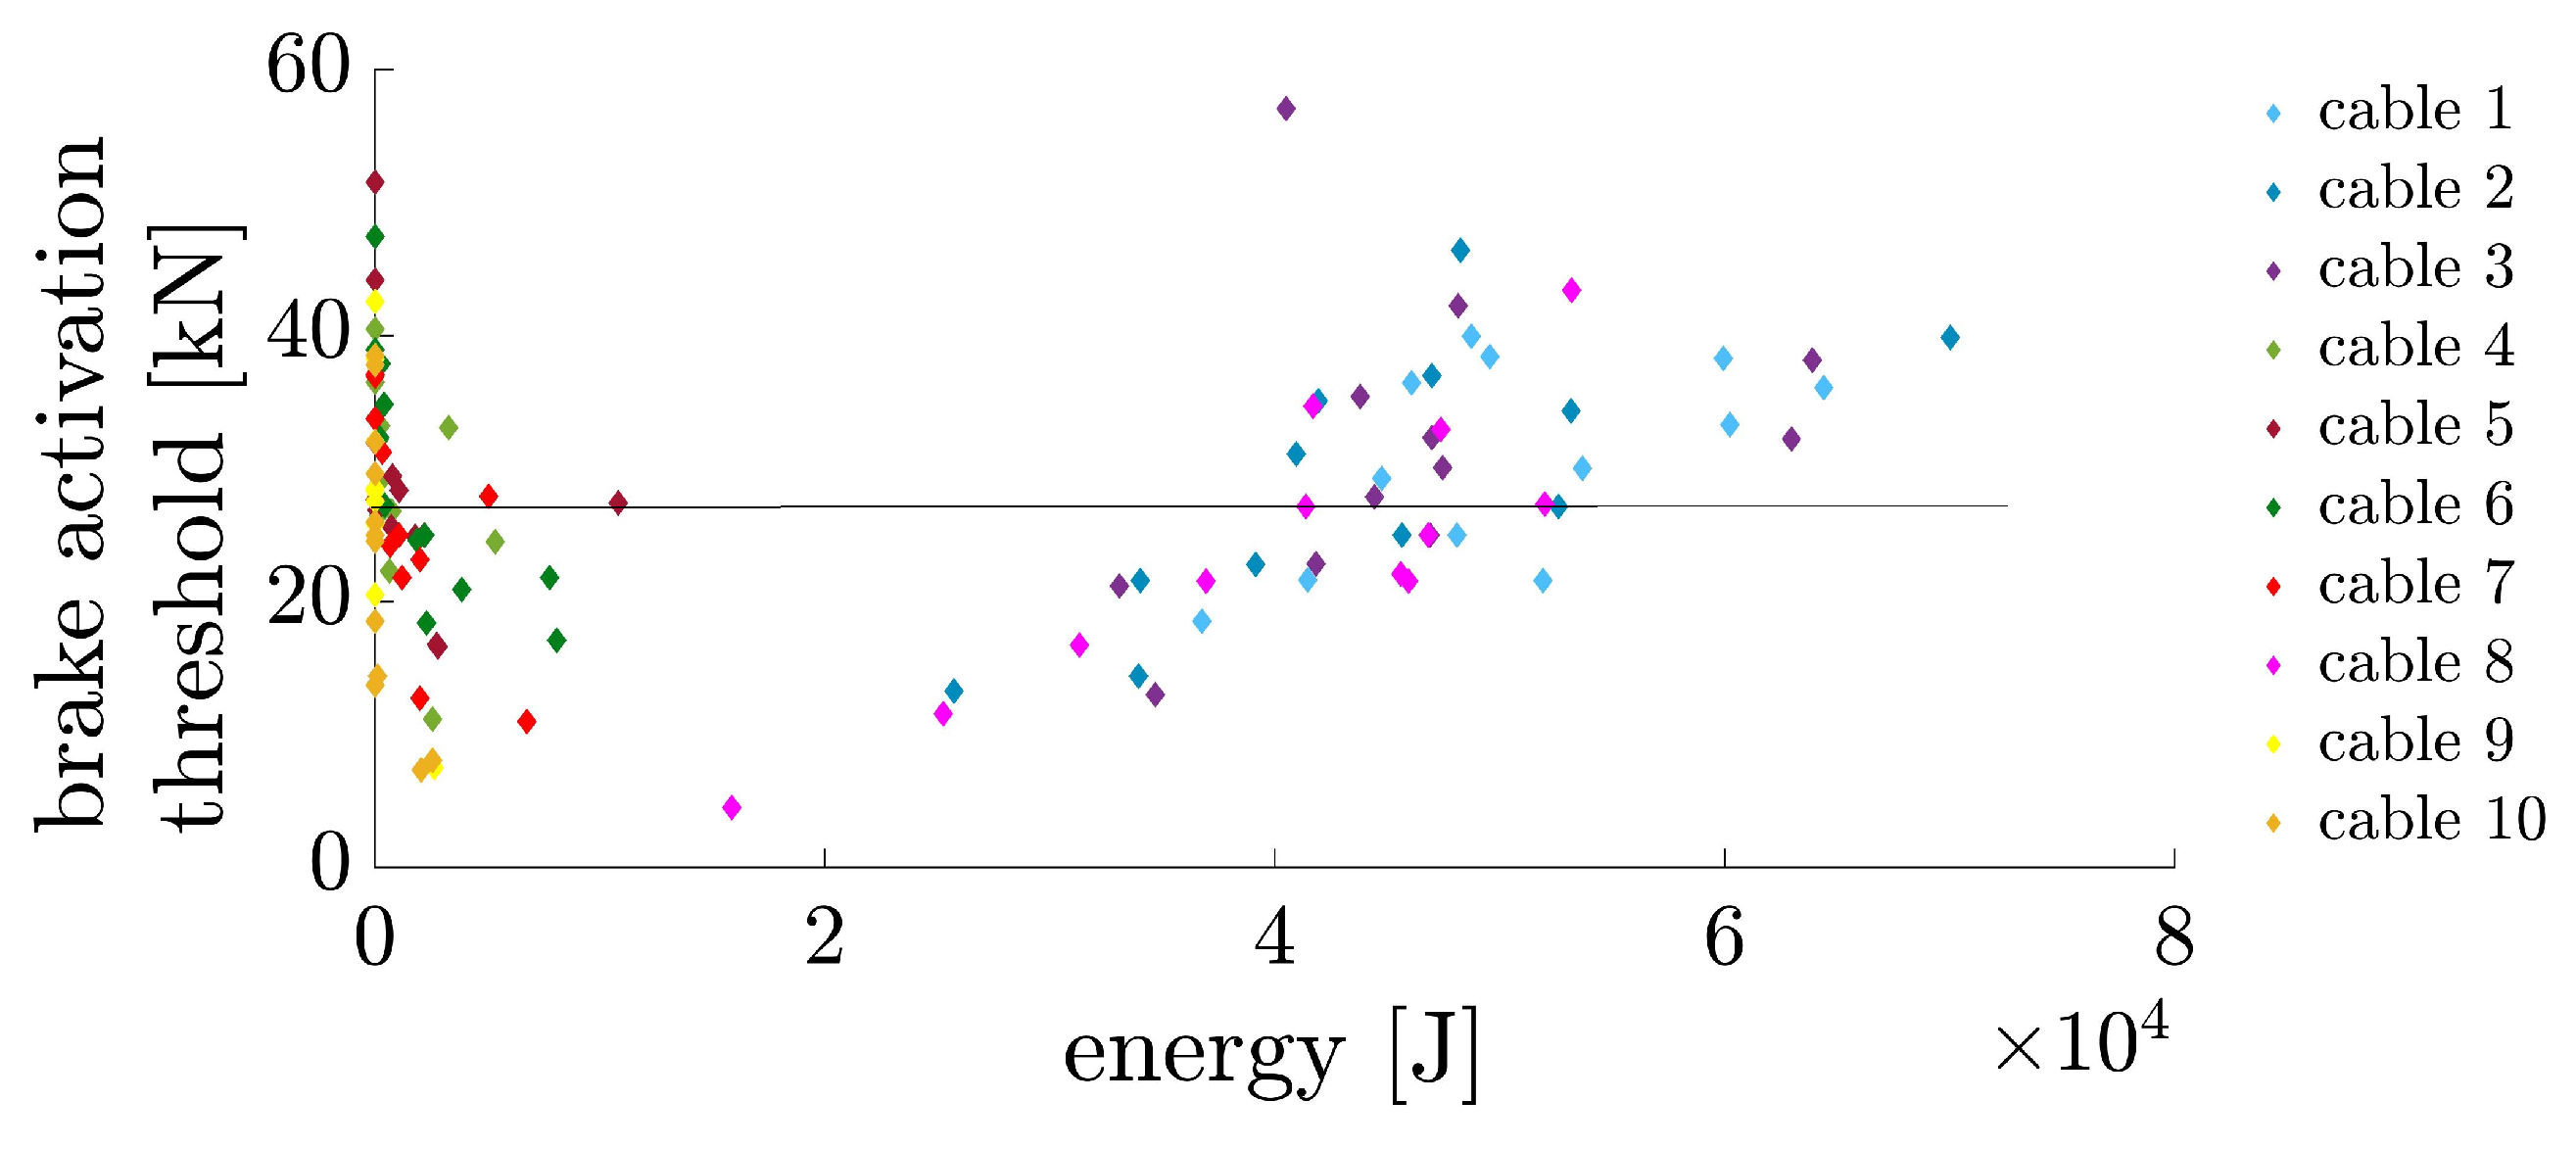
Figure 7.
Distribution of experimentally measured brake-activation thresholds.
Figure 7.
Distribution of experimentally measured brake-activation thresholds.
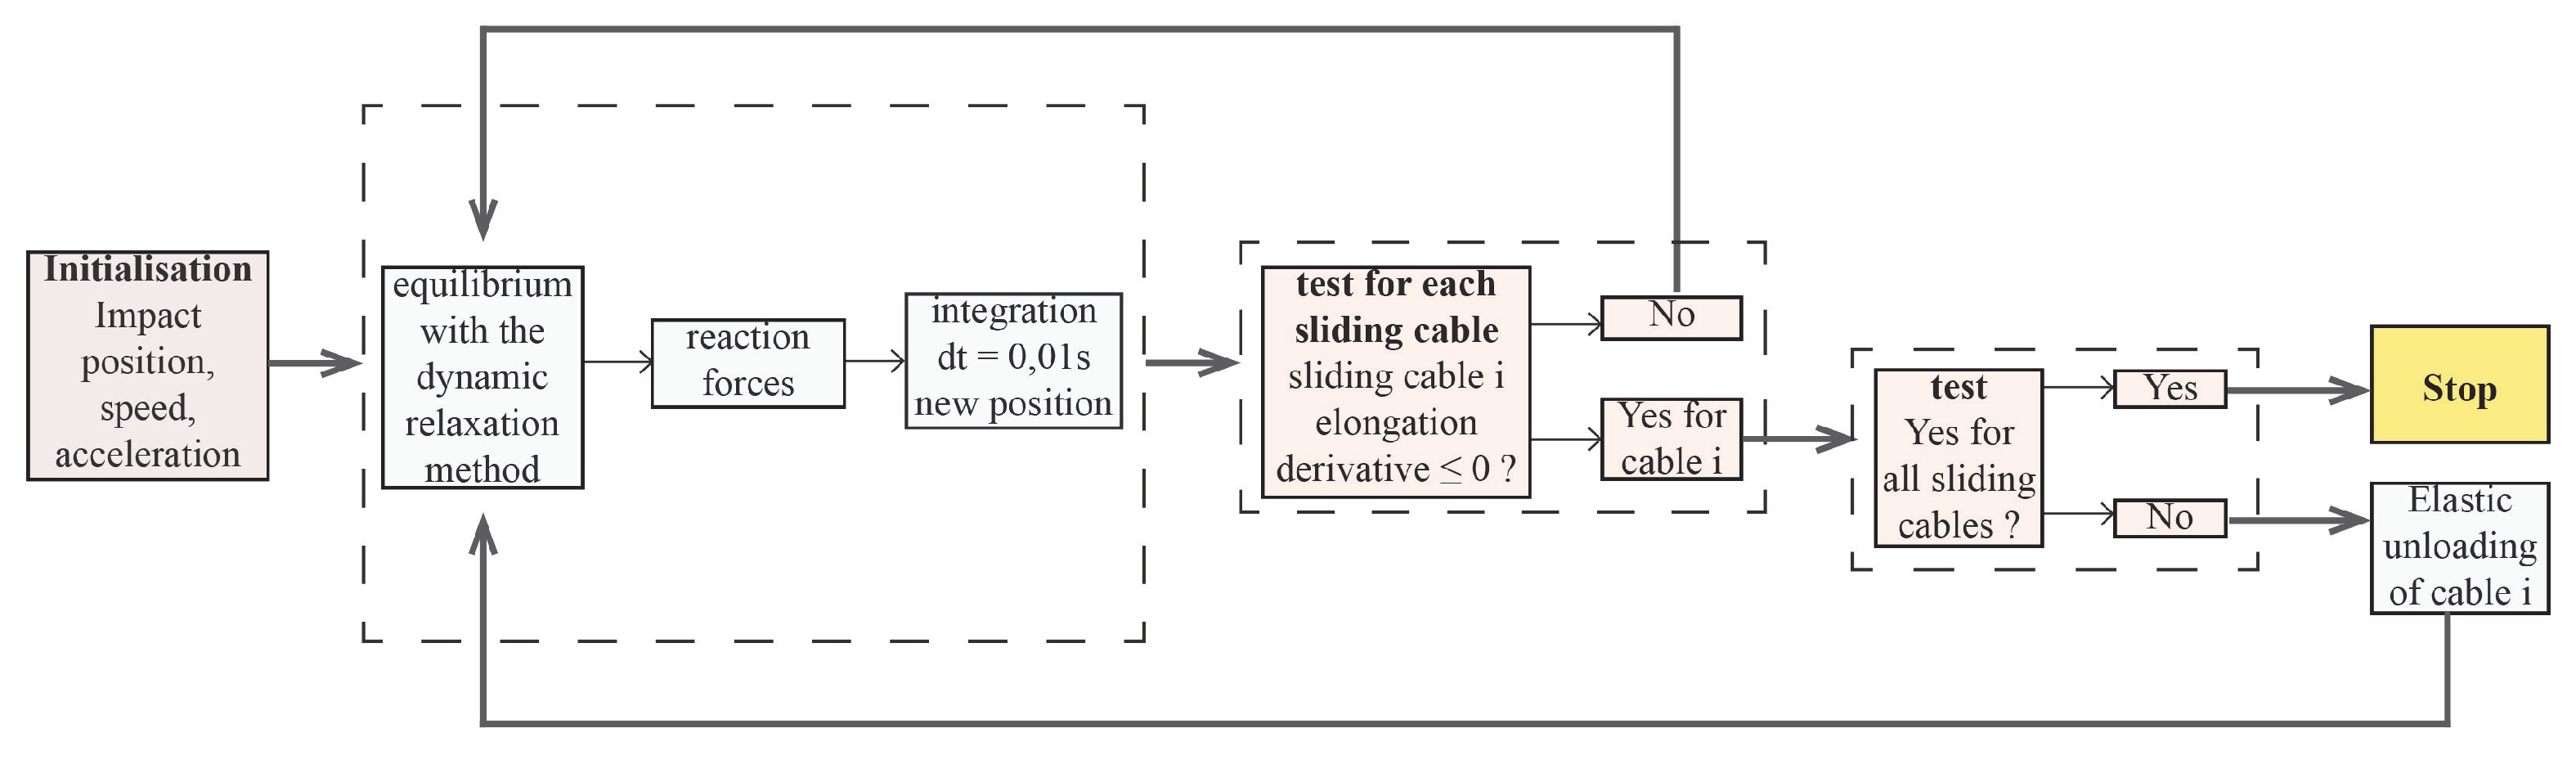
Figure 8.
Equivalent spring-mass dynamic algorithm of the barrier.
Figure 8.
Equivalent spring-mass dynamic algorithm of the barrier.
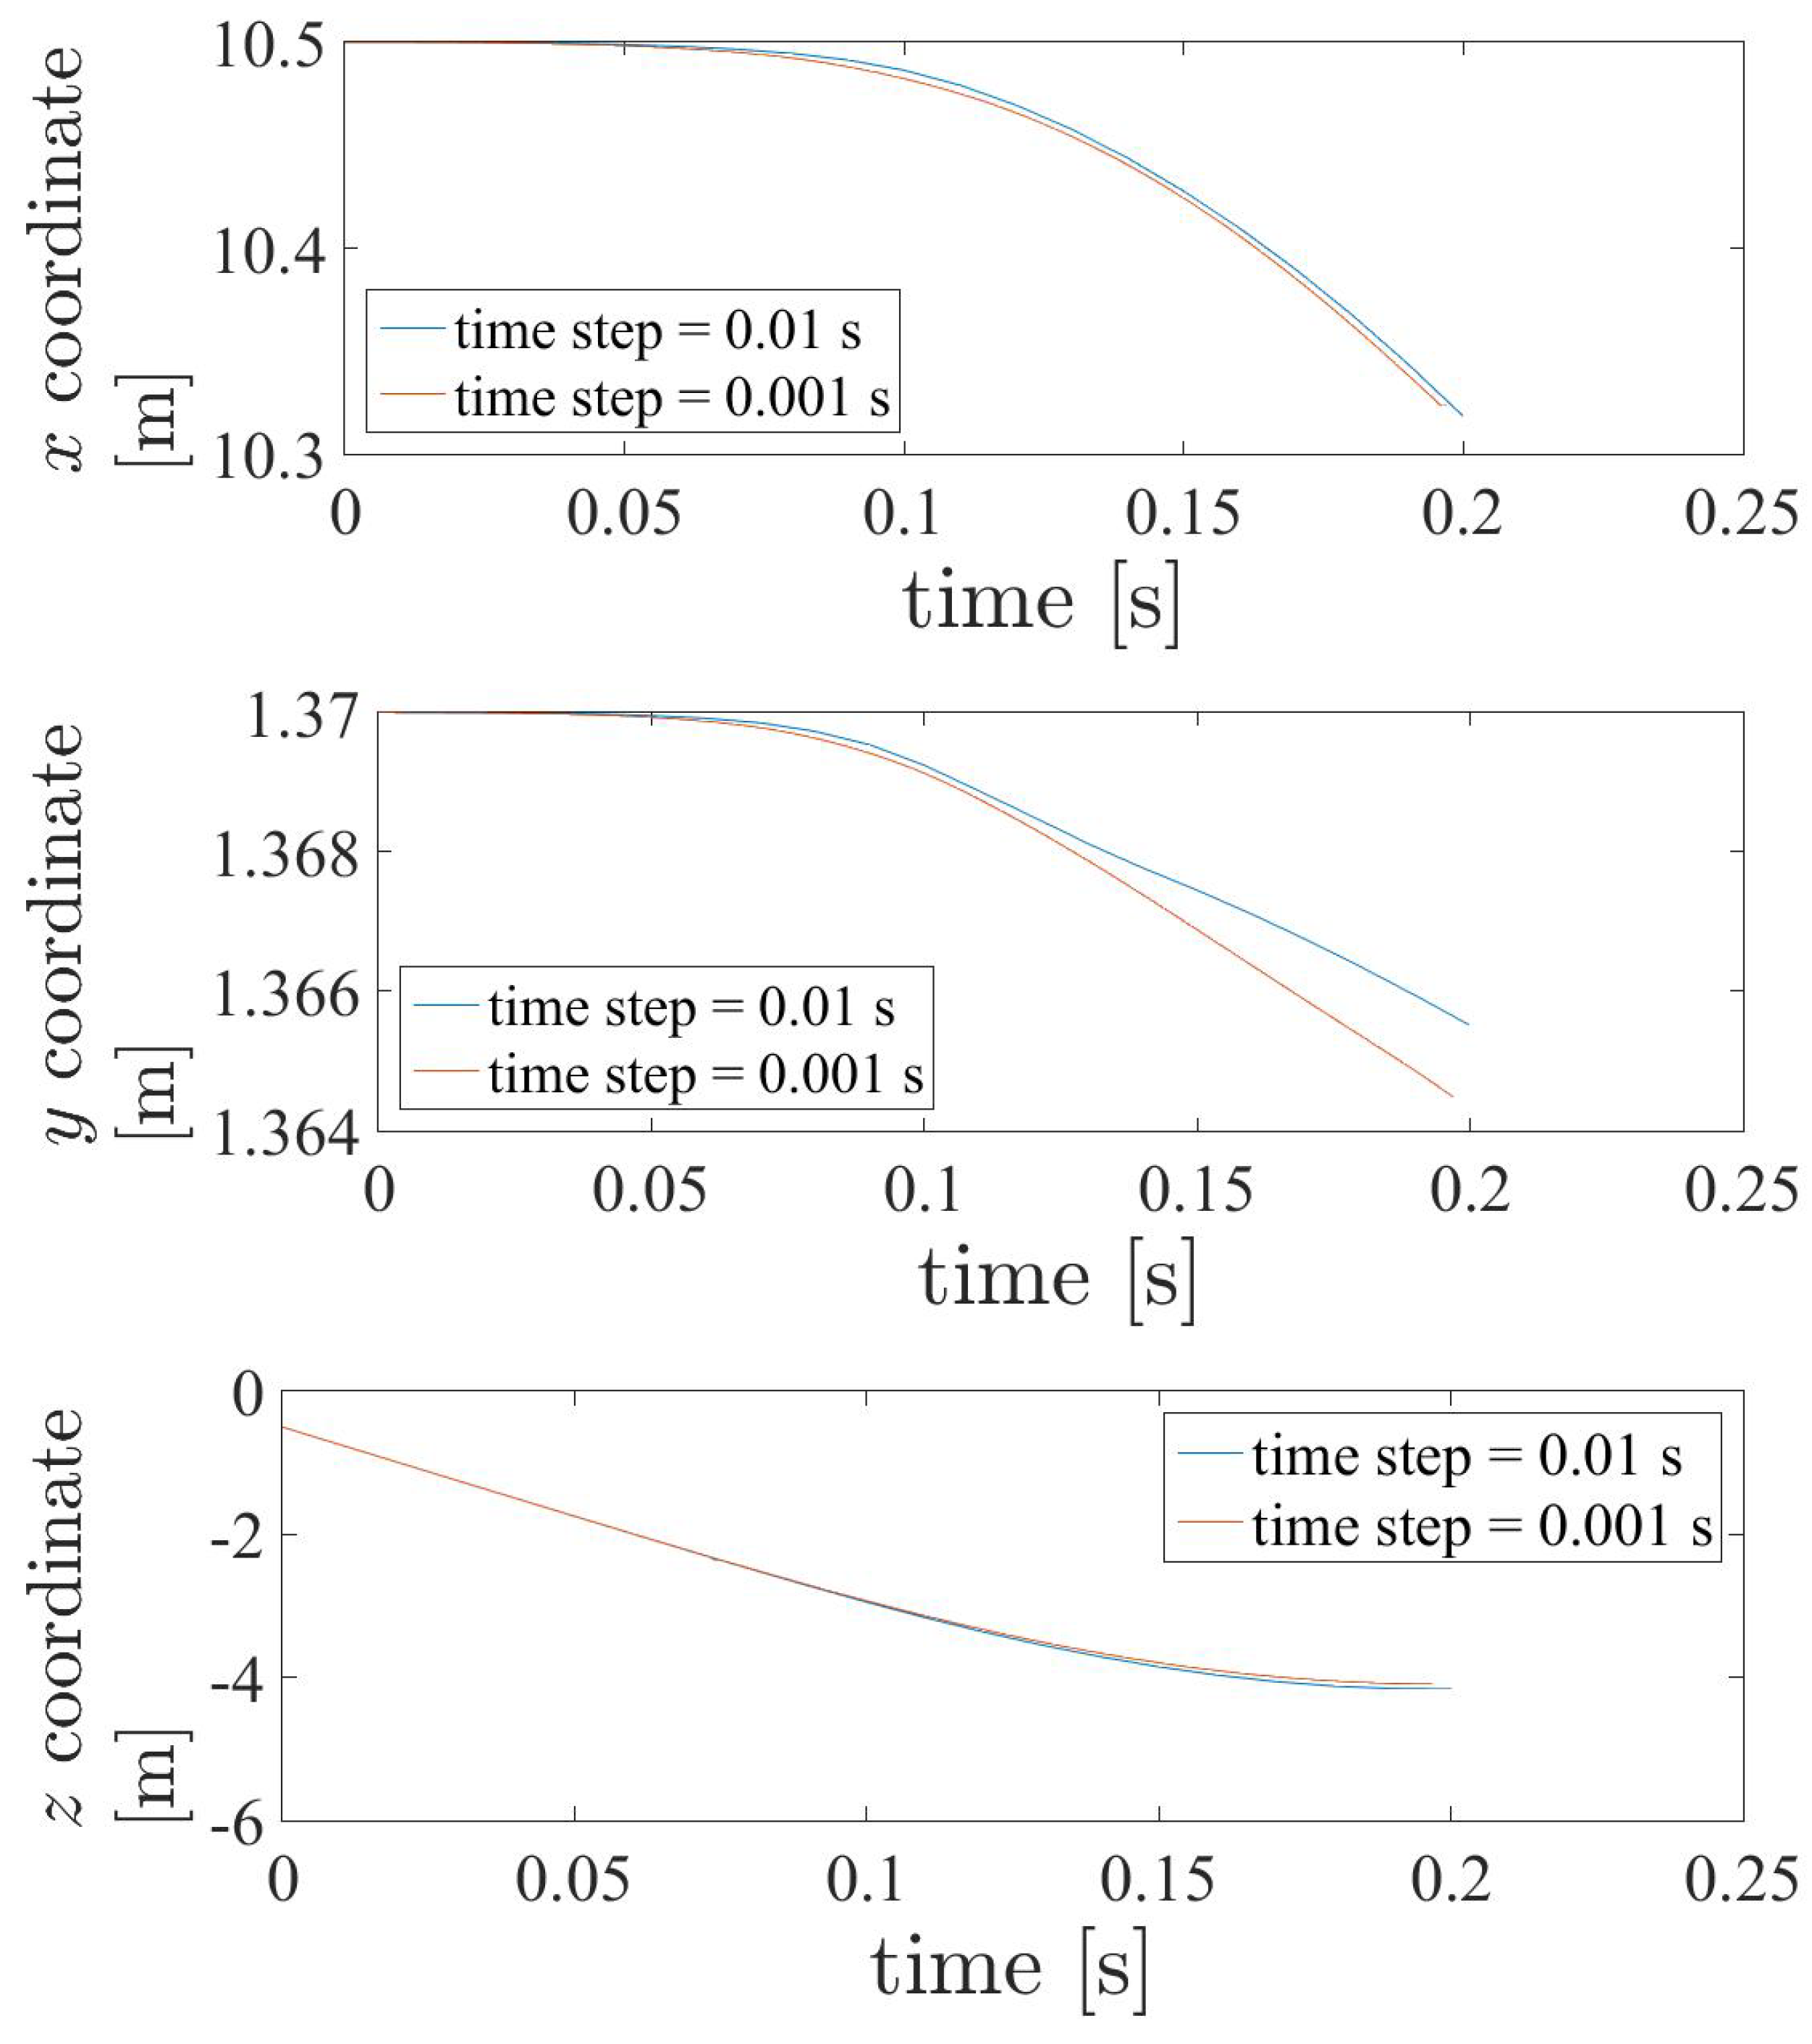
Figure 9.
Position in the x, y and z directions as a function of time for s and s.
Figure 9.
Position in the x, y and z directions as a function of time for s and s.
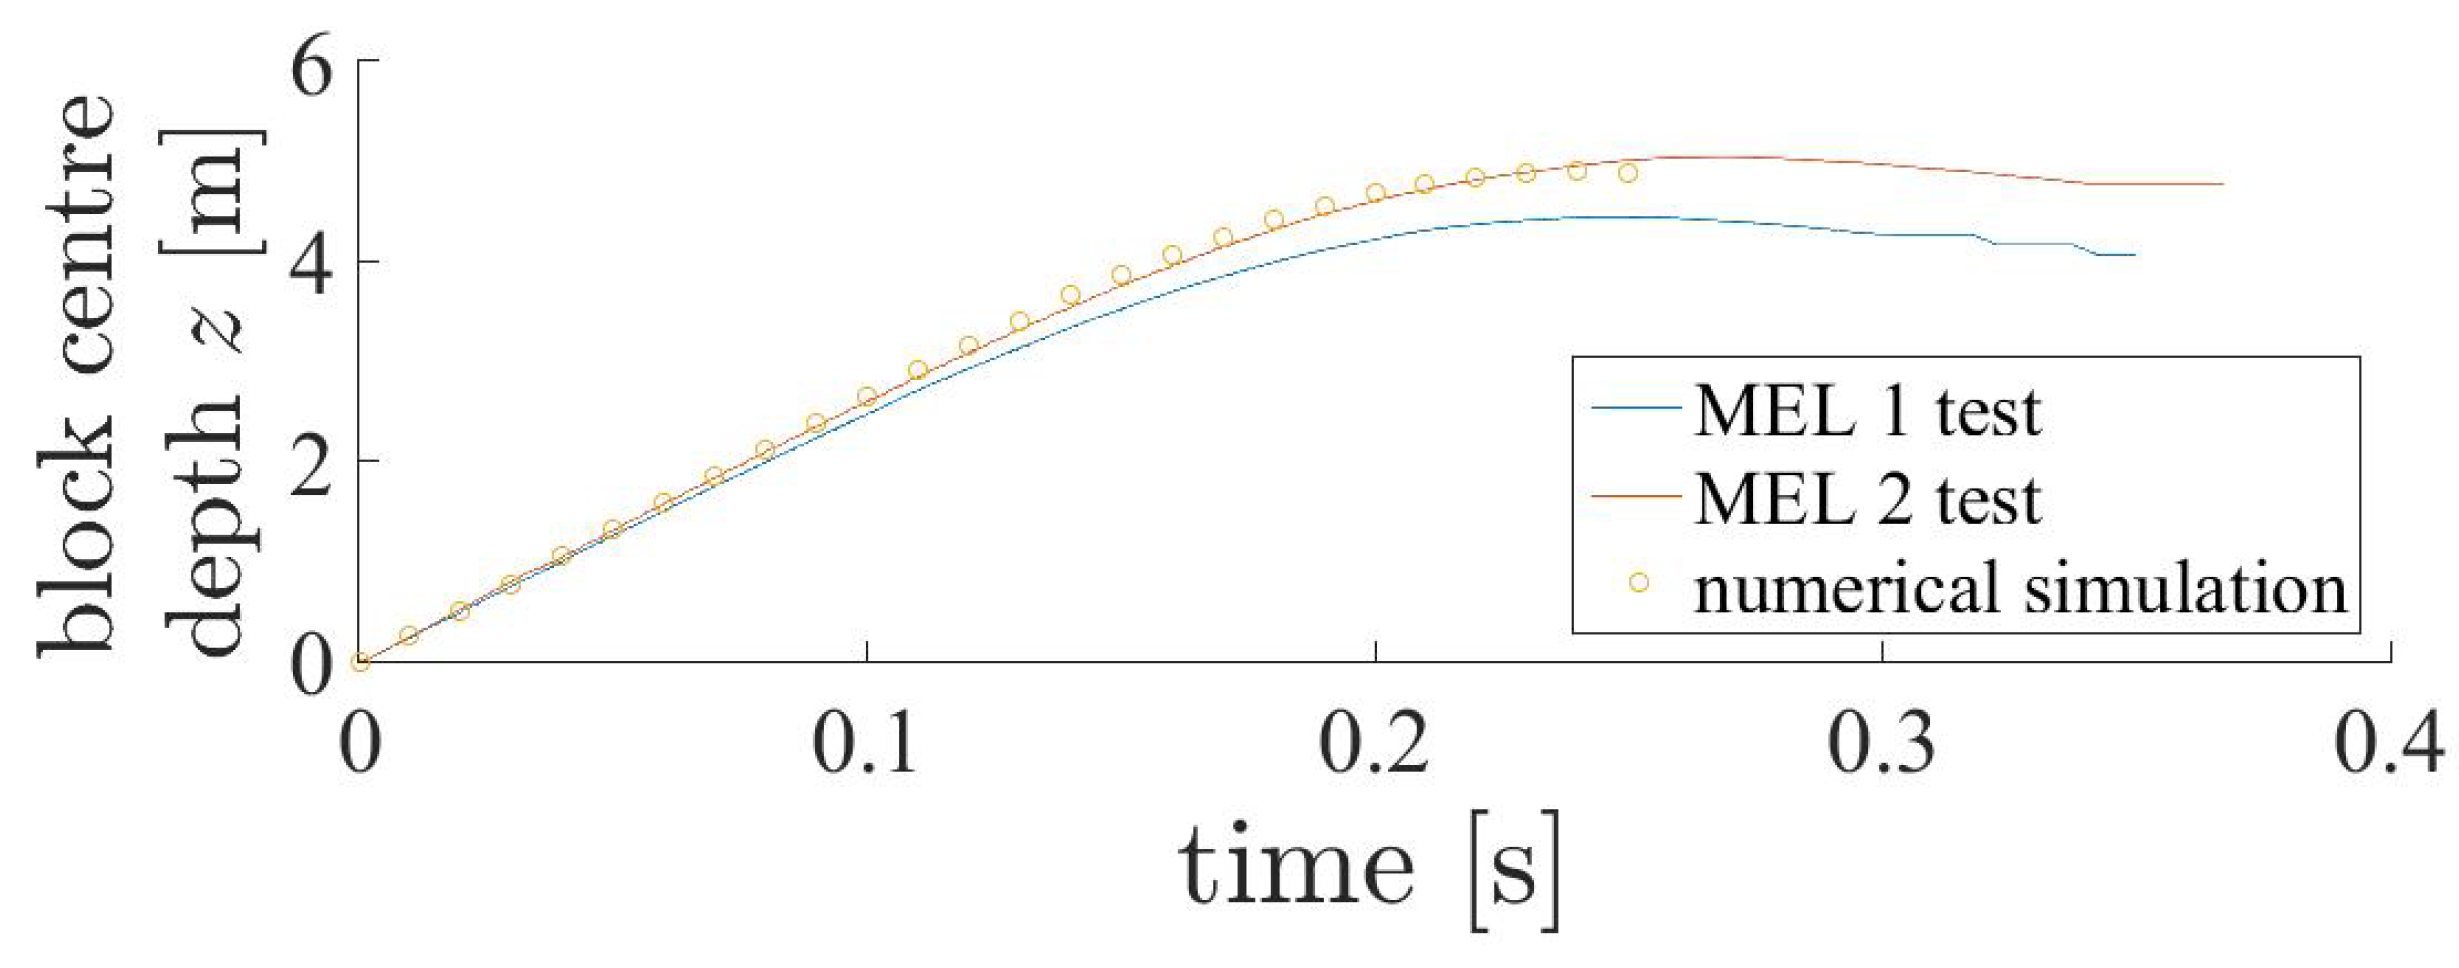
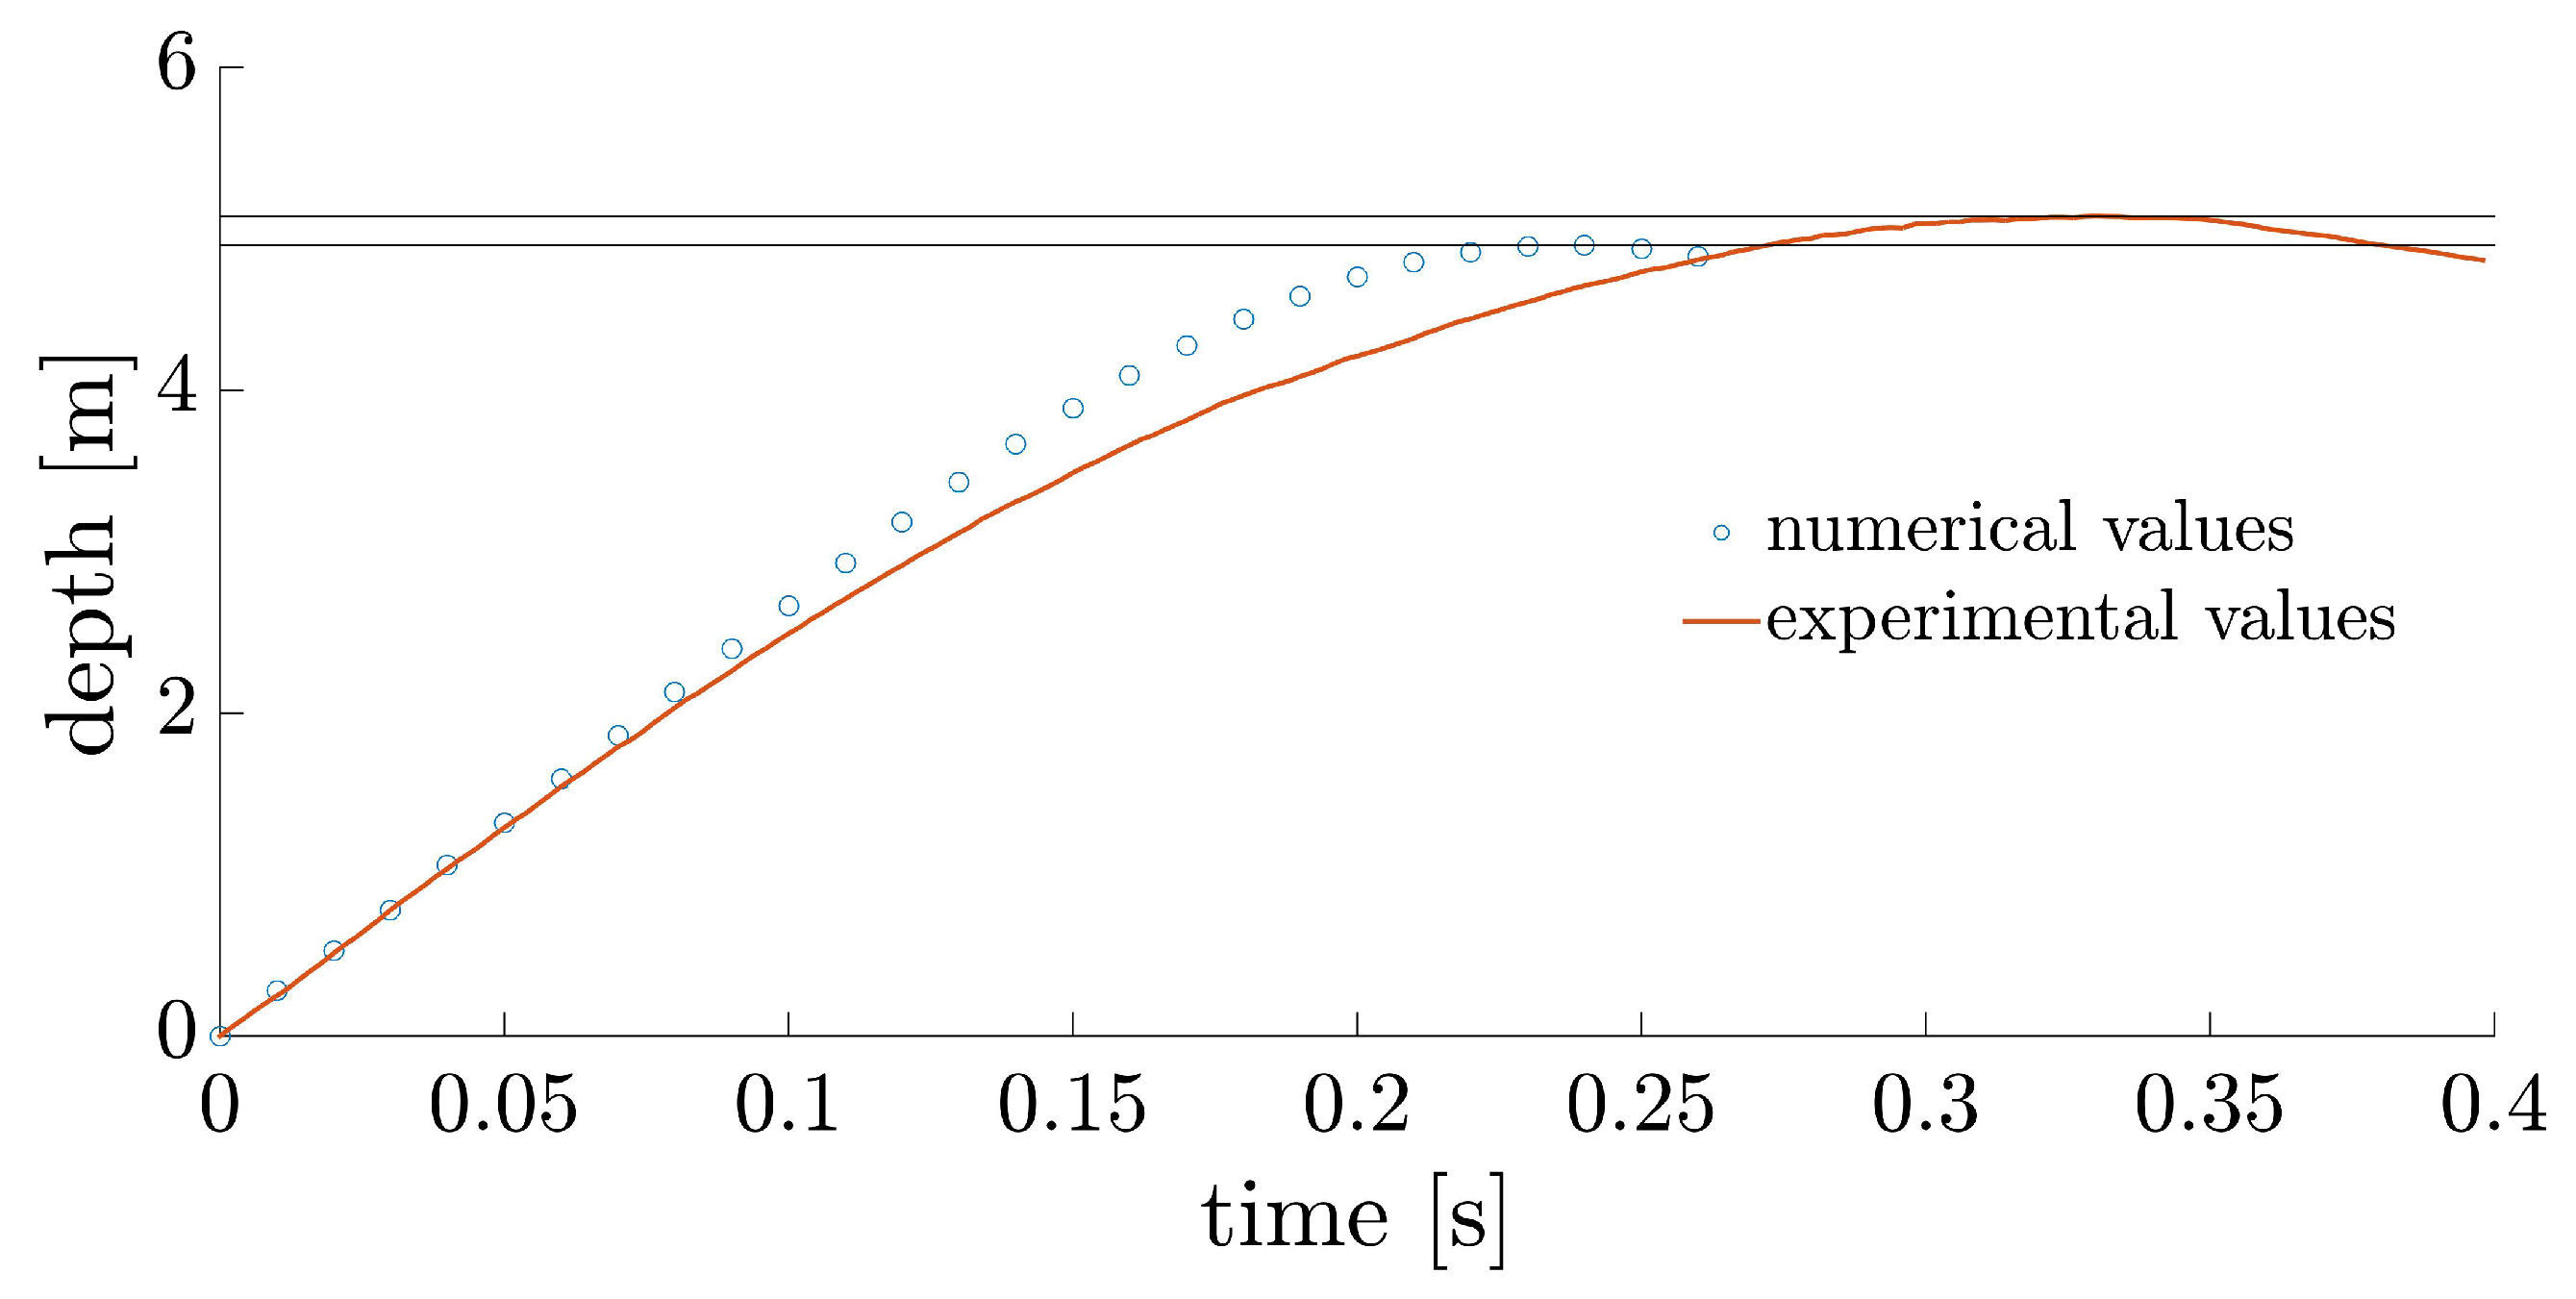
Figure 10.
Displacement of the block centre as a function of time: MEL and numerical-test comparisons.
Figure 10.
Displacement of the block centre as a function of time: MEL and numerical-test comparisons.
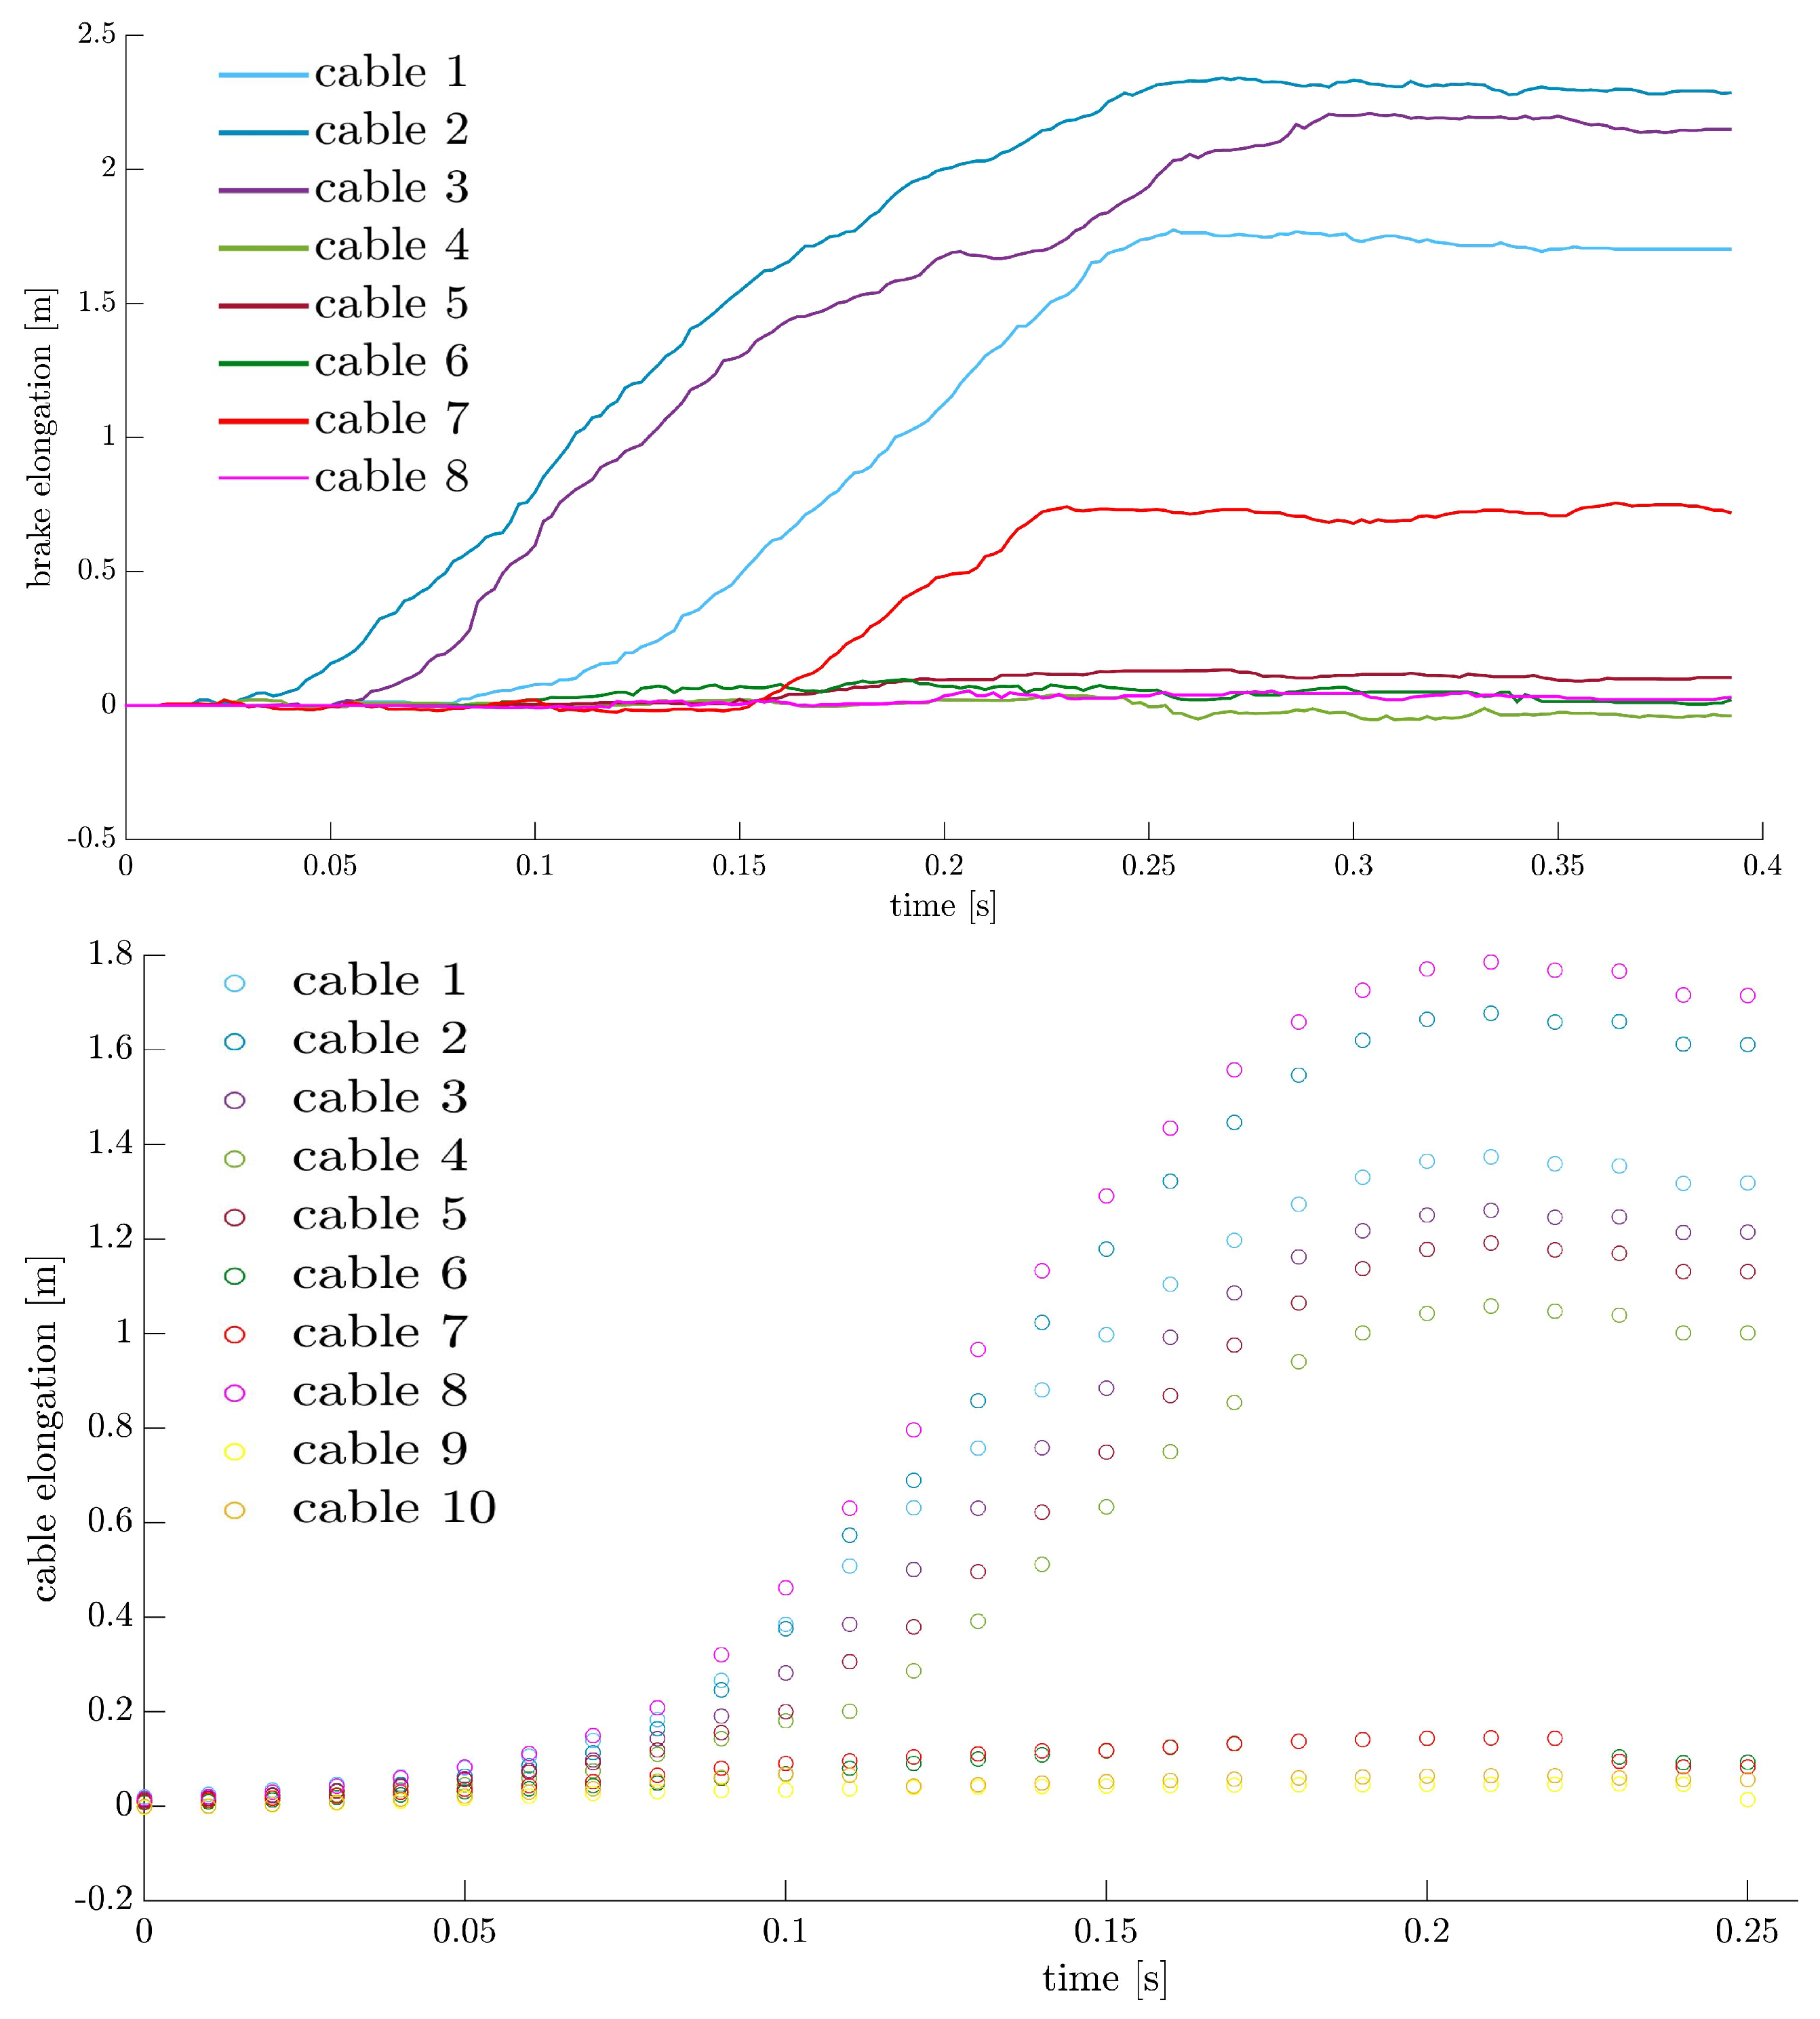
Figure 11.
Above: Experimental brake elongation (off-centre impact) as a function of time. Below: Numerical brake elongation (off-centre impact) as a function of time.
Figure 11.
Above: Experimental brake elongation (off-centre impact) as a function of time. Below: Numerical brake elongation (off-centre impact) as a function of time.
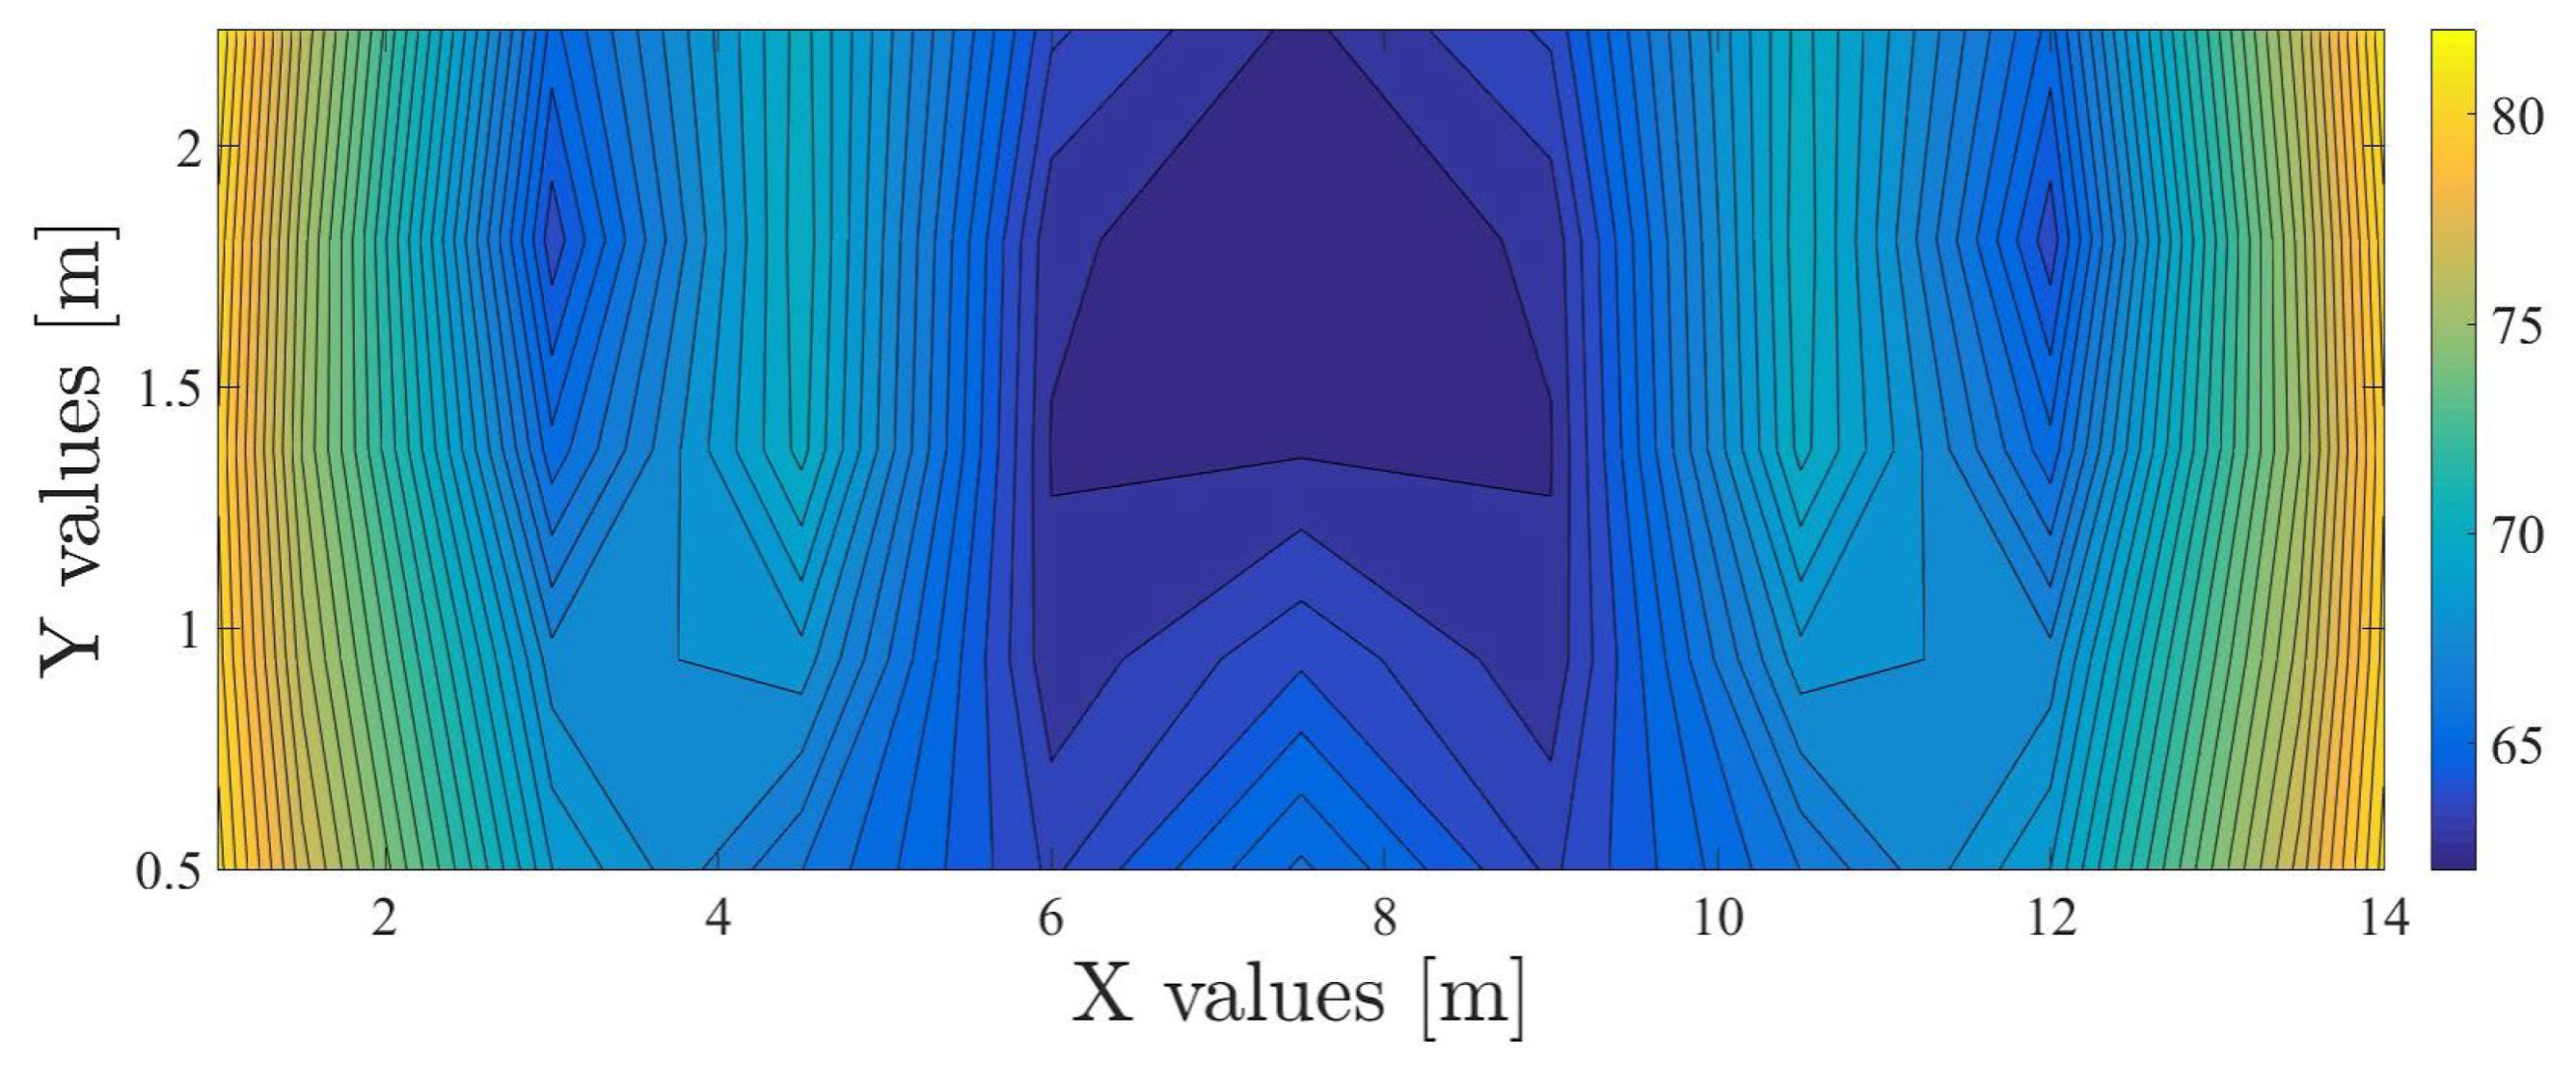
Figure 12.
Mapping of the static force as a function of the impact position on the net (kN) for an impacting energy of 270 kJ.
Figure 12.
Mapping of the static force as a function of the impact position on the net (kN) for an impacting energy of 270 kJ.
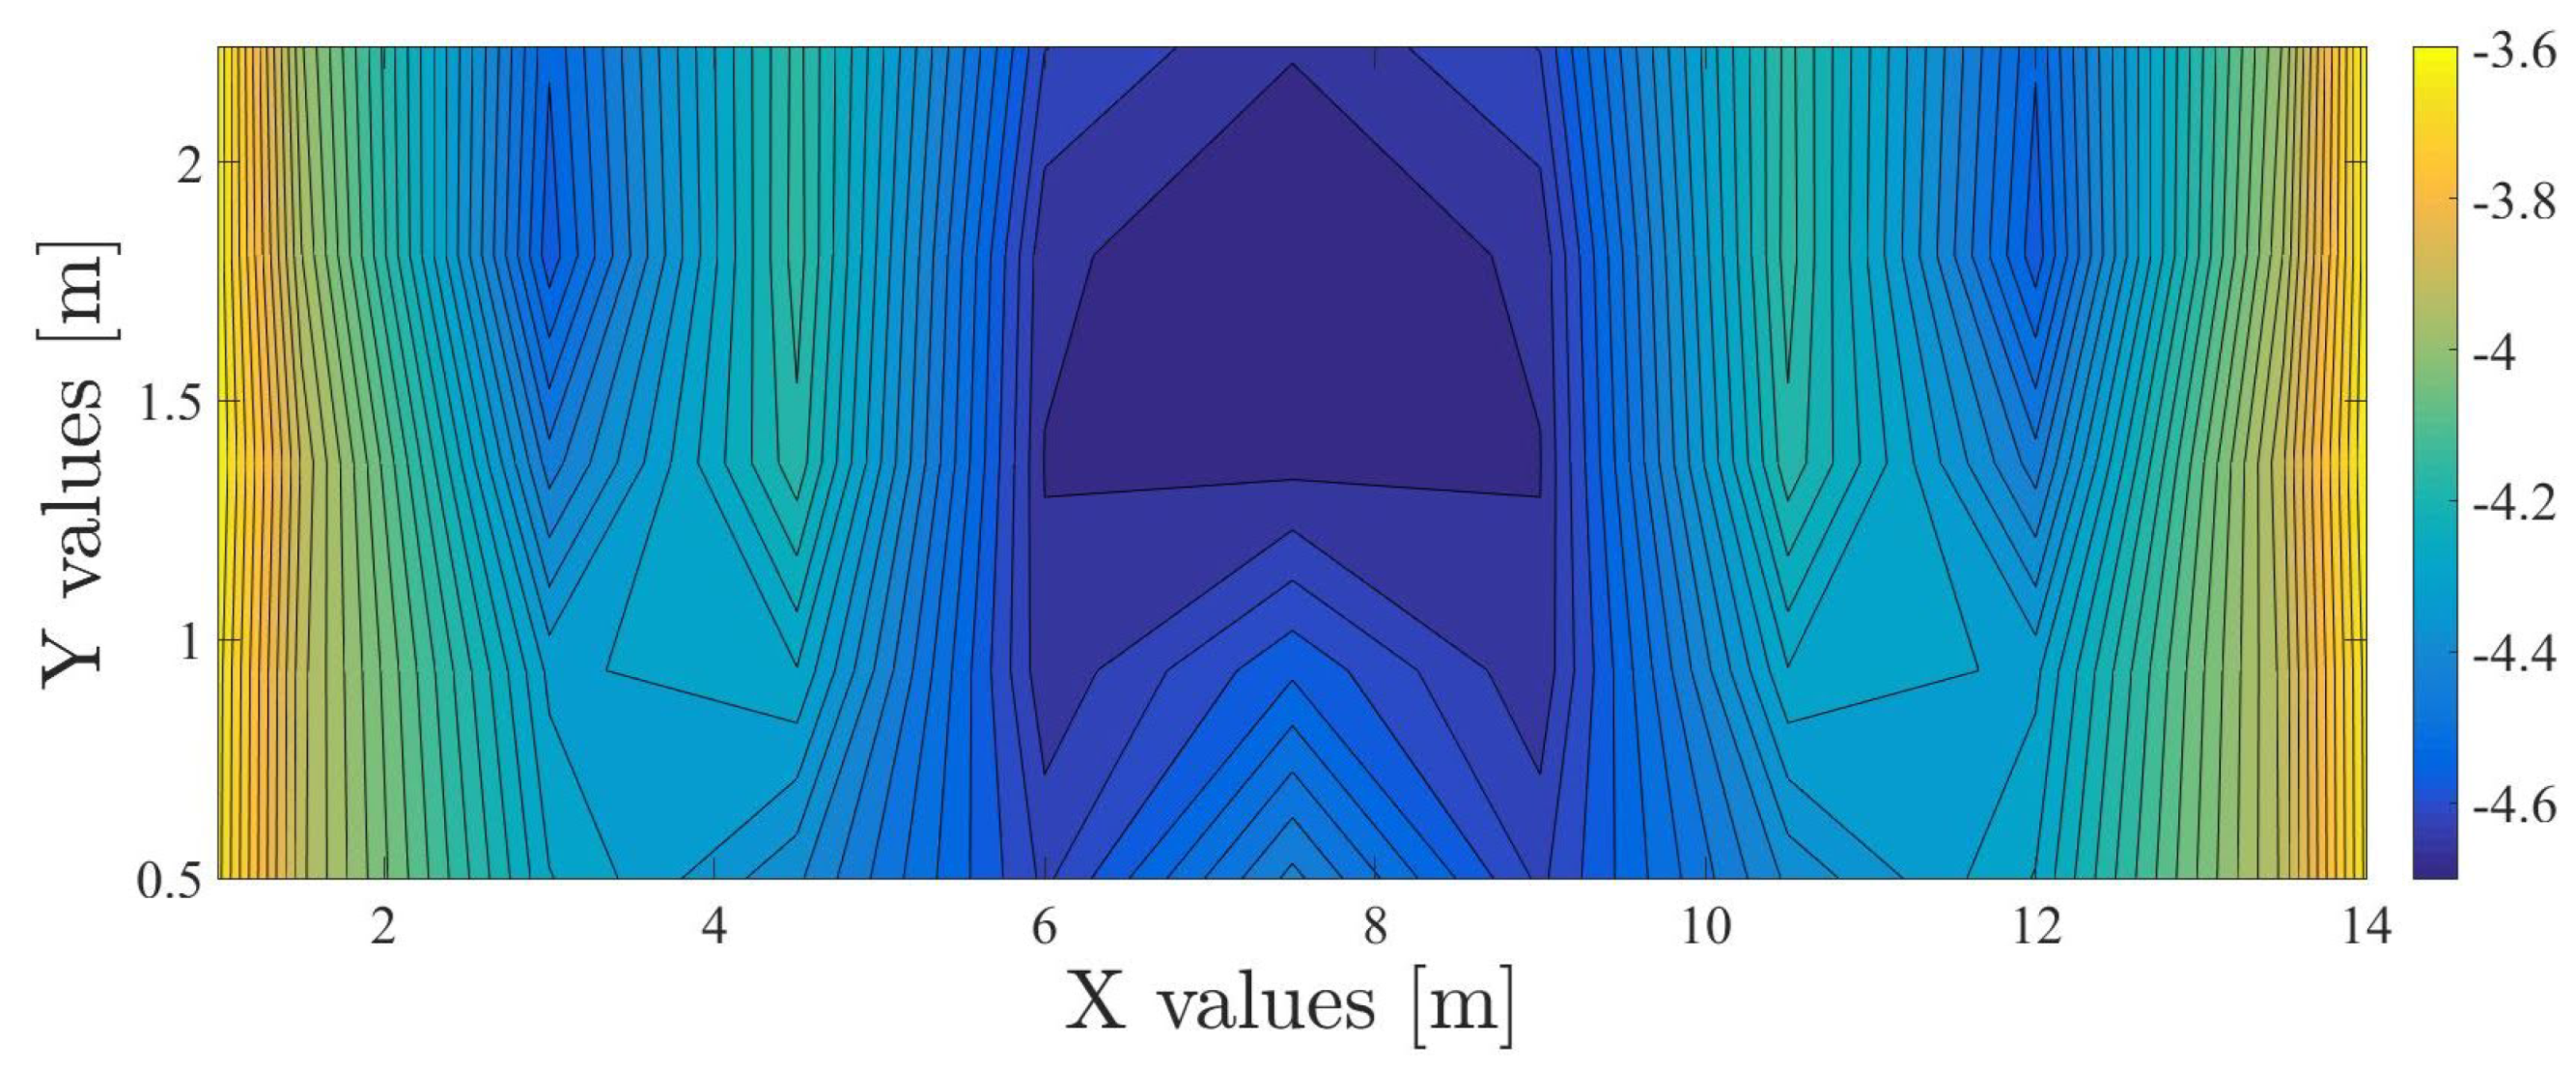
Figure 13.
Mapping of the maximal displacement reached by the block centre as a function of the impact position on the net (m) for an impacting energy of 270 kJ.
Figure 13.
Mapping of the maximal displacement reached by the block centre as a function of the impact position on the net (m) for an impacting energy of 270 kJ.
Figure 14.
Off-centred impact: block’s displacement according to time for an impacting energy of 270 kJ.
Figure 14.
Off-centred impact: block’s displacement according to time for an impacting energy of 270 kJ.
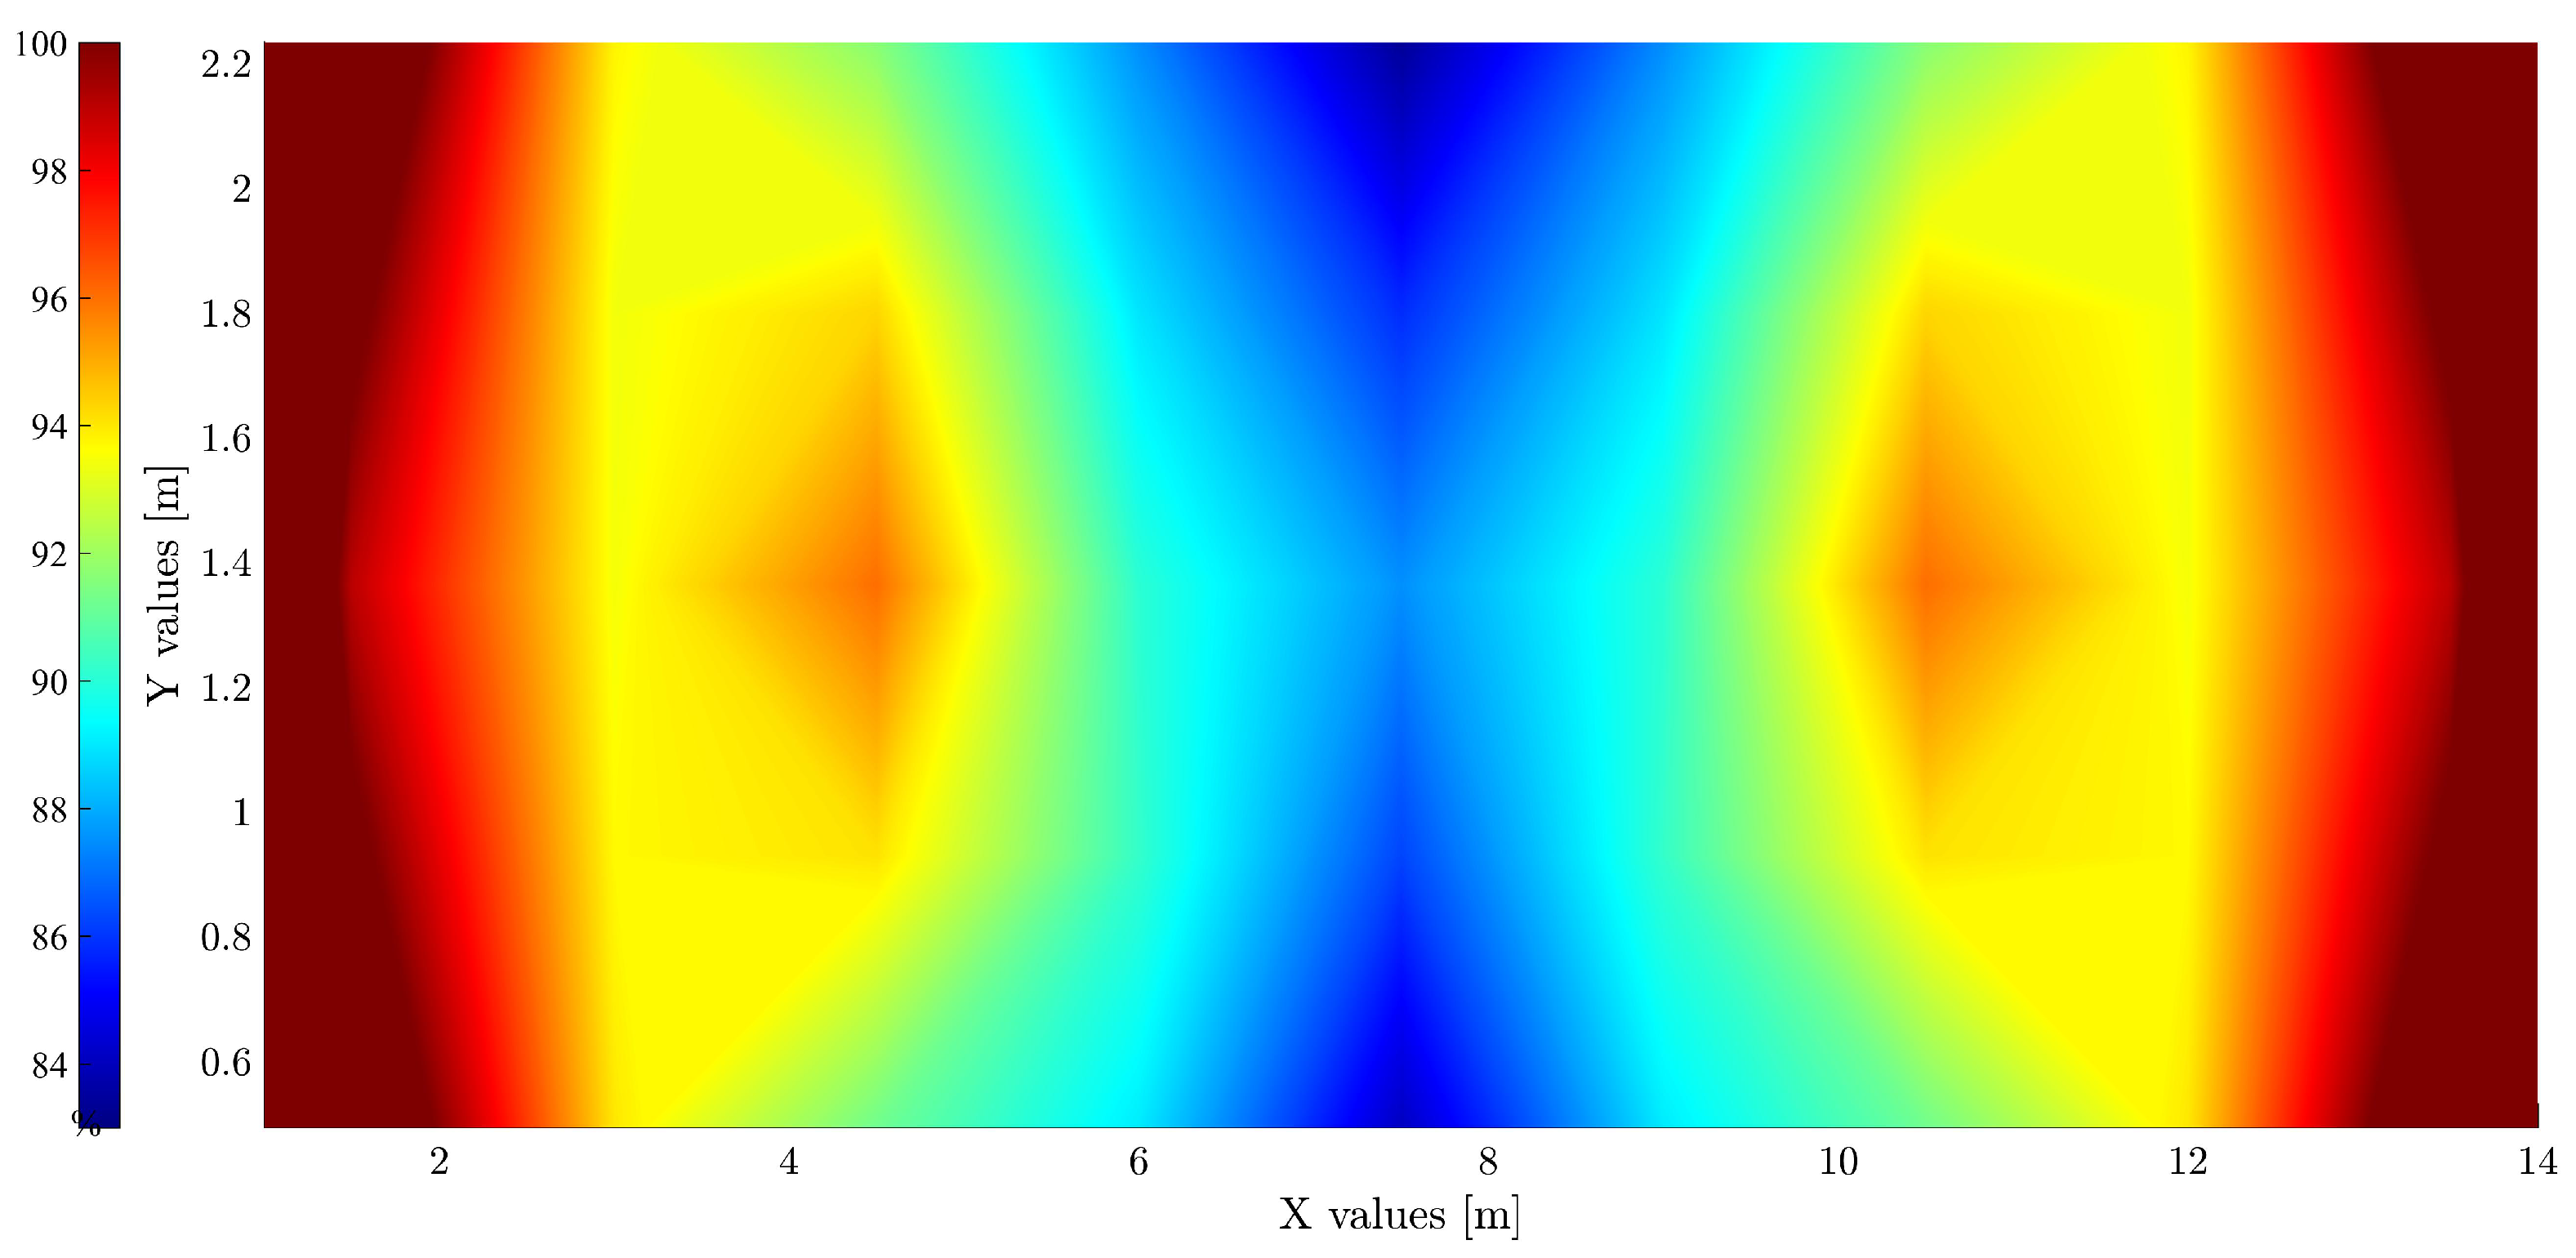
Figure 15.
Percentage of plastically dissipated energy on the initial mechanical energy, supposing a constant threshold of brakes for an impacting energy of 270 kJ.
Figure 15.
Percentage of plastically dissipated energy on the initial mechanical energy, supposing a constant threshold of brakes for an impacting energy of 270 kJ.
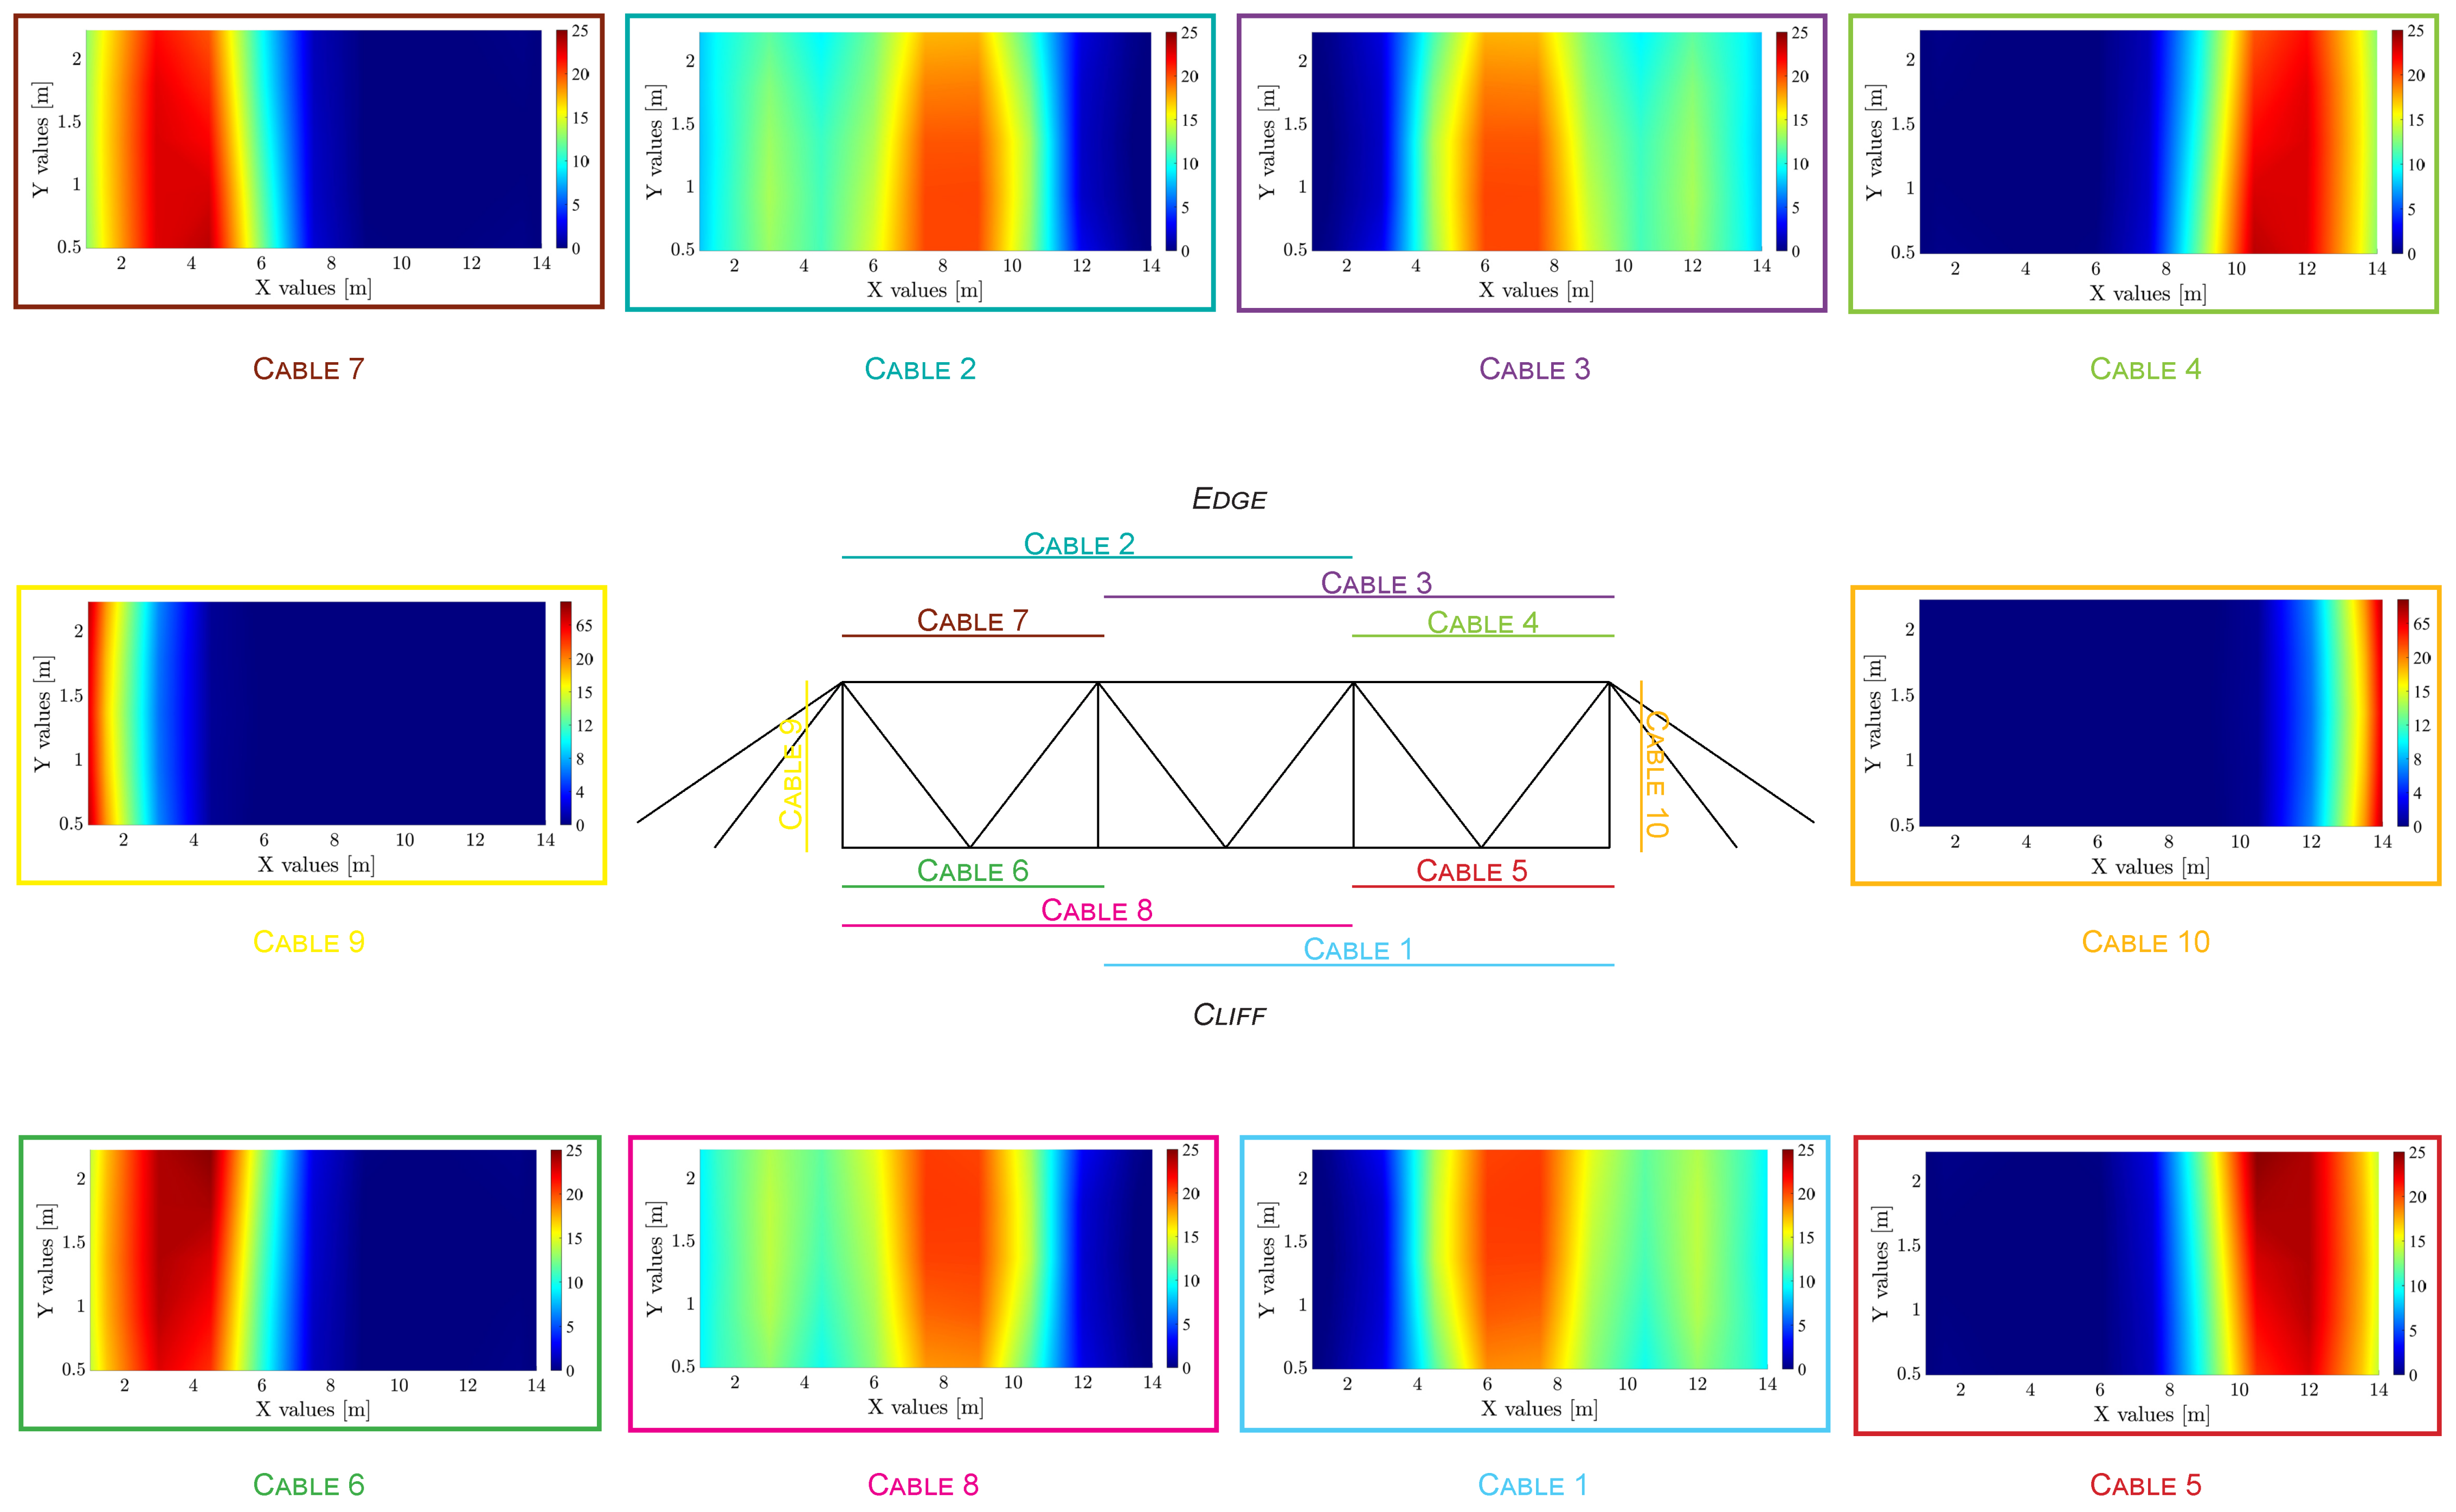
Figure 16.
Percentage of the energy dissipated plastically in each cable on the initial mechanical energy, supposing a constant threshold of brakes.
Figure 16.
Percentage of the energy dissipated plastically in each cable on the initial mechanical energy, supposing a constant threshold of brakes.
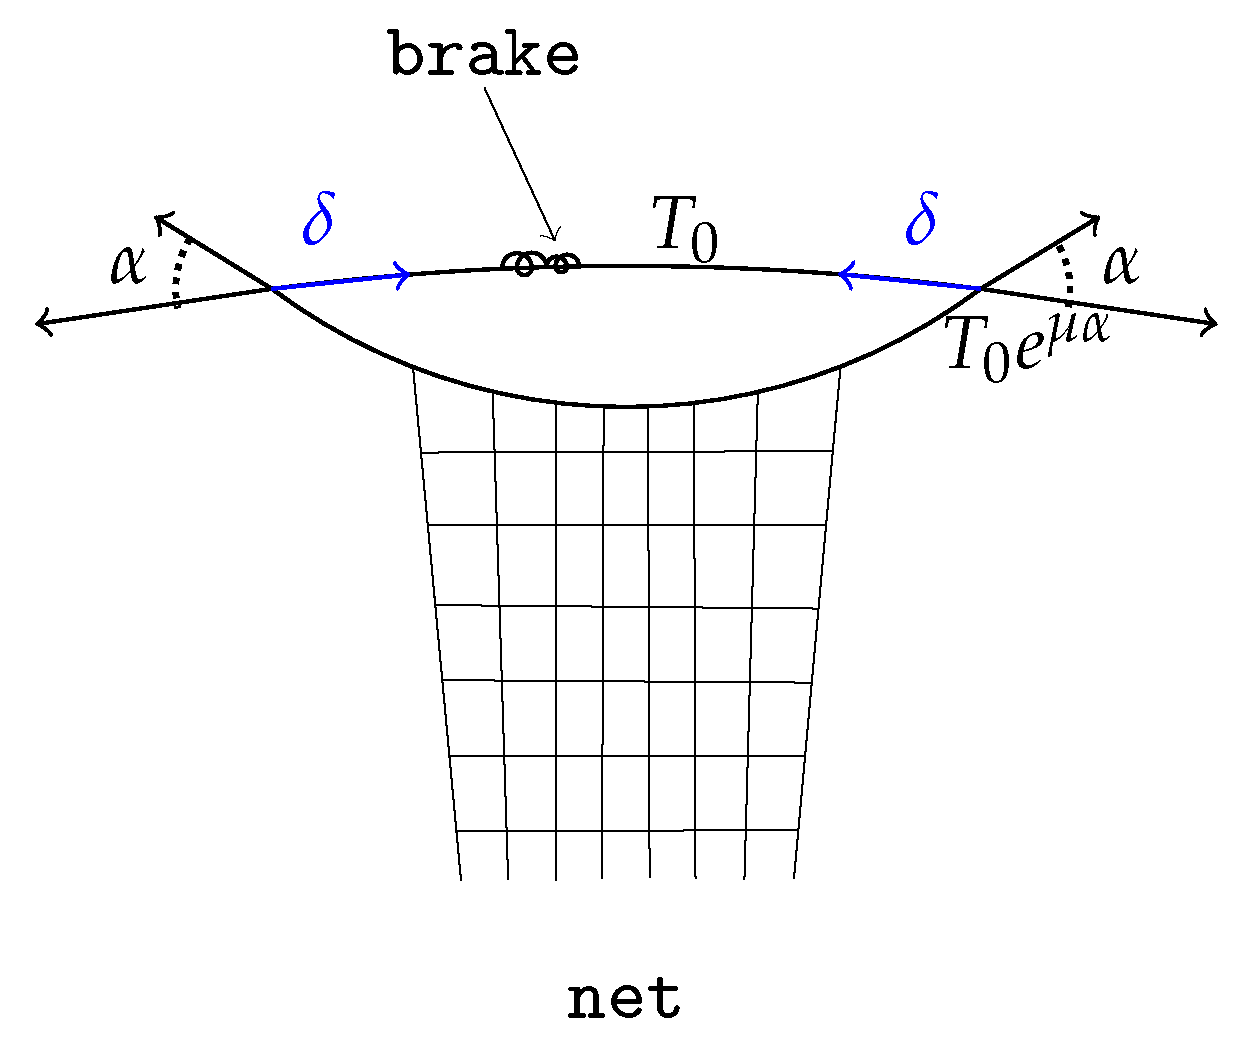
Figure 17.
Detailed scheme of lateral cables (9 or 10) showing characteristic angles at shackles.
Figure 17.
Detailed scheme of lateral cables (9 or 10) showing characteristic angles at shackles.
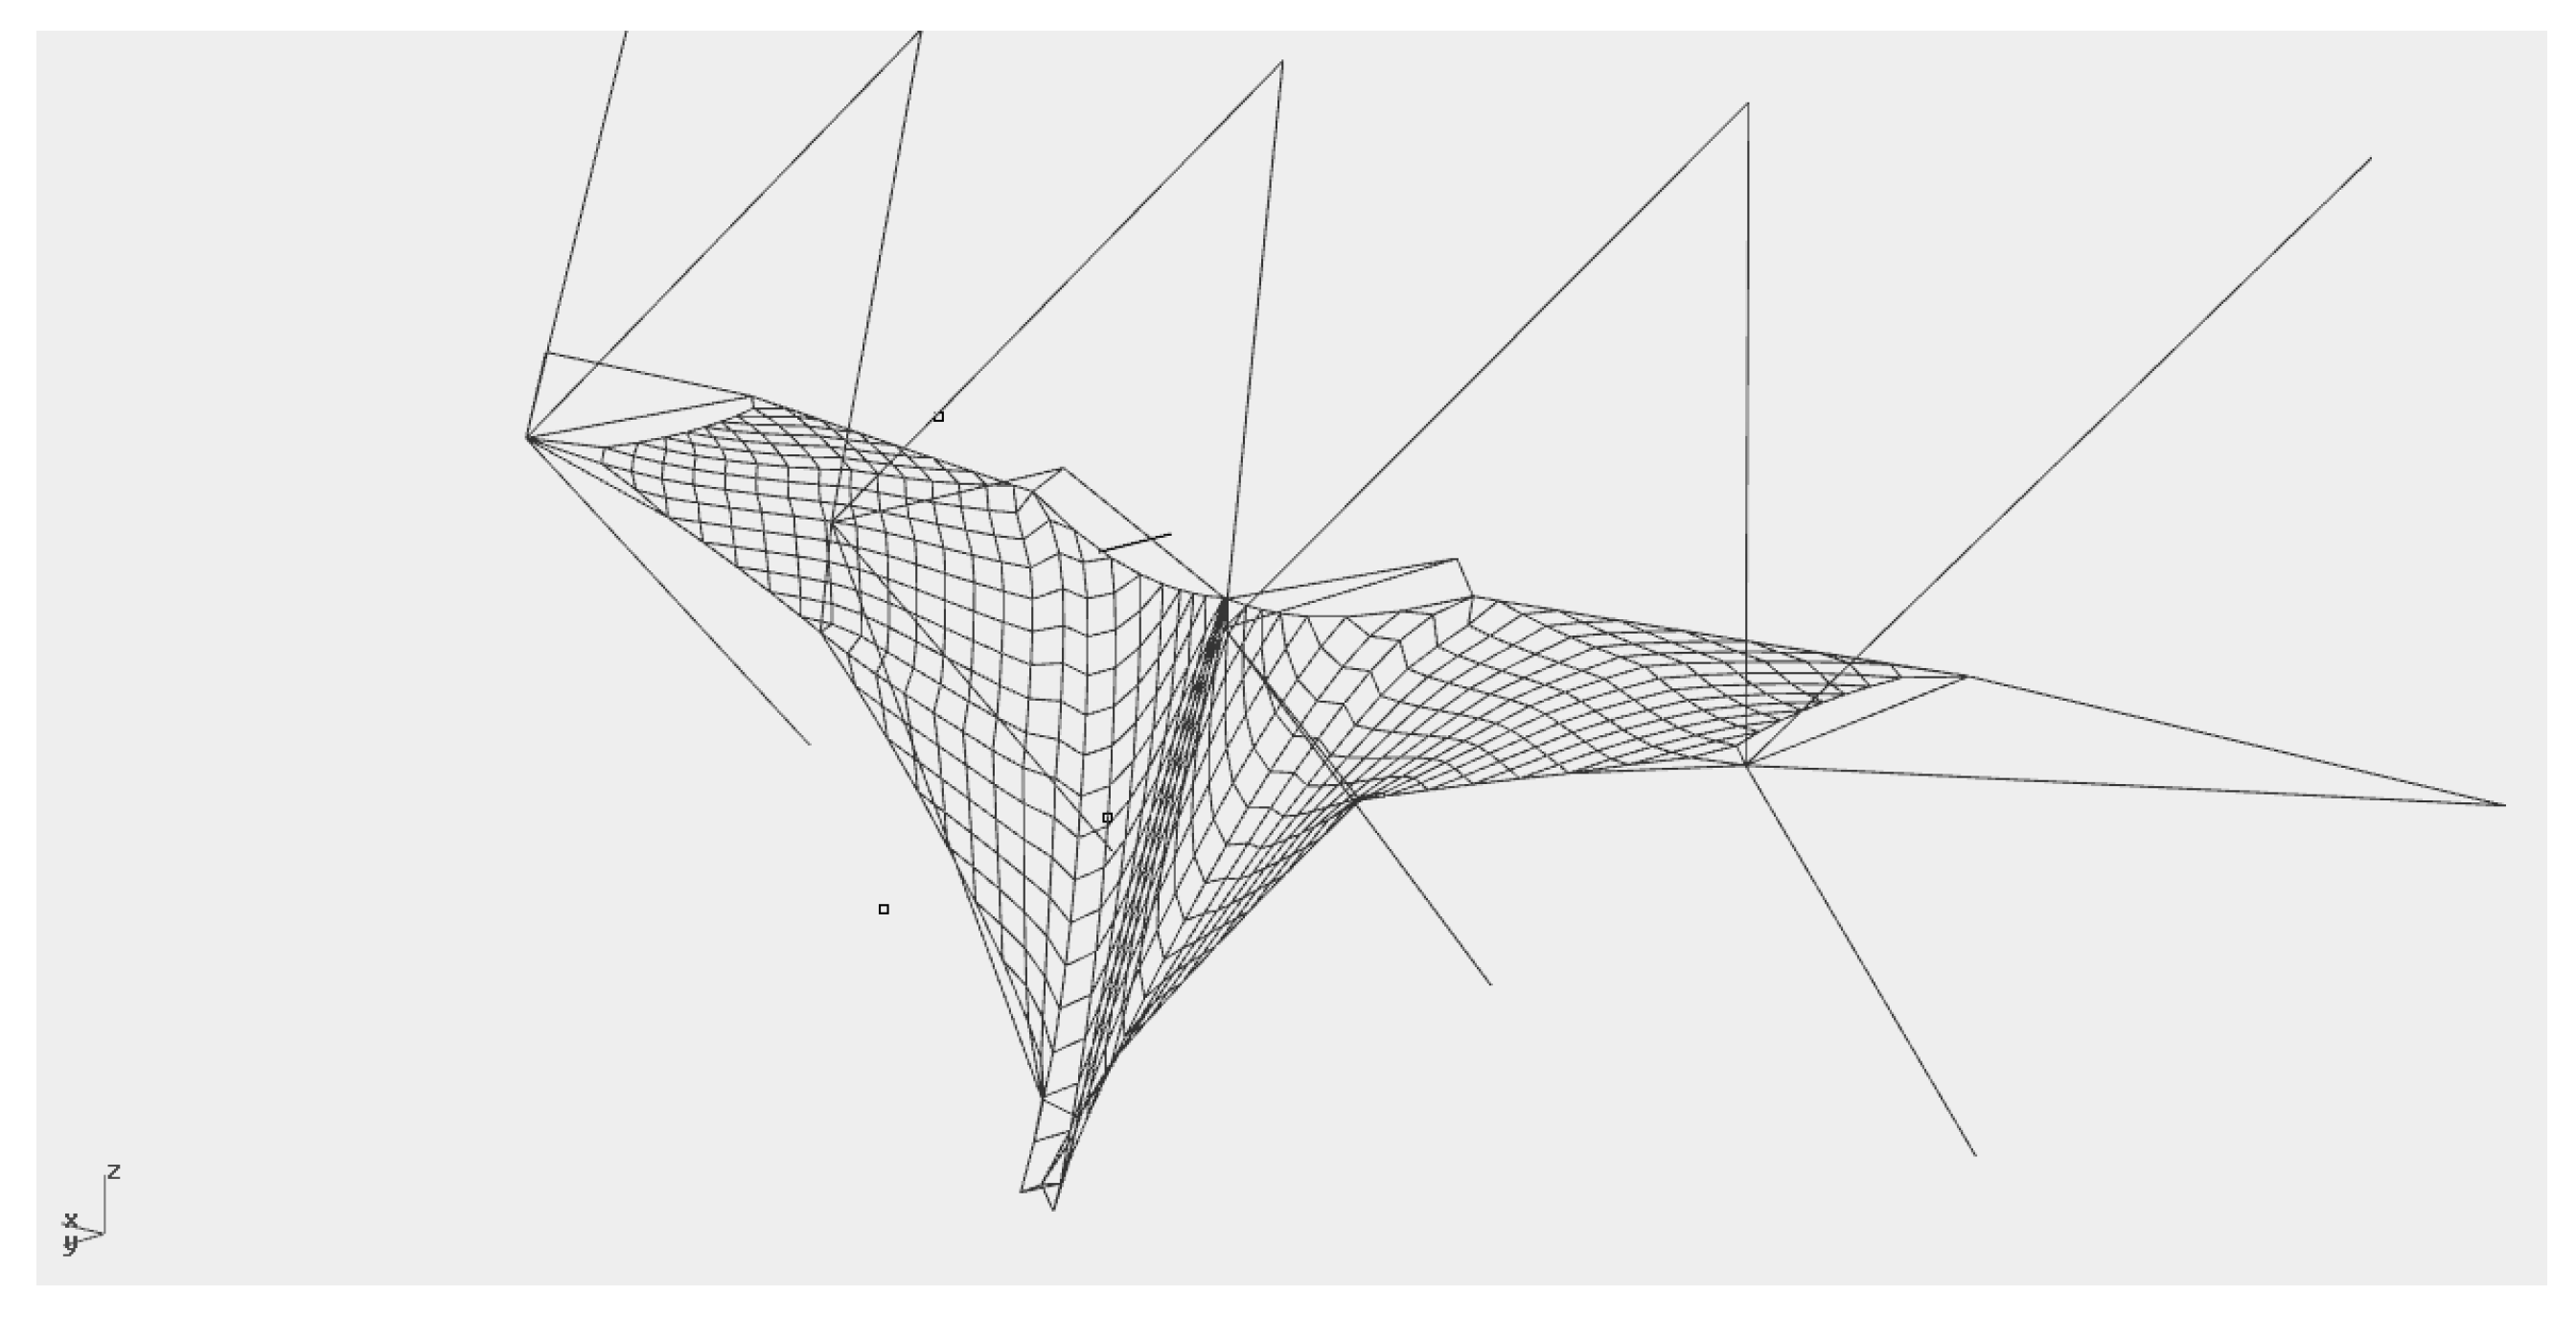
Figure 18.
Net with cliff-side cables blocked and block fallen off the net.
Figure 18.
Net with cliff-side cables blocked and block fallen off the net.
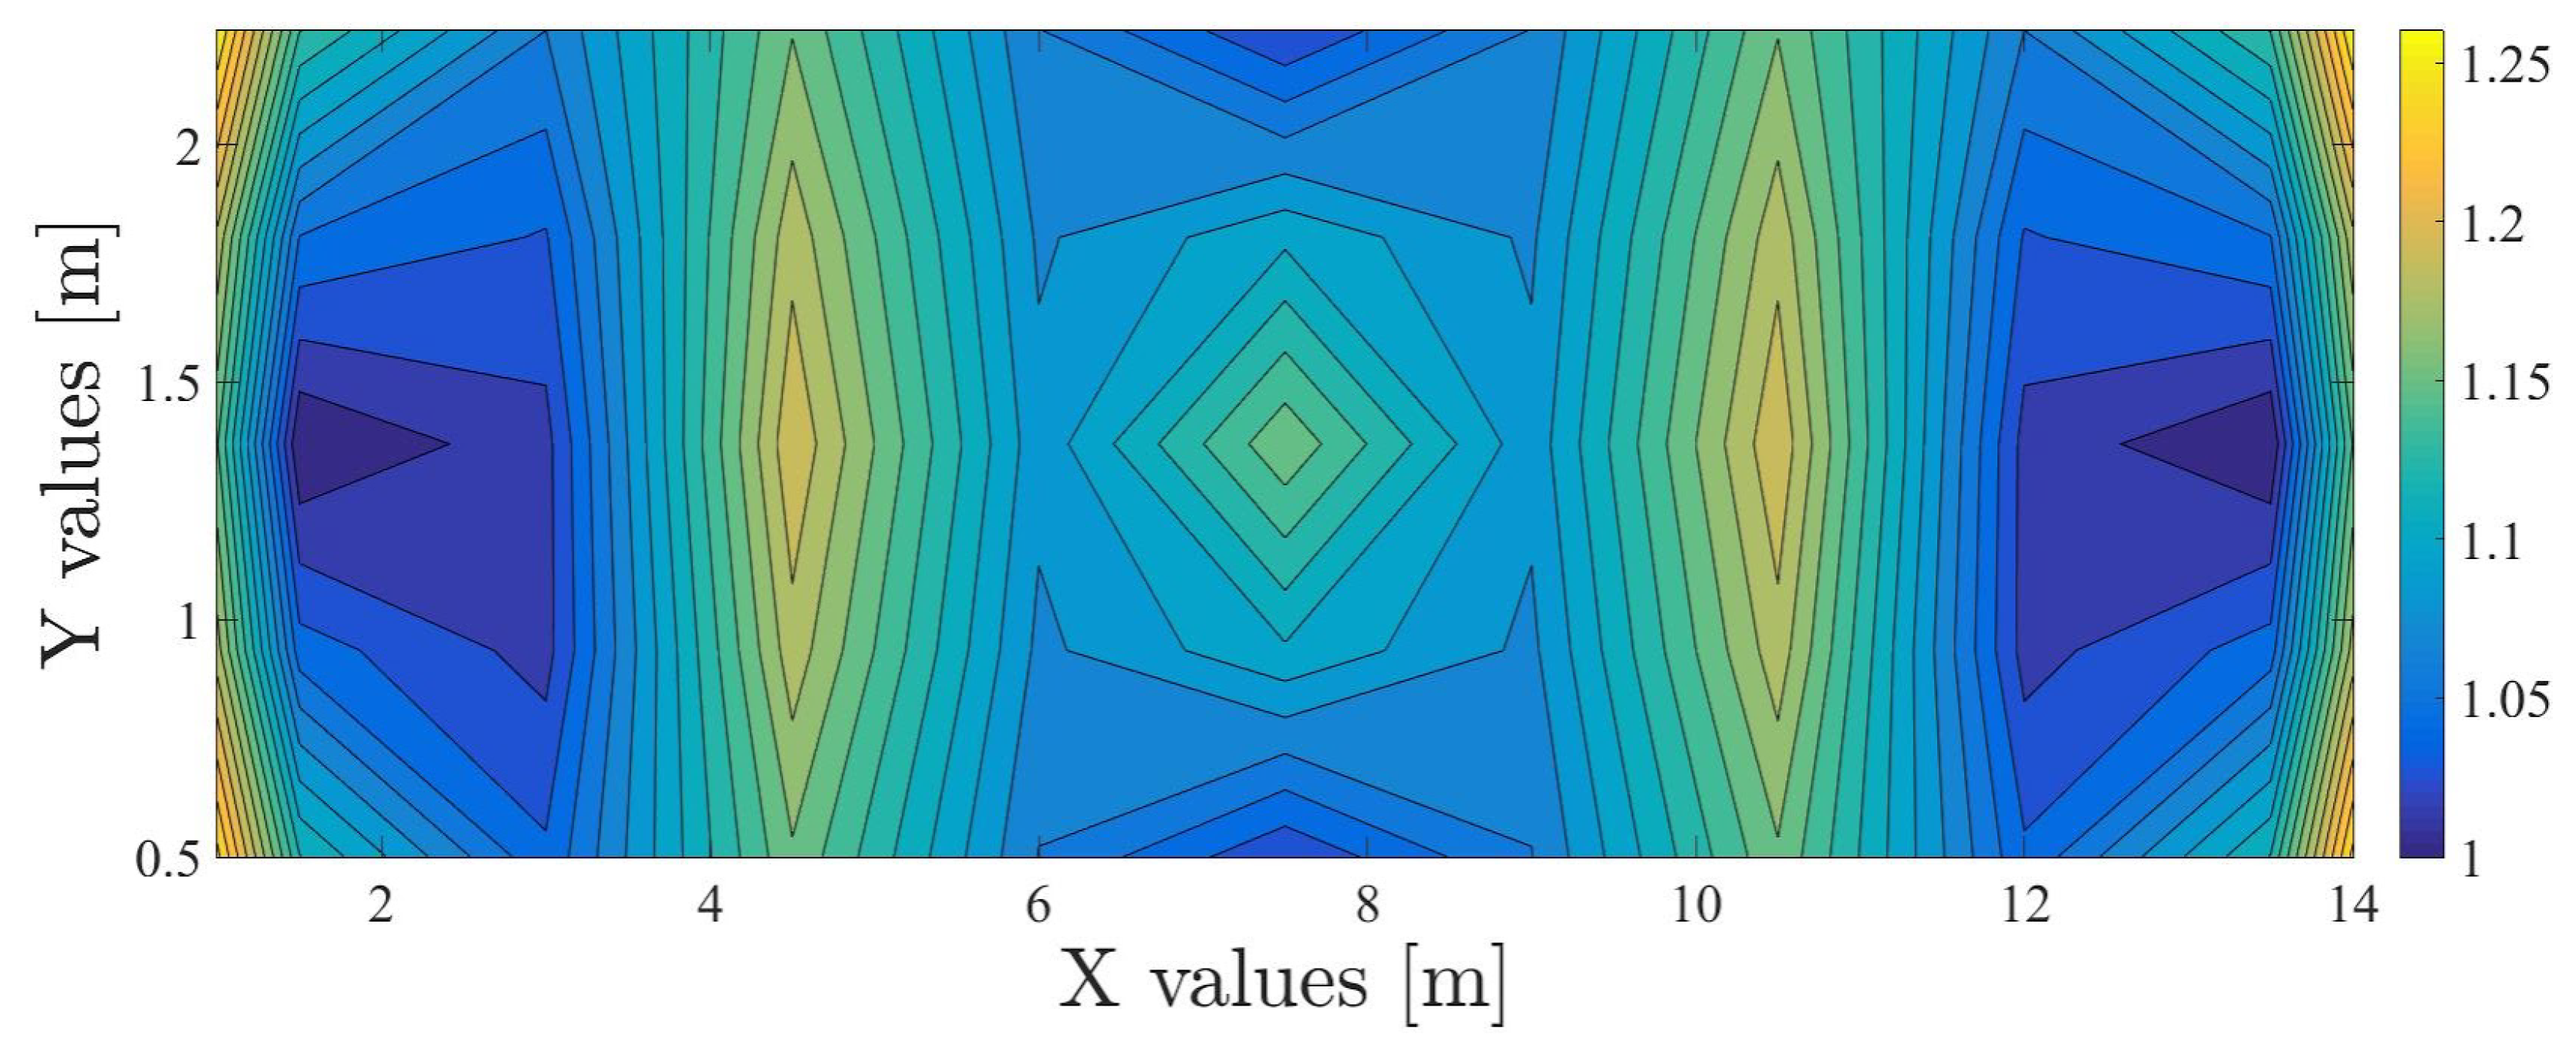
Figure 19.
Mapping of the residual height as a function of the impact position on the net (m).
Figure 19.
Mapping of the residual height as a function of the impact position on the net (m).
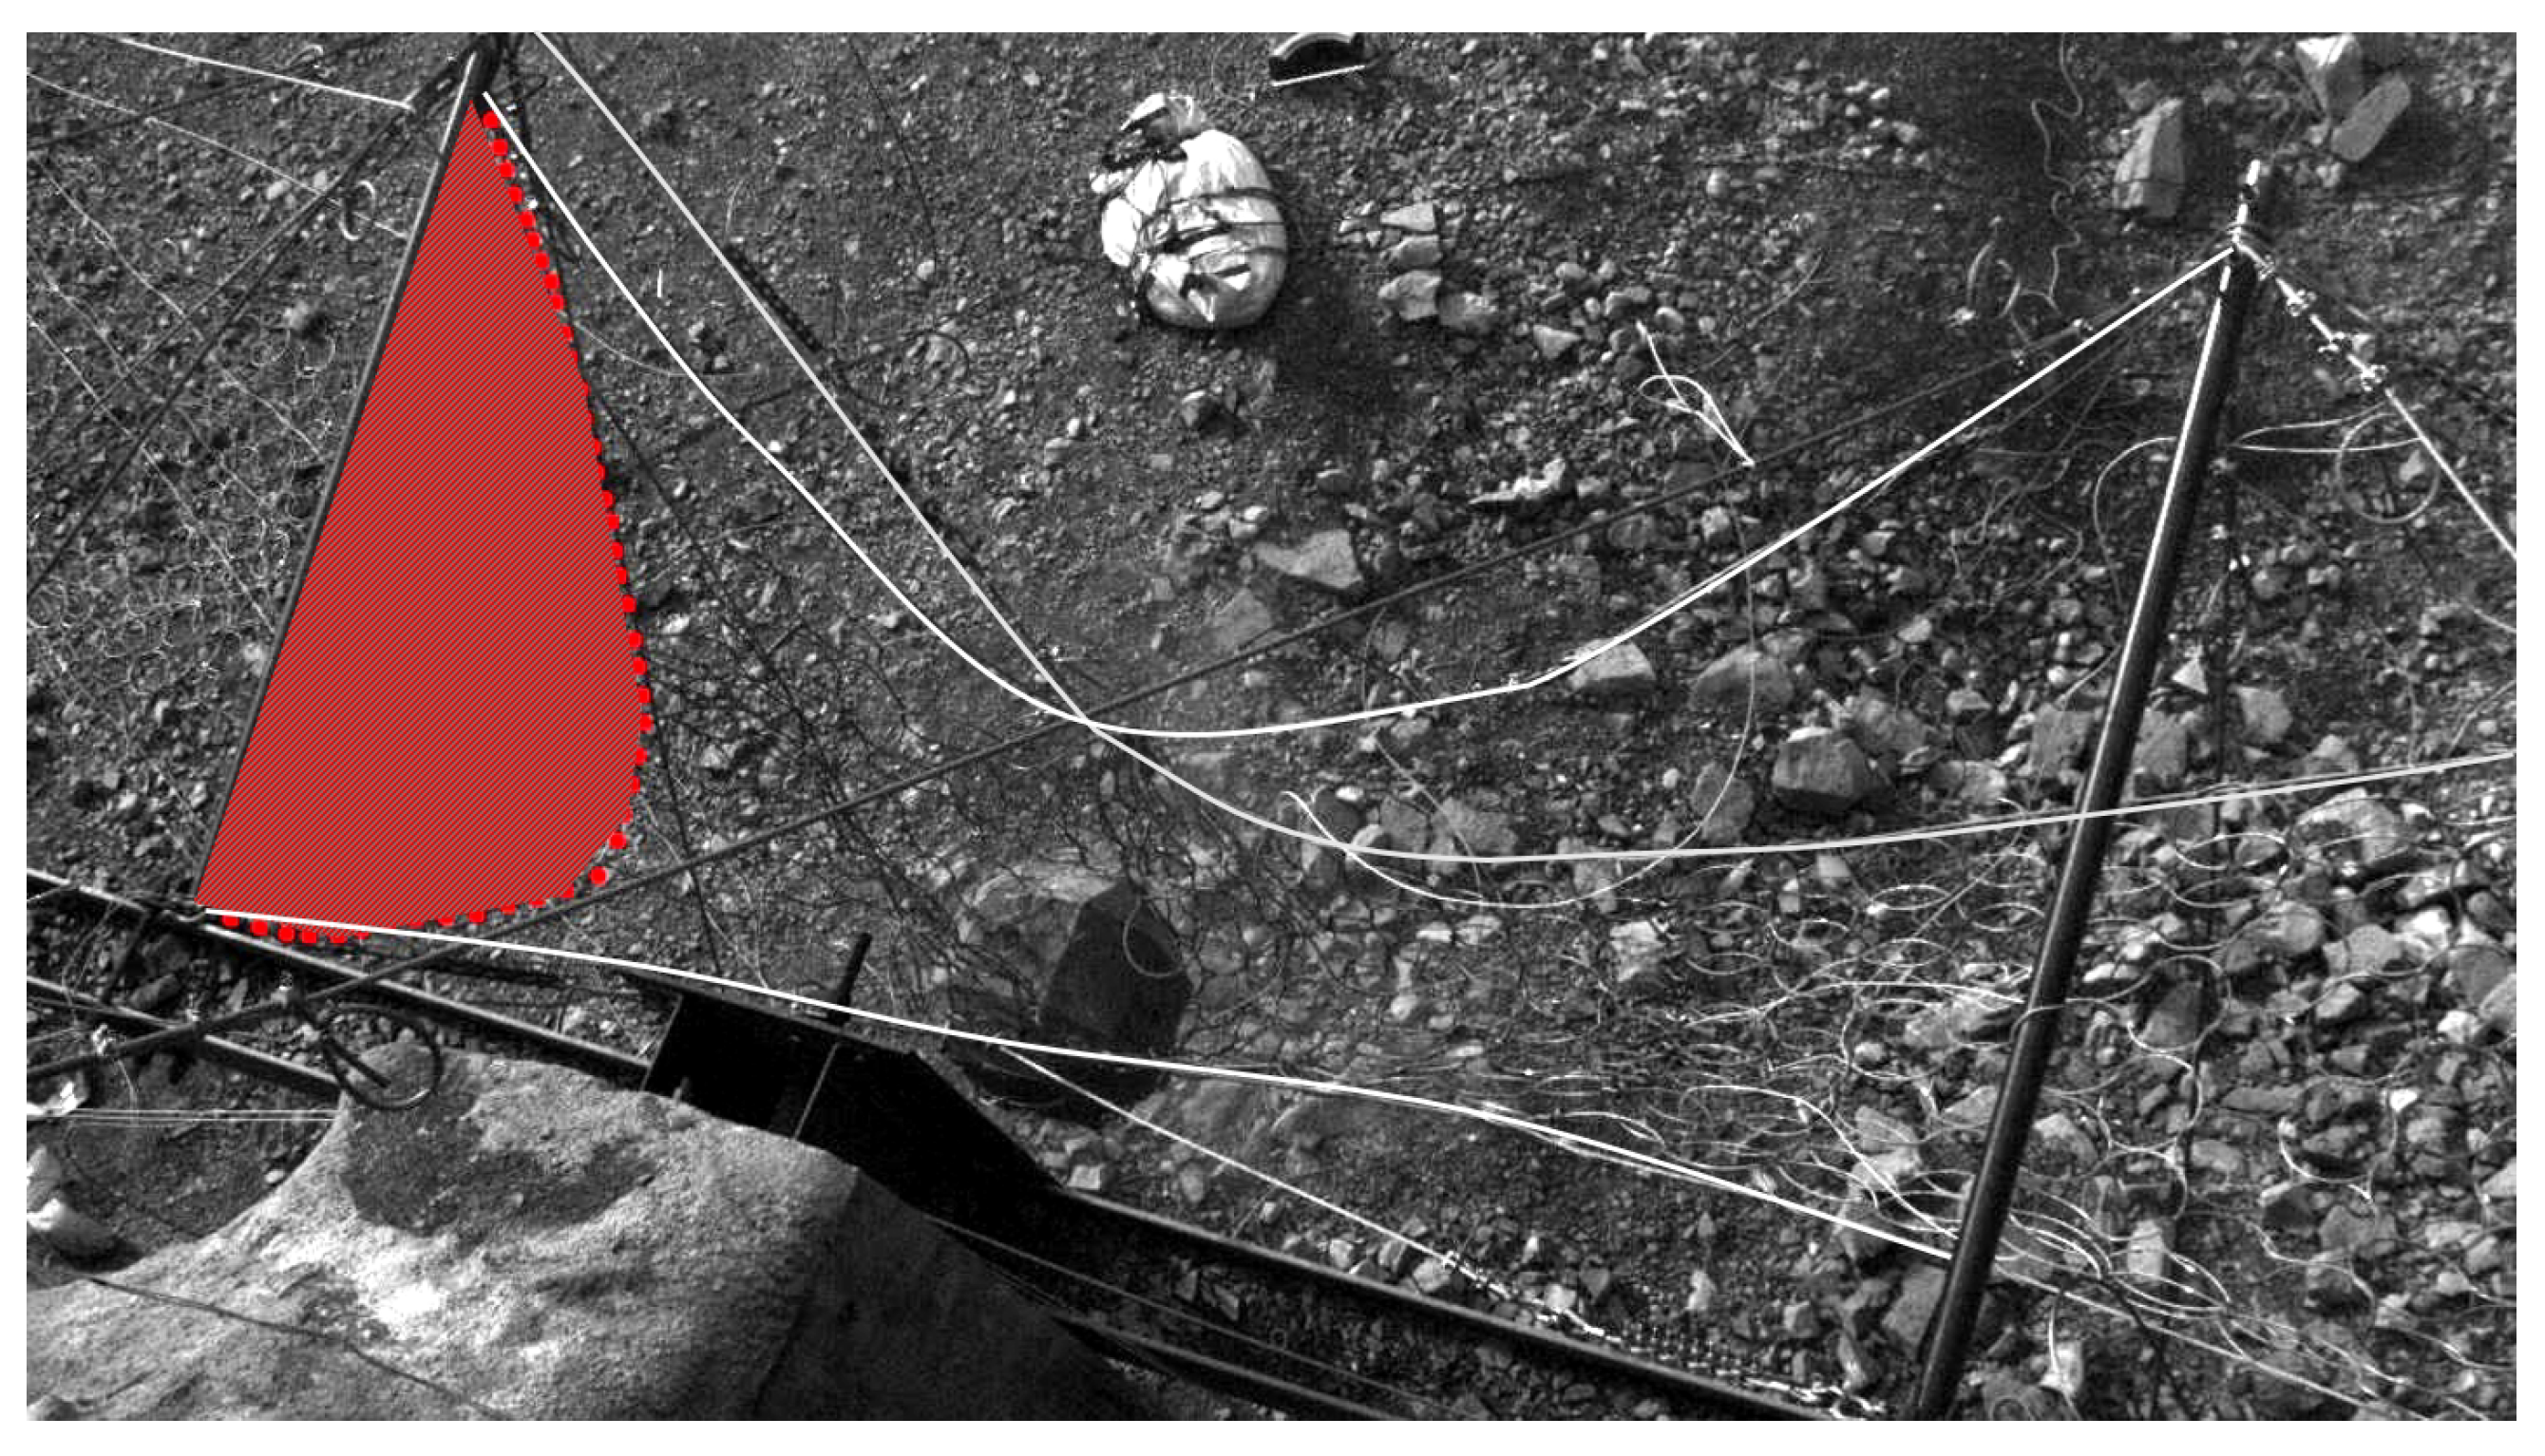
Figure 20.
Side hole in the barrier after the lateral impact during the second campaign.
Figure 20.
Side hole in the barrier after the lateral impact during the second campaign.
Figure 21.
Locally dissipated energy according to prestress in each cable.
Figure 21.
Locally dissipated energy according to prestress in each cable.
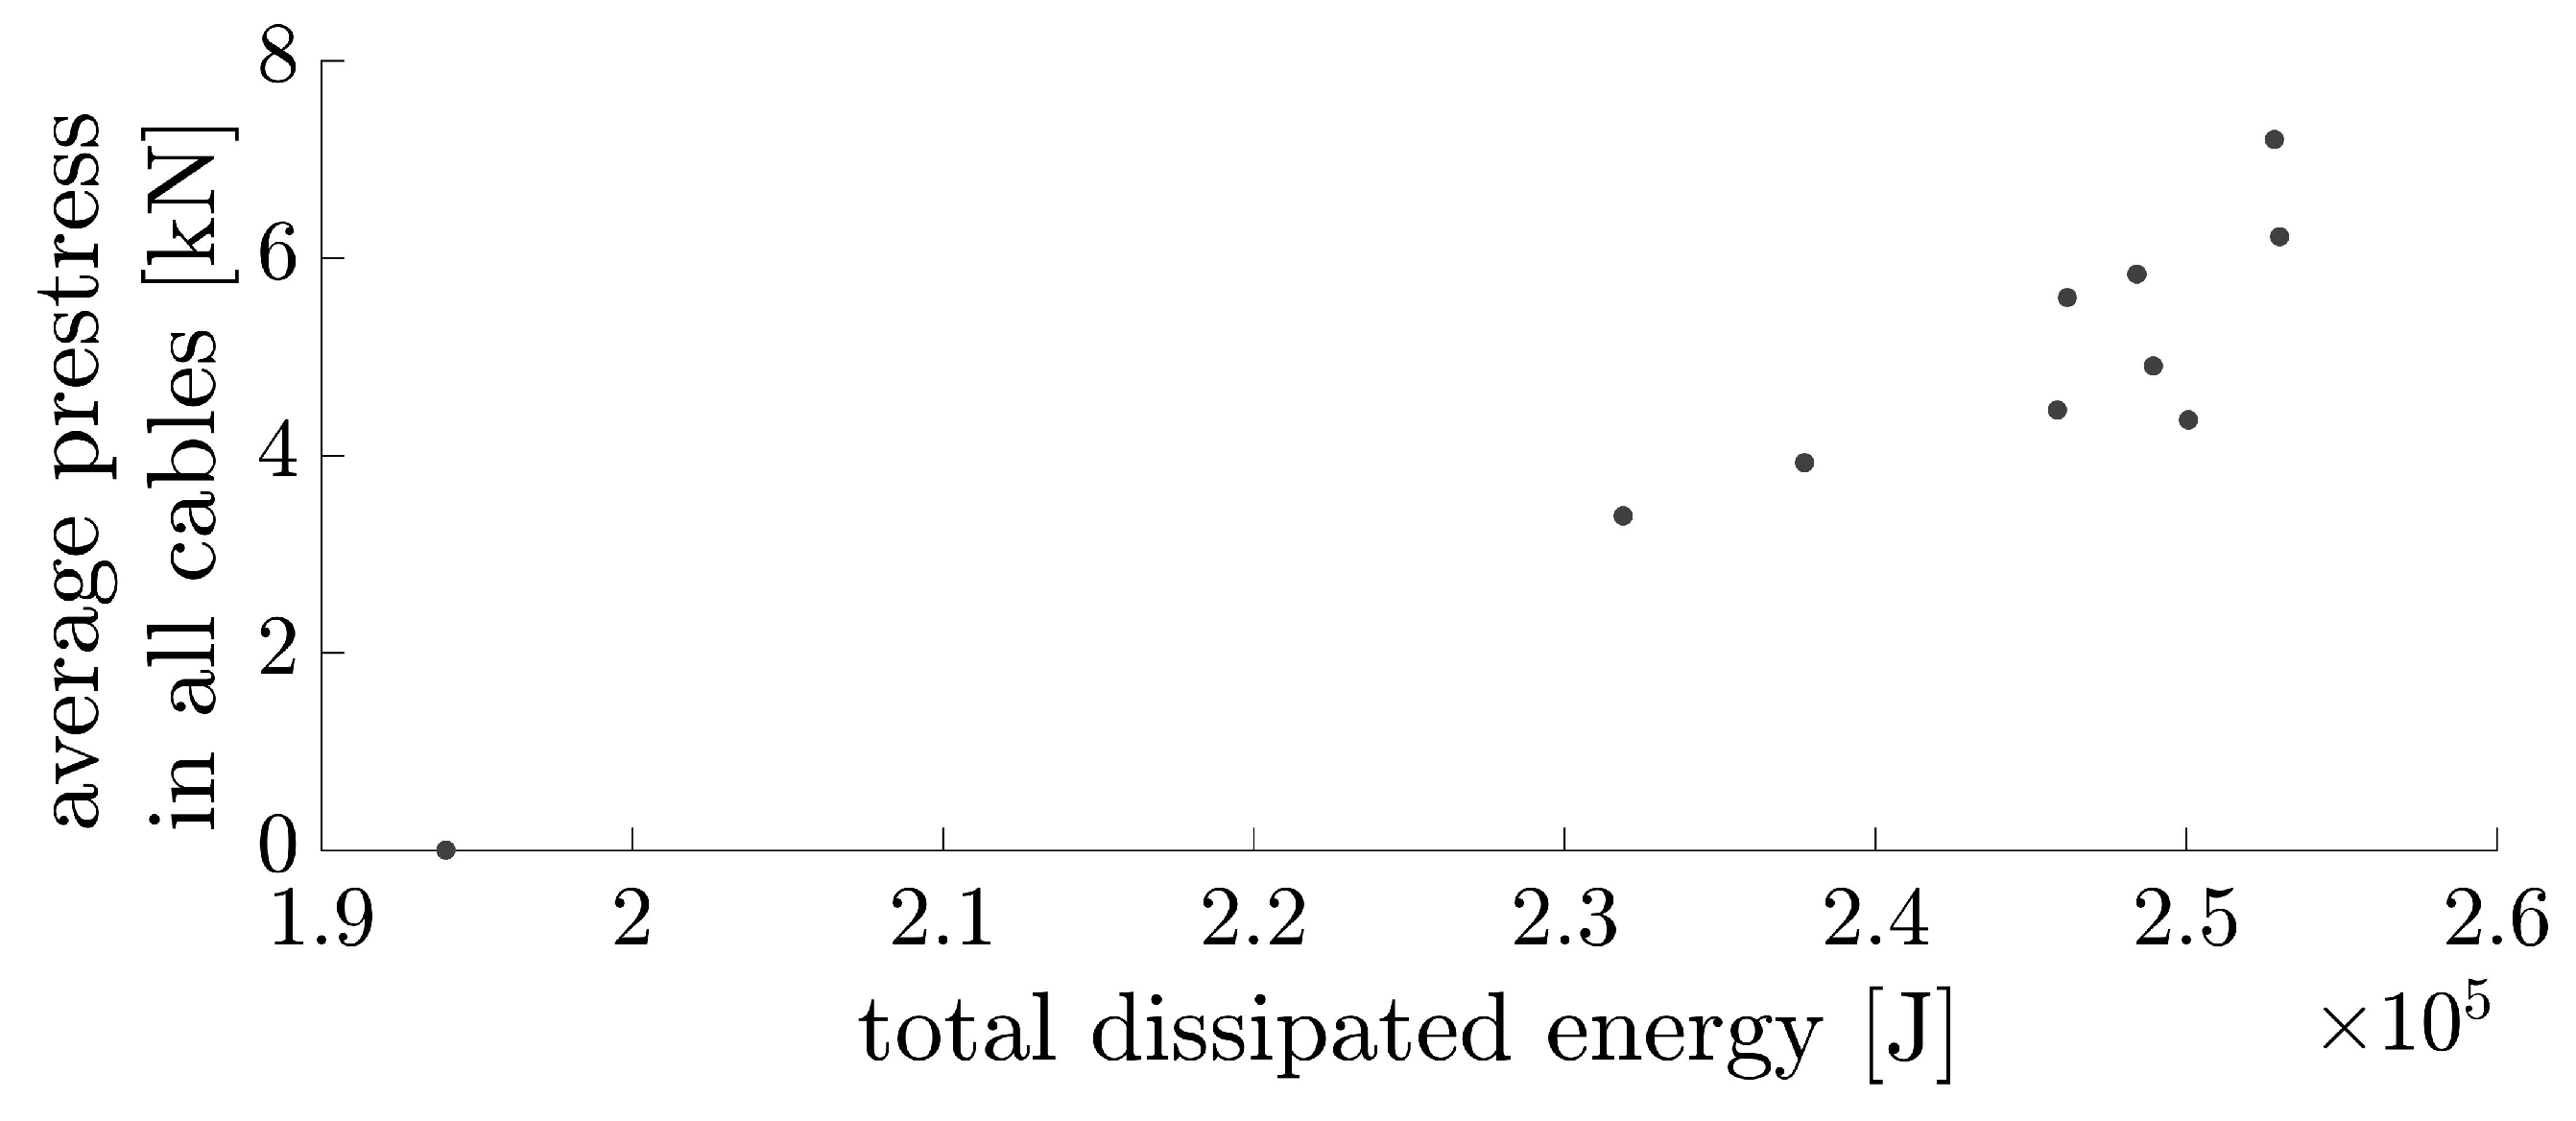
Figure 22.
Global energy variation according to the average prestress in all cables.
Figure 22.
Global energy variation according to the average prestress in all cables.
Figure 23.
Local dissipated energy variations according to brake-activation threshold in each cable.
Figure 23.
Local dissipated energy variations according to brake-activation threshold in each cable.
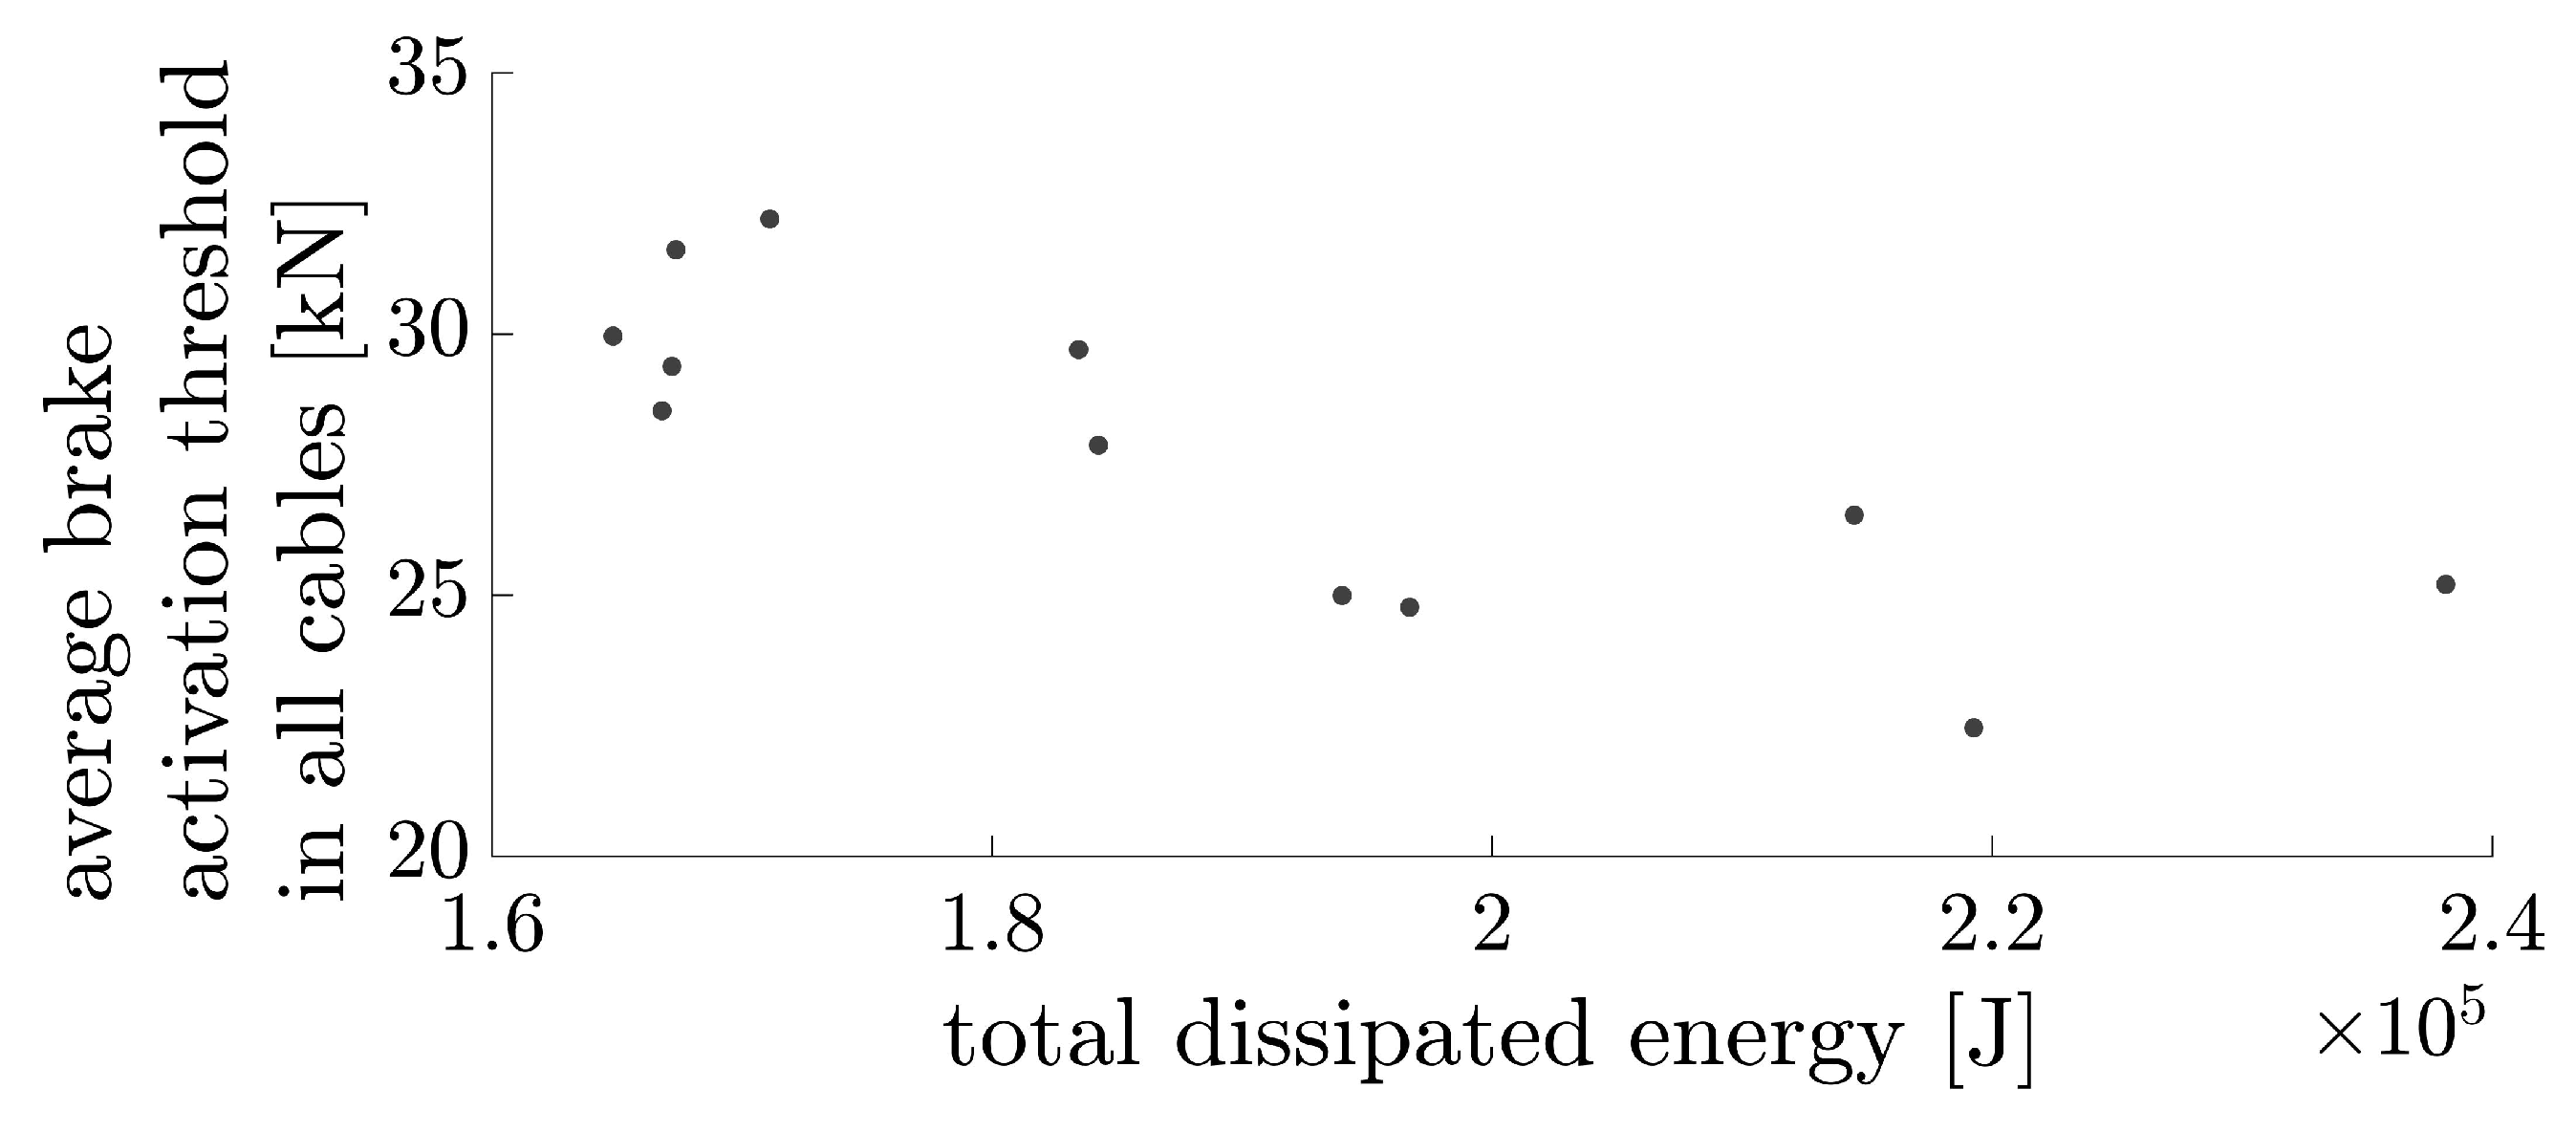
Figure 24.
Global energy variation according to the average brake-activation threshold in all cables.
Figure 24.
Global energy variation according to the average brake-activation threshold in all cables.
Table 1.
Characteristics recorded for each of the two MEL and three SEL impacts—first campaign.
Table 1.
Characteristics recorded for each of the two MEL and three SEL impacts—first campaign.
| Test | MEL 1 | MEL 2 | SEL 1 | SEL 2 | SEL 3 | SELtot |
|---|
| Theor. energy | 270 kJ | 270 kJ | 90 kJ | 90 kJ | 90 kJ | 3 × 90 kJ |
| Total brake elong. (eq. energy 25 kN ) | 828 cm (207 kJ) | 1136 cm (284 kJ) | 348 cm (87 kJ) | 288 cm (72 kJ) | 256 cm (64 kJ) | 892 cm (223 kJ) |
| Maximal displacement | 4.44 m | 5.05 m | | | | |
| Residual height | 1.4 m | 1.2 m | 1.5 m | 1.1 m | 0.9 m | |
Table 2.
Characteristics recorded for each of the five test impacts for the second campaign.
Table 2.
Characteristics recorded for each of the five test impacts for the second campaign.
| Test | Indiv. Module | Pre-Loaded | Off-Centred | Lateral | Consecutive |
|---|
| Location | m
m
| m
m
| m
m
| m
m
| m
m
|
| Total brake elong. (eq. energy 25 kN) | 581 cm (145 kJ) | 579 cm (145 kJ) | 1210 cm (303 kJ) | 474 cm (119 kJ) | 670 cm (168 kJ) |
| Max. displ | 4.74 m | 4.19 m | 5.08 m | 4.18 m | 3.48 m |
| Res. height | 1.36 m | no data | 1.01 m | 0.94 m | no data |
Table 3.
Pre-loading distributions.
Table 3.
Pre-loading distributions.
| Standard Deviation | Average | Expected Value |
|---|
| 3.0 kN | 6.2 kN | 5.6 kN |
Table 4.
Brake-activation threshold distributions.
Table 4.
Brake-activation threshold distributions.
| Standard Deviation | Average | Expected Value |
|---|
| 10.8 kN | 27.0 kN | 27.0 kN |
Table 5.
Total sum of brakes elongation comparison between MEL 1, MEL 2, and the numerical simulation.
Table 5.
Total sum of brakes elongation comparison between MEL 1, MEL 2, and the numerical simulation.
| Test | MEL 1 | MEL 2 | Num. Simulation |
|---|
| total elongation | 828 cm | 1136 cm | 1004 cm |
Table 6.
Difference (in percentage) between the calculated values and the values obtained by interpolation.
Table 6.
Difference (in percentage) between the calculated values and the values obtained by interpolation.
| X (m) | Y (m) | Calculated (%) | Interpolated (%) | Difference (%) |
|---|
| 7.5 | 0.5 | 66.94 | 66.94 | 0.0 |
| 7.5 | 1.37 | 70.18 | 68.69 | 2.13 |
| 7.5 | 2.24 | 66.58 | 66.58 | 0.0 |
| 9 | 0.935 | 75.49 | 75.49 | 0.0 |
| 9 | 1.805 | 75.54 | 75.54 | 0.0 |
| 10.5 | 0.5 | 75.69 | 77.84 | −2.84 |
| 10.5 | 1.37 | 84.68 | 84.68 | 0.0 |
| 10.5 | 2.24 | 76.31 | 77.76 | −1.91 |
| 12 | 0.935 | 80.03 | 80.03 | 0.0 |
| 12 | 1.805 | 79.94 | 79.94 | 0.0 |
Table 7.
Brake elongations by the cable number for the off-centred test.
Table 7.
Brake elongations by the cable number for the off-centred test.
| Cable No. | 1 Edge | 2 Cliff | 3 Cliff | 4 Cliff | 5 Edge | 6 Edge | 7 Cliff | 8 Edge | 9 Lat. | 10 Lat. |
|---|
| Exp. (cm) | 174 | 340 | 301 | 75 | 107 | 0 | 15 | 198 | 0 | 0 |
| Num. (cm) | 158 | 204 | 159 | 118 | 133 | 15 | 14 | 197 | 5 | 9 |
| Num. mod. (cm) | 158 | 320 | 290 | 118 | 133 | 15 | 14 | 197 | 5 | 9 |
Table 8.
Brake elongations by cable number grouping cable by pairs in the y direction for the lateral impact.
Table 8.
Brake elongations by cable number grouping cable by pairs in the y direction for the lateral impact.
| Cable Couple | 1 + 3 | 2 + 8 | 4 + 5 | 6 + 7 | 9 | 10 |
|---|
| Exp. (cm) | 0 | 173 | 0 | 230 | 71 | 0 |
| Num. (cm) | 29 | 236 | 12 | 344 | 269 | 2 |
Table 9.
Residual height for the off-centred impact and the lateral impact.
Table 9.
Residual height for the off-centred impact and the lateral impact.
| Impact | Exp. Height | Num. Height | Diff. |
|---|
| off-centred impact | 1.01 m | 1.03 m | 1.9% |
| lateral impact | 0.94 m | 0.84 m | 11.2% |
| lateral + friction | 0.94 m | 0.92 m | 2.1% |
Table 10.
Prestress in supporting cables: target level () and practical equilibrium state ().
Table 10.
Prestress in supporting cables: target level () and practical equilibrium state ().
| Cable | Input at (kN) | Equilibrium at (kN) | Difference (kN) |
|---|
| 1 | 8.6 | 9.5 | 0.9 |
| 2 | 4.7 | 6.3 | 1.6 |
| 3 | 0.7 | 2.9 | 2.2 |
| 4 | 7.0 | 7.3 | 0.3 |
| 5 | 5.3 | 5.9 | 0.7 |
| 6 | 10.4 | 10.9 | 0.5 |
| 7 | 1.8 | 3.1 | 1.3 |
| 8 | 6.0 | 6.9 | 0.8 |
| 9 | 4.4 | 5.2 | 0.8 |
| 10 | 8.6 | 8.9 | 0.4 |
| Average | 5.7 | 6.7 | 1.0 |
Table 11.
Variability due to impact position, prestress, and brake-activation threshold uncertainties.
Table 11.
Variability due to impact position, prestress, and brake-activation threshold uncertainties.
| Variable | | Prestress | Brake Threshold | Impact Position |
|---|
| Energy | Std dev. | 2.9% | 13.5% | 8.1% |
| | Max. dev. | 8.6% | 38.9% | 26.1% |
| Max. Displ | Std dev. | 0.3% | 2.7% | 8.6% |
| | Max. dev. | 0.9% | 8.6% | 24.2% |
| Res. Height | Std dev. | 1.6% | 6.2% | 7.9% |
| | Max. dev. | 5.3% | 18.2% | 23.1% |


