Article

Drivers of Last Millennium Antarctic Climate Evolution in an Ensemble of Community Earth System Model Simulations

by
Olivia J. Truax
1,2,*,
Bette L. Otto-Bliesner
3,
Esther C. Brady
3,
Craig L. Stevens
4,5,
Gary S. Wilson
6 and
Christina R. Riesselman
1,2
1
Department of Geology, University of Otago, Dunedin 9016, New Zealand
2
Department of Marine Science, University of Otago, Dunedin 9016, New Zealand
3
National Center for Atmospheric Research, Boulder, CO 80305, USA
4
National Institute of Water and Atmospheric Research, Wellington 6241, New Zealand
5
Department of Physics, University of Auckland, Auckland 1010, New Zealand
6
GNS Science, Lower Hutt 5040, New Zealand
*
Author to whom correspondence should be addressed.
Geosciences 2022, 12(8), 299; https://doi.org/10.3390/geosciences12080299
Submission received: 1 June 2022 / Revised: 8 July 2022 / Accepted: 15 July 2022 / Published: 31 July 2022

Abstract

:
Improved understanding of the drivers of climate variability, particularly over the last millennium, and its influence on Antarctic ice melt have important implications for projecting ice sheet resilience in a changing climate. Here, we investigated the variability in Antarctic climate and sea ice extent during the last millennium (850–1850 CE) by comparing paleoenvironmental reconstructions with simulations from the Community Earth System Model Last Millennium Ensemble (CESM-LME). Atmospheric and oceanic response to external forcing in CESM-LME simulations typically take the form of an Antarctic dipole: cooling over most of Antarctica and warming east of the Antarctic Peninsula. This configuration is also observed in ice core records. Unforced variability and a dipole response to large volcanic eruptions contribute to weaker cooling in the Antarctic than the Arctic, consistent with the absence of a strong volcanic signal in Antarctic ice core records. The ensemble does not support a clear link between the dipole pattern and baseline shifts in the Southern Annular Mode and El Niño-Southern Oscillation proposed by some paleoclimate reconstructions. Our analysis provides a point of comparison for paleoclimate reconstructions and highlights the role of internal climate variability in driving modeled last millennium climate evolution in the Antarctic.

1. Introduction

Surface temperature trends over the last 50 years are more spatially heterogeneous in Antarctica compared with other continental regions. Much of East Antarctica has cooled since the 1950s despite temperatures rising globally [1]. West Antarctica and the Antarctic Peninsula warmed more than twice as fast as the global average [2] until the early 2000s, when temperature trends there reversed [1]. Regionally heterogeneous fluctuations in temperatures and substantial annual and decadal-scale variability in Antarctica occur, in part, because of the continent’s sensitivity to tropical forcing and the strength and position of the circumpolar westerly winds [1,3,4,5,6]. However, sparse instrumental data is insufficient to characterize the strongly coupled, highly variable Antarctic climate system or conclusively identify an anthropogenic influence [7]. The numerous interconnections between changes in the Southern Hemisphere high-latitude atmosphere, ocean, and sea-ice systems can amplify initial perturbations in non-linear ways that are not yet fully understood or represented by the current generation of Earth system models [8].
High-resolution paleoclimate archives from 850–1850 CE (the Last Millennium, LM hereafter) are an essential source of information to augment the instrumental record. Records from the LM provide an opportunity to study the variability and response of Earth’s climate to small shifts in climate forcings—volcanic eruptions and changes in orbital configuration, solar variability, land use and land cover, and greenhouse gas concentrations—prior to anthropogenic influence. Of particular interest is the Little Ice Age (LIA), a period of relatively cold global temperatures typically defined between 1400 and 1850 CE with a core period between 1600 and 1850 CE [9]. The LIA is often contrasted with the Medieval Climate Anomaly (MCA; 850–1200), which is associated with warmer temperatures [10]. These periods have been used extensively as targets for LM climate reconstruction and climate changes from the MCA to LIA are documented both globally [10,11] and in Antarctica [12,13,14,15,16]. The significance of MCA-LIA differences in paleoclimate records has been questioned in the past [17]; recent LM temperature reconstructions finds no evidence of a globally coherent warmer MCA and only partial evidence for a globally cooler LIA [18,19]. Nevertheless, the LIA and MCA periods provide a useful, and widely used, framework to investigate LM climate evolution.
Ice core temperature reconstructions indicate dipole patterns of temperature change in Antarctica during the LM: cooling over most of mainland Antarctica and a warming trend along the eastern Antarctic Peninsula and in the eastern Ross Sea [20,21,22,23]. These regionally specific temperature changes point to a potential link between LM climate evolution and multi-centennial trends in large-scale modes of climate variability [13]; El Niño Southern-Oscillation (ENSO) and the Southern Annular Mode (SAM) both drive temperature dipoles in the Antarctic, and previous research has suggested that multi-centennial trends in these modes of variability are a dominant control on climate in Antarctica during the LM [13,21,24,25]. Other reconstructions identify external forcing, particularly volcanic eruptions and orbital trends, as the primary environmental driver [16,20,26]. However, the relative importance of external forcings (i.e., volcanic eruptions vs. solar variability) and any connection to mean state shifts in dynamic modes of climate variability (SAM and ENSO) are difficult to parse from the paleoclimate record alone.
Earth system model simulations of the LM are a useful resource to identify the impact of external forcing and internal variability on climate evolution and can be used in conjunction with paleoclimate records to infer drivers of past climate changes [24]. Little Ice Age cooling in the Northern Hemisphere is linked to periods of low solar activity and strong volcanic eruptions amplified through ice-albedo feedbacks and internal variability [25,26]. However, comparatively little research on the drivers of LM climate using Earth system models has been focused on the Southern Hemisphere high latitudes and the robustness of LM cooling in the Antarctic has been a matter of debate [27,28]. Goosse et al. [29] conclude that, while the main driver of LIA cooling in Antarctica is volcanic forcing, more records are needed to resolve the spatial distribution and causes of Antarctic temperature variations during the LM. Though recent studies have identified a last millennium cooling trend [30,31,32,33], large uncertainties remain about the drivers of LM climate evolution in Antarctica.
Here, we provide an updated, circum-Antarctic, perspective on the drivers of LM surface temperature evolution in the southern high latitudes in the Community Earth System Model Last Millennium Ensemble (CESM-LME or LME). The LME expands on the CMIP5 and earlier LM model simulations by providing 32 realizations of the 850–1850 period with all relevant forcings considered both together and individually within a signal modeling framework. The LME has been used extensively to study the drivers of the LIA [26,34], the relationship between volcanic eruptions and a tropical hydroclimate [35,36,37], and LM climate evolution in the Atlantic sector of the Southern Ocean and Antarctic Peninsula [30,31,32,33]. The ensemble nature of LME simulations (referred to in aggregate as the LME) is a particular strength because it quantifies both the variability associated with external climate forcings (ensemble mean) and the range of unforced variability that arises from internal dynamics (referred to as unforced or internal variability; ensemble spread). By contrast, the inter-model spread in other CMIP5 LM simulations, which typically contain only one simulation from each modeling group, is difficult to interpret and attribute correctly to differences in model configuration or internal variability.
Our analysis of LM Antarctic climate evolution aims to address three fundamental questions: (1) How does Antarctic surface temperature evolve in LME simulations? (2) What was the relative importance of climate forcings (volcanic eruptions, and changes in solar intensity, land use and land cover, greenhouse gas concentrations, and orbital configuration) and unforced variability in driving these changes? (3) How does the picture of LM climate from the LME compare to recent compilations of Antarctic paleoclimate reconstructions [13,23] (Figure 1)? The integrated perspective on the drivers of LM climate changes we develop aims to provide a useful point of comparison for future LM paleoclimate reconstructions from the Antarctic.

2. Methods and Data

2.1. Community Earth System Model—Last Millennium Ensemble (CESM-LME)

The CESM-LME employs version 1.1 of CESM with the Community Atmosphere Model version 5 (CESM1-CAM5) [38]. The CESM-LME uses ~2° resolution in the atmosphere (30 levels) and land components and ~1° resolution in the sea ice and ocean (60 levels) components. The sea ice component of CESM1 uses version 4 of the Los Alamos National Laboratory Community Ice Code and the Parallel Ocean Program, version 2 as the ocean model component (see the detailed description in Hurrell et al. [38]). The representation of modern Antarctic climate in the CESM1-CAM5 compares favorably to observations and other CMIP5 generation models [39,40]. The CESM-LME simulations capture about 80% of the observed 20th-century warming globally and reproduce instrumental observations of the observed annual sea ice limit, temperature, and sea level pressure trends in the Antarctic [32,41].
The CESM-LME experiment included a total of 32 simulations forced with reconstructions for the transient evolution of volcanic emissions (n = 5), solar intensity (n = 4), greenhouse gases (n = 3), land use and land cover (n = 3), orbital parameters (n = 3), and all forcings (n = 13) (Figure S1) [41]. Smaller (3–5 simulation) ensembles for individual forcings provide a useful first-order estimate of the range of climate responses to each forcing. However, we note that variability within the 13-member full forcing ensemble suggests that small ensembles do not capture the full range of LM unforced variability in the Antarctic.
The only difference between ensemble members is a small (order 10−14) random roundoff difference in the air temperature field at the start of each simulation. Volcanic forcing is determined by the monthly, zonally resolved distributions of stratospheric aerosols, as estimated by Gao et al. [42] from ice cores. The largest injection, 260 tons of SO2, occurred in 1257 and is associated with the eruption of the tropical Samalas volcano. Other notable sulfate injections took place in 1452, 1600, and 1815, resulting from the tropical eruptions of Kuwae, Huaynaputina, and Tambora. Changes in total solar irradiance (TSI) were prescribed using the Vieira et al. [43] reconstruction. This forcing is characterized by multidecadal perturbations that predominantly correspond to the Wolf (1280–1350), Sporer (1460–1550), and Maunder (1645–1715) sunspot minima. The concentrations of greenhouse gases, such as CO2, CH4, and N2O, were obtained from Schmidt et al. [44]. Pongratz et al. [45] and Hurtt et al. [46] reconstructions were used for land use and land cover changes (LULC). Seasonal and latitudinal distribution of the orbital modulation of insolation was obtained from Berger [47]. During the last millennium, high southern latitudes experienced a decrease in insolation in November and early December (>5 W/m2/kyr) and a weaker increase (3 W/m2/kyr) in insolation in February, with an overall annual trend of −0.5–1 W/m2/kyr (Figure S1).
Large-scale climate patterns are critical features of the climate system. The simulated annual Southern Annular Mode (SAM), Pacific South America Pattern (PSA1), and El Niño-Southern Oscillation (Niño3.4) indices in LME full forcing simulations were calculated using the Climate Variability Diagnostics Package (CVDP) [48]. The SAM and the PSA1 were defined as the first and second principal components of the normalized pressure over the Southern Hemisphere (20–90° S). ENSO was quantified through the Nino3.4 index, a measure of sea surface temperature in the Tropical Pacific (5° N to 5° S, 170–120° W). ENSO has a realistic spread in the frequency domain in CESM-LME simulations, although its amplitude is overestimated compared with observations [41].
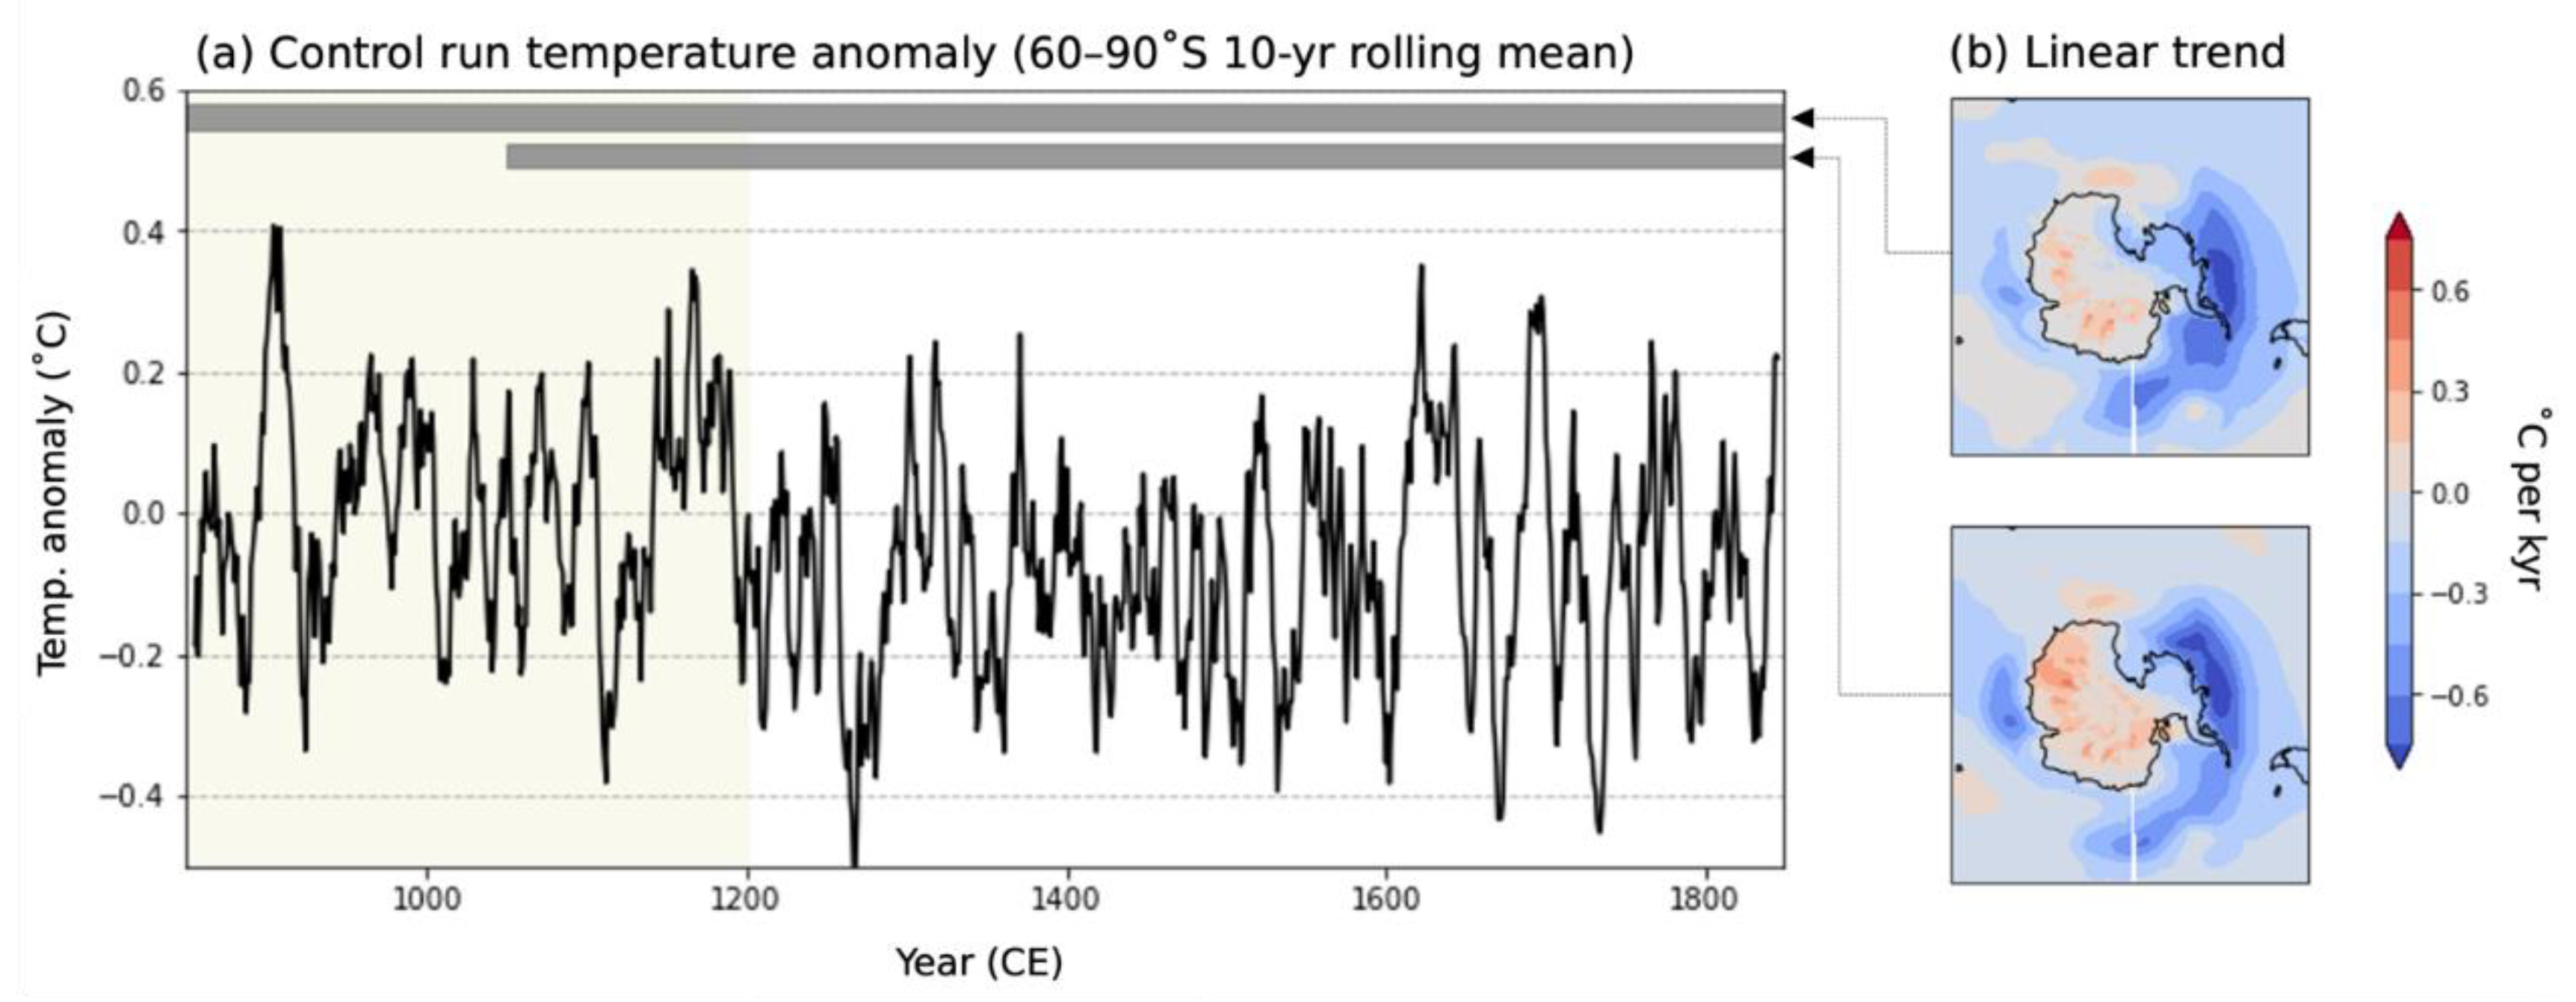
Spurious long-term changes unrelated to changes in external forcing and internal low-frequency variability (model drift) are common in CMIP5-generation models [49]. Model drift is a particularly important consideration when analyzing LM simulations from the Antarctic because the magnitude of external forcing is relatively small and the southern high latitudes are highly sensitive to the initial state of the Southern Ocean [49,50,51]. All CESM-LME simulations were branched from year 850 of an 850 CE control simulation to minimize model drift. An unforced control simulation allowed us to remove any trends still present in the LME prior to our analysis [41]. Though globally averaged drift in LME simulations is negligible, previous studies have identified spurious changes in Southern Ocean frontal boundaries between 850 and 1050 CE [30,31]. Substantial cooling trends persisted in the West Antarctic (−0.35 °C/kyr) and Weddell Sea (−0.41 °C/kyr) sectors in the control simulation between 850 and 1850 CE (Figure 2). We linearly detrend simulations at each grid point using the control prior to analysis to isolate the Antarctic response to LM external forcing. We also considered the impact of model drift and choice to detrend in our analysis; all results from LME simulations presented here are detrended unless otherwise stated.

2.2. Paleoclimate Records

Paleoclimate records inferred from proxy-based reconstructions and model simulations are complimentary sources of information about past climate conditions: paleoclimate records reflect the impact of climate evolution and ensembles of model simulations can provide process-based insights. We compared simulations from the CESM-LME to a database of quantitative isotopic (δ18O) ice core temperature reconstructions compiled by the PAGES Antarctica2k working group [23] and paleotemperature records derived from a diverse array of paleoclimate archives (e.g., marine, ice, lake and peat sediments, tree-rings, glacial dynamics) complied and qualitatively assessed by Lüning et al. [13] (Figure 1).
The PAGES Antarctica2k working group database consists of 112 ice core records; paleotemperatures are reconstructed based on the statistical relationship between δ18O and surface air temperature [23]. A total of 11 records cover the full LM (850–1850 CE). Most of the records have a data resolution ranging from 0.025 to 5 years but were 5-year-averaged data for reconstructing the last 200 years, and 10-year-averaged data for reconstructing the last 2000 years to mitigate the influence of decadal-scale age model uncertainty. In addition to ice core records, the Lüning et al. [13] database (60 records) contains paleoclimate records that provide qualitative insight into past climatic conditions (e.g., the formation of glacial moraines and the ecological preferences of marine algae). Lüning et al. [13] assessed anomalies (warm, neutral, or cold) for four time-windows (500–900, 950–1250, 1250–1500, and 1500–1800 CE) following the methodology used to interpret the record in the original publication. This qualitative approach synthesizes heterogeneous, low-resolution proxy data that lacks an established quantitative relationship with temperature to facilitate intercomparison.

3. Results

3.1. Full Forcing Simulations

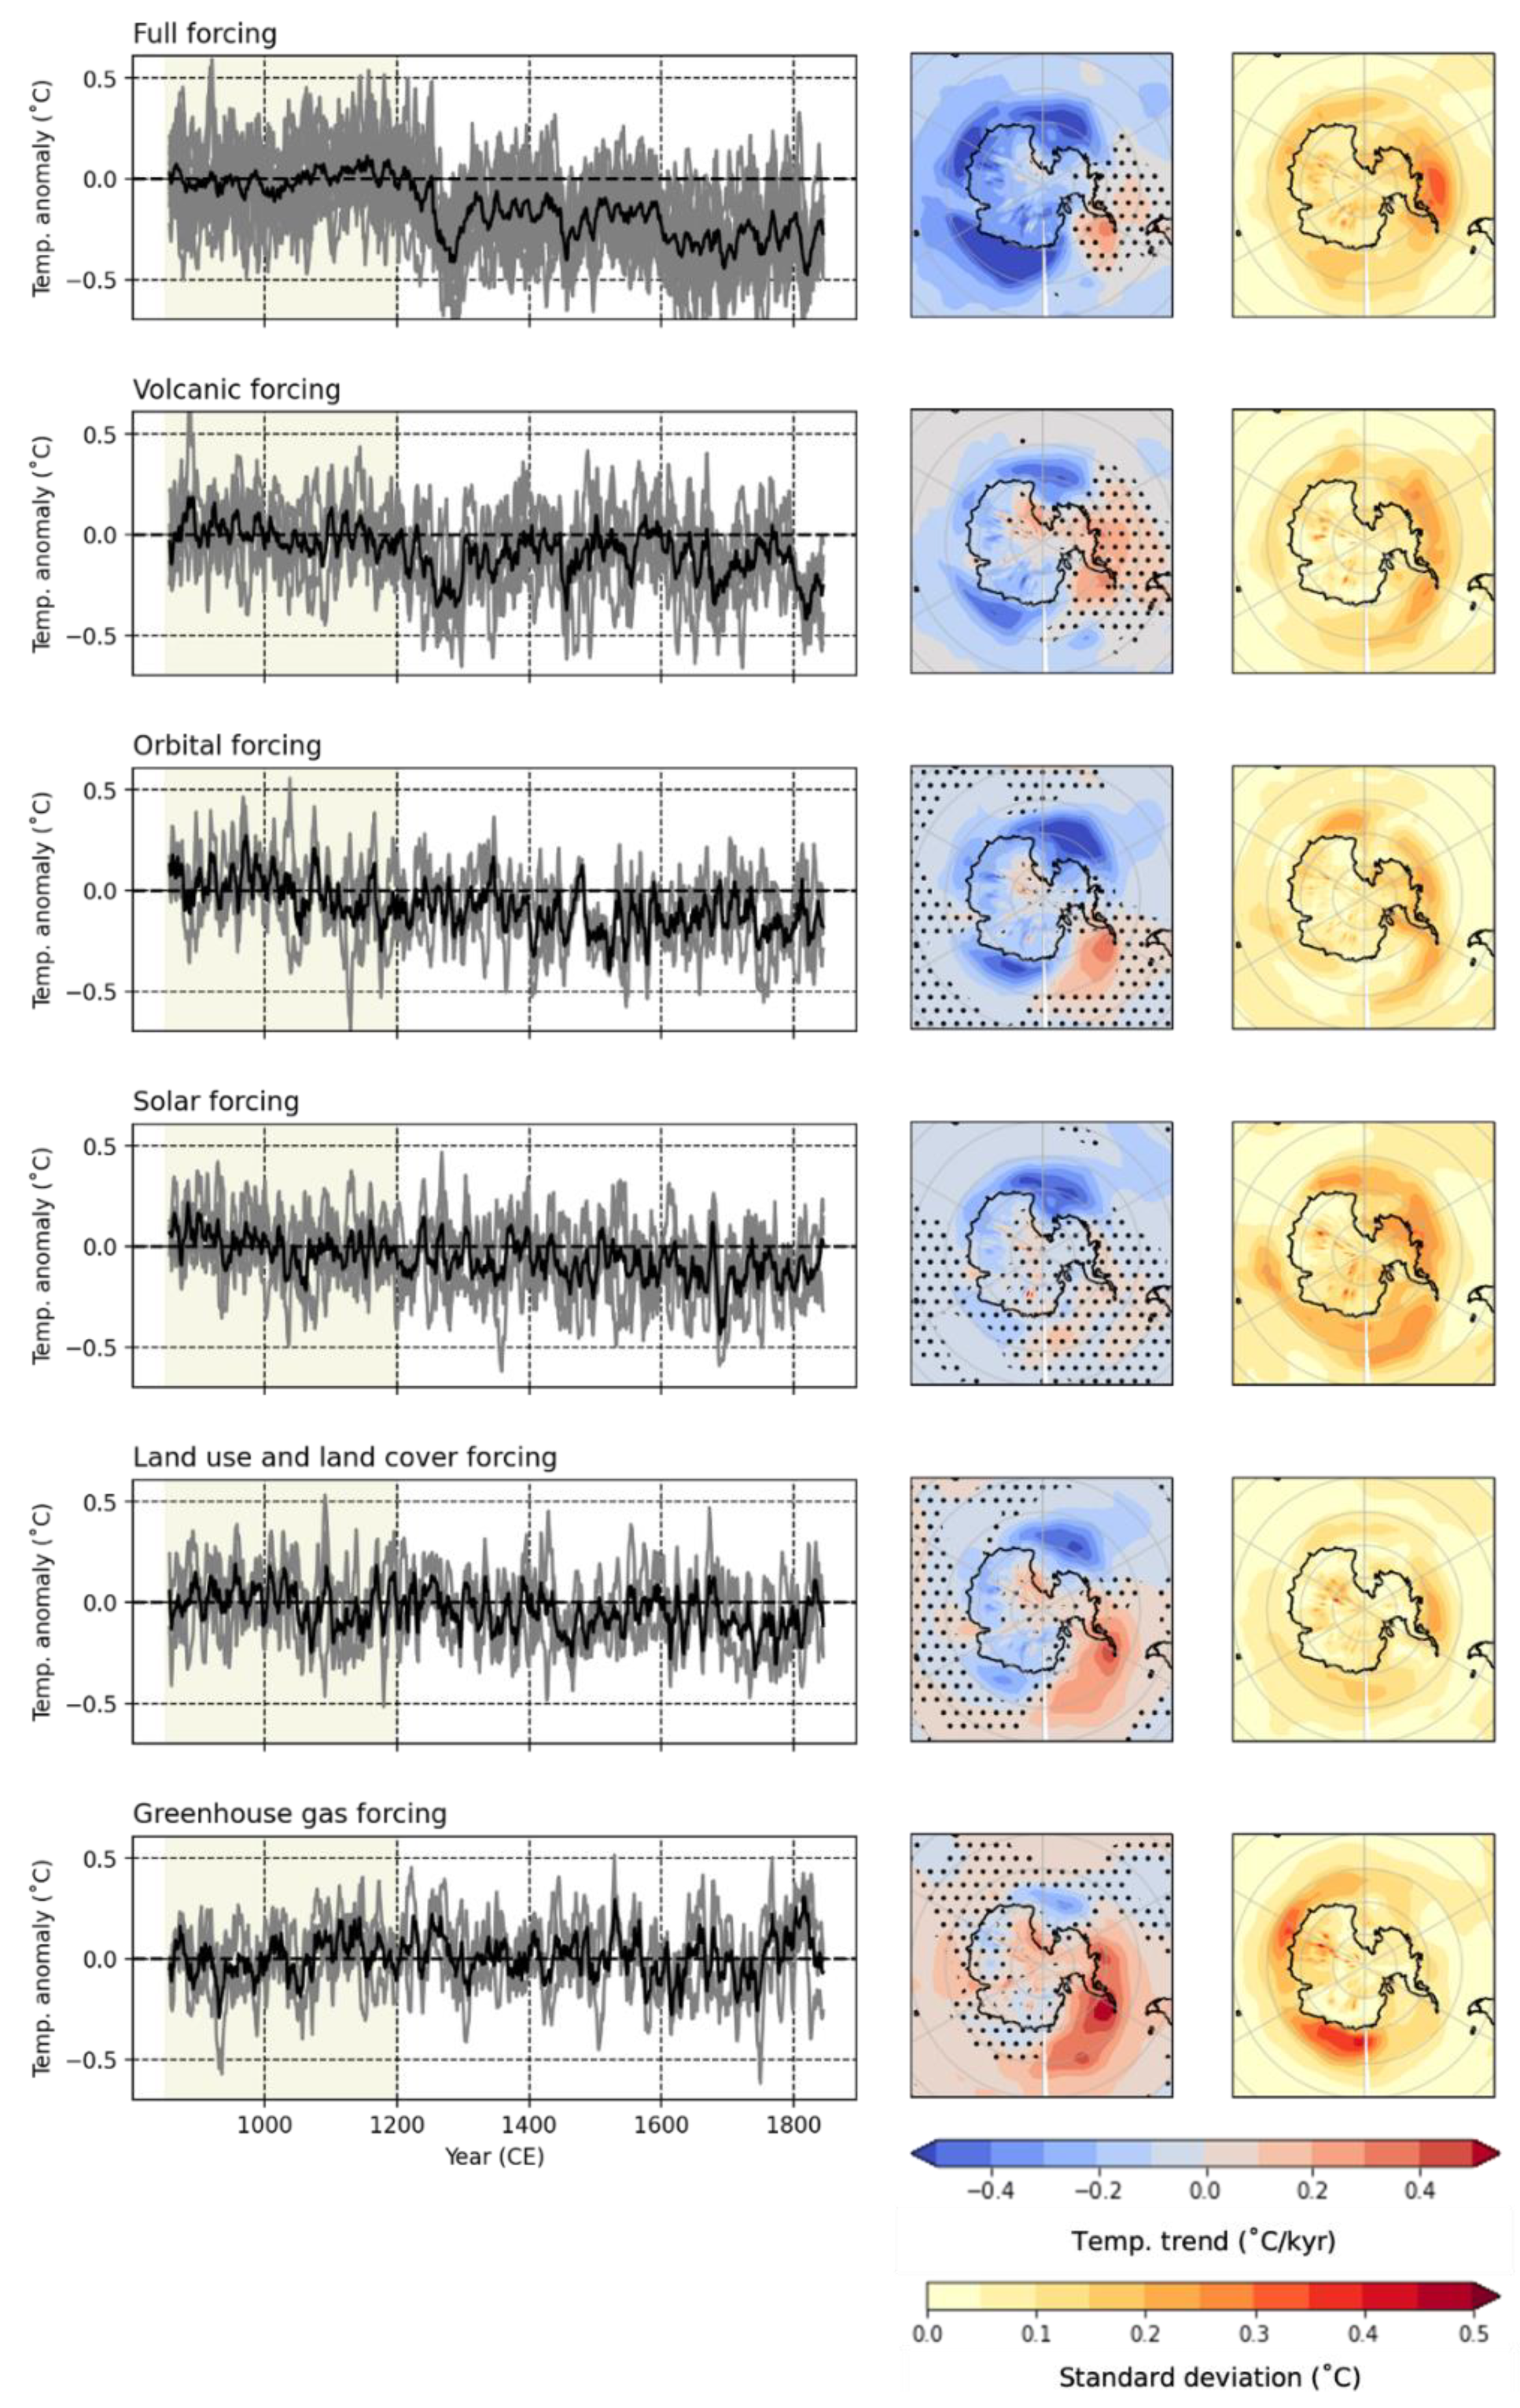
The average 2-m air temperature in southern high latitudes (60 to 90° S) cools by −0.37 ± 0.5 °C/kyr in the full forcing ensemble mean (Figure 3). The first 350 centuries of the simulation (850–1200) are warmer and more stable; the next four centuries are punctuated by cooling following the Samalas (1258) and Kuwae (1450) and Huaynaputina (1600) volcanic eruptions; and the final 250 years (1600–1850) are 0.30 ± 0.5 °C cooler than the period between 850 and 1200 CE. Last millennium cooling in the Antarctic is greater than the global mean but less than the Arctic, particularly after 1600 CE. Asymmetry between the Antarctic and the Arctic is largest (>1.5 °C) following large volcanic eruptions (Figure 4). The regionally heterogenous and eruption-specific impact of volcanic aerosols on the Southern Hemisphere contrasts with a cooling trend in most regions of the Northern Hemisphere mid and high latitudes (Figure 5).
A continent-wide LM Antarctic cooling trend masks significant regional heterogeneity in both ensemble members and the ensemble mean (Figure 3 and Figure 4; Figures S2 and S3). Forced (ensemble mean) cooling is greater over East Antarctica (−0.42 ± 0.7 °C/kyr) than West Antarctica (−0.25 ± 14 °C/kyr) and more significant relative to the variability within the ensemble (Figure 6). The Dronning Maud land sector of East Antarctica cools by −0.54 °C ± 0.9 °C/kyr; regions of coastal Dronning Maud Land cool by up to −1 °C/kyr. The ensemble mean temperature change in the Weddell Sea sector is not significant (−0.08 ± 0.11 °C/kyr). However, a slight forced warming trend (>0.2 °C/kyr) is evident in parts of the western Weddell Sea and the mean surface temperatures between 1600 and 1850 CE are up to 0.5 °C warmer than the mean surface temperatures between 850 and 1200 CE in some ensemble members. However, warmer temperatures between 1600 and 1850 CE are not statistically significant in 9 out of 13 ensemble members (Figure S2).
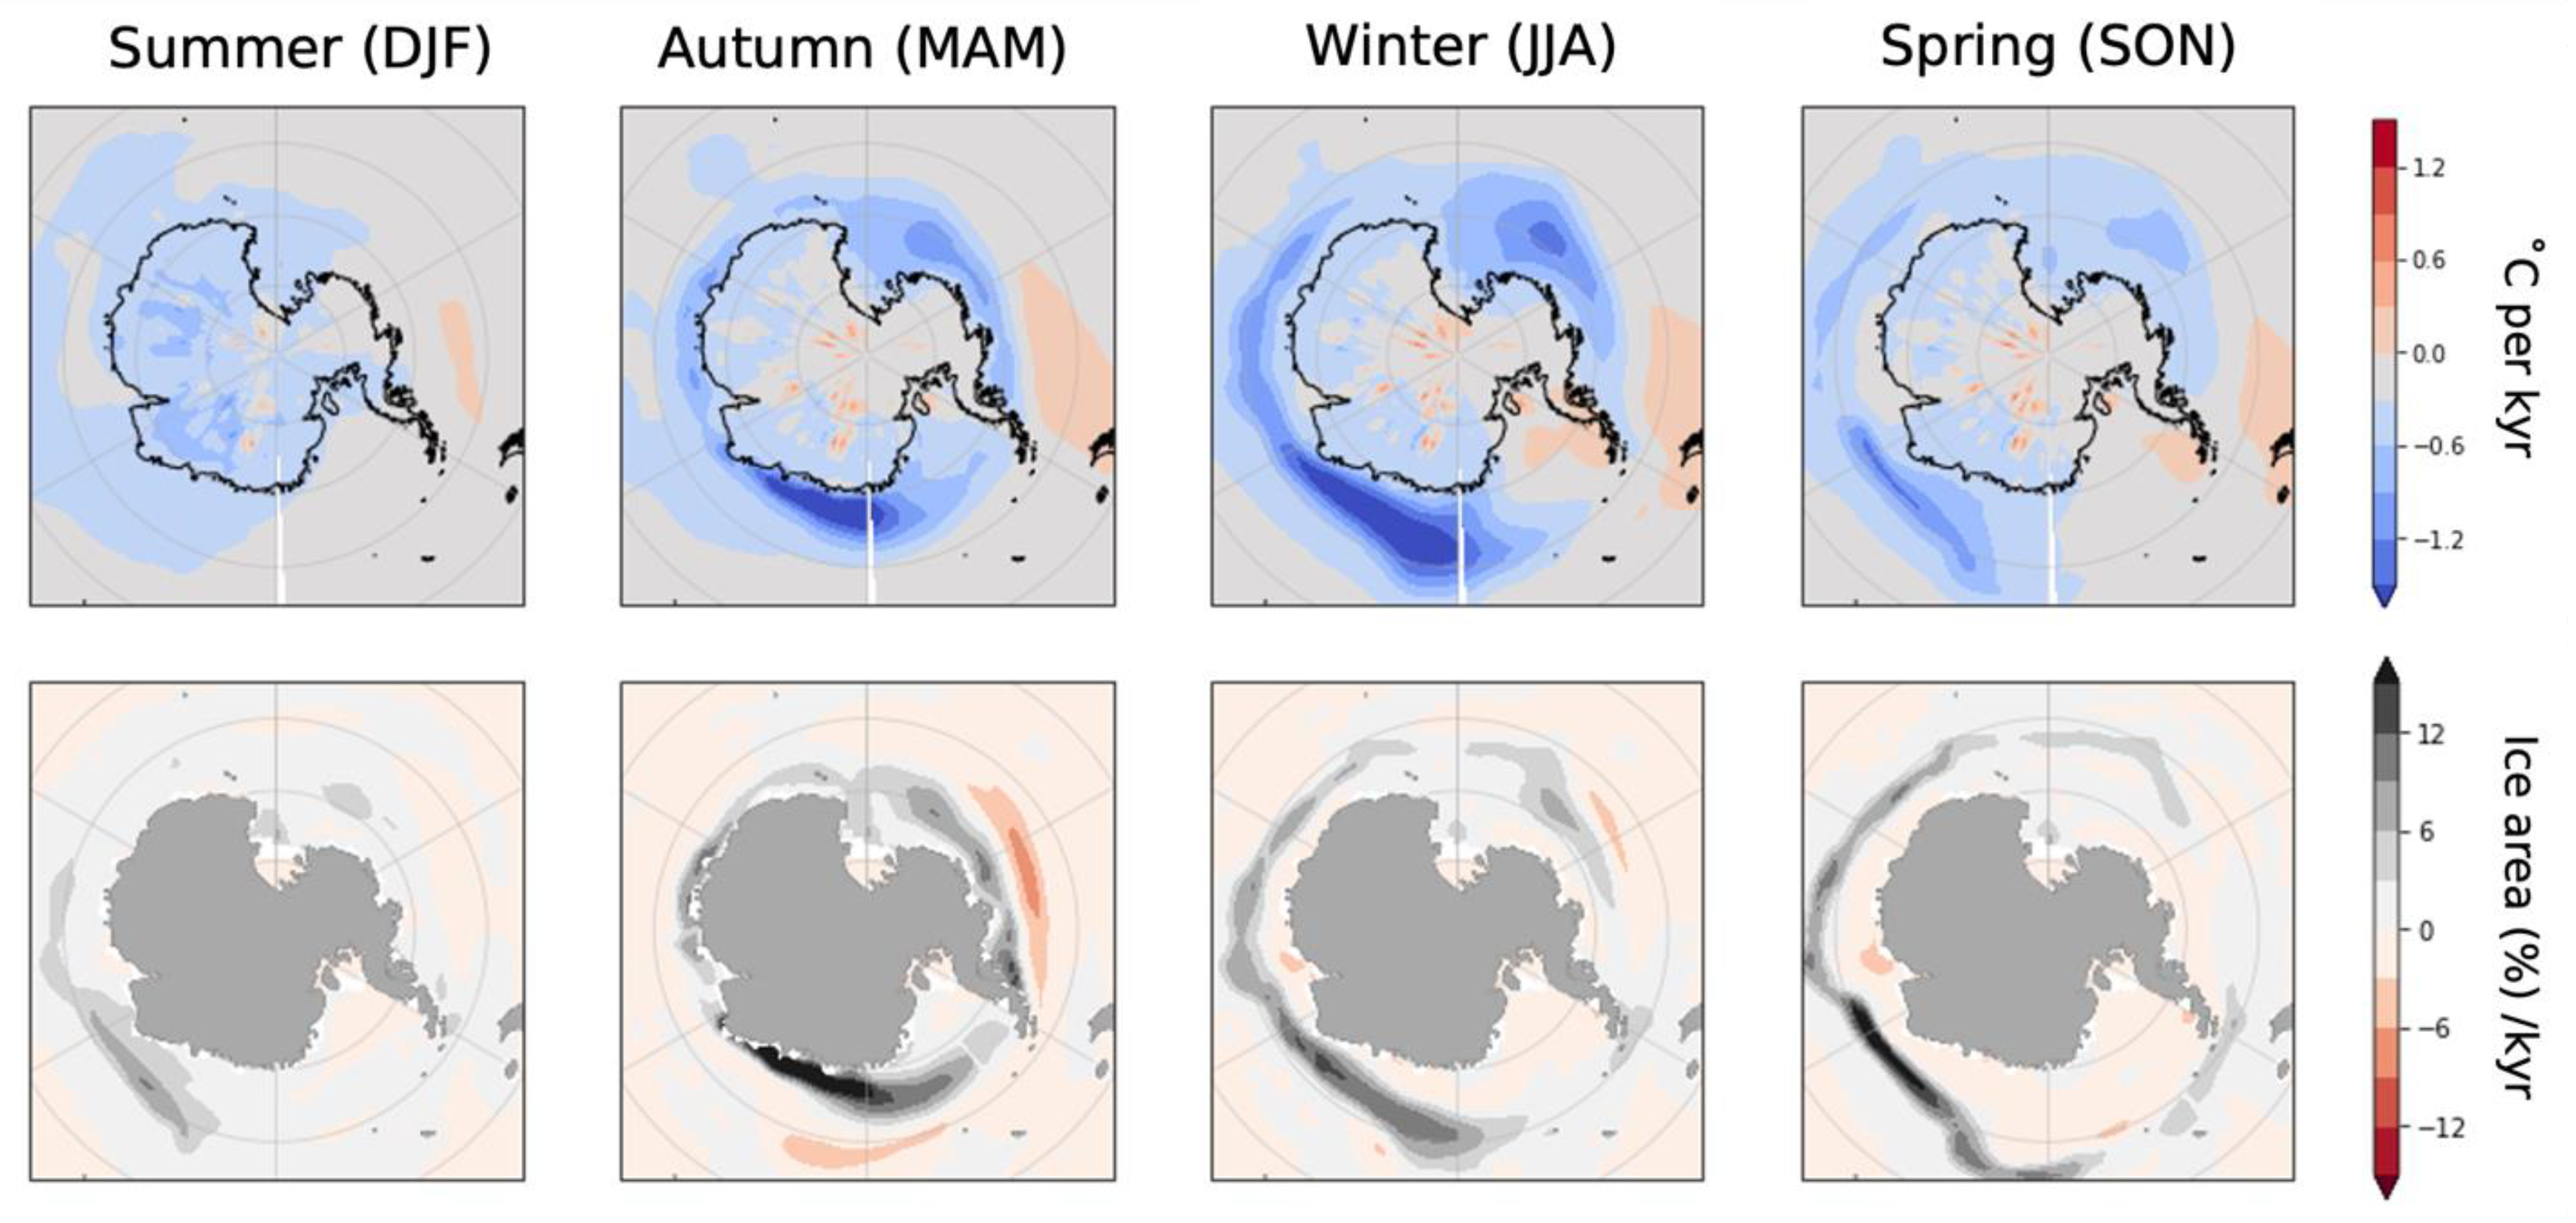
The pattern of forced temperature change in the CESM-LME simulations is also seasonally heterogeneous (Figure 7). Maximum cooling over land occurs during austral summer (December, January, and February; DJF). Temperatures over the Southern Ocean also cool by −0.25 °C/kyr during DFJ; cooling over the ocean is greatest during March, April, and May (MAM) and June, July, and August (JJA), with >1.5 °C of cooling in the Atlantic and Pacific sectors of the Southern Ocean. The seasonal contrast is particularly evident in the Droning Maud Land sector of the Southern Ocean, where simulated cooling of >1.5 °C in MAM and JJA contrasts with <0.6 °C in DJF.
The most pronounced LM cooling occurs in areas of the Southern Ocean where the sea ice concentration increases, consistent with local amplification by simulated sea ice–ocean interactions and the ice–albedo feedback (Figure 7). A trend towards higher sea ice concentrations around the continent during MAM indicate earlier sea ice advance while increases at the northern limit during austral spring (SON) indicate later retreat. The greatest increases in sea ice concentration occur in the Droning Maud land sector of the Southern Ocean.
Analysis of the ensemble standard deviation allows us to assess the relative importance of internal variability and forced trends (Figure 3 and Figure 6). Low ensemble spread in East Antarctica (±0.07 °C/kyr) indicates that this region is primarily responding to forcing rather than internal variability. By contrast, a weaker forced trend in West Antarctica (−0.25 °C/kyr) is less significant relative to unforced variability (±0.14 °C/kyr) (Figure 6). Ensemble spread in the Amundsen Sea and Bellingshausen Sea regions is particularly high (standard deviation of up to 0.35 °C/kyr); one ensemble member simulates warming of >0.5 °C/kyr while others simulate weak (−0.1 °C/kyr) cooling (Figure S2).

3.2. Single Forcing Simulations

Single forcing ensembles isolate the relative influence of orbital, solar, volcanic, land use and land cover (LULC), and greenhouse gas (GHG) forcing on the LM climate in Antarctica (Figure 3 and Figure 4; Figure S2). The average surface temperature in the southern high latitudes (60–90° S) cools in ensembles forced by solar (−0.17 ± 0.04 °C/kyr), volcanic (−0.19 ± 0.05 °C/kyr), and orbital (−0.23 ± 0.05 °C/kyr) changes, with a smaller (−0.12 ± 0.02 °C/kyr) contribution from LULC forcing (Figure 3 and Figure 4b). Increased volcanism after 1200 CE cools average surface temperatures in the Antarctic, particularly following the Samalas (1258), Huaynaputina (1600), and Tambora (1815) volcanic eruptions. Orbital, solar, and LULC forcing result in a more monotonic decrease in the mean Antarctic temperature (Figure 3). The response to greenhouse gas forcing varies across the three-simulation ensemble (Figure 3 and Figure S2).
Individual forcings drive a heterogeneous pattern of temperature change around the Antarctic landmass during the LM (Figure 3 and Figure 4). Forced cooling in the volcanic and orbital ensembles is concentrated in the Ross Sea and Dronning Maud Land sectors of the Southern Ocean; the cooling response in solar and LULC-forced ensembles is most pronounced (>0.4 °C/kyr) in the Ross Sea region. Weak warming (~0.4 °C/kyr) in the Weddell Sea is evident in the orbital, LULC, and greenhouse gas-forced ensembles. Warmer Weddell Sea temperatures between 1600 and 1850 CE relative to 850–1250 CE are statistically significant in all orbitally forced simulations (Figure S2). Cooling in the Dronning Maud Land region of the Southern Ocean is weaker than cooling in the Ross Sea region in the individually forced ensembles. The reversal of this pattern in the full forcing ensemble indicates that the combined influence of all forcings, rather than any individual external factor, cools coastal Dronning Maud Land.

4. Discussion

4.1. Drivers of Antarctic Temperature Evolution in the CESM-LME

External forcing drives cooling in the southern high latitudes in the CESM-LME. Analysis of the LME simulations shows LM cooling in the Antarctic driven by solar, orbital, and volcanic forcing, with a small contribution from land use and land cover changes (Figure 3). Antarctic temperature evolution in the LME simulations can be divided into three main periods: the three and a half centuries (analogous to the Medieval Climate Anomaly, 850–1200), characterized by warmer, more stable, temperatures; the following 400 years that correspond to the initial period of colder temperatures punctuated by cooling in the aftermath of the Samalas (1258) and Kuwae (1450) and Huaynaputina (1600) volcanic eruptions; and the two and a half centuries that follow (1600–1850), where temperatures are even colder during the core period of the Little Ice Age [11] (Figure 4).
A dipole pattern, with cooling around most of continental Antarctica juxtaposed against warming in the Weddell Sea region, is a statistically significant feature of the single and full forcing LME simulations detrended using the control simulation. A trend towards warmer surface temperatures in western Weddell Sea is evident in the full forcing ensemble members but is greatest (>0.5 °C/kyr) in ensembles forced by orbital changes, greenhouse gases, and LULC. However, we note that the warming trend in the Weddell Sea is the result of detrending to account for a cooling trend in the unforced control simulation (Figure S4). The presence of a cooling trend in the Weddell Sea (−0.41 °C/kyr) and WAIS (−0.35 °C/kyr) sectors in the LME control simulation despite the 850-year spin-up period and its significance relative to forced changes underlines the importance of considering model drift when analyzing simulations from the LME and other CMIP5-generation LM simulations.
The sensitivity of LM temperature evolution to a small random roundoff (order 10−14 °C) difference in the air temperature field at the start of each simulation highlights the role of internal variability, with implications for both paleoclimate reconstructions and future projections in the Antarctic. The magnitude of ensemble spread in West Antarctica indicates that internal variability, rather than external forcing, is a dominant control on LM climate in that region (Figure 3 and Figure 6). Temperature evolution in West Antarctica associated with model drift (−0.35 °C/kyr) and internal variability (±0.14 °C/kyr) is more significant than the forced trend (−0.25 °C/kyr). Notably, one ensemble member simulates >0.5 °C warmer conditions during the LIA than the MCA while another simulates ~0.4 °C of cooling (Figure S2). The influence of unforced variability and the initial state of the Southern Ocean in the Amundsen and Bellingshausen regions is relevant to future projections of the West Antarctic Ice Sheet [52]. Additional paleoclimate records will be particularly useful to constrain the range of ensemble estimates of LM climate evolution in this region and inform reconstructions of pre-industrial climate used to initialize future projections.

4.2. Polar Asymmetry

The forced (ensemble mean) LM cooling trend is weaker in the Southern Hemisphere high latitudes (60–90° S) (−0.37 ± 0.05 °C/kyr) than in the Northern Hemisphere high latitudes (60–90° N) (−0.70 ± 0.09 °C/kyr) (Figure 4). The pattern of warming and cooling in response to LM external forcing is heterogeneous in the Antarctic. The non-linear response of the Antarctic to external forcing (e.g., the dynamic response to volcanic eruptions [53]) and the deeply penetrating Antarctic circumpolar current, which isolates the continent from the mid and low latitudes [54], dampen the regional cooling trend. By contrast, the Arctic cools in both the full and single forcing ensembles. Polar asymmetry is most pronounced following volcanic eruptions and between 1600 and 1850 CE, a period with the greatest negative excursion of radiative forcing during the last millennium primarily due to the combined influence of solar minima and volcanic eruptions [41].
The contrasting behavior of the simulated Arctic and Antarctic air temperatures during the last millennium in the LME simulations is consistent with the differing importance of radiative and non-radiative feedbacks in the polar regions. Polar amplification of external forcing is mainly a consequence of positive feedbacks involving snow cover and sea ice [55], and it emerges more robustly in the Northern than in the Southern Hemisphere [56]. Arctic sea ice, formed at the pole in the semi-enclosed Arctic Ocean, persists from year to year. Arctic sea ice responds quickly to (and amplifies) changes in northward heat transport and associated shifts in surface temperature through positive ice–ocean feedbacks. Antarctic sea ice, by contrast, forms each year around the Antarctica landmass in the open Southern Ocean; its northern boundary is set by the circumpolar system of southern midlatitude westerly winds, bathymetry, and ocean currents [57]. The regionally heterogeneous impact of external forcing on Antarctica during the LM in the LME and significant contribution of internal variability, particularly in the Amundsen and Bellingshausen seas, illustrates that dynamic feedbacks and regional processes in the Antarctic can yield unforced temperature changes of similar, or greater, magnitude to the LM forced trend [6] (Figure 3 and Figure 6).

4.3. Comparison to Proxy Records

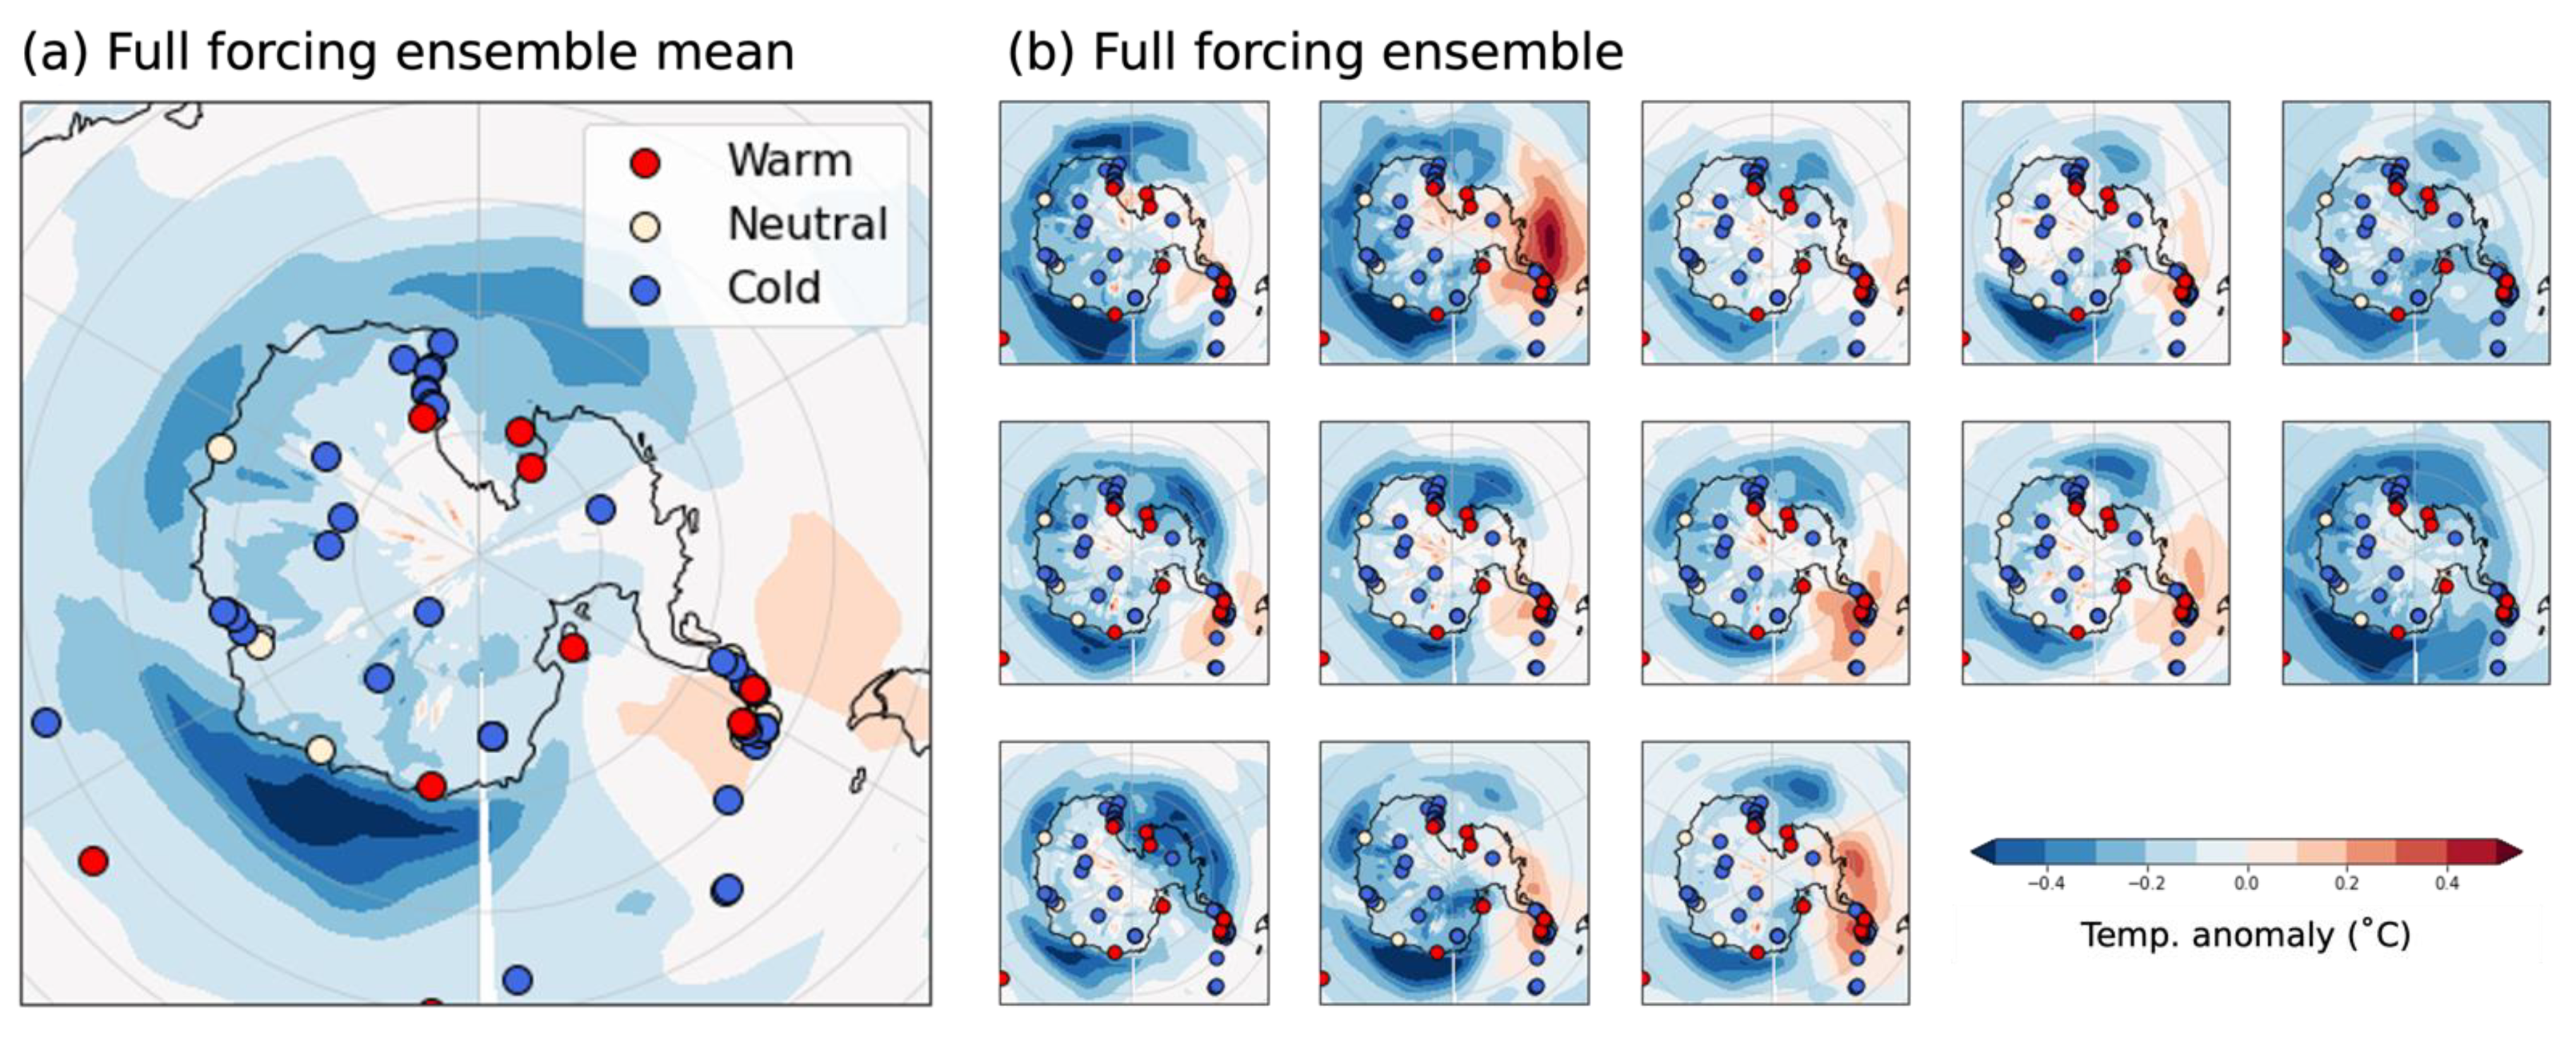
The CESM-LME full forcing ensemble members simulate an Antarctic dipole pattern of LM temperature evolution that is consistent with ice core and other paleoclimate records. The LM temperature trends in most regions of Antarctica are of a similar sign and magnitude to a database of ice core temperature reconstructions compiled by the PAGES Antarctica2k working group, Stenni et al. [23] (Figure 1, Figure 5 and Figure S3), though only 11 records span the full LM. The LME is also broadly in agreement with an LM cooling trend identified in qualitative paleotemperature reconstructions compiled by Lüning et al. [13] (Figure 8). Some discrepancies remain between paleoclimate records and the LME ensemble mean (Figure 8a), particularly on the western side of the Antarctic Peninsula [32], which may be related to the role of internal variability in West Antarctica (Figure 6 and Figure 8b). A weak (~0.2 °C/kyr) warming trend in parts of the Weddell Sea in detrended full forcing LME ensemble members is consistent with an ice core temperature reconstruction from James Ross Island [22] and a terrestrial record from the Eastern Antarctic Peninsula [58] and evidence of enhanced meltwater discharge from Eastern Antarctic Peninsula Ice Shelves during the LM inferred from a marine sediment core [59]. Few proxy reconstructions are available from coastal Dronning Maud Land, the region of maximum LM cooling in the full forcing LME simulations. Ice core records from interior Dronning Maud Land record a weak LM cooling trend and the only available coastal records, terrestrial lacustrine sediment cores [31,60,61], do not have a straightforward relationship with temperature [13]. More marine and coastal ice core records from this region would be particularly useful to validate results from the LME.
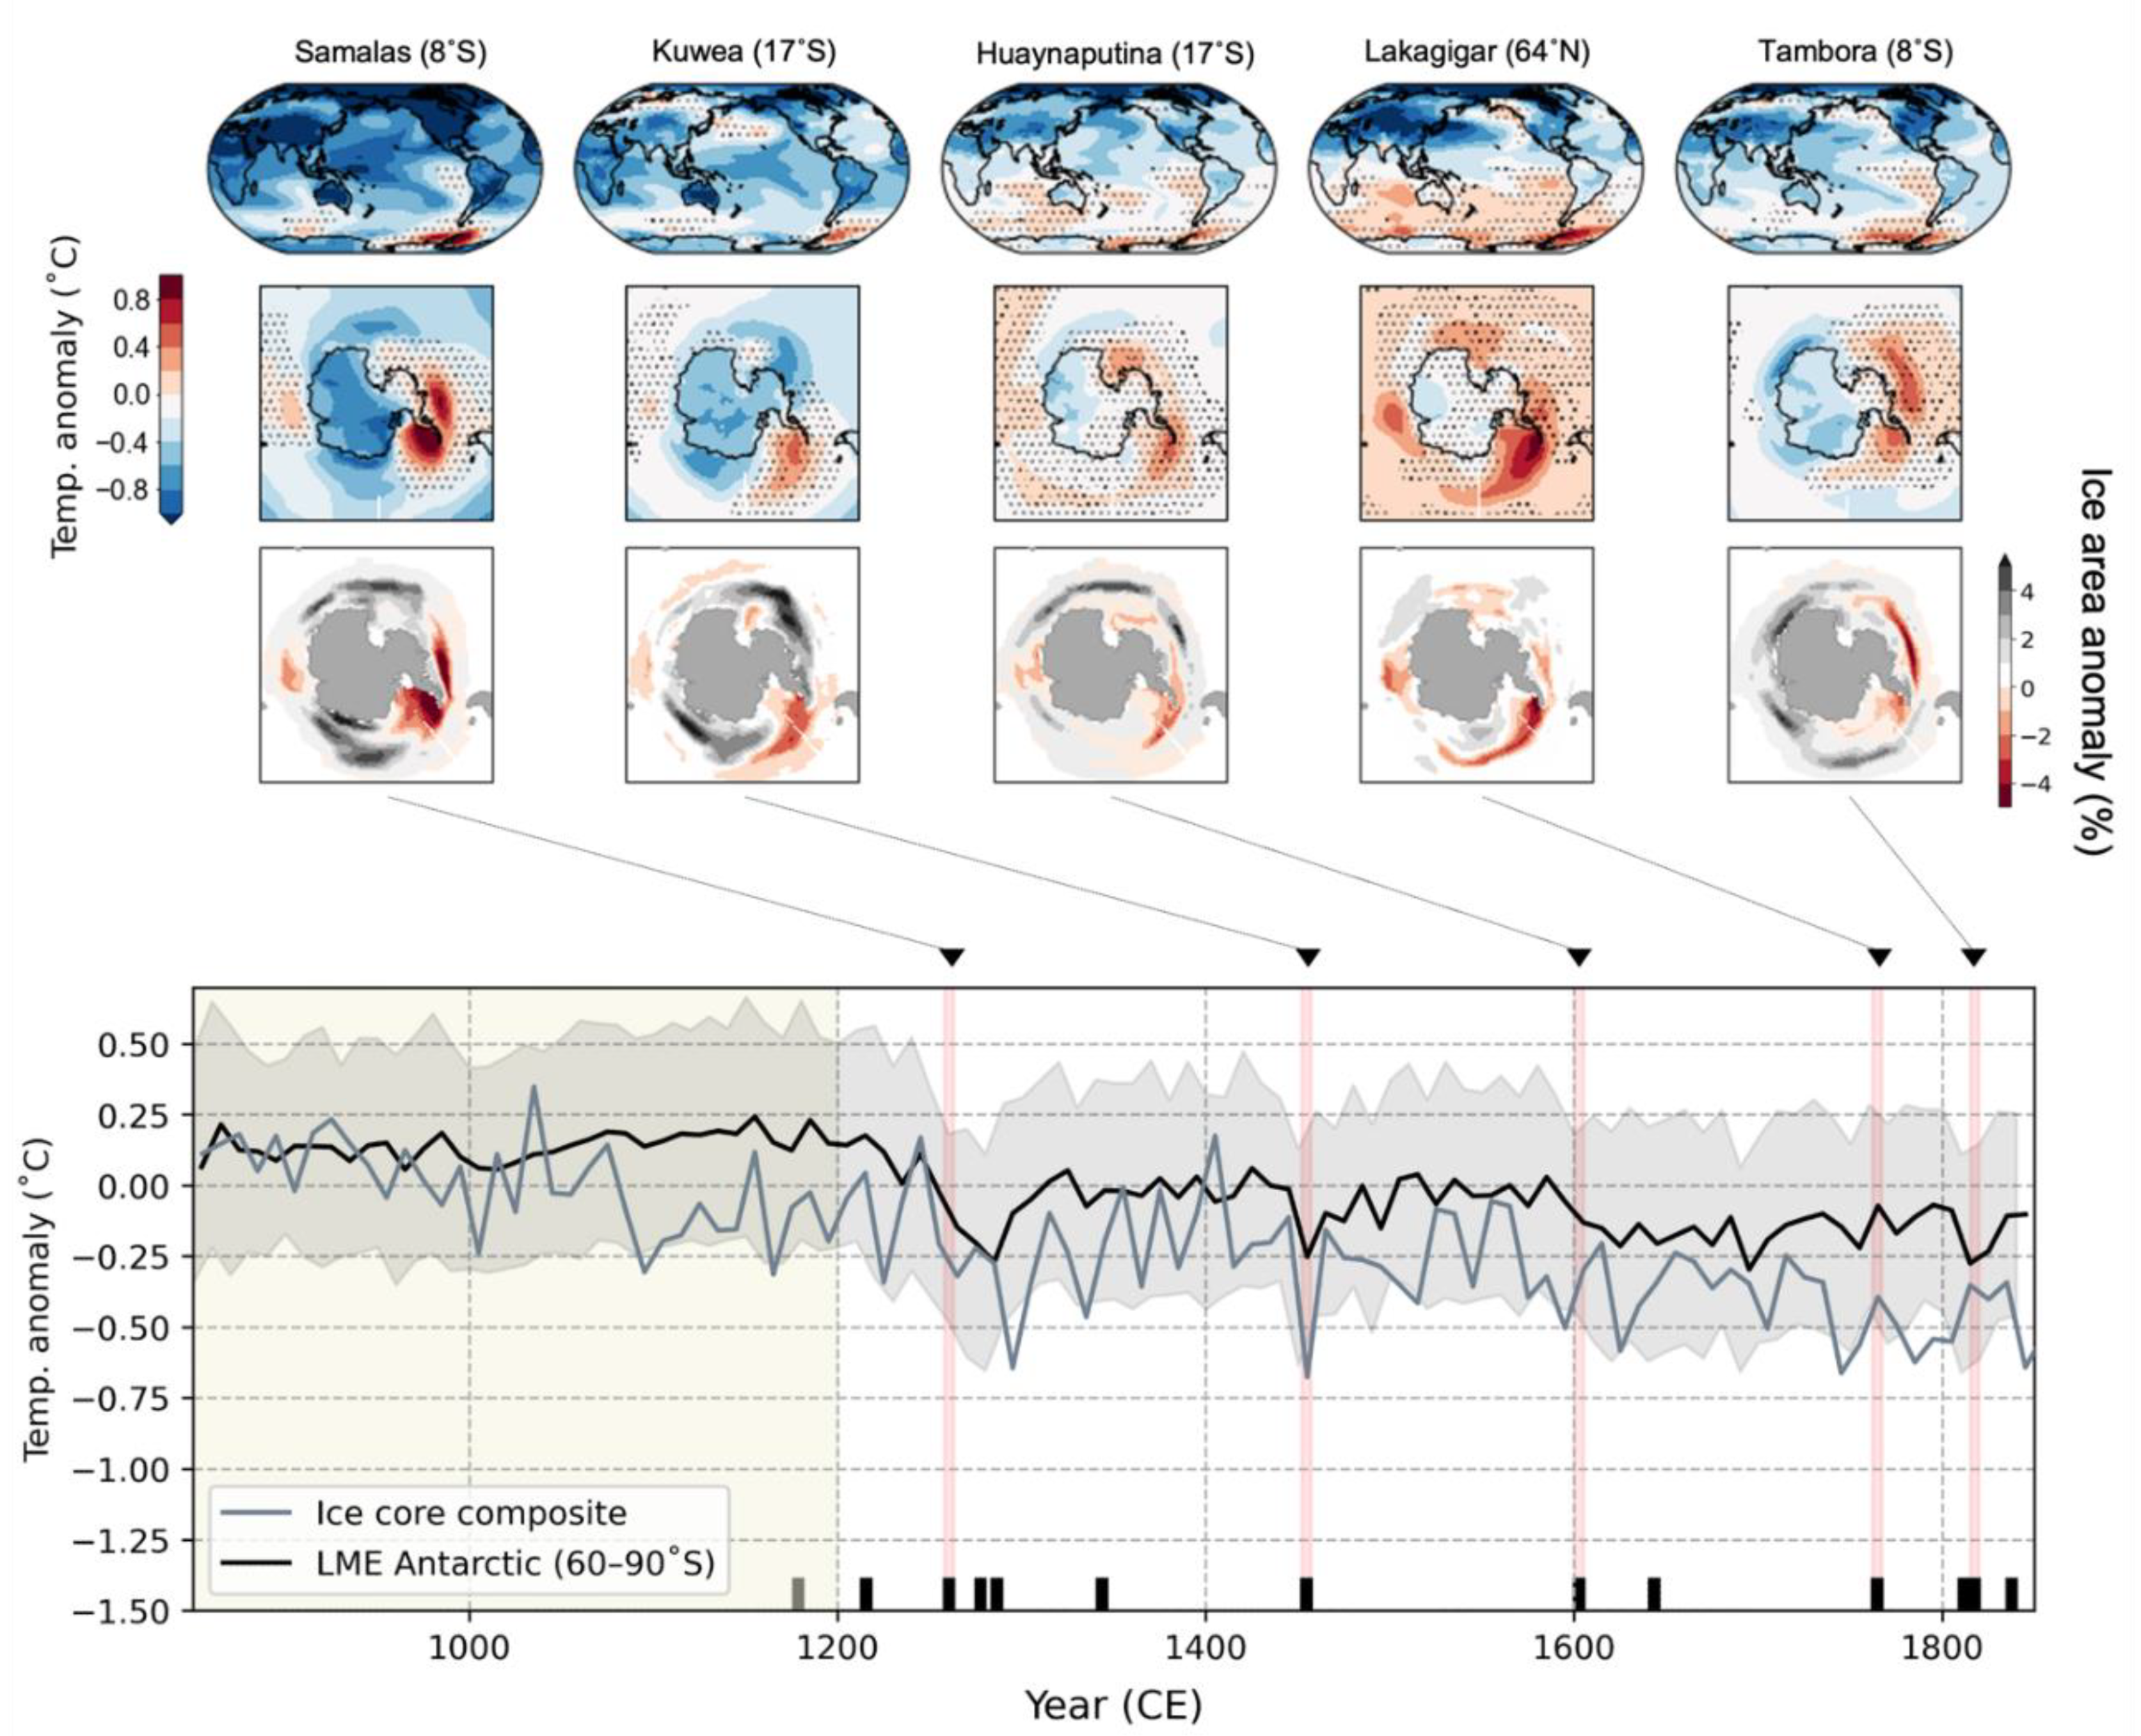
The LME ensemble members underestimate cooling relative to the ice core records, particularly in West Antarctica (Figure 5 and Figure S3). The LM ensemble mean temperature trend of −0.43 ± 0.7 °C/kyr in East Antarctica is consistent with an estimate of −0.50 °C/kyr from ice cores [23]; however, the cooling of −0.25 ± 0.14 °C/kyr in West Antarctica is weaker than the composite ice core estimate of −0.58 °C/kyr. Weaker cooling in West Antarctica in the LME ensemble mean may be related internal variability in the WAIS sector and model bias. However, the seasonality of ice core reconstructions and the statistical methodology used to infer paleotemperatures from ice cores also may contribute to this discrepancy. The WAIS Divide core [14], a paleotemperature record from the interior of West Antarctica that records a robust LM cooling trend, is given higher weight in the continental reconstruction than the Roosevelt Island Ice Core [21], an ice core from the eastern Ross Sea that records a warming trend [23]. In addition, statistically based ice core estimates of past temperatures, such as Stenni et al. [23], are limited by a short instrumental calibration interval and the complicated link between isotope records from ice cores, local climate, and regional climate [62]. Though outside the scope of this study, analysis of isotope-enabled LM simulations [36] will allow for a more sophisticated, direct comparison between modeled climate and ice core reconstructions [62].
The forced response of Antarctic air temperatures to volcanic aerosols in the LME is consistent with the variable regional response to large LM volcanic eruptions inferred from ice core temperature reconstructions [23] (Figure 5). Changes in atmospheric and ocean dynamics and regional feedbacks, rather than direct radiative forcing, drive a heterogenous pattern of warming and cooling in Antarctica in the years after a large volcanic eruption [63,64]. Using observational data from the 1991 Mt. Pinatubo eruption and the LME, Verona et al. [53] showed that volcanism alters Southern Hemisphere wind patterns, weakens subsurface outflow in the Weddell Sea, and warms sea surface temperatures along the East Antarctic Peninsula in the first year after a large volcanic eruption. Taken together, observational data and results from the LME and show that the absence of a response to volcanic eruptions in Antarctic ice cores [23] and warming along the Eastern Antarctic Peninsula [22] are likely features of the climate system, rather than a result of age model uncertainty or bias in ice core records [53].
Results from the LME full forcing simulations provide a dynamic explanation for a weaker response to volcanism and more varied MCA and LIA periods in networks of paleoclimate records from the Southern Hemisphere mid and high latitudes [23,60]. Regional heterogeneity and a substantial component of unforced variability in the Antarctic in LME simulations are consistent with the lack of an identifiable cooler LIA period in some Antarctic records [31,65,66] (Figure 3, Figure 8, and Figure S3). LME ensemble members also simulate weaker cooling during the summer (Figure 7), the season preferentially recorded by terrestrial and marine sediment core records, underlining the importance of exploring seasonality when interpreting paleoclimate reconstructions [50].

4.4. Role of Large-Scale Modes of Climate Variability (SAM and ENSO)

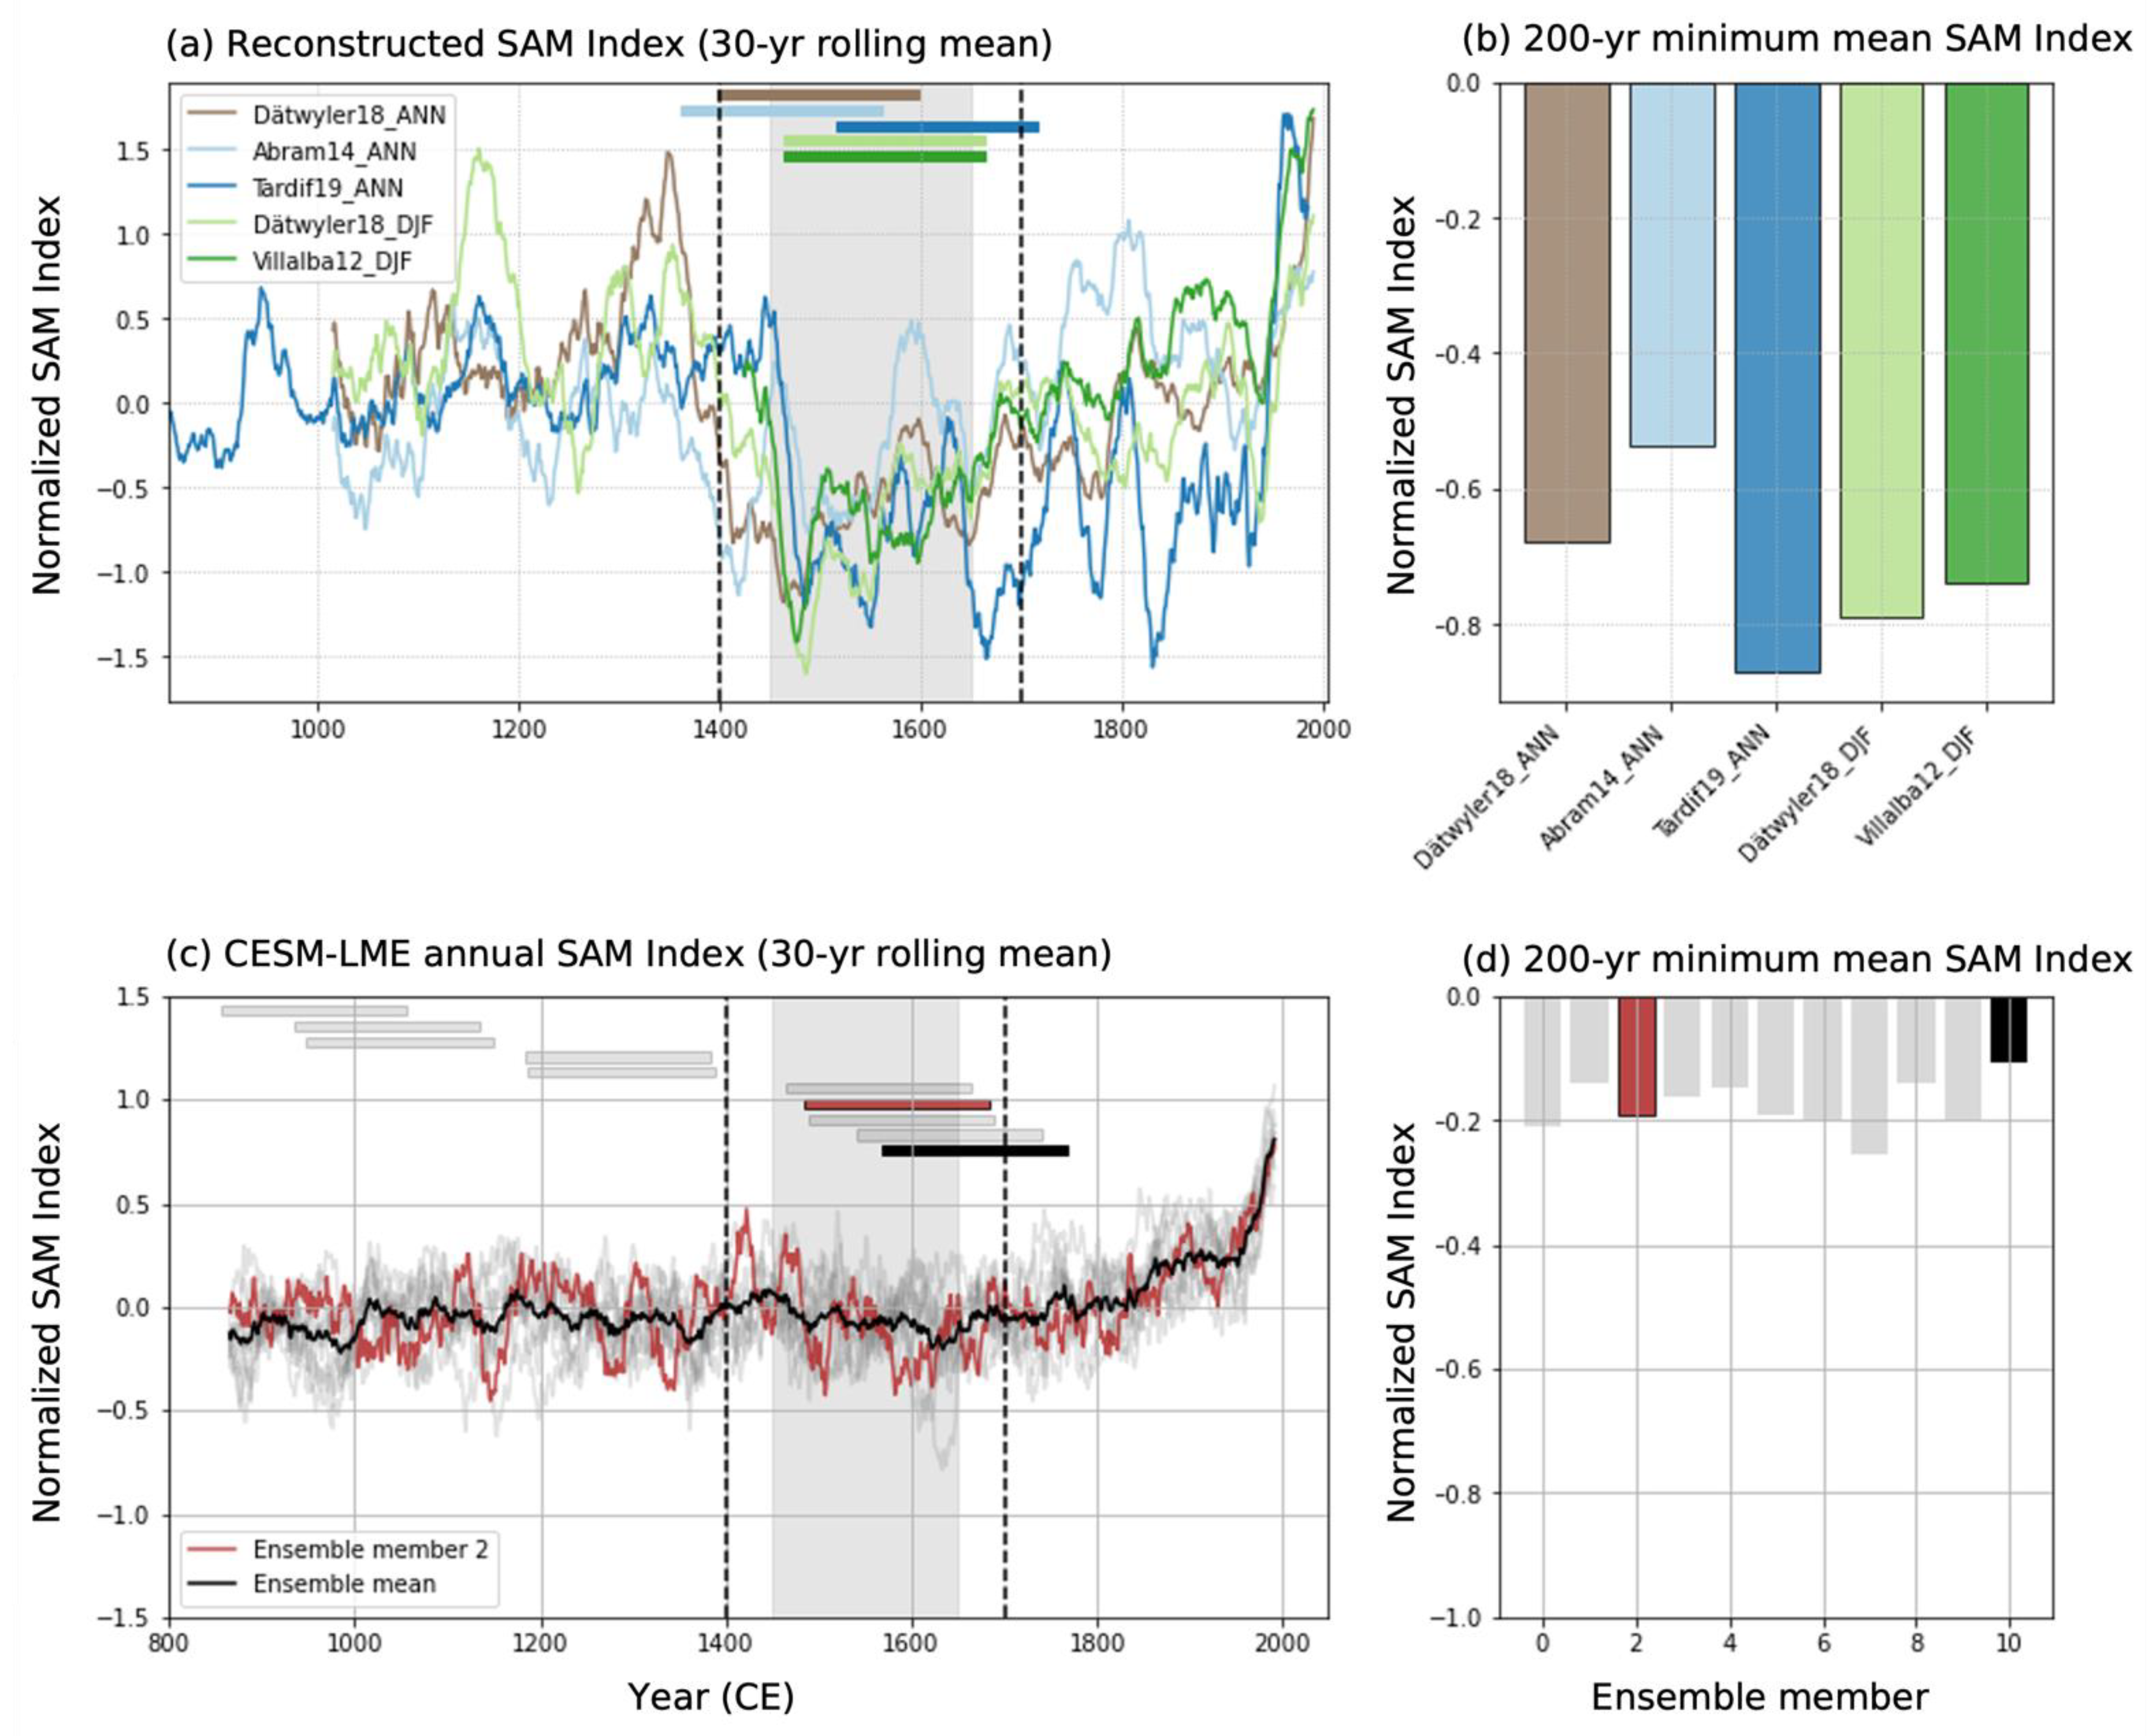
The LME simulates a dipole pattern of Antarctic temperature change during the LM. However, the heterogeneous pattern of warming and cooling in ensemble members does not have a direct link to mean-state shifts in large-scale modes of Southern Hemisphere climate variability, as has been previously proposed [13,21,24,25]. The LME does not reproduce the negative mean state of the Southern Annular Mode (SAM) recorded in proxy reconstructions between 1400 and 1700 CE [61,67,68,69] as a forced response (Figure 9); furthermore, a prolonged (200 year) negative phase of the SAM is outside the range of low-frequency SAM variability in the LME (Figure 9); The LME also does not simulate mean state changes in ENSO or the Pacific South America pattern, which is the impact of ENSO on the southern high latitudes [70], between the MCA and LIA (Figure S5). Cooler tropical Pacific sea surface temperatures in LME ensemble members between 1600 and 1850 CE (a more La Niña-like mean state) reflect globally colder conditions rather than a shift in ENSO dynamics. Instead of mean state shifts in the modes of climate variability, external forcings interact with local feedbacks in the LME to produce heterogenous temperature and sea ice trends in the southern high latitudes [53] against the backdrop of a regional cooling trend in response to volcanic, solar, orbital, and LULC forcing.
The absence of multi-centennial trends in SAM and ENSO in the LME is consistent with previous work: the current generation of climate models do not simulate the low-frequency dynamic variability inferred from proxy reconstructions of LM climate [17,61,66,71,72,73]. A multi-model analysis of last millennium simulations from CMIP5 models identified a more negative SAM mean state between 1450 and 1850; however, the trend was not statistically significant [74]. CMIP5-generation Earth system models also do not simulate a low-frequency (multi-decadal) shift to more El Niño- or La Niña-like conditions in the Tropical Pacific or a change in the ENSO amplitude during the MCA and LIA [17]; shifts in sea surface temperatures in the Niño3.4 region of the Tropical Pacific and forced changes in the relative frequency of El Niño and La Niña events in CESM-LME simulations track global temperature trends (Figure S5).

4.5. Considerations When Comparing Paleoclimate Records and Model Simulations

Both paleoclimate records and model simulations have limitations that may contribute to the mismatch between the drivers of LM climate evolution inferred from proxy records [13,21,24,25] and simulations from the LME. Paleoclimate records have been shown to overestimate low-frequency variability and the a priori interpretation of a given paleoclimate time series should be that it represents local information rather than hemispheric-scale shifts in climate [17,18,75]. Though there is proxy evidence of a negative SAM between 1400 and 1700 CE [61,65,67,68] (Figure 9), evidence for low-frequency LM shifts in the ENSO mean state is inconclusive (see the discussion in Henke et al. [76] and references therein). Further, significant unforced temperature variability in the LME demonstrates that LM temperature change in the Antarctic may be the result of stochastic climate variability interacting with a local process. For instance, the LME does not recreate a warming trend inferred from an ice core in the Eastern Ross Sea [21] as a forced response; however, some ensemble members simulate >0.1 °C/kyr warming in the region (Figure S2), which may be exaggerated in the Roosevelt Island Ice Core due to local polynya processes (see the discussion in Bertler et al. [21]). More and better resolved paleoclimate records from the ENSO-sensitive region of the Tropical Pacific, SAM-sensitive region of the Southern Hemisphere mid-latitudes, and Antarctica are necessary to improve current reconstructions of paleoenvironmental evolution and infer climate drivers.
The absence of a link between modeled large-scale modes and Antarctic climate variability in the LME may also be related to known model biases: CMIP5-generation ESMs struggle to simulate realistic patterns of decadal climate variability [77,78,79,80]. Earth system model simulations operating over multi-centennial timescales need to make substantial approximations. Sub-grid-scale processes and missing feedbacks impact both the simulated internal variability and the model response to external forcing [7]. The coarse resolution of the upper atmosphere and ocean components of the LME and uncertainties in the last millennium forcing reconstructions have important implications for model representation of the low-frequency variability in the Southern Hemisphere. Fluctuations in solar irradiance have been shown to impact the SAM through changes in the mean flow in the stratosphere [81]. Thus, both large uncertainties in the magnitude of LM solar variability [82] and the low-top configuration of the LME, which does not capture the “top-down” effect of changes in solar irradiance [83], impact the representation of Southern Hemisphere circulation [83]. In addition, Earth system models that do not resolve mesoscale eddies, such as the CESM-LME, have been shown to systematically underestimate multidecadal variability [78]. Updated solar forcing files in CMIP6 [81] and LM simulations with high-top chemistry and improved eddy parameterizations are necessary to isolate the source of the mismatch between model and proxy perspectives on low-frequency SAM and ENSO variability during the LM and associated impacts on the Antarctic climate. In addition, new paleoclimate data assimilation products that combine networks of paleoclimate records with the physical constraints of a climate model [19,65] will be useful to assess this mismatch in the future.

5. Conclusions

Isolating the relative importance of radiative forcing, regional feedbacks, and centennial trends in global modes of climate variability in the Antarctic climate during the LM has important implications for the future of the Antarctic in changing climate. Simulations from the CESM-LME show that orbital changes, solar variability, and a greater frequency of volcanic eruptions acted to cool both the northern and the southern high latitudes during the LM, with a smaller contribution from LULC changes. However, a regionally heterogenous response and a damped overall cooling trend in the Antarctic contrasts with the Arctic, where external forcing drove widespread cooling. The contrast between the polar regions’ responses to changes in orbital configuration, solar intensity, and volcanic eruptions during the LM is consistent with differing sensitivity to radiative and non-radiative forcings and resembles the modern response to rising greenhouse gas concentrations, despite the different nature of the forcing.
Results from the LME show that the dipole pattern of LM climate evolution in Antarctic paleoclimate records—cooling over mainland Antarctica and warming in the Weddell Sea—is consistent with the impact of external forcing on the southern high latitudes during the last millennium. When detrended for drift in the control simulations, full forcing ensemble members simulated a weak warming trend in the Weddell Sea, agreeing with evidence of warming from the James Ross Island Ice core [22]. Further, the simulated impact of volcanic aerosols in the decades following a major volcanic eruption is heterogenous, indicating that the absence of a pan-Antarctic temperature response to LM volcanic eruptions in ice cores reconstructions [23] is linked to climate dynamics [53] rather than proxy bias. Substantial (±>0.5 °C) unforced temperature variability in the Antarctic in the LME also shows that that regional feedbacks during the LM can drive a heterogeneous pattern of warming and cooling in the Antarctic, consistent with the absence of an identifiable LIA period in some Antarctic paleoclimate records [27]. LME simulations do not reproduce a proposed link between LM environmental trends in the Antarctic and baseline shifts in Southern Hemisphere modes of dynamic variability (SAM and ENSO) [13,21,24,25,71]. Models may underestimate low-frequency climate variability [63,71,72,73,78] while paleoclimate records may overestimate past changes in SAM and ENSO [17]. Taken together, our analysis provides a useful point of comparison for future LM paleoclimate reconstructions from the Antarctic and highlights an important difference between the drivers of LM climate evolution in Antarctica inferred from some proxy records and those simulated by Earth system models.
The sensitivity of West Antarctica to unforced variability and the initial state of the Southern Ocean in the LME has implications for both paleoclimate reconstructions and projections of ice sheet stability; the Amundsen and Bellingshausen regions of the Western Antarctic Ice sheet are vulnerable to collapse in a warming climate [52]. Ensemble spread in the LME shows that that divergent trends in LM simulations are consistent with internal variability. Inter-model spread and proxy-model disagreement in the CMIP LM simulations of the West Antarctic climate are particularly difficult to interpret and attribute correctly to model structural uncertainty, model drift, or internal variability because many models only contributed one realization and a single control simulation. Though uncertainty associated with unforced variability is irreducible in model projections of future climate evolution, it must be accounted for to produce accurate estimates of future AIS behavior [52]. Proxy records can also be used in conjunction with model simulations to improve estimates of actual climate behavior over the LM [19]. More well-resolved LM paleoclimate records from the Amundsen and Bellingshausen regions would be a particularly useful constraint on the estimates of pre-industrial climate evolution used to initialize future projections of West Antarctic Ice Sheet stability.

Supplementary Materials

The following supporting information can be downloaded at: https://www.mdpi.com/article/10.3390/geosciences12080299/s1, Figure S1: Evolution of the major forcings used for the CESM-LME. Figure S2: LIA (1600–1850 CE)—MCA (850–1200 CE) temperature anomaly in LME full and single forcing simulations. Figure S3: Temperature trend (°C/kyr years) for all LME full forcing ensemble members compared to ice core records. Figure S4: LIA (1600–1850 CE)—MCA (850–1200 CE) temperature anomaly in LME full forcing simulations that were not detrended using the control simulation. Figure S5: simulated anomalies in modes of large-scale Southern Hemisphere variability in the LME. Figure S6: Regions of Antarctica with a LM warming trend in the 13 full forcing ensemble simulations. Table S1: Full list of paleoclimate records and qualitatively assessed LM temperature assembled in Lüning et al. [13].

Author Contributions

Conceptualization, O.J.T., B.L.O.-B., E.C.B.; Data curation, O.J.T., B.L.O.-B., E.C.B.; Formal analysis, O.J.T.; Investigation, O.J.T.; Methodology, O.J.T., B.L.O.-B., E.C.B.; Project administration, O.J.T.; Validation, O.J.T.; Funding acquisition, O.J.T., B.L.O.-B., E.C.B., C.R.R., G.S.W.; Resources, B.L.O.-B., E.C.B., C.R.R.; Software, O.J.T.; Supervision, C.L.S., C.R.R., G.S.W.; Visualization, O.J.T.; Writing–original draft, O.J.T.; Writing–review and editing, O.J.T., C.L.S., B.L.O.-B., E.C.B., G.S.W., C.R.R. All authors have read and agreed to the published version of the manuscript.

Funding

This study was financed in part by the New Zealand Ministry of Business, Innovation and Employment through the Antarctic Science Platform (ANTA1801). O.J.T. received additional support from Antarctica New Zealand, Amherst College, and the University of Otago.

Institutional Review Board Statement

Not applicable.

Informed Consent Statement

Not applicable.

Data Availability Statement

The CESM-LME simulations are publicly available via the Earth System Grid (www.earthsystemgrid.org; accessed on 1 July 2021). Ice core reconstructions from Stenni et al. [23] are available through the NOAA World Data Center for Paleoclimatology (WDC Paleo) at the following link: https://www.ncdc.noaa.gov/paleo/study/22589 (accessed on 20 September 2021).

Acknowledgments

The CESM project is supported primarily by the National Science Foundation (NSF). This material is based on work supported by the National Center for Atmospheric Research (NCAR), sponsored by the NSF under Cooperative Agreement No. 1852977. This work relies on computing and data storage resources, including the Cheyenne supercomputer (doi:10.5065/D6RX99HX), provided by the Computational and Information Systems Laboratory (CISL) at NCAR. We thank John Fasullo for assistance with data visualization.

Conflicts of Interest

The funders had no role in the design of the study; in the collection, analyses, or interpretation of data; in the writing of the manuscript, or in the decision to publish the results.

References

  1. Nicolas, J.P.; Bromwich, D.H. New Reconstruction of Antarctic Near-Surface Temperatures: Multidecadal Trends and Reliability of Global Reanalyses. J. Clim. 2014, 27, 8070–8093. [Google Scholar] [CrossRef]
  2. Bromwich, D.H.; Nicolas, J.P.; Monaghan, A.J.; Lazzara, M.A.; Keller, L.M.; Weidner, G.A.; Wilson, A.B. Central West Antarctica among the Most Rapidly Warming Regions on Earth. Nat. Geosci. 2013, 6, 139–145. [Google Scholar] [CrossRef] [Green Version]
  3. Ding, Q.; Steig, E.J.; Battisti, D.S.; Küttel, M. Winter Warming in West Antarctica Caused by Central Tropical Pacific Warming. Nat. Geosci. 2011, 4, 398–403. [Google Scholar] [CrossRef] [Green Version]
  4. Hsu, P.-C.; Fu, Z.; Murakami, H.; Lee, J.-Y.; Yoo, C.; Johnson, N.C.; Chang, C.-H.; Liu, Y. East Antarctic Cooling Induced by Decadal Changes in Madden-Julian Oscillation during Austral Summer. Sci. Adv. 2021, 7, eabf9903. [Google Scholar] [CrossRef] [PubMed]
  5. Steig, E.; Ding, Q.; Battisti, D.; Jenkins, A. Tropical Forcing of Circumpolar Deep Water Inflow and Outlet Glacier Thinning in the Amundsen Sea Embayment, West Antarctica. Ann. Glaciol. 2012, 53, 19–28. [Google Scholar] [CrossRef] [Green Version]
  6. Turner, J.; Lu, H.; White, I.; King, J.C.; Phillips, T.; Hosking, J.S.; Bracegirdle, T.J.; Marshall, G.J.; Mulvaney, R.; Deb, P. Absence of 21st Century Warming on Antarctic Peninsula Consistent with Natural Variability. Nature 2016, 535, 411–415. [Google Scholar] [CrossRef] [PubMed] [Green Version]
  7. Jones, J.M.; Gille, S.T.; Goosse, H.; Abram, N.J.; Canziani, P.O.; Charman, D.J.; Clem, K.R.; Crosta, X.; de Lavergne, C.; Eisenman, I.; et al. Assessing Recent Trends in High-Latitude Southern Hemisphere Surface Climate. Nat. Clim. Chang. 2016, 6, 917–926. [Google Scholar] [CrossRef]
  8. Beadling, R.L.; Russell, J.L.; Stouffer, R.J.; Mazloff, M.; Talley, L.D.; Goodman, P.J.; Sallée, J.B.; Hewitt, H.T.; Hyder, P.; Pandde, A. Representation of Southern Ocean Properties across Coupled Model Intercomparison Project Generations: CMIP3 to CMIP6. J. Clim. 2020, 33, 6555–6581. [Google Scholar] [CrossRef]
  9. Neukom, R.; Barboza, L.A.; Erb, M.P.; Shi, F.; Emile-Geay, J.; Evans, M.N.; Franke, J.; Kaufman, D.S.; Lücke, L.; Rehfeld, K.; et al. Consistent Multidecadal Variability in Global Temperature Reconstructions and Simulations over the Common Era. Nat. Geosci. 2019, 12, 643–649. [Google Scholar] [CrossRef] [Green Version]
  10. Diaz, H.F.; Trigo, R.; Hughes, M.K.; Mann, M.E.; Xoplaki, E.; Barriopedro, D. Spatial and Temporal Characteristics of Climate in Medieval Times Revisited. Bull. Am. Meteorol. Soc. 2011, 92, 1487–1500. [Google Scholar] [CrossRef]
  11. Mann, M.E.; Zhang, Z.; Rutherford, S.; Bradley, R.S.; Hughes, M.K.; Shindell, D.; Ammann, C.; Faluvegi, G.; Ni, F. Global Signatures and Dynamical Origins of the Little Ice Age and Medieval Climate Anomaly. Science 2009, 326, 1256–1260. [Google Scholar] [CrossRef] [Green Version]
  12. Bertler, N.A.N.; Mayewski, P.A.; Carter, L. Cold Conditions in Antarctica during the Little Ice Age—Implications for Abrupt Climate Change Mechanisms. Earth Planet. Sci. Lett. 2011, 308, 41–51. [Google Scholar] [CrossRef]
  13. Lüning, S.; Gałka, M.; Vahrenholt, F. The Medieval Climate Anomaly in Antarctica. Palaeogeogr. Palaeoclimatol. Palaeoecol. 2019, 532, 109251. [Google Scholar] [CrossRef]
  14. Orsi, A.J.; Cornuelle, B.D.; Severinghaus, J.P. Little Ice Age Cold Interval in West Antarctica: Evidence from Borehole Temperature at the West Antarctic Ice Sheet (WAIS) Divide. Geophys. Res. Lett. 2012, 39, L09710. [Google Scholar] [CrossRef] [Green Version]
  15. Rhodes, R.H.; Bertler, N.A.N.; Baker, J.A.; Steen-Larsen, H.C.; Sneed, S.B.; Morgenstern, U.; Johnsen, S.J. Little Ice Age Climate and Oceanic Conditions of the Ross Sea, Antarctica from a Coastal Ice Core Record. Clim. Past 2012, 8, 1223–1238. [Google Scholar] [CrossRef] [Green Version]
  16. Simms, A.R.; Bentley, M.J.; Simkins, L.M.; Zurbuchen, J.; Reynolds, L.C.; DeWitt, R.; Thomas, E.R. Evidence for a “Little Ice Age” Glacial Advance within the Antarctic Peninsula—Examples from Glacially-Overrun Raised Beaches. Quat. Sci. Rev. 2021, 271, 107195. [Google Scholar] [CrossRef]
  17. Wang, J.; Emile-Geay, J.; Guillot, D.; McKay, N.P.; Rajaratnam, B. Fragility of Reconstructed Temperature Patterns over the Common Era: Implications for Model Evaluation. Geophys. Res. Lett. 2015, 42, 7162–7170. [Google Scholar] [CrossRef] [Green Version]
  18. Neukom, R.; Steiger, N.; Gómez-Navarro, J.J.; Wang, J.; Werner, J.P. No Evidence for Globally Coherent Warm and Cold Periods over the Preindustrial Common Era. Nature 2019, 571, 550–554. [Google Scholar] [CrossRef]
  19. Perkins, W.; Hakim, G. Coupled Atmosphere-Ocean Reconstruction of the Last Millennium Using Online Data Assimilation. Paleoceanogr. Paleoclimatol. 2021, 36, e2020PA003959. [Google Scholar] [CrossRef]
  20. An, C.; Hou, S.; Jiang, S.; Li, Y.; Ma, T.; Curran, M.A.J.; Pang, H.; Zhang, Z.; Zhang, W.; Yu, J.; et al. The Long-Term Cooling Trend in East Antarctic Plateau Over the Past 2000 Years Is Only Robust Between 550 and 1550 CE. Geophys. Res. Lett. 2021, 48, e2021GL092923. [Google Scholar] [CrossRef]
  21. Bertler, N.A.N.; Conway, H.; Dahl-Jensen, D.; Emanuelsson, D.B.; Winstrup, M.; Vallelonga, P.T.; Lee, J.E.; Brook, E.J.; Severinghaus, J.P.; Fudge, T.J.; et al. The Ross Sea Dipole—Temperature, Snow Accumulation and Sea Ice Variability in the Ross Sea Region, Antarctica, over the Past 2700 Years. Clim. Past 2018, 14, 193–214. [Google Scholar] [CrossRef] [Green Version]
  22. Mulvaney, R.; Abram, N.J.; Hindmarsh, R.C.A.; Arrowsmith, C.; Fleet, L.; Triest, J.; Sime, L.C.; Alemany, O.; Foord, S. Recent Antarctic Peninsula Warming Relative to Holocene Climate and Ice-Shelf History. Nature 2012, 489, 141–144. [Google Scholar] [CrossRef] [Green Version]
  23. Stenni, B.; Curran, M.A.J.; Abram, N.J.; Orsi, A.; Goursaud, S.; Masson-Delmotte, V.; Neukom, R.; Goosse, H.; Divine, D.; van Ommen, T.; et al. Antarctic Climate Variability on Regional and Continental Scales over the Last 2000 Years. Clim. Past 2017, 13, 1609–1634. [Google Scholar] [CrossRef] [Green Version]
  24. PAGES 2k-PMIP3 group Continental-Scale Temperature Variability in PMIP3 Simulations and PAGES 2k Regional Temperature Reconstructions over the Past Millennium. Clim. Past 2015, 11, 1673–1699. [CrossRef] [Green Version]
  25. Miller, G.H.; Geirsdóttir, Á.; Zhong, Y.; Larsen, D.J.; Otto-Bliesner, B.L.; Holland, M.M.; Bailey, D.A.; Refsnider, K.A.; Lehman, S.J.; Southon, J.R.; et al. Abrupt Onset of the Little Ice Age Triggered by Volcanism and Sustained by Sea-Ice/Ocean Feedbacks. Geophys. Res. Lett. 2012, 39, L02708. [Google Scholar] [CrossRef] [Green Version]
  26. Slawinska, J.; Robock, A. Impact of Volcanic Eruptions on Decadal to Centennial Fluctuations of Arctic Sea Ice Extent during the Last Millennium and on Initiation of the Little Ice Age. J. Clim. 2018, 31, 2145–2167. [Google Scholar] [CrossRef]
  27. Tavernier, I.; Verleyen, E.; Hodgson, D.A.; Heirman, K.; Roberts, S.J.; Imura, S.; Kudoh, S.; Sabbe, K.; De Batist, M.; Vyverman, W. Absence of a Medieval Climate Anomaly, Little Ice Age and Twentieth Century Warming in Skarvsnes, Lützow Holm Bay, East Antarctica. Antart. Sci. 2014, 26, 585–598. [Google Scholar] [CrossRef] [Green Version]
  28. Ahmed, M.; Anchukaitis, K.J.; Asrat, A.; Borgaonkar, H.P.; Braida, M.; Buckley, B.M.; Büntgen, U.; Chase, B.M.; Christie, D.A.; Cook, E.R.; et al. Continental-Scale Temperature Variability during the Past Two Millennia. Nat. Geosci. 2013, 6, 339–346. [Google Scholar] [CrossRef]
  29. Goosse, H.; Braida, M.; Crosta, X.; Mairesse, A.; Masson-Delmotte, V.; Mathiot, P.; Neukom, R.; Oerter, H.; Philippon, G.; Renssen, H.; et al. Antarctic Temperature Changes during the Last Millennium: Evaluation of Simulations and Reconstructions. Quat. Sci. Rev. 2012, 55, 75–90. [Google Scholar] [CrossRef]
  30. Tonelli, M.; Marcello, F.; Ferrero, B.; Wainer, I. Warm Deep Water Variability During the Last Millennium in the CESM–LME: Pre-Industrial Scenario versus Late 20th Century Changes. Geosciences 2019, 9, 346. [Google Scholar] [CrossRef] [Green Version]
  31. Wainer, I.; Gent, P.R. Changes in the Atlantic Sector of the Southern Ocean Estimated from the CESM Last Millennium Ensemble. Antarct. Sci. 2019, 31, 37–51. [Google Scholar] [CrossRef]
  32. Silvestri, G.; Berman, A.L.; De Vleeschouwer, F.; Wainer, I. Last Millennium Climate Changes over the Antarctic Peninsula and Southern Patagonia in CESM-LME Simulations: Differences between Medieval Climate Anomaly and Present-Day Temperatures. Quat. Sci. Rev. 2021, 274, 107273. [Google Scholar] [CrossRef]
  33. Marcello, F.; Wainer, I.; Gent, P.R.; Otto-Bliesner, B.L.; Brady, E.C. South Atlantic Surface Boundary Current System during the Last Millennium in the CESM-LME: The Medieval Climate Anomaly and Little Ice Age. Geosciences 2019, 9, 299. [Google Scholar] [CrossRef] [Green Version]
  34. Owens, M.J.; Lockwood, M.; Hawkins, E.; Usoskin, I.; Jones, G.S.; Barnard, L.; Schurer, A.; Fasullo, J. The Maunder Minimum and the Little Ice Age: An Update from Recent Reconstructions and Climate Simulations. J. Space Weather Space Clim. 2017, 7, A33. [Google Scholar] [CrossRef]
  35. Stevenson, S.; Otto-Bliesner, B.; Fasullo, J.; Brady, E. “El Niño Like” Hydroclimate Responses to Last Millennium Volcanic Eruptions. J. Clim. 2016, 29, 2907–2921. [Google Scholar] [CrossRef]
  36. Stevenson, S.; Otto-Bliesner, B.L.; Brady, E.C.; Nusbaumer, J.; Tabor, C.; Tomas, R.; Noone, D.C.; Liu, Z. Volcanic Eruption Signatures in the Isotope-Enabled Last Millennium Ensemble. Paleoceanogr. Paleoclimatol. 2019, 34, 1534–1552. [Google Scholar] [CrossRef]
  37. Fasullo, J.T.; Otto-Bliesner, B.L.; Stevenson, S. The Influence of Volcanic Aerosol Meridional Structure on Monsoon Responses over the Last Millennium. Geophys. Res. Lett. 2019, 46, 12350–12359. [Google Scholar] [CrossRef]
  38. Hurrell, J.W.; Holland, M.M.; Gent, P.R.; Ghan, S.; Kay, J.E.; Kushner, P.J.; Lamarque, J.-F.; Large, W.G.; Lawrence, D.; Lindsay, K.; et al. The Community Earth System Model: A Framework for Collaborative Research. Bull. Amer. Meteor. Soc. 2013, 94, 1339–1360. [Google Scholar] [CrossRef]
  39. Barthel, A.; Agosta, C.; Little, C.M.; Hattermann, T.; Jourdain, N.C.; Goelzer, H.; Nowicki, S.; Seroussi, H.; Straneo, F.; Bracegirdle, T.J. CMIP5 Model Selection for ISMIP6 Ice Sheet Model Forcing: Greenland and Antarctica. Cryosphere 2020, 14, 855–879. [Google Scholar] [CrossRef] [Green Version]
  40. Fasullo, J.T. Evaluating Simulated Climate Patterns from the CMIP Archives Using Satellite and Reanalysis Datasets Using the Climate Model Assessment Tool (CMATv1). Geosci. Model Dev. 2020, 13, 3627–3642. [Google Scholar] [CrossRef]
  41. Otto-Bliesner, B.L.; Brady, E.C.; Fasullo, J.; Jahn, A.; Landrum, L.; Stevenson, S.; Rosenbloom, N.; Mai, A.; Strand, G. Climate Variability and Change since 850 CE: An Ensemble Approach with the Community Earth System Model. Bull. Amer. Meteor. Soc. 2015, 97, 735–754. [Google Scholar] [CrossRef]
  42. Gao, C.; Robock, A.; Ammann, C. Volcanic Forcing of Climate over the Past 1500 Years: An Improved Ice Core-Based Index for Climate Models. J. Geophys. Res. 2008, 113, D23111. [Google Scholar] [CrossRef] [Green Version]
  43. Vieira, L.E.A.; Solanki, S.K.; Krivova, N.A.; Usoskin, I. Evolution of the Solar Irradiance during the Holocene. Astron. Astrophys. 2011, 531, A6. [Google Scholar] [CrossRef] [Green Version]
  44. Schmidt, G.A.; Jungclaus, J.H.; Ammann, C.M.; Bard, E.; Braconnot, P.; Crowley, T.J.; Delaygue, G.; Joos, F.; Krivova, N.A.; Muscheler, R.; et al. Climate Forcing Reconstructions for Use in PMIP Simulations of the Last Millennium (v1.0). Geosci. Model Dev. 2011, 4, 33–45. [Google Scholar] [CrossRef] [Green Version]
  45. Pongratz, J.; Reick, C.; Raddatz, T.; Claussen, M. A Reconstruction of Global Agricultural Areas and Land Cover for the Last Millennium: Millenium land cover reconstruction. Glob. Biogeochem. Cycles 2008, 22. [Google Scholar] [CrossRef]
  46. Hurtt, G.C.; Chini, L.P.; Frolking, S.; Betts, R.A.; Feddema, J.; Fischer, G.; Fisk, J.P.; Hibbard, K.; Houghton, R.A.; Janetos, A.; et al. Harmonization of Land-Use Scenarios for the Period 1500–2100: 600 Years of Global Gridded Annual Land-Use Transitions, Wood Harvest, and Resulting Secondary Lands. Clim. Chang. 2011, 109, 117–161. [Google Scholar] [CrossRef] [Green Version]
  47. Berger, A. Long-Term Variations of Daily Insolation and Quaternary Climatic Changes. J. Atmos. Sci. 1978, 35, 2362–2367. [Google Scholar] [CrossRef]
  48. Phillips, A.; Deser, C.; Fasullo, J.; Schneider, D.P.; Simpson, I.R. Assessing Climate Variability and Change in Model Large Ensembles: A User’s Guide to the “Climate Variability Diagnostics Package for Large Ensembles”. 2020. Available online: https://opensky.ucar.edu/islandora/object/manuscripts:1001 (accessed on 31 May 2022).
  49. Gupta, A.S.; Jourdain, N.C.; Brown, J.N.; Monselesan, D. Climate Drift in the CMIP5 Models. J. Clim. 2013, 26, 8597–8615. [Google Scholar] [CrossRef] [Green Version]
  50. Lücke, L.J.; Schurer, A.P.; Wilson, R.; Hegerl, G.C. Orbital Forcing Strongly Influences Seasonal Temperature Trends During the Last Millennium. Geophys. Res. Lett. 2021, 48, e2020GL088776. [Google Scholar] [CrossRef]
  51. Manabe, S.; Stouffer, R.J. Low-Frequency Variability of Surface Air Temperature in a 1000-Year Integration of a Coupled Atmosphere-Ocean-Land Surface Model. J. Clim. 1996, 9, 376–393. [Google Scholar] [CrossRef] [Green Version]
  52. Tsai, C.-Y.; Forest, C.E.; Pollard, D. The Role of Internal Climate Variability in Projecting Antarctica’s Contribution to Future Sea-Level Rise. Clim. Dyn. 2020, 55, 1875–1892. [Google Scholar] [CrossRef]
  53. Verona, L.S.; Wainer, I.; Stevenson, S. Volcanically Triggered Ocean Warming Near the Antarctic Peninsula. Sci. Rep. 2019, 9, 9462. [Google Scholar] [CrossRef] [PubMed]
  54. Siedler, G.; Church, J.; Gould, J. (Eds.) Ocean Circulation and Climate: Observing and Modelling the Global Ocean; This is Volume 77 in the International Geophysics Series; Academic Press: San Diego, CA, USA, 2001; ISBN 978-0-12-641351-9. [Google Scholar]
  55. Manabe, S.; Stouffer, R.J. Sensitivity of a Global Climate Model to an Increase of CO 2 Concentration in the Atmosphere. J. Geophys. Res. 1980, 85, 5529. [Google Scholar] [CrossRef] [Green Version]
  56. Singh, H.A.; Garuba, O.A.; Rasch, P.J. How Asymmetries Between Arctic and Antarctic Climate Sensitivity Are Modified by the Ocean. Geophys. Res. Lett. 2018, 45, 13031–13040. [Google Scholar] [CrossRef] [Green Version]
  57. Nghiem, S.V.; Rigor, I.G.; Clemente-Colón, P.; Neumann, G.; Li, P.P. Geophysical Constraints on the Antarctic Sea Ice Cover. Remote Sens. Environ. 2016, 181, 281–292. [Google Scholar] [CrossRef] [Green Version]
  58. Sterken, M.; Roberts, S.J.; Hodgson, D.A.; Vyverman, W.; Balbo, A.L.; Sabbe, K.; Moreton, S.G.; Verleyen, E. Holocene Glacial and Climate History of Prince Gustav Channel, Northeastern Antarctic Peninsula. Quat. Sci. Rev. 2012, 31, 93–111. [Google Scholar] [CrossRef] [Green Version]
  59. Dickens, W.A.; Kuhn, G.; Leng, M.J.; Graham, A.G.C.; Dowdeswell, J.A.; Meredith, M.P.; Hillenbrand, C.-D.; Hodgson, D.A.; Roberts, S.J.; Sloane, H.; et al. Enhanced Glacial Discharge from the Eastern Antarctic Peninsula since the 1700s Associated with a Positive Southern Annular Mode. Sci. Rep. 2019, 9, 14606. [Google Scholar] [CrossRef] [PubMed] [Green Version]
  60. Neukom, R.; Schurer, A.P.; Steiger, N.J.; Hegerl, G.C. Possible Causes of Data Model Discrepancy in the Temperature History of the Last Millennium. Sci. Rep. 2018, 8, 7572. [Google Scholar] [CrossRef] [Green Version]
  61. Abram, N.J.; Mulvaney, R.; Vimeux, F.; Phipps, S.J.; Turner, J.; England, M.H. Evolution of the Southern Annular Mode during the Past Millennium. Nat. Clim. Chang. 2014, 4, 564–569. [Google Scholar] [CrossRef] [Green Version]
  62. Klein, F.; Abram, N.J.; Curran, M.A.J.; Goosse, H.; Goursaud, S.; Masson-Delmotte, V.; Moy, A.; Neukom, R.; Orsi, A.; Sjolte, J.; et al. Assessing the Robustness of Antarctic Temperature Reconstructions over the Past 2 Millennia Using Pseudoproxy and Data Assimilation Experiments. Clim. Past 2019, 15, 661–684. [Google Scholar] [CrossRef] [Green Version]
  63. Pauling, A.G.; Bushuk, M.; Bitz, C.M. Robust Inter-Hemispheric Asymmetry in the Response to Symmetric Volcanic Forcing in Model Large Ensembles. Geophys. Res. Lett. 2021, 48, e2021GL092558. [Google Scholar] [CrossRef]
  64. Zanchettin, D.; Bothe, O.; Timmreck, C.; Bader, J.; Beitsch, A.; Graf, H.-F.; Notz, D.; Jungclaus, J.H. Inter-Hemispheric Asymmetry in the Sea-Ice Response to Volcanic Forcing Simulated by MPI-ESM (COSMOS-Mill). Earth Syst. Dynam. 2014, 5, 223–242. [Google Scholar] [CrossRef] [Green Version]
  65. Tardif, R.; Hakim, G.J.; Perkins, W.A.; Horlick, K.A.; Erb, M.P.; Emile-Geay, J.; Anderson, D.M.; Steig, E.J.; Noone, D. Last Millennium Reanalysis with an Expanded Proxy Database and Seasonal Proxy Modeling. Clim. Past 2019, 15, 1251–1273. [Google Scholar] [CrossRef] [Green Version]
  66. Landrum, L.; Otto-Bliesner, B.L.; Wahl, E.R.; Conley, A.; Lawrence, P.J.; Rosenbloom, N.; Teng, H. Last Millennium Climate and Its Variability in CCSM4. J. Clim. 2013, 26, 1085–1111. [Google Scholar] [CrossRef]
  67. Dätwyler, C.; Neukom, R.; Abram, N.J.; Gallant, A.J.E.; Grosjean, M.; Jacques-Coper, M.; Karoly, D.J.; Villalba, R. Teleconnection Stationarity, Variability and Trends of the Southern Annular Mode (SAM) during the Last Millennium. Clim. Dyn. 2018, 51, 2321–2339. [Google Scholar] [CrossRef]
  68. Perren, B.B.; Hodgson, D.A.; Roberts, S.J.; Sime, L.; Van Nieuwenhuyze, W.; Verleyen, E.; Vyverman, W. Southward Migration of the Southern Hemisphere Westerly Winds Corresponds with Warming Climate over Centennial Timescales. Commun. Earth Environ. 2020, 1, 1–8. [Google Scholar] [CrossRef]
  69. Villalba, R.; Lara, A.; Masiokas, M.H.; Urrutia, R.; Luckman, B.H.; Marshall, G.J.; Mundo, I.A.; Christie, D.A.; Cook, E.R.; Neukom, R.; et al. Unusual Southern Hemisphere Tree Growth Patterns Induced by Changes in the Southern Annular Mode. Nat. Geosci. 2012, 5, 793–798. [Google Scholar] [CrossRef]
  70. Mo, K.C.; Paegle, J.N. The Pacific—South American Modes and Their Downstream Effects. Int. J. Climatol. 2001, 21, 1211–1229. [Google Scholar] [CrossRef]
  71. Ljungqvist, F.C.; Zhang, Q.; Brattström, G.; Krusic, P.J.; Seim, A.; Li, Q.; Zhang, Q.; Moberg, A. Centennial-Scale Temperature Change in Last Millennium Simulations and Proxy-Based Reconstructions. J. Clim. 2019, 32, 2441–2482. [Google Scholar] [CrossRef]
  72. Neukom, R.; Gergis, J.; Karoly, D.J.; Wanner, H.; Curran, M.; Elbert, J.; González-Rouco, F.; Linsley, B.K.; Moy, A.D.; Mundo, I.; et al. Inter-Hemispheric Temperature Variability over the Past Millennium. Nat. Clim. Chang. 2014, 4, 362–367. [Google Scholar] [CrossRef]
  73. Parsons, L.A.; Loope, G.R.; Overpeck, J.T.; Ault, T.R.; Stouffer, R.; Cole, J.E. Temperature and Precipitation Variance in CMIP5 Simulations and Paleoclimate Records of the Last Millennium. J. Clim. 2017, 30, 8885–8912. [Google Scholar] [CrossRef] [Green Version]
  74. Roldán-Gómez, P.J.; González-Rouco, J.F.; Melo-Aguilar, C.; Smerdon, J.E. Dynamical and Hydrological Changes in Climate Simulations of the Last Millennium. Clim. Past 2020, 16, 1285–1307. [Google Scholar] [CrossRef]
  75. Meehl, G.A.; Arblaster, J.M.; Matthes, K.; Sassi, F.; van Loon, H. Amplifying the Pacific Climate System Response to a Small 11-Year Solar Cycle Forcing. Science 2009, 325, 1114–1118. [Google Scholar] [CrossRef] [Green Version]
  76. Henke, L.M.K.; Lambert, F.H.; Charman, D.J. Was the Little Ice Age More or Less El Niño-like than the Medieval Climate Anomaly? Evidence from Hydrological and Temperature Proxy Data. Clim. Past 2017, 13, 267–301. [Google Scholar] [CrossRef] [Green Version]
  77. Kravtsov, S.; Grimm, C.; Gu, S. Global-Scale Multidecadal Variability Missing in State-of-the-Art Climate Models. npj Clim. Atmos. Sci. 2018, 1, 34. [Google Scholar] [CrossRef] [Green Version]
  78. Jüling, A.; von der Heydt, A.; Dijkstra, H.A. Effects of Strongly Eddying Oceans on Multidecadal Climate Variability in the Community Earth System Model. Ocean. Sci. 2021, 17, 1251–1271. [Google Scholar] [CrossRef]
  79. Cheung, A.H.; Mann, M.E.; Steinman, B.A.; Frankcombe, L.M.; England, M.H.; Miller, S.K. Comparison of Low-Frequency Internal Climate Variability in CMIP5 Models and Observations. J. Clim. 2017, 30, 4763–4776. [Google Scholar] [CrossRef] [Green Version]
  80. Mann, M.E.; Steinman, B.A.; Miller, S.K. Absence of Internal Multidecadal and Interdecadal Oscillations in Climate Model Simulations. Nat. Commun. 2020, 11, 49. [Google Scholar] [CrossRef] [Green Version]
  81. Maycock, A.C.; Ineson, S.; Gray, L.J.; Scaife, A.A.; Anstey, J.A.; Lockwood, M.; Butchart, N.; Hardiman, S.C.; Mitchell, D.M.; Osprey, S.M. Possible Impacts of a Future Grand Solar Minimum on Climate: Stratospheric and Global Circulation Changes. J. Geophys. Res. Atmos. 2015, 120, 9043–9058. [Google Scholar] [CrossRef] [PubMed] [Green Version]
  82. Matthes, K.; Funke, B.; Andersson, M.E.; Barnard, L.; Beer, J.; Charbonneau, P.; Clilverd, M.A.; de Wit, T.D.; Haberreiter, M.; Hendry, A.; et al. Solar Forcing for CMIP6 (v3.2). Geosci. Model Dev. 2017, 10, 2247–2302. [Google Scholar] [CrossRef] [Green Version]
  83. Wright, N.M.; Krause, C.E.; Phipps, S.J.; Boschat, G.; Abram, N.J. Influence of Long-Term Changes in Solar Irradiance Forcing on the Southern Annular Mode. Clim. Past 2022, 18, 1509–1528. [Google Scholar] [CrossRef]
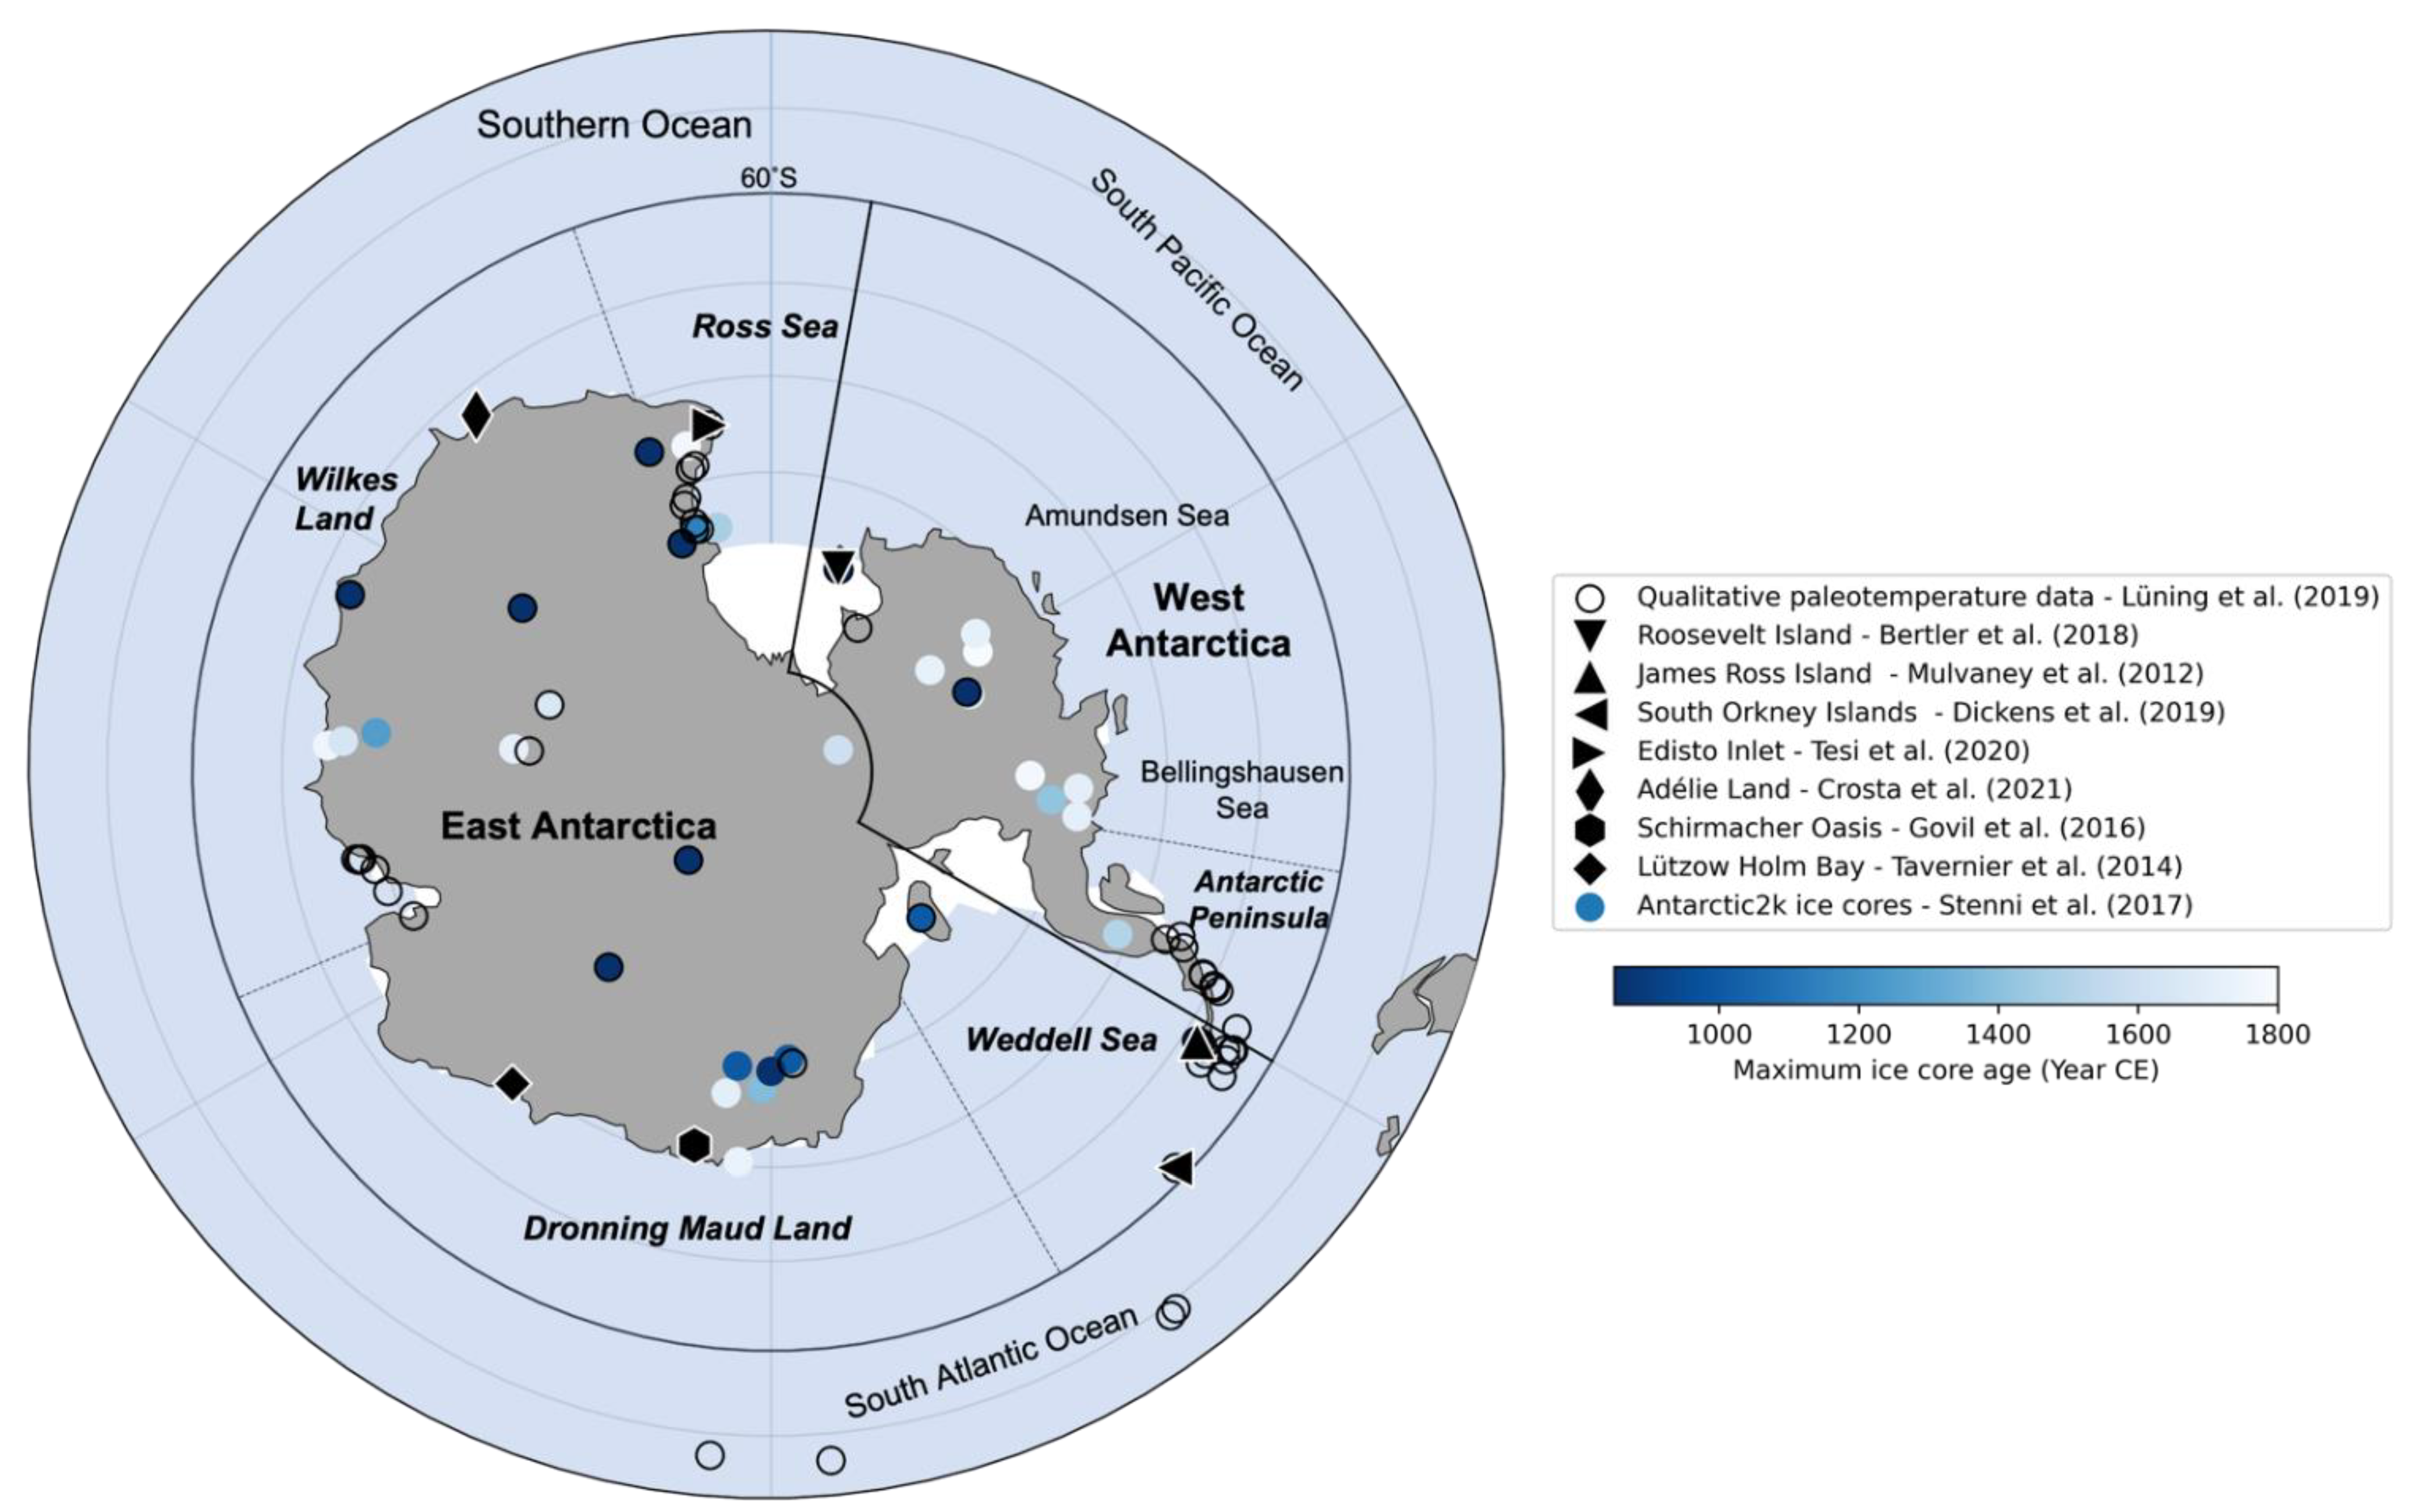
Figure 1. Map of Antarctica highlighting the location of paleoclimate records referenced in the text and climatic regions. The boundaries between East and West Antarctica (solid lines, bold text), and subregions (Antarctic Peninsula, Weddell Sea, Dronning Maud Land, Wilkes Land, Ross Sea; dashed lines, bold and italicized text) follow those defined in Stenni et al. [23].
Geosciences 12 00299 g001
Figure 2. Antarctic annual surface temperature anomalies (°C) in the 850 CE control simulation; (a) average temperature between 60° and 90° south relative to the base period of 850–1200 CE (highlighted in beige). A 10-year rolling mean was applied; (b) linear trend (°C/kyr years) for the full control simulation (850–1850 CE, top), and the last 800 years (1050–1850 CE, bottom).
Geosciences 12 00299 g002
Figure 3. Antarctic (60–90° S) annual 2-m air temperature anomalies (°C) for the full forcing, volcanic, orbital, solar, land use and land cover, and greenhouse gas simulations. Timeseries of the temperature anomalies for each ensemble member (grey) and ensemble mean (black) were computed relative to the base period of 850–1200 CE (highlighted in beige), and a 10-year rolling mean was applied (left). Maps show the ensemble mean full LM (850:1850) linear trend (center) and standard deviation of the temperature trend (right); stippling indicates areas where the ensemble standard deviation is greater than the linear trend.
Geosciences 12 00299 g003
Figure 4. Comparison between Antarctic and Arctic temperature evolution during the LME; (a) average Antarctic, Arctic, and global temperature evolution highlighting the timing of the core periods of the MCA (850–1200 CE) and LIA (1600–1850 CEE). Anomalies were computed relative to the base period of 850–1200, and a 10-year rolling mean was applied. Black bars indicate the timing of the 10 largest LM volcanic eruptions; (b) LIA-MCA temperature anomaly in the Arctic (north of 60° N) and Antarctic (south of 60° S) in full and single forcing simulations; (c) ensemble mean LIA-MCA temperature difference in full and single forcing simulations. Stippling indicates differences that were not statistically significant at the 95% level using a Students t-test.
Geosciences 12 00299 g004
Figure 5. LM average Antarctic (60–90° S) air temperature evolution LME full forcing ensemble mean compared to composite ice core temperature reconstructions from Antarctica compiled in Stenni et al. [23]. Anomalies were computed in 10-year bins relative to the 850–1200 CE mean (highlighted in beige) to facilitate comparison to ice core reconstructions. Black bars highlight the timing of the 13 largest LM volcanic eruptions (peak global-mean aerosol mass mixing ratios above 1 × 10⁸). Map insets (top) show the average temperature anomaly (°C) and sea ice area anomaly (%) in the 5 years after the five largest LM volcanic eruptions (bottom, shown in red). Anomalies were computed relative to the prior 50-year mean. Stippling indicates differences that were not statistically significant at the 95% level using a Students t-test.
Geosciences 12 00299 g005
Figure 6. Regional temperature evolution in West Antarctica (WAIS), East Antarctica (EAIS), and the Wedell Sea (WS) and Dronning Maud Land (DML) sectors of EAIS in LME full forcing simulations. Timeseries of ensemble mean (grey) temperature anomalies for each region were computed relative to the base period of 850–1200 CE (highlighted in beige), a 10-year rolling mean was applied, and the ensemble standard deviation is shaded in light grey. Map (center) shows the full ensemble mean LM (850:1850) linear trend; stippling indicates areas where the ensemble standard deviation is greater than the trend.
Geosciences 12 00299 g006
Figure 7. Seasonal temperature (°C per kyr) and sea ice concentration trends (ice area % per kyr) in the full forcing ensemble mean.
Geosciences 12 00299 g007
Figure 8. LM surface temperature anomaly (1500–1850 CE relative to 950–1250 CE) in the LME full forcing ensemble mean (a) and individual ensemble members (b) compared to qualitatively assessed paleotemperature records assembled in Lüning et al. [13]. A full list of paleoclimate records and the LM temperature trend is included in Table S1.
Geosciences 12 00299 g008
Figure 9. Last millennium trends in the Southern Annular Mode in (a) paleoclimate reconstructions and (c) the CESM-LME. (a) Reconstructed SAM index from Abram et al. [61] (annual), Dätwyler et al. [67] (DJF), Tardiff et al. [65] (annual), and Villallba et al. [69] (DJF). All indices were normalized and a 30-year rolling mean was applied to mitigate the influence of uncertainties in the paleoclimate records. Dashed lines denote a trend towards a more negative SAM in proxy records between 1400 and 1700 CE, with a core period of 1450 to 1650 CE (highlighted in grey). Colored bars denote the 200-year period with the lowest average SAM index; the average SAM index for each 200-year minimum period is shown in (b). (c) Same as in (a), but for the annual SAM index in LME full forcing simulations; the ensemble mean is shown in black; ensemble member 2 is highlighted in red to illustrate the modeled SAM variability in the individual ensemble members (shown collectively in grey) and; (d) same as in (b), but for LME full forcing simulations.
Geosciences 12 00299 g009
Publisher’s Note: MDPI stays neutral with regard to jurisdictional claims in published maps and institutional affiliations.