Article

Active Triclinic Transtension in a Volcanic Arc: A Case of the El Salvador Fault Zone in Central America

by
Jorge Alonso-Henar
1,*,
Carlos Fernández
1,
José Antonio Álvarez-Gómez
1,
Carolina Canora
2,
Alejandra Staller
3,
Manuel Díaz
4,
Walter Hernández
5,
Ángela Valeria García
4 and
José Jesús Martínez-Díaz
1,6
1
Department of Geodynamics, Stratigraphy and Paleontology, Complutense University of Madrid, 28040 Madrid, Spain
2
Department of Geology and Geochemistry, Faculty of Sciences, Autonomous University of Madrid, Cantoblanco Campus, 28049 Madrid, Spain
3
Departamento de Ingenieriía Topográfica y Cartografiía, Universidad Politécnica de Madrid, 28031 Madrid, Spain
4
Observatorio de Amenazas y Recursos Naturales, Ministerio de Medio Ambiente y Recursos Naturales, San Salvador 015015, El Salvador
5
Departamento de Geología, El Salvador University, Ciudad Universitaria, San Salvador 015015, El Salvador
6
Institutro de Geociencias (IGEO), Universidad Complutense de Madrid-Consejo Superior de Investigaciones Científicas, 28040 Madrid, Spain
*
Author to whom correspondence should be addressed.
Geosciences 2022, 12(7), 266; https://doi.org/10.3390/geosciences12070266
Submission received: 27 March 2022 / Revised: 5 June 2022 / Accepted: 15 June 2022 / Published: 30 June 2022
(This article belongs to the Special Issue Evolution of Modern and Ancient Orogenic Belts)

Abstract

:
The El Salvador Fault Zone (ESFZ) is part of the Central American Volcanic Arc and accommodates the oblique separation movement between the forearc sliver and the Chortis block (Caribbean Plate). In this work, a triclinic transtension model was applied to geological (fault-slip inversion, shape of volcanic calderas), seismic (focal mechanisms) and geodetic (GPS displacements) data to evaluate the characteristics of the last stages of the kinematic evolution of the arc. The El Salvador Fault Zone constitutes a large band of transtensional deformation whose direction varies between N90° E and N110° E. Its dip is about 70° S because it comes from the reactivation of a previous extensional stage. A protocol consisting of three successive steps was followed to compare the predictions of the model with the natural data. The results show a simple shear direction plunging between 20° and 50° W (triclinic flow) and a kinematic vorticity number that is mostly higher than 0.81 (simple-shearing-dominated flow). The direction of shortening of the coaxial component would be located according to the dip of the deformation band. It was concluded that this type of analytical model could be very useful in the kinematic study of active volcanic arcs, even though only information on small deformation increments is available.

1. Introduction

Harland [1] defined transtension as crustal extension and shear operating in zones of oblique extension, which, from the point of view of classic transtension (pure shear as the coaxial component), produces: (1) constrictional (prolate) strain; (2) horizontal stretching with steep or flat cleavage; (3) folds and thrusts at a high angle to the zone; (4) extensional structures at a low angle and; (5) crustal thinning, subsidence and basin development [2]. Classic transpression–transtension models for shear zones assume monoclinic flow geometries, in which the finite strain rotation axis (i.e., the vorticity vector of instantaneous flow) is fixed parallel to (with) one of the main strain axes (i.e., [2]). Those models were later modified, increasing the degrees of freedom, by [3] or [4], including the possibility that the coaxial component is not exclusively pure shear. Unfortunately, sometimes these models do not satisfactorily explain numerous observations in several shear zones where the stretching lineation varies in intermediate positions, from parallel to the strike to parallel to the dip sense of the shear zone [5,6,7,8]. That is because the implementation of more general flow models with triclinic symmetry is necessary to shed light on the kinematic meaning of rock fabrics in numbers of inclined or even vertical shear zones [6,9]; therefore, the use of progressively more sophisticated analytic models to understand the features of ductile shear zones is becoming more common (e.g., [10]). However, the use of this kind of approach is less common in the shear zones developed in the brittle regime (upper crust) or in active tectonics regions, although their use has proved viable and is remarkably useful to understand regional kinematics. Thus, [11,12,13] have satisfactorily applied these models in different tectonic frames in the upper crust.
Despite the amount of oblique extensional tectonic zones, in classic transtension, as defined by [1], there is a relatively low number of studies focused on transtensional kinematics compared with the transpression studies. This might be due to the fact that these studies are focused on rocks exhumed from middle to lower crust rocks where transtension is, apparently, less common (e.g., [14]). A search in the Scopus database shows four times fewer results for transtension than for transpression, which makes the opportunity to apply analytic models in order to shed light on complex strain processes in transtensional settings even more interesting.
At the Central American Volcanic Arc (CAVA), several structures appear from Guatemala to the Talamanca Ridge in Costa Rica that accommodate the forearc sliver relative motion. Specifically, in El Salvador, there is a fault system crossing the country from east to west: the El Salvador Fault Zone [15]. The transtension within the CAVA crossing El Salvador has been experimentally suggested by [16] and geodetically measured by [17] or inferred from morphometrical and structural analyses by [18] but has not been sufficiently proven, as indicated by [19]. Available kinematic data (focal mechanisms, GPS data, fault slickensides and deformed volcanic caldera) help to constrain the main deformation parameters of the shear zone. These parameters are: (1) its kinematic vorticity; (2) the orientation of the vorticity vector and thereby the rake of the non-coaxial component on the shear zone boundary; and (3) the sinkage rate in the CAVA imposed by the transtension. Through the application of the general triclinic transpression/transtension with the oblique extrusion model [10], it has been possible to infer the triclinic and transtensional nature of the ESFZ (with high vorticity values). The results can be easily explained by the imposition of inclined structures generated during a previous extensional phase that are inherited and later reactivated by its current kinematics.

2. Tectonic Frame

The ESFZ is located in the CAVA, a volcanic chain that expands from the border of Guatemala and Mexico to Costa Rica (Figure 1A). Northern Central America (Honduras, Nicaragua, El Salvador and Southern Guatemala) is part of the Chortis Block, the only area with a Precambrian and Paleozoic basement in the Caribbean region. On this basement, several Mesozoic–Cenozoic basins were developed and filled by a volcanic cover related to the CAVA magmatism [20]. The crustal block boundaries are: (1) the Motagua–Polochic Fault Zone, which is the northern boundary of the Caribbean Plate (in contact with the Maya Block); (2) the Hess Escarpment to the south; and (3) the Middle America Trench to the west. The northern end of the CAVA is located at a diffuse triple joint between North American, Caribbean and Cocos Plates [21,22,23]. The northward motion of the forearc sliver (relative to the Caribbean Plate) is accommodated throughout dextral faulting developed along the CAVA. These structures coincide with geographical boundaries and are, from north to south: Jalpatagua Faut in Guatemala [24,25]; and more recently [26]; ESFZ in El Salvador [15,27,28]; and the Nicaraguan Depression [29,30,31]. Even though the developed structures are well constrained, there is no consensus on why the forearc sliver is moving. Once discarded the strain partition hypothesis as the engine of the fore arc motion [32,33,34], two main hypotheses appeared to explain the transcurrent faulting parallel to the trench: the northern dragging of the forearc sliver driven by the pinning of the forearc sliver and the North America Plate ([34,35], among others); or the southern push driven by the Cocos Ridge collision [36,37] among others). In [38], the two main hypotheses are discussed, concluding that both force sources may be acting analogue to a push–pull train in Northern Central America, the dragging of the forearc sliver is dominant from northern Guatemala to Chiapas, while in Southern Central America (southern Nicaragua and Costa Rica), the push promotes the movement due to the Cocos Ridge collision. Regardless of the movement source, the GPS velocities distribution regarding the Caribbean fixed plate show that in the lowest coupling area of the subduction interphase (coincident with El Salvador), there is a rate ranging from 7 to 11 mm/yr of parallel movement to the trench versus 2 mm/yr of extension perpendicular to the trench ([38]; Figure 1B is based on data from [17,39,40,41,42].
Within this context, a fault system is developed crossing El Salvador, which accommodates the forearc sliver motion. The CAVA acts as a weak zone that accommodates almost all the displacement of the forearc sliver [16,45]. Considered in a broad sense, the fault system is composed of dextral strike-slip faults E–W to WNW–ENE oriented with extensional step-overs [19,40,45,46]. This fault system was developed over non-continuous graben or semi-graben structures inherited from an extensional stage that were reactivated and promoted by releasing step-overs and pull-apart basins along the fault system [16,47,48,49].
The ESFZ is divided into five sectors, which are, from west to east: Western Segment (the Guaycume fault is the main fault in this sector); San Vicente Segment (the source of the 13 February 2001 earthquake); Lempa Segment; Berlin Segment (whose main fault is El Triunfo Fault); and San Miguel Segment (with the lowest geomorphological expression). The ESFZ was the source of the 13 February 2001 destructive earthquake (Mw 6.6), and it has great seismic potential, being able to generate earthquake magnitudes up to Mw 7.0, which makes this area especially interesting from a hazard point of view and has led to several studies [15,28,48,50,51]. A detailed review of each fault and its associated seismicity can be found in [52] and references therein.
This study is focused on the central region of the ESFZ, where the deformation is concentrated in a narrower band compared with the bounding areas, and it is composed of the San Vicente, Lempa and Berlin Segments, which show a releasing relay at the surface between the San Vicente and El Triunfo Faults (Figure 2). In this zone, GPS data show velocity rates ranging from 9 to 12 mm/yr depending on the measured site [17,53]; however, the fault slip rates obtained from paleoseismology and geological techniques are slower, ranging from 3 to 6 mm/yr, depending on the methodology and the structure analyzed [18,19,27,47,48,49]. The lower rates obtained from geologic measurements are a common feature in any tectonic setting and are usually related to the fact that geodesy obtains rates from broad deformation areas while paleoseismology obtains rates from singular structures.

3. Methodology

For a better and deeper understanding of the ESFZ kinematics, we have resorted to analytic models and adapted protocols previously proposed that have successfully explained the strain in several geological contexts (e.g., [12,13,54]). As mentioned above, transtension is kinematically defined as the combination of a non-coaxial component (simple shear) acting parallel to the shear zone boundaries (SZBs) together with a coaxial component that, in the simplest case, is pure shear with an extension perpendicular to the SZB and vertical shortening or according to the SZB dip sense [2,3]. Classic models of monoclinic transpression (e.g., [2]) obtain vertical foliations for vertical shear zones, while the vorticity normal section (VNS, the highest degree of structural asymmetry section) coincides with the YZ section of the Finite Strain Ellipsoid (FSE), except for simple-shear-dominated flows and low to moderate finite deformation stages (e.g., [3]), where the VNS coincides with the XZ section. Similarly, under classical transtension, foliations tend to be horizontal, and the VNS coincides with the XY plane of the finite strain ellipsoid, except for flows dominated by simple shear and low to moderate finite strains, where the VNS coincides with the XZ section, and foliations tend to be vertical. Despite the fact that these assumptions can be applied to several cases and broadly observed in structural geology literature, other situations are possible. For instance, more complex, triclinic flows can result from inclined (non-vertical) shear zones (e.g., [6,55]). An inclined shear zone can result from the reactivation under transtension of normal faults resulting from a previous extensional phase, as in the case considered in this work.
In recent years, finding fabric evidence in shear zones that are not satisfactorily explained by monoclinic type flows is becoming more and more common; for example, the coexistence of stretching lines with opposite plunges or the coexistence of FSE in the flattening and constriction fields within the same shear zone (i.e., [7,8,56,57]). Although this last situation (flattening and constrictional strain geometry depending only on vorticity) can also be observed in monoclinic flows under types of coaxial components that can differ from pure shear, as in class A of transpression and transtension [3]. Later models proposed by [6,9,55] are considered to be more complete and realistic options that include convergence vectors between two rigid blocks separated by a shear zone that are not horizontally restricted or inclined boundaries shear zones that impose a simple shear vector oblique on the SZB.
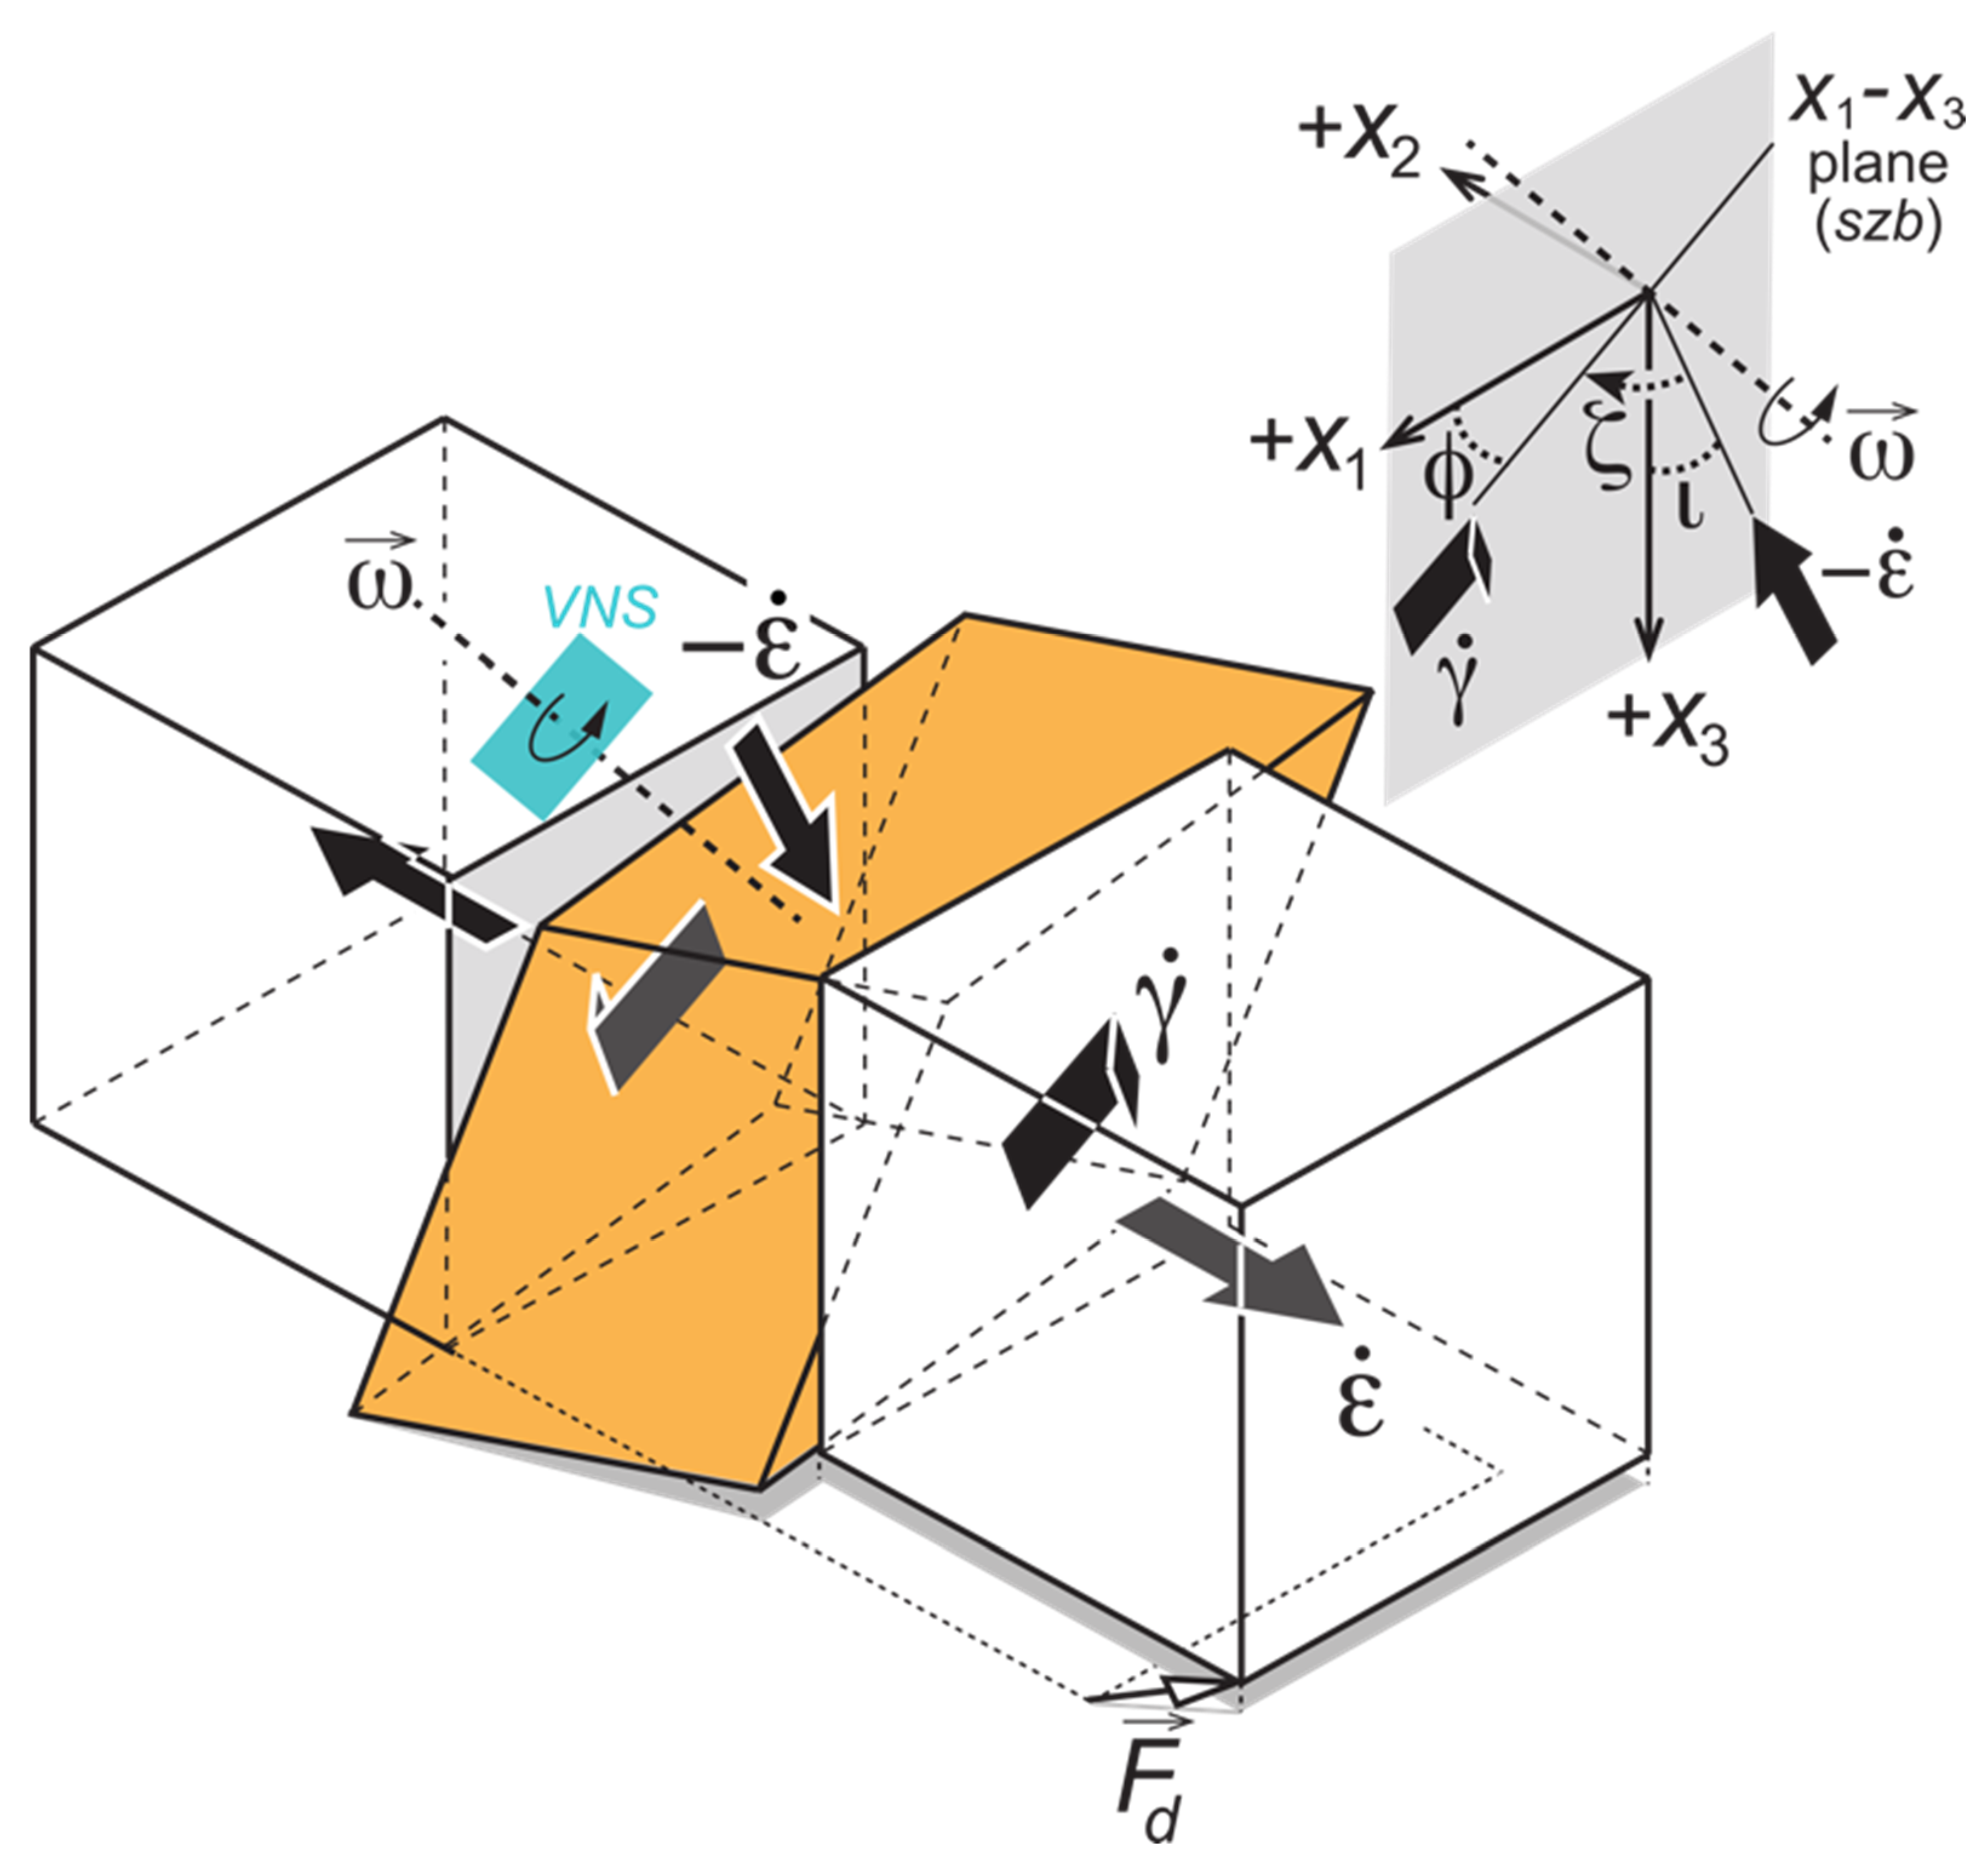
In our study, we have applied the triclinic transpression with an oblique extrusion model by [10], which, with several degrees of freedom, involves all the options mentioned above and inclined extrusion, enabling a more realistic approach to nature. This transpression model considers the non-coaxial and coaxial strain combination and the possibility of obtaining inclined simple shear or even oblique extrusion (defined by the maximum stretching axis of the coaxial component). For the kinematic study of the ESFZ, a modification of the model will be considered by simulating a transtension (Figure 3). In order to achieve this, it is necessary to modify the value of the longitudinal deformation (stretching) perpendicular to the boundary of the shear zone and corresponding to the coaxial component of flow (Equation (12) in [10]). Unlike under transpression, where that component involves shortening, transtension is simulated by lengthening perpendicular to the shear zone. The divergence vector pointing to the relative displacement of the blocks limited by the shear zone can be decomposed into a component parallel and another perpendicular to the boundaries of the shear zone. The displacement parallel to the shear zone originates from the non-coaxial (simple shearing) component of the flow and is characterized by the simple shear strain rate ( γ ˙ ). The triclinic transtension analytical model has the advantage of including, as a special case, the monoclinic transtension. Therefore, in this work, we have preferred to use a general model, which does not prejudge the triclinic or monoclinic character of the flow that affected the region under study. In this case, the simple shearing direction is allowed to deviate from the azimuth of the shear zone (angle φ, Figure 3). The displacement perpendicular to the shear zone boundary gives place to the coaxial component of the flow, which is defined by the coaxial strain rates ( ε ˙ 1 , ε ˙ 2 , ε ˙ 3 ). Due to its simplicity, pure shearing is chosen as the coaxial component (in this case). For pure shearing, ε ˙ 1 = 0; ε ˙ 2 = ε ˙ 3 = ε ˙ . The principal lengthening axis ( ε ˙ ) of the coaxial component is normal to the boundaries of the shear zone, while the principal shortening axis ( ε ˙ ) is considered, in principle, to coincide with the dip direction of the shear zone (Figure 3).
In order to apply this model, we have followed the protocol adaptations proposed by [12,54]. Such model has been tested in several ductile shear zones, such as Wabigoon-Quetico, Canada or South Iberian Shear Zone, the southwest of Spain [54]; in rocks deformed in brittle regimes—such as Torcal de Antequera, External Betics, South Spain, [12] or the Neka Valley, Eastern Alborz, Iran [58]—or active shear zones—in the Alhama de Murcia Fault in eastern Betics, Spain, [13]—and has also been numerically tested [59], contributing to higher confidence in the transpression model.

3.1. Incremental Strain Constriction

The ESFZ strain features make it crucial to consider the first stages of the incremental strain vs. the finite strain as one of the main pieces of evidence for the kinematic analyses. For this reason, we have resorted to three data sources: (1) orientations and slip senses of fault slickensides, (2) earthquake focal mechanisms and (3) GPS data.

3.1.1. Infinitesimal Strain Ellipsoid from Fault Slickensides

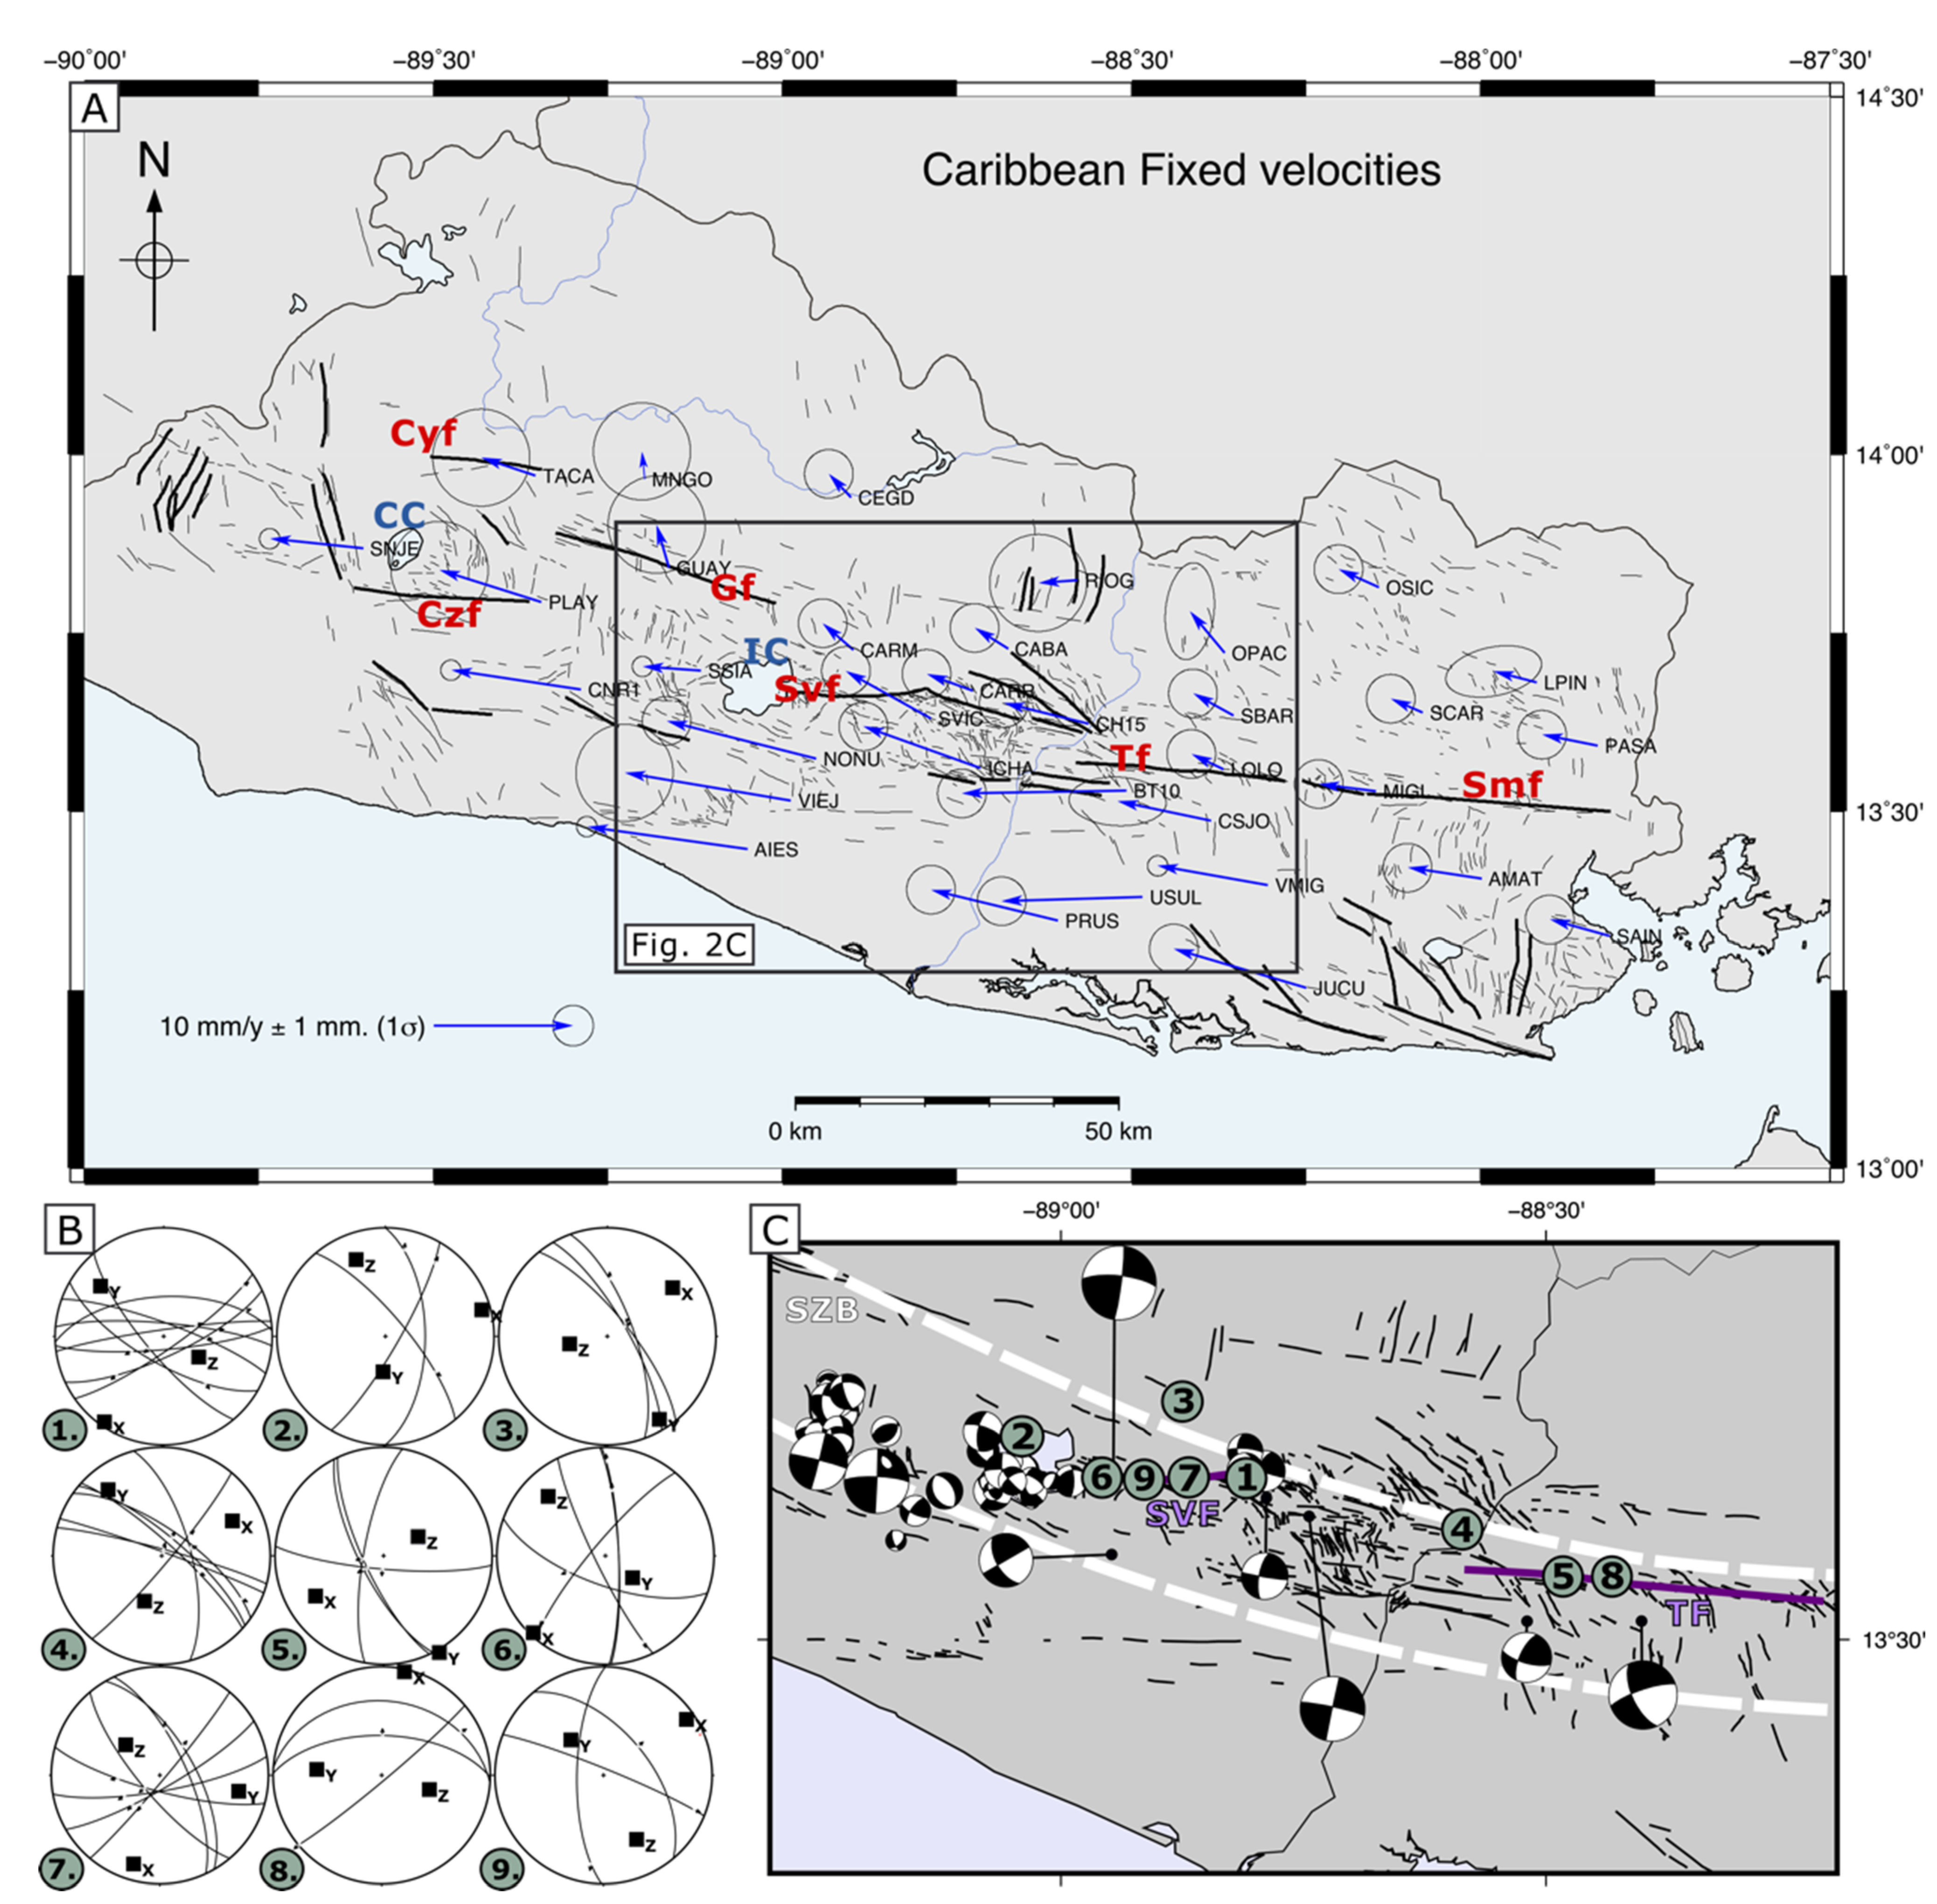
All calculations are based on the principle that the planes of maximum incremental shear strain are 45° from the main axes of an incremental strain ellipsoid (ISE) (e.g., [60,61]). Thereby, from slip data on faults and assuming that the amount of displacement is relatively small compared with the area under study, it is possible to obtain the X, Y and Z axes of an ISE. We have compiled fault slip data all along the ESFZ, in outcrops, road cuts and paleoseismic trenches (data published in [47,48,49]). In addition, when the number of data is enough, we can obtain the incremental strain ellipsoid by using the [61] method for each measured site. All the ISE axes are projected in Figure 2B, which shows fair consistency in the X axis’ orientation, with low plunge values and trending approximately to 040° or 220°. However, there is a greater dispersion of the Y and Z axes, which are exchanged in some cases. We would like to highlight the limited availability of data of some sites, so there is a remarkable uncertainty about the ISE axes’ location, and there are not enough samples to obtain representative confidence cones for them. For this reason, we have unified all data to statistically constrain a representative ISE for the area under study using a fault population of 49 data (Figure 4A). The great dispersion of the Z axis is explained if we regard the constrictive nature of the ellipsoids. Due to the deformation heterogeneity, we have carried out three more analyses in order to consider the possible influence that faults within the relay zone (between the El Triunfo and San Vicente Faults) may have had on the first results (Figure 2). We also show the lower hemisphere projections of the analyses carried out by using only data from sites located closer to the El Triunfo and San Vicente Faults (Figure 4B). When the analysis is focused on El Triunfo Fault, the data amount is low, and no uncertainty cones are possible to obtain. The results of the local analyses also show a great dispersion in the Z axes despite the fact that data are surrounding a more homogeneous area. The X axis is much more consistent, and even though it is within the confidence cone calculated from the global analysis, the sense of plunge is the opposite (Figure 4A).
Finally, we show the results of the filtered analysis after data selection, removing sites that could be reflecting the local extensional relay at the Lempa area between the San Vicente and El Triunfo Faults or northern to the SZB (sites 2, 3 and 4 in Figure 2C), because the inherently heterogeneous nature of deformation at extensional relays cannot be approached with the used analytical model. We have obtained the preferred ISE with a more reliable X axis 216°//07°oriented, with a relatively small confidence cone (half angles of 11.6° and 14.4° for 95% and 99% confidence, respectively). On the other hand, the Y and Z axes are delocalized with their containing plane, the average orientation of the Z axis is 327°//69°, but we consider that it could be located in every place within the YZ plane of the incremental strain ellipsoid regarding the confidence cone projected at Figure 4C.

3.1.2. Incremental Strain Ellipsoid from Earthquake Focal Mechanisms

We have compiled all the available earthquake focal mechanisms in El Salvador (see [52]). It is important to highlight that there are only a few obtained from earthquake magnitudes Mw < 3.0, which reduces data reliability and may lead to some errors. Another issue is that some of the focal mechanisms were inferred or recalculated from the record of old seismic stations or using damage mapping of historical earthquakes, which may also be a source of uncertainty [62]. The Mw 6.6 San Salvador earthquake on 13 February 2001 (highlighted in the central part of Figure 2C), whose source was the San Vicente Fault [15,28], had the highest earthquake magnitude that has contributed more to the results of these analyses. We have projected the focal mechanisms within the area under study after being filtered at depth in a Kaverina classification diagram (Figure 4D) to easily visualize the data dispersion. These focal mechanisms (N = 54) were used to constrain a seismic tensor. We have also obtained the P, B and T axes for each focal mechanism using the FMC program [63], which are projected in Figure 4D. As shown in the stereoplot, the P axes distribution is dispersed but contained in a plane, whereas there is more consistency in the T axes, as can be shown in the results obtained from the analysis of the fault slip measurements. The seismic tensor was inferred by resorting to the Kostrov method [64]. The used parameters were: (1) 54 focal mechanisms, whose weights in the calculation depend on the earthquake’s magnitude; (2) a shear modulus of 32 GPa; and (3) a 35,000 km3 volume. The results of the analysis are shown in the table and plotted in Figure 4D. The table shows X, Y and Z axes’ orientation and eigenvalues and their projection in the stereoplot with the X axis equivalent to T and the Z axis equivalent to P.

3.1.3. Incremental Strain Ellipses from GPS Data Sites

In order to constrain the current strain within and out of the shear zone from GPS data, we have resorted to two approaches: first, we have determined divergence values out of the shear zone, and second, we have obtained the main axes of horizontal ellipses within the shear zone. El Salvador counts on a GPS network (ZFESnet, [17]) that combines both campaign and continuous equipment. The GPS velocity field across and along the ESFZ was determined in [17], obtaining relatively high strain rates at the fault zone (Figure 2A). Further information on GPS sites and their naming and data processing can be found in [17].

Flow Apophyses Constriction

According to [3], the relative movement of the rigid blocks separated by a shear zone is parallel to the flow apophyses oblique to the shear zone (flow apophyses are directions or maximum, intermediate and minimum rate of particle displacement; see, e.g., [3]). Determining this parameter is possible by arbitrarily considering a block fixed (the northern block, in this case) and constraining the southern block displacement from data immediately adjacent to the southern end of the ESFZ; and a little further, considering the 1σ error of GPS data, resulting in the orientation presented in Figure 4E. In red are the values of closer data sites (AIES, PRUS, USUL sites versus CAR, CABA, SBAR sites, Figure 2), and in black are the far ones (AIES y PRUS vs. OPAC y RIOG, Figure 2). Some differences can be observed along the strike of the ESFZ, from the AIES orientation (westernmost studied zone) to USUL (eastern area).

Strain Rate Tensors

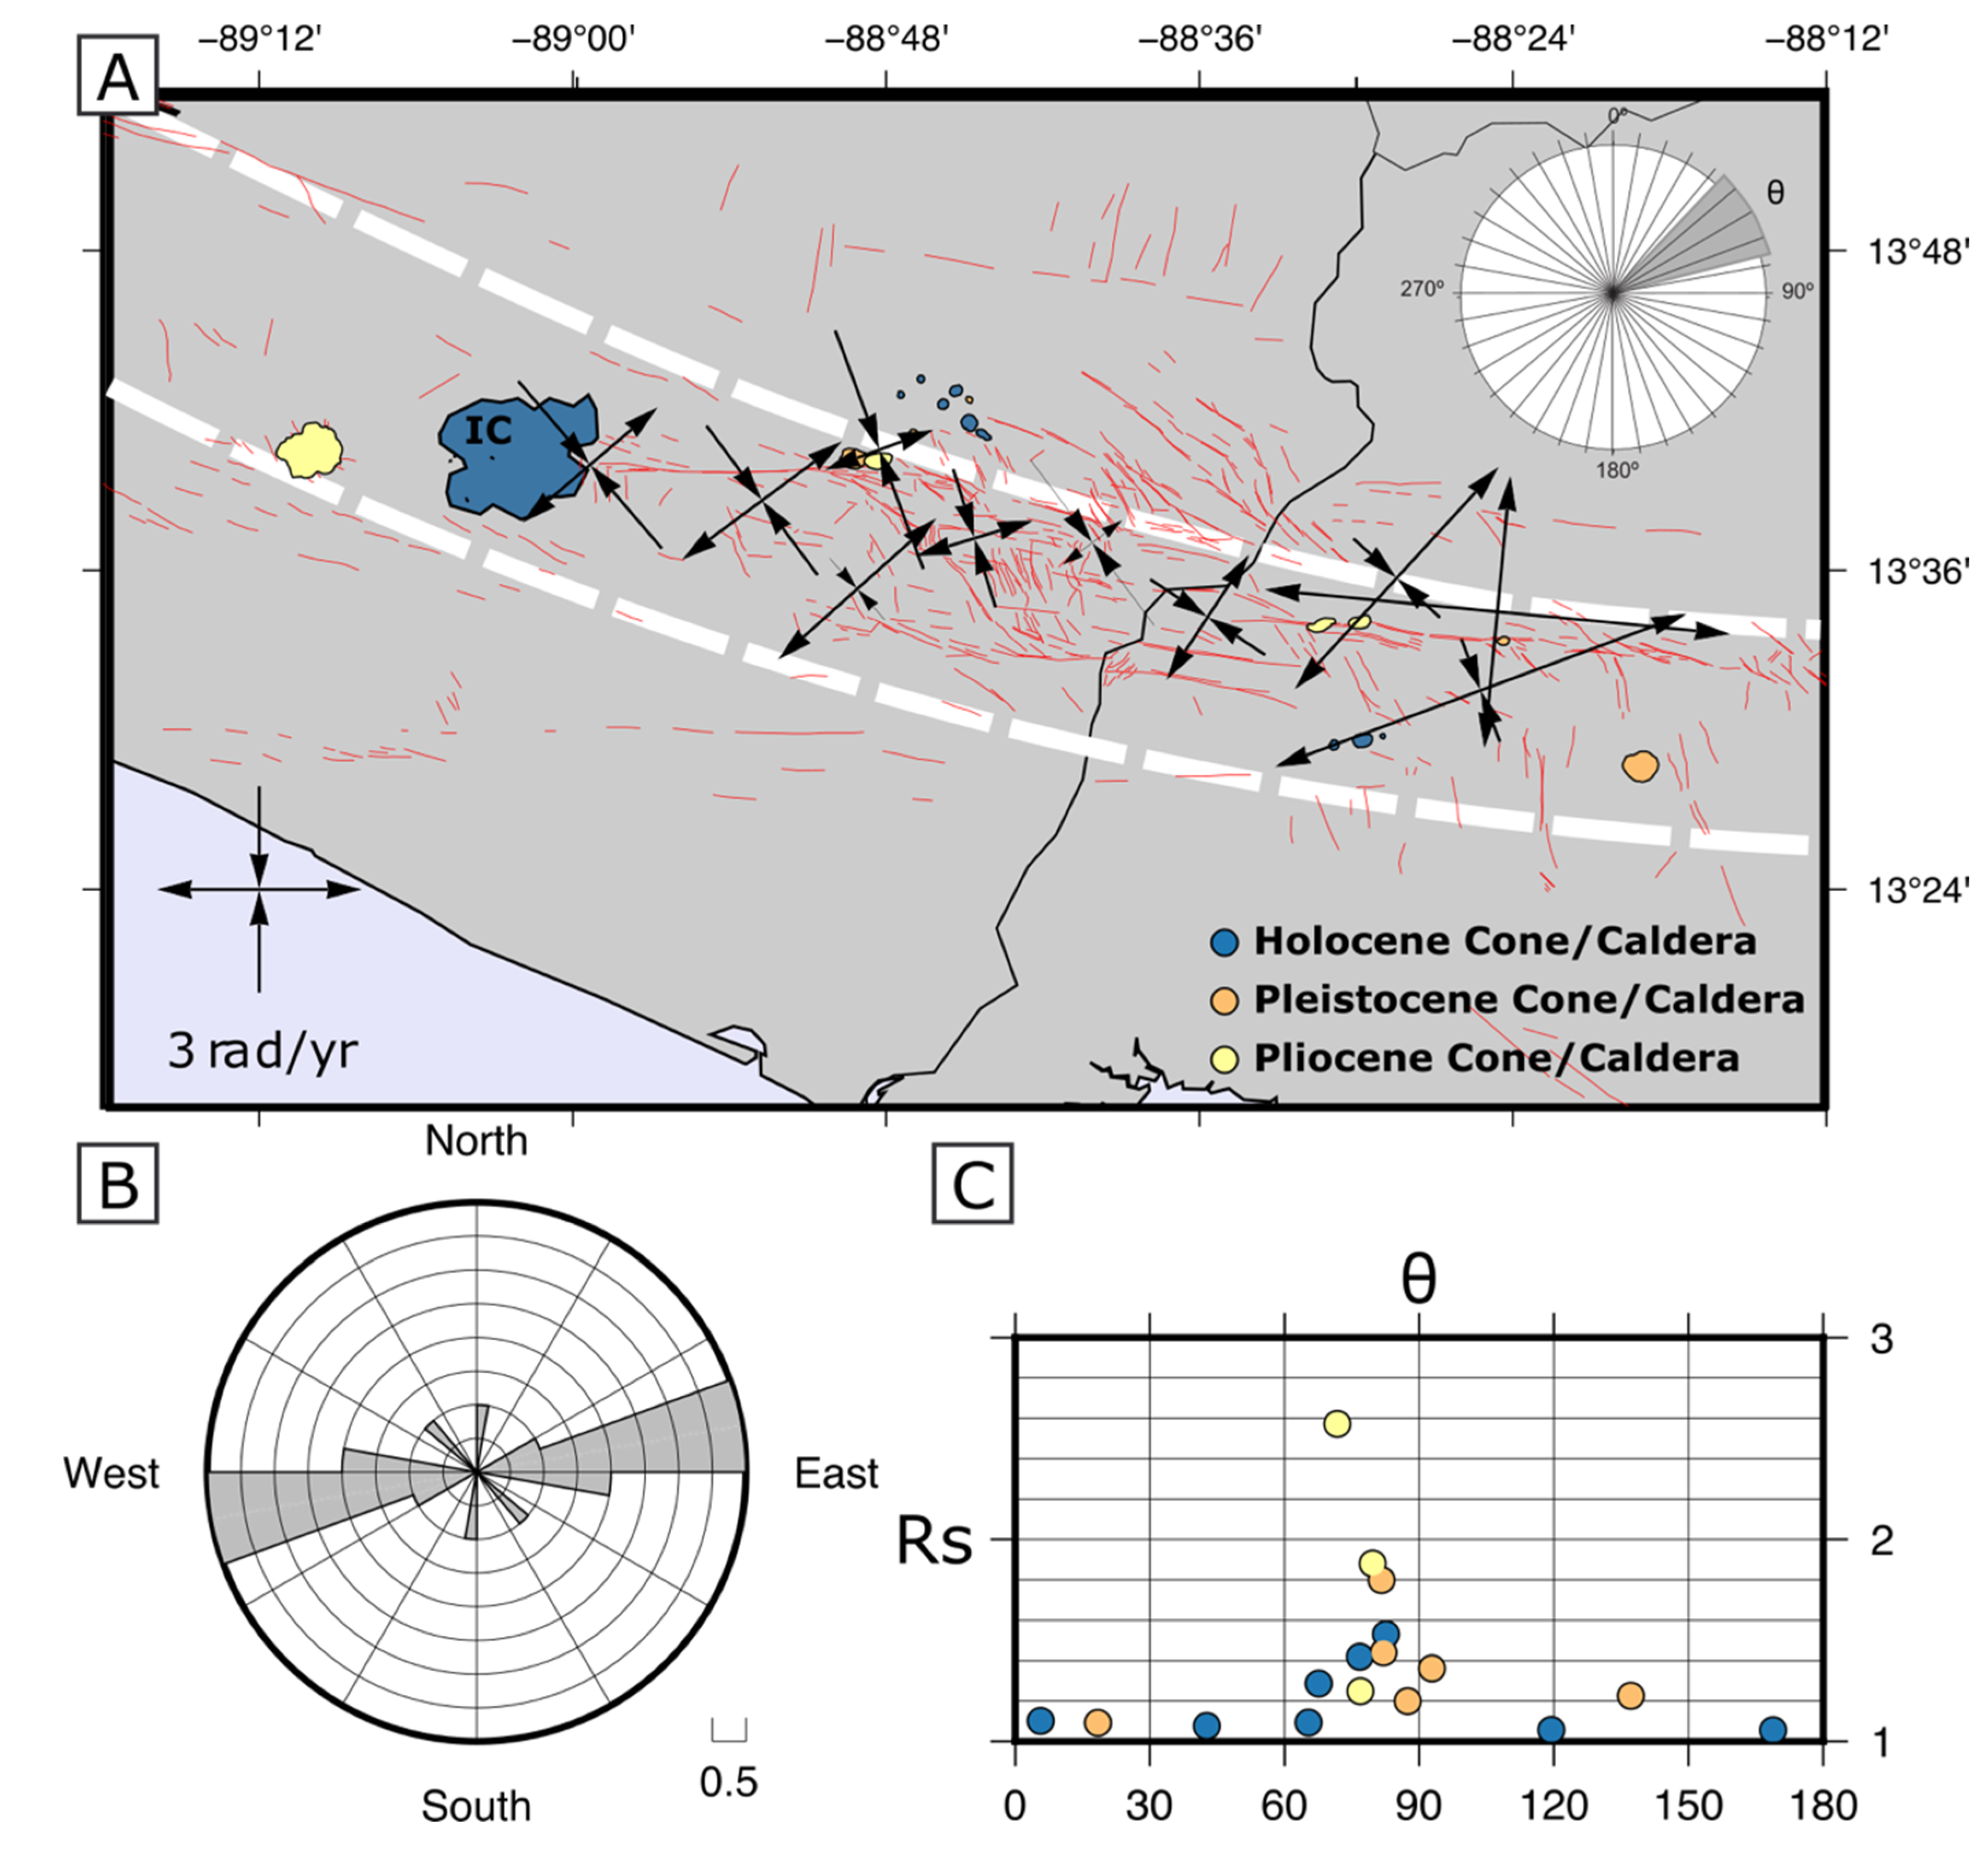
To constrain the horizontal infinitesimal strain within the shear zone, we have resorted to gradient tensor calculation from the GPS data. From the ZFESNet velocity network, we have calculated a velocity gradient tensor for each triangle formed by GPS sites within the shear zone. The triangles were obtained by Delaunay triangulation [65] using GMT software [66]. We calculated the velocity gradient tensor from the horizontal velocity field from ZFESNet GPS velocities based on the formulation of [67]. For this case, the strain was only constrained in two dimensions; the orientation of the main strain axes and their values are summarized in Supplementary Materials S3 and shown in Figure 5A (Further details and analyses are in [17].

3.2. Finite Strain Constriction

For a deeper understanding of the ESFZ kinematics, we tried to add finite strain data to the available incremental strain data. We have resorted to volcanic calderas and monogenetic volcanic cone shapes deformed by the shear zone activity [68,69,70,71]. The deformation of Pliocene, Pleistocene and Holocene calderas and volcanic cones have been measured along the ESFZ. The best fit ellipse was calculated using Fiji, an image analysis software. Possible cartographic projection distortion was discarded due to the working scale that may not influence the results. The long axis of the Best Fit Ellipse is projected, both in a rose diagram (Figure 5B) and on a diagram representing the ellipticity of each ellipse (Rs) against the angle (θ), which is the angle that long axes form with the boundary of the ESFZ (Figure 5C) in order to evaluate a preferred orientation. On the other hand, we have applied the same tool to the interpretation of the Carbonera Caldera evolution (proposed by [71]), obtaining similar results as those obtained with regional data but with better fits of a polynomial regression (Supplementary Materials S1). Data projection shows that the shape factor (Rs) is higher for Pliocene cones than the others, while the rose diagram confirms dextral kinematics of the shear zone, with one exception—regardless of the Holocene data with great dispersion inherent to their low ellipticity that mislocates the long and short axes of the best fit ellipse at the first stages of the deformation.

3.3. Protocol for Model Application

The kinematic model applicability has been possible by following a protocol that evaluates in parallel the highest number of kinematic markers available in the area under study. The protocol was initially proposed for the study of plastically deformed rocks [54] and later modified for rocks deformed under upper crust conditions [12]. In this case, the protocol has been adapted to the available data, strongly emphasizing the incremental strain (focal mechanisms, GPS and fault slickensides).

3.3.1. Data Ranges

We have tested the adjustment of the triclinic transtension model to the ESFZ (marked by dashed white lines in Figure 2 and Figure 5). The dip of the shear zone has been estimated at 70° from seismicity data [28] and from analogue modeling [16]. Regarding the strike of the SZB, we explored a range of N90° E, N100° E and N110° E, all dipping 70° S, considering the curvature of the volcanic arc. Regarding the φ value (the simple shear obliquity), we explored a wide range of values with a westward rake that is compatible with the dextral and normal features of the shear zone. The studied values measured from the west are 0°, 10°, 20°, 25°, 30°, 40°, 50°, 60°, 70°, 80° and 90°.
Regarding the maximum shortening associated with the pure shear, for simplicity, it has been considered that the direction of the maximum infinitesimal shortening of the coaxial component coincides with the true dip of the ESFZ boundary (i.e., ι = 0°). Finally, with regard to the kinematic vorticity number (Wk, [72]), after a preliminary analysis, we have tested that the values under 0.7 do not fit the observations; thus, the explored values are: 0.7, 0.81, 0.9, 0.95, 0.99 and 0.9999.
The model predictions have been calculated for the first deformation steps to infer the incremental strain estimated in the area under study (given the starting data and the volume of such area). Then, in Figure 6 and the Supplementary Materials, we can only find the first stages of the finite strain considered (1% and 5% of extension perpendicular to the shear zone), even if we realize that 5% of extension could be too high, so we give more reliability to the first of both.

3.3.2. Applied Protocol Steps

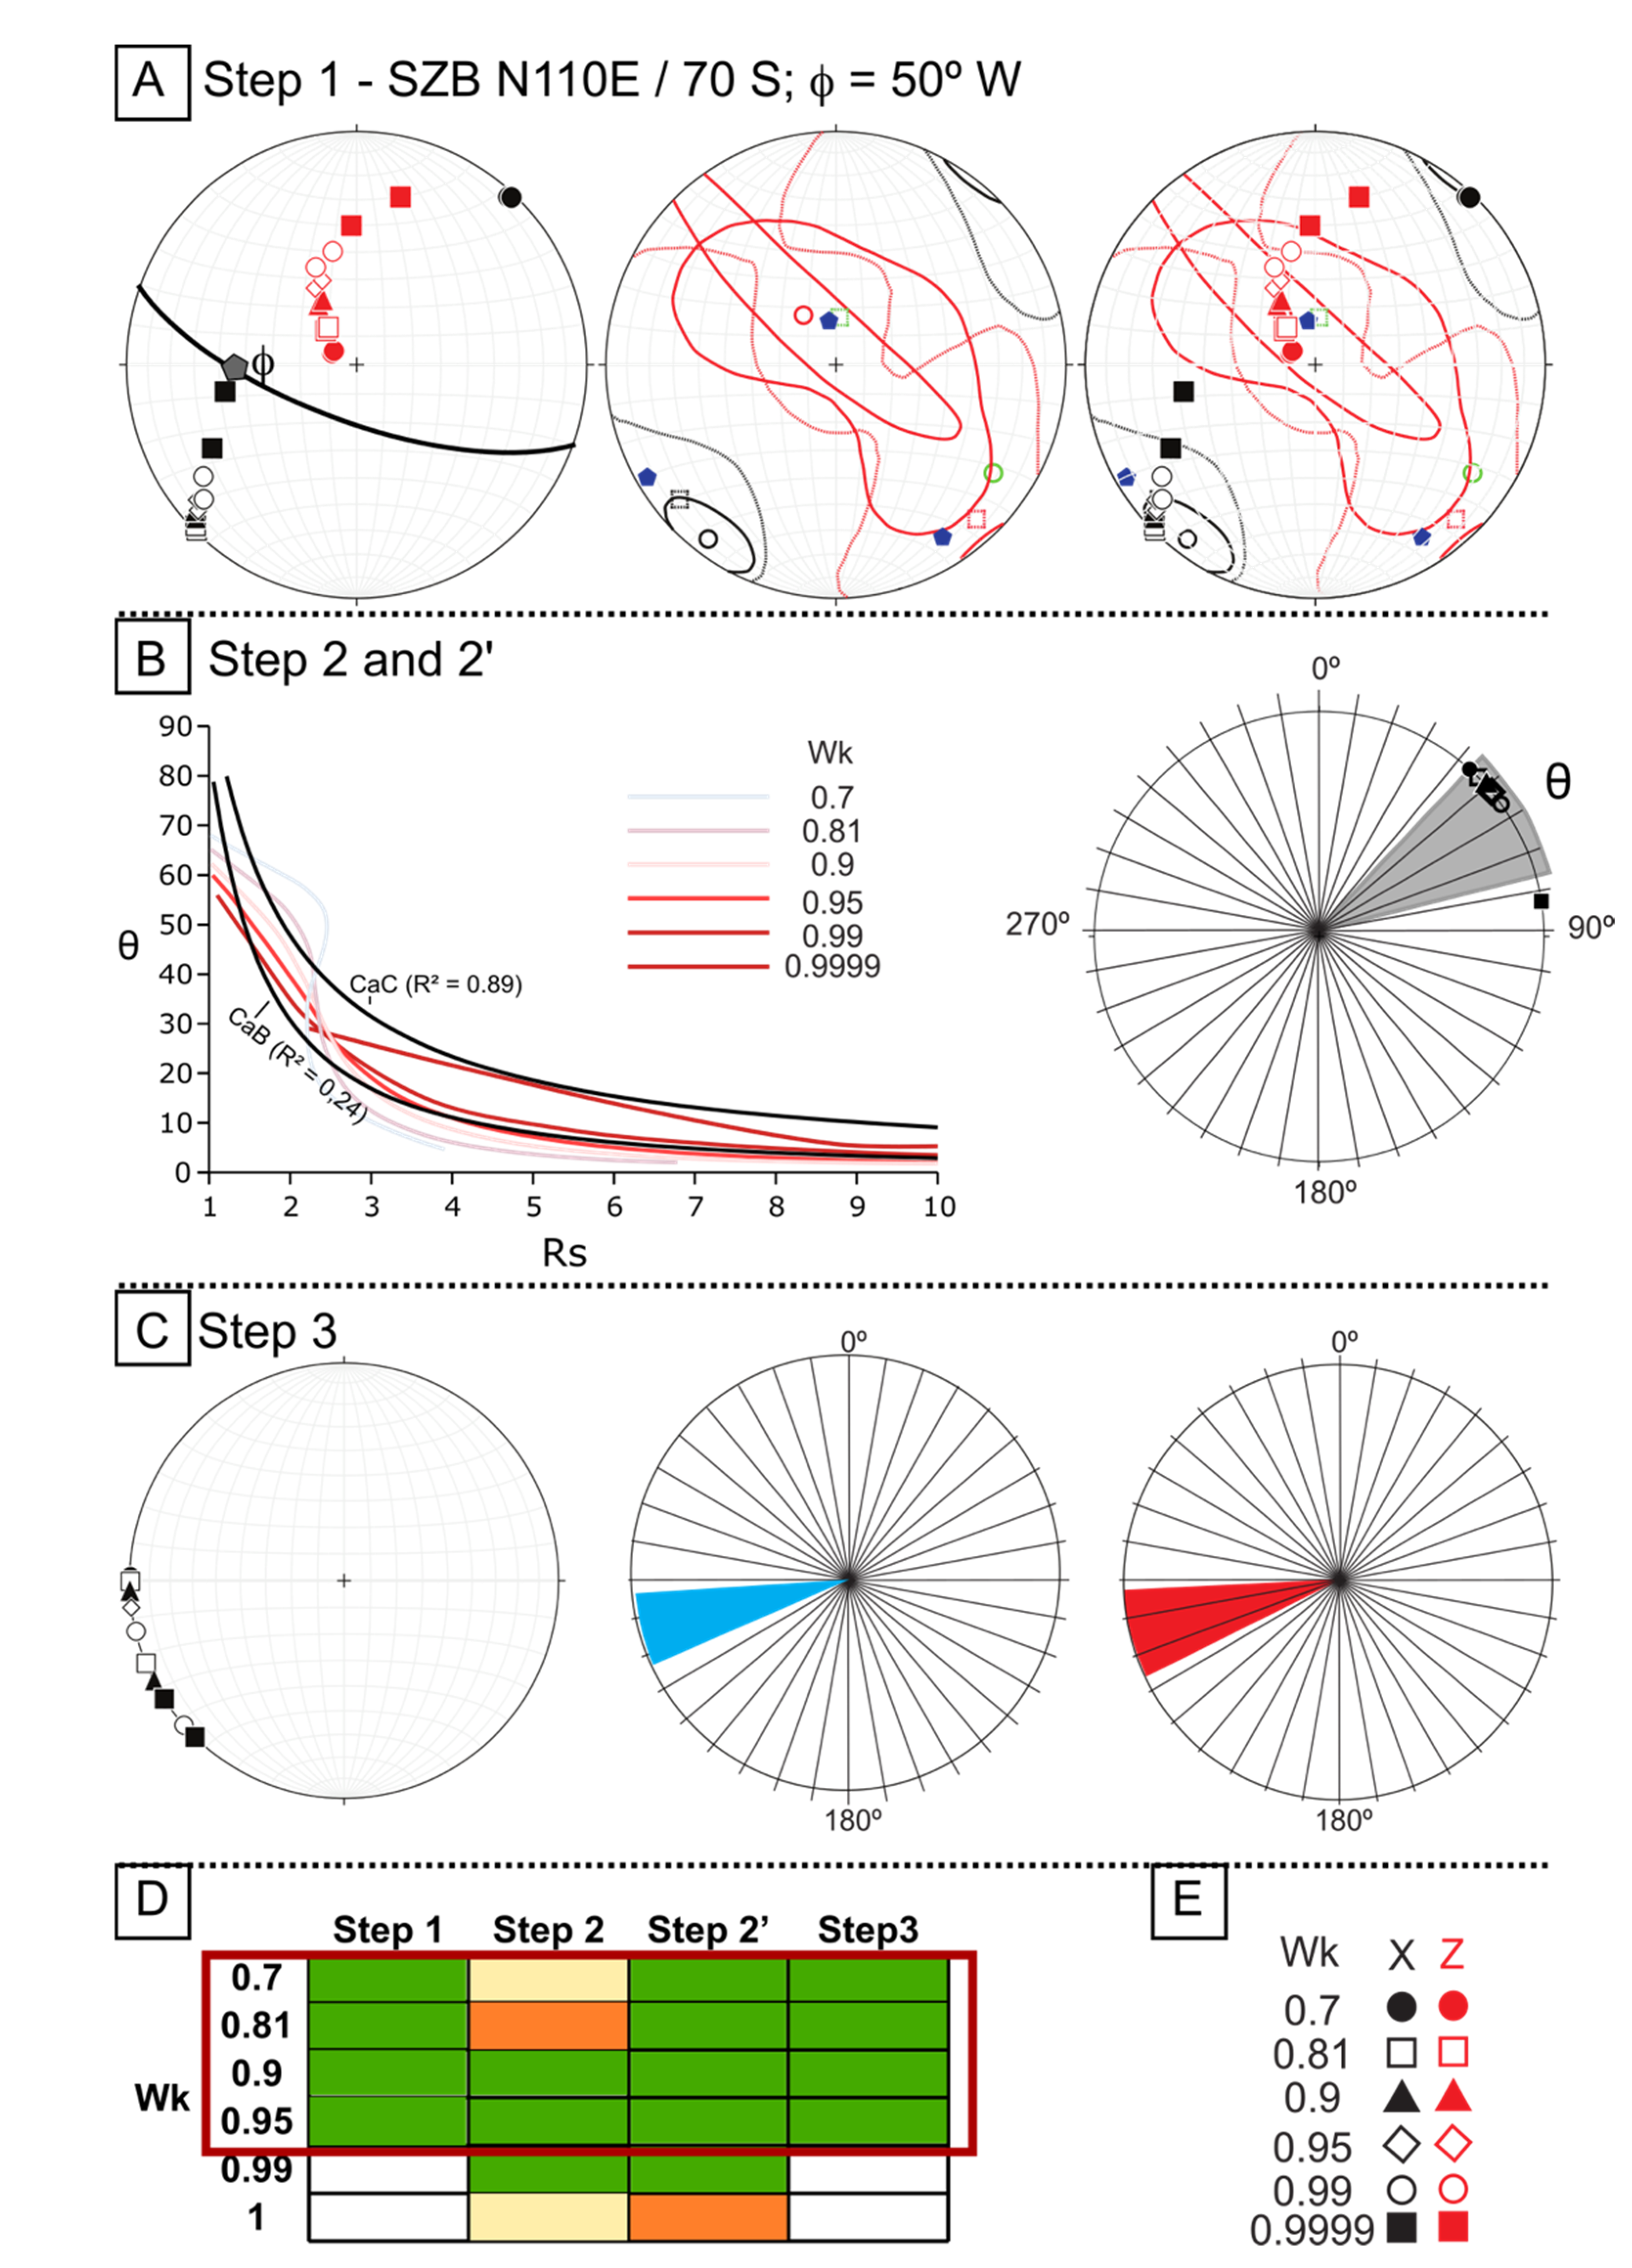
  • Step 1: Comparison, in equal area projection, of the X and Z axes of the infinitesimal strain against model predictions for all the considered parameters described above. We consider it to be a good fit when model predictions are projected within the confidence interval both for the faults and focal mechanisms and are close to their mean values. We consider it to be a fair fit in the same situation when the model predictions are not close to the mean values. We consider it to be a poor fit when model predictions are out of the confidence areas of the focal mechanisms or faults. Finally, we consider that there is no fit when the model predictions are out of the confidence areas for both data at the same time (Figure 6A).
  • Step 2: This step was originally designed by [54] to compare the Rs vs. θ curves predicted by the model with the corresponding values obtained from nature. In our case, the volcanic edifices and caldera shapes were used for this purpose. However, the volcanic edifice geometry might not provide discriminating information to constrain the horizontal strain ellipse (as we will discuss below), and, for this reason, we had to adapt the protocol and complement this step with an intermediate step named 2’ focused on incremental strain (and explained further below). We consider it to be a good fit when the model predicted curves are constrained between the ones obtained from the volcanic edifices; fair fit when adapted to the curve geometry inferred from all the edifices against the obtained from Carbonera Caldera (CaC); and no fit when they cross both curves (Figure 6B).
  • Step 2’: It is the comparison of the main axes of incremental strain predicted by the model on a horizontal section of the ellipsoid against the strain rate tensors measured by GPS sites obtained within the shear zone from the Delaunay triangulation and the [67] equations, published in [17]. In this study, we use Step 2’ in order to complement the original Step 2 due to the available information. We consider it to be a good fit when the range of values predicted by the model is within the measured and one standard deviation. We consider it to be a fair fit when the range exceeds 5° from one standard deviation, and we have considered it to be no fit when the values predicted by the model are out of this range (Figure 6C).
  • Step 3: This step is the comparison of the values of the divergence angle predicted by the model (oblique flow apophyses) for the range of values of the model yielding an acceptable fit in Step 1, with the mean vectors geodetically measured considering the northern block fixed. We have considered them to be good, regular or poor fit when there is a total, partial or null overlap between the model values and the GPS values measured in the closest environment, respectively (Figure 6C).

4. Results

To consider that the model optimally explains the data of the area under study, it should satisfy all the protocol steps simultaneously. In that case, only a narrow range of the values of the parameters governing the transtension model (φ, ι, Wk) would explain the kinematics of the ESFZ. This range coincides with the example shown in Figure 6, in which a N110° E/70° S-oriented shear zone is considered with a kinematic vorticity value of 0.9/0.95 and a rake of 50° W for the simple shearing component. However, we consider Step 2 to be especially restrictive, and the data available in the area under study may make it not applicable in El Salvador because the starting data used to define horizontal ellipses (volcanic edifice and caldera) do not necessarily represent finite strain and their geometry could not be exclusively related to incremental strain but also could be elongated due to fractures that could have acted as magma conduits. This is the reason for using Step 2’, complementing Step 2 and placing emphasis on the incremental strain. By adding Step 2’, broader options appeared that would satisfactorily explain the strain within the volcanic arc.
The results are classified in a way that, when in one step, there is no or poor fit, we discard this possibility; when the three steps of the protocol have a good fit simultaneously (Steps 1, 2’ and 3), the final consideration is classified as good; if two of the three steps have a good fit and one has a fair fit, we consider fair fit as final classification; if two of them have obtained the fair label and one of them good, the final label is a poor fit; when in the three steps of the model we obtained a fair fit, we also consider a poor fit in the final decision. All the information concerning the results of the protocol step by step is presented in Supplementary Materials S1 and S2. A summary of the results is shown in Table 1.
In summary: (a) for a shear zone oriented at N90° E/70° S, there are no good results, and fair results are obtained for φ = 20°, 25° and 30° W, all of them with Wk = 0.99; (b) for a shear zone oriented at N100° E/70° S, no good results were obtained, and fair results were obtained for φ = 25° W, with Wk = 0.99, for φ = 30° with 0.81 < Wk < 0.99, and for φ = 40° and 50° W with 0.9 < Wk < 0.99. Poor results were obtained for φ = 30° W with Wk = 0.7 and for φ = 60° W with Wk = 0.95 and 0.99; and (c) for a shear zone oriented at N110° E/70° S, good results were obtained for φ = 50° W and 0.7 < Wk < 0.99 (even the Step 2 have good fit in for these options when Wk = 0.9 y 0.95); fair results for φ = 40° W (0.7 < Wk < 0.95) and φ = 60° W (0.9 < Wk < 0.95); and poor results are obtained for φ = 60° W (0.7 < Wk < 0.81).
When N90° E/70° S orientation is used as the shear zone boundary, the model predictions yield the worse fit with nature even though this orientation is the most evident for the surface data of the main faults (San Vicente and El Triunfo Faults). All the obtained results have several common features for all the tested orientations, such as the rake of simple shearing (angle φ), which is always higher than 25° W and mostly ranges between 30° W and 50° W in the case of the best results. These data are glimpsed in morphometric analyses [18], where the sink of the southern blocks of the main faults was constrained from geomorphological indexes. The results for the kinematic vorticity number have high values, which, with some exceptions, are systematically higher than 0.81, pointing to simple-shear-dominated flow. The flow type is, therefore, triclinic and located mostly in the field dominated by simple shear flow or in the transition between pure shear/simple-shear-dominated flows. Depending on the orientation used for the calculation, the simple shear obliquity (φ) varies from relatively low values (φ ≈ 20° W, for the N90° E orientation of the ESFZ, with the worst fit) to low/middle (φ ≈ 30–40° W for the N100° E orientation) or even high (φ ≈ 40–50° W for a N110° E-oriented shear zone).

5. Discussion

5.1. On the Data Uncertainty and the Importance of the Incremental Strain

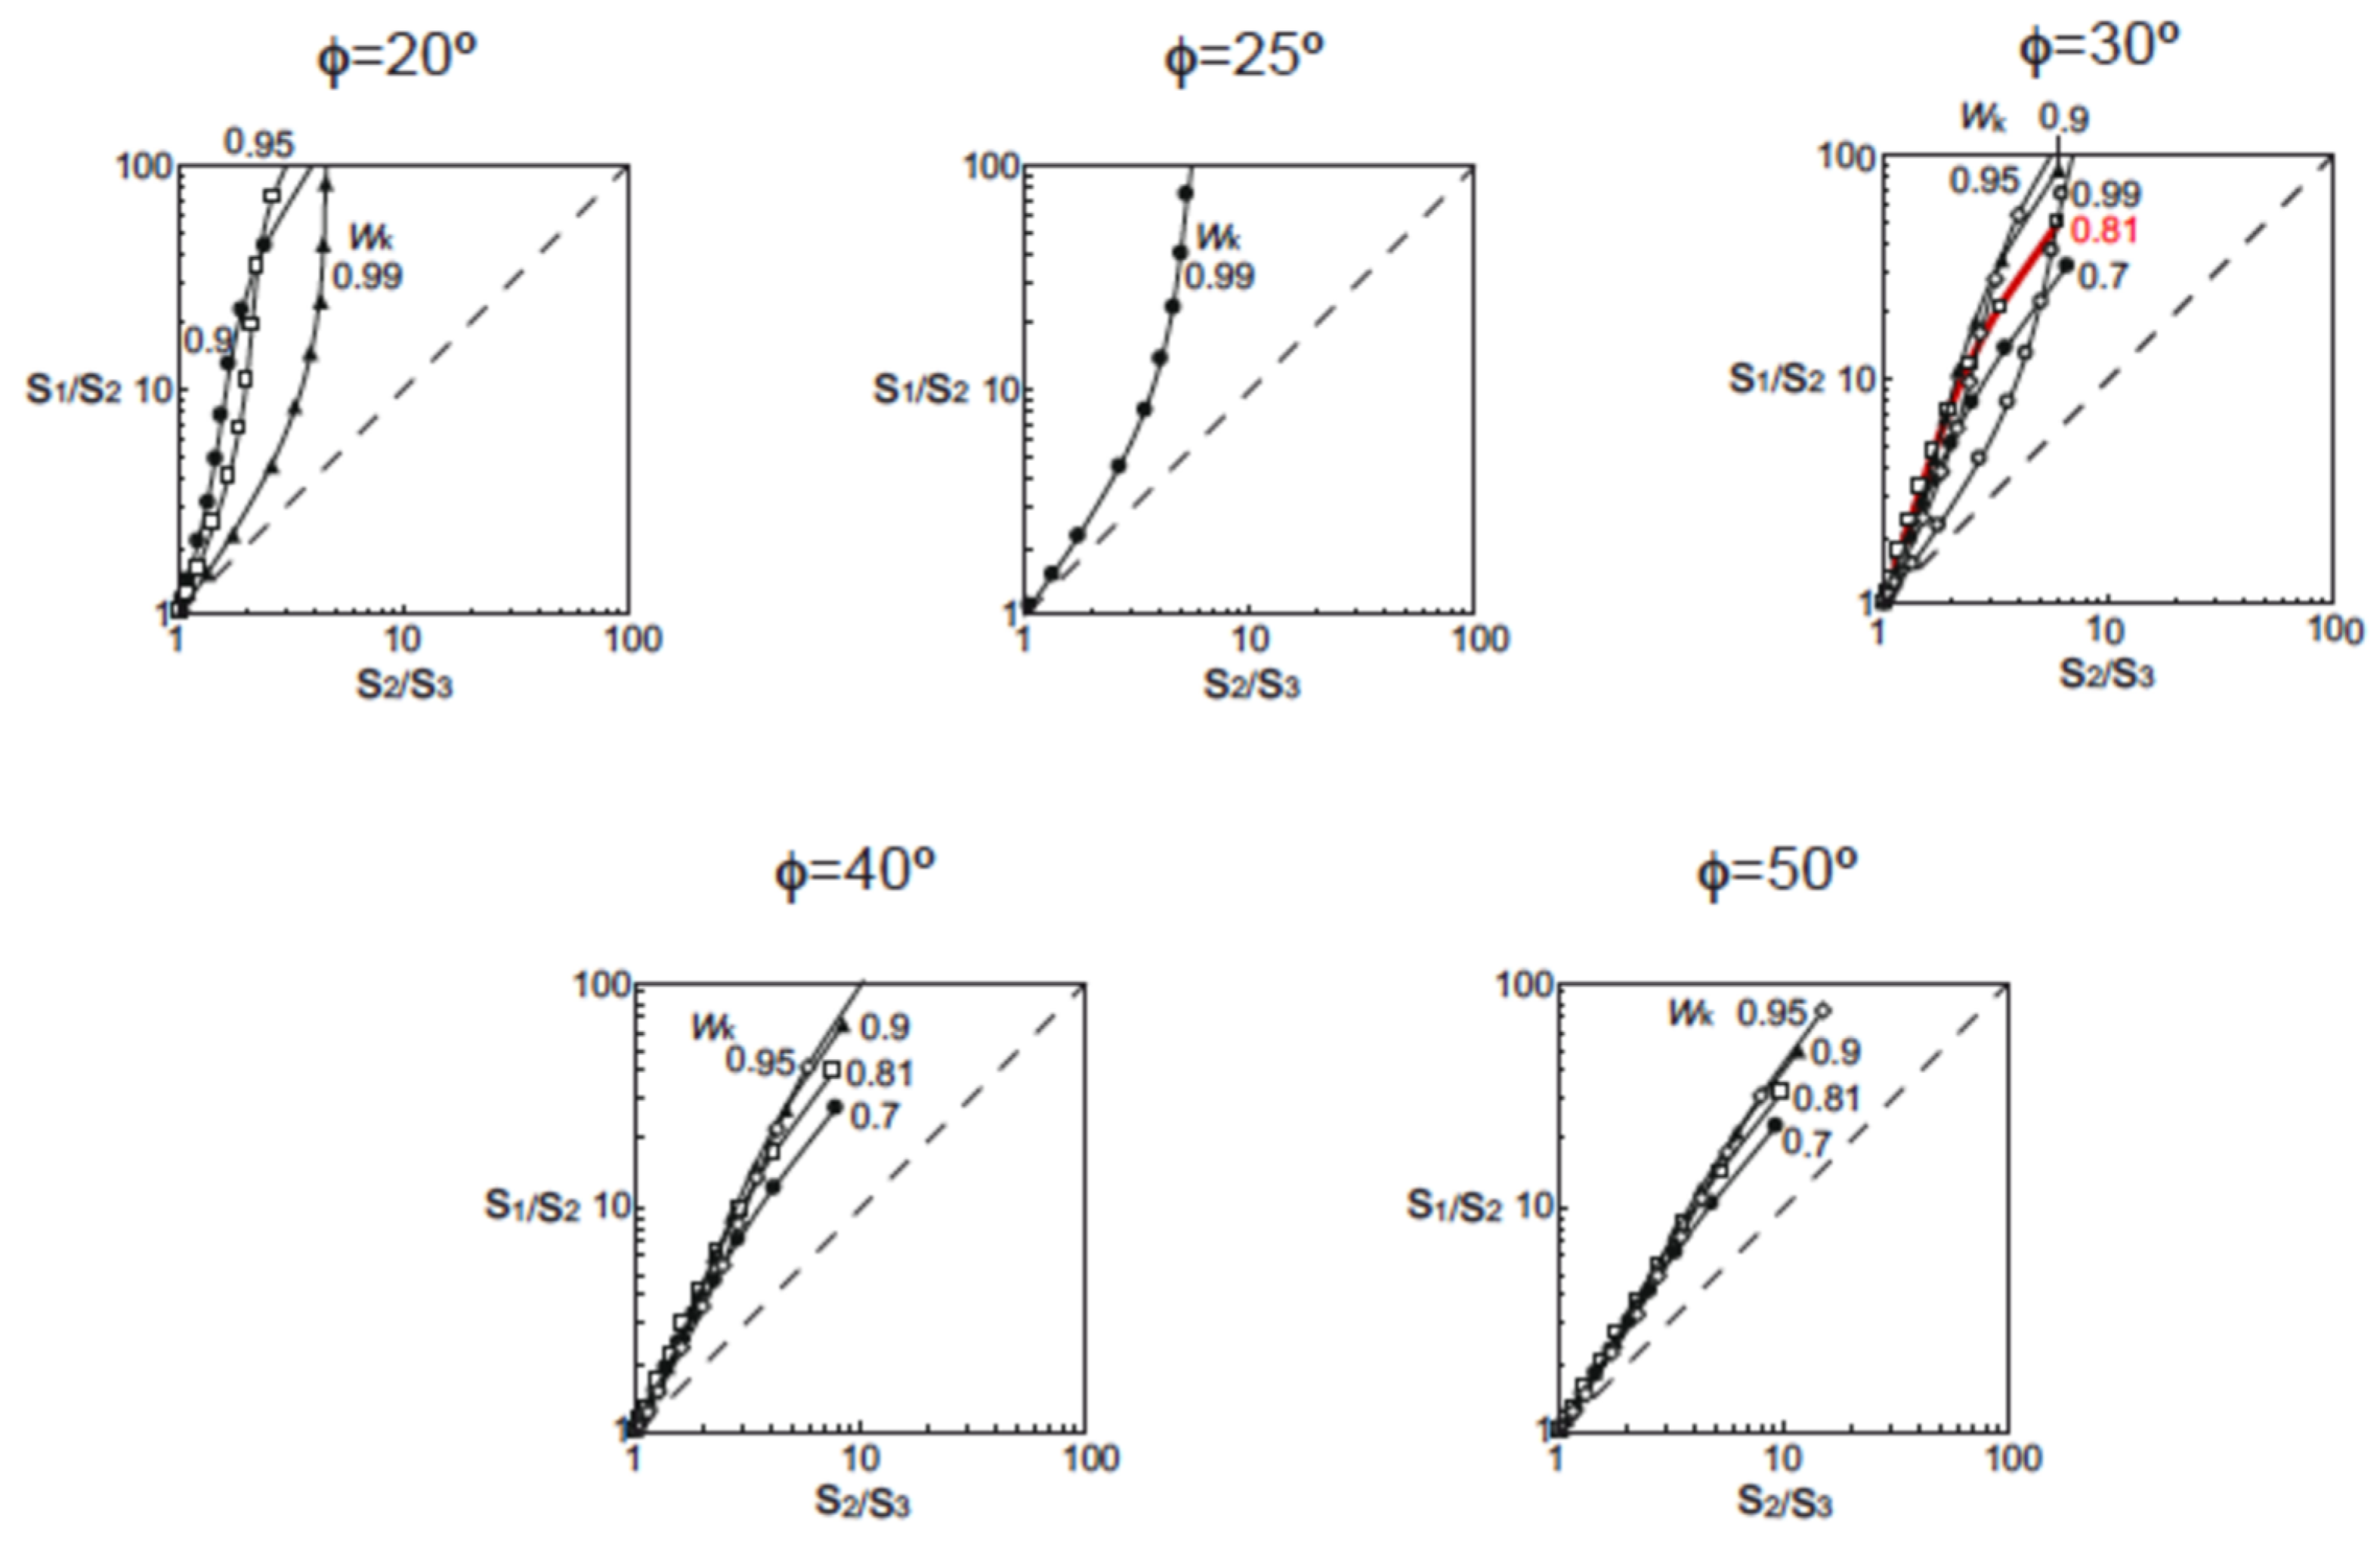
The strain logarithmic diagrams in Figure 7 show that, for the results of the application of the transtensional analytic model to the CAVA crossing El Salvador, both in the first increments (“infinitesimal”) of the strain history and for the clearly finite strain stages, the ellipsoid geometry is completely located at the apparent constriction field. That is especially evident, for example, for one of the best fits obtained (φ = 30° W and Wk = 0.81, red line in Figure 7) when the SZB is oriented N100° E/70° S. This result is consistent with the study of faults and focal mechanisms that show a good location of the X axis but an apparent mislocation of the Y and Z axes, which is the consequence of the constrictive style of the strain ellipsoids. As the faults and focal mechanisms study do not allow us to calculate the relative magnitude of the FSE axes, we cannot use this information as another step to test the model and a new constraint of the positive values range of the parameters involved. Nevertheless, it is possible to verify the compatibility regarding the general ellipsoid type between the model and nature. Therefore, it suggests that in the structural analysis of active shear zones, an effort must be focused on the determination of infinitesimal deformation since it is generally not easy to obtain information from finite deformation. In this sense, the construction of balanced cross sections with several orientations could help understand the deformation history of the region.

5.2. On the Contraction, Vertical Sink or “Sinkage”

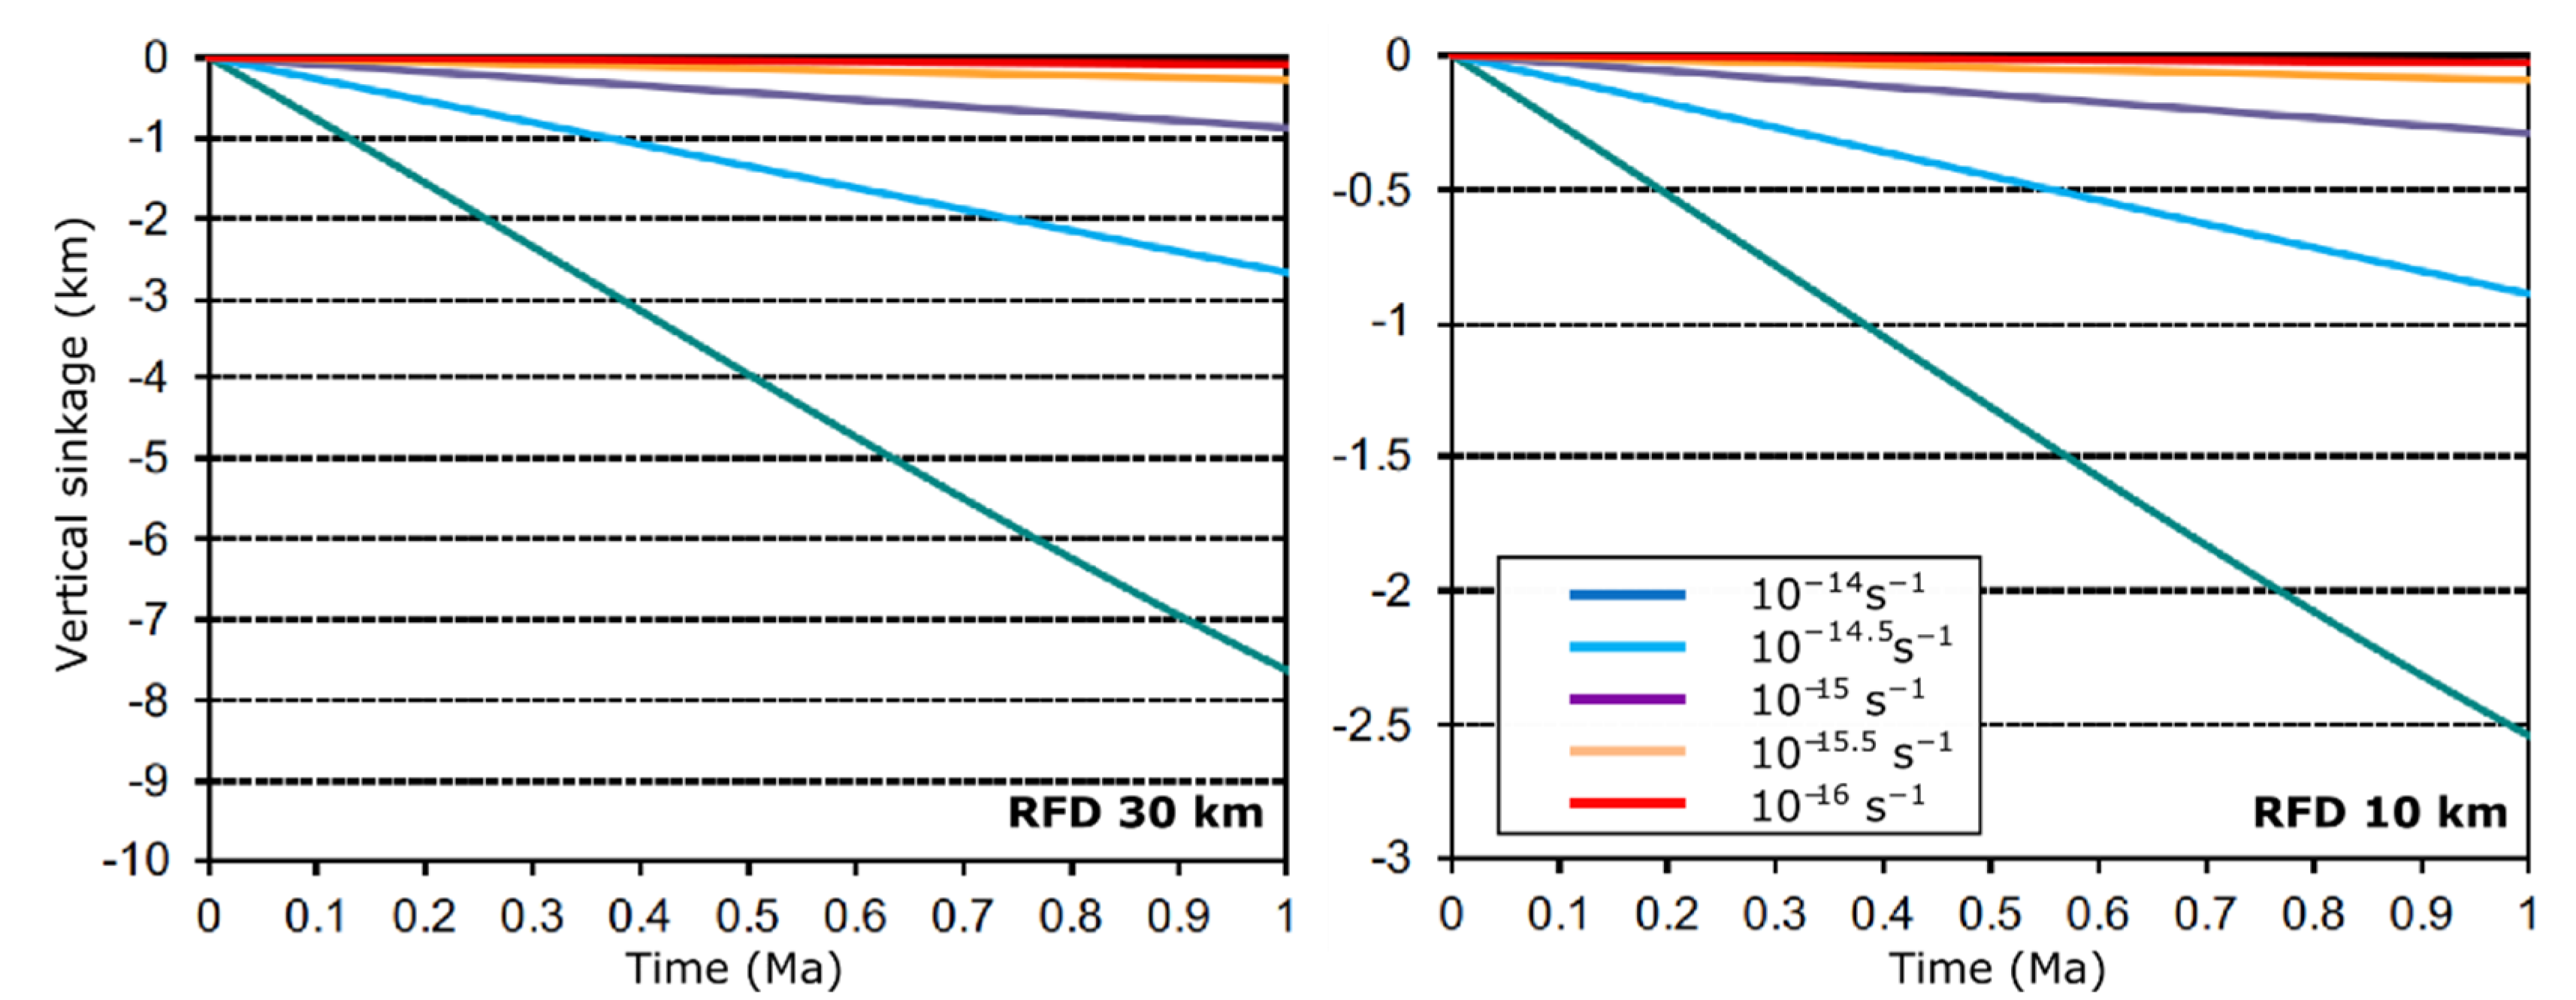
According to [73], it is possible to determine the vertical displacement produced in a shear zone under monoclinic transpression driven by the pure shear component (the “extrusion” for the transpression case). After simple modifications in the equations of the transpression model, it is possible to obtain the vertical displacement for transtension. In this case, vertical displacement is negative (vertical sinking or “sinkage”). The result for the ESFZ within the CAVA, regarding its geometrical and kinematic features and assuming a 30 km depth for the reference level (“rigid floor depth”, RFD), according to [74] data based on [75] data, we obtain the graphic in Figure 8. This graphic shows with colored lines the sinkage values for different strain rates (given in s−1) perpendicular to the SZB (assumed as N10° E or N190°). According to GPS values, the mean velocity is approximately 12 mm/yr, 10° oblique to the SZB [17,53]. Taking the 10° obliquity between the divergence direction and the SZB (as discussed above in the section dedicated to the explanation of Step 3), the current velocity perpendicular to the CAVA would be 2 mm/yr. Assuming a 20 km thickness of the volcanic arc (and the shear zone), we obtained a rate of 3 × 10⁻¹⁵ s−1–10−14.5 s−1. If this strain rate is extrapolated to the recent past of the CAVA, it would imply vertical sink rates of the shear zone of 2.7 km/Ma. We consider this value to be too high, and even if this sink must be compensated by the volcano-sedimentary fill of the basin, it still seems too high and does not correspond to the current topography or geological map information. Thus, we consider that some of the assumptions could not be correct: an explanation could be that the strain rates cannot be extrapolated due to changes in the velocity field (the lower velocities in the past imply lower sinkage); secondly, the reference depth (30 km) based on the little information available of the Moho may be not well constrained. If we consider standard crustal rheology for a volcanic arc, we should take a shallower reference depth, and thereby, the vertical sink would be lower. Taking 10 km depth of the RFD of 10 km (the third part of the considered above) and keeping the strain rates constant, the sinkage would be only 0.9 km/yr, which is a more realistic value and closer to the observations in nature. A thickness of only 10 km for RFD is possible if we visualize a deformable surface layer with that thickness lying on top of a more rigid level (for example, a more basic middle-lower crust). Due to the lack of more specific data about the rheological architecture of the crust in the ESFZ, a thickness of 10 km for the RFD should be considered as a mere hypothesis that, however, coincides with the geomorphic and sedimentary observations in the area under study.

5.3. On the Triclinic Strain Nature and the Tectonic History

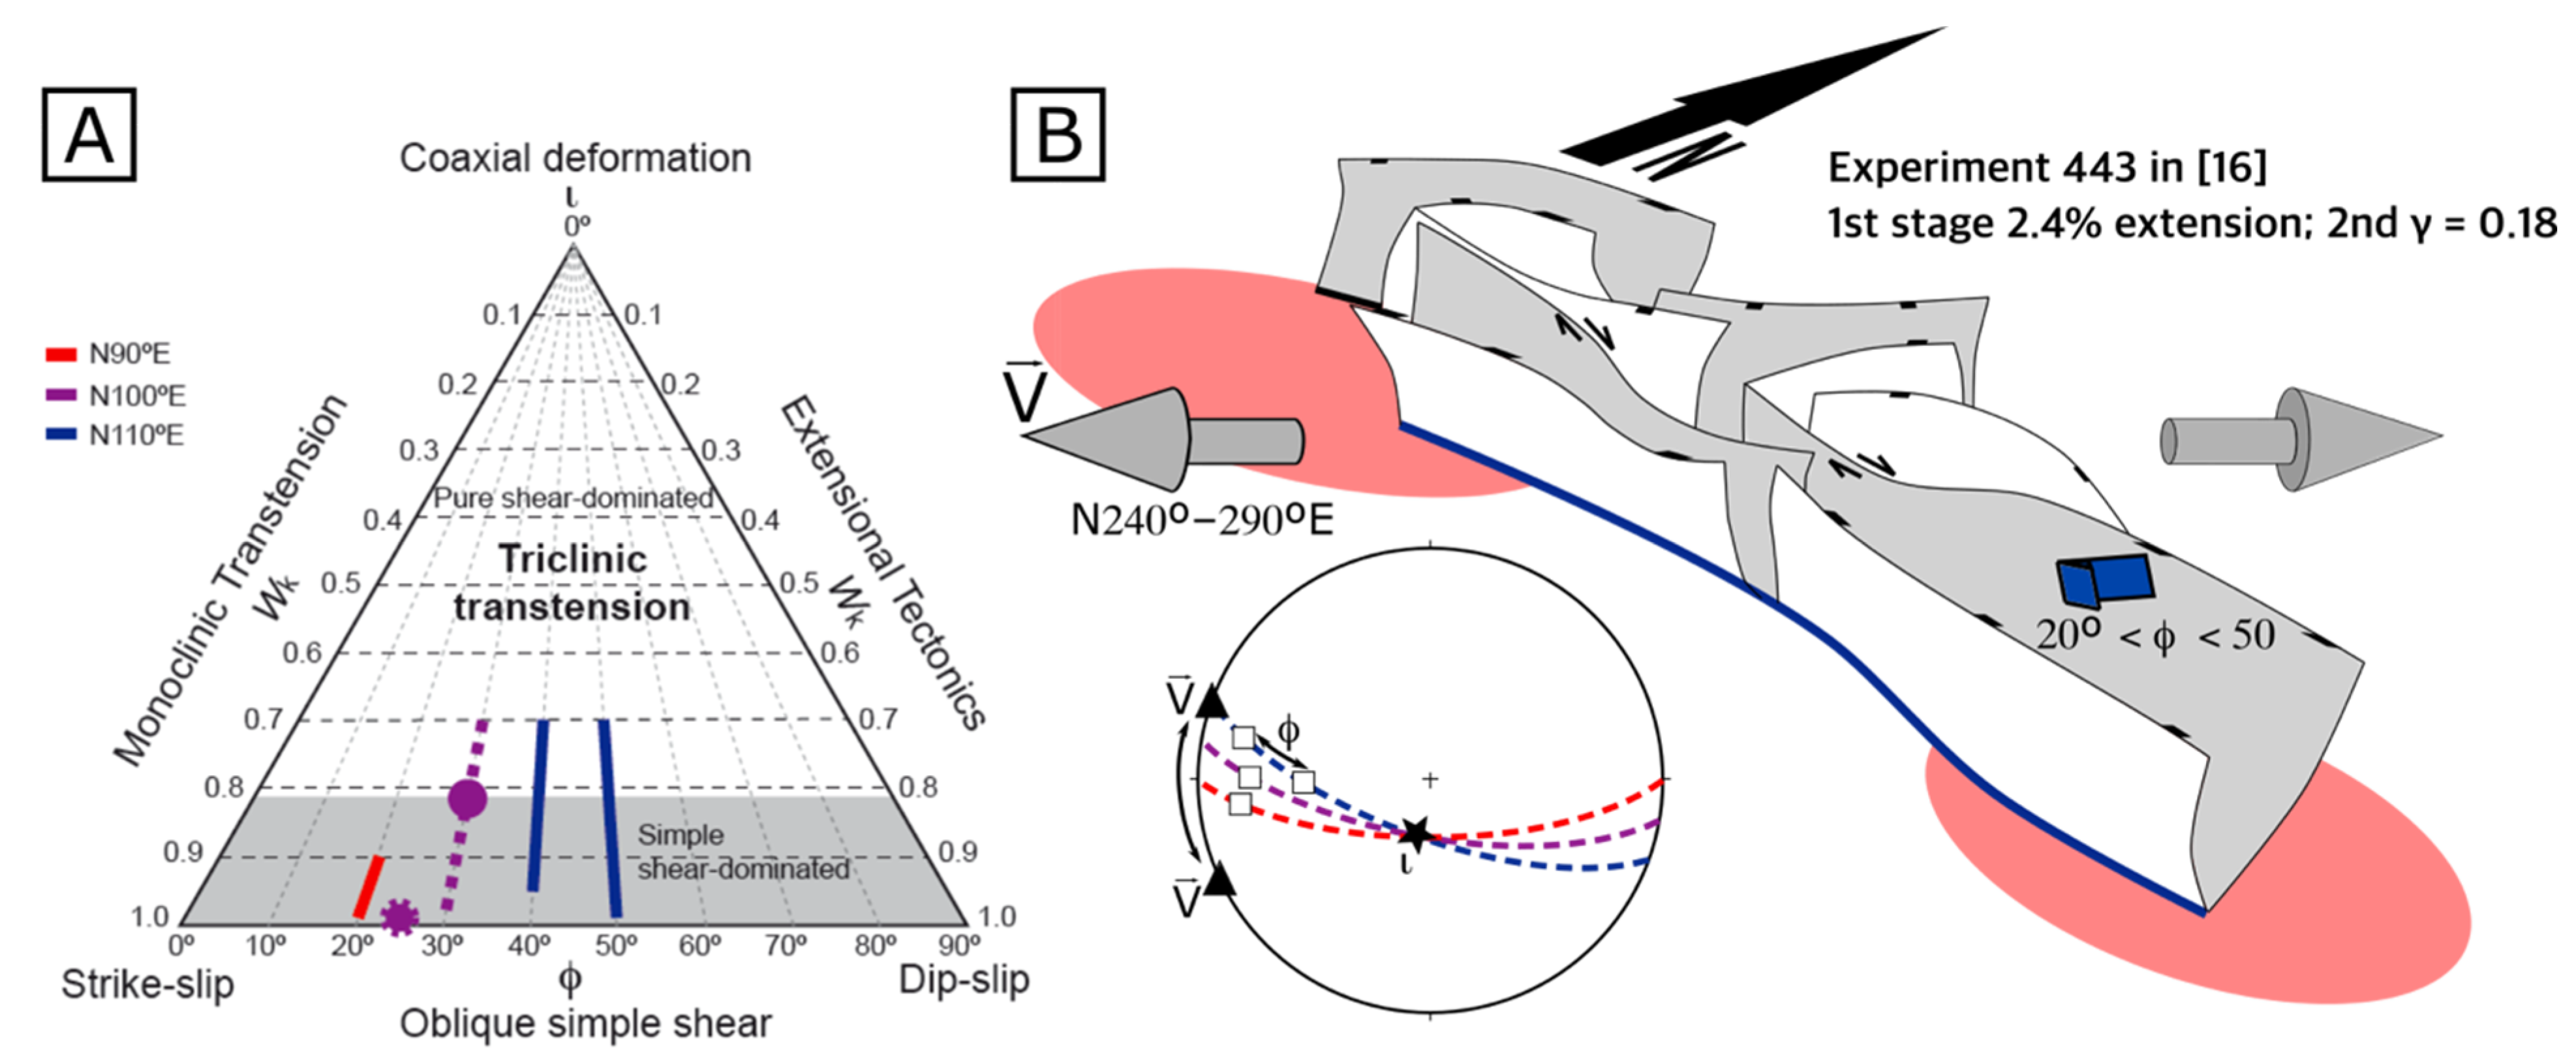
In Figure 9, we show a triangular diagram of [9] later modified by [12]. The representation of the best fits of the transtensional model to the ESFZ in this diagram helps to visualize the type of transtension acting in the CAVA. The results obtained for the ESFZ are represented inside the triangle of Figure 9, pointing to triclinic transtension and, more specifically, in the field of the simple-shear-dominated transtension or in the transition between simple shear/pure-shear-dominated transtension (Wk ≈ 0.81). Depending on the chosen strike of the deformation band, the simple shear obliquity varies from φ = 20° W (for ESFZ oriented N90° E) to φ ≈ 40–50° W for the segments oriented N110° E. Since the extrusion direction is 0°, both directions are neither perpendicular nor coincident, which automatically implies that we are dealing with a triclinic flow. The authors of [48] proposed that the main faults of the ESFZ could be inherited from the extensional stage related to a roll-back of the subducting slab under the Chortis Block. This extensional process has been experimentally tested by [16], who proposed a discontinuous weak zone associated with the CAVA segments as a necessary condition to reproduce structures similar to those mapped in ESFZ. The triclinic nature of the shear zone can be easily explained if we take into consideration the tectonic evolution of the ESFZ, with an extensional stage that preceded the current tectonics, in which the main faults with a southward dip were generated. Consequently, the current oblique divergence responsible for the transtension found an inclined weakness, and then, the flow in the shear zone has an inevitable triclinic nature. It is important to note at this point that a triclinic transtension does not require the presence of inclined deformation zones. In fact, Figure 3 shows a case of triclinic transtension schematically in a vertical deformation zone. However, it can be shown that if two blocks separated by a steep deformation zone undergo oblique divergence, then the simple shearing direction will be tilted with respect to the azimuth of the boundary of the deformation zone (angle φ ≠ 0°). In such cases, the relative arrangement between the single shear and extrusion directions will differ from 90° or 0°, resulting in triclinic flows. In the case of the ESFZ, the presence of a band of normal faults generated during a previous extensional phase ensures φ values other than 0° during the transtension stage studied in this work.
It is remarkable that for the most evident fault traces at the surface (San Vicente and El Triunfo Faults), which are N90° E oriented, the model-nature fits are notably worse than the ones obtained with the other orientations compared. According to the experimental results, [16] proposed that the weak zone had conditioned the location of “en-echelon” graben or semi-graben-like structures E–W oriented that were reactivated as strike-slip faults during the subsequent and current deformation phase, in which releasing structures are being developed by linking the main segments. When revising the experimental results, we can see that, in the brittle–ductile transition or even in the lower crust, after an extensional stage (2.4% of extension), during the second transcurrent stage (γ = 0.18), oblique shortcuts are produced by linking the main segments that are oriented N110° E (highlighted in blue in Figure 9). The kinematic results of this study might reflect the deformation of a broad crustal band (the entire CAVA) rather than displacement along local or accommodating structures on the surface. Another way to understand why the best results are obtained for N110° E strikes (rather than N90° E) is that this is the strike of the Middle American Trench in El Salvador and the forearc sliver motion promotes the growth of structures within this strike. Finally, the average azimuth of the ESFZ and the associated segment of the volcanic arc (white, dashed lines in Figure 2 and Figure 5) is also parallel to this best-fit azimuth (N110° E) found through the kinematic methodology presented in this work. In short, the model proposed in this work suggests a deformation partitioning in the ESFZ so that most of the crust was subjected to a triclinic transtension according to a deformation zone parallel to the general direction of the volcanic arc and the Middle American Trench (N110° E), whereas, near the surface, some of the previously generated graben and half-graben structures, with an approximate E–W orientation, were reactivated assuming strike-slip displacements.

6. Conclusions

The application of the analytic model of triclinic transtension to the ESFZ reveals that:
  • The flow type in the CAVA crossing El Salvador is triclinic, located in the simple-shear-dominated strain field or close to the transition between pure and simple shear (Wk ≥ 0.81). Depending on the strike of the shear zone, the simple shear obliquity (φ) varies from low to middle values; that is, a deflection (ζ) angle between 40° and 70°.
  • Triclinic transtension is explained if we consider the tectonic evolution of the ESFZ, preceded by an extensional stage that generated south dipping faults, and, as a consequence, the current divergence responsible for the transtension reactivated inclined planes resulting in the triclinic nature of the strain.
  • The deformation features in El Salvador make the constrain of very small deformation, nearly infinitesimal, crucial against the rather scarce evidence of finite strain. However, it is probable that the results might be narrowed down if balanced cross sections in several orientations were available or if data were obtained from fault rocks, veins or dikes that recorded progressive strain.

Supplementary Materials

The following supporting information can be downloaded at: https://www.mdpi.com/article/10.3390/geosciences12070266/s1, Documents S1: SM1.pdf; S2: SM2.pdf; S3: SM3.pdf.

Author Contributions

Conceptualization, J.A.-H., C.F., J.A.Á.-G., C.C. and J.J.M.-D.; Data Curation, C.F., J.A.-H. and A.S.; software, J.A.-H., C.F. and A.S.; validation, J.A.-H., C.F., J.A.Á.-G., C.C., A.S., M.D., W.H., Á.V.G. and J.J.M.-D.; formal analysis, J.A.-H. and C.F.; investigation, J.A.-H., C.F., J.A.Á.-G., C.C., A.S., M.D., W.H., Á.V.G. and J.J.M.-D.; resources, J.A.-H., C.F., J.A.Á.-G., C.C., A.S., M.D., W.H., Á.V.G. and J.J.M.-D.; data curation, J.A.-H., C.F., J.A.Á.-G., C.C., A.S., M.D., W.H., Á.V.G. and J.J.M.-D.; writing—original draft preparation, J.A.-H. and C.F.; writing—review and editing, J.A.-H., C.F. and J.A.Á.-G.; project administration, J.A.Á.-G. and J.J.M.-D.; funding acquisition, J.A.Á.-G. and J.J.M.-D. All authors have read and agreed to the published version of the manuscript.

Funding

This research was supported by the Spanish Research Agency, grants numbers: CGL2017–83931-C3-1-PQUAKESTEP, CGL2017-83931-C3-3-P GEOACTIVA and PGC2018-096534-B-I00 IBERCRUST.

Data Availability Statement

Not applicable.

Acknowledgments

We thank the Geological Survey from the MARN in El Salvador (Observatorio Ambiental, Ministerio de Medio Ambiente) for their assistance in field campaigns. Special thanks to Griselda Marroquin and Douglas Hernández for their helpful assistance and constructive comments that inspired the ideas included in the paper. We acknowledge the constructive comments of three anonymous reviewers that have served to substantially improve the original manuscript. We thank Marta Castilla for reviewing the English of the final version of the paper.

Conflicts of Interest

The authors declare no conflict of interest.

References

  1. Harland, W.B. Tectonic transpression in Caledonian Spitsbergen. Geol. Mag. 1971, 108, 27–41. [Google Scholar] [CrossRef]
  2. Sanderson, D.J.; Marchini, W.R.D. Transpression. J. Struct. Geol. 1984, 6, 449–458. [Google Scholar] [CrossRef]
  3. Fossen, H.; Tikoff, B. The deformation matrix for simultaneous simple shearing, pure shearing and volume change, and its application to transpression-transtension tectonics. J. Struct. Geol. 1993, 15, 413–422. [Google Scholar] [CrossRef]
  4. Jiang, D.; Williams, P.F. High-strain zones: A unified model. J. Struct. Geol. 1998, 20, 1105–1120. [Google Scholar] [CrossRef]
  5. Lin, S.; Jiang, D. Using along-strike variation in strain and kinematics to define the movement direction of curved transpressional shear zones: An example from northwestern Superior Province, Manitoba. Geology 2001, 29, 767–770. [Google Scholar] [CrossRef]
  6. Lin, S.; Jiang, D.; Williams, P.F. Transpression (or transtension) zones of triclinic symmetry: Natural example and theoretical modeling. In Continental Transpression and Transtension Tectonics; Holdsworth, R.E., Strachan, R.A., Dewey, J.F., Eds.; Special Publication; Geological Society: London, UK, 1998; Volume 135, pp. 41–57. [Google Scholar]
  7. Czeck, D.M.; Hudleston, P.J. Testing models for obliquely plunging lineations in transpression: A natural example and theoretical discussion. J. Struct. Geol. 2003, 25, 959–982. [Google Scholar] [CrossRef]
  8. Díaz-Azpiroz, M.D.; Fernández, C. Kinematic analysis of the southern Iberian shear zone and tectonic evolution of the Acebuches metabasites (SW Variscan Iberian Massif). Tectonics 2005, 24, TC3010. [Google Scholar] [CrossRef]
  9. Jones, R.R.; Holdsworth, R.; Clegg, P.; McCaffrey, K.; Tavarnelli, E. Inclined transpression. J. Struct. Geol. 2004, 26, 1531–1548. [Google Scholar] [CrossRef]
  10. Fernández, C.; Díaz-Azpiroz, M.D. Triclinic transpression zones with inclined extrusion. J. Struct. Geol. 2009, 31, 1255–1269. [Google Scholar] [CrossRef]
  11. Toy, V.; Norris, R.; Prior, D.; Walrond, M.; Cooper, A. How do lineations reflect the strain history of transpressive shear zones? The example of the active Alpine Fault zone, New Zealand. J. Struct. Geol. 2013, 50, 187–198. [Google Scholar] [CrossRef]
  12. Díaz-Azpiroz, M.; Barcos, L.; Balanyá, J.C.; Fernández, C.; Expósito, I.; Czeck, D.M. Applying a general triclinic transpression model to highly partitioned brittle-ductile shear zones: A case study from the Torcal de Antequera massif, external Betics, southern Spain. J. Struct. Geol. 2014, 68, 316–336. [Google Scholar] [CrossRef]
  13. Alonso-Henar, J.; Fernánadez, C.; Martínez-Díaz, J.J. Application of the analytic model of general triclinic trans- pression with oblique extrusion to an active deformation zone: The Alhama de Murcia Fault (SE Iberian Peninsula). J. Struct. Geol. 2020, 130, 103924. [Google Scholar] [CrossRef]
  14. Yang, R.; Jiang, D.; Lu, L.X. Constrictional strain and linear fabrics as a result of deformation partitioning: A multiscale modeling investigation and tectonic significance. Tectonics 2019, 38, 2829–2849. [Google Scholar] [CrossRef]
  15. Martínez-Díaz, J.; Álvarez-Gómez, J.; Benito, B.; Hernández, D. Triggering of destructive earthquakes in El Salvador. Geology 2004, 32, 65–68. [Google Scholar] [CrossRef] [Green Version]
  16. Alonso-Henar, J.; Schreurs, G.; Martínez-Díaz, J.J.; Álvarez-Gómez, J.A.; Villamor, P. Neotectonic development of the El Salvador Fault Zone and implications for deformation in the Central America Volcanic Arc. Insights from 4D analogue modeling experiments. Tectonics 2015, 34, 133–151. [Google Scholar] [CrossRef] [Green Version]
  17. Staller, A.; Martínez-Díaz, J.J.; Benito, B.; Alonso-Henar, J.; Hernández, D.; Hernández-Rey, R.; Díaz, M. Present-day crustal deformation along the El Salvador Fault Zone from ZFESNet GPS network. Tectonophysics 2016, 670, 66–81. [Google Scholar] [CrossRef] [Green Version]
  18. Alonso-Henar, J.; Álvarez-Gómez, J.A.; Martínez-Díaz, J.J. Constraints for the recent tectonics of the El Salvador Fault Zone, Central America Volcanic Arc, from morphotectonic analysis. Tectonophysics 2014, 623, 1–13. [Google Scholar] [CrossRef]
  19. Garibaldi, N.; Tikoff, B.; Hernandez, W. Neotectonic deformation within an extensional stepover in El Salvador magmatic arc, Central America: Implication for the interaction of arc magmatism and deformation. Tectonophysics 2016, 693, 327–339. [Google Scholar] [CrossRef]
  20. Rogers, R.D.; Mann, P.; Emmet, P.A. Tectonic Terranes of the Chortis Block Based on Integration of Regional Aeromagnetic and Geologic data, en Geologic and Tectonic De-velopment of the Caribbean Plate in Northern Central America; Mann, P.P., Ed.; GSA Special Paper; Geological Society of America: Boulder, CO, USA, 2007; Volume 428, pp. 65–88. [Google Scholar]
  21. Plafker, G. Tectonic Aspects of the Guatemala Earthquake of 4 February 1976. Science 1976, 193, 1201–1208. [Google Scholar] [CrossRef]
  22. Guzmán-Speziale, M.; Molina, E. Seismicity and seismically active faulting of Guatemala: A review. J. South Am. Earth Sci. 2022, 115, 103740. [Google Scholar] [CrossRef]
  23. Garnier, B.; Tikoff, B.; Flores, O.; Jicha, B.; DeMets, C.; Cosenza-Muralles, B.; Hernandez, W.; Greene, D. Deformation in western Guatemala associated with the NAFCA (North America-Central American Forearc-Caribbean) triple junction: Neotectonic strain localization into the Guatemala City graben. Tectonics 2022, 41, e2021TC006739. [Google Scholar] [CrossRef]
  24. Muehlberger, W.R.; Ritchie, A.W. Caribbean–Americas plate boundary in Guatemala and southern Mexico as seen on Skylab IV orbital photography. Geology 1975, 3, 232–235. [Google Scholar] [CrossRef]
  25. Gordon, M.B.; Muehlberger, W.R. Rotation of the Chortís block causes dextral slip on the Guayape fault. Tectonics 1994, 13, 858–872. [Google Scholar] [CrossRef]
  26. Garnier, B.; Tikoff, B.; Flores, O.; Jicha, B.; DeMets, C.; Cosenza-Muralles, B.; Hernandez, D.; Marroquin, G.; Mixco, L.; Hernandez, W. An integrated structural and GPS study of the Jalpatagua fault, southeastern Guatemala. Geosphere 2021, 17, 201–225. [Google Scholar] [CrossRef]
  27. Corti, G.; Carminati, E.; Mazzarini, F.; Garcia, M.O. Active strike-slip faulting in El Salvador, Central America. Geology 2005, 33, 989–992. [Google Scholar] [CrossRef]
  28. Canora, C.; Martínez-Díaz, J.J.; Villamor, P.; Berryman, K.; Álvarez-Gómez, J.A.; Pullinger, C.; Capote, R. Geological and seismological analysis of the Mw 6.6 13th February 2001 El Salvador earthquake: Evidence for surface rupture and implications for seismic hazard. Bull. Seismol. Soc. Am. 2010, 100, 2873–2890. [Google Scholar] [CrossRef] [Green Version]
  29. McBirney, A.R.; Williams, H. Volcanic History of Nicaragua; University of California Publications in Geological Sciences: Berkeley, CA, USA, 1965; Volume 55, p. 73. [Google Scholar]
  30. Wyk de Vries, B.V. Tectonics and magma evolution of Nicaraguan volcanic systems. Ph.D. Thesis, Open University, Milton Keynes, UK, 1993. [Google Scholar]
  31. La Femina, P.C.; Dixon, T.H.; Strauch, W. Bookshelf faulting in Nicaragua. Geology 2002, 30, 751–754. [Google Scholar] [CrossRef]
  32. DeMets, C. A new estimate for present-day Cocos-Caribbean Plate motion: Implications for slip along the Central American Volcanic Arc. Geophys. Res. Lett. 2001, 28, 4043–4046. [Google Scholar] [CrossRef] [Green Version]
  33. Guzmán-Speziale, M.; Gómez, J.M. Comment on “A new estimate for present-day Cocos-Caribbean plate motion: Implications for slip along the Central American volcanic arc” by Charles DeMets. Geophys. Res. Lett. 2002, 29, 1945. [Google Scholar] [CrossRef]
  34. Álvarez-Gómez, J.A.; Meijer, P.T.; Martínez-Díaz, J.J.; Capote, R. Constraints from finite element modeling on the active tectonics of northern Central America and the Middle America Trench. Tectonics 2008, 27, TC1008. [Google Scholar] [CrossRef]
  35. Guzmán-Speziale, M.; Valdés-González, C.; Molina, E.; Gómez, J.M. Seismic activity along the central america volcanic arc: Is it related to subduction of the Cocos plate? Tectonophysics 2005, 400, 241–254. [Google Scholar] [CrossRef]
  36. Norabuena, E.; Dixon, T.H.; Schwartz, S.; Deshon, H.; Newman, A.; Protti, M.; Gonzalez, V.; Dorman, L.; Flueh, E.R.; Lundgren, P.; et al. Geodetic and seismic constraints on some seismogenic zone processes in Costa Rica. J. Geophys. Res. Earth Surf. 2004, 109. [Google Scholar] [CrossRef]
  37. LaFemina, P.; Dixon, T.H.; Govers, R.; Norabuena, E.; Turner, H.; Saballos, A.; Mattioli, G.; Protti, M.; Strauch, W. Fore-arc motion and Cocos Ridge collision in Central America. Geochem. Geophys. Geosyst. 2009, 10. [Google Scholar] [CrossRef] [Green Version]
  38. Alvarez-Gomez, J.; Staller-Vazquez, A.; Martínez-Díaz, J.; Canora, C.; Alonso-Henar, J.; Insúa-Arévalo, J.; Bejar-Pizarro, M. Push-pull Driving of the Central America Forearc in the Context of the Cocos-Caribbean-North America Triple Junction. Sci. Rep. 2019, 9, 11164. [Google Scholar] [CrossRef] [Green Version]
  39. Rodriguez, M.; DeMets, C.; Rogers, R.; Tenorio, C.; Hernandez, D. A GPS and modelling study of deformation in northern Central America. Geophys. J. Int. 2009, 178, 1733–1754. [Google Scholar] [CrossRef] [Green Version]
  40. Alvarado, D.; DeMets, C.; Tikoff, B.; Hernández, D.; Wawrzyniec, T.; Pullinger, C.; Mattioli, G.; Turner, H.; Rodriguez, M.; Correa-Mora, F. Forearc motion and deformation between El Salvador and Nicaragua: GPS, seismic, structural, and paleomagnetic observations. Lithosphere 2011, 3, 3–21. [Google Scholar] [CrossRef] [Green Version]
  41. Correa-Mora, F.; DeMets, C.; Alvarado, D.; Turner, H.L.; Mattioli, G.; Hernandez, D. GPS-derived coupling estimates for Central America subduction zone and volcanic arc faults: El Salvador, Honduras and Nicaragua. Geophys. J. Int. 2009, 179, 1279–1291. [Google Scholar] [CrossRef] [Green Version]
  42. Franco, A.; Lasserre, C.; Lyon-Caen, H.; Kostoglodov, V.; Molina, E.; Guzman-Speziale, M.; Monterosso, D.; Robles, V.; Figueroa, C.; Amaya, W.; et al. Fault kinematics in northern Central America and coupling along the subduction interface of the Cocos Plate, from GPS data in Chiapas (Mexico), Guatemala and El Salvador. Geophys. J. Int. 2012, 189, 1223–1236. [Google Scholar] [CrossRef] [Green Version]
  43. DeMets, C.; Gordon, R.G.; Argus, D.F. Geologically current plate motions. Geophys. J. Int. 2010, 181, 1–80. [Google Scholar] [CrossRef] [Green Version]
  44. Siebert, L.; Simkin, T. 2002–Present. Volcanoes of the World: An Illustrated Catalog of Holocene Volcanoes and Their Eruptions. Smithsonian Institution. Global Volcanism Program Digital Information Series, GVP-3. Available online: http://www.volcano.si.edu (accessed on 27 March 2022).
  45. Agostini, S.; Corti, G.; Doglioni, C.; Carminati, E.; Innocenti, F.; Tonarini, S.; Manetti, P.; Di Vincenzo, G.; Montanari, D. Tectonic and magmatic evolution of the active volcanic front in El Salvador: Insight into the Berlín and Ahuachapán geothermal areas. Geothermics 2006, 35, 368–408. [Google Scholar] [CrossRef]
  46. Funk, J.; Mann, P.; McIntosh, K.; Stephens, J. Cenozoic tectonics of the Nicaraguan depression, Nicaragua, and Median Trough, El Salvador, based on seismic-reflection profiling and remote-sensing data. GSA Bull. 2009, 121, 1491–1521. [Google Scholar] [CrossRef]
  47. Canora, C.; Villamor, P.; Martínez-Díaz, J.J.; Berryman, K.; Álvarez-Gómez, J.A.; Capote, R.; Hernández, W. Paleoseismic analysis of the San Vicente segment of the El Salvador Fault Zone, El Salvador, Central America. Geol. Acta 2012, 10, 103–123. [Google Scholar]
  48. Canora, C.; Martínez-Díaz, J.; Villamor, P.; Staller, A.; Berryman, K.; Alvarez-Gomez, J.; Capote, R.; Diaz, M. Structural evolution of the El Salvador Fault Zone: An evolving fault system within a volcanic arc. J. Iber. Geol. 2014, 40, 471–488. [Google Scholar] [CrossRef] [Green Version]
  49. Alonso-Henar, J.; Álvarez-Gómez, J.A.; Martínez-Díaz, J.J. Neogene-quaternary evolution from transpressional to transtensional tectonics in Northern Central America controlled by cocos: Caribbean subduction coupling change. J. Iber. Geol. 2017, 43, 519–538. [Google Scholar] [CrossRef]
  50. Cepeda, J.M.; Benito, M.B.; Burgos, E.A. Strong-Motion Characteristics of January and February 2001 Earthquakes in El Salvador. In Natural Hazards in El Salvador; Rose, W.I., Bommer, J.J., López, D.L., Carr, M.J., Major, J.J., Eds.; Geological Society of America Special Paper: Boulder, CO, USA, 2014; Volume 375, pp. 405–421. [Google Scholar]
  51. Alonso-Henar, J.; Benito, B.; Staller, A.; Álvarez-Gómez, J.A.; Martínez-Díaz, J.J.; Canora, C. Large-magnitude crustal seismic sources in El Salvador and deterministic hazard scenarios. Eng. Geol. 2018, 243, 70–83. [Google Scholar] [CrossRef]
  52. Martínez-Díaz, J.J.; Alvarez-Gomez, J.A.; Staller, A.; Alonso-Henar, J.; Canora, C.; Insúa-Arevalo, J.M.; Tsige, M.; Villamor, P.; Herrero-Barbero, P.; Hernandez-Moreno, C.; et al. Active faults of El Salvador. J. S. Am. Earth Sci. 2021, 105, 103038. [Google Scholar] [CrossRef]
  53. Ellis, A.; DeMets, C.; McCaffrey, R.; Briole, P.; Cosenza Muralles, B.; Flores, O.; Guzmán-Speziale, M.; Hernández, D.; Kostoglodov, V.; LaFemina, P.; et al. GPS constraints on deformation in northern Central America from 1999 to 2017, Part 2: Block rotations and fault slip rates, fault locking and distributed deformation. Geophys. J. Int. 2019, 218, 729–754. [Google Scholar] [CrossRef] [Green Version]
  54. Fernández, C.; Czeck, D.M.; Díaz Azpiroz, M. Testing the model of oblique transpression with oblique extrusion in two natural cases: Steps and consequences. J. Struct. Geol. 2013, 54, 85–102. [Google Scholar] [CrossRef]
  55. Jones, R.R.; Holdsworth, R.E. Oblique simple shear in transpression regimes. In Continental Transpression and Transtension Tectonics; Holdsworth, R.E., Strachan, R.A., Dewey, J.F., Eds.; Special Publication; Geological Society: London, UK, 1998; Volume 135, pp. 35–40. [Google Scholar]
  56. Dias, R.; Ribeiro, A. Constriction in a transpressive regime: An example in the Iberian branch of the Ibero-Armorican arc. J. Struct. Geol. 1994, 16, 1543–1554. [Google Scholar] [CrossRef]
  57. Sullivan, W.; Law, R. Deformation path partitioning within the transpressional White Mountain shear zone, California and Nevada. J. Struct. Geol. 2007, 29, 583–598. [Google Scholar] [CrossRef]
  58. Nabavi, S.T.; Díaz-Azpiroz, M.; Talbot, C. Inclined transpression in the Neka Valley, eastern Alborz, Iran. Geol. Rundsch. 2016, 106, 1815–1840. [Google Scholar] [CrossRef]
  59. Nabavi, S.T.; Alavi, S.A.; Díaz-Azpiroz, M.; Mohammadi, S.; Ghassemi, M.R.; Fernández, C.; Barcos, L.; Frehner, M. Deformation mechanics in inclined, brittle-ductile transpression zones: Insights from 3D finite element modelling. J. Struct. Geol. 2020, 137, 104082. [Google Scholar] [CrossRef]
  60. Ramsay, J.G. Folding and Fracturing of Rocks; McGraw-Hill: New York, NY, USA, 1967. [Google Scholar]
  61. Marrett, R.; Allmendinger, R.W. Kinematic analysis of fault-slip data. J. Struct. Geol. 1990, 12, 973–986. [Google Scholar] [CrossRef]
  62. Peraldo, G.; Montero, W. Sismología Histórica de América Central; Instituto Panamericano de Geografía e Historia: Mexico City, Mexico, 1999; Volume 513, pp. 1–347. [Google Scholar]
  63. Álvarez-Gómez, J.A. FMC—Earthquake focal mechanisms data management, cluster and classification. SoftwareX 2019, 9, 299–307. [Google Scholar] [CrossRef]
  64. Kostrov, V.V. Seismic moment and energy of earthquakes, and seismic flow of rock. Izv. Acad. Sci. USSR Phys. Solid Earth 1974, 1, 23–44. [Google Scholar]
  65. Watson, D.F. ACORD: Automatic contourning of raw data. Comput. Geosci. 1982, 8, 97–101. [Google Scholar] [CrossRef]
  66. Wessel, P.; Luis, J.F.; Uieda, L.; Scharroo, R.; Wobbe, F.; Smith, W.H.F.; Tian, D. The Generic Mapping Tools Version 6. Geochem. Geophys. Geosyst. 2019, 20, 5556–5564. [Google Scholar] [CrossRef] [Green Version]
  67. Feigl, K.L.; King, R.W.; Jordan, T.H. Geodetic measurement of tectonic deformation in the Santa Maria Fold and Thrust Belt, California. J. Geophys. Res. Earth Surf. 1990, 95, 2679–2699. [Google Scholar] [CrossRef]
  68. Bosse, H.R.; Lorenz, W.; Merino, A.; Mihm, A.; Rode, K.; Schmidt-Thome, M.; Weber, H.S.; Wiesemann, G. Carta Geológica de la República de El Salvador (Centroamérica), vol. 1. 100,000. Maps I to VI; Herausgegeben von der Bunderstalt fur Geowissenschaften und Rohstoffe: Hannover, Germany, 1976. [Google Scholar]
  69. Jicha, B.R.; Hernández, W. Effusive and explosive eruptive history of the Ilopango caldera complex, El Salvador. J. Volcanol. Geotherm. Res. 2021, 421, 107426. [Google Scholar] [CrossRef]
  70. Lexa, J.; Šebesta, J.; Alexander, C.J.; Hernández, W.; Pécskay, W. Geology and volcanic evolution in the southern part of the San Salvador Metropolitan Area. J. Geosci. 2010, 56, 105–140. [Google Scholar] [CrossRef] [Green Version]
  71. Suñe-Puchol, I.; Aguirre-Díaz, G.J.; Dávila-Harris, P.; Miggins, D.P.; Pedrazzi, D.; Costa, A.; Ortega-Obregón, C.; Lacan, P.; Hernández, W.; Gutiérrez, E. The Ilopango caldera complex, El Salvador: Origin and early ignimbrite-forming eruptions of a graben/pull-apart caldera structure. J. Volcanol. Geotherm. Res. 2019, 371, 1–19. [Google Scholar] [CrossRef]
  72. Truesdell, C.A. The Kinematic of Vorticity; Indiana University Press: Bloomington, IN, USA, 1954. [Google Scholar]
  73. Schulmann, K.; Thompson, A.B.; Lexa, O.; Jezek, J. Strain distribution and fabric development modeled in active and transient transpressive zones. J. Geophys. Res. 2003, 108, ETG6-1. [Google Scholar]
  74. Manea, V.C.; Manea, M.; Ferrari, L. A geodynamical perspective on the subduction of Cocos and Rivera plates beneath Mexico and Central America. Tectonophysics 2013, 609, 56–81. [Google Scholar] [CrossRef]
  75. Reguzzoni, M.; Sampietro, D. Moho estimation using GOCE data: A numerical simulation. In International Association of Geodesy Symposia, “Geodesy for Planet Earth”; Kenyon, S.C., Pacino, M.C., Marti, U.J., Eds.; Springer: Berlin, Germany, 2012; Volume 136. [Google Scholar] [CrossRef]
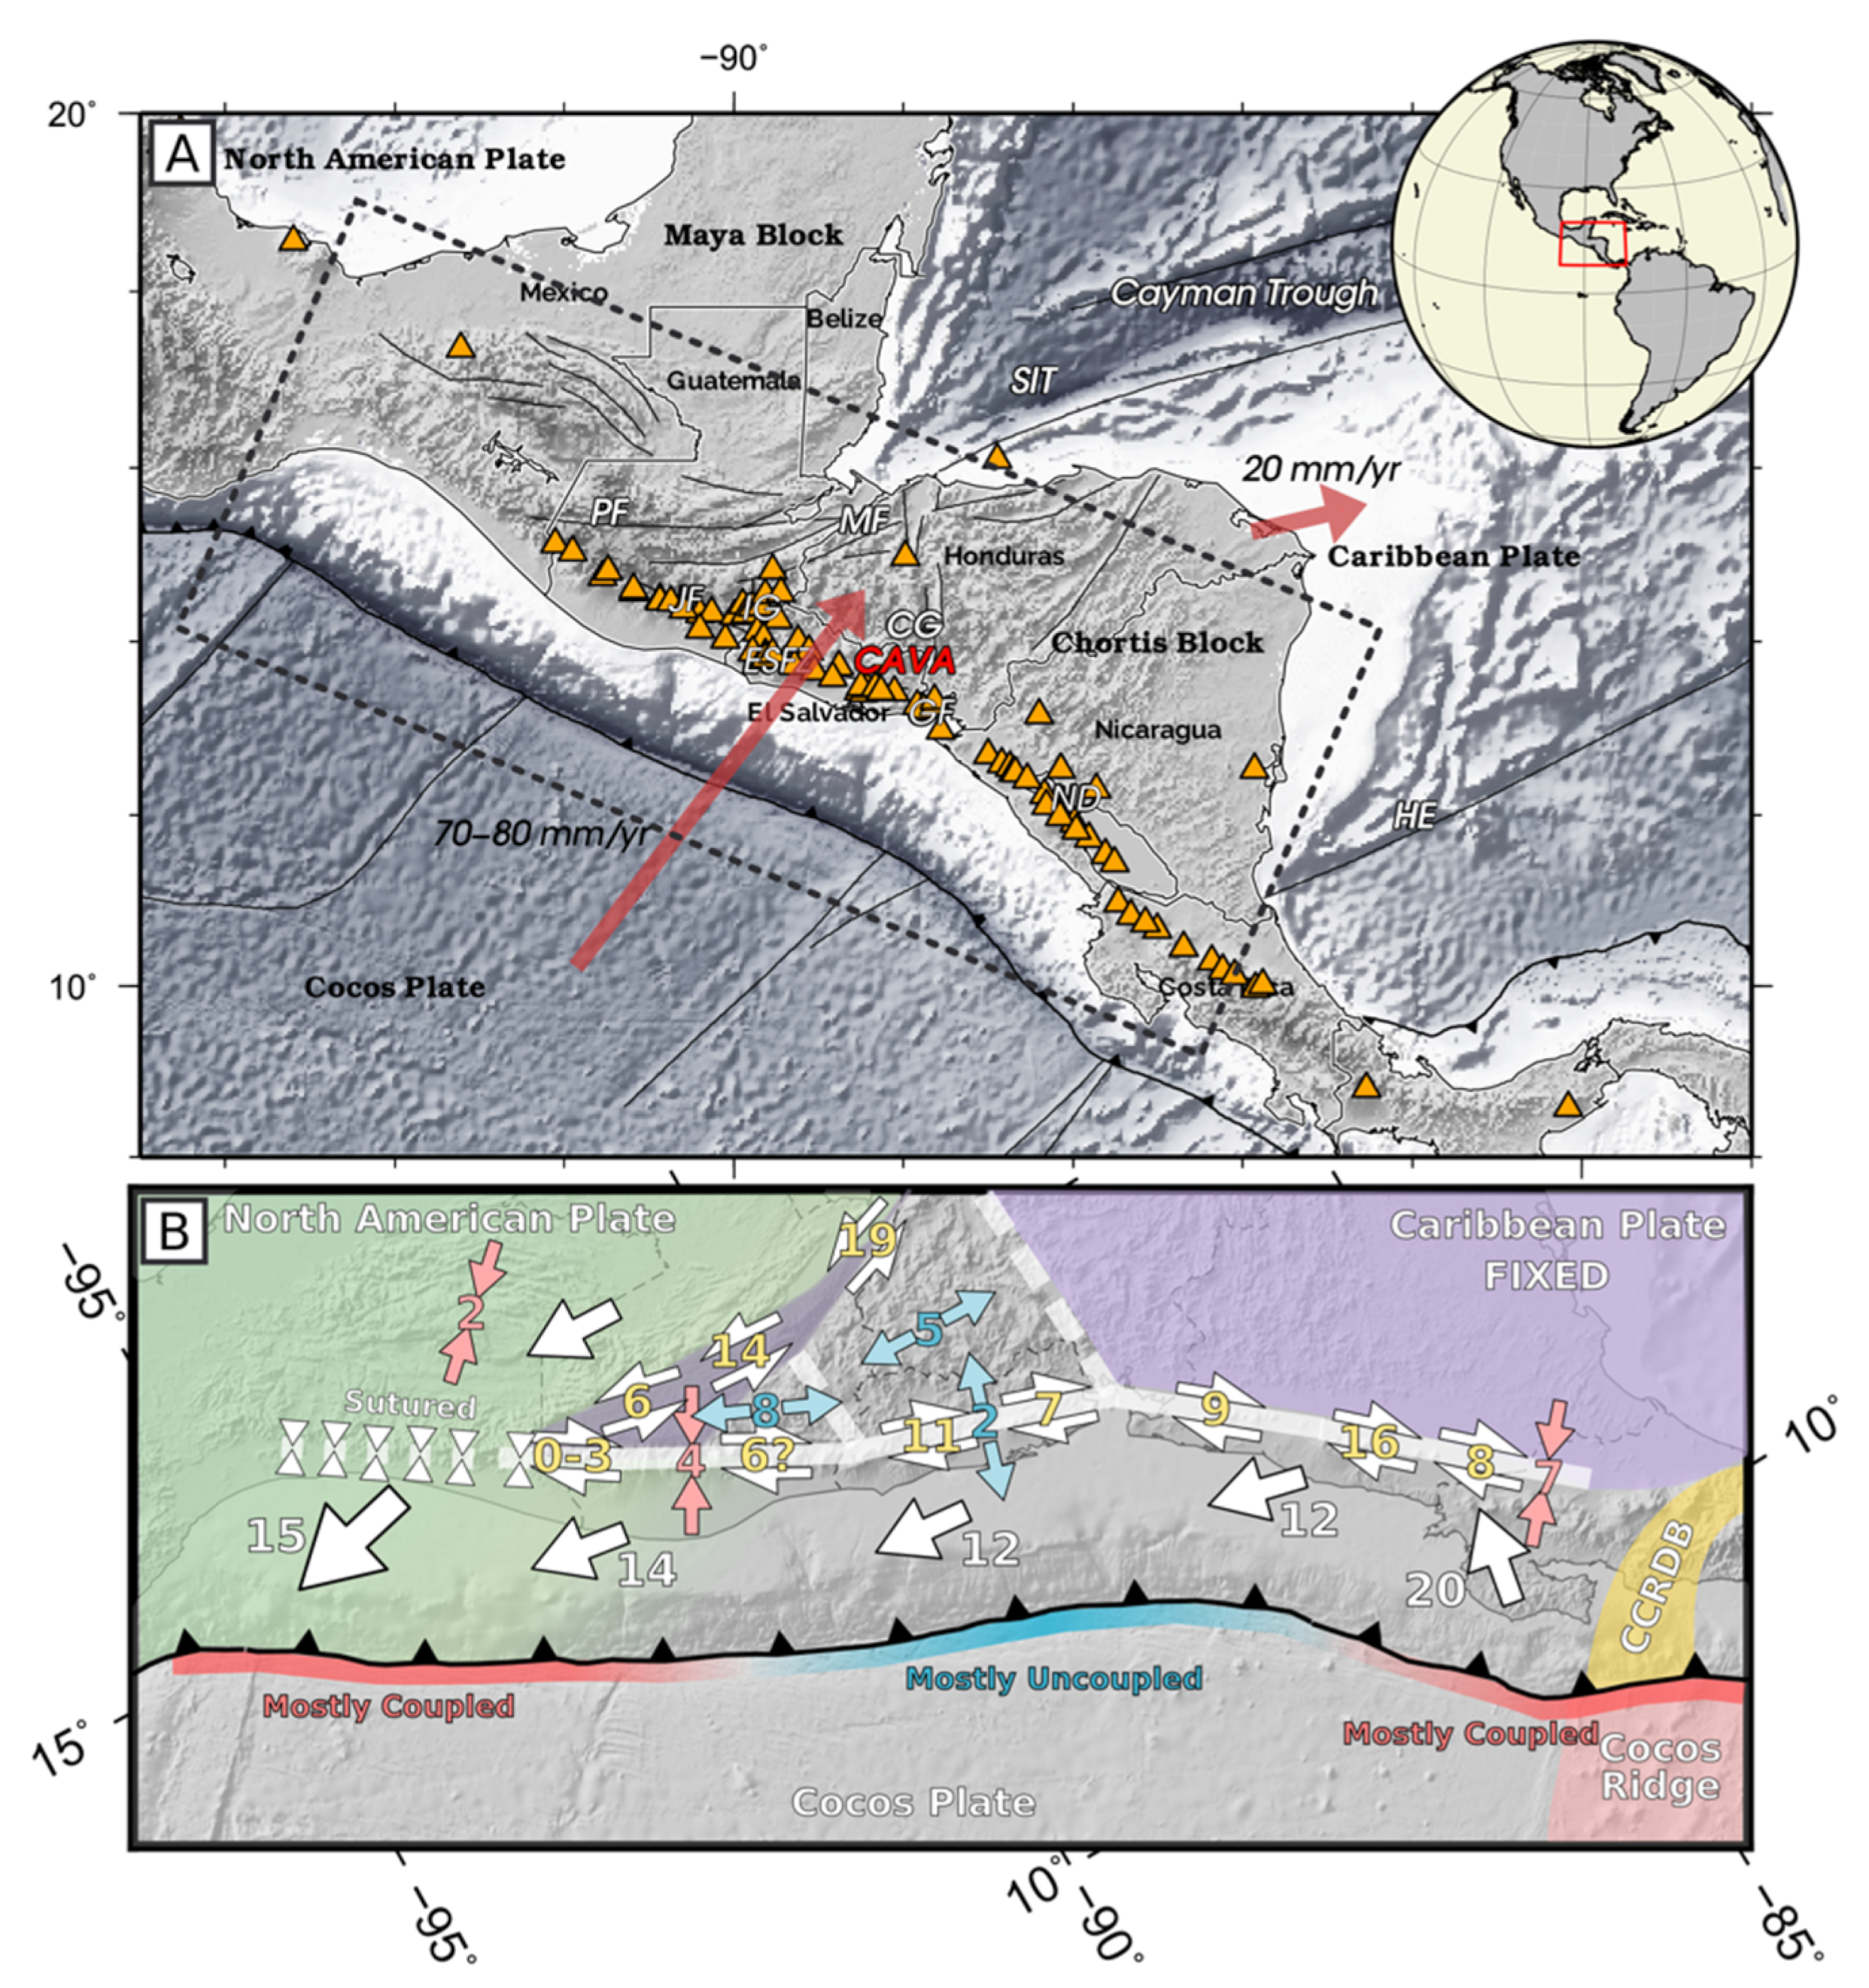
Figure 1. (A) Geodynamic sketch of northern Central America with the main regional tectonic features. Red arrows are the GPS site velocities relative to the North American Plate fixed (according to [43]). PF: Polochic fault; MF: Motagua Fault; IG: Ipala graben; CG: Comayagua graben; SIT: Swan Island Transform Fault; JF: Jalpatagua Fault; ESFZ: El Salvador Fault Zone; ND: Nicaraguan Depression; GF: Gulf of Fonseca; HE: Hess Escarpment; CAVA: Central American Volcanic Arc. Orange triangles are the Holocene volcanoes from [44]. Rectangle shows the location of (B) Kinematic model proposed with average velocities of blocks and faults (modified from [38]). The numbers show velocities in mm/yr. Yellow numbers are the strike slip velocities, blue for extension and red for shortening. The large white arrows show the horizontal motion of blocks. The red shaded area shows the Cocos Ridge bathymetric features, and the yellow shaded area represents the Central Costa Rica Deformed Belt (CCRDB). The subduction is segmented in three sections with a different coupling. White triangles show the sutured zip-type plate contact.
Geosciences 12 00266 g001
Figure 2. (A) El Salvador Fault Zone (ESFZ): thicker black lines are the main faults; thinner gray lines are minor faults. Arrows are GPS velocities from the ZFESnet GPS network [17]. Text in red corresponds to the fault names: Cyf = Comecayo Fault; Czf = Coatepeque-Zapotitán Fault; Gf = Guaycume Fault; Svf = San Vicente Fault; Tf = El Triunfo Fault; Smf = San Miguel Fault. Labels in blue are Calderas: CC = Coatepeque Caldera; IC = Ilopango Caldera. (B) Equal area lower hemisphere projection of fault slip data measured in the study area. X, Y and Z are the three principal axes of an infinitesimal strain ellipsoid determined for each site (see Section 3), with the location of each site shown by numbers in (C). (C) Focal Mechanisms available in the study area, whose size depends on earthquake magnitude. Numbers indicate the site of the fault slip data collection. Letters highlighted in purple correspond to San Vicente and El Triunfo faults.
Geosciences 12 00266 g002
Figure 3. Sketch illustrating the main characteristics of the model of general triclinic transtension with oblique extrusion (modified from [10]). Reference frame: X1 is parallel to the strike of the shear zone boundary (szb), X2 is normal to the shear zone boundary and X3 parallel with the true dip direction. F d is the relative displacement vector between the diverging blocks. The simple shearing direction (characterized by the shear rate, γ ˙ ) is allowed to deviate from the horizontal, with angle φ measuring the obliquity of the simple shearing flow component. Angle ι between the axis of maximum infinitesimal shortening of the coaxial component ( ε ˙ ) and axis X3 is initially considered as 0°. ζ is the acute angle between the simple shearing direction and the maximum shortening direction of the coaxial component. The vorticity vector ( ω ) is parallel to the shear zone boundary and normal to the simple shearing direction, and it is the pole to the vorticity normal section (VNS). See main text for further explanations.
Geosciences 12 00266 g003
Figure 4. Equal area, lower hemisphere projection of: (A) X and Z axes derived from the analysis of the fault slip data compiled from all across the ESFZ (Kamb contours with a significance level of 3σ and contour intervals of 2σ); (B) X and Z axes of the areas enclosing San Vicente and El Triunfo faults, respectively; and (C) orientation of the principal axes (X and Z) of the incremental strain ellipsoid for selected fault slip data (see main text). (right diagram) 95% confidence cones are also represented in the elliptic base for X and Z. Tables show the three main axes’ orientation of a Bingham analysis. A minimum and a maximum show the confidence cones of 95% and 99%, respectively. (D) Classification diagram of 54 focal mechanisms enclosed in the area under study. Stereoplots show the P and T axes of the focal mechanisms (Kamb contours with a significance level of 3σ and contour interval of 2σ) and the three main axes from the obtained seismic strain rate (see main text for details). (E) Divergence direction obtained from GPS data considering fixed the northern boundary of the ESFZ. In black, GPS sites are far from the shear zone boundary (SZB); in red, GPS sites are closer to the SZB. GPS stations are indicated below each plot.
Geosciences 12 00266 g004
Figure 5. (A) Black arrows show the orientation of the principal axes of the horizontal strain rate tensors (according to GPS data). White dashed lines are the boundaries of the ESFZ. Colored polygons are the caldera and edifice borders used to constrain the 2D horizontal finite strain ellipsoid IC: Ilopango Caldera. (B) Rose diagram of the orientation of the long axes of the best fit ellipse for each caldera. (C) Rs/θ diagram of the best fit ellipse of each caldera. Rs is the ellipticity (length ratio of long to short axes of each caldera), while θ is the angle that the long axis forms with the azimuth of the ESFZ borders. Colors are the ages of each caldera based on [68,69]: Blue for Holocene, orange for Pleistocene and yellow for Pliocene.
Geosciences 12 00266 g005
Figure 6. Example of the application of the transtensional model to the ESFZ using the orientation of the shear zone of N110° E and φ = 50° W. (A) Step 1 compares (right diagram) the orientation of the principal axes of the measured incremental strain ellipsoids (X, Y, Z and their respective confidence cones, central diagram) with those resulting from the transpression model for various Wk values (left diagram; black symbols: X axes; red symbols: Z axes) in equal area, lower hemisphere plots. (B) Step 2 represents the left shape (axial ratio, Rs) and orientation (θ angle) of the sectional horizontal ellipse of the measured caldera (Caldera and Edifice Borders (CaB) and Carboneras Caldera (CaC) labeled black lines) against the predictions of the model for various Wk values (grey to purple lines); on the right, the projection of the maximum horizontal stretching axis measured by the GPS network (shaded in gray) against the predictions of the model (horizontal θ angle; symbols in black). (C) Step 3 compares the displacement of the bounding blocks predicted by the model for several Wk values and calculated by GPS (red and blue depending on the used data). (D) The bar chart located in the lower part of the figure represents the range of possible Wk solutions for the three steps in colors—green: good fit; orange: fair fit; yellow: poor fit; white: no fit; marking the optimal result (red rectangle) as the range of vorticity values with matching values for all the steps, discarding step 2 due to its lower reliability (see main text). (E) Legend of symbols used to represent the X and Z axes of the strain ellipsoid according to the transtension model and for various Wk values. See text for further explanations.
Geosciences 12 00266 g006
Figure 7. Logarithmic diagrams with the finite strain ellipsoid shapes for several predictions of the analytic model of transtension that show a good fit to the measured natural data. The results do not depend on the actual strike of the ESFZ (N90° E to N110° E) but mainly on φ and Wk. As an example, the trajectory depicted by the ellipsoid shapes from one of the most acceptable fits for a N100° E trending segment of the EFSZ (φ= 30° W, Wk = 0.81) is highlighted with a red line.
Geosciences 12 00266 g007
Figure 8. Sinkage versus time curves computed from the best-fit results of the analytical model of transtension using the equations by [73] conveniently modified for transtension. RFD: Rigid Floor Depth, for 30 (left) and 10 (right) km.
Geosciences 12 00266 g008
Figure 9. (A) Kinematic parameters deduced for the ESFZ plotted on the transpression/transtension deformation triangle. Colors depend on SZB orientation. The triangle is based on that of [9], modified by [12] and adapted for the transtension case. It incorporates dashed lines for transtension obliquity values (φ, given in absolute value) and the kinematic vorticity number (Wk). Pure-shear-dominated transtension and simple-shear-dominated transtension areas are separated, according to [3], by the Wk > 0.81 gray area. (B) Three-dimensional sketch for the ESFZ modified by [16]. Sketch deduced from analogue modeling after 2.4% extensional stage and γ = 0.18 in a second stage. Stereoplot showing the best-fit results obtained after the transtension model application.
Geosciences 12 00266 g009
Table 1. List of the positive results after the application of the model and its reliability.
Orientationφ (s)WkReliability
N90° E; 70° S200.99Poor
250.99
0.9999
N100° E; 70° S250.99Fair
300.81
0.9
0.95
0.99
400.9Fair
0.95
0.99
500.9Fair
0.95
0.99
300.7Poor
600.95Poor
0.99
N110° E; 70° S500.7Good
0.81
0.9
0.95
0.99
400.7Fair
0.81
0.9
0.95
600.9Fair
0.95
600.7Poor
0.81
Publisher’s Note: MDPI stays neutral with regard to jurisdictional claims in published maps and institutional affiliations.