Article

Application of Chemostratigraphic Methods to Floodplain Alluvial Deposits within the Big Harris Creek Basin, North Carolina

by
Samantha N. Sullivan
1,
Jerry R. Miller
2,* and
Carmen L. Huffman
3
1
Department of Chemistry & Biochemistry, Old Dominion University, Norfolk, VA 23508, USA
2
Department of Geosciences & Natural Resources, Western Carolina University, Cullowhee, NC 28723, USA
3
Department of Chemistry & Physics, Western Carolina University, Cullowhee, NC 28723, USA
*
Author to whom correspondence should be addressed.
Geosciences 2022, 12(5), 187; https://doi.org/10.3390/geosciences12050187
Submission received: 25 March 2022 / Revised: 21 April 2022 / Accepted: 23 April 2022 / Published: 26 April 2022
(This article belongs to the Section Sedimentology, Stratigraphy and Palaeontology)

Abstract

:
Big Harris Creek, North Carolina, possesses a geomorphic history and alluvial stratigraphic record similar to many drainages in southern Appalachian Piedmont. An approximately 1 km reach of Upper Stick Elliott Creek, a tributary to Big Harris Creek, was used herein to (1) explore the use of chemostratigraphic methods to define and correlate late Holocene alluvial deposits along this relatively uncontaminated rural stream containing legacy sediments (historic, anthropogenically derived deposits), and (2) interpret depositional floodplain processes within small (<10 km2), headwater drainages. The lithofacies within four floodplain sections were described in channel banks and sampled at about 5 cm intervals. The 128 collected samples were then analyzed for grain size and the concentration of 22 elements using X-ray fluorescence. Well-defined chemostratigraphic units (facies) were defined on the basis of a multi-elemental fingerprint using a principal component analysis (PCA) and verified using discriminant analysis (DA). Chemostratigraphic units did not reflect grain size at a site (by design) but marginally correlated to lithofacies defined by field descriptions. Of significant importance, chemostratigraphic units could be quantitatively correlated between the four stratigraphic sections at a much higher spatial resolution (~5 cm) than could be performed using other sedimentologic parameters alone. In combination, the lithostratigraphic and chemostratigraphic architecture of the floodplain is consistent with a previously proposed sequence of deposition for the legacy deposits in which extensive land-use change associated with the onset of cotton farming in the 1860s led to upstream incision and gully formation and downstream deposition on the floodplain surface. Deposition appears to have progressed downvalley as incision deepened, probably in the form of crevasse splay deposits or proximal sandsheets that were occasionally interbedded with vertically accreted sediments. The results indicate that chemostratigraphy represents a highly useful approach to the assessment of floodplain depositional processes over (at least) relatively small temporal and spatial scales, even in areas with minimal sediment contamination.

1. Introduction

It has long been recognized that floodplains, and floodplain deposits, record a history of a river system’s responses to both natural and anthropogenic disturbances [1,2,3,4,5]. As a result, researchers in fluvial geomorphology and applied sedimentology have, since at least the late 1800s, sought novel indicators to effectively interpret and quantify the temporal and spatial changes in riverine ecosystems and their associated basins. Indicators now include a wide range of parameters, such as the mineral composition, size, and size distribution of a floodplain’s sediments, the nature of the floodplain’s stratigraphic architecture, and various types of stratigraphic markers (e.g., buried soils, archeological artifacts, and geochemical fingerprints, to mention a few) [6]. These approaches are often used in combination and not only provide insights into the changes in a basin’s sedimentologic and hydrologic regime but the magnitude and timing of the external disturbances that led to the documented geomorphic response(s) [6,7,8,9,10,11,12,13,14]. Indeed, floodplain deposits have been effectively used to determine the impacts of changing climates and tectonics on fluvial systems as well as the impacts of agriculture, mining, construction (development), and other human activities on aquatic ecosystems [15,16].
Legacy sediments, defined as historic, anthropogenically derived deposits, represent one of the most extensively studied types of floodplain deposit (see James [17] for a detailed definition of legacy sediments). These sediments are most commonly associated with land-use/land-cover changes that accompanied industrialized agriculture [5,18,19,20] and/or the influx of mine tailings materials to river valleys [9,18,19,20,21]. The impacts of agriculture were particularly prevalent in North America during and following European settlement from the late 1700s through the late 1800s and resulted in the formation of legacy deposits throughout the eastern piedmont and the Mississippi River valley of the U.S., among other locations. In general, these legacy deposits can be subdivided into two broad categories, including sediments that accumulated upstream of milldams, which were historically pervasive in the eastern and southeastern U.S. [22,23,24,25,26], and sediments that accumulated on valley floors as a result of extensive upland soil erosion and gully development following widespread land-use change [5,20,27,28,29]. In the latter case, the formation of legacy sediments was often associated with an aggradational–degradational episode (ADE) that included [30] (1) an extensive period of hillslope and valley bottom clearing, resulting in major changes in land-cover; (2) the formation of upland gullies and accelerated soil erosion which increased sediment loads to the channel; (3) accelerated rates of floodplain deposition and/or channel bed aggradation that produced a thick sequence of highly stratified legacy sediments; (4) a renewed period of land-use/land-cover change, including reforestation, that was accompanied by the use of upland soil conservation practices to reduced upland degradation and sediment production; and (5) a phase of channel bed incision that occurred in response to decreased sediment loads and that exposed both precolonial and legacy sediments in the channel banks.
The analysis of legacy sediments has demonstrated that a historical understanding of basin and channel evolution is not only an interesting academic topic but provides insights essential for informed basin and riverine management, including river restoration [17,24]. Moreover, an understanding of the nature, age, and spatial distribution of the deposits upon which the history of a basin’s disturbances may be defined is critical to effective management [17]. For example, a river’s contemporary sediment and water quality are often influenced by the influx of historical (legacy) sediments (and their associated contaminants) that serve as secondary sources of contamination to the aquatic environment [26,30,31,32,33,34]. In addition, the stratigraphic deposits produced by human-induced geomorphic events generally possess geotechnical and other properties that differ from older deposits, and these differences can significantly impact contemporary channel processes, form, and restoration [30,35,36,37].
Perhaps one of the more significant recent approaches to the dating and analysis of floodplain deposits is chemostratigraphy. Chemostratigraphy involves the characterization of the geochemical nature of the strata and the use of specific geochemical signatures for the dating and correlation of geographically separated units [38]. Chemostratigraphic methods were originally utilized primarily for the correlation of marine, lacustrine, and lithified strata [38,39,40]. However, during the past few decades, researchers have shown that the technique holds considerable potential for correlating alluvial stratigraphic units [41,42]. The approach has been particularly useful in the analysis of rivers subjected to the discrete input of contaminants from a short-lived (time-constrained) event (e.g., from mining, a tailings pond failure, or an industrial spill). While such events often pose significant environmental problems, they also provide chemical tracers that are incorporated into floodplain deposits over a relatively short-geologic time period and can be used to gain insights into the geomorphic behavior of the river system [43]. The use of such chemical tracers is primarily related to the development of contaminant isochrones (layers of similar age) within the channel bed and floodplain that can be used to develop a well-defined understanding of the dispersal and three-dimensional depositional pattern of the contaminated sediment within the channel, floodplain, and terraces. These geochemically defined isochrones can then be used to (1) date the floodplain and terrace deposits in both relative and absolute terms and (2) gain an understanding of the magnitude and rates of sediment transport and depositional processes within a recent channel, floodplain, and terrace deposits [44,45,46,47].
While chemostratigraphy has, in a few cases, been applied to rivers within weakly industrialized basins or with diffuse (non-point) sources of contamination [43], its application to agriculturally related legacy sediments has been limited. An exception is a work by Wang and Leigh [48], who demonstrated that precolonial and legacy deposits along the Little Tennessee River in North Carolina not only differed in terms of sedimentation rates and sediment size but Ca, Hg, and Pb concentrations. These data suggest that chemostratigraphic methods may be applicable to the analysis of recent alluvial sequences and geomorphic processes throughout the southeastern U.S., where the impacts of European settlement are well-documented and ubiquitous [20,27,48,49,50].
During this study, chemostratigraphic analyses were applied to late Holocene alluvial deposits within the Big Harris/Upper Stick Elliot Creek basin of North Carolina (Figure 1). The Big Harris Creek Basin possesses a geomorphic history similar to many drainages in southern Appalachian Piedmont and possesses legacy sediments representative of those described throughout much of the southeastern U.S., which did not accumulate upstream of milldams. The primary objective of the study was to assess whether chemostratigraphic analysis serves as a viable approach to the assessment of depositional patterns and processes when applied to floodplains along rural riverine systems dominated by agricultural activities that are devoid of significant inputs of metal contaminants and that are characterized by thick sections of legacy sediments. Inherent in the study was the hypothesis that chemostratigraphic methods could provide a more detailed understanding of depositional patterns and processes than can be obtained from the use of other forms of lithostratigraphic data when applied to geologically young (late Holocene) alluvial deposits.

2. Materials and Methods
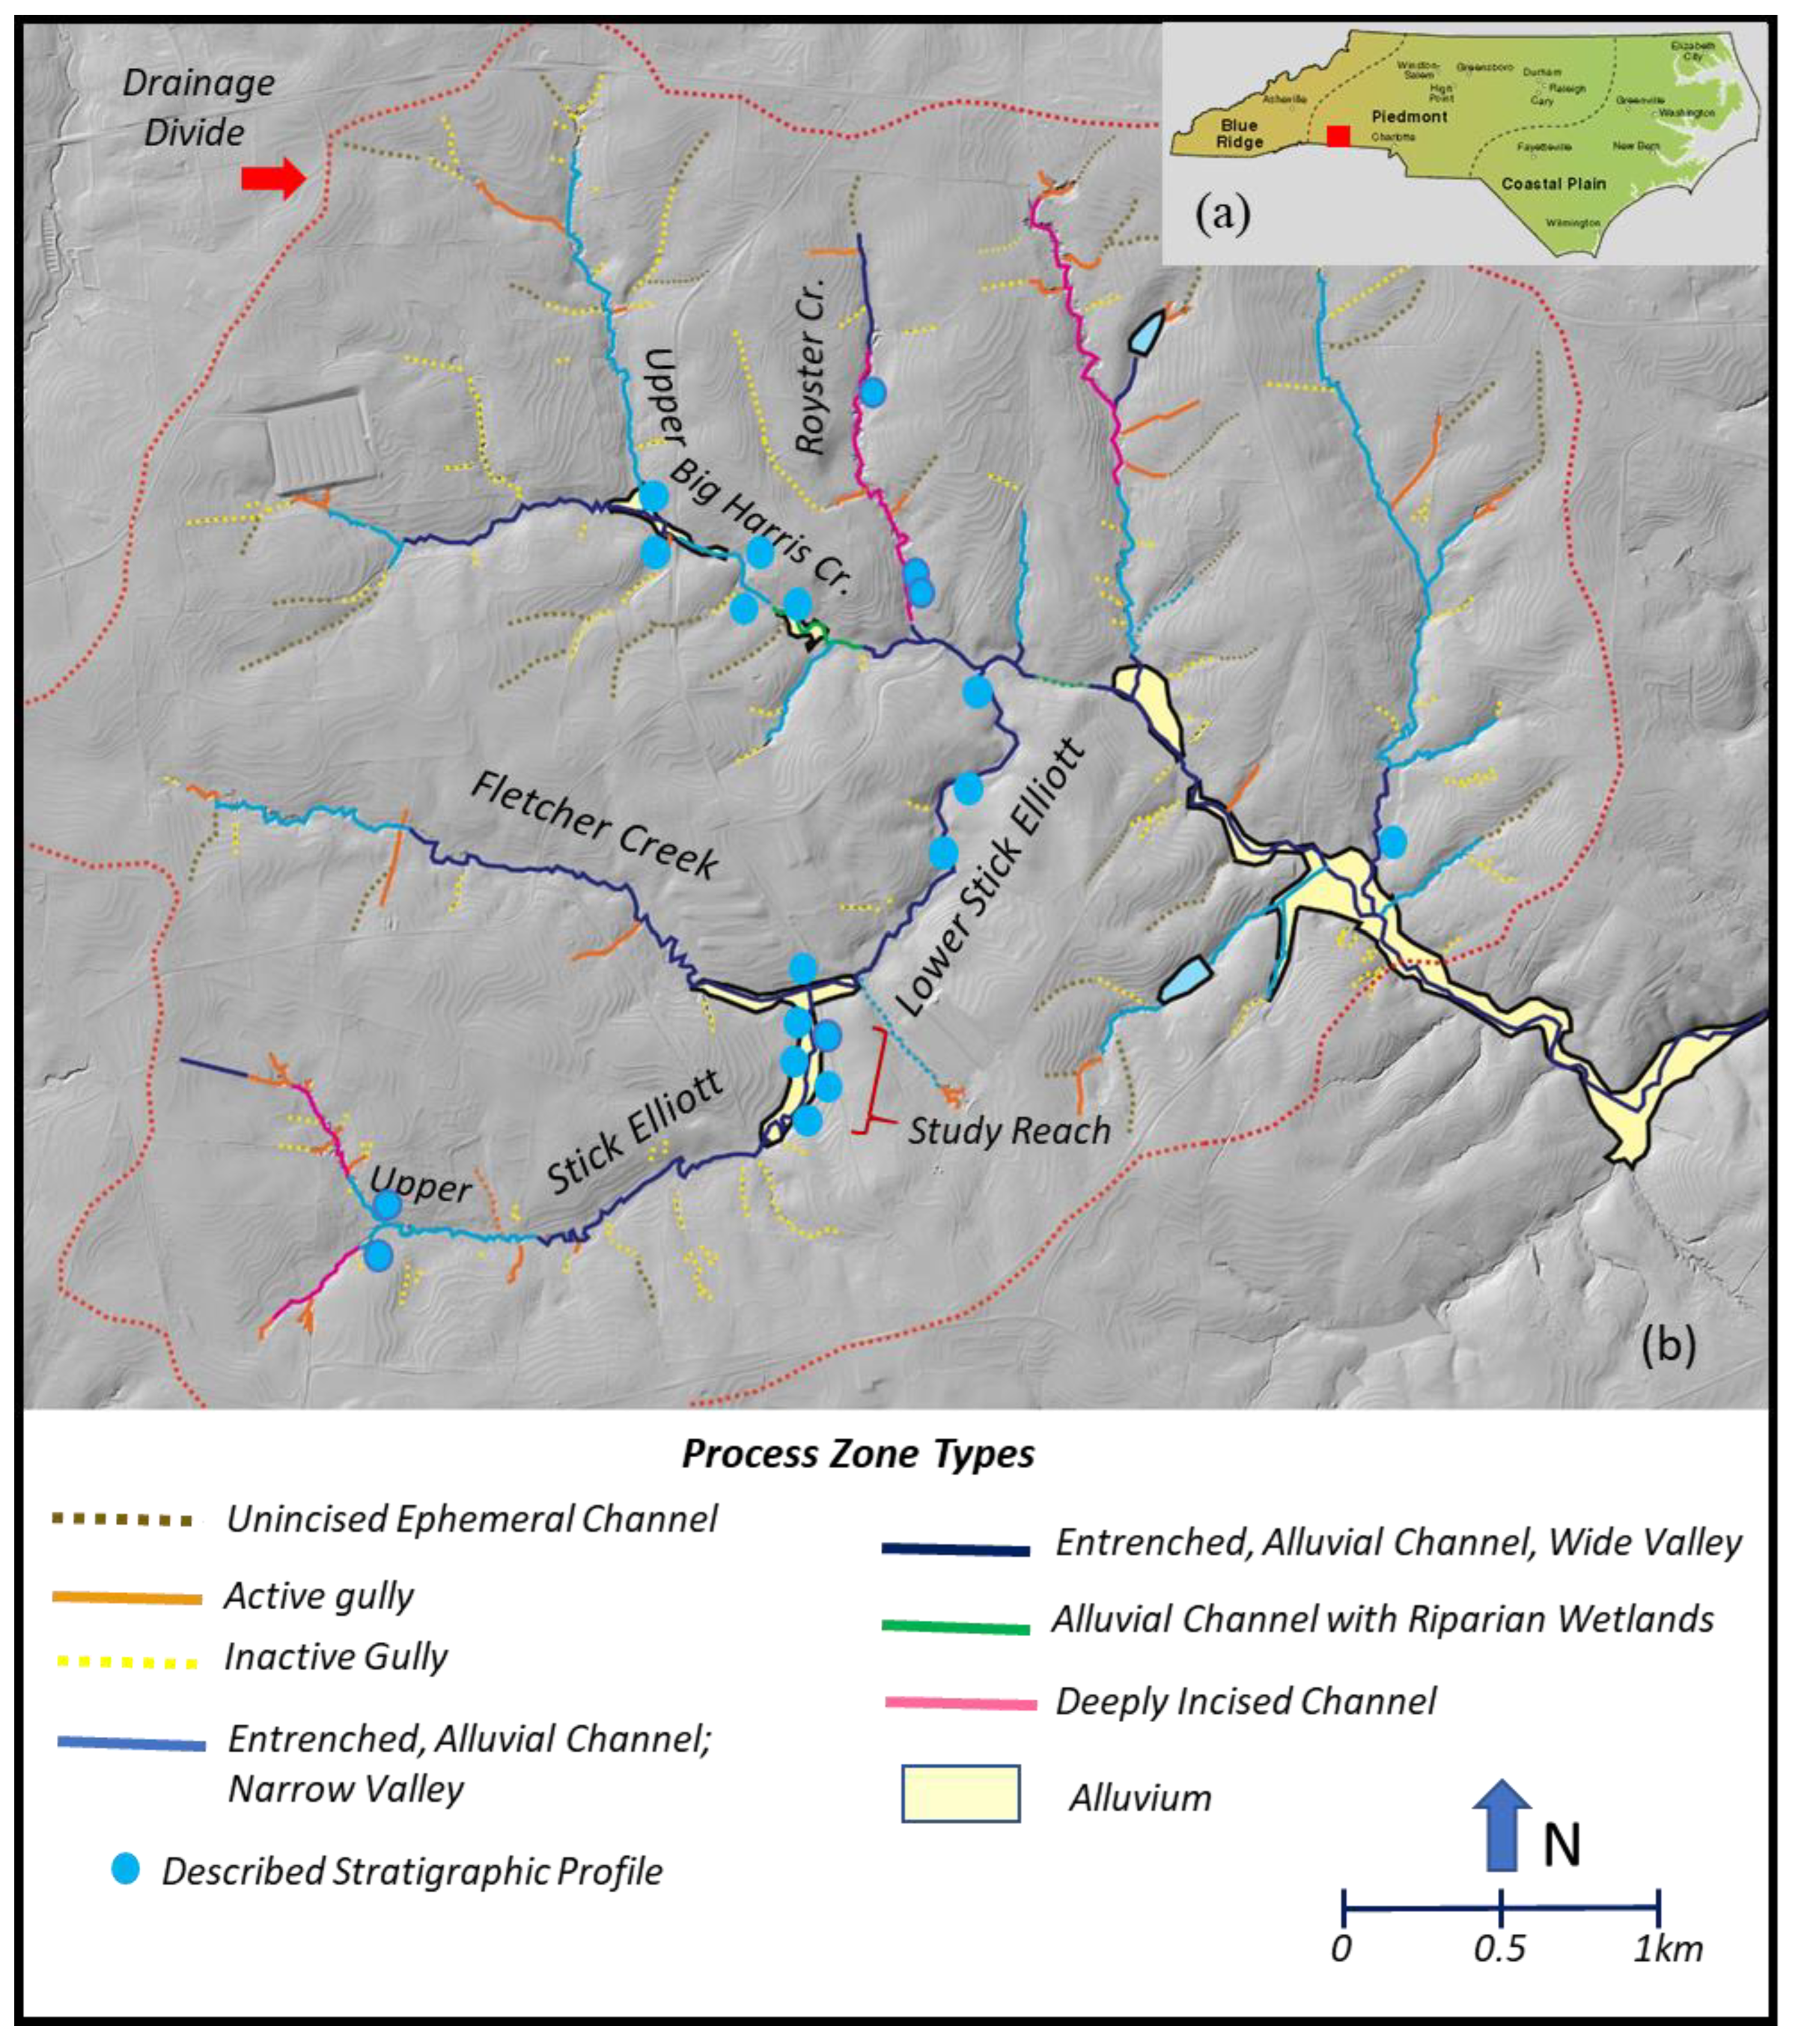
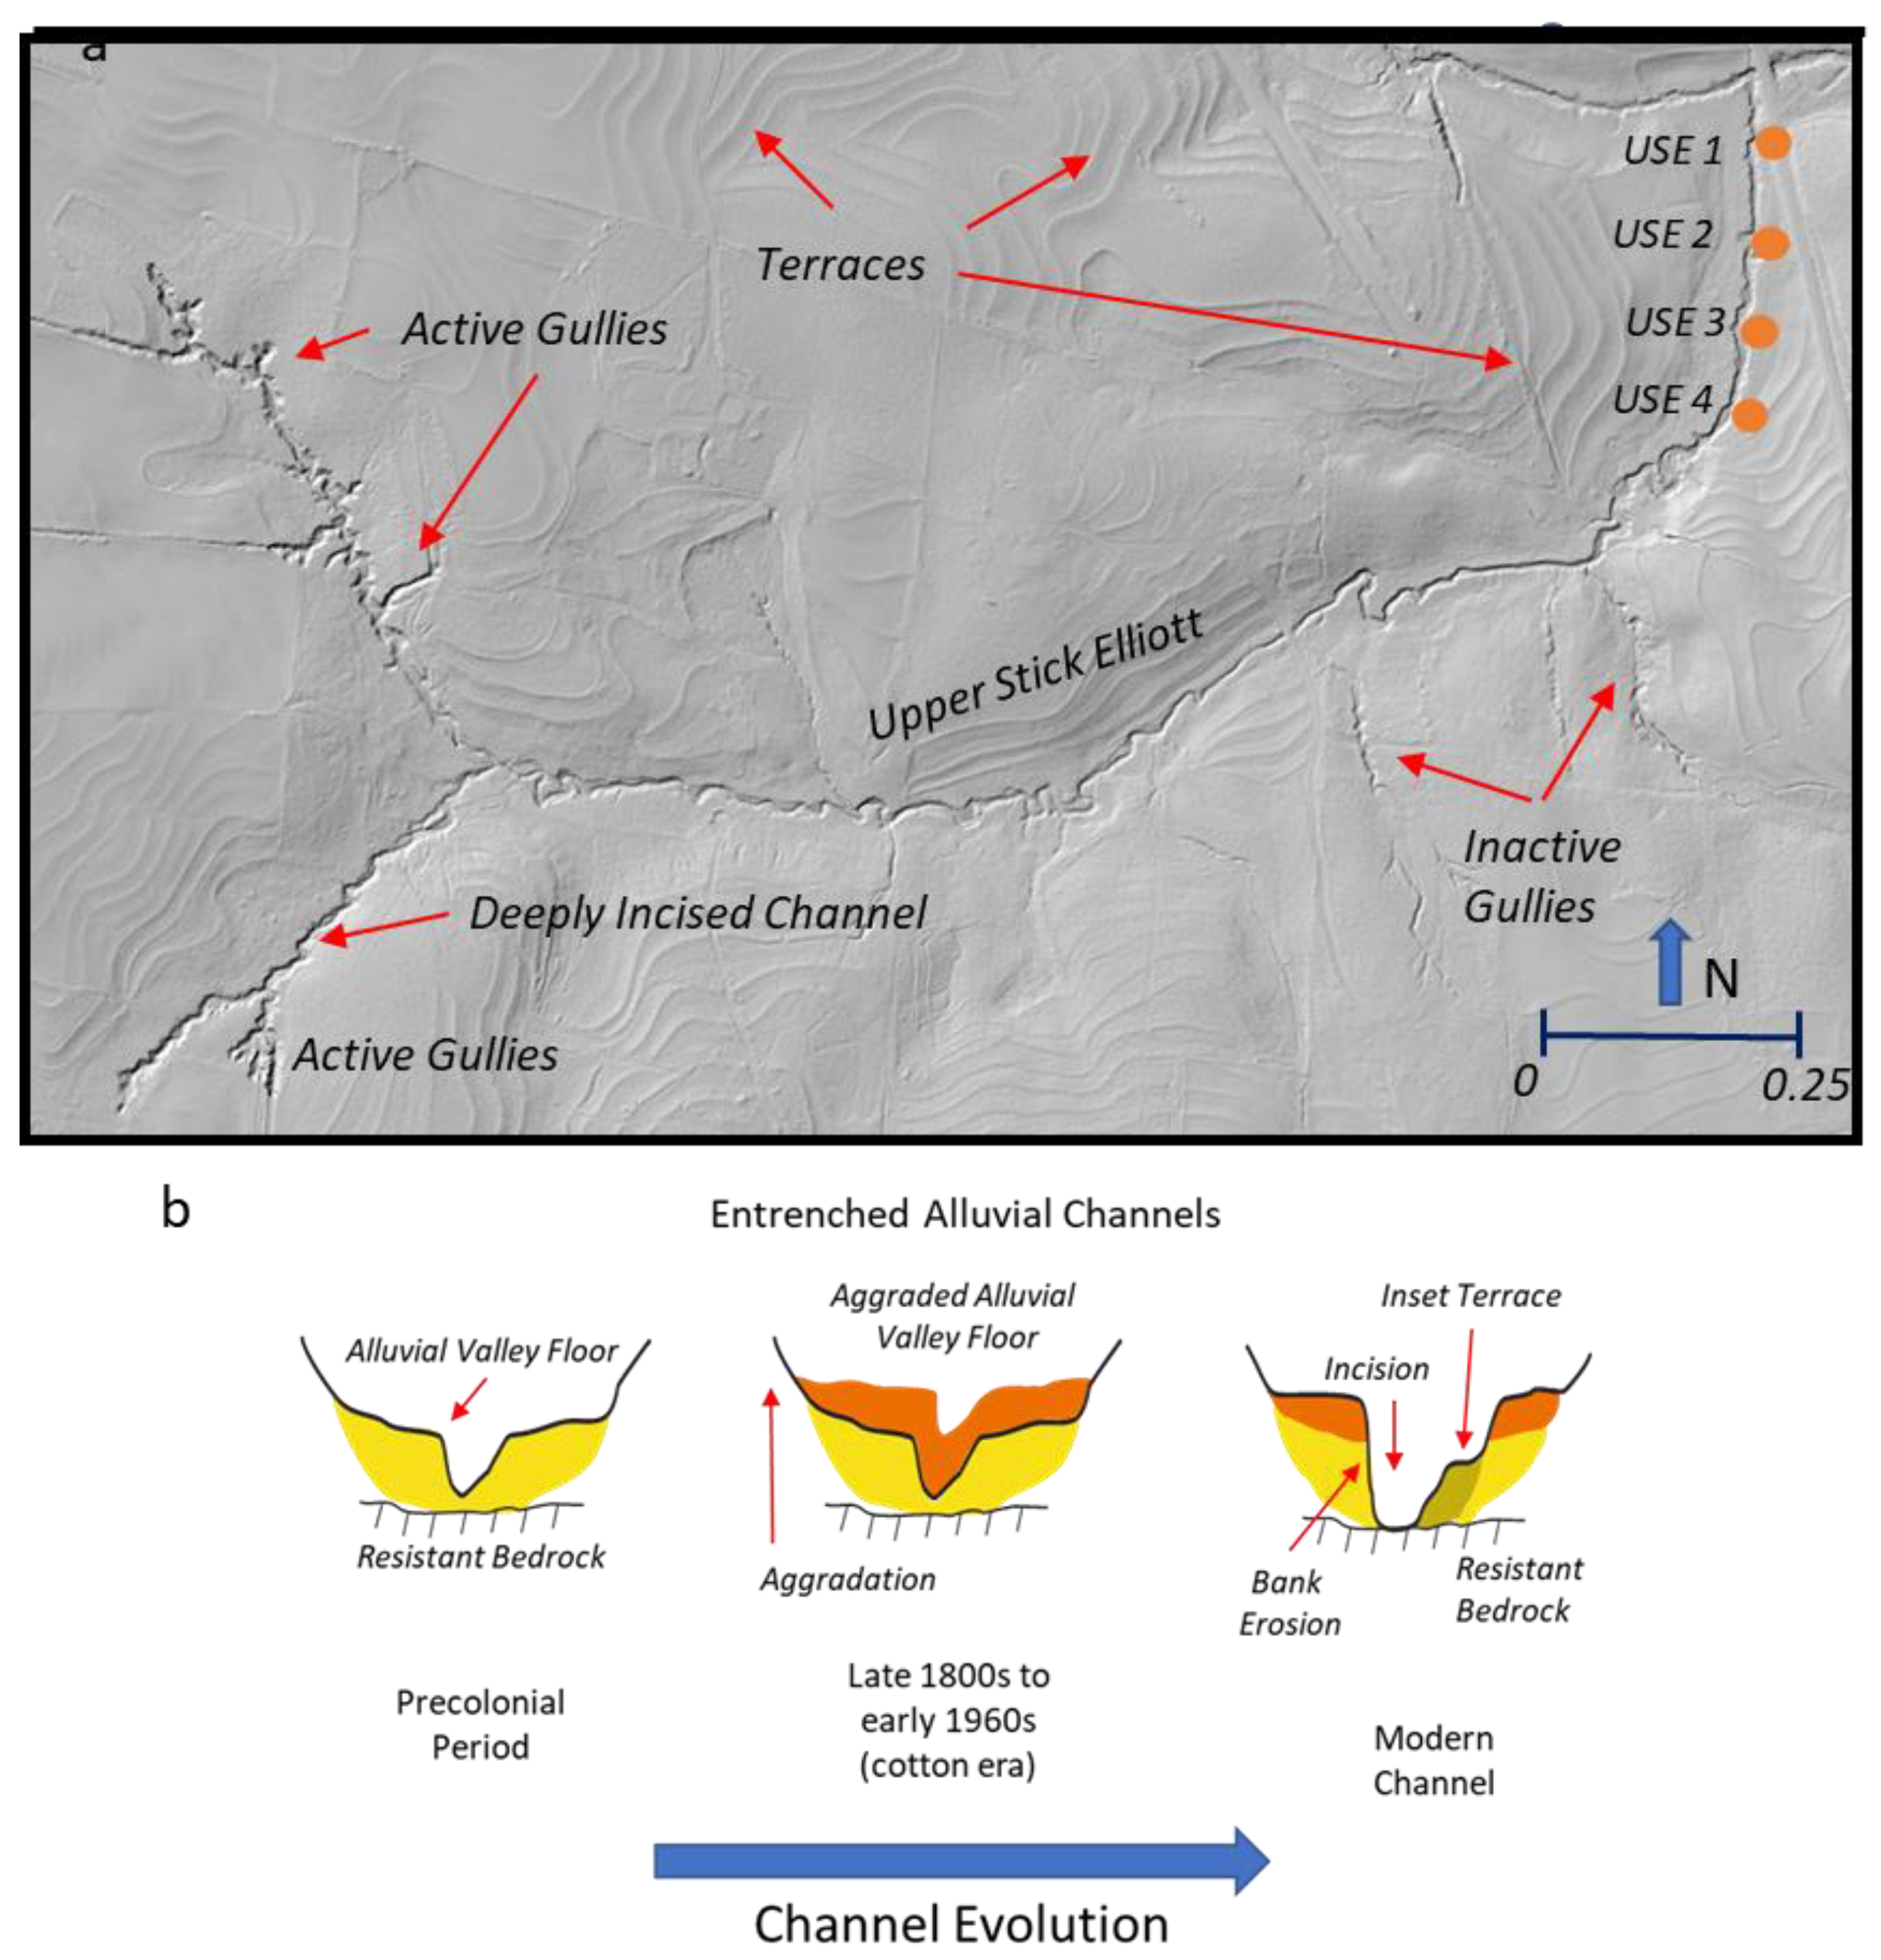
2.1. Study Area

This study was carried out along Upper Stick Elliott Creek, a tributary to Big Harris Creek located within the Piedmont Physiographic Province of Cleveland County, North Carolina (Figure 1). The Big Harris Creek Basin, a tributary to the First Broad River, is the site of one of the largest stream restoration projects in North Carolina, a project that encompasses the upper 9.6 km2 of the basin. Detailed analyses, which included the interpretation of historical, stratigraphic, dendrochronologic, and cartographic data, demonstrated that the geomorphic history of the basin was similar to many other catchments within the southern Appalachian piedmont [30]. Immigration to the area began during the mid-1700s. Most early settlers in the catchment were engaged in general farming practices until after the Civil War (1861–1865) [30]. A typical farm at the time included a combination of free-ranging livestock (mostly pigs), vegetable gardens, and a few fruit trees and/or cornfields. In general, the style of farming that was practiced had a limited impact on the landscape [51].
Land use dramatically changed after the Civil War (~1865) when local landowners began to engage in commercial cotton production [52]. By World War I, Cleveland County (which includes the Big Harris Creek project area) was one of the most productive cotton-growing regions in North Carolina. The farming of cotton required the whole scale clearing of both upland areas and valley bottoms, which led to increased runoff and soil erosion. Trimble [29], in fact, estimated that within the vicinity of Big Harris Creek, about 10 to 12.7 cm of topsoil was eroded in response to agricultural activities. Other estimates are even higher, suggesting that upland soil losses ranged between 15 and 20 cm [53]. In addition to the removal of topsoils by overland flow, gully formation on hillslopes was widespread. In fact, James et al. [6] argued that the region, including Big Harris Creek, is now one of the most eroded and gullied agricultural regions in North America. The net result of this upland erosion was the relatively rapid deposition of legacy sediments on floodplains and within the channel bed (Figure 2a,b) [5,27,30,50], two depositional areas that comprise less than 10 % of the total landscape [17,54].
In response to severe upland erosion and valley bottom aggradation, farmers, including Mr. Clemmie Royster, who owned a significant part of the Big Harris Creek watershed at the time, began to replace cotton farming with pasturage and turkey farming, a trend that continued through the mid-1900s. In addition, many farmers in the area began to adopt upland terracing and other soil conservation practices (e.g., contour farming) in the 1930s to reduce soil erosion. In the Big Harris Creek basin, such terraces (Figure 2) were not constructed until the mid-twentieth century. The net results of these changes were (1) a reduction in upland erosion, (2) the stabilization of the valley bottoms, and (3) the incision of the channel bed, exposing both precolonial and legacy sediments in the channel banks along most mid- and down-stream channel reaches [30].
In spite of the relatively small size of the Big Harris Creek study basin (9.6 km2), there were significant spatial variations in the type and magnitude of the geomorphic responses to European settlement and the onset of intensive agricultural activities within the basin.
The nature of these responses, and the resulting spatial differences in channel and valley forms that were produced, have been described in detail by Miller et al. [30]. Of significance to this paper, most mid- and down-stream reaches of the drainage network are now characterized by channel banks composed of precolonial deposits that are overlain by legacy sediments of variable thickness. While legacy deposits did locally accumulate upstream of milldams in North Carolina [25], the closest milldam to the study area (the Double Shoals mill site) is located on the First Broad River upstream of the mouth of Big Harris Creek. Thus, the closest milldam was hydrologically disconnected from Big Harris Creek and did not influence the deposition of legacy deposits within the study area.

2.2. Stratigraphic Analyses

The contemporary interpretation of sedimentary deposits relies primarily on a sequence stratigraphic framework, where strata are examined from a chronostratigraphic perspective in which mechanistically linked depositional bodies are bound by a hierarchical set of erosional or depositional surfaces. A fundamental unit in sequence stratigraphy is a lithostratigraphic unit or lithofacies that can be defined on the basis of its lithological, sedimentological, geophysical, geochemical, and/or fossil characteristics. Such facies, when associated with distinct genetically related depositional processes and conditions, can be grouped together to define higher-order depositional systems, which in turn can be grouped to form surface-bound, chronologically-linked sequences. As described by Miller et al. [30], lithostratigraphic units, or lithofacies, were identified in bank exposures at 22 locations along the Big Harris Creek drainage network (Figure 1) and used to determine the basin’s general geomorphic history as well as the types and extent of deposits that comprise the valley fill. During this study, chemostratigraphic methods were applied to alluvial floodplain deposits located along about a 1 km reach of upper Stick Elliott Creek, a tributary to Big Harris Creek (Figure 1 and Figure 2). The focus on upper Stick Elliott Creek was due to (1) the occurrence of precolonial and legacy deposits that could be easily defined, mapped, and sampled along a majority of its drainage system prior to the implementation of the restoration project, (2) the presence of active and inactive gullies in the basin (Figure 2), indicating that the basin possessed the typical suite of processes that occurred during landscape evolution, and (3) the ability to gain access from local landowners for the majority of the riparian corridor.
The delineation of lithofacies was based on parameters previously found to be useful for the analysis of legacy and precolonial deposits in the southeastern U.S. [5,27], including (1) color, (2) organic matter content, (3) grain size (texture), (4) thickness and type of laminations, bedding, and sedimentary structures, and (5) degree of sediment weathering. Lithofacies (or lithostratigraphic units) were not defined on the basis of their metal content. Thus, as used herein, lithostratigraphic and chemostratigraphic units (described below) were identified using different criteria. The general stratigraphic and sedimentologic nature of the floodplain deposits were described according to the methods put forth by Kottlowski [55] and Bridge [56]. Other more detailed field descriptions of the alluvial materials, particularly with regards to weathering, were based on the nomenclature provided by the U.S. Soil Survey Manual [57] and were conducted along a narrow (<50 cm wide) vertical profile that extended from the ground surface to the channel bed. The relative age of the deposits had been determined previously by Miller et al. [30] and was defined on the basis of artifacts buried within the deposits and the degree of sediment weathering (e.g., buried soils). The numeric (absolute) age of the precolonial deposits was also estimated using dendrochronologic methods and the radiocarbon dating of organic materials [30].

2.3. Sediment Sampling

Sediment samples were collected at approximately 5 cm intervals from the ground surface to the base of the stratigraphic sections at four locations along Stick Elliott Creek (USE 1–USE 4, Figure 2). Each of these four sites possessed both legacy sediments and precolonial deposits. Prior to sampling, the outer 10 cm of the bank materials were removed, and the lithostratigraphic units were delineated and described. Sampling intervals did not traverse (cross) layer or stratigraphic boundaries. Samples were collected from the top of the section to the bottom along a trench cut into the deposits to limit contamination between sampling intervals. A total of 128 samples were collected and placed in polypropylene sampling bags, after which they were shipped to the laboratory at Western Carolina University for analysis. In the laboratory, the samples were air-dried and then subdivided into subsamples for grain size and geochemical analysis.

2.4. Analysis of Grain Size Distribution

The grain-size distribution of the <2 mm size fraction was determined using a Mastersizer 2000 particle size analyzer (Malvern Instruments, Malvern, UK) at 0.5 phi intervals. Prior to analysis, ~5 g of sediment was placed in a 50 mL beaker to which 5 mL of pyrophosphate and ~30 to 40 mL of deionized water were added. The sediment-solution mixture was stirred for approximately 5 min and left to sit overnight to aid in particle dispersal. Herein, grain size data are reported in terms of the percent silt + clay (i.e., particles <63 µm in size) in the deposits as a simple descriptor of sediment texture that is also relevant to the geochemical nature of the deposits. The texture of sediment >2 mm in size was qualitatively described in the field.

2.5. Analytical Metal Analyses

An important decision in the geochemical analysis of alluvial deposits for both chemostratigraphic and geochemical fingerprinting analyses is the grain size fraction to be analyzed. This follows because the grain size and composition of the sediments can strongly influence elemental concentrations, with higher concentrations generally associated with finer-grained sediments characterized by relatively high surface areas and charge [58]. Collins et al. [59] note that this decision is typically based on three factors: (1) the particle size of the sediment being transported and deposited by the river, (2) the relationship between particle size and tracer concentrations, and (3) the time and resources required and available for sample preparation. During this study, the <2 mm size fraction was analyzed because some stratigraphic units within the legacy deposits were composed almost exclusively of sand-sized particles (<5 % silt + clay), and our primary intent was to assess distinct differences in the geochemical composition of the deposits. In addition, grain size-concentration relations were relatively weak, as described in more detail below.
The elemental content of 22 major and trace metals in the collected samples was determined by energy dispersive X-ray fluorescence (ED-XRF)], using a METEK Spectro Xepos spectrometer. Prior to analysis, a subsample of the sediment was ground into a fine powder using a clean, dry mortar and pestle. A piece of mylar was then laid flat on the rim of a 30 mm open-ended plastic cuvette, and a ring was pushed smoothly on top of the cuvette, ensuring there were no wrinkles in the film. The cuvette was then inverted and filled with ground sediment. A cotton ball was placed on top of the sediment to compress and secure it, while the lid was placed on top and labeled with the site name [60].
Elemental concentrations in the samples analyzed by ED-XRF were calculated using a two-point calibration curve based on two standards measured at the time of each analysis: OREAS 930 and USGS SGR-1b. These standards were chosen because they contain metals of interest in the concentration range that was expected to be present in the samples. The relative difference between the known and measured standard concentrations was calculated to provide the accuracy of the instrument on each day of analysis. The relative standard deviation was used to assess the precision of the instrument. It is important to note that the two-point calibration limited the method’s accuracy and only validated how well the standards used could be measured. The measurements do not necessarily account for matrix effects or inhomogeneity. Nonetheless, herein we are primarily concerned with relative differences in the elemental composition of the samples, which are adequately reflected in the obtained data.
The limit of detection (LOD) of the approach was determined by:
L O D = 3 σ μ x
where σ is the standard deviation of the concentrations, µ is the known concentration of the element, and x is the average of the standard concentrations.

2.6. Selection of Elements for Chemostratigraphic Analysis

During this study, we utilized a multi-elemental fingerprint to define specific chemostratigraphic units; that is, facies or units of sediment characterized by a geochemical composition that is distinct from other sediments in the floodplain. Identification of the geochemical fingerprint for each chemostratigraphic unit involved a multi-step process. First, elements that possessed concentrations that were below detection in a large number of samples (~35%) were eliminated from consideration. Second, a Kruskal–Wallis H-test was used to determine which elements had the potential to separate defined groups of sediments (see Collins et al. [61]). Here, the groups of sediments represented potential sediment sources that were defined within the basin and which included the precolonial deposits, the legacy sediments, gully sediments, and two groups of upland soils (Pacolet soils and soil complexes and Appling and Cecil soils). Once the elements that passed the Kruskal–Wallis H-test at the p = 0.05 level were identified, the vertical variation in elemental concentrations (from the surface to the base of the floodplain) was examined. Elements were then selected that exhibited significant systematic variations in the concentration within the profile and that typically possess a low solubility under natural Eh and pH conditions. The latter is important because an assumption in the application of chemostratigraphy is that there is minimal post-depositional migration of the elements within the sediments [62].
Two different approaches were used by Sullivan [63] to identify chemostratigraphic units within the precolonial and legacy deposits at the four investigated sites, including a cluster analysis (CA) and principal component analysis (PCA). Here, we only describe results that were derived using the PCA, which yields the best results. Prior to conducting the PCA, the data were normalized by a lithogenic element (Fe) to minimize spatial variations in elemental concentrations that would be expected to result from variations in sediment size and composition. Once the PCA had been conducted using the normalized geochemical fingerprinting data, sample scores associated with the first two components were plotted on an x-y coordinate system, and discrete clusters of samples were identified. Given the subjective nature of identifying clusters, a discriminant analysis (DA) was used to statistically evaluate the ability to correctly classify members (samples) assigned to each cluster (or chemostratigraphic unit).
The statistical analyses, including the PCA and DA, were conducted using IBM SPSS Statistics 26. When concentrations were below the LOD, a value of one-half of the detection limit was used in statistical analyses. Graphs and plots shown in the paper were created using Microsoft Excel and Origin 9.0.

3. Results and Discussion

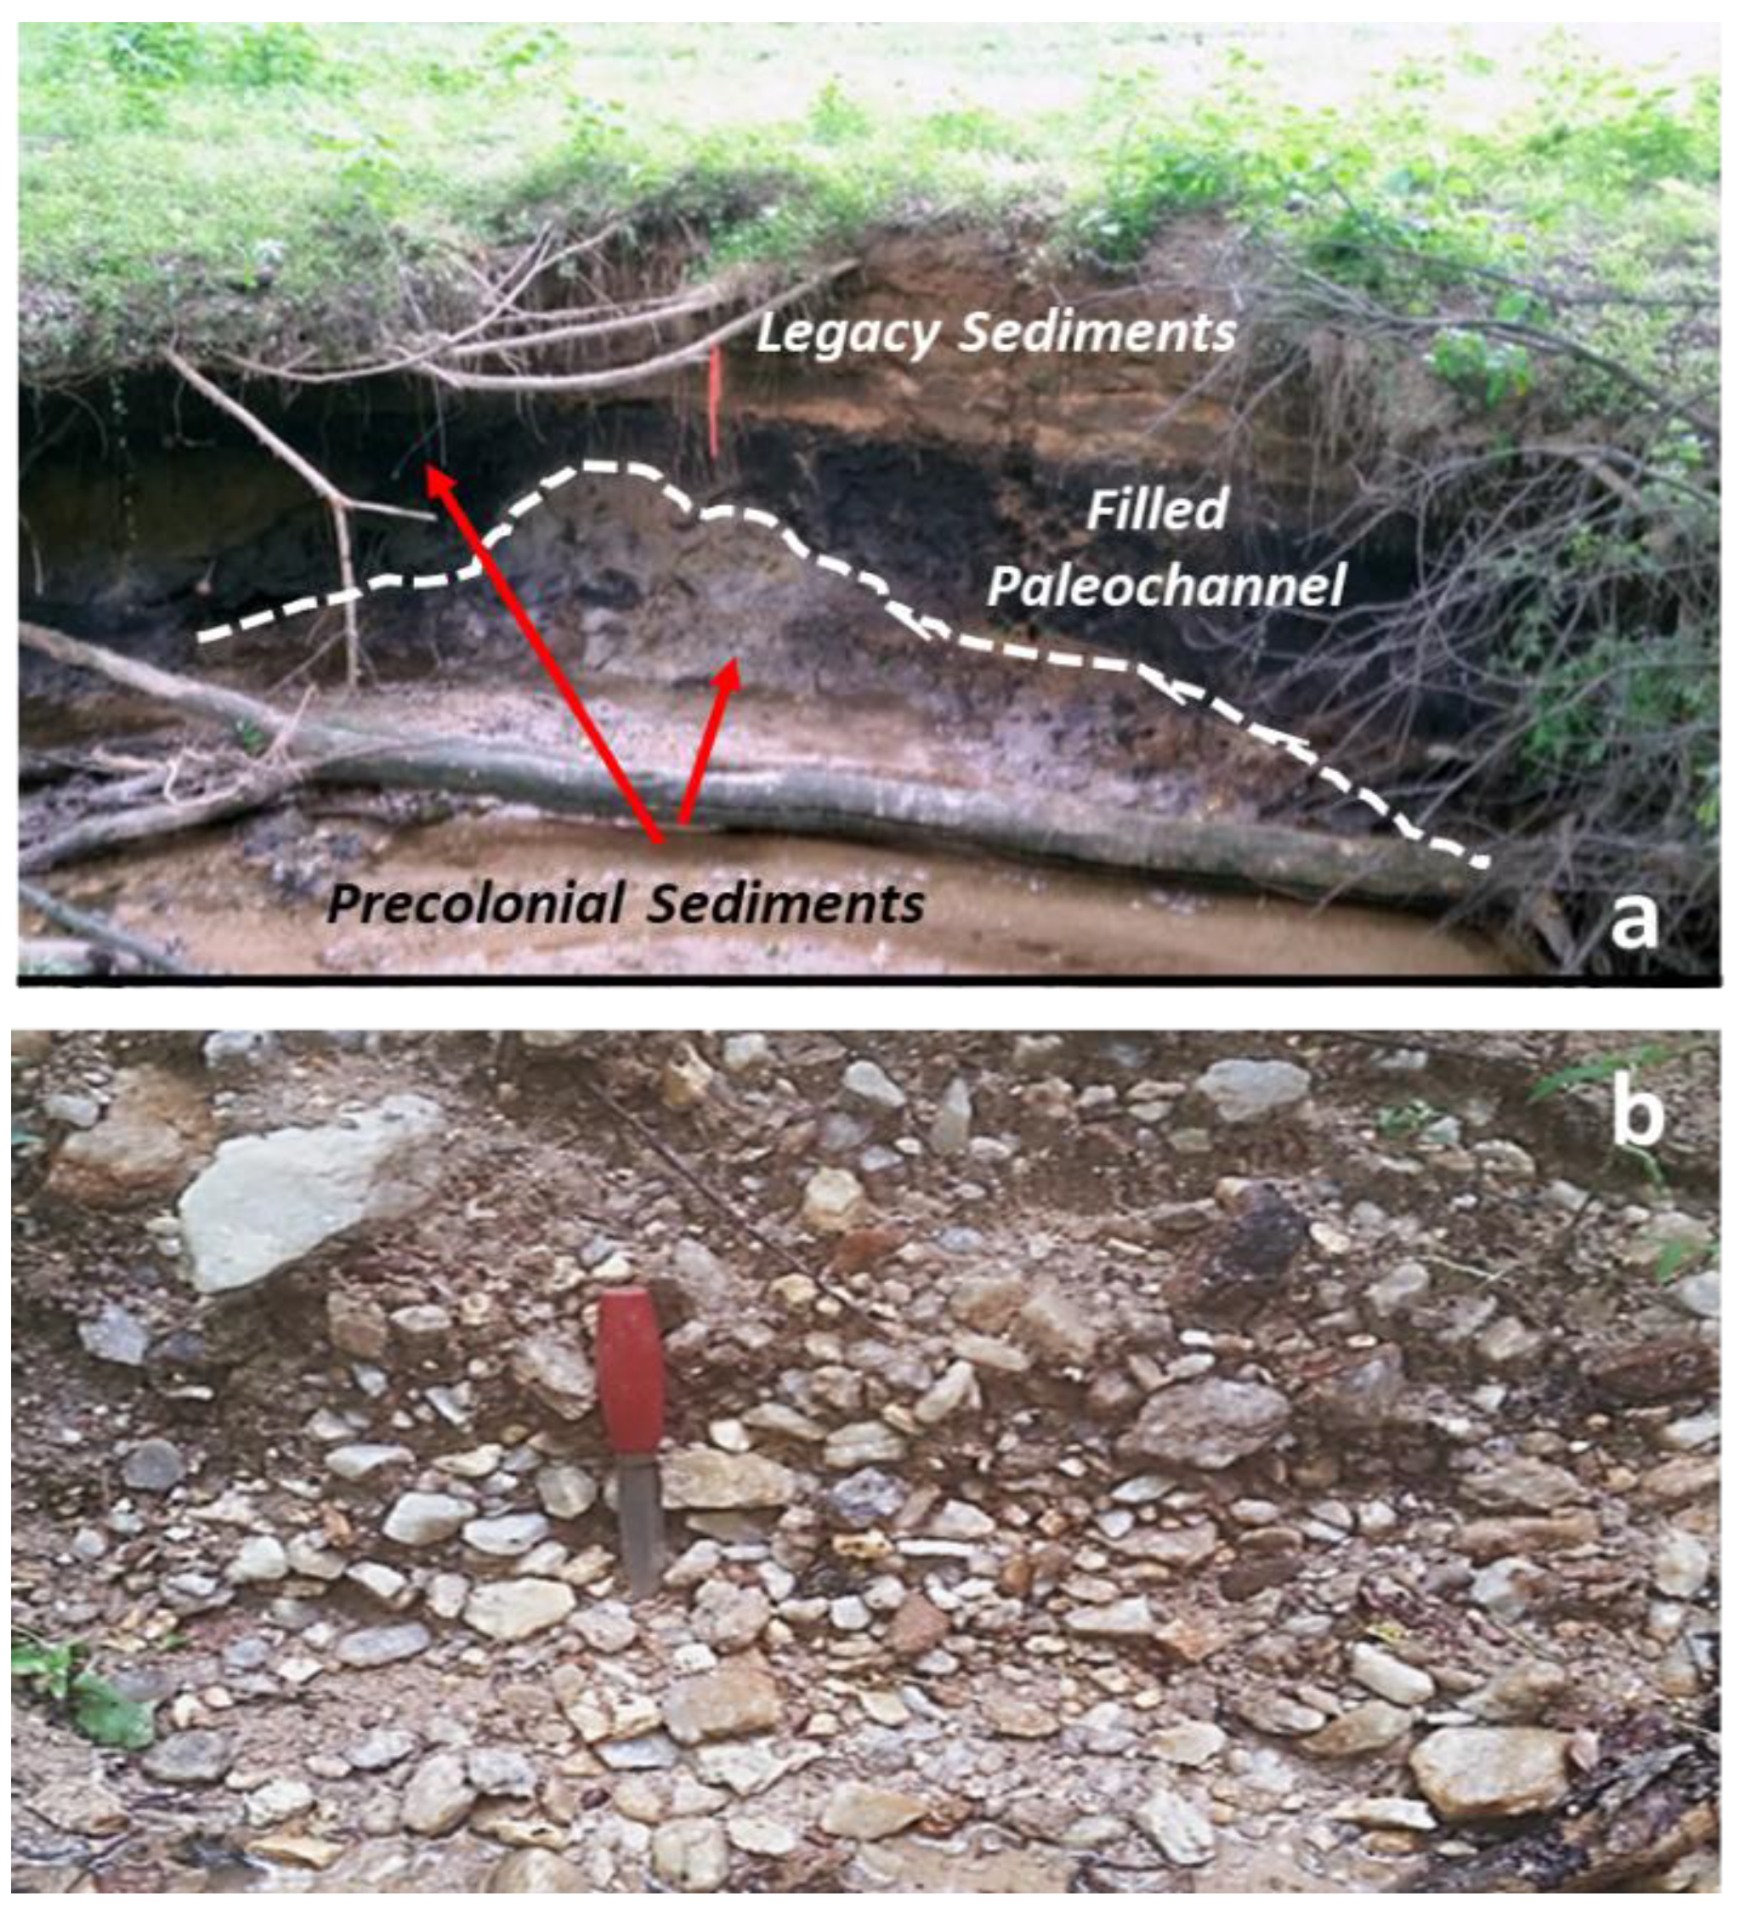
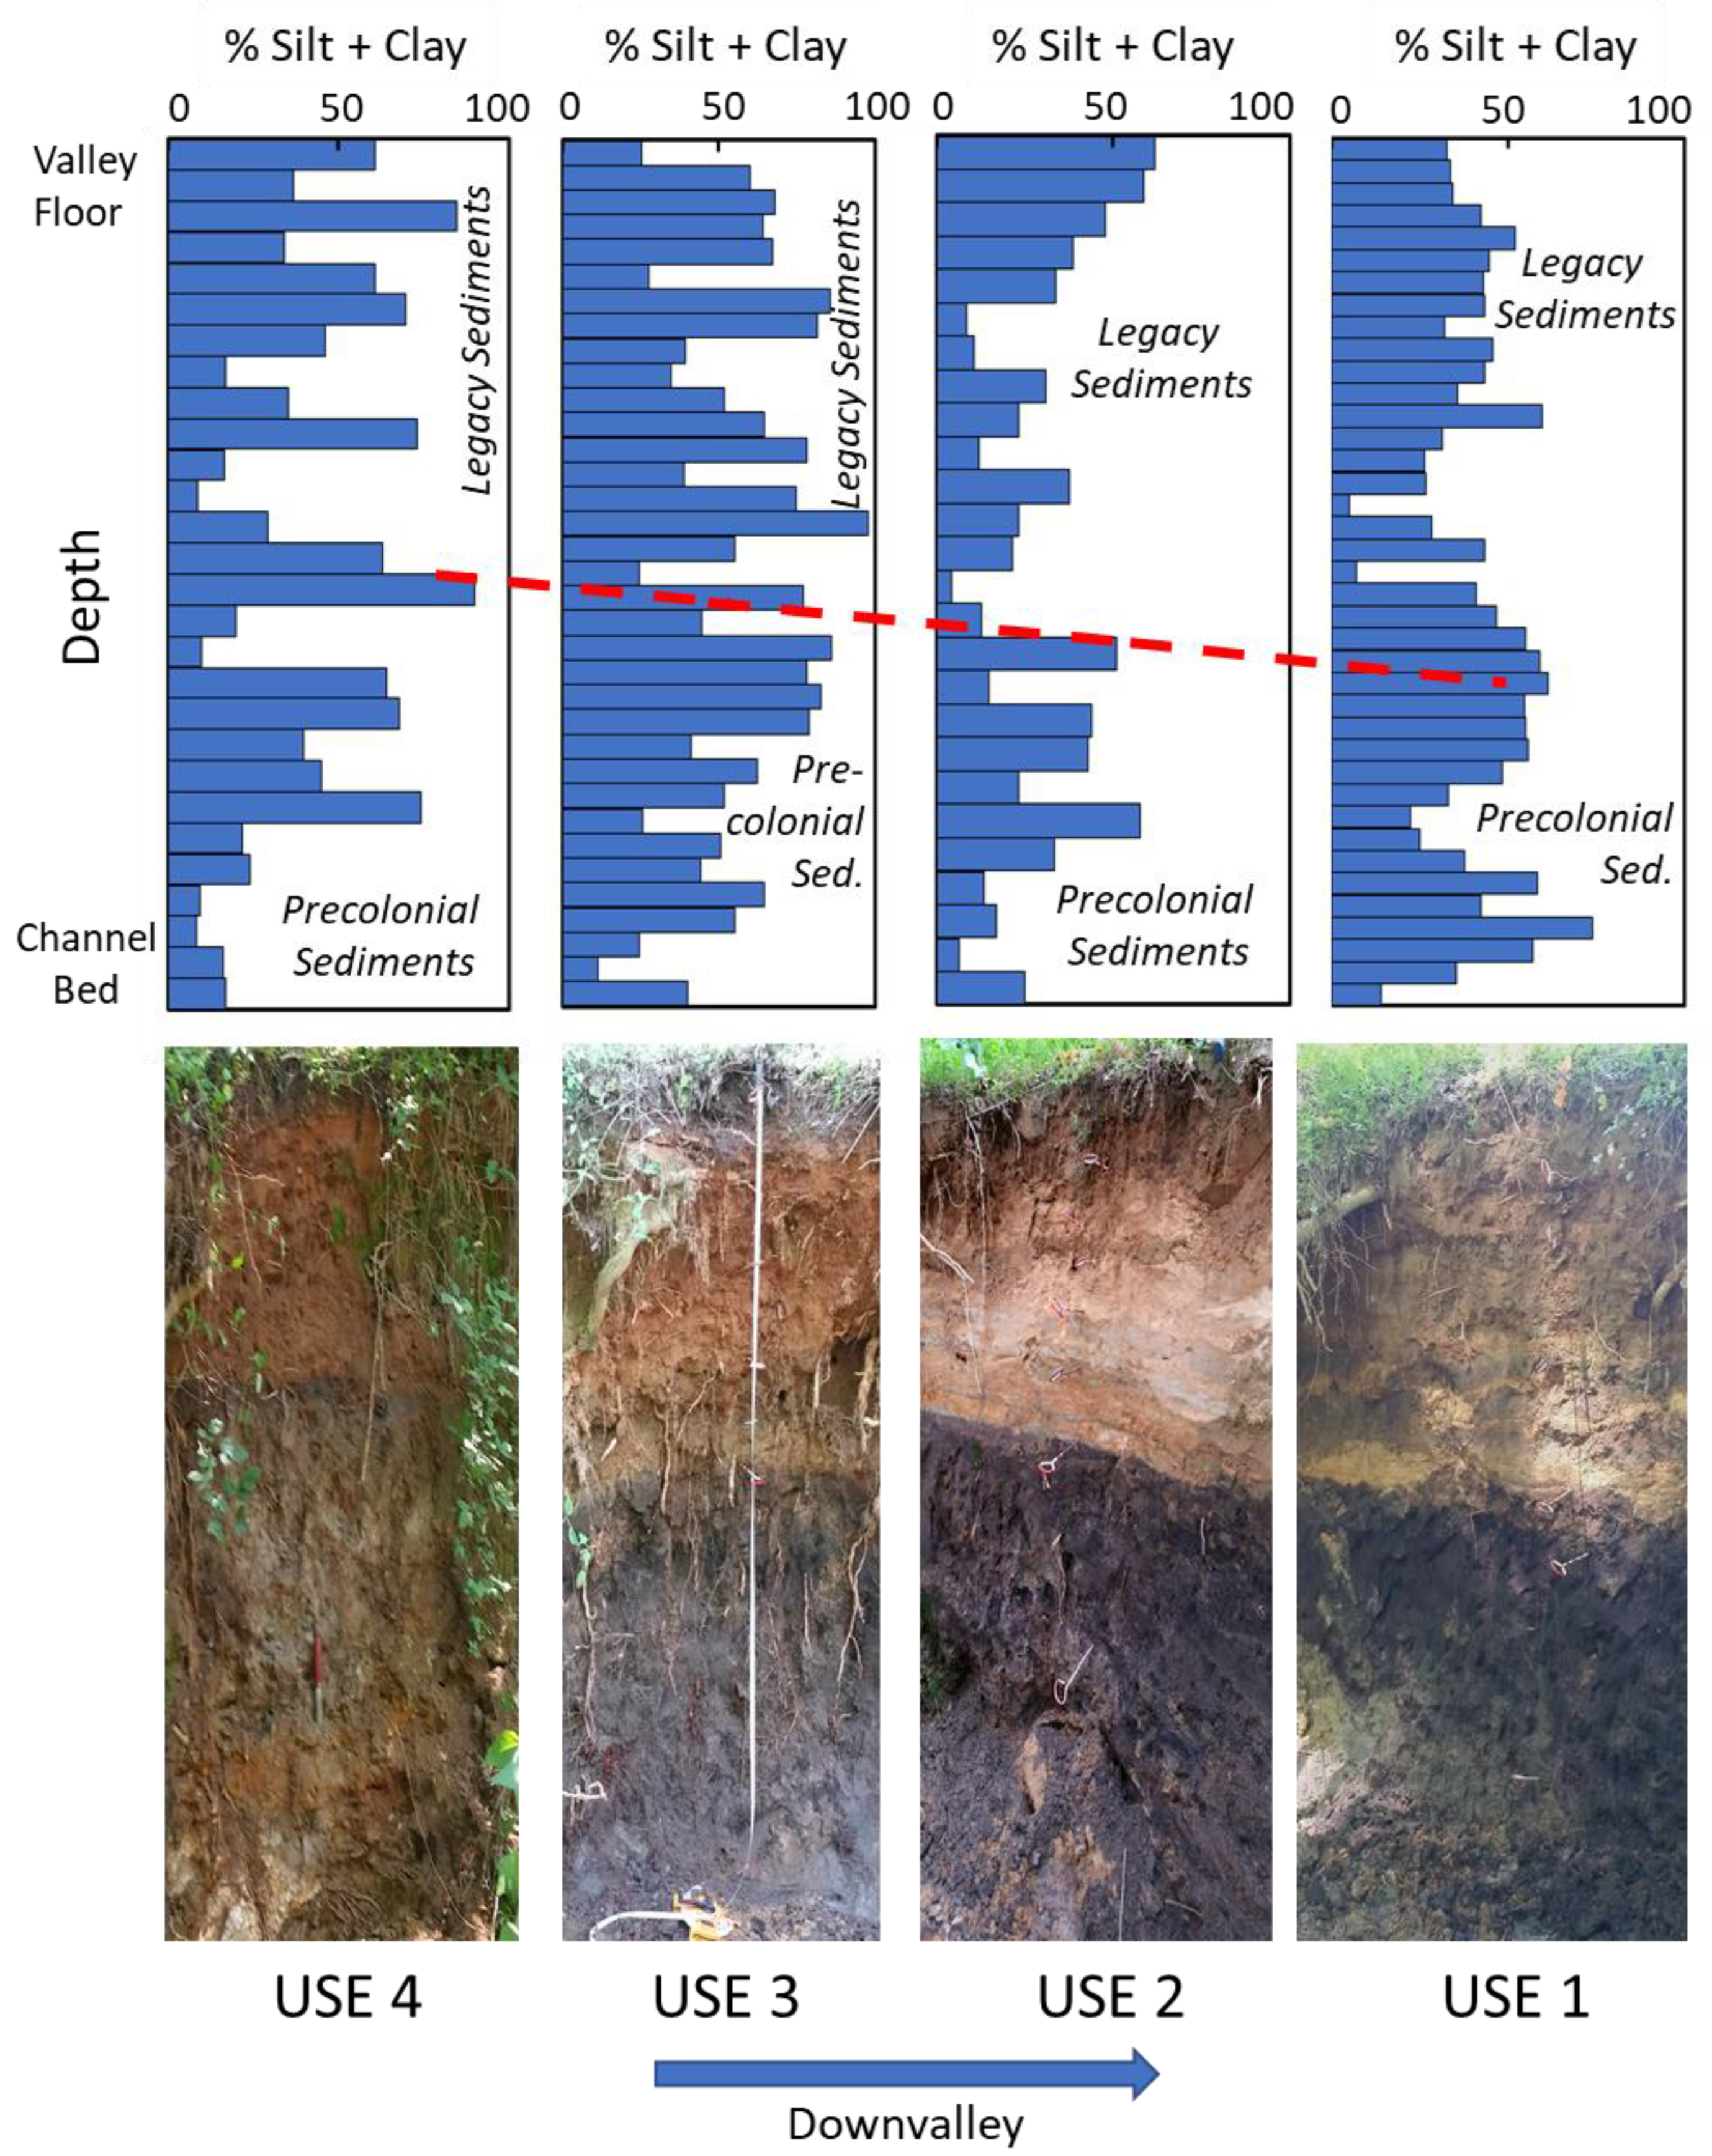
3.1. Lithologic Characteristics of the Floodplain

Field descriptions, photographs, and grain size of the alluvial deposits described at the four locations (USE 1–USE 4) along Upper Stick Elliott Creek (Figure 2) are provided for Site USE 2 in Figure 3; these data are provided for the other three sites in Supplemental Materials, Figures S1–S3. At all four sites, the floodplain deposits can be subdivided into two primary stratigraphic sequences with distinctly different assemblages of lithofacies. The lower 1–1.5 m of the banks at the three most downstream sites (USE 1–USE 3) are composed of darker colored, organic-rich sediments that could be physically traced along the study reach for at least a kilometer (Figure 3, Figures S1 and S2). The upper 0.5–1 m of this lithofacies was dominated by weathered, non-stratified (massive), organic-rich, loamy materials interpreted to be a buried A-horizon (i.e., an Ab-horizon). The dark-colored, cohesive sediments grade downward into mottled, gray to dark gray fine-grained, silty to loamy sands, which subsequently transition into a coarse sand and gravel lithofacies near the base of the banks (Figure 3, Figures S1 and S2). The gravels are typically encompassed by a fine-grained loamy to a loamy sand matrix. At Site USE 1, the dark-colored sediments fill an asymmetrical paleochannel (Figure 4). Collectively, these lithofacies form a fining-upward sequence commonly associated with the alluvial floodplain architecture of a single-thread, meandering channel produced by a combination of vertical and lateral accretion deposits [64,65].
The lower bank deposits at Site USE 4, while distinct from the overlying sediments, differ from those observed at the other three downstream sites (Figure 4 and Figure S3). Here, the dark-colored lithofacies possessing the buried A-horizon is either absent or is only a few centimeters thick. The unit is primarily characterized by a gray, cohesive, medium sandy loam that grades downward into clast-supported gravel. The sandy loam sediments exhibit a subangular block structure containing reddish-brown clay films on ped surfaces, suggesting that the organic-rich A-horizon of the buried soil was removed by erosion. The lower bank sediments at all four sites were interpreted chronologically to represent precolonial floodplain deposits on the basis of (1) the presence of the buried soils at the surface of the unit; (2) a lack of historical artifacts (particularly metal items), which were found throughout the overlying sediments, and (3) radiocarbon dates obtained on organic materials collected from within the deposits or along their upper bounding surface at other sites along Stick Elliott Creek that range between 290 ± 30 YBP and 3760 ± 30 YBP [30].
The sediments overlying the precolonial deposits are characterized by highly stratified, reddish-brown to buff-colored sediments that contained historical artifacts (e.g., metal straps), indicating that the unit post-dates European settlement. Miller et al. [30] found that, on average, legacy deposits possess a slightly lower percentage of silt and clay than the precolonial sediments, but the difference was statistically insignificant (t-test, p = 0.05). However, the legacy sediments differ from the precolonial deposits in that they are highly stratified, consisting of thin layers of sediment of differing grain sizes (Figure 2, Figure 5, and Figures S1–S3). The observed stratification is presumably related to the relatively rapid deposition of sediment of differing grain sizes during varying flood flow conditions (as described in more detail below) and/or to the migration of depositional features on the floodplain surface. Within the study reach, the upper 15 to 25 cm of material at the upstream most sites (USE 2–USE 4) form a distinct lithofacies dominated by generally loose, gray to reddish-brown sandy loams to loamy sands (Figure 5). Beneath this unit at Site USE 1 and USE 2, as well as near the surface of USE 3, the deposits are characterized by reddish-brown loamy sediments that contain laterally discontinuous, locally cross-bedded, fine-to-medium sand lenses of varying thickness. The lenses generally extend from about 6 cm in length to more than 1 m, and their thickness tends to increase with depth. The layers are often wavy and/or characterized by convoluted bedding that is laterally discontinuous. Stratification and the presence of loose, well-sorted sand is more extensive at Site USE 2, and less extensive at Site USE 3. At Site USE 4, stratification is much less prevalent, and the deposits contain a few lenses of gravel characterized by clasts <1 cm in maximum diameter. Significantly, none of the observed legacy deposits contained clasts larger than ~1 cm, which are common near the base of precolonial deposits.

3.2. Defining, Characterizing, and Correlating Chemostratigraphic Units

The identification of chemostratigraphic units was based on a geochemical fingerprint that was defined using a multi-step process. The initial step involved the application of a Kruskal–Wallis H test to the concentrations determined for 22 elements in samples collected from the four study sites. The Kruskal–Wallis H test showed that 19 elements had the potential to be used to differentiate between the groups at the 99 % confidence level (Table S1). A total of six elements (Co, Cr, Cu, V, W, Zn) were then selected to define chemostratigraphic units on the basis of (1) the potential for post-depositional migration of the elements (based on their affinity for the particulate matter), (2) the number of samples that exhibited concentrations above the detection limit, and (3) the magnitude of the vertical variations in elemental concentrations within the four stratigraphic sections (Figure S4). Preference was given to elements with higher and more systematic variations, as it was hypothesized that these would possess a higher potential to identify chemical differences between sedimentary layers.
Variations in elemental concentrations between stratigraphic units are often controlled by the grain size and composition of the sediments; higher concentrations tend to be associated with higher percentages of chemically reactive fine-grained (<63 µm) sediments [54,60]. Studies primarily related to metal contaminants from mining operations have shown that the transport of sediment-associated trace metals by fluvial (river) processes may partition the metals into specific deposition features (environments) on the basis of the physical characteristics (density, size, shape) of the particles with which they are associated. It seems possible, then, that elemental concentrations of a geochemical fingerprint within floodplain deposits could vary along the channel as a result of differences in sediment size and composition, thereby complicating the downstream correlation of chemostratigraphic units.
The relationships between elemental concentrations and grain size are often examined by means of correlation analysis (e.g., [34]). Prior to the analysis, the normality of the geochemical data was assessed using normal Q-Q plots and a Shapiro–Wilk normality test (Table S2). With the exception of W, the elements selected to develop a geochemical fingerprint were non-normally distributed at the 99% confidence level. Tungsten and grain size (as represented by the % silt and clay in the sample) were non-normally distributed at the 95 % confidence level. Aluminum and Ti concentrations were found to exhibit a normal distribution (Table S2). Therefore, the non-parametric Kendall tau b correlation analysis was used to assess the relations between each of the six fingerprinting elements and the sediment’s content of chemically reactive fine-grained (<63 µm) constituents in the samples. The Kendall tau b test is relatively robust with respect to outliers.
The correlation analysis demonstrated that, with the exception of Cr, elemental concentrations of the fingerprinting elements were statistically correlated at the p < 0.05 level to the fine sediment content of the deposits (Table 1). The correlation coefficients, however, were low (around 0.20), indicating only a weak influence of grain size on elemental concentrations. Much higher correlations were observed between Fe and Mn concentrations and the concentrations of the fingerprinting elements (Table 1), suggesting that the elements are associated in part with Fe and Mn oxyhydroxides that were widely observed within the deposits, particularly as films that lined root pores, soil fractures, and ped faces.
An alternative approach to assessing the compositional controls on elemental concentrations is through the use of lithogenic (reference) elements (e.g., Al, Fe, Si, and Ti) as proxies for grain size and composition [43,66]. Aluminum, Fe, and Ti, for example, are often associated with clay minerals as well as silt-sized phyllosilicates and heavy minerals [66]; thus, their concentrations are positively correlated to the quantity of clay- and silt-sized sediment in the deposits. Silica, associated with quartz, feldspar, and other non-reactive silicate minerals, is negatively correlated to metal concentrations as it tends to dilute their elemental contents.
An advantage of using a proxy element to assess the influence of grain size and composition on elemental concentrations is that the metal contents can be normalized by the concentration of the lithogenic proxy, thereby minimizing the effects of sediment grain size and composition on metal concentrations in the samples. The application of such proxy ratio data has become increasingly utilized in geochemical studies (e.g., [35,44,67]) but must be used with caution as the concentration of an elemental proxy can be influenced by various post-depositional processes, including weathering, diagenesis, and biogenic alterations [66,67]. The lithogenic elements may also be affected by differences in provenance. Herein, we used Fe as a proxy for sediment composition, in spite of the fact that it was not statistically related to the amount of fine sediment in the samples (Table 2) because (1) the concentrations between grain size and the other lithogenic elements (Al, Si, Ti) were weak (<0.28), and (2) Fe was more strongly correlated to the six metals used as a geochemical fingerprint and is likely to serve as a primary transporting agent of the metals. Iron may also simultaneously occur in specific minerals. Thus, the metal concentration data were normalized by Fe prior to their use in multivariate statistical analysis to minimize the influence of grain size and compositional differences between the samples on concentrations of the metals within the geochemical fingerprint.
Once normalized by Fe concentration, the concentrations of the geochemical fingerprinting elements from the four stratigraphic sections along Upper Stick Elliott Creek were analyzed using a principal component analysis (PCA), as shown in Table 2. The first two components of the analysis explained 83.74% of the variance. Principal component one (PC1) possesses strong positive loadings with V, Cr, W, and, to a lesser degree, Zn (Table 2). Cobalt is negatively loaded onto PC1. PC2 is associated with high positive component loadings for Cu, Zn, and to a lesser degree, Co (Table 2).
Component scores for the collected and analyzed sediment samples are plotted for each individual stratigraphic section in Figure 6, both in terms of an X-Y coordinate system and as a function of depth below the surface of the floodplain. The samples at each site form generally distinct clusters with minimal overlap (Figure 6a) and are therefore characterized by specific ranges of PC1 and PC2 scores (Table 3). Vertical plots of the component scores (Figure 6b) show that many of the defined units are present at several of the measured stratigraphic sites and can therefore be correlated between sites on the basis of the respective component score characteristics (Table 3, Figure 6b). The legacy deposits possess three well-defined chemostratigraphic units, whereas the precolonial deposits are characterized by a more complex architecture, exhibiting six chemostratigraphic units (Figure 6).
Given that the assignment of a sample to a given cluster or chemostratigraphic unit was a subjective process, a discriminant analysis (DA) was applied independently to the legacy sediments, the precolonial sediments, and all floodplain deposits to more fully assess the validity of the defined chemostratigraphic units. The analysis was based on the normalized geochemical data from all four sites, whereas the analyzed groups included in the DA were based on the chemostratigraphic units defined by the PCA (i.e., units 1–9, depending on the analysis). Table 4 shows that 88.6% of the samples from the legacy deposits were correctly classified into the chemostratigraphic units. Incorrectly classified samples occurred between units seven and eight, which interfinger with one another (Figure 6b). About 84% of the samples from the precolonial deposits were correctly classified (Table 5). When the geochemical data from both the legacy and precolonial deposits were analyzed together, the results were not as good; only 75.6% were correctly classified (Table 6). A few of the incorrectly classified samples from the latter analysis were from legacy deposits that immediately overlie the precolonial sediments. The inability to geochemically distinguish between these legacy deposit sediments and the underlying precolonial deposits is likely to be related to the localized incorporation of eroded precolonial sediments into the lower layers of the legacy deposits. Erosion of the precolonial deposits is indicated by the abrupt contact between the two units (Figure 3 and Figure 4) and the occurrence of black, organic-rich “clasts” of precolonial sediments within the lower layers of the legacy deposits.

3.3. Comparison of Chemo- and Lithostratigraphic Units

The precolonial lithofacies that form a fining upward sequence, combined with filled, asymmetrical paleochannels, are indicative of floodplain deposition by a combination of both lateral and vertical accretion along a meandering stream. Sedimentation rates were also presumably low, as indicated by the development of the organic-rich A-horizon (which is now buried) along the sequence’s upper bounding surface. In contrast, the legacy deposits are dominated by two primary lithofacies, consisting of (1) an intermediate layer, composed of stratified (bedded) and/or laminated sands or loamy sands of variable thickness and which locally contain laterally discontinuous lenses of well-sorted, loose sand, and (2) a lower lithofacies that overlies the precolonial deposits along an abrupt, erosional contact, and that is characterized by sediments similar to the overlying layer, but which are often darker in color and interbedded with gray to dark gray colored loamy sediments. Both of these lithofacies are characterized by significant variations in grain size, color, and bedding and contain laterally discontinuous sand layers suggestive of (1) rapid deposition during markedly different flow conditions and/or (2) shifting depositional features on the floodplain surface (Figure 5). Geochemically, the legacy and precolonial deposits possess distinct chemostratigraphic signatures. Thus, from both a chemical and lithologic perspective, the legacy and precolonial deposits represent distinct stratigraphic sequences characterized by contrasting facies deposited under significantly different geomorphic conditions and which were deposited at different times. In many small headwater basins within both the southern Appalachians and eastern/southeastern piedmont of the U.S., it is locally difficult to distinguish between legacy and precolonial deposits solely on the basis of lithologic characteristics. The geochemical data presented herein indicate that it might be possible to define such late Holocene stratigraphic sequences on the basis of their trace metal content. The spatial scale for which a geochemical distinction between legacy and precolonial sequences can be made is currently unknown, but when the data presented herein are combined with the data from Wang and Leigh [48], which were collected along the much larger Little Tennessee River, it appears that such chemostratigraphic approaches may be applicable to alluvial deposits in the watershed that are on the order of a few 100 km2.
One topic for which a distinction between precolonial and legacy deposits has become more important and for which chemostratigraphy may be of use is in the analyses of legacy nutrients. Legacy nutrients are nutrients derived from anthropogenic sources that have accumulated over long periods of time within a catchment and which often represent a significant source of nutrients to contemporary water bodies. Thus, it is necessary for water quality management plans to consider legacy nutrients, including those associated with legacy deposits. In fact, the erosion of legacy sediments has been shown to serve as an important source of legacy nutrients, so much so that the removal of legacy sediments deposited upstream of milldams has been proposed and tested as an effective stream restoration method [24].
At a finer (smaller) spatial resolution, there is a general correspondence between the lithofacies and the chemostratigraphic units (facies). The correlation between the two types of facies, however, is not perfect. At an even smaller scale, the defined lithologic and geochemical facies are less well aligned. For example, a comparison of unit grain size and sediment geochemistry on a sample-by-sample basis shows that there is little correlation between the two (Figure 2 and Figures S1–S3). This is not surprising given (1) the relatively weak correlation between the percent of fine sediment in the samples and the concentration of the metals used to develop the geochemical fingerprints (Table 1) and (2) that the geochemical data used in the analyses were normalized by Fe to account for differences in sediment composition. A significant difference between the lithofacies and chemostratigraphic units is the ability to correlate the latter on the basis of PC scores at a much higher spatial resolution and with more confidence than is possible using lithologic/sedimentologic characteristics alone (Figure 6b). Indeed, the correlation of sediment layers as thin as 5 cm (corresponding to a single sample) was possible on the basis of the geochemical fingerprints (Figure 6b). Thus, it is possible to define sediments that are likely to have been deposited contemporaneously over distances of at least several 100 m, thereby gaining additional insights into the timing and depositional processes involved in floodplain development. Whether these correlations can be made over larger distances in basins where trace metal contamination has not occurred remains unclear but is currently under investigation.
The observed spatial differences between the lithofacies and the chemostratigraphic units may be related in part to the different controls on the deposited sediments. Lithofacies associated with floodplains are likely to reflect, in large part, local depositional processes and environments. For example, the basal lithofacies within the precolonial deposits (composed of gravels, Figure 4) presumably reflect channel lag and/or lower point bar deposition in a high energy environment, whereas the fine-grained, organic-rich sediments at and near the surface of the precolonial sequence were deposited by vertical accretion processes on a relatively stable floodplain characterized by low energy. In contrast to the lithologic nature of the sediments, the geochemistry of the deposits most likely reflects (1) the provenance of the sediments deposited at a specific site and time, as has been shown by numerous geochemical fingerprinting studies [59,61,68,69,70,71], and/or (2) the partitioning of sediments from a given source as a function of size, density and shape into specific depositional features [72]. Such variations in the source are not only controlled by local processes but by factors that occur throughout the basin, including upland areas. A more detailed examination of sediment provenance as defined by geochemical fingerprinting methods, and its relation to the defined chemostratigraphic units, will be provided elsewhere.

3.4. Implications of Chemostratigraphic Correlations to Depositional Processes

The geomorphic responses during and following European settlement, and the resulting alluvial stratigraphy, within the study area of Big Harris Creek, are similar to those that have been observed and documented throughout the piedmont of the southeastern U.S. [5,27,28,29]. Prominent and widespread responses to land clearing during the late 1800s and early 1900s were gully formation, the incision of channels in headwater areas, and (where milldams were absent) the downstream deposition of the eroded sediments upon previously stable floodplains in the form of legacy sediments. Happ et al. [27], for example, found that headwater gully formation and trenching along Tobitubby and Hurricane valleys in South Carolina led to downstream sedimentation in a process they referred to as ‘sanding’. Within the Big Harris Creek basin examined herein, a combination of geomorphic, stratigraphic, and dendrochronologic data was used by Miller et al. [30] to document the spatial variations in geomorphic responses to land-use change within the basin, which they mapped in terms of process zones (or stream reaches of similar processes, morphology, and landforms) (Figure 1). Their data show that deep, headwater incision and gully formation (Figure 1 and Figure 2) led to the downstream deposition of legacy sediments on the valley floor in a manner analogous to that observed by Happ [27].
Happ [27] also noted that in many areas, downstream deposition was promoted by the filling or “chocking” of the channel with sediment as the “locus of sedimentation shifts downvalley”. Channel “chocking” then led to the upstream backfilling of the channel and the overbank deposition of sediment on the valley floor. Within Big Harris Creek, there is little evidence for the formation of such a filled channel or “sediment plug”. Rather, the transition point from upstream degradation (incision) to downstream aggradation was hypothesized to have migrated downvalley through time as the depth of upstream incision progressed, an observation also made by Happ [27] in other drainages in the area. The observed downstream variations in the thickness and dip of the bounding surfaces of chemostratigraphic units seven and eight within the legacy deposits are consistent with this hypothesis (Figure 6b). More specifically, the surfaces of the chemostratigraphic units are suggestive of a downstream pro-grading wave of deposition as is commonly observed in basins characterized by massive upstream sediment production and delivery to the axial channel [18,73,74,75,76,77].
On a more local scale, Happ [19] observed that floodplain deposition was dominated by the formation of crevasse splays and vertical accretion. In the case of Big Harris Creek, the processes responsible for the deposition of the legacy sediments at a site must explain several important characteristics, including (1) the erosional contact between the legacy and underlying precolonial deposits, (2) a general lack of coarse (gravel-sized) clasts within the legacy deposits, and (3) stratified units containing local, laterally discontinuous, sand and sandy loam textured layers that often occur as wavy or convoluted bedding. These characteristics are consistent with the deposition of the legacy deposits as crevasse splays and/or proximal sandsheets as flood flows rose and waned during an event. The sedimentology of the legacy sediments may also be attributed in part to the migration of depositional features (ripples, dunes) on the surface of the splay deposits and/or the periodic deposition and burial of more sandy sediments by finer-grained vertically accreted sediments during relatively minor overbank floods. Interestingly, the interfingering of chemostratigraphic units seven and eight (Figure 6b) is consistent with the downstream growth and migration of multiple splay or sandsheet deposits during the deposition of the legacy sediments (e.g., Site USE 2), perhaps as a result of changes in sediment supply or the magnitude of the overbank flows.
Chemostratigraphic unit nine, found at the three upstream most sites, generally corresponds to the loose to massive, darker-colored, loamy sand to sandy loam sediments. The dendrochronologic dating of trees growing on the floodplain surface suggest that this chemostratigraphic unit corresponds to the stabilization of the valley floor around the 1940s to 1960s in Big Harris Creek and, thus, is likely to have been formed by vertical accretion processes following channel incision that resulted from the implementation of soil conservation practices in the basin.
The obtained results suggest that the combined use of litho- and chemostratigraphic methods within headwater basins allows for a more quantitative assessment of the alluvial architecture of the floodplain deposits, thereby providing a more detailed understanding of the depositional processes that occur in response to land-use changes in watershed than could be obtained from the use of lithostratigraphic methods alone. A disadvantage of using chemostratigraphic methods is the number of samples that need to be analyzed for a wide range of elements. This problem is countered by the fact that (1) precise or relative concentrations are required for the analysis of chemostratigraphic units, and (2) recent advances in analytical chemistry, such as the development of portable (hand-held) XRF, have made it possible to analyze a large number of samples for multiple elements in a timely and cost-effective manner.

4. Summary and Conclusions

Chemostratigraphic methods were applied to floodplain alluvial deposits exposed along the channel banks of Upper Stick Elliott Creek, a tributary to Big Harris Creek located within the Piedmont Physiographic Province of the southeastern U.S. These deposits were described and sampled at four locations, after which 128 collected samples were analyzed for 22 elements using X-ray fluorescence. A multi-step process including an assessment of the percentage of samples with detectable concentrations, a Kruskal–Wallis H-Test, and the vertical variations in elemental concentrations were used to select a geochemical fingerprint that could then be applied to define chemostratigraphic units. The fingerprint consisted of six metals, including Co, Cu, Cr, V, W, and Zn. The concentrations of these metals were normalized by Fe concentrations to reduce the spatial variations in concentration induced by differences in sediment size and composition. A principal component analysis was then applied to define chemostratigraphic units, which were statistically verified using discriminant analysis. The defined chemostratigraphic units were generally independent of the deposit’s grain size distribution (as expected) but marginally reflected the larger-scale lithofacies defined in the field at each site. Of importance, the chemostratigraphic units could be quantitatively correlated between sites at a much higher spatial resolution (~5 cm) than was possible on the basis of their lithofacies characteristics, including grain size. The lithostratigraphic and chemostratigraphic architecture of the legacy deposits are consistent with a previously proposed model of the geomorphic responses of the channel to the extensive land-use change that accompanied the onset of cotton farming in the 1860s. The model suggests that land-use change resulted in the upstream incision and gully formation and downstream deposition on the floodplain surface. On the basis of the chemostratigraphic units, aggradation appears to have progressed downvalley as incision deepened. Deposition probably occurred in the form of splay deposits or proximal sandsheets. Variations in the thickness, grain size, and stratification of the legacy deposits were presumably influenced, then, by the relatively rapid deposition of sediments of differing grain sizes as a result of changing overbank flow conditions and the lateral and downvalley migration of the crevasses splays and their associated bedforms. The combined use of lithostratigraphic and chemostratigraphic data at a relatively small temporal and spatial scale allowed for more quantitative analysis of floodplain deposition than was possible using lithostratigraphic methods alone, even in this rural watershed where metal contamination was minimal. The geochemical definition of stratigraphic sequences (e.g., legacy deposits) over much larger spatial scales also appears promising.
A potential disadvantage of using chemostratigraphy is the number of samples that must be collected and analyzed to conduct detailed assessments. However, recent advances in analytical geochemistry, including the development of portable (hand-held) XRFs, significantly decrease the time and costs involved in such analyses, making chemostratigraphic methods more attractive.

Supplementary Materials

The following are available online at https://www.mdpi.com/article/10.3390/geosciences12050187/s1, Figure S1: Field descriptions and lithostratigraphic data at Site USE 1, Figure S2: Field descriptions and lithostratigraphic data at Site USE 3, Figure S3: Field descriptions and lithostratigraphic data at Site USE 4, Table S1: Kruskal–Wallis Test results, Figure S4: Variations in elemental fingerprint concentrations at the four sampled sites; Table S2: Shapiro-Wilk normality test results.

Author Contributions

Conceptualization, J.R.M.; methodology, S.N.S., C.L.H. and J.R.M.; validation of analytical results, S.N.S. and C.L.H.; formal analysis, S.N.S., J.R.M. and C.L.H.; investigation, S.N.S.; data curation, J.R.M.; writing—original draft preparation, J.R.M. and S.N.S.; writing—review and editing, C.L.H. and S.N.S.; visualization, S.N.S. and J.R.M.; supervision, J.R.M. and C.L.H.; project administration, J.R.M.; funding acquisition, J.R.M. All authors have read and agreed to the published version of the manuscript.

Funding

This research was funded by the North Carolina Division of Mitigation Services, DENR contract number 00461, and the Whitmire Endowment at Western Carolina University. The results presented in this paper do not necessarily reflect the opinion of the funding agencies.

Data Availability Statement

The data presented in this study are available on request from the corresponding author. Data that are publicly available are in the paper or in Supplemental Materials.

Acknowledgments

The authors thank Kelly Ferri and Lionel Villarroel for the help in the collection of alluvial stratigraphic and survey data. We also thank Gina Carney and Eldridge Machen for help in the laboratory analysis of sediment samples.

Conflicts of Interest

The authors declare no conflict of interest.

References

  1. Macklin, M.G.; Brewer, P.A.; Hudson-Edwards, K.A.; Bird, G.; Coulthard, T.J.; Dennis, I.A.; Lechler, P.J.; Miller, J.R.; Turner, J.N. A Geomorphological Approach to the Management of Rivers Contaminated by Metal Mining. Geomorphology 2006, 79, 423–447. [Google Scholar] [CrossRef]
  2. Macklin, M.G.; Lewin, J. Alluvial Responses to the Changing Earth System. Earth Surf. Process. Landf. 2008, 33, 1374–1395. [Google Scholar] [CrossRef]
  3. Swennen, R.; Van der Sluys, J. Anthropogenic Impact on Sediment Composition and Geochemistry in Vertical Overbank Profiles of River Alluvium from Belgium and Luxembourg. J. Geochem. Explor. 2002, 75, 93–105. [Google Scholar] [CrossRef]
  4. de Moor, J.J.W.; Kasse, C.; van Balen, R.; Vandenberghe, J.; Wallinga, J. Human and Climate Impact on Catchment Development during the Holocene—Geul River, the Netherlands. Geomorphology 2008, 98, 316–339. [Google Scholar] [CrossRef]
  5. Dearman, T.L.; James, L.A. Patterns of Legacy Sediment eposits in a Small South Carolina Piedmont Catchment, USA. Geomorphology 2019, 343, 1–14. [Google Scholar] [CrossRef]
  6. Allan James, L.; Beach, T.P.; Richter, D.D. Floodplain and Terrace Legacy Sediment as a Widespread Record of Anthropogenic Geomorphic Change. Ann. Am. Assoc. Geogr. 2021, 111, 742–755. [Google Scholar] [CrossRef]
  7. Trimble, S.W.; Happ, S.C.; Rittenhouse, G.; Dobson, G.C. 1940: Some Principles of Accelerated Stream and Valley Sedimentation. US Department of Agriculture Technical Bulletin 695. Prog. Phys. Geogr. 2008, 32, 337–345. [Google Scholar] [CrossRef]
  8. Knox, J.C. Valley Alluviation in Southwestern Wisconsin. Ann. Am. Assoc. Geogr. 1972, 62, 401–410. [Google Scholar] [CrossRef]
  9. Knox, J.C. Historical Valley Floor Sedimentation in the Upper Mississippi Valley. Ann. Am. Assoc. Geogr. 1987, 77, 224–244. [Google Scholar] [CrossRef]
  10. Knox, J.C. Floodplain Sedimentation in the Upper Mississippi Valley: Natural versus Human Accelerated. Geomorphology 2006, 79, 286–310. [Google Scholar] [CrossRef]
  11. Jacobson, R.B.; Coleman, D.J. Stratigraphy and Recent Evolution of Maryland Piedmont Flood Plains. Am. J. Sci. 1986, 286, 617. [Google Scholar] [CrossRef]
  12. Beach, T. The Fate of Eroded Soil: Sediment Sinks and Sediment Budgets of Agrarian Landscapes in Southern Minnesota, 1851–1988. Ann. Am. Assoc. Geogr. 1994, 84, 5–28. [Google Scholar] [CrossRef]
  13. Leigh, D.S. Mercury-Tainted Overbank Sediment from Past Gold Mining in North Georgia, USA. Environ. Geol. 1997, 30, 244–251. [Google Scholar] [CrossRef]
  14. Beach, T.; Luzzadder-Beach, S.; Cook, D.; Dunning, N.; Kennett, D.J.; Krause, S.; Terry, R.; Trein, D.; Valdez, F. Ancient Maya Impacts on the Earth’s Surface: An Early Anthropocene Analog? Quat. Sci. Rev. 2015, 124, 1–30. [Google Scholar] [CrossRef] [Green Version]
  15. Hooke, R.L. On the History of Humans as Geomorphic Agents. Geology 2000, 28, 843–846. [Google Scholar] [CrossRef]
  16. Wilkinson, B.H.; McElroy, B.J. The Impact of Humans on Continental Erosion and Sedimentation. GSA Bull. 2007, 119, 140–156. [Google Scholar] [CrossRef]
  17. James, L.A. Legacy Sediment: Definitions and Processes of Episodically Produced Anthropogenic Sediment. Anthropocene 2013, 2, 16–26. [Google Scholar] [CrossRef]
  18. Gilbert, G.K. Hydrualic-Mining Debris in the Sierra Nevada; United States Geological Survey: Washington, DC, USA, 1917. [Google Scholar]
  19. Miller, J.R.; Lechler, P.J.; Desilets, M. The Role of Geomorphic Processes in the Transport and Fate of Mercury in the Carson River Basin, West-Central Nevada. Environ. Geol. 1998, 33, 249–262. [Google Scholar] [CrossRef]
  20. Lecce, S.A. Spatial Patterns of Historical Overbank Sedimentation and Floodplain Evolution, Blue River, Wisconsin. Geomorphology 1997, 18, 265–277. [Google Scholar] [CrossRef]
  21. Orbock Miller, S.M.; Ritter, D.F.; Kochel, R.C.; Miller, J.R. Fluvial Responses to Land-Use Changes and Climatic Variations within the Drury Creek Watershed, Southern Illinois. Geomorphology 1993, 6, 309–329. [Google Scholar] [CrossRef]
  22. Schenk, E.R.; Hupp, C.R. Legacy Effects of Colonial Millponds on Floodplain Sedimentation, Bank Erosion, and Channel Morphology, Mid-Atlantic, USA1. JAWRA J. Am. Water Resour. Assoc. 2009, 45, 597–606. [Google Scholar] [CrossRef]
  23. Walter, R.C.; Merritts, D.J. Natural Streams and the Legacy of Water-Powered Mills. Science 2008, 319, 299–304. [Google Scholar] [CrossRef] [PubMed] [Green Version]
  24. Fleming, P.M.; Merritts, D.J.; Walter, R.C. Legacy Sediment Erosion Hot Spots: A Cost-Effective Approach for Targeting Water Quality Improvements. J. Soil Water Conserv. 2019, 74, 67A. [Google Scholar] [CrossRef] [Green Version]
  25. Wegmann, K.W.; Lewis, R.Q.; Hunt, M.C. Historic Mill Ponds and Piedmont Stream Water Quality: Making the Connection near Raleigh, North Carolina; Field Guide 29; Geological Society of America: Boulder, CO, USA, 2012. [Google Scholar]
  26. Donovan, M.; Miller, A.; Baker, M.; Gellis, A. Sediment Contributions from Floodplains and Legacy Sediments to Piedmont Streams of Baltimore County, Maryland. Geomorphology 2015, 235, 88–105. [Google Scholar] [CrossRef]
  27. Happ, S.C. Sedimentation in South Carolina Piedmont Valleys. Am. J. Sci. 1945, 243, 113. [Google Scholar] [CrossRef]
  28. Happ, S.C.; Rittenhouse, G.; Dobson, G.C. Some Principles of Accelerated Stream and Valley Sedimentation, General Technical Bulletin 105. 1940. Available online: https://www.yumpu.com/en/document/view/17676383/some-principles-of-accelerated-stream-and-valley-sedimentation (accessed on 24 April 2022).
  29. Trimble, S.W. Man-Induced Soil Erosion on the Southern Piedmont, 1700-1970; Soil and Water Conservation Society of America: Ankeny, IA, USA, 1974. [Google Scholar]
  30. Miller, J.R.; Grow, D.; Philyaw, L.S. Influence of Historical Land-Use Change on Contemporary Channel Processes, Form, and Restoration. Geosciences 2021, 11, 423. [Google Scholar] [CrossRef]
  31. Jackson, C.R.; Martin, J.K.; Leigh, D.S.; West, L.T. A Southeastern Piedmont Watershed Sediment Budget: Evidence for a Multi-Millennial Agricultural Legacy. J. Soil Water Conserv. 2005, 60, 298. [Google Scholar]
  32. Bain, D.J.; Brush, G.S. Early Chromite Mining and Agricultural Clearance: Opportunities for the Investigation of Agricultural Sediment Dynamics in the Eastern Piedmont (USA). Am. J. Sci. 2005, 305, 957. [Google Scholar] [CrossRef]
  33. Grabowski, R.C.; Surian, N.; Gurnell, A.M. Characterizing Geomorphological Change to Support Sustainable River Restoration and Management. WIREs Water 2014, 1, 483–512. [Google Scholar] [CrossRef]
  34. Miller, J.R.; Watkins, X.; O’Shea, T.; Atterholt, C. Controls on the Spatial Distribution of Trace Metal Concentrations along the Bedrock-Dominated South Fork New River, North Carolina. Geosciences 2021, 11, 519. [Google Scholar] [CrossRef]
  35. Hoyle, J.; Brooks, A.; Brierley, G.; Fryirs, K.; Lander, J. Spatial Variability in the Timing, Nature and Extent of Channel Response to Typical Human Disturbance along the Upper Hunter River, New South Wales, Australia. Earth Surf. Process. Landf. 2008, 33, 868–889. [Google Scholar] [CrossRef] [Green Version]
  36. Baillie, M.B.; Salant, N.L.; Schmidt, J.C. Using a Historical Aerial Photograph Analysis to Inform Trout Habitat Restoration Efforts. Earth Surf. Process. Landf. 2011, 36, 1693–1702. [Google Scholar] [CrossRef]
  37. Woelfle-Erskine, C.; Wilcox, A.C.; Moore, J.N. Combining Historical and Process Perspectives to Infer Ranges of Geomorphic Variability and Inform River Restoration in a Wandering Gravel-Bed River. Earth Surf. Process. Landf. 2012, 37, 1302–1312. [Google Scholar] [CrossRef]
  38. Boyle, J.F. Inorganic Geochemical Methods in Palaeolimnology. In Tracking Environmental Change Using Lake Sediment Geochemical Methods; Last, W.M., Smol, J.P., Eds.; Khrwer: Dordrecht, The Netherlands, 2001. [Google Scholar]
  39. Banner, J.L. Radiogenic Isotopes: Systematics and Applications to Earth Surface Processes and Chemical Stratigraphy. Earth-Sci. Rev. 2004, 65, 141–194. [Google Scholar] [CrossRef]
  40. Mabrouk El Asmi, A.; Jarvis, I.; Belayouni, H.; Moody, R.; de Cabrera, S. An Integrated Chemostratigraphic Study of the Campanian-Early Maastrichtian Deposits of the Offshore Miskar Field in Southeastern Tunisia: SIS, δ13C and δ18O Isotopes, and Elemental Geochemistry. Stratigraphy 2005, 2, 193–216. [Google Scholar]
  41. Chillrud, S.N.; Hemming, S.; Shuster, E.L.; Simpson, H.J.; Bopp, R.F.; Ross, J.M.; Pederson, D.C.; Chaky, D.A.; Tolley, L.-R.; Estabrooks, F. Stable Lead Isotopes, Contaminant Metals and Radionuclides in Upper Hudson River Sediment Cores: Implications for Improved Time Stratigraphy and Transport Processes. Chem. Geol. 2003, 199, 53–70. [Google Scholar] [CrossRef]
  42. Hudson-Edwards, K.A.; Macklin, M.G.; Finlayson, R.; Passmore, D. Medieval Lead Pollution in the River Ouse at York. J. Archaeol. Sci. 1999, 26, 809–819. [Google Scholar] [CrossRef]
  43. Matys Grygar, T.; Elznicová, J.; Kiss, T.; Smith, H.G. Using Sedimentary Archives to Reconstruct Pollution History and Sediment Provenance: The Ohře River, Czech Republic. CATENA 2016, 144, 109–129. [Google Scholar] [CrossRef]
  44. Lecce, S.A.; Pavlowsky, R.T. Floodplain Storage of Sediment Contaminated by Mercury and Copper from Historic Gold Mining at Gold Hill, North Carolina, USA. Geomorphology 2014, 206, 122–132. [Google Scholar] [CrossRef]
  45. Ciszewski, D. Pollution of Mala Panew River Sediments by Heavy Metals: Part I. Effect of Changes in River Bed Morphology. Pol. J. Environ. Sci. Stud. 2004, 13, 589–595. [Google Scholar]
  46. Hobo, N.; Makaske, B.; Wallinga, J.; Middelkoop, H. Reconstruction of Eroded and Deposited Sediment Volumes of the Embanked River Waal, the Netherlands, for the Period Ad 1631–Present. Earth Surf. Process. Landf. 2014, 39, 1301–1318. [Google Scholar] [CrossRef]
  47. Notebaert, B.; Houbrechts, G.; Verstraeten, G.; Broothaerts, N.; Haeckx, J.; Reynders, M.; Govers, G.; Petit, F.; Poesen, J. Fluvial Architecture of Belgian River Systems in Contrasting Environments: Implications for Reconstructing the Sedimentation History. Neth. J. Geosci. Geol. En Mijnb. 2011, 90, 31–50. [Google Scholar] [CrossRef] [Green Version]
  48. Wang, L.; Leigh, D.S. Anthropic Signatures in Alluvium of the Upper Little Tennessee River Valley, Southern Blue Ridge Mountains, USA. Anthropocene 2015, 11, 35–47. [Google Scholar] [CrossRef] [Green Version]
  49. Leigh, D.S. Morphology and Channel Evolution of Small Streams in the Southern Blue Ridge Mountains of Western North Carolina. Southeast. Geogr. 2010, 50, 397–421. [Google Scholar] [CrossRef]
  50. Price, K.; Leigh, D.S. Morphological and Sedimentological Responses of Streams to Human Impact in the Southern Blue Ridge Mountains, USA. Geomorphology 2006, 78, 142–160. [Google Scholar] [CrossRef] [Green Version]
  51. Spangenberg, A.G. Journal of August Gottlieb Spangenberg’s Voyage to North Carolina to Establish a Moravian Settlement, Vol 5, September 13, 1752-January 8, 17531752. Available online: https://docsouth.unc.edu/csr/index.php/document/csr05-0001 (accessed on 10 October 2021).
  52. Link, W.A. North Carolina: Change and Tradition in a Southern State; Harlan Davidson: Wheeling, IL, USA, 2009. [Google Scholar]
  53. CCSWCD. Cleveland County Agriculture; Cleveland Soil and Water Conservation District; Arcadia Publishing: Charleston, SC, USA, 2016. [Google Scholar]
  54. Wade, A.M.; Richter, D.D.; Cherkinsky, A.; Craft, C.B.; Heine, P.R. Limited Carbon Contents of Centuries Old Soils Forming in Legacy Sediment. Geomorphology 2020, 354, 107018. [Google Scholar] [CrossRef]
  55. Kottlowski, F.E. Measuring Stratigraphic Sections; Geological Field Techniques Series; Holt, Rinehart and Winston: New York, NY, USA, 1965. [Google Scholar]
  56. Bridge, J.S. Rivers and Floodplains: Forms, Processes, and Sedimentary Record; Blackwell: Malden, MA, USA, 2003. [Google Scholar]
  57. SSDS. Soil Survey Manual; U.S Government Printing Office: Washington, DC, USA, 2017. [Google Scholar]
  58. Horowitz, A.J. Primer on Sediment-Trace Element Chemistry; Lewis Publishers: Boca Raton, FL, USA, 1991; ISBN 978-0-87371-499-0. [Google Scholar]
  59. Collins, A.L.; Blackwell, M.; Boeckx, P.; Chivers, C.-A.; Emelko, M.; Evrard, O.; Foster, I.; Gellis, A.; Gholami, H.; Granger, S.; et al. Sediment Source Fingerprinting: Benchmarking Recent Outputs, Remaining Challenges and Emerging Themes. J. Soils Sediments 2020, 20, 4160–4193. [Google Scholar] [CrossRef]
  60. Spectro. Sample Preparation Procedures; XEPOS Benchtop XRF Spectrometer/Original Operating Instructions: Kleve, Germany, 2017; pp. 33–36. [Google Scholar]
  61. Collins, A.L.; Zhang, Y.; McChesney, D.; Walling, D.E.; Haley, S.M.; Smith, P. Sediment Source Tracing in a Lowland Agricultural Catchment in Southern England Using a Modified Procedure Combining Statistical Analysis and Numerical Modelling. Sci. Total Environ. 2012, 414, 301–317. [Google Scholar] [CrossRef]
  62. Hudson-Edwards, K.A. Sources, Mineralogy, Chemistry and Fate Ofheavy Metal-Bearing Particles in Mining-Affected River Systems. Mineral. Mag. 2003, 67, 205–217. [Google Scholar] [CrossRef]
  63. Sullivan, S. Chemostratigraphic Analysis of Legacy and Late Holocene, Pre-Settlement Deposits, Upper Stick Elliott Creek, North Carolina. Master’s Thesis, Western Carolina University, Cullowhee, SC, USA, 2020. [Google Scholar]
  64. Reineck, H.E.; Singh, I.B. Depositional Sedimentary Environments, 2nd ed.; Springer-Verlag: Berlin/Heidelberg, Germany, 1980. [Google Scholar]
  65. Bridge, J.S.; Demicco, R.V. Earth Surface Processes, Landforms, and Sediment Deposits; University Press: Cambridge, MA, USA, 2008; ISBN 978-0-521-85780-2. [Google Scholar]
  66. Bábek, O.; Grygar, T.M.; Faměra, M.; Hron, K.; Nováková, T.; Sedláček, J. Geochemical Background in Polluted River Sediments: How to Separate the Effects of Sediment Provenance and Grain Size with Statistical Rigour? CATENA 2015, 135, 240–253. [Google Scholar] [CrossRef]
  67. Bloemsma, M.R.; Zabel, M.; Stuut, J.B.W.; Tjallingii, R.; Collins, J.A.; Weltje, G.J. Modelling the Joint Variability of Grain Size and Chemical Composition in Sediments. Sediment Geol. 2012, 280, 135–148. [Google Scholar] [CrossRef]
  68. Collins, A.L.; Walling, D.E.; Leeks, G.J.L. Use of Composite Fingerprints to Determine the Provenance of the Contemporary Suspended Sediment Load Transported by Rivers. Earth Surf. Process. Landf. 1998, 23, 31–52. [Google Scholar] [CrossRef]
  69. Collins, A.L.; Williams, L.J.; Zhang, Y.S.; Marius, M.; Dungait, J.A.J.; Smallman, D.J.; Dixon, E.R.; Stringfellow, A.; Sear, D.A.; Jones, J.I.; et al. Catchment Source Contributions to the Sediment-Bound Organic Matter Degrading Salmonid Spawning Gravels in a Lowland River, Southern England. Sci. Total Environ. 2013, 456–457, 181–195. [Google Scholar] [CrossRef] [PubMed]
  70. Miller, J.R.; Mackin, G. Concentrations, Sources, and Potential Ecological Impacts of Selected Trace Metals on Aquatic Biota within the Little Tennessee River Basin, North Carolina. Water Air Soil Pollut. 2013, 224, 1613. [Google Scholar] [CrossRef]
  71. Miller, J.R.; Lord, M.; Yurkovich, S.; Mackin, G.; Kolenbrander, L. Historical Trends in Sedimentation Rates and Sediment Provenance, Fairfield Lake, Western North Carolina1. JAWRA J. Am. Water Resour. Assoc. 2005, 41, 1053–1075. [Google Scholar] [CrossRef]
  72. Matys Grygar, T.; Popelka, J. Revisiting Geochemical Methods of Distinguishing Natural Concentrations and Pollution by Risk Elements in Fluvial Sediments. J. Geochem. Explor. 2016, 170, 39–57. [Google Scholar] [CrossRef]
  73. Knighton, A.D. The Gravel–Sand Transition in a Disturbed Catchment. Geomorphology 1999, 27, 325–341. [Google Scholar] [CrossRef]
  74. Lisle, T.E.; Cui, Y.; Parker, G.; Pizzuto, J.E.; Dodd, A.M. The Dominance of Dispersion in the Evolution of Bed Material Waves in Gravel-Bed Rivers. Earth Surf. Process. Landf. 2001, 26, 1409–1420. [Google Scholar] [CrossRef]
  75. James, L.A. Bed Waves at the Basin Scale: Implications for River Management and Restoration. Earth Surf. Process. Landf. 2006, 31, 1692–1706. [Google Scholar] [CrossRef]
  76. Allan James, L. Secular Sediment Waves, Channel Bed Waves, and Legacy Sediment. Geogr. Compass 2010, 4, 576–598. [Google Scholar] [CrossRef]
  77. Sims, A.J.; Rutherfurd, I.D. Management Responses to Pulses of Bedload Sediment in Rivers. Geomorphology 2017, 294, 70–86. [Google Scholar] [CrossRef]
Figure 1. (a) Map showing the location of the Big Harris Creek basin in North Carolina; (b) Spatial distribution of the 7 defined process zones within the basin and the location of the described stratigraphic sections. Descriptions of process zones can be found in Miller et al. [30]. Mapped areas of alluvium are characterized by legacy sediments overlying precolonial deposits. North Carolina map is from the USGS. LiDAR DEM from the North Carolina Spatial Data Download Center (https://sdd.nc.gov/, accessed on 10 October 2021).
Geosciences 12 00187 g001
Figure 2. (a) LiDAR DEM showing detailed view of geomorphic features along Stick Elliott Creek. LiDAR DEM from the North Carolina Spatial Data Download Center (https://sdd.nc.gov/, accessed on 10 October 2019); (b) Schematic diagram of the geomorphic responses documented along the lower reaches of Big Harris Creek by Miller et al. [30] during and following European settlement.
Geosciences 12 00187 g002
Figure 3. (a) Field descriptions, (b) relationship between fine sediment content and PCA scores, and (c) photograph of the stratigraphic section analyzed at Site USE 2. Numbers shown within the plot of PC scores refer to chemostratigraphic units. These data are provided for the other sites in Figures S1–S3.
Geosciences 12 00187 g003
Figure 4. (a) Photograph of stratigraphic section described at Site USE 1 showing filled paleochannel within the lower precolonial deposits and the nature of the overlying legacy sediments; (b) Gravel facies commonly observed at the base of the precolonial deposits.
Geosciences 12 00187 g004
Figure 5. (Upper graphs) Comparison of the vertical variations in the fine sediment content of the precolonial and legacy deposits at the four examined sites; (Bottom) Photographs of the deposits at the four sites. Dashed-red line represents contact between legacy and precolonial sediments. Downvalley correlation of distinct lithostratigraphic deposits can only be conducted at a relatively large (10s of cm) scale.
Geosciences 12 00187 g005
Figure 6. (a) X-Y plots of component scores used to define the chemostratigraphic units at USE 1, USE 2, USE 3, and USE 4. Chemostratigraphic units were plotted as clusters of samples on the plots, each of which are encompassed by a colored circle. Orange circles denote chemostratigraphic units within the precolonial deposits; blue circles represent units within the legacy deposits. Groupings were subjectively defined. The PC scores for unit 1 at Site USE 4 overlap with unit 7. (b) Defined and correlated chemostratigraphic units within the study reach. Bar graphs show component scores that were used to define the chemostratigraphic units. Italicized numbers in (a) and (b) refer to chemostratigraphic units, defined from oldest to youngest, and allow for correlation between plots.
Geosciences 12 00187 g006
Table 1. Kendall’s tau b correlation coefficients between elements of the developed chemostratigraphic fingerprints (italics, bold), grain size, and selected lithogenic (reference) elements.
CoCrCuVWZnMud aAlFeMnSiTi
Co1.00
Cr0.51 b1.00
Cu0.73 b0.41 b1.00
V0.62 b0.47 b0.65 b1.00 .
W0.61 b 0.46 b0.53 b0.49 b1.00
Zn0.59 b0.51 b0.65 b0.61 b0.48 b1.00
Mud a0.17 b0.080.20 b0.22 b0.13 c0.101.00
Al0.35 b0.30 b0.35 b0.37 b0.250.25 b0.221.00
Fe0.85 b0.47 b0.72 b0.57 b0.60 b0.59 b0.100.311.00
Mn0.42 b0.30 b0.43 b0.28 b0.200.47 b−0.060.080.47 b1.00
Si−0.33 b−0.31 b−0.46 b−0.49 b−0.27−0.46 b−0.29 b−0.29 b−0.32 b−0.081.00
Ti0.47 b0.46 b0.43 b0.52 b0.56 b0.47 b0.21 b0.33 b0.43 b0.16−0.25 b1.00
a Silt + clay sized particles (<63 µm); b Significant at the 99% level; c Significant at the 95% level.
Table 2. Loadings on the first two principal components (PC1 and PC2).
Element in FingerprintComponent
PC1PC2
Co−0.780.44
Cr0.97−0.07
Cu−0.140.86
V0.920.27
W0.94−0.08
Zn0.610.59
83.74% cumulative variance explained.
Table 3. Summary of general component scores for chemostratigraphic units.
UnitDeposit AgePC1 ScoresPC2 Scores
1Precolonial SedimentsNegative (−0.25 to −0.75)Negative (−0.05 to −0.55)
2Precolonial SedimentsPositive (1.00 to 2.65)Negative (−0.12 to −0.90)
3Precolonial SedimentsPositive (0.76 to 2.60) 1Positive (0.30 to 2.00) 1
4Precolonial SedimentsPositive (0.15 to 1.10)Negative (−0.85 to −1.60)
5Precolonial SedimentsNegative (−0.05 to −0.60)Positive (1.00 to 1.60)
6Precolonial SedimentsNegative (−0.12 to 0.28)Pos./Neg. (−0.25 to 0.15)
7Legacy SedimentNegative (−0.50 to −0.89) 2Negative (0.60 to −1.90) 2
8Legacy SedimentNegative (−0.04 to 1.08)Positive (0.08 to 1.20)
9Legacy SedimentNegative (−0.55 to −0.89)Positive (1.08 to 3.27)
1 Slightly lower scores at Site USE 4; 2 less negative values at Site USE 4.
Table 4. Summary of samples from chemostratigraphic units in legacy deposits that were correctly classified by discriminant analysis.
Predicted Group Membership
Strat. UnitUnit 7Unit 8Unit 9Total
Count
Unit 7274031
Unit 8331135
Unit 90044
Percent
Unit 787.112.90100
Unit 88.688.62.9100
Unit 900100100
88.6% of original grouped cases correctly classified.
Table 5. Summary of samples from each chemostratigraphic unit within the precolonial deposits that were correctly classified by discriminant analysis.
Predicted Group Membership
Strat. UnitUnit 1Unit 2Unit 3Unit 4Unit 5Unit 6Total
Count
Unit 12000002
Unit 2116120020
Unit 3301501019
Unit 401090010
Unit 50000404
Unit 60000022
Percent
Unit 110000000100
Unit 258051000100
Unit 315.8078.905.30100
Unit 401009000100
Unit 500001000100
Unit 600000100100
84.2% of original grouped cases correctly classified
Table 6. Summary of samples from chemostratigraphic units in both legacy and precolonial deposits that were correctly classified by discriminant analysis when the data were combined.
Predicted Group Membership
Strat. UnitUnit 1Unit 2Unit 3Unit 4Unit 5Unit 6Unit 7Unit 8Unit 9Total
Count
Unit 12000000002
Unit 2017000300020
Unit 3101200600019
Unit 4000100000010
Unit 50000400004
Unit 61000010002
Unit 7700005181031
Unit 8100030228135
Unit 90000000044
Percent
Unit 110000000000100
Unit 2085.000015000100
Unit 35.3063.20031.6000100
Unit 400010000000100
Unit 500001000000100
Unit 650000050000100
Unit 722.6000016.158.13.20100
Unit 82.90008.605.7802.9100
Unit 900000000100100
75.6% of original grouped cases correctly classified.
Publisher’s Note: MDPI stays neutral with regard to jurisdictional claims in published maps and institutional affiliations.

