Article

Effect of Boulder Size on Debris Flow Impact Pressure Using a CFD-DEM Numerical Model

1
Université Clermont Auvergne, Clermont Auvergne INP, CNRS, Institut Pascal, F-63000 Clermont-Ferrand, France
2
Itasca Consultants SAS, 29 Avenue Joannes Masset, F-69009 Lyon, France
3
Université Clermont-Auvergne, Laboratoire Magmas et Volcans, OPGC, CNRS et IRD, Campus Les Cézeaux, F-63000 Clermont-Ferrand, France
*
Authors to whom correspondence should be addressed.
Geosciences 2022, 12(5), 188; https://doi.org/10.3390/geosciences12050188
Submission received: 30 March 2022 / Revised: 20 April 2022 / Accepted: 23 April 2022 / Published: 26 April 2022
(This article belongs to the Section Natural Hazards)

Abstract

:
Debris flows (DFs) are dangerous events that can cause the complete destruction of buildings and infrastructure, such as bridges; DFs therefore represent a high risk to public safety in exposed areas. The impact pressures due to these flows are essentially determined by the flow height, velocity and density, but other parameters that are less often considered are also involved. We developed a numerical model to evaluate the impact pressure of mass flows, focusing on a better description of the influence of the blocks transported in these flows: the block size strongly influences the impact pressure, which has a strong effect on structural damage. The numerical model proposed considers a staggered, loosely one-way granular–fluid coupling based on a distinct-element-method code, using the separate simulation results of a computing fluid dynamics code used to model the fluid phase. This model estimates the impact pressure distribution due to blocks at the local scale of the obstacle; the pressure due to the fluid phase can be added afterwards. The pressure applied by the DF increased with the maximum block size for a given set of DF characteristics: velocity, height and apparent density. The vulnerability of a given structure depends on the intensity of DFs: the pressure applied on the structure is one of considerable intensity. The existing vulnerability functions are interpreted in the light of the results obtained with the numerical model. This interpretation highlights the need to integrate new parameters in the intensity to better evaluate structures’ vulnerability to debris flows.

1. Introduction

Debris flows (DFs) are rapid mass movements of mixed debris and water in river channels that are common in mountainous terrains. They most often occur after heavy rainfall, when rainwater can mobilize large amounts of sediment. Due to their high mobility, debris flows can travel long distances, up to tens of kilometers [1]. The different types of DF can be distinguished according to the sediment concentration, particle size distribution, bulk flow density, and triggering phenomena. Debris flows are hazardous events that can result in the complete destruction of civil structures such as buildings or bridges. A proper assessment of the vulnerability of these structures should make possible more efficient risk assessment, emergency management and mitigation measures [2,3,4,5].
Many flow simulation models exist, such as VolcFLOW [6], FLO-2D [7], LaharZ and Titan2D [2,8]. They are useful for improving understanding of flow behavior and predicting its spatial distribution in areas and for developing hazard and risk maps when coupled with exposure challenges [9]. These digital programs or codes are used to simulate flows and reproduce some of their effects. For example, [1] have distinguished at least three types of numerical codes (1) statistical models, such as LAHARZ and DAN-W, which simulate the “runout” distance [10,11]; (2) 2D models based on “depth-averaged shallow water” equations by means of the conservation of mass and momentum by depth equations, such as TITAN2D [12] and VolcFlow [6]; and (3) 3D hydrological approach models based on a Lagrangian code, such as “Smoothed particle hydrodynamics” (SPH) [13].
The literature provides several numerical approaches that are able to evaluate the impact of a DF on a barrier or obstacle [14,15,16]. It can be modeled by continuum or discrete approaches. In continuum approaches, the flow is often treated as a viscous fluid [17]. In discrete approaches, the DF is modeled by an assembly of discrete particles [16,18,19]. The motions of the particles and their interactions obey the fundamental laws of motion. The interaction between the flow and the structure is always a challenge due to the complexity of the problem.
In phenomenological terms, DF-induced damage results from three main forces: (1) hydrodynamic pressure; (2) hydrostatic pressure; and (3) collision forces [20]. Density, velocity, flow depth, and the minimum impact angle on the obstacle are all significant parameters of impact forces, but some authors have added more parameters to this list (see [1]). For instance, the block sizes carried by the flow and collisions with obstacles are parameters that are not well studied in the literature, even though they have a significant influence on the impact pressures [21].
The most recent simulations of DFs [3,17] focus on the hydraulic effect of the flow without considering the contribution of the solid fraction. However, several authors emphasize the importance of this parameter in their research [22,23]. Our approach considers a discrete method (DEM) with coupled computational fluid dynamics (CFD): the sensitivity of the impact pressure results as a function of macroscopic flow parameters were evaluated and validated [24]. Several parameters of the model related to the flows, such as the grain size distribution and the shapes of the particles, or related to the structure, such as shape, orientation, and number, remain insufficiently studied in the literature, in terms of their influence on the impact pressure. In this paper, we focus on the influence of the block size to better evaluate how it can influence the impact pressure on a structure, and suggest that the block size can be utilized for better assessing the vulnerability of structures.
The model used here better accounts for the effect of block size on impact, without being limited to a simple granular flow model. By using a DEM approach [25], the impact forces of each block on the structure can be recorded. Thus, the distribution of individual contacts between the blocks and the pillar can be plotted over time. This analysis provides the impact pressure applied by the flow on the structure as a function of the particle size and its position in the flow.
The objectives of this work are to (1) simulate a debris flow with given characteristics in a channel with an obstacle, (2) show the influence of the block size on the impact pressure on exposed structures and (3) provide a better estimate of structures’ vulnerability as a function of this parameter.

2. Methods and Parameters

2.1. CFD-DEM Numerical Approach

Several methods exist to evaluate the impact of DFs on obstacles. These methods are based on different approaches, ranging from: (1) pure granular models simulating dry granular flows using DEM [19]; (2) fluid-granular models simulating the fluid–solid mixture by coupling, for example, DEM and the lattice Boltzman method (LBM) [15]; (3) pure fluid models using, for example, the smoothed particle hydrodynamics (SPH) method [17]. Single-phase (fluid or granular) approaches are generally numerically efficient, in contrast to coupled approaches, which need longer computational times.
In this study, a staggered, loosely one-way granular–fluid coupling based on CFD-DEM model is used to estimate the impact pressure of the DF at the pillar’s local scale by better describing the effect of blocks [24]. The largest solid phases involved in the flow are considered as blocks and explicitly modelled using DEM (PFC3D code, Itasca), whereas the fine-grained solid fraction is integrated in the fluid phase. This simplified coupling is useful to estimate the impact of DF on a pillar with reasonable calculation time [24].
In the DEM part of the model, a linear contact law is used in normal and tangential directions between blocks and between block and wall. A Coulomb friction criterion is considered to limit the tangential component of contact force, with respect to normal component. The block shape is spherical, so a linear rolling resistance law is added in the contact model to mimic the effect of angular blocks by limiting the rolling of spherical particles [26]. The rolling resistance law applies a moment on the particle, calculated as follows:
Δ M r = k r Δ θ b
where Δ θ b is the relative bend–rotation increment and k r is the rolling resistance stiffness.
The two-phase granular–fluid model uses CFD results that are obtained in the first step and are subsequently used as input in the DEM approach (one-way coupling) in order to take into account the effect of the fluid motion on blocks. The simulation of the fluid was conducted with Telemac3d with the following boundary conditions: a constant flow rate Q at the entrance of the channel and a constant flow depth h at the exit. More details on the steps of the simulation process can be found in [24].
The fluid phase is considered to be a perfectly mixed system, with constant physical properties and distribution of fine solids. It generates two effects on the blocks: Archimedes’ force and the drag force (Equation (2)). The drag force is expressed as follows [27]:
F d = 1 2 c d ρ f π d 2 4 v f v b v f v b n ζ + 1
where ρ f is the density of the fluid (kg/m3), d is the block diameter (m), c d is the drag coefficient, v b is the velocity of the immersed block (m/s), v f is the velocity vector of the fluid phase (m/s), n is the solid fraction in the flow and ζ is a term ranging between 3.4 and 3.7.
In general, quantifying impact pressure is challenging: pressure depends on the flow depth, density and flow velocity, but parameters related to the blocks or the structure are poorly studied even if they are commonly supposed to influence this pressure [20,28,29]. In addition, the quantification of vulnerability depends on the impact pressure. Hence, it is of interest to show the role of block size and argue that vulnerability functions can be improved.

2.2. Physical and Mechanical Parameters of the Model

For the particle size distribution, blocks are distributed in four size classes, between a minimum diameter d m i n and a maximum diameter d m a x . It is assumed that d m a x is the threshold between the fine-grained particles and the blocks: this threshold is selected to reduce the number of blocks and, therefore, the calculation time [24]. The velocity field and the flow depth of the fluid phase depend on the geometry of the channel and are used to compute drag forces, as described in Equation (2). The model considers the movements of the blocks and the fluid separately and integrates the effect of the fluid on the blocks.
The calibration procedure that is used to determine the parameters of the DEM model is detailed by [24]. We determined the characteristics of the debris flow to be simulated (Table 1). Next, we implemented some of the physical parameters of the model concerning the particle size distribution and the proportion of blocks in the experimental debris flow (Table 2). Finally, the mechanical parameters are set one after the other by order of influence on the flow characteristics, following the calibration procedure (Table 3).
In the simulation runs, we kept the minimum diameter ( d m i n = 0.1 m) and increased the maximum block diameter to four values of d m a x between 0.4 and 1.5 m, with each value representing one case (Figure 1). Upon checking the DF characteristics in a channel without an obstacle, we obtained the same global flow characteristics as those listed in Table 1: density, flow rate and solid concentration. To be more representative, for the subsequent numerical results, four runs of the same flow case were simulated: each of the four runs differed only in the blocks’ representative elementary volume (REV), which was randomly generated within the corresponding particle size distribution curve.

3. Results

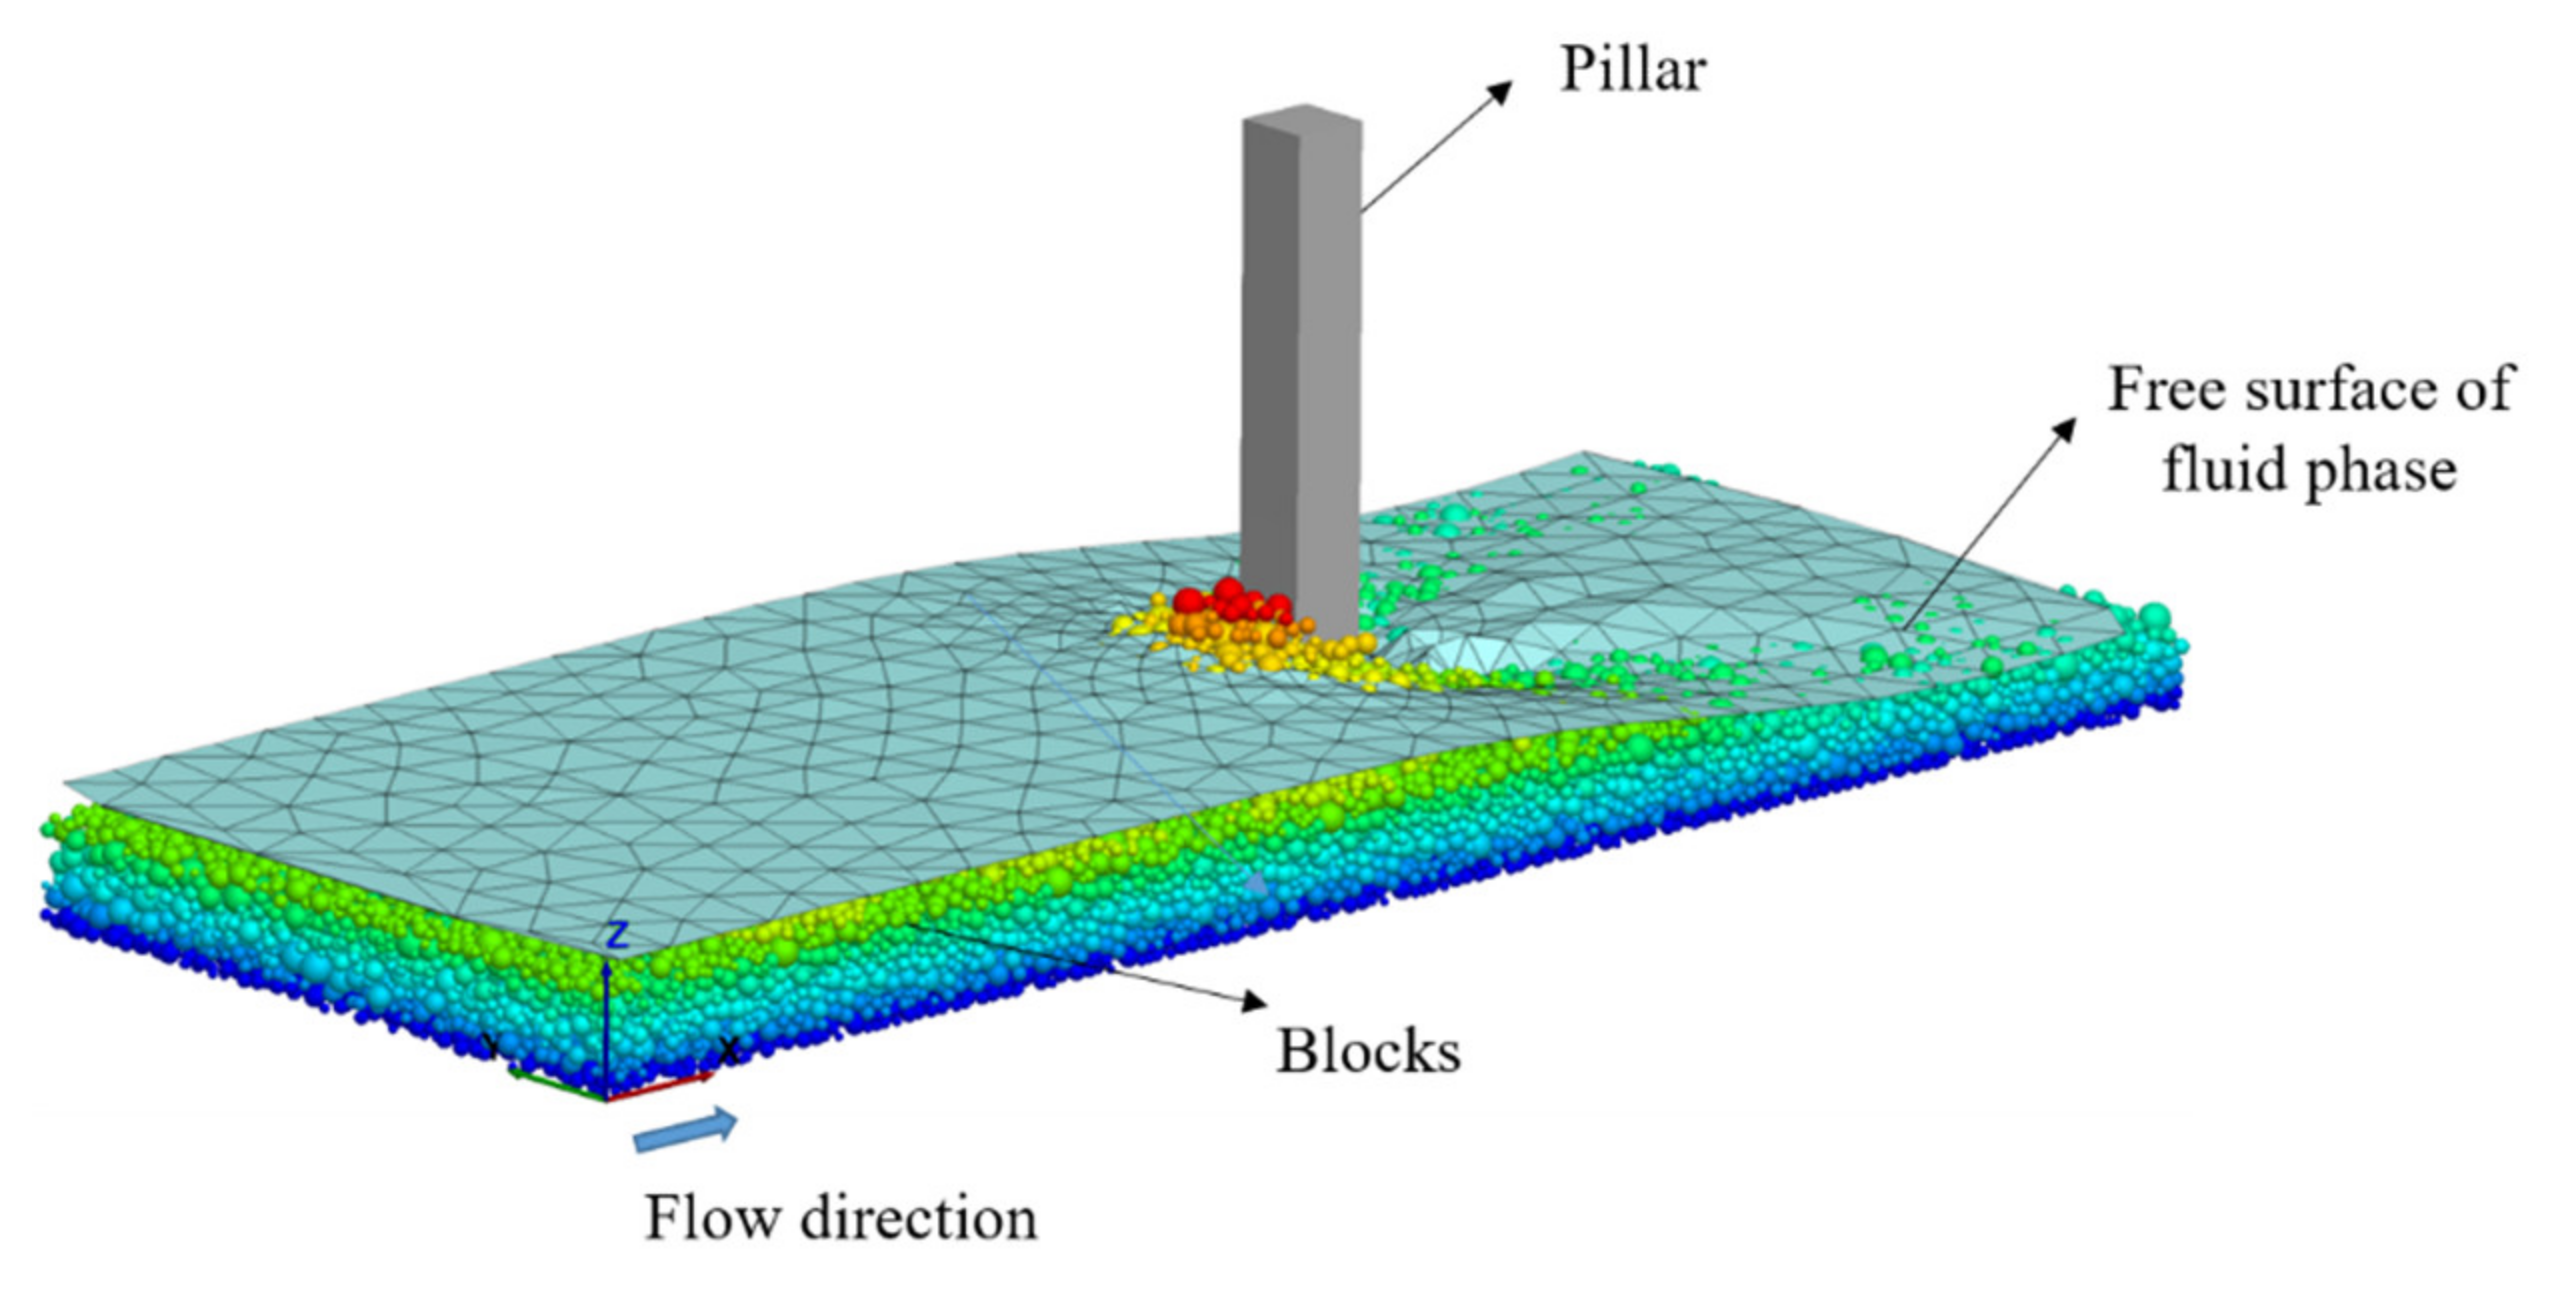
Once the debris flow is calibrated, it is propagated in a channel with an obstacle for the purpose of analyzing how the flow interacts with the structure. In this study, a channel with a laterally centered square pillar was used (Figure 2).
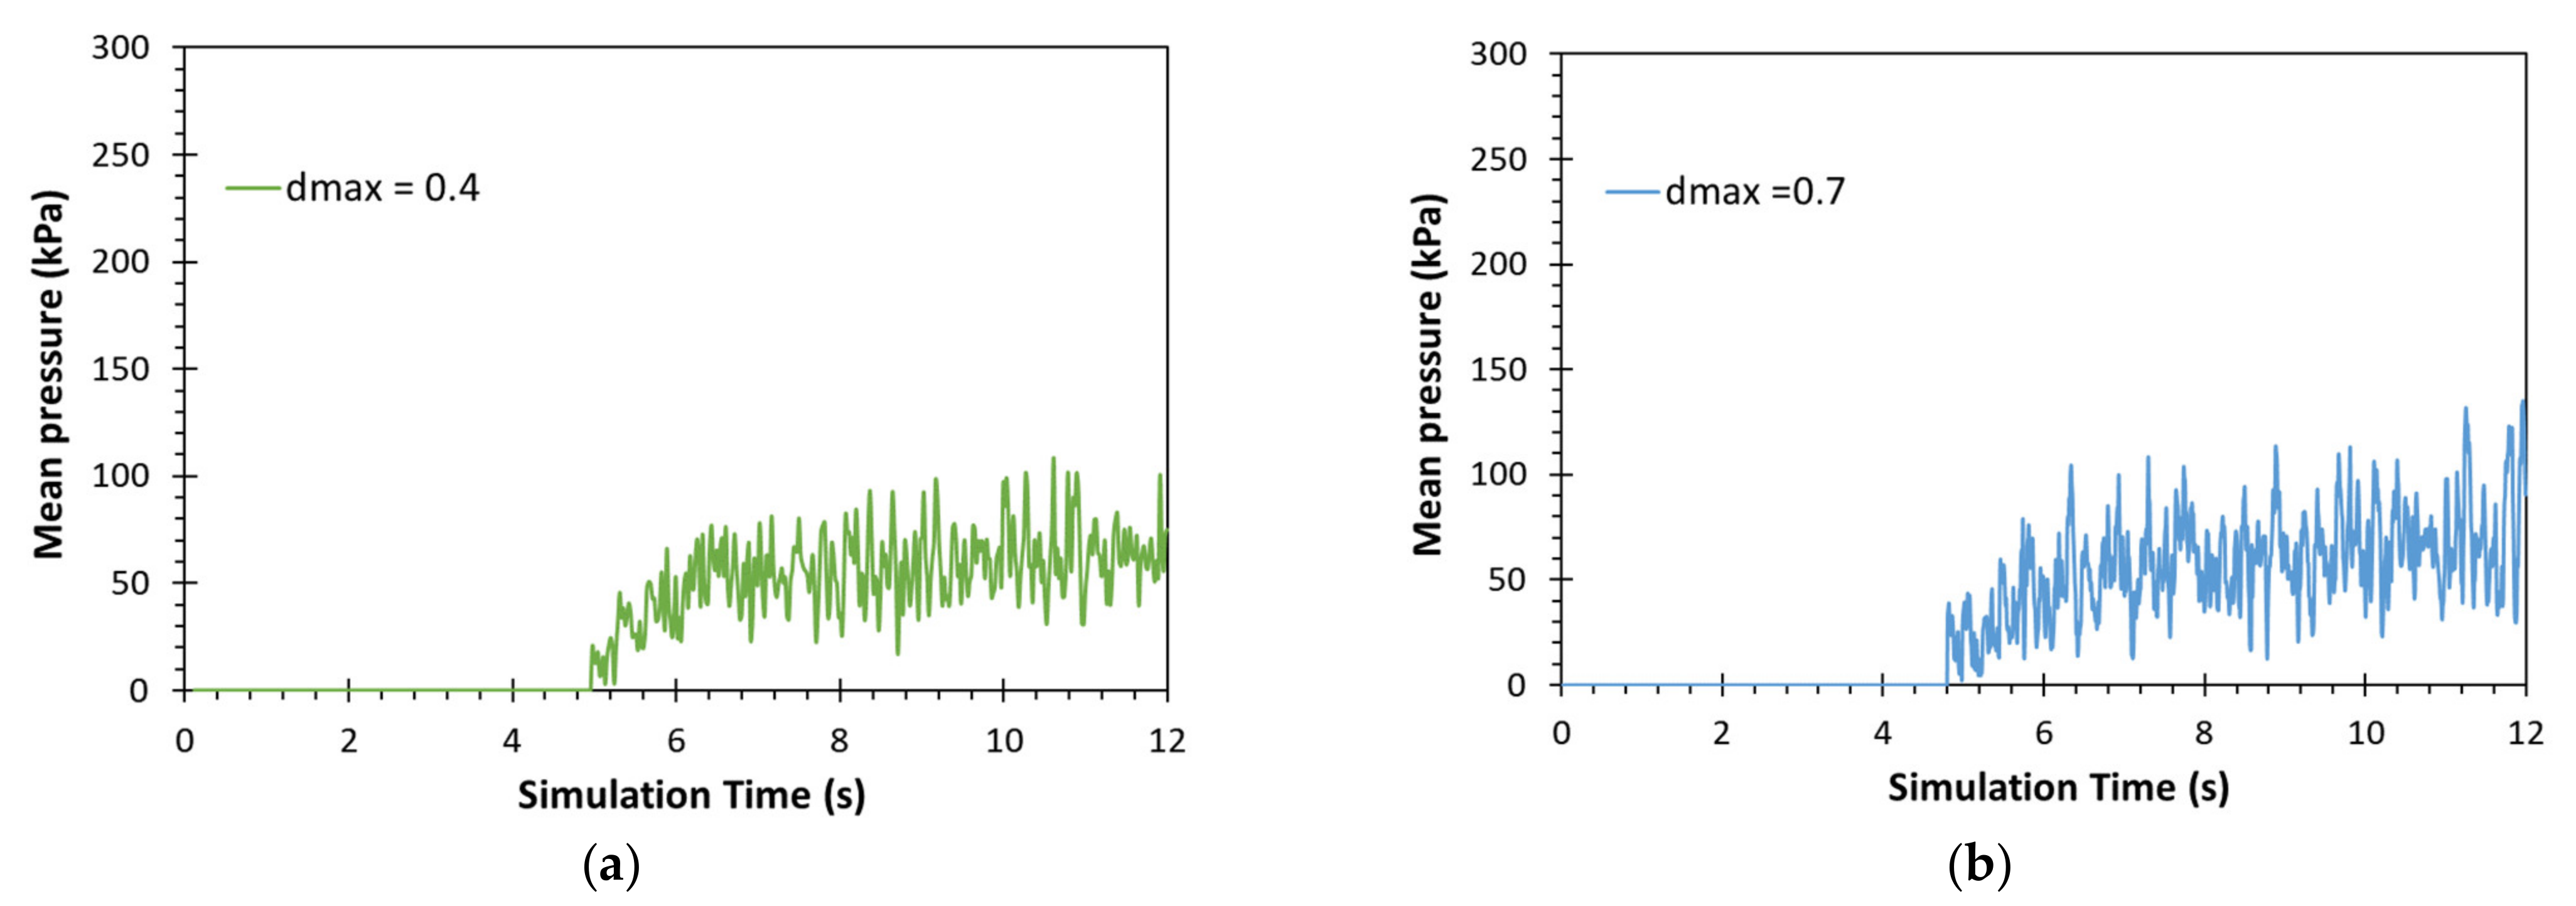
We simulated 12 s of flow, which was long enough to fill the channel completely and to obtain a steady flow. Figure 3 shows the distribution of the average pressure applied by the blocks on the obstacle as a function of the simulation time, for the four considered values of d m a x (0.4, 0.7, 1.0 and 1.5 m). The average pressure, which is directly provided by the DEM model, is calculated from the spatial distribution of the contact forces between the blocks and the pillar as a function of time. The time t1 = 5 s corresponds to the time when the first block impacting the pillar. For t > 9 s, and disregarding the oscillations associated with the discrete nature of the numerical model, the pressure seems to reach an average plateau. Subsequently, for the following analysis of the results, the time-averaged value of the pressure is calculated between 9 and 12 s. We also note that the dispersion of the numerical results is higher when the block diameter increases: there are strong temporal fluctuations of the pressures on the pillar. Indeed, this variability of the pressure can be linked to the temporal variability of the collisions between the blocks and the pillar, due to the size and the velocity of the blocks.

3.1. Effect of the Block Size

The study of the block size’s effect on the impact pressure was complicated by the need to vary the block size of the solid phase randomly without changing the macroscopic scale flow parameters, such as the bulk density, the velocity, etc. Several studies indicate that particle size distribution remains an important parameter to study in order to highlight its influence on the force or pressure exerted on an exposed structure [21,22,23,30].
Regarding the influence of the block size, we normalized the results as follows:
  • To estimate the total pressure, the pressure applied by the blocks on the obstacles were measured and added to the effect of the fluid phase through hydrostatic pressure. The mean total pressure was calculated between t = 9 s and t = 12 s.
  • The pressure was normalized to the density of the DF and the velocity ( ρ v 2 ) with ρ = 1867 kg/m3 and v = 3 m/s. We noted p ˜ = p m a x ρ v 2 .
  • The height was normalized to the flow height h in cases without obstacles.
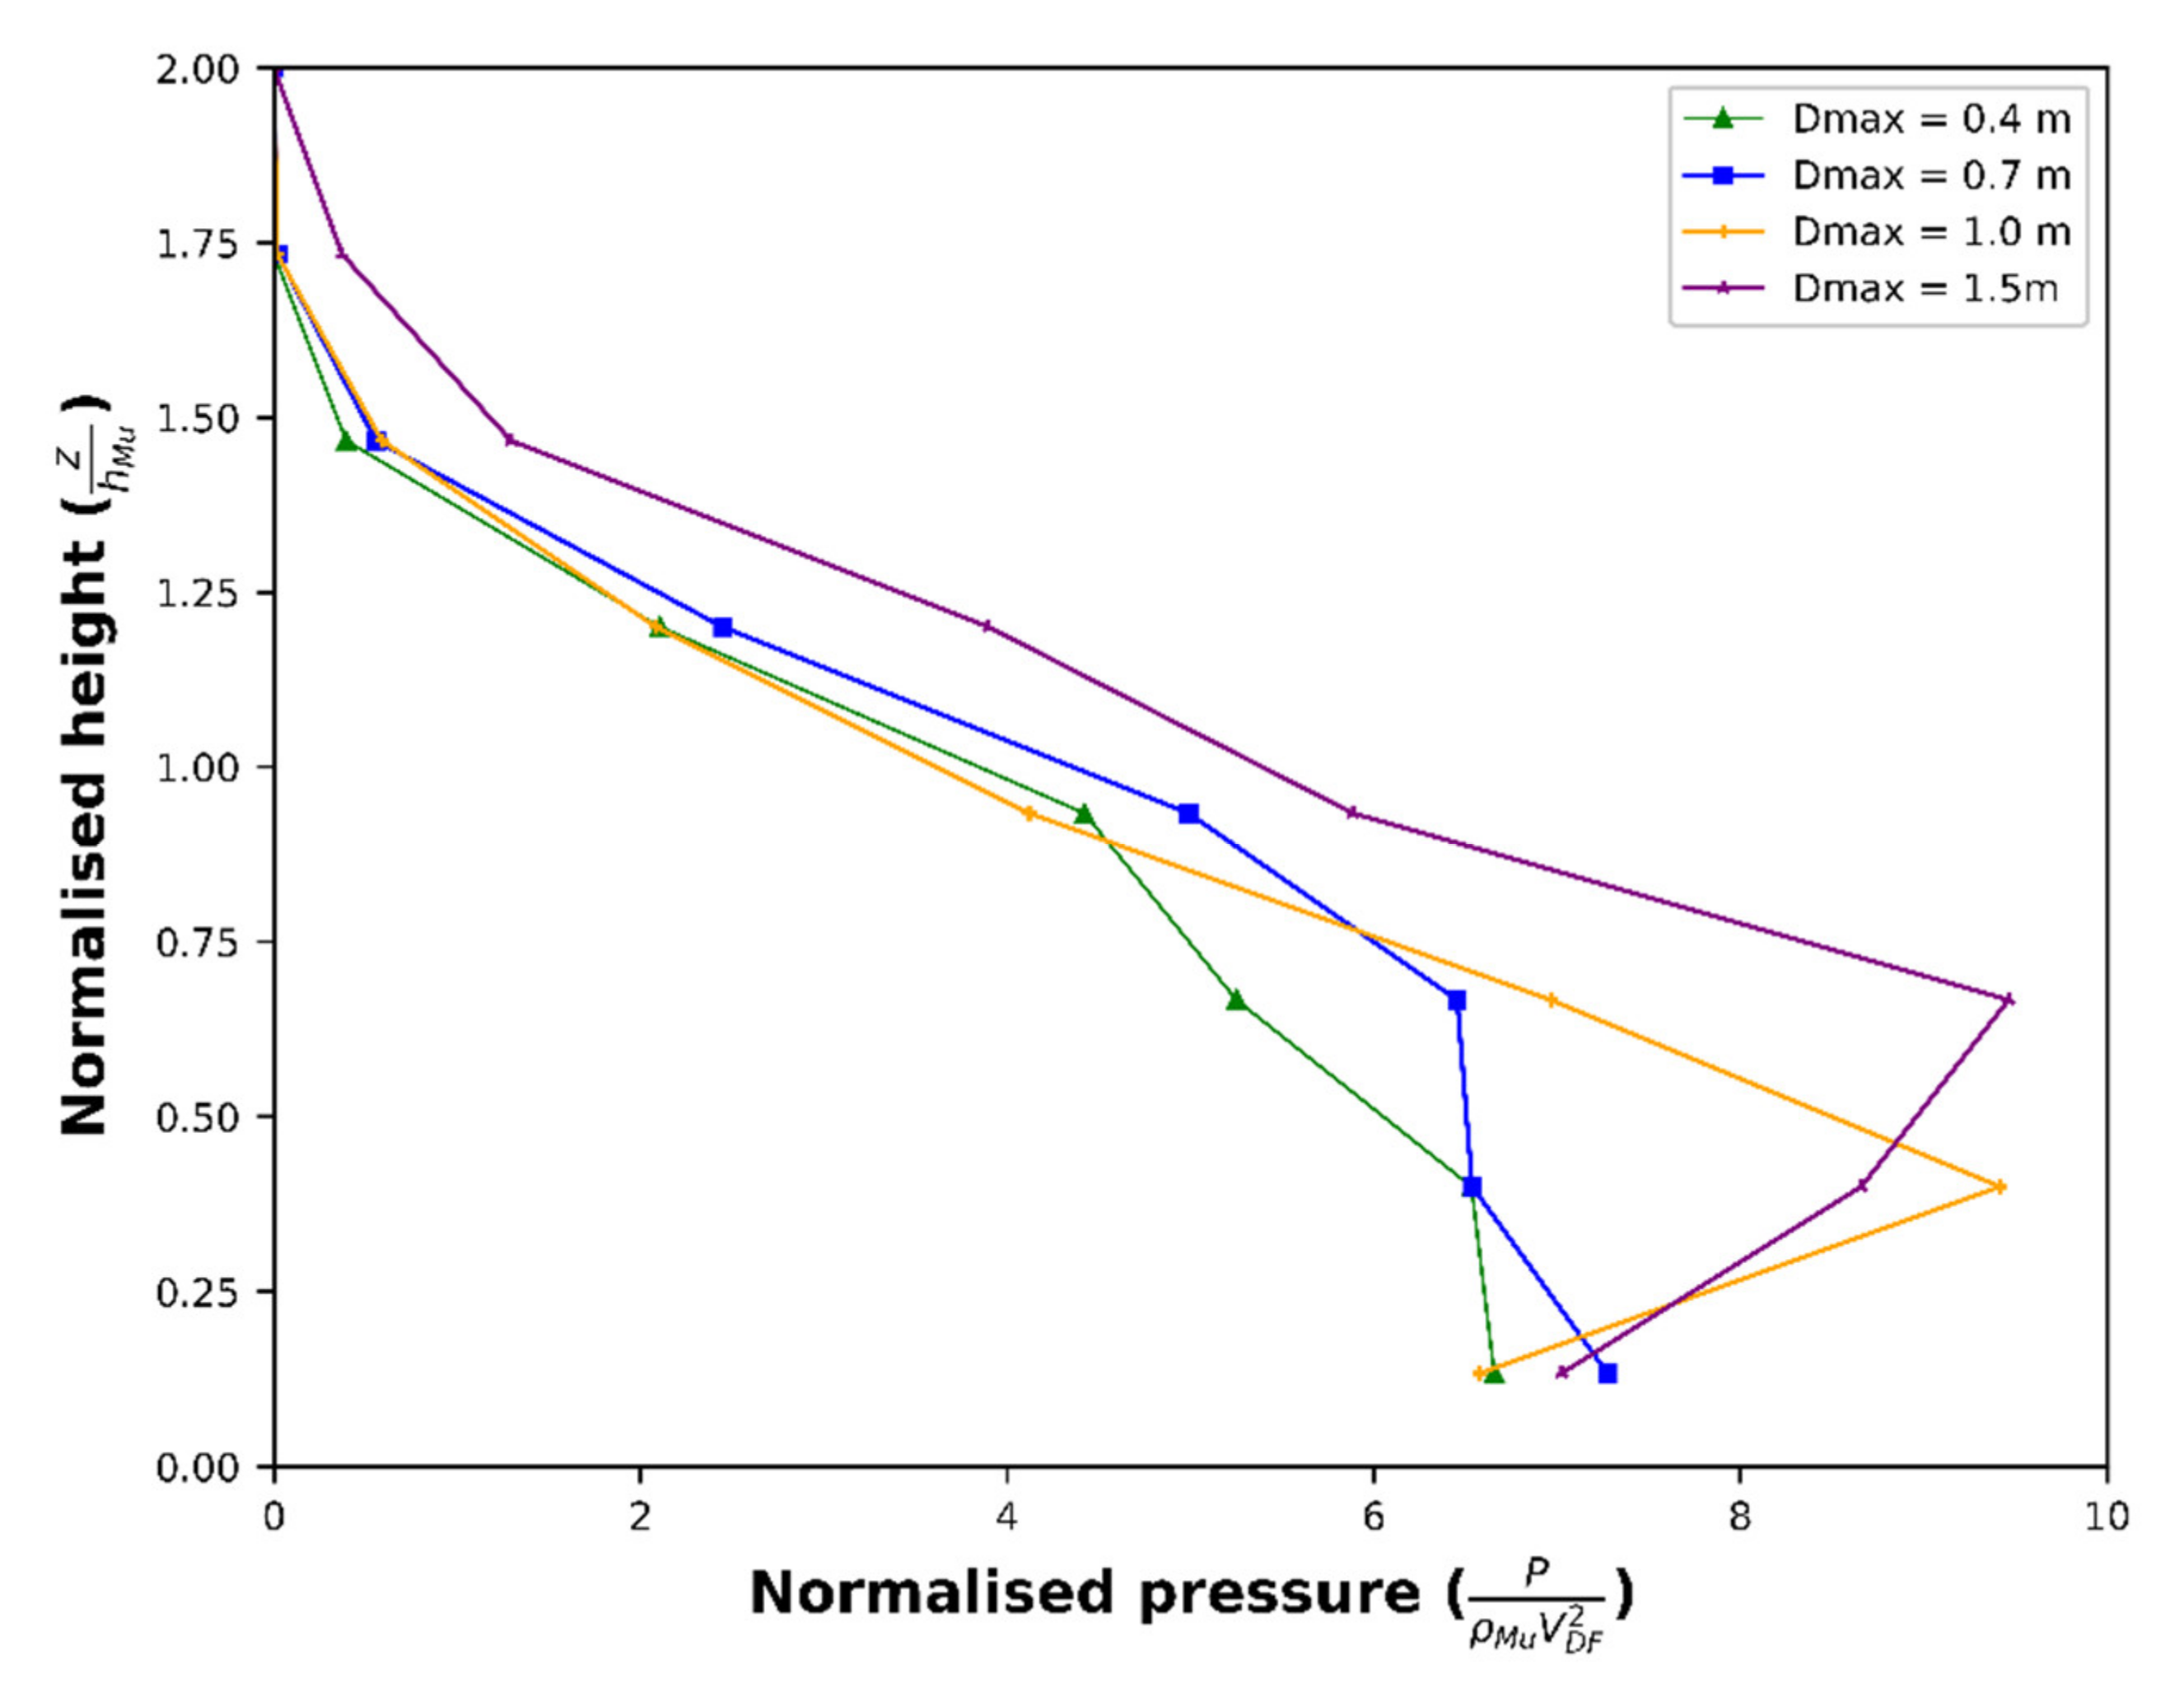
Figure 4 shows the distribution of the total stress normalized by ρ v 2 as a function of the vertical position in the flow measured from the bottom of the channel and normalized by the total flow height against the obstacle ( z h ) for different d m a x : 0.4 (reference case), 0.7, 1.0, and 1.5 m. Considering the maximum pressure for each case, we note that the dynamic pressure coefficient p ˜ varies between 6.5 (for d m a x = 0.4 m) and 9.5 (for d m a x = 1.5 m). Indeed, the maximum pressure exerted by the blocks on the pillar increases with the block size, for which this coefficient p ˜ increases. These results are in accordance with findings published by [23,31], who reported that the highest maximum impact forces resulted from larger blocks. These plots also show that the accumulation height of the blocks upstream of the pillar (x = 15 m) is related to their size when the ratio z h is equal to 1. The damming up of the flow upstream of the pillar is relatively high in all cases and a value of z h = 1.75 holds for all cases, except for d m a x = 1.5 m, for which z h = 2.0.
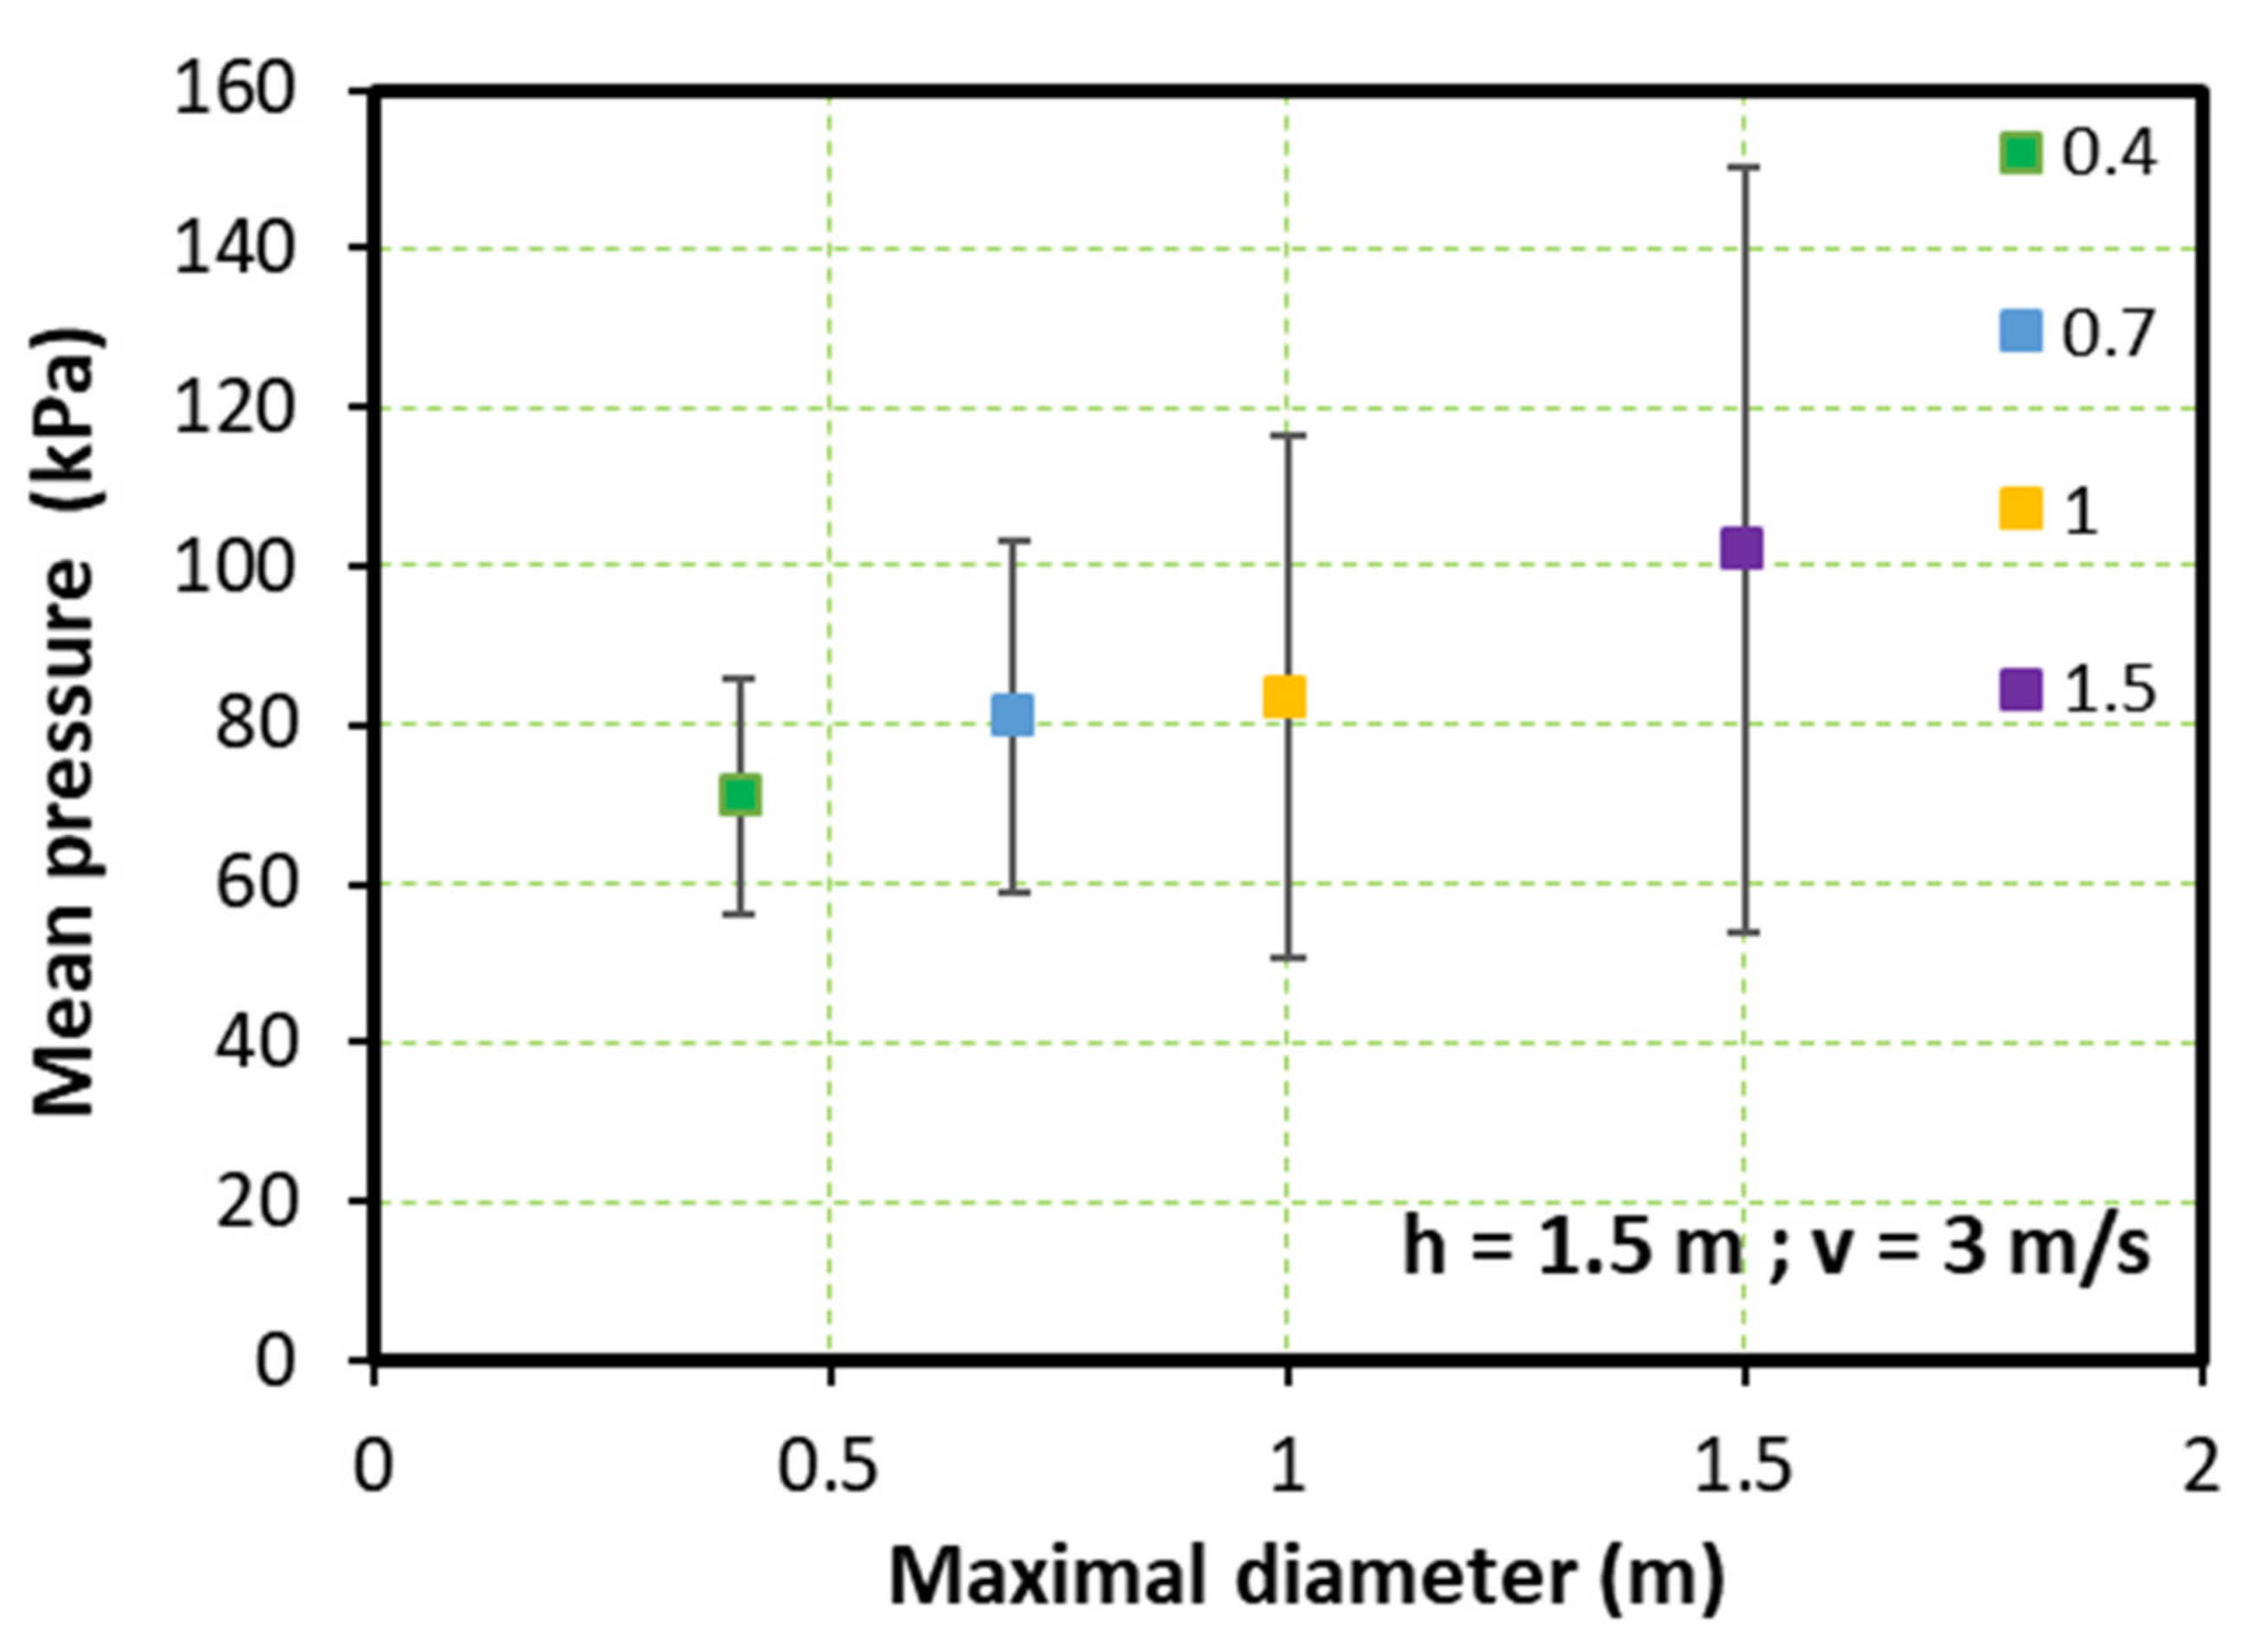
Figure 5 shows the evolution of the average pressure applied by the simulated DF on the pillar, according to the maximum diameter d m a x . The standard deviation of each pressure is calculated between t = 9 s and t = 12 s when the flow reaches a steady state. We note that while keeping the same macroscopic flow characteristics (height and velocity), the average pressure on the obstacle clearly increases with the size of the blocks.
We can assume that the size, volume and mass of blocks indirectly influence their position in the flow and their kinetic energy, which modifies the impact pressure measured on obstacles and, therefore, has an impact on the vulnerability of structures.

3.2. Influence of Individual Impacts on the Structure

The DEM provides information on every contact between elements developing in the simulation, which enables us to analyze the individual impacts of the blocks on the pillar. This model records the following data about contacts between the blocks and the pillar: the size of the block involved in the contact, the position of the contact point, the time at which the contact occurs, and the contact’s duration.
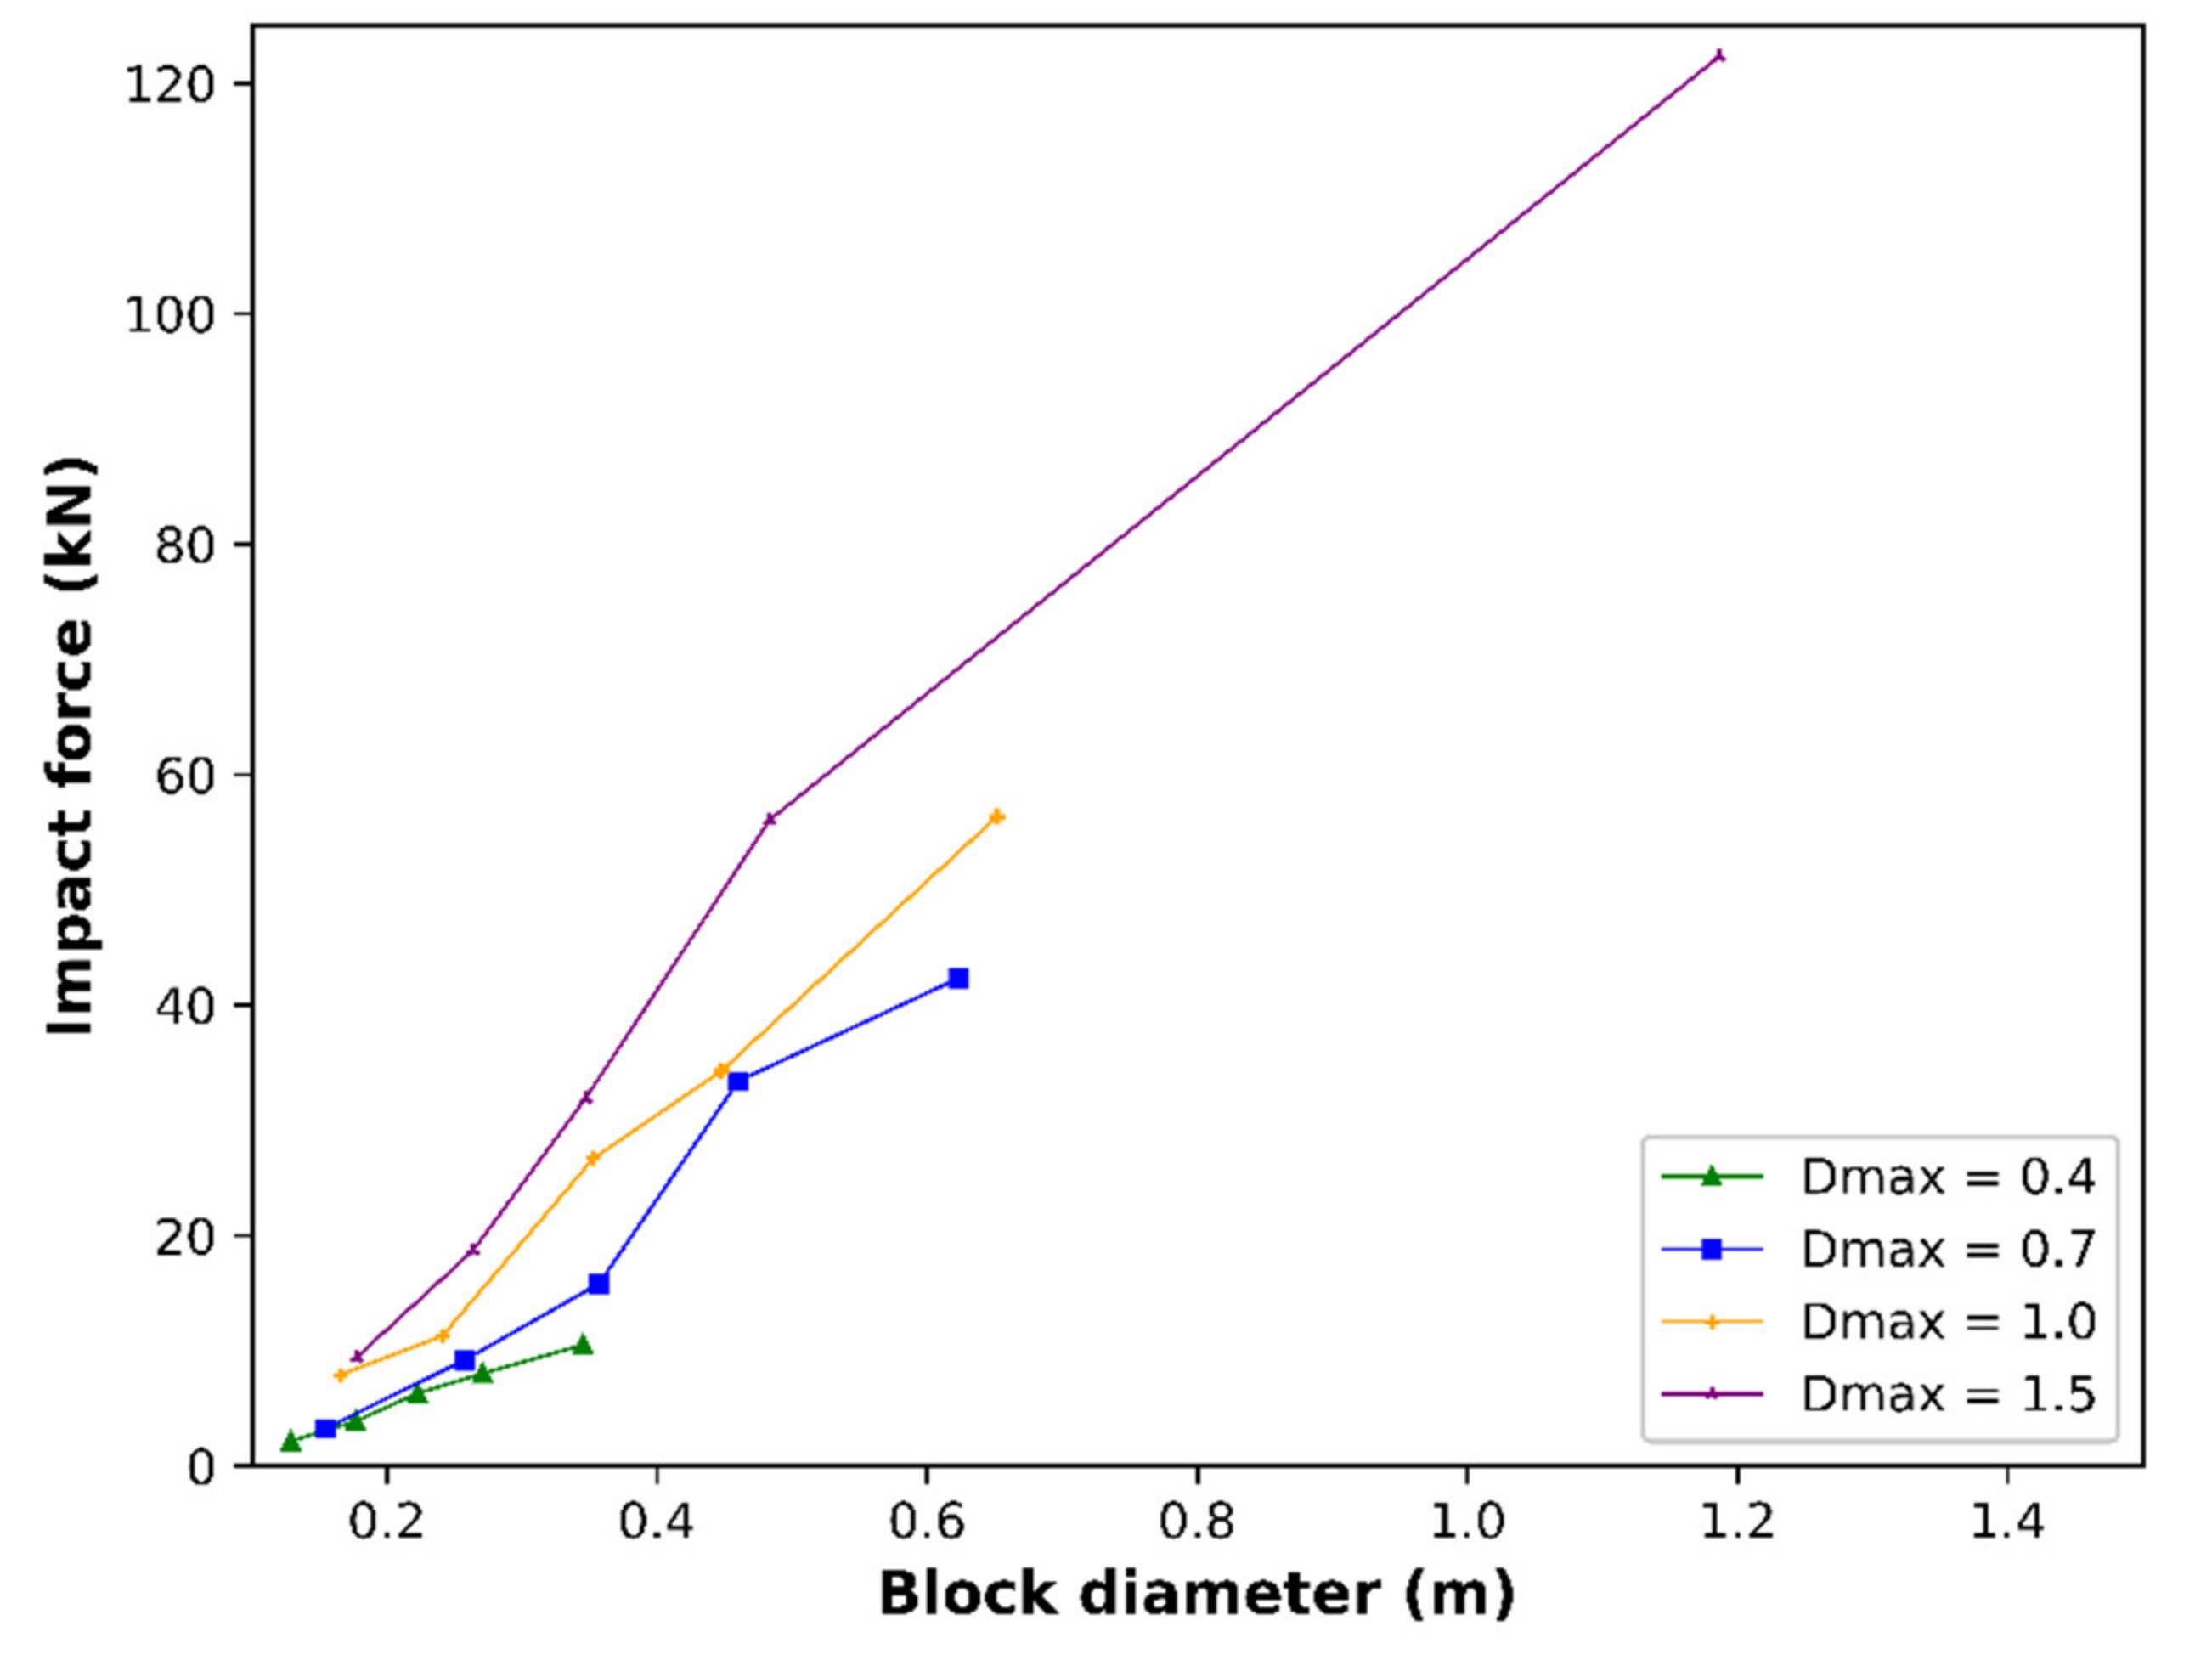
All the impact forces between t = 9 s and t = 12 s were stored and analyzed. Figure 6 shows the distribution of the maximal value of contact forces as a function of the block diameter for four different d m a x . In this time window, a total of 698 collisions occurred for the coarser particle size distribution ( d m a x = 1.5 m) and up to 9618 collisions for the case of d m a x = 0.4 m. We note that blocks of the same size conveys stronger forces to the obstacles when the particle size distribution is more extended: the effect of the large blocks is then reflected in the smaller blocks, since they transmit greater impact forces directly to the pillar, but also to the surrounding blocks. Additionally, for each case, it was shown that the block size induces variation in the individual impact forces on the structure. As expected, the force exerted by a block on the pillar increases with its size. For example, we note that for d m a x = 0.4 m, with a block that is 0.12 m in diameter, the contact force between the block and the pillar is ten times that of a block of 0.38 m: this proves the need to consider the block diameter in the calculation of the impact force before evaluating the vulnerability of a structure.

4. Discussion

In the literature, the empirical models used to predict pressure do not explicitly consider the block diameter. The results of this study show the following: (1) the block size is an important parameter for the measurement of pressure, since the DF pressure on obstacles increases as the block size increases; and (2) the block size can therefore play a role in the evaluation of vulnerability. Physical vulnerability is the degree of loss of a given element located within a zone affected by a hazard: it is quantified on a scale of ranging from 0 (no loss) to 1 (total loss) [32]. Numerous vulnerability functions are available: they are generally based on macroscopic flow parameters, such as the flow height, velocity and density [33,34,35].
The results of our numerical model can be used to address some limitations linked to existing vulnerability functions: for example, one flow characteristic alone (height, velocity or pressure) is not sufficient to realistically calculate vulnerability [21,36]. However, it is possible that other parameters have a greater influence on the evaluation of the vulnerability than the studied parameter. The model used in this study can predict the range of pressures on a structure by integrating a set of the physical and hydrological characteristics of the flow (height, velocity, density and block size) and of the characteristics of the structure (orientation and shape). Thus, the pressure and, therefore, vulnerability assessment can be improved compared to when only one input parameter is considered.
The treatments of physical vulnerability (V) with curves and functions vary from one study to another [21,36,37]. Hence, the first step is to choose an existing vulnerability model from the literature. From this vulnerability function, we can compare the results of the numerical model and, thus, estimate the damage level of the structure. It is also possible to show that for the same DF, and depending on the flow characteristics (height, velocity or pressure), three different values of vulnerability V are obtained. For example, to apply the [33] model, which presents the three intensities of the flow (Table 4) we use the flow height h to calculate a first value of vulnerability V1, the velocity v to calculate V2 and, finally, the mean pressure p to calculate V3. These functions confirm that a single DF flow—here, h = 1.5 m and v = 3 m/s, resulting in an average pressure of 72 kPa—may result in different vulnerability assessments, depending on the parameter considered, such as V1 equal to 0.272, V2 equal to 0.179 and V3 equal to 0.489, for the same structure exposed. As the impact pressure indirectly integrates other variables, such as the height, velocity and, also, block size, it is a parameter of choice to characterize the intensity associated with a flow.
To better quantify the flow intensity and to improve the existing vulnerability function, we should consider additional parameters, such as the block size, which is a parameter that affects impact forces [21,28,38,39].
We have shown previously that the particle size distribution has an important influence on the pressures induced by the flow on impacted structures. Table 5 shows an example of a DF with fixed macroscopic characteristics (height and velocity), for which the vulnerability V3 varies between 0.48 and 0.77, thus moving from a state of moderate damage (V = 0.3 to 0.6) to one of almost extensive damage (V = 0.6 to 0.8). This difference shows the importance of the size of the blocks present in the flow and of taking into account the value of d m a x . This shows that a precise quantification of the impact pressure is necessary to better assess the vulnerability of structures.
It is noticed that a vulnerability calculation based on flow velocity, height or pressure will not give the same result when the particle size varies. Therefore, it is important to improve vulnerability calculations and to quantify the effect of the impact pressure on vulnerability.

5. Conclusions

Debris flows are influenced by both solid and fluid forces, making them particularly destructive phenomena. A CFD-DEM model was developed and used for evaluating debris flow impact on structures on a local scale. The influence of the block size on the impact force generated on the pillar was investigated.
We highlight the following results:
  • The CFD-DEM model provides a precise average pressure value as a function of the flow height, the flow velocity and the block size.
  • The effect of the block size on the impact pressure is that the highest maximum impact pressures resulted from coarser particle size distributions. There is a cumulative effect of a high number of collisions on the impact pressure on the obstacle.
  • The same flow, with given macroscopic characteristics (height, velocity, density), induces different impact pressures depending on the particle size distribution of the blocks transported and affects the distribution of the individual contact forces on the obstacle.
  • When the grain size distribution is spread out towards larger diameters, the temporal variation in the pressure applied on the obstacle increases. Furthermore, blocks of a given size imply greater contact forces when the maximum block size is greater. The biggest blocks also affect the impact forces of the smallest blocks; therefore, they can also exert stronger forces on the pillar.
A better understanding of the role of blocks in impact pressure mechanisms offers a better form of analysis in the evaluation of vulnerability.

Author Contributions

Writing—original draft, R.C., B.C., F.D., P.B. and J.-C.T.; writing-review and editing. All authors have read and agreed to the published version of the manuscript.

Funding

This research was funded by Region AURA Auvergne Rhône-Alpes: Pack Ambition Recherche 2018 ‘Quorum’; National Agency for Research: 16- IDEX-0001 CAP 20-25.

Acknowledgments

The authors thank the Municipality of Arequipa, the Arequipa Civil Defence and the department of geology of the University Nacional San Agustin, in Arequipa. This study benefited from the financial support by the “Pack Ambition Recherche” project 2018 of the Region AURA Auvergne Rhône-Alpes and from the Clervolc LabEx.

Conflicts of Interest

The authors declare no conflict of interest.

References

  1. Thouret, J.; Antoine, S.; Magill, C.; Ollier, C. Lahars and debris flows: Characteristics and impacts. Earth-Sci. Rev. 2020, 201, 103003. [Google Scholar] [CrossRef]
  2. Franco, R.D.V.; Thouret, J.C.; Delaite, G.; Van Westen, C.; Sheridan, M.F.; Siebe, C.; Mariño, J.; Souriot, T.; Stinton, A. Mapping and assessing volcanic and flood hazards and risks, with emphasis on lahars, in Arequipa, Peru. Spec. Pap. Geol. Soc. Am. 2010, 464, 265–280. [Google Scholar] [CrossRef]
  3. Gao, L.; Zhang, L.M.; Chen, H.X. Two-dimensional simulation of debris flow impact pressures on buildings. Eng. Geol. 2017, 226, 236–244. [Google Scholar] [CrossRef]
  4. Jalayer, F.; Aronica, G.T.; Recupero, A.; Carozza, S.; Manfredi, G. Debris flow damage incurred to buildings: An in situ back analysis. J. Flood Risk Manag. 2018, 11, S646–S662. [Google Scholar] [CrossRef]
  5. Papathoma-Köhle, M.; Kappes, M.; Keiler, M.; Glade, T. Physical vulnerability assessment for alpine hazards: State of the art and future needs. Nat. Hazards 2011, 58, 645–680. [Google Scholar] [CrossRef]
  6. Kelfoun, K.; Druitt, T.H. Numerical modeling of the emplacement of Socompa rock avalanche, Chile. J. Geophys. Res. Solid Earth 2005, 110, 1–13. [Google Scholar] [CrossRef]
  7. O’ Brien, J.S.; Julien, P.Y.; Fullerton, W.T. Two-dimensional water flood and mudflood simultion. J. Hydraul. Eng. 1993, 119, 244–261. [Google Scholar] [CrossRef]
  8. Schilling, S.P. LAHARZ: GIS Programs for Automated Delineation of Lahar Hazard Zones; U.S. Geological Survey Open-File Report. 1998. Available online: https://pubs.er.usgs.gov/publication/ofr98638 (accessed on 15 March 2022).
  9. Thouret, J.C.; Enjolras, G.; Martelli, K.; Santoni, O.; Luque, J.A.; Nagata, M.; Arguedas, A.; MacEdo, L. Combining criteria for delineating lahar-and flash-flood-prone hazard and risk zones for the city of Arequipa, Peru. Nat. Hazards Earth Syst. Sci. 2013, 13, 339–360. [Google Scholar] [CrossRef]
  10. Horton, P.; Jaboyedoff, M.; Rudaz, B.; Zimmermann, M. Flow-R, a model for susceptibility mapping of debris flows and other gravitational hazards at a regional scale. Nat. Hazards Earth Syst. Sci. 2013, 13, 869–885. [Google Scholar] [CrossRef] [Green Version]
  11. Scheidl, C.; Rickenmann, D. TopFlowDF-A simple gis based model to simulate debris-flow runout on the fan. In Proceedings of the 5th International Conference on Debris-Flow Hazards Mitigation: Mechanics, Prediction and Assessment, Padua, Italy, 14–17 June 2011; pp. 253–262. [Google Scholar] [CrossRef]
  12. Pitman, E.B.; Long, L.E. A two-fluid model for avalanche and debris flows. Philos. Trans. R. Soc. A Math. Phys. Eng. Sci. 2005, 363, 1573–1601. [Google Scholar] [CrossRef]
  13. Huang, Y.; Cheng, H.; Dai, Z.; Xu, Q.; Liu, F.; Sawada, K.; Moriguchi, S.; Yashima, A. SPH-based numerical simulation of catastrophic debris flows after the 2008 Wenchuan earthquake. Bull. Eng. Geol. Environ. 2015, 74, 1137–1151. [Google Scholar] [CrossRef]
  14. Teufelsbauer, H.; Wang, Y.; Pudasaini, S.P.; Borja, R.I.; Wu, W. DEM simulation of impact force exerted by granular flow on rigid structures. Acta Geotech. 2011, 6, 119–133. [Google Scholar] [CrossRef]
  15. Leonardi, A.; Wittel, F.K.; Mendoza, M.; Vetter, R.; Herrmann, H.J. Particle-Fluid-Structure Interaction for Debris Flow Impact on Flexible Barriers. Comput. Civ. Infrastruct. Eng. 2016, 31, 323–333. [Google Scholar] [CrossRef] [Green Version]
  16. Shen, W.; Zhao, T.; Zhao, J.; Dai, F.; Zhou, G.G.D. Quantifying the impact of dry debris flow against a rigid barrier by DEM analyses. Eng. Geol. 2018, 241, 86–96. [Google Scholar] [CrossRef]
  17. Dai, Z.; Huang, Y.; Cheng, H.; Xu, Q. SPH model for fluid—Structure interaction and its application to debris flow impact estimation. Landslides 2017, 14, 917–928. [Google Scholar] [CrossRef]
  18. Teufelsbauer, H.; Wang, Y.; Chiou, M.C.; Wu, W. Flow-obstacle interaction in rapid granular avalanches: DEM simulation and comparison with experiment. Granul. Matter 2009, 11, 209–220. [Google Scholar] [CrossRef]
  19. Albaba, A.; Schwarz, M.; Wendeler, C.; Loup, B.; Dorren, L. Numerical modeling using an elastoplastic-adhesive discrete element code for simulating hillslope debris flows and calibration against field experiments. Nat. Hazards Earth Syst. Sci. 2019, 19, 2339–2358. [Google Scholar] [CrossRef] [Green Version]
  20. Proske, D.; Suda, J.; Hübl, J. Debris flow impact estimation for breakers. Georisk 2011, 5, 143–155. [Google Scholar] [CrossRef]
  21. Papathoma-Köhle, M.; Gems, B.; Sturm, M.; Fuchs, S. Matrices, curves and indicators: A review of approaches to assess physical vulnerability to debris flows. Earth-Sci. Rev. 2017, 171, 272–288. [Google Scholar] [CrossRef]
  22. Mead, S.R.; Magill, C.; Lemiale, V.; Thouret, J.C.; Prakash, M. Examining the impact of lahars on buildings using numerical modelling. Nat. Hazards Earth Syst. Sci. 2017, 17, 703–719. [Google Scholar] [CrossRef] [Green Version]
  23. Cui, Y.; Choi, C.E.; Liu, L.H.D.; Ng, C.W.W. Effects of particle size of mono-disperse granular flows impacting a rigid barrier. Nat. Hazards 2018, 91, 1179–1201. [Google Scholar] [CrossRef]
  24. Chehade, R.; Chevalier, B.; Dedecker, F.; Breul, P.; Thouret, J.C. Discrete modelling of debris flows for evaluating impacts on structures. Bull. Eng. Geol. Environ. 2021, 80, 6629–6645. [Google Scholar] [CrossRef]
  25. Cundall, P.A.; Strack, O.D.L. A discrete numerical model for granular assemblies. Geotechnique 1979, 29, 47–65. [Google Scholar] [CrossRef]
  26. Itasca. Particle Flow Code 5.0 Documentation. 2016. Available online: https://geomatlab.com/itasca/pfc5.0help/source/index.html (accessed on 15 March 2022).
  27. Zhao, T.; Houlsby, G.T.; Utili, S. Investigation of granular batch sedimentation via DEM–CFD coupling. Granul. Matter 2014, 16, 921–932. [Google Scholar] [CrossRef]
  28. Zhao, L.; He, J.W.; Yu, Z.X.; Liu, Y.P.; Zhou, Z.H.; Chan, S.L. Coupled numerical simulation of a flexible barrier impacted by debris flow with boulders in front. Landslides 2020, 17, 2723–2736. [Google Scholar] [CrossRef]
  29. Hu, K.; Wei, F.; Li, Y. Real-time measurement and preliminary analysis of debris-flow impact force at Jiangjia Ravine, China. Earth Surf. Process. Landf. 2011, 36, 1268–1278. [Google Scholar] [CrossRef]
  30. Poudyal, S.; Choi, C.E.; Song, D.; Zhou, G.G.D.; Yune, C.Y.; Cui, Y.; Leonardi, A.; Busslinger, M.; Wendeler, C.; Piton, G.; et al. Review of the mechanisms of debris-flow impact against barriers. In Proceedings of the Seventh International Conference on Debris-Flow Hazards Mitigation, Golden, CO, USA, 10–13 June 2019; pp. 1027–1034. [Google Scholar]
  31. Bardou, E.; Ancey, C.; Bonnard, C.; Vulliet, L. Classification of debris-flow deposits for hazard assessment in alpine areas. In Proceedings of the 3th International Conference on Debris-Flow Hazards Mitigation: Mechanics, Prediction, and Assessment, Davos, Switzerland, 10–12 September 2003; Available online: http://infoscience.epfl.ch/record/94551 (accessed on 15 March 2022).
  32. Martelli, K. The physical vulnerability of urban areas facing the threat of inundation from lahars and flash floods: Application to the case study of Arequipa, Peru. PhD Thesis, Université Blaise Pascal-Clermont-Ferrand II, Clermont-Ferrand, France, 2013. [Google Scholar]
  33. Kang, H.; Kim, Y. The physical vulnerability of different types of building structure to debris flow events. Nat. Hazards 2016, 80, 1475–1493. [Google Scholar] [CrossRef]
  34. Lo, W.C.; Tsao, T.C.; Hsu, C.H. Building vulnerability to debris flows in Taiwan: A preliminary study. Nat. Hazards 2012, 64, 2107–2128. [Google Scholar] [CrossRef]
  35. Zhang, S.; Zhang, L.; Li, X.; Xu, Q. Physical vulnerability models for assessing building damage by debris flows. Eng. Geol. 2018, 247, 145–158. [Google Scholar] [CrossRef]
  36. Fuchs, S.; Keiler, M.; Ortlepp, R.; Schinke, R.; Papathoma-Köhle, M. Recent advances in vulnerability assessment for the built environment exposed to torrential hazards: Challenges and the way forward. J. Hydrol. 2019, 575, 587–595. [Google Scholar] [CrossRef]
  37. Quan Luna, B.; Blahut, J.; Van Westen, C.J.; Sterlacchini, S.; Van Asch, T.W.J.; Akbas, S.O. The application of numerical debris flow modelling for the generation of physical vulnerability curves. Nat. Hazards Earth Syst. Sci. 2011, 11, 2047–2060. [Google Scholar] [CrossRef] [Green Version]
  38. Trujillo-Vela, M.G.; Galindo-Torres, S.A.; Zhang, X.; Ramos-Cañón, A.M.; Escobar-Vargas, J.A. Smooth particle hydrodynamics and discrete element method coupling scheme for the simulation of debris flows. Comput. Geotech. 2020, 125, 103669. [Google Scholar] [CrossRef]
  39. Lei, Y.; Cui, P.; Zeng, C.; Guo, Y. An empirical mode decomposition-based signal process method for two-phase debris flow impact. Landslides 2018, 15, 297–307. [Google Scholar] [CrossRef]
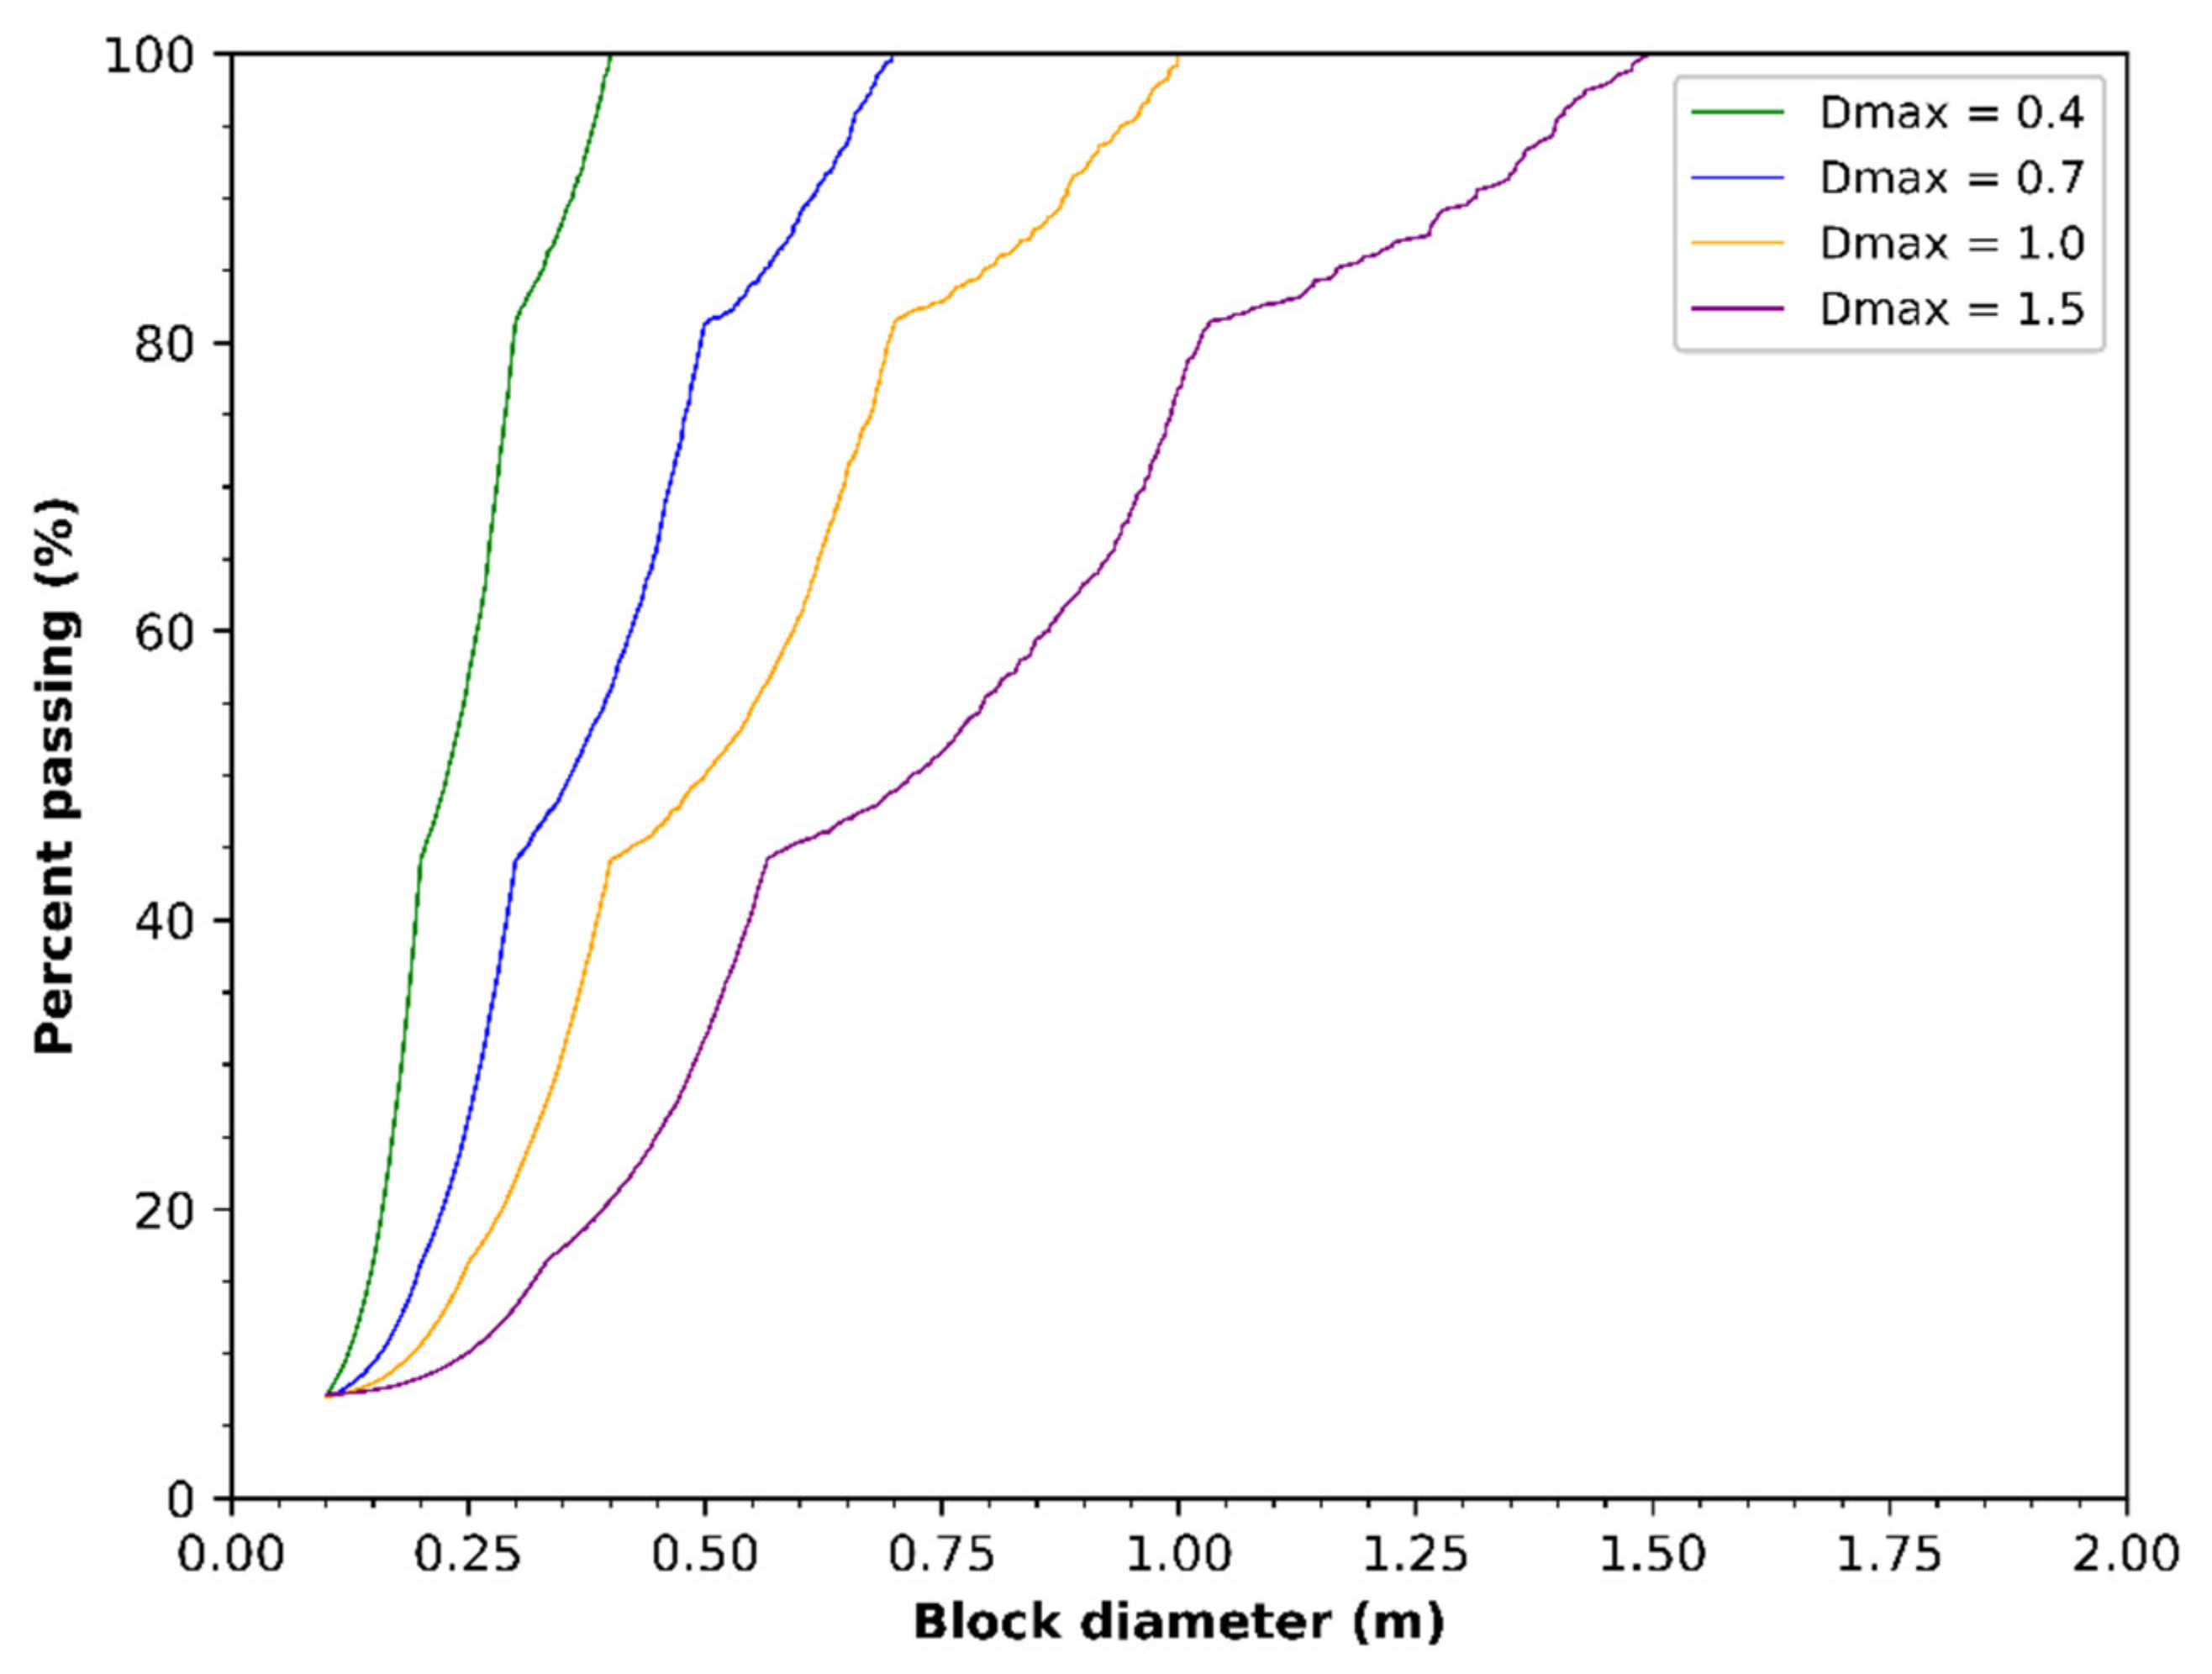
Figure 1. Particle size distributions of blocks in the debris flow.
Geosciences 12 00188 g001
Figure 2. Example of simulation result of a DF in a linear channel with a centered pillar. Blocks are colored with respect to their vertical position. The free surface of the fluid phase, obtained in a previous CFD calculation [24], is also shown.
Geosciences 12 00188 g002
Figure 3. Total pressure applied by the blocks on a pillar as a function of simulation time for different cases of d m a x : (a) d m a x = 0.4 m, (b) d m a x = 0.7 m, (c) d m a x = 1.0 m and (d) d m a x = 1.5 m.
Geosciences 12 00188 g003aGeosciences 12 00188 g003b
Figure 4. Normalized stress p ˜ induced by DF versus normalized flow height on the pillar, for four different d m a x .
Geosciences 12 00188 g004
Figure 5. Average pressure applied by the blocks on the pillar as a function of the maximum diameter of the blocks in the simulation (the standard deviation for the mean pressure is shown).
Geosciences 12 00188 g005
Figure 6. Maximal impact force versus block diameter for h = 1.5 m and v = 3 m/s.
Geosciences 12 00188 g006
Table 1. Characteristics of the obtained debris flow.
Solid FractionApparent
Density
Flow Rate
55%1867 kg/m340 m3/s
Table 2. Input parameters of the numerical model of reference case.
ShapeBlock SizePorosityFlow HeightFlow
Velocity
Froude
Number
Sphere d m i n = 0.1 m
d m a x = 0.4 m
0.451.5 m3.00 m/s0.78
Table 3. Mechanical parameters of the model.
Normal StiffnessTangential StiffnessRolling
Resistance
Friction
Coefficient
Fluid
Density
Block
Density
Fluid
Viscosity
107 N/m5 × 106 N/m0.20.41100 kg/m32500 kg/m30.048 Pa.s
Table 4. Vulnerability function proposed by [33] for reinforced concrete structures.
IntensityVulnerability FunctionCase Study Example
Height h (m) V 1 = 1 e x p 0.0005   h 1.537 h = 1.5; V1 = 0.272
Velocity v (m/s) V 2 = 1 e x p 0.0005   v 2.775 v = 3 m/s; V2 = 0.179
Impact pressure p (kPa) V 3 = 1 e x p 0.0005   p 1.690 p = 72 kPa; V3 = 0.489
Table 5. Influence of maximal diameter d m a x on average pressure Pmoy and vulnerability V.
h (m)v (m/s)dmax (m)Pmoy (kPa)V3
1.530.4720.489
0.7810.568
183.50.587
1.51020.710
Publisher’s Note: MDPI stays neutral with regard to jurisdictional claims in published maps and institutional affiliations.