Abstract
This paper presents parametric studies that assess the role of loading factors (i.e., number of cycles, frequency, and amplitude) on liquefaction-induced failure by performing numerical simulations. Most of the existing literature considers the effects of the soil properties on the development of excess pore pressure with few research endeavours focusing on the effects of the input motion itself. Numerical simulations are performed herein, via the advanced software platform OpenSees, to generate several finite element models that consider non-linear development of pore pressure inside the soil. Several sinusoidal inputs were considered to study the effects of the various loading factors and compare the responses. The main findings arise from evaluating the effects of several input motion parameters (number of cycles, frequency, and amplitude) on soil liquefaction through numerical simulations. This research study, based on state-of-the-art knowledge, may be applied to assess future seismic events and to update or propose new code provisions for soil liquefaction.
1. Background
Soil liquefaction is a complex phenomenon associated with pore water pressure development and the corresponding reduction in volume during undrained loading that may result in several additional failure mechanisms, such as lateral spreading, slope failure, excessive settlement, and bridge and building foundation failure, as described by several researchers [1,2,3,4,5,6,7].
Historically, liquefaction effects have been observed and documented in many earthquakes all over the world. In particular, liquefaction-induced effects observed during field reconnaissance from the 1964 Niigata, 1990 Luzon, 2010–2011 Canterbury, and 2011 Tohoku earthquakes have been shown to depend on many input parameters such as shaking intensity, duration, and frequency [8,9,10] as well as material and geometric factors such as relative density, fines content, soil thickness, building weight and width. Many relationships between liquefaction resistance and soil parameters have been proposed [11,12,13,14,15,16,17,18,19,20]. Among them, Ref. [13] applied SPT results to a second-moment statistical analysis as a development of the empirical procedure introduced by Robertson and Wride [18].
In addition, these approaches assess liquefaction-induced settlement with semi-empirical procedures that predict post-liquefaction, one-dimensional, consolidation settlement for free-field conditions [8,9,10]. Other contributions (i.e., [21,22]) investigated post-liquefaction free-field settlements by considering the cyclic stress ratio and soil relative density to estimate a volumetric strain. In particular, Ref. [21] considered that this procedure is affected by a potential error ranging from 25–50% and stated that liquefaction conditions are more complex than accounted for in their prediction.
In addition, Ref. [23] proposed an expression for the maximum earthquake-induced shear stress that considers both peak ground acceleration (PGA) and peak ground velocity (PGV), demonstrating that the conventional method based on PGA neglects the effects of the frequency content of the input motion.
Other researchers focused on experimental tests to assess the soil properties [24,25,26] that drive liquefaction potential. In particular, Refs. [27,28] performed centrifuge tests while shaking table tests were used in [29,30,31,32,33,34]. Centrifuge modelling has been and continues to be a valuable resource in the advancement of liquefaction understanding. The centrifuge community has had two large multi-facility round-robin validation exercises, with VELACS (Verification of Liquefaction Analysis by Centrifuge Studies) [35] in the 1990s and, more recently, LEAP (Liquefaction Experiments and Analysis Projects) [36]. In the last few years, LIQUEFACT [37] used centrifuge testing to calibrate constitutive models that capture both free-field response as well as soil-structure interaction. Moreover, Ref. [38] considered the effect of acceleration and frequency of base shaking on the liquefaction potential by performing 1-g free-field liquefaction studies on sand through uniaxial shaking table tests. The assessment of the parameters that may drive liquefaction has been investigated by many researchers. Among the other contributions, Ref. [39] investigated the role of magnitude, mean grain size, vertical effective stress, peak ground acceleration, and cone resistance by applying the artificial neural network method. In addition, Ref. [40] developed a logistic regress model for evaluating soil liquefaction probability via the normalized resistance from cone penetration tests (CPT) and soil behaviour type indices. Moreover, Ref. [41] considered the effective stress, soil type, shear wave velocity, peak horizontal acceleration, and earthquake magnitude with the vector machine method. Another contribution [42] analysed the effects of magnitude, standard penetration number, mean diameter, and groundwater table by considering the fuzzy comprehensive evaluation method. In addition, Ref. [43] considered the magnitude, peak ground acceleration, vertical effective stress, and standard penetration number as the main parameters by adopting a genetic algorithm. Likewise, Refs. [44,45] identified 16 significant parameters of soil liquefaction by considering the Analytic Hierarchy Process (AHP) and the entropy method, and [46] separately used AHP and rough set theory to calculate the weights of factors for soil liquefaction.
In this context, liquefaction has been studied primarily through two different approaches: (1) laboratory tests, and (2) site observations of past earthquakes. Only a few contributions [47,48,49,50,51,52,53,54,55] proposed advanced numerical simulations that assess liquefaction potential. This paper targets this gap through focused numerical simulations that study the factors that affect liquefaction, specifically concentrating on those connected with the input motion characteristics. Several parametric studies are proposed to evaluate the influence of various factors (duration, amplitude, and frequency) that define the input motions. The soil layers were taken from the profile previously analyzed in [50], and free-field conditions are applied in order to focus on the effects of liquefaction on the soil. The main novelties of the proposed methodology consist in (1) performing parametric studies with advanced numerical simulations as an alternative to the more common approaches (i.e., experimental investigations and site observations) generally adopted in literature, (2) concentrating on the loading factors themselves while most other research endeavours focused on the effects of soil parameters on the liquefaction potential, and thus the liquefaction-induced damage scenarios, and (3) that the outcomes may be considered for revisions or proposals of new code provisions that may account for loading factors in the assessments of liquefaction potential.
The paper is divided into four sections. Section 2 describes the case study by focusing on (1) the performed numerical model, (2) the constitutive materials used to model the soil layers, and (3) the non-linear analyses that have been performed. Section 3 describes the three parametric studies that have been performed to assess the role of (1) the number of cycles, (2) the frequency, and (3) the amplitude. Finally, the results are compared with the existing literature.
2. Case Study
Numerical liquefaction analyses require complex computational approaches. The following sections describe the numerical assumptions, algorithms, and non-linear procedures that were performed with the finite element interface OpenSeesPL [56], an opensource platform (soilquake.net/openseespl/ accessed on 13 January 2022).
2.1. Numerical Model
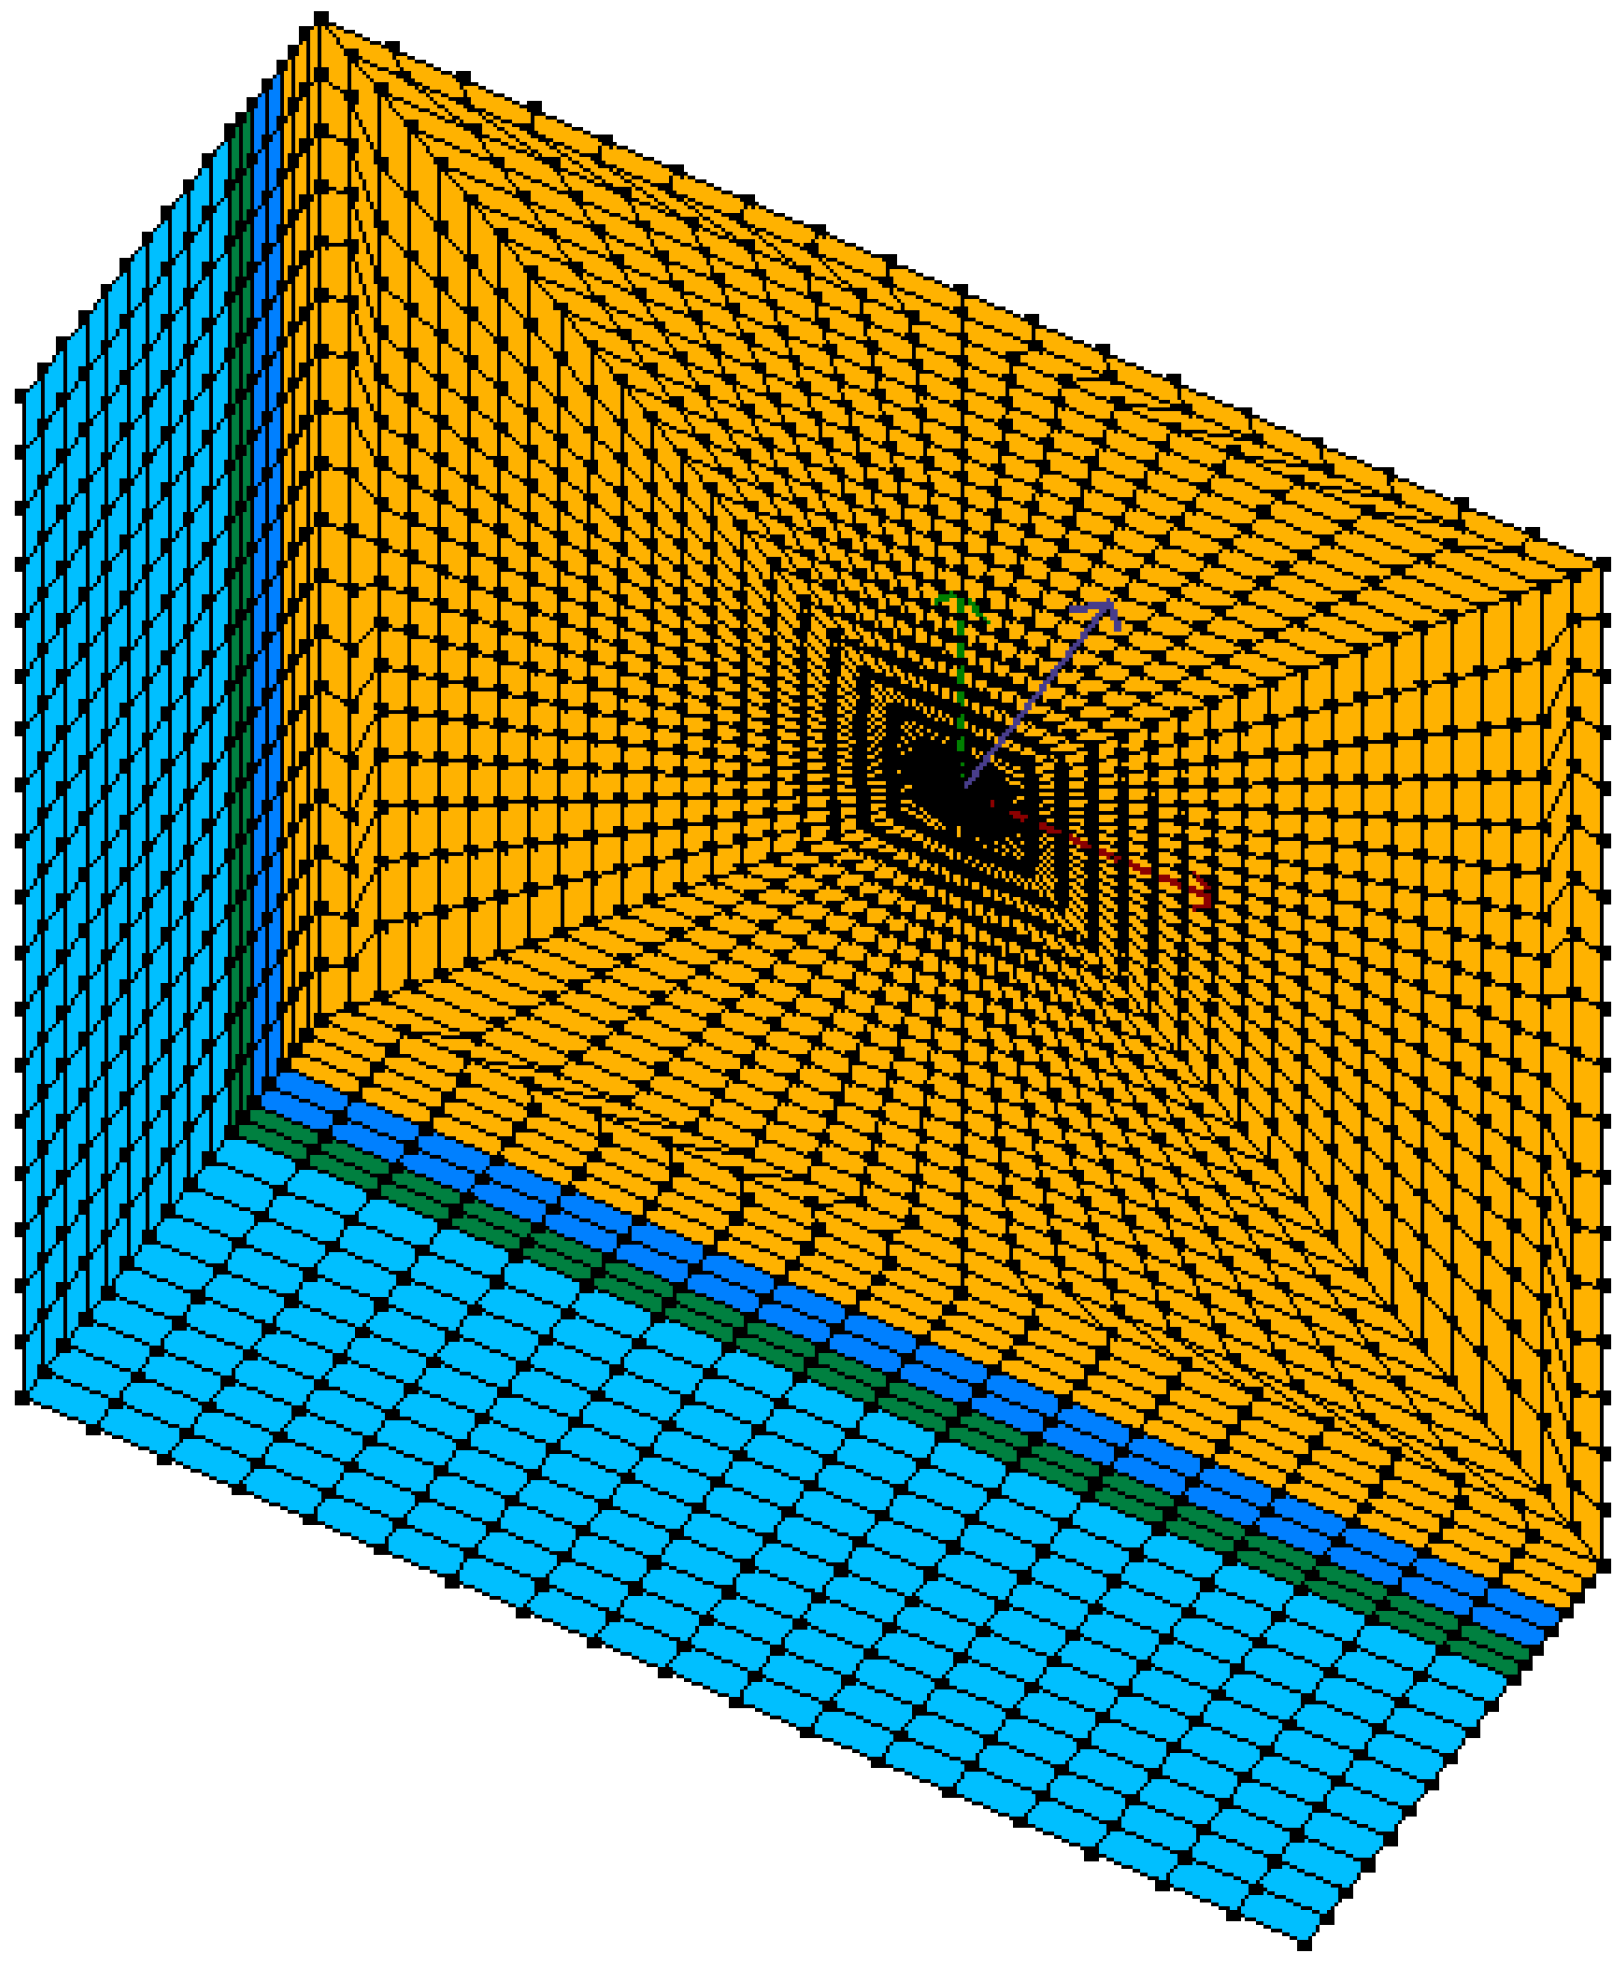
The complete 3D numerical model of the free-field soil profile consists of a layered 38 m deep series of materials, with a 3D mesh (Figure 1) that was calibrated via a convergence study between several meshes with an increasing number of nodes and elements (Table 1). Mesh 2 is used herein, as it is an efficient and effective compromise between computational time and accuracy as derived from performing 25 cycles of the sinusoidal input motion described below (frequency: 1 Hz; amplitude: 0.2 g) as compared to the relative error of the maximum longitudinal displacement at the surface with respect to mesh 3. It consists of a 100 × 100 × 38 m mesh, comprised of 27,540 20-node BrickUP elements [56,57] and 29,826 nodes. Each BrickUP element is constructed with 20 nodes describing the solid translational degrees of freedom and 8 nodes (at the corners) that represent the fluid pressure. For each node, the first, second, and third degrees of freedom (DOF) represent solid displacement (u), and DOF 4 describes fluid pressure (p), which are recorded using the Node Recorder [50,51,52] at the corresponding integration points. The dimensions of the element increase from the centre of the model to the lateral boundaries, in order to guarantee convergence and avoid problems of instability.
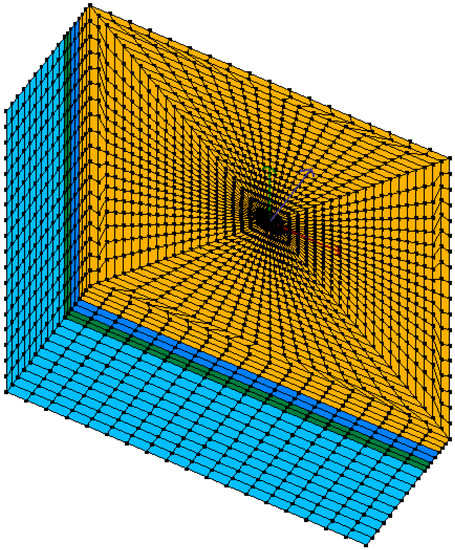
Figure 1.
3D mesh of the soil profile used in the numerical analyses (yellow: S1, blue: S2, green: C, cyan: S3).

Table 1.
Mesh parameters used in the convergence study.
In order to reproduce the infinite domain of the real soil, lateral boundaries were modelled with the penalty method to reproduce transmitting boundary conditions. A tolerance of 10−4 was chosen as a compromise; it is large enough to ensure strong constraint conditions without introducing instability problems [50,51,52]. Base boundaries (depth of 38 m) are considered elastic to allow wave filtering. The vertical direction for both the base and lateral boundaries was constrained. The longitudinal and transversal directions were unconstrained for the lateral boundaries (shear deformations) and constrained at the base of the mesh. The mesh was defined by considering the previous contributions and its performance was verified by comparing the accelerations at the top of the mesh with the free field. The water level was located at depth of 4 m below the surface, as the water profile was governed by a nearby canal.
2.2. Soil Materials
In order to model a realistic case study, the characteristics of the soil layers were derived from the representative values in [58]. The considered layers are representative of the typical riverbank subsoil of the studied area. The layers were modelled herein with three cohesionless soil units (S1, S2, and S3, as described in Table 2) and a clayey soil, C. Such assumptions were necessary to implement a feasible numerical model inside OpenSeesPL. The soil materials were modelled following the u-p formulation (u is the displacement of the soil skeleton and p is the pore pressure) [59]. Several assumptions were applied: (1) small deformations and rotations; (2) the soil and water densities remain constant in both time and space; (3) porosity was considered homogeneous and constant with time; (4) incompressibility of the soil grains; and (5) equal accelerations for the soil and water [41].

Table 2.
Characteristics of soils S1, S2, and S3.
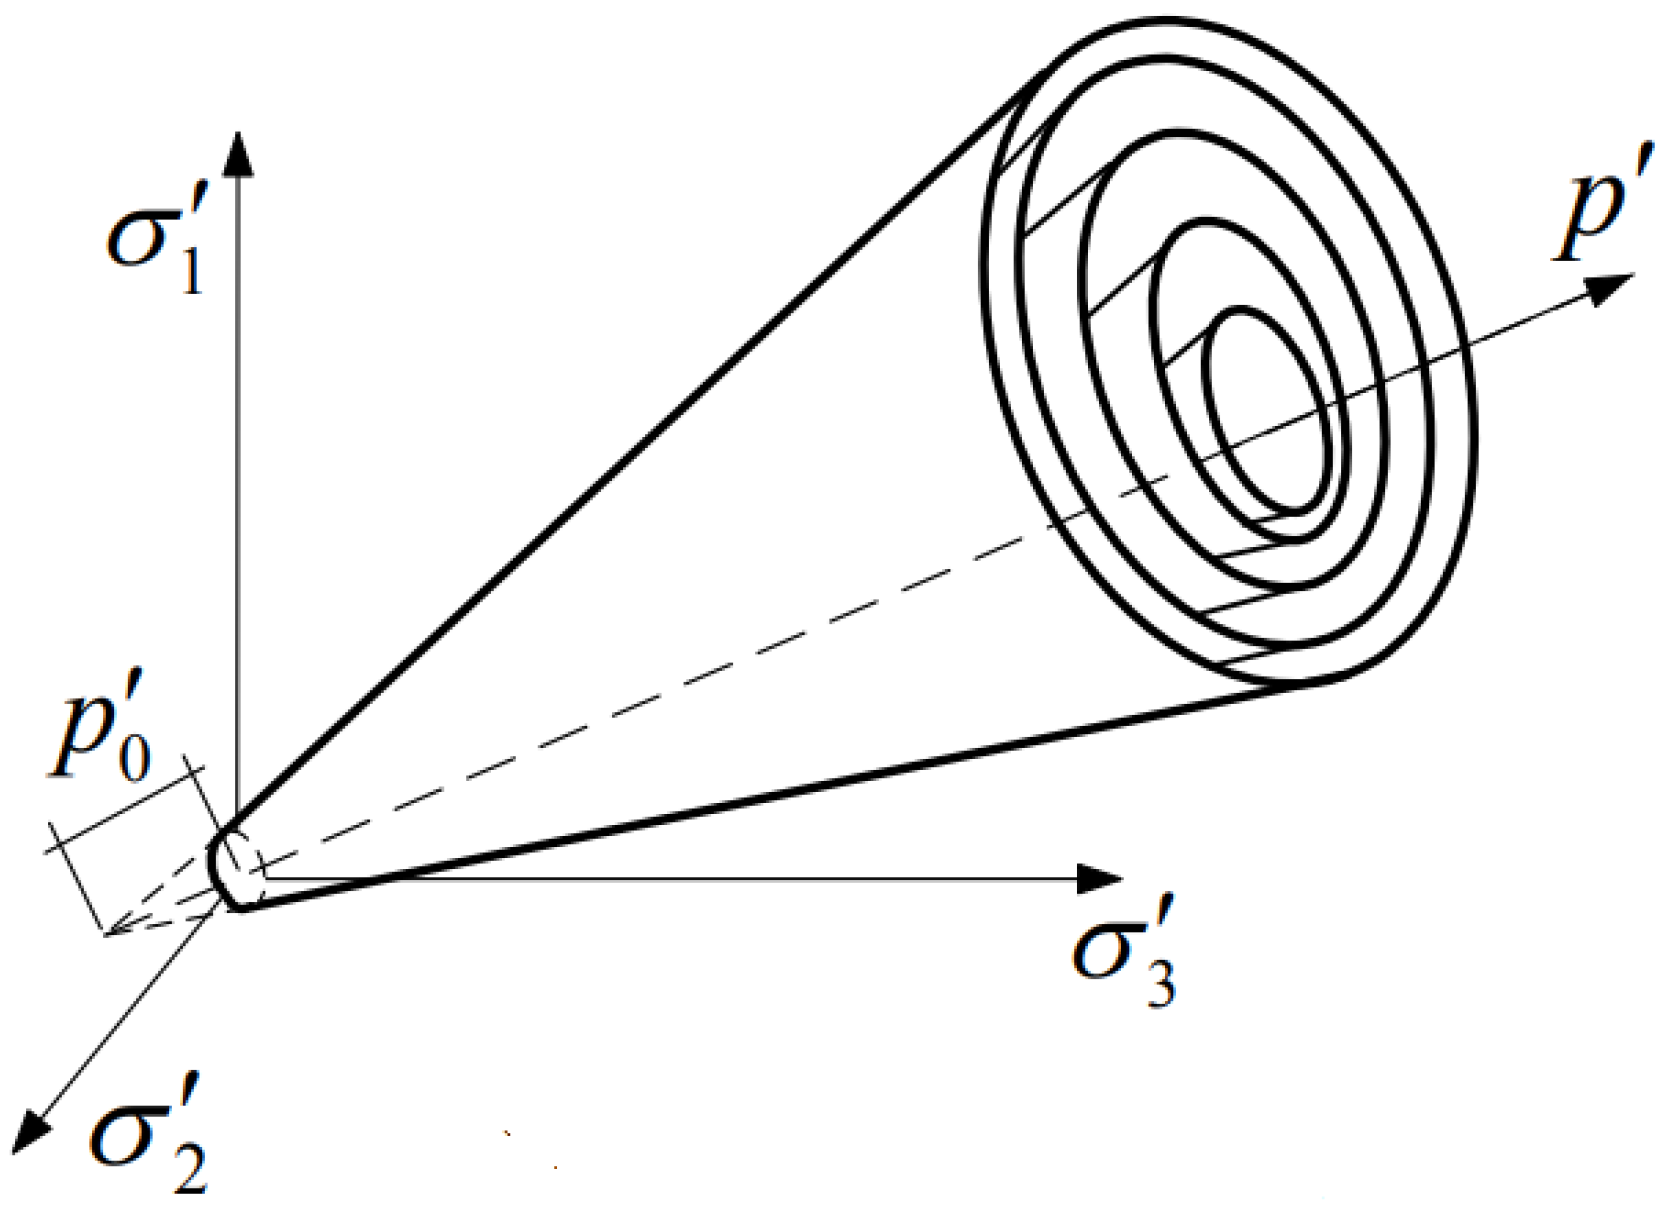
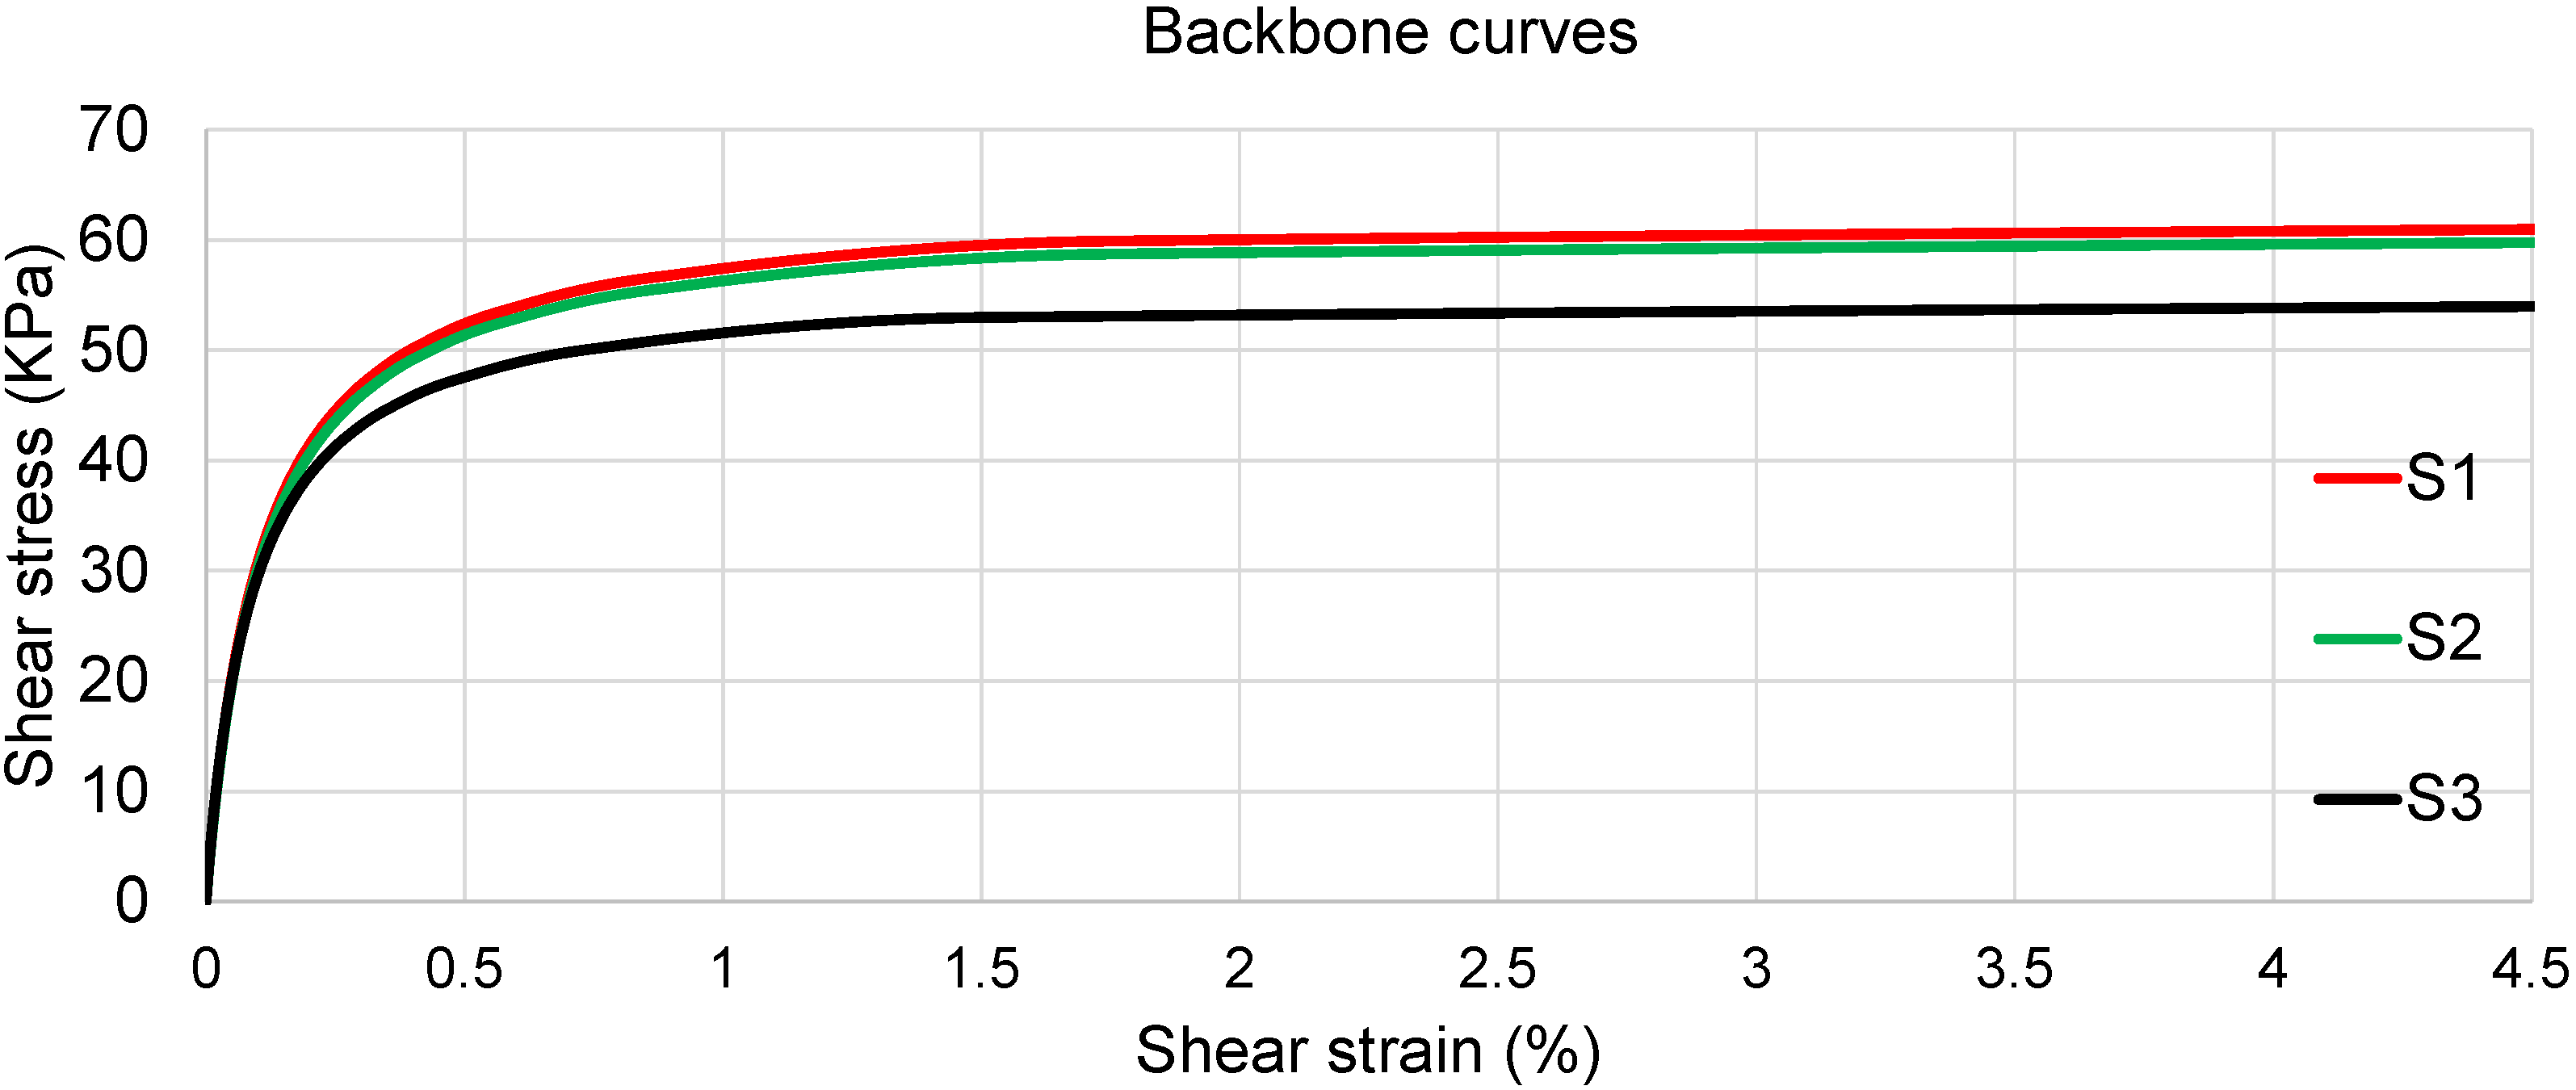
The sand layers (named S1, S2, S3) were defined with the PressureDependMultiYield model (PDMY) [49,50], based on the multi-yield-surface plasticity framework by [60]. This model reproduces the mechanism of cycle-by-cycle permanent shear strain accumulation in clean sands (Figure 2). The model was calibrated to the response of Nevada sand (at a relative density of approximately 40%) and under situations of liquefaction and lateral spreading [49]. The PDMY model applied conical-shaped yield surfaces with the common apex at the origin of principal stress space and describes the volumetric dilatation and contraction (under shear deformations) with a non-associative flow rule (Figure 2). Table 2 shows the adopted parameters: low-strain shear modulus and friction angle, shear wave velocities, permeability and the parameters that control the contraction (c1), dilatancy (d1 and d2), and the level of liquefaction-induced yield strain (l1, l2, and l3). Figure 3 shows the backbone curves for all the selected sand models. In particular, contraction and dilatancy parameters define the rate of shear-induced volumetric decrease (contraction) or increase (dilatancy). Larger values correspond to faster rates, with a more detailed discussion found in [48].
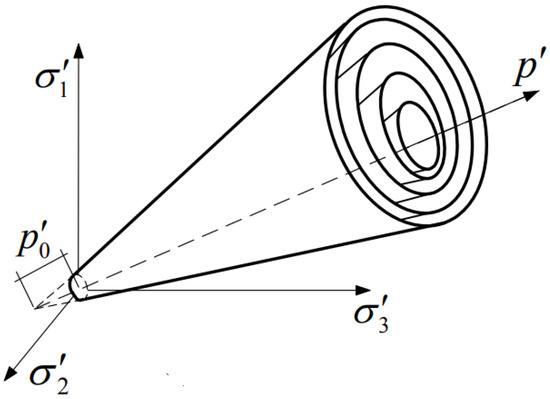
Figure 2.
PressureDependMultiYield (PDMY) model: multi-yield surfaces in principal stress space.
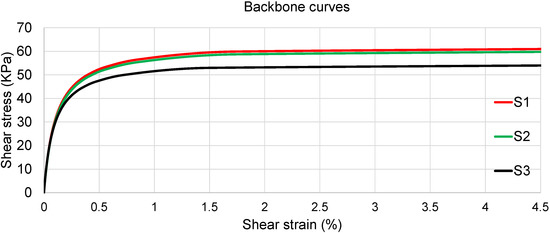
Figure 3.
Backbone curves for soils S1, S2, and S3.
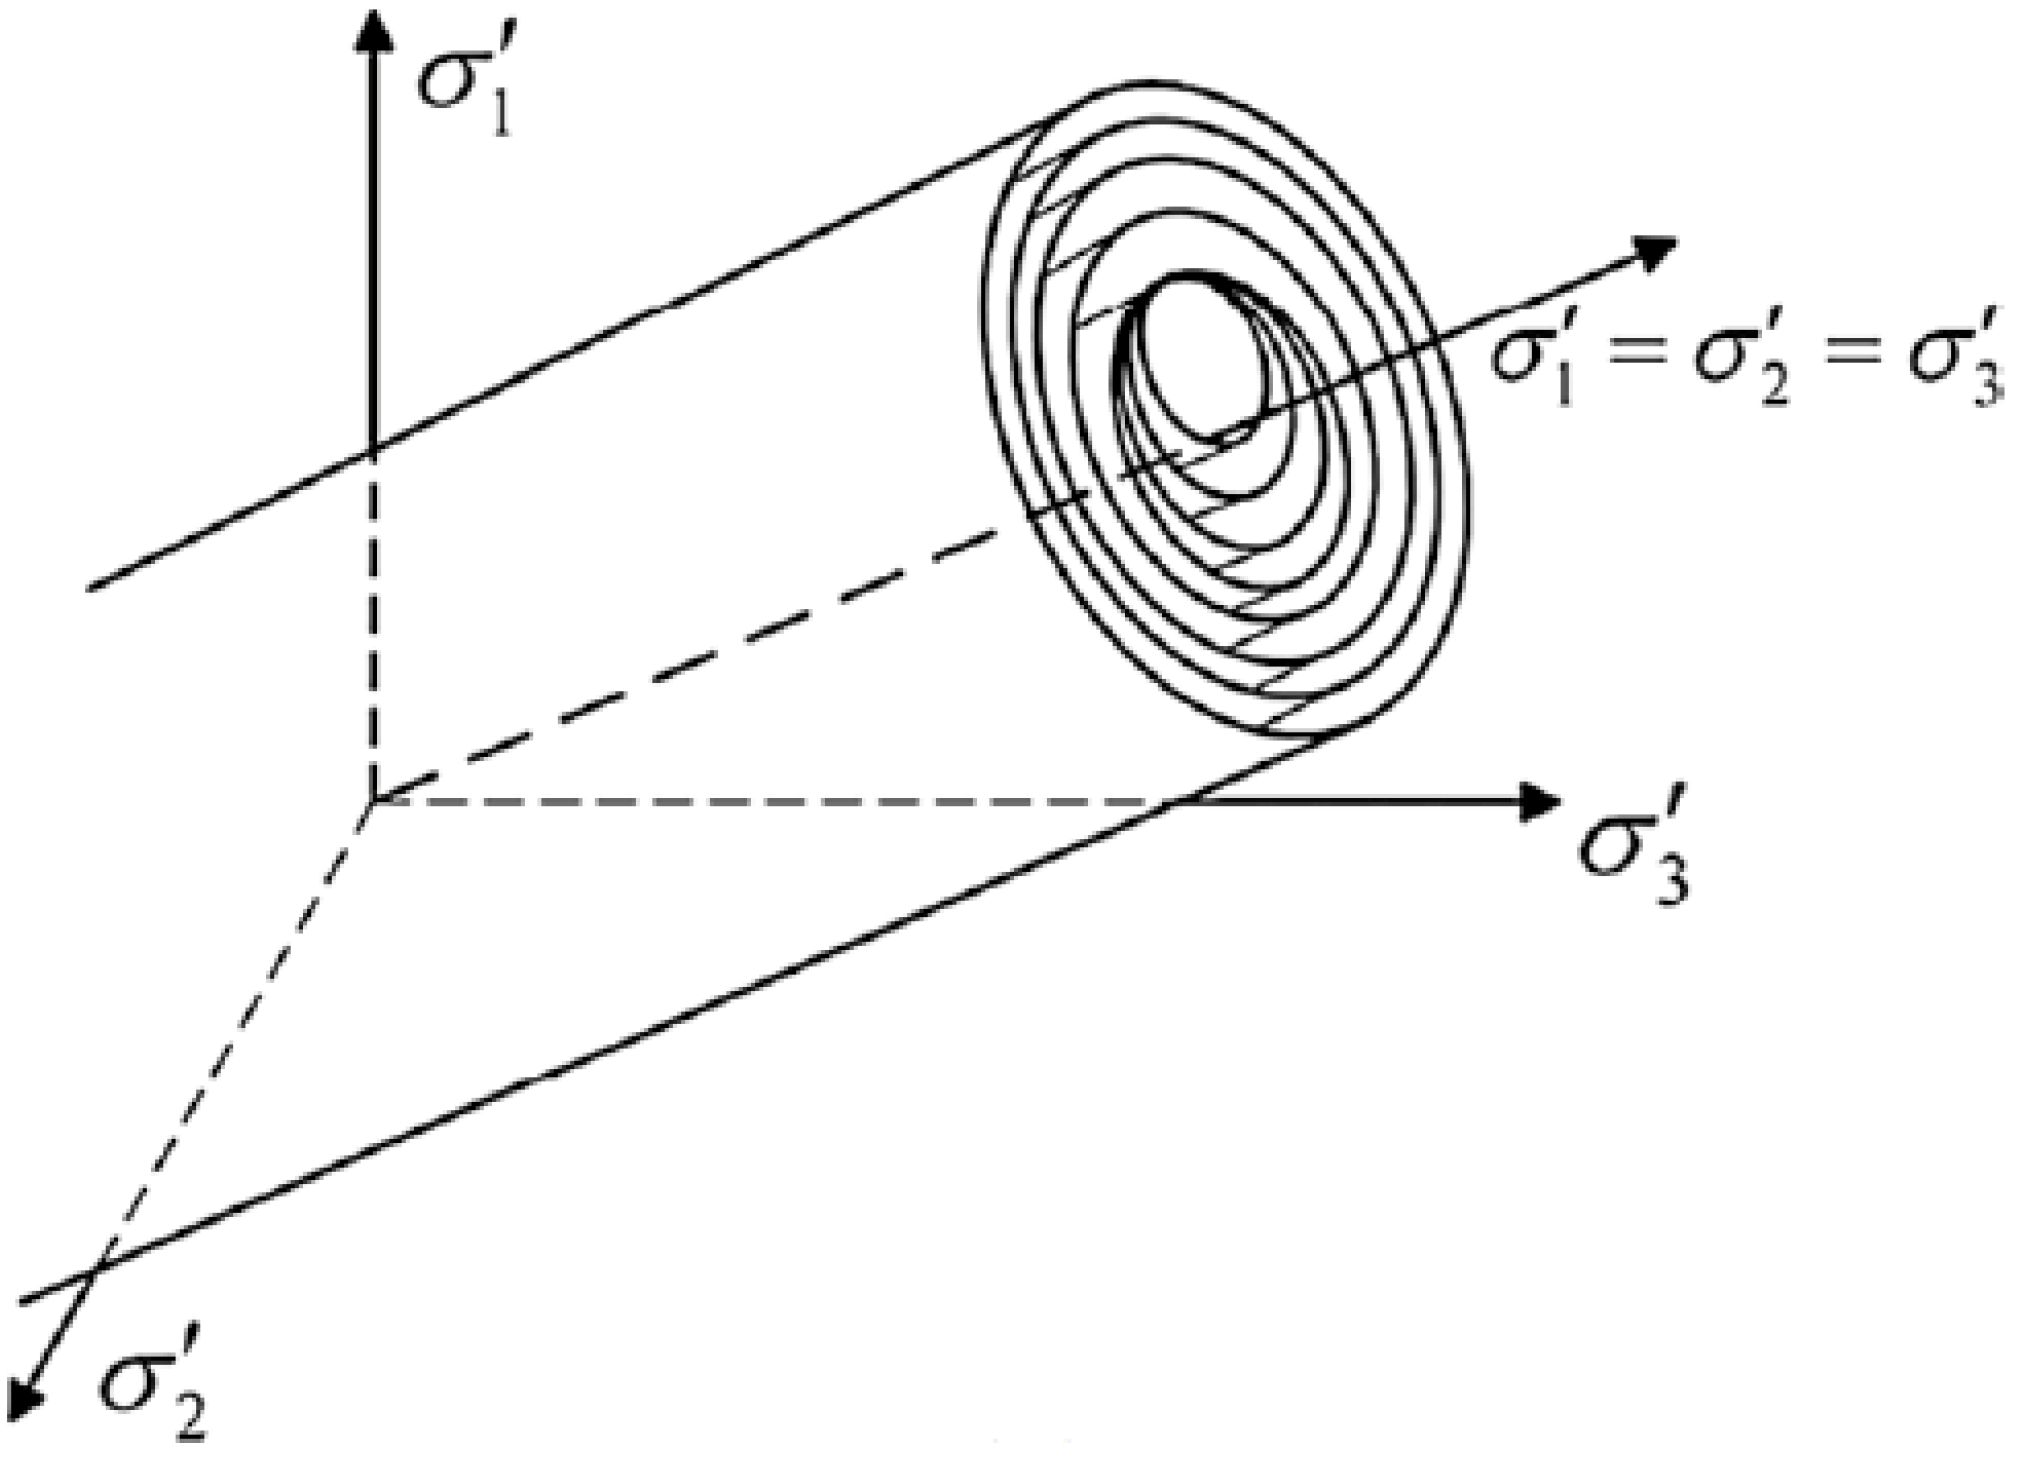
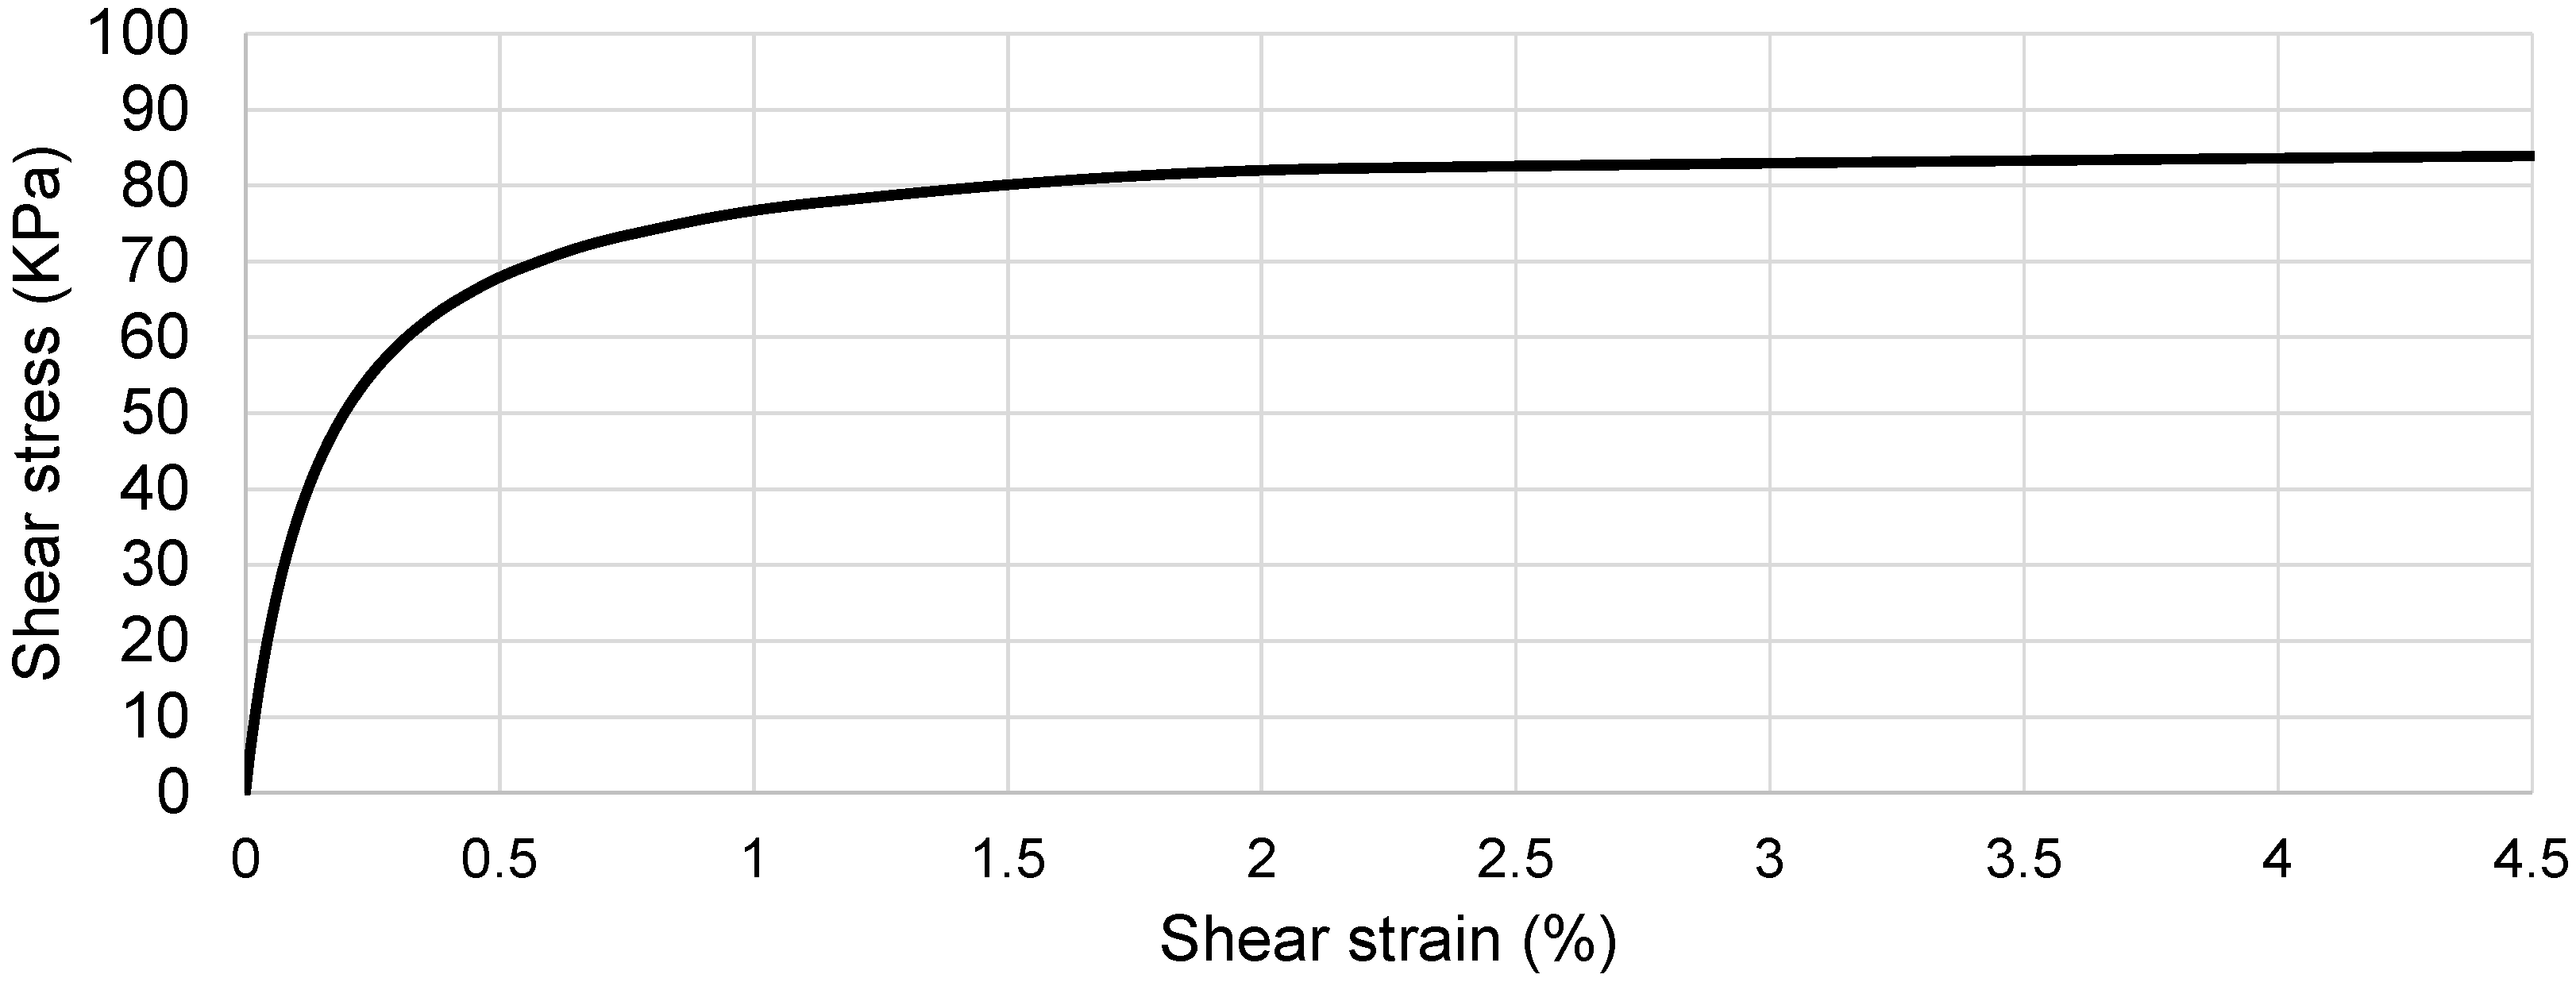
Material properties of the clay soil (called soil C) were defined with the PressureIndependMultiYield (PIMY) model [56,57] and consist of a non-linear hysteretic material based on a Von Mises multi-surface kinematic plasticity and an associate flow rule (Figure 4). This model captures both monotonic and hysteretic elastoplastic cyclic response by assuming that the shear behaviour is insensitive to confining stress. Plasticity is exhibited in the deviatoric stress–strain response and the volumetric response is linear-elastic. Table 3 shows the values used for this material, and Figure 5 shows the backbone curves for the C model. The number of yield surfaces is equal to 20 for all soil models.
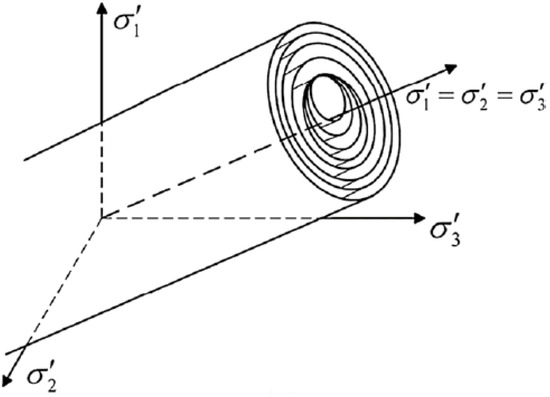
Figure 4.
PressureIndependMultiYield (PMIY) model: multi-yield surfaces in principal stress space.

Table 3.
Soils C characteristics.
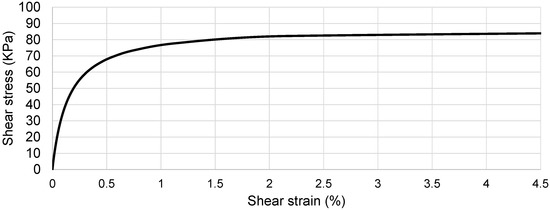
Figure 5.
Soil C backbone curve.
2.3. Non-Linear Analyses
The highly non-linear analyses were divided into four subsequent sub-steps in order to solve the convergence issues by separating the various sources of numerical instability. The first two steps consider the loading of the soil mesh, and linear properties (weight, shear, and bulk moduli) were considered: step (1) the weight of the soil only (with no water) was applied; step (2) the water was introduced. In step 3 the properties were changed from elastic to plastic by applying 25 load steps to reach convergence. Step 4 consisted of the dynamic analysis itself, and the NewtonLineSearch algorithm [57] was used. Numerical damping was applied to avoid high frequency components that can cause instability, since the system has a large degree-of-freedom and nonlinear material behaviour. The Newmark transient integrator (γ = 0.6 and β = 0.3) was used. In addition, energy dissipation at low deformation levels was considered by applying Rayleigh damping as calculated in [61,62]. The damping was set up equal to 2% and proportional to stiffness and mass (at 1 and 6 Hz), corresponding to mass-proportional and stiffness proportional coefficients of 0.12542 and 0.00090946, respectively.
2.4. Parametric Studies
Several input motions were selected by varying the characteristics of the loading factors (intensity, duration, and frequency) as detailed in Table 4, Table 5 and Table 6, in order to study the effects of various input motions on liquefaction-induced effects on the soil. Three parametric studies have been performed.

Table 4.
Details of parametric study PS1.

Table 5.
Details of parametric study PS2.

Table 6.
Details of parametric study PS3.
- (1)
- PS1: the objective is to assess the role of the number of cycles of the input motion on the liquefaction-induced effects. The number of cycles of a sinusoidal motion (1 Hz frequency and 0.2 g amplitude) were considered: 25, 20, 10, and 5 as described in Table 4.
- (2)
- PS2: the objective is to assess the role of the frequency of the input motion. The frequency of a sinusoidal motion (35 s duration and 1 g amplitude) has been varied: 1 Hz, 2 Hz, 3 Hz, 4 Hz, and 5 Hz as shown in Table 5
- (3)
- PS3: the objective is to assess the role of the amplitude. The amplitude of a sinusoidal motion (1 Hz frequency and 35 s duration) has been varied: 0.04 g, 0.08 g, 0.14 g, and 0.20 g as illustrated in Table 6.
3. Results and Discussion
As previously discussed, liquefaction analyses require complex computational formulations. In particular, the steady state of deformation defined as the locus point describing the relationship between the void ratio and the effective confining pressure is useful for identifying the conditions under which a particular soil may or may not be susceptible to liquefaction [63]. In order to discuss the results presented below, the pore pressure ratio (ru) is considered herein. The definition of ru considers the pore pressure as a fraction of the vertical stress, as described in [11]. In particular, an ru value approaching 1 is generally considered to correspond to the onset of liquefaction. Although, in most practical cases, soils supporting infrastructure will likely fail prior to an ru of 1 as the effective stress, and thus the shear capacity of the soil, is greatly reduced.
3.1. Number of Cycles
As shown in [63], the effects of liquefaction-induced failures (such as lateral spreading) develop incrementally during the period of earthquake shaking and the number of shaking cycles required to produce said failure depends largely on the shear amplitude and soil density. Therefore, liquefaction failure may occur in only a few cycles in a loose soil subjected to large cyclic shear, while many cycles are needed for a dense soil. Historical earthquake records (i.e., Loma Prieta in 1989, Northridge in 1994, and Kobe in 1995) showed that there are many factors (and thus uncertainties) other than magnitude that are connected to duration [64].
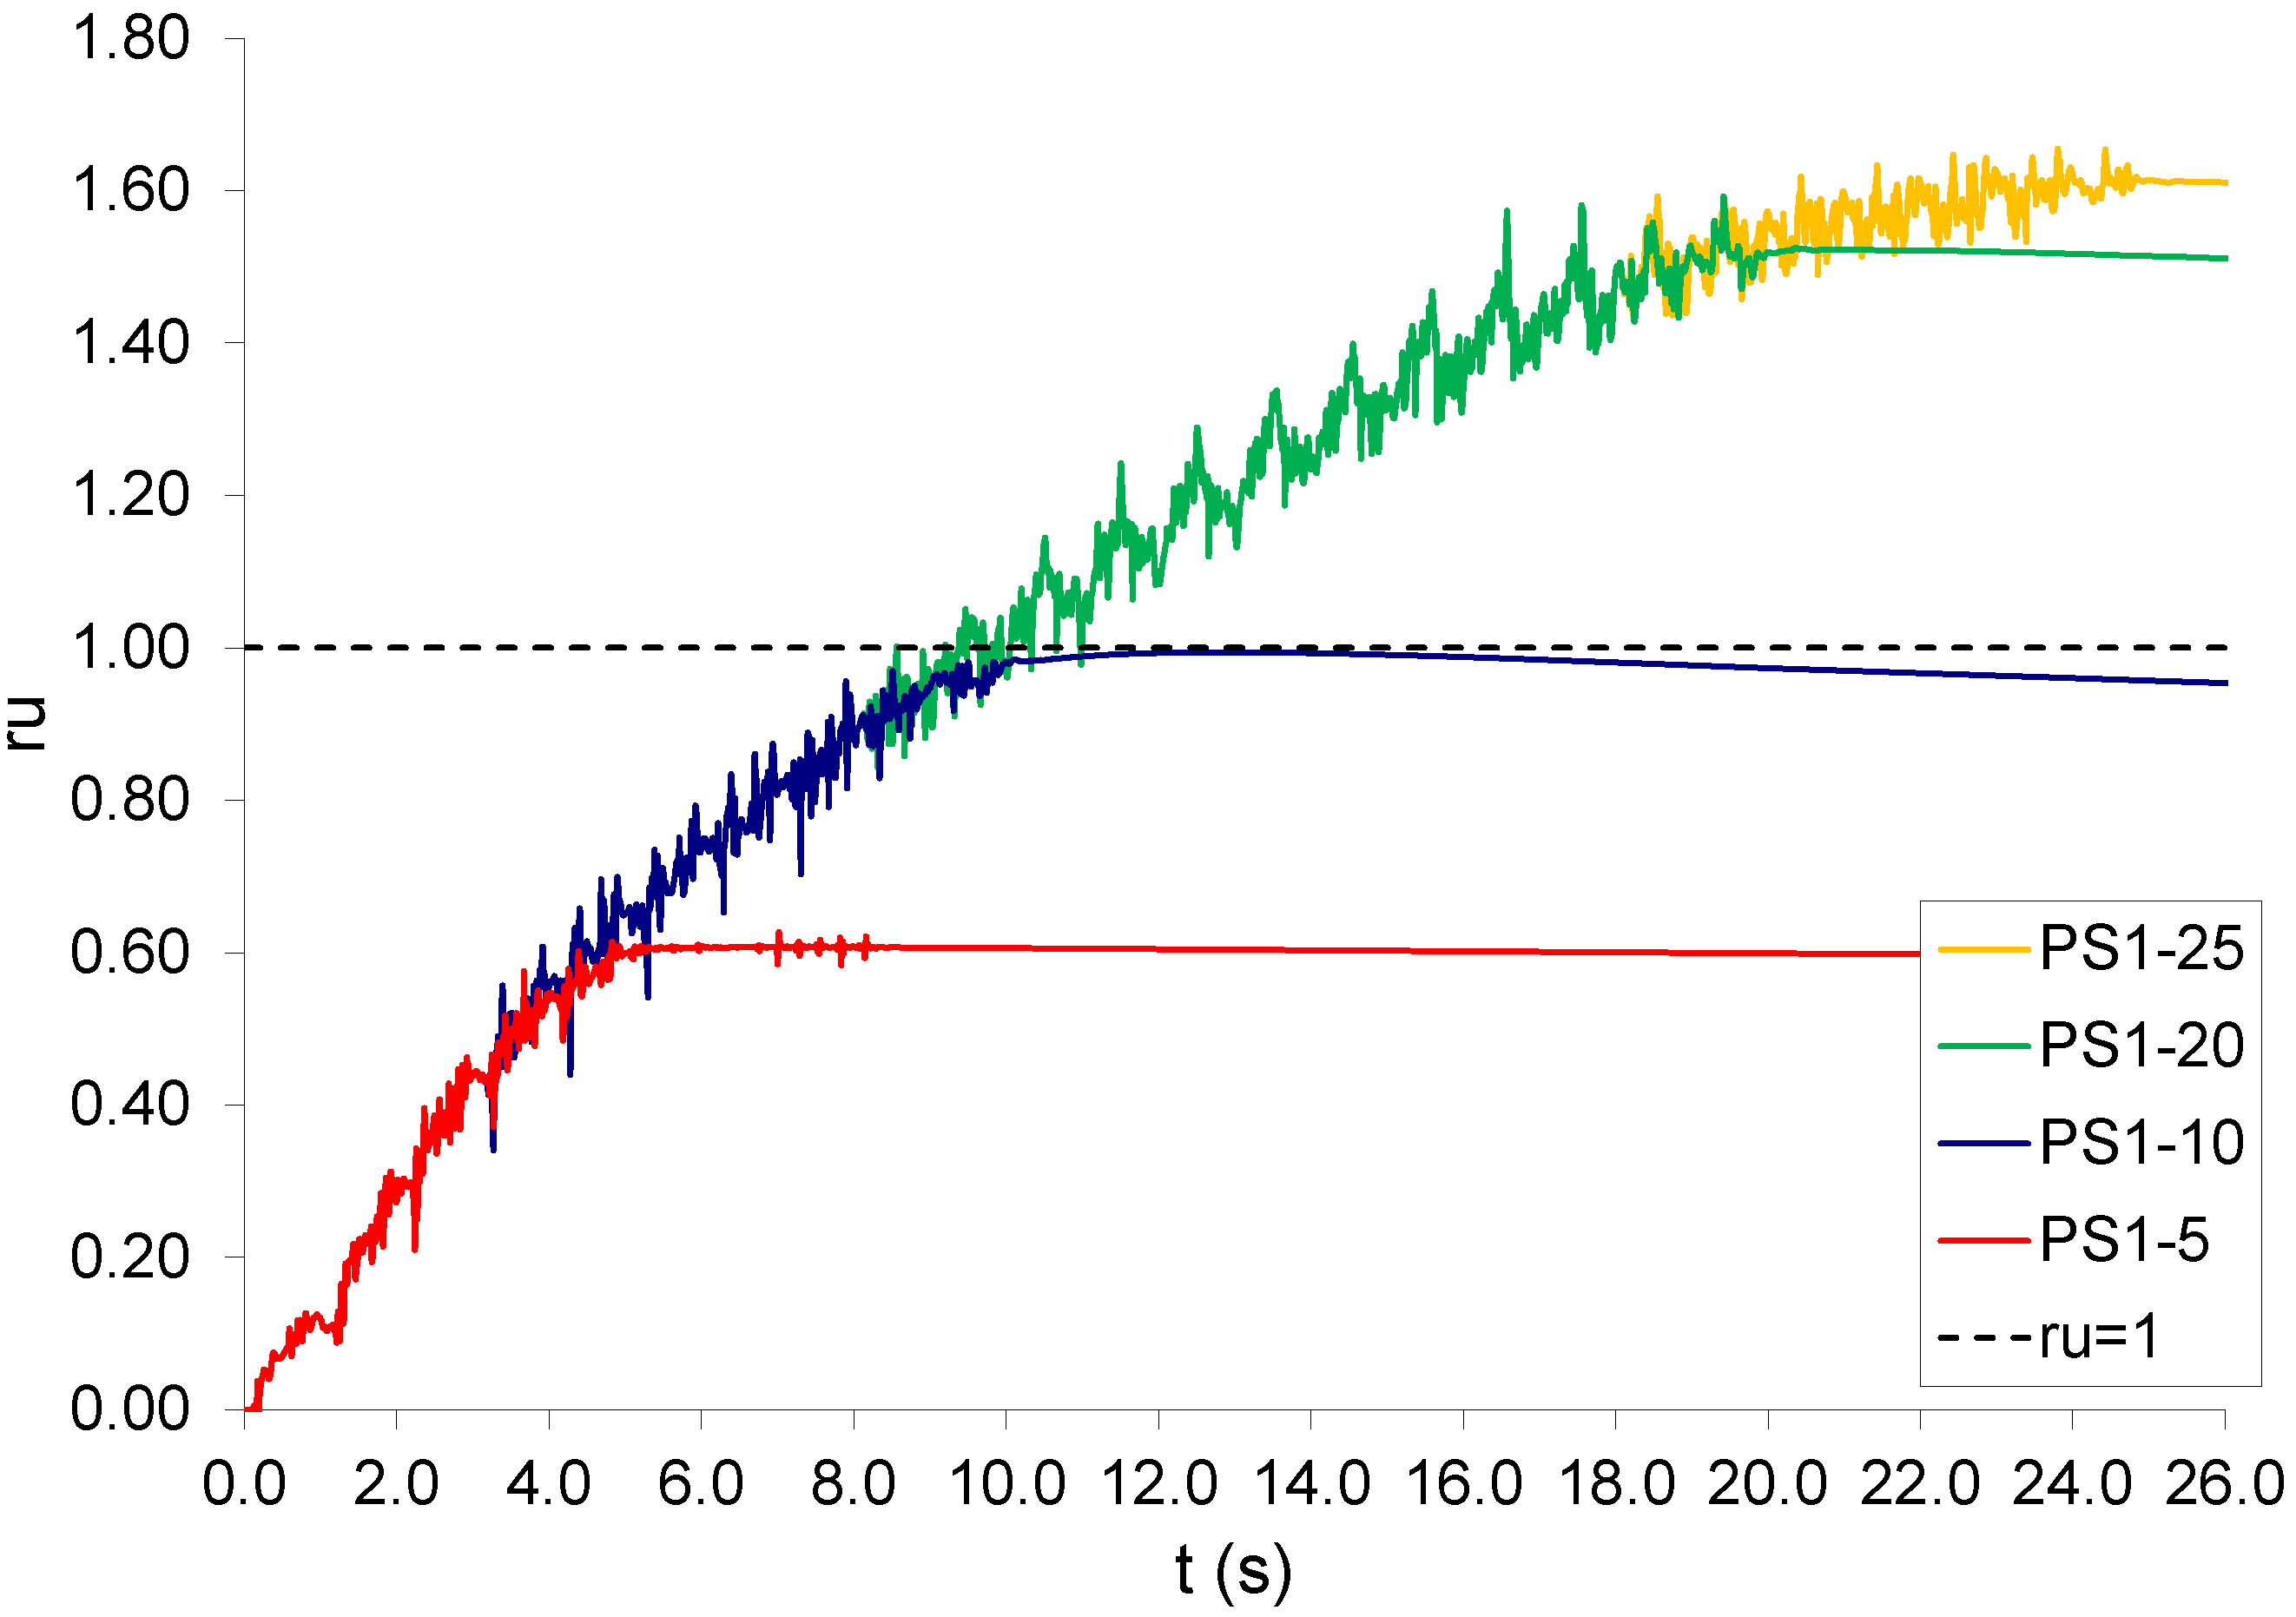
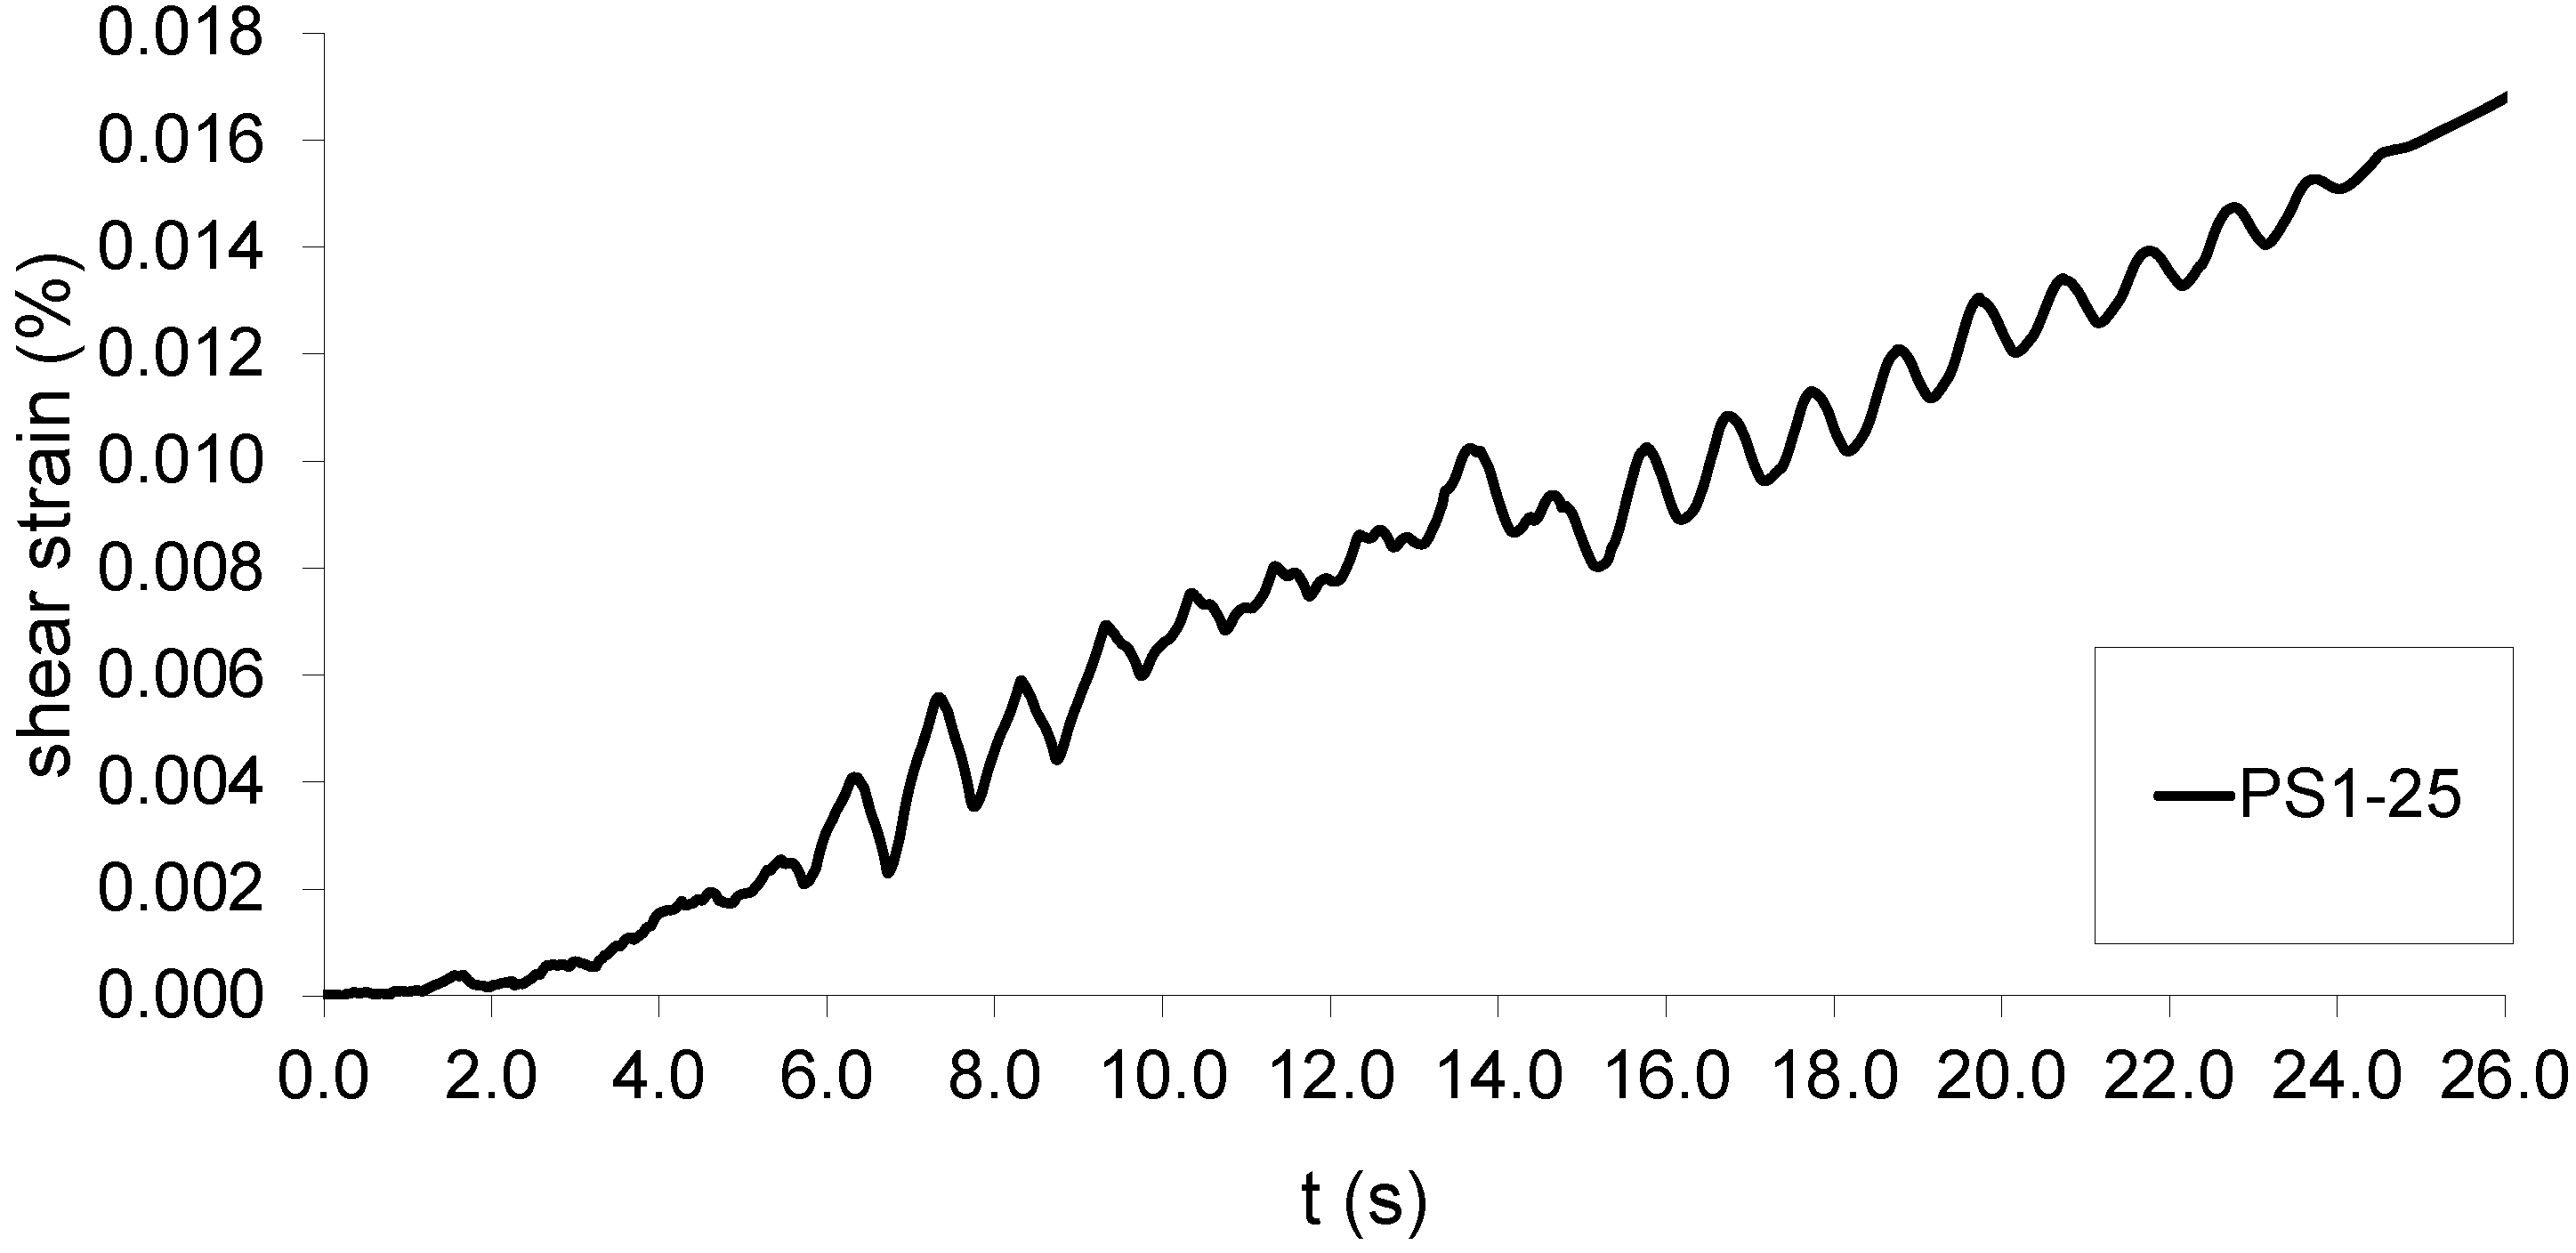
Herein the importance of the number of cycles is assessed by performing several analyses with a different number of cycles and consequently duration (Table 4). Figure 6 shows the results for the parametric study, where the horizontal line represents ru = 1 and is assumed to be the point at which liquefaction occurs. If the number of cycles is less than 10 (input duration: 10 s), liquefaction does not occur. When the input motion is extended to 20 and 25 cycles (20 s and 25 s, respectively), the maximum ru reaches significant values of 1.51 and 1.61, for PS1-20 and PS1-25, respectively, as taken from a location 5 m deep in the centre of the mesh (i.e., 1 m below the water table). This finding demonstrates that the longer the duration of an input motion of sufficient amplitude occurs, the higher the pore water pressure that accumulates inside the soil, confirming what is presented in [65], where the influence of duration on liquefaction potential was described as the possibility that pore water pressure may accumulate and thus liquefaction becomes more likely. In addition, [64] considered the duration of the shaking as proportional to the earthquake magnitude. Figure 7 represents the time histories of shear strain for 25 cycles (PS1-25), showing that the increase in the deformation with time depends on the number of cycles. The linear trend observed aligns with data found in many centrifuge tests, e.g., [66,67].
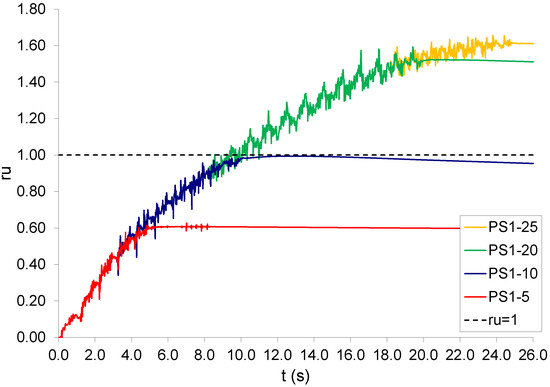
Figure 6.
Pore pressure ratios versus time for parametric study PS1.
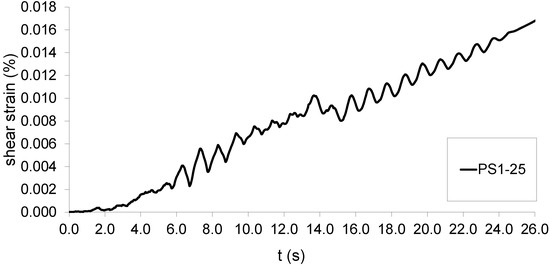
Figure 7.
Shear strain time history (PS1-25) at −5 m depth.
3.2. Frequency
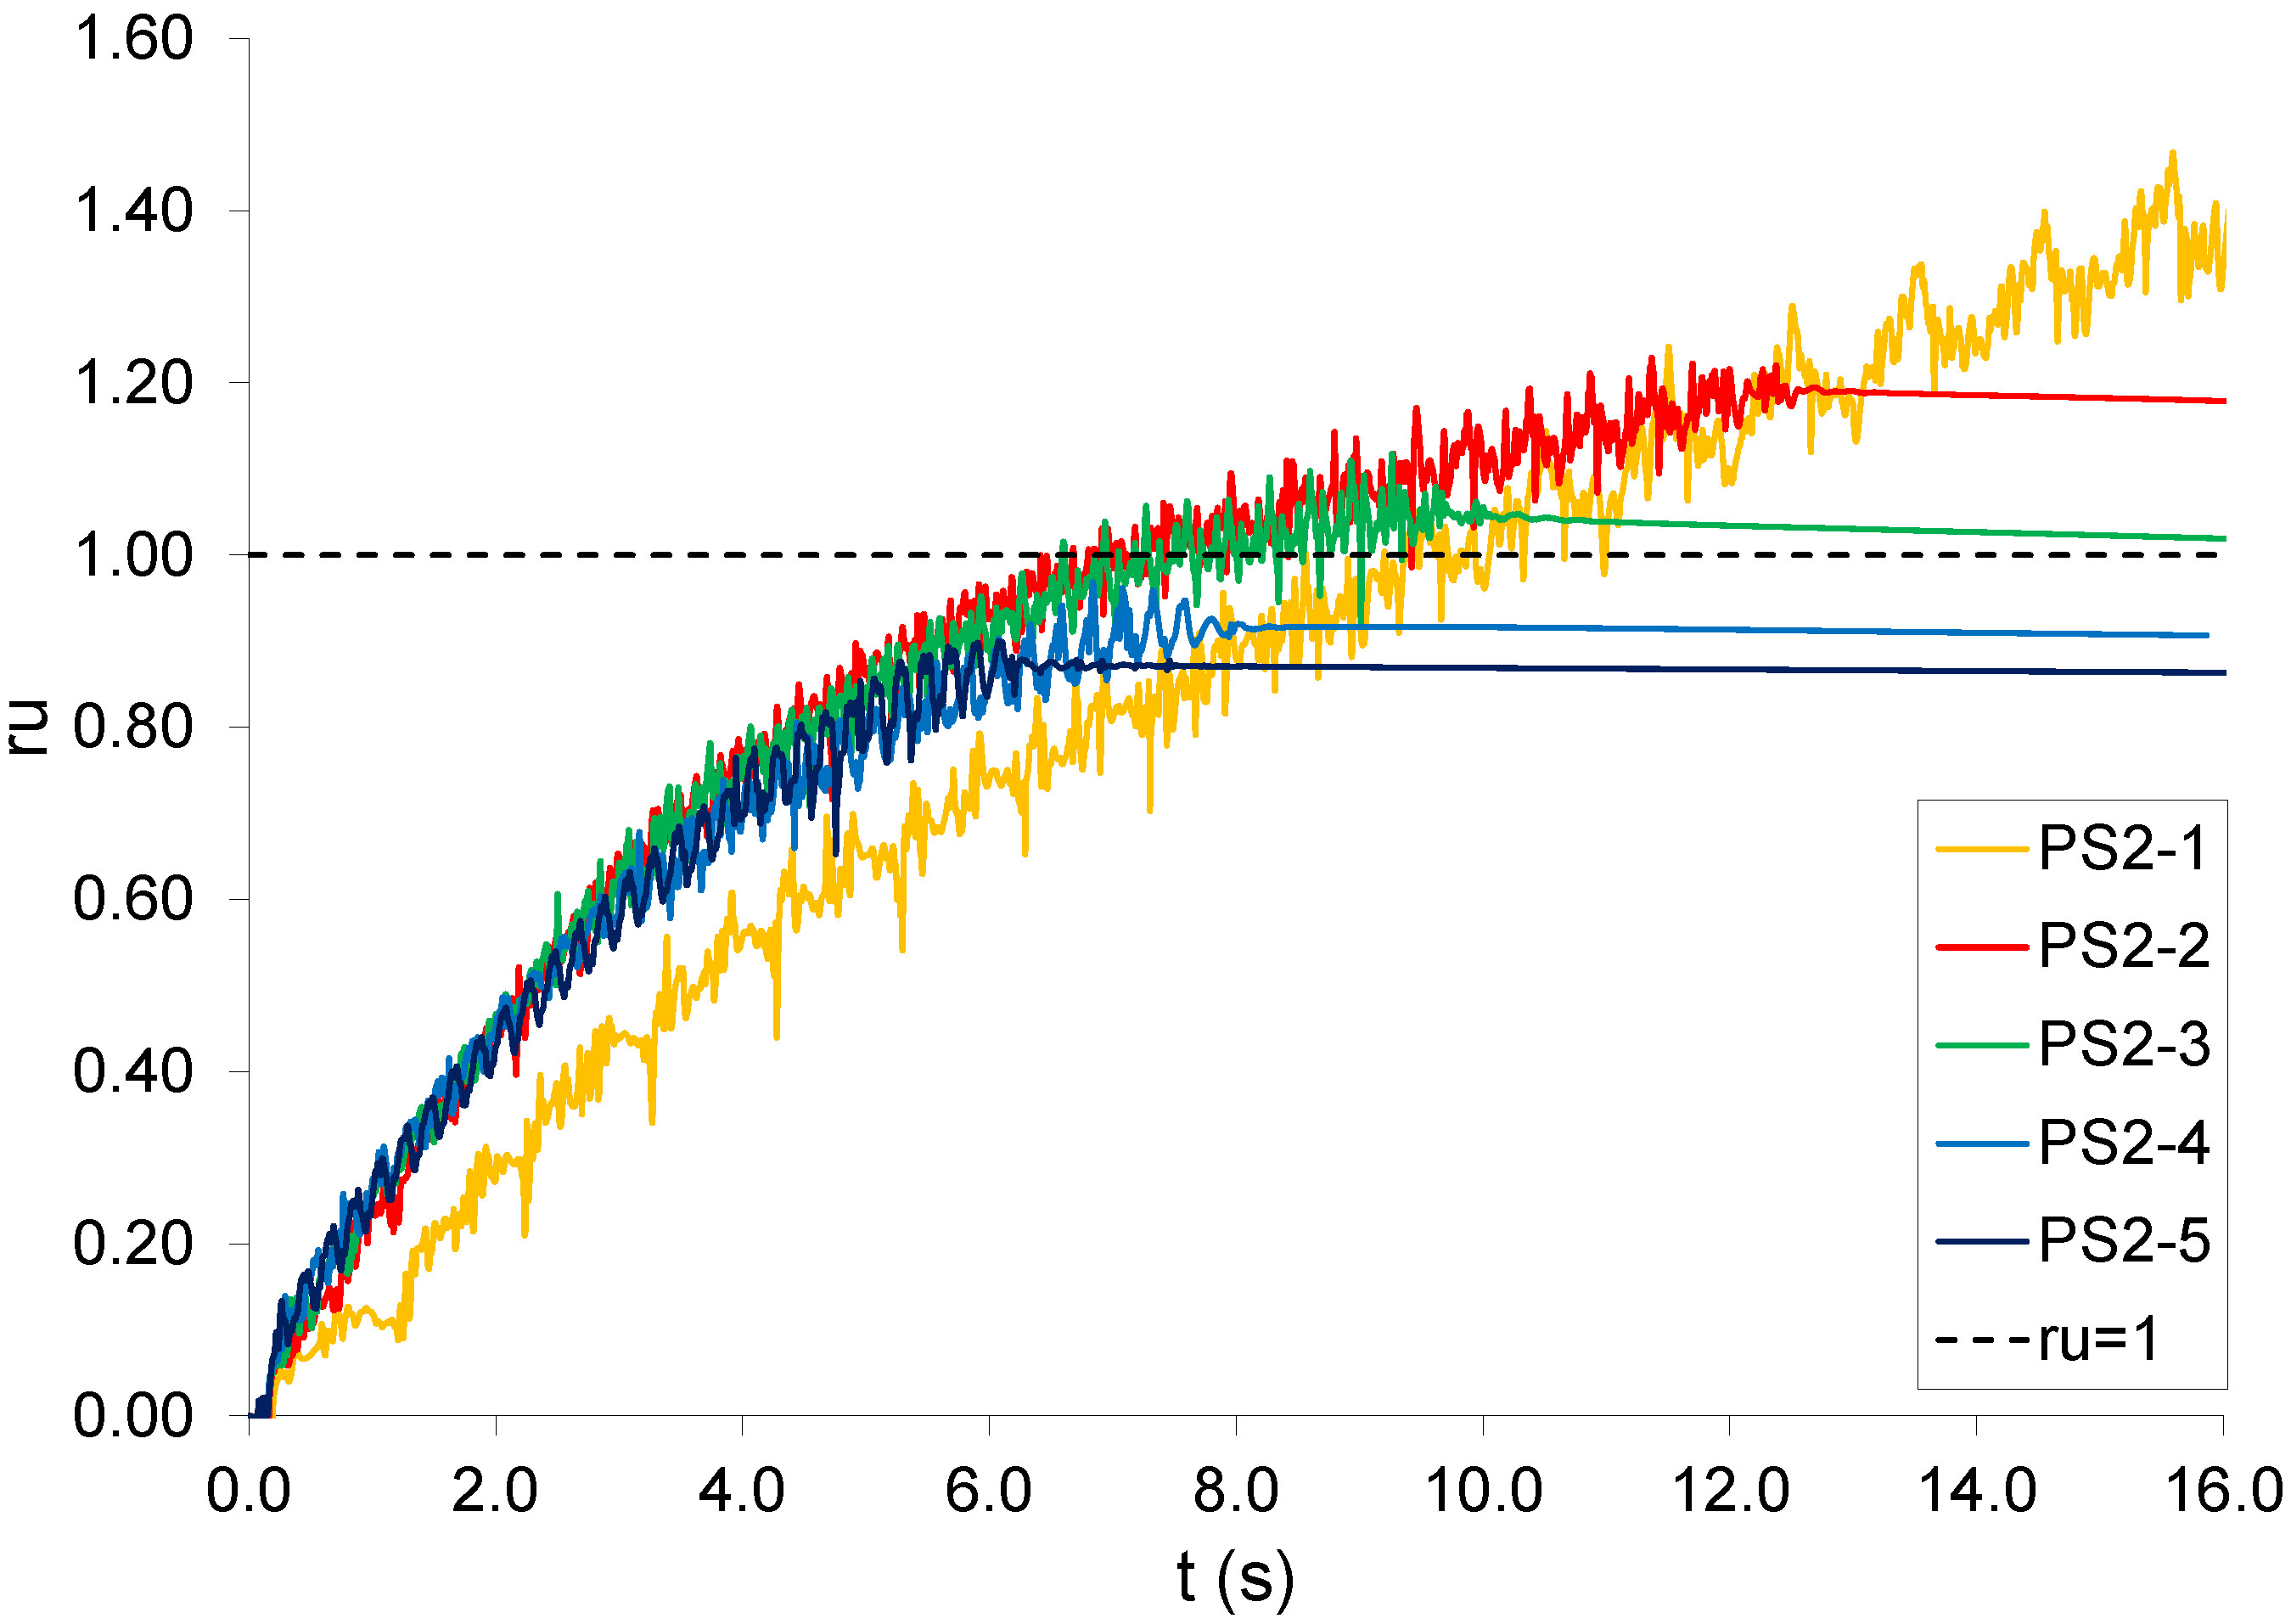
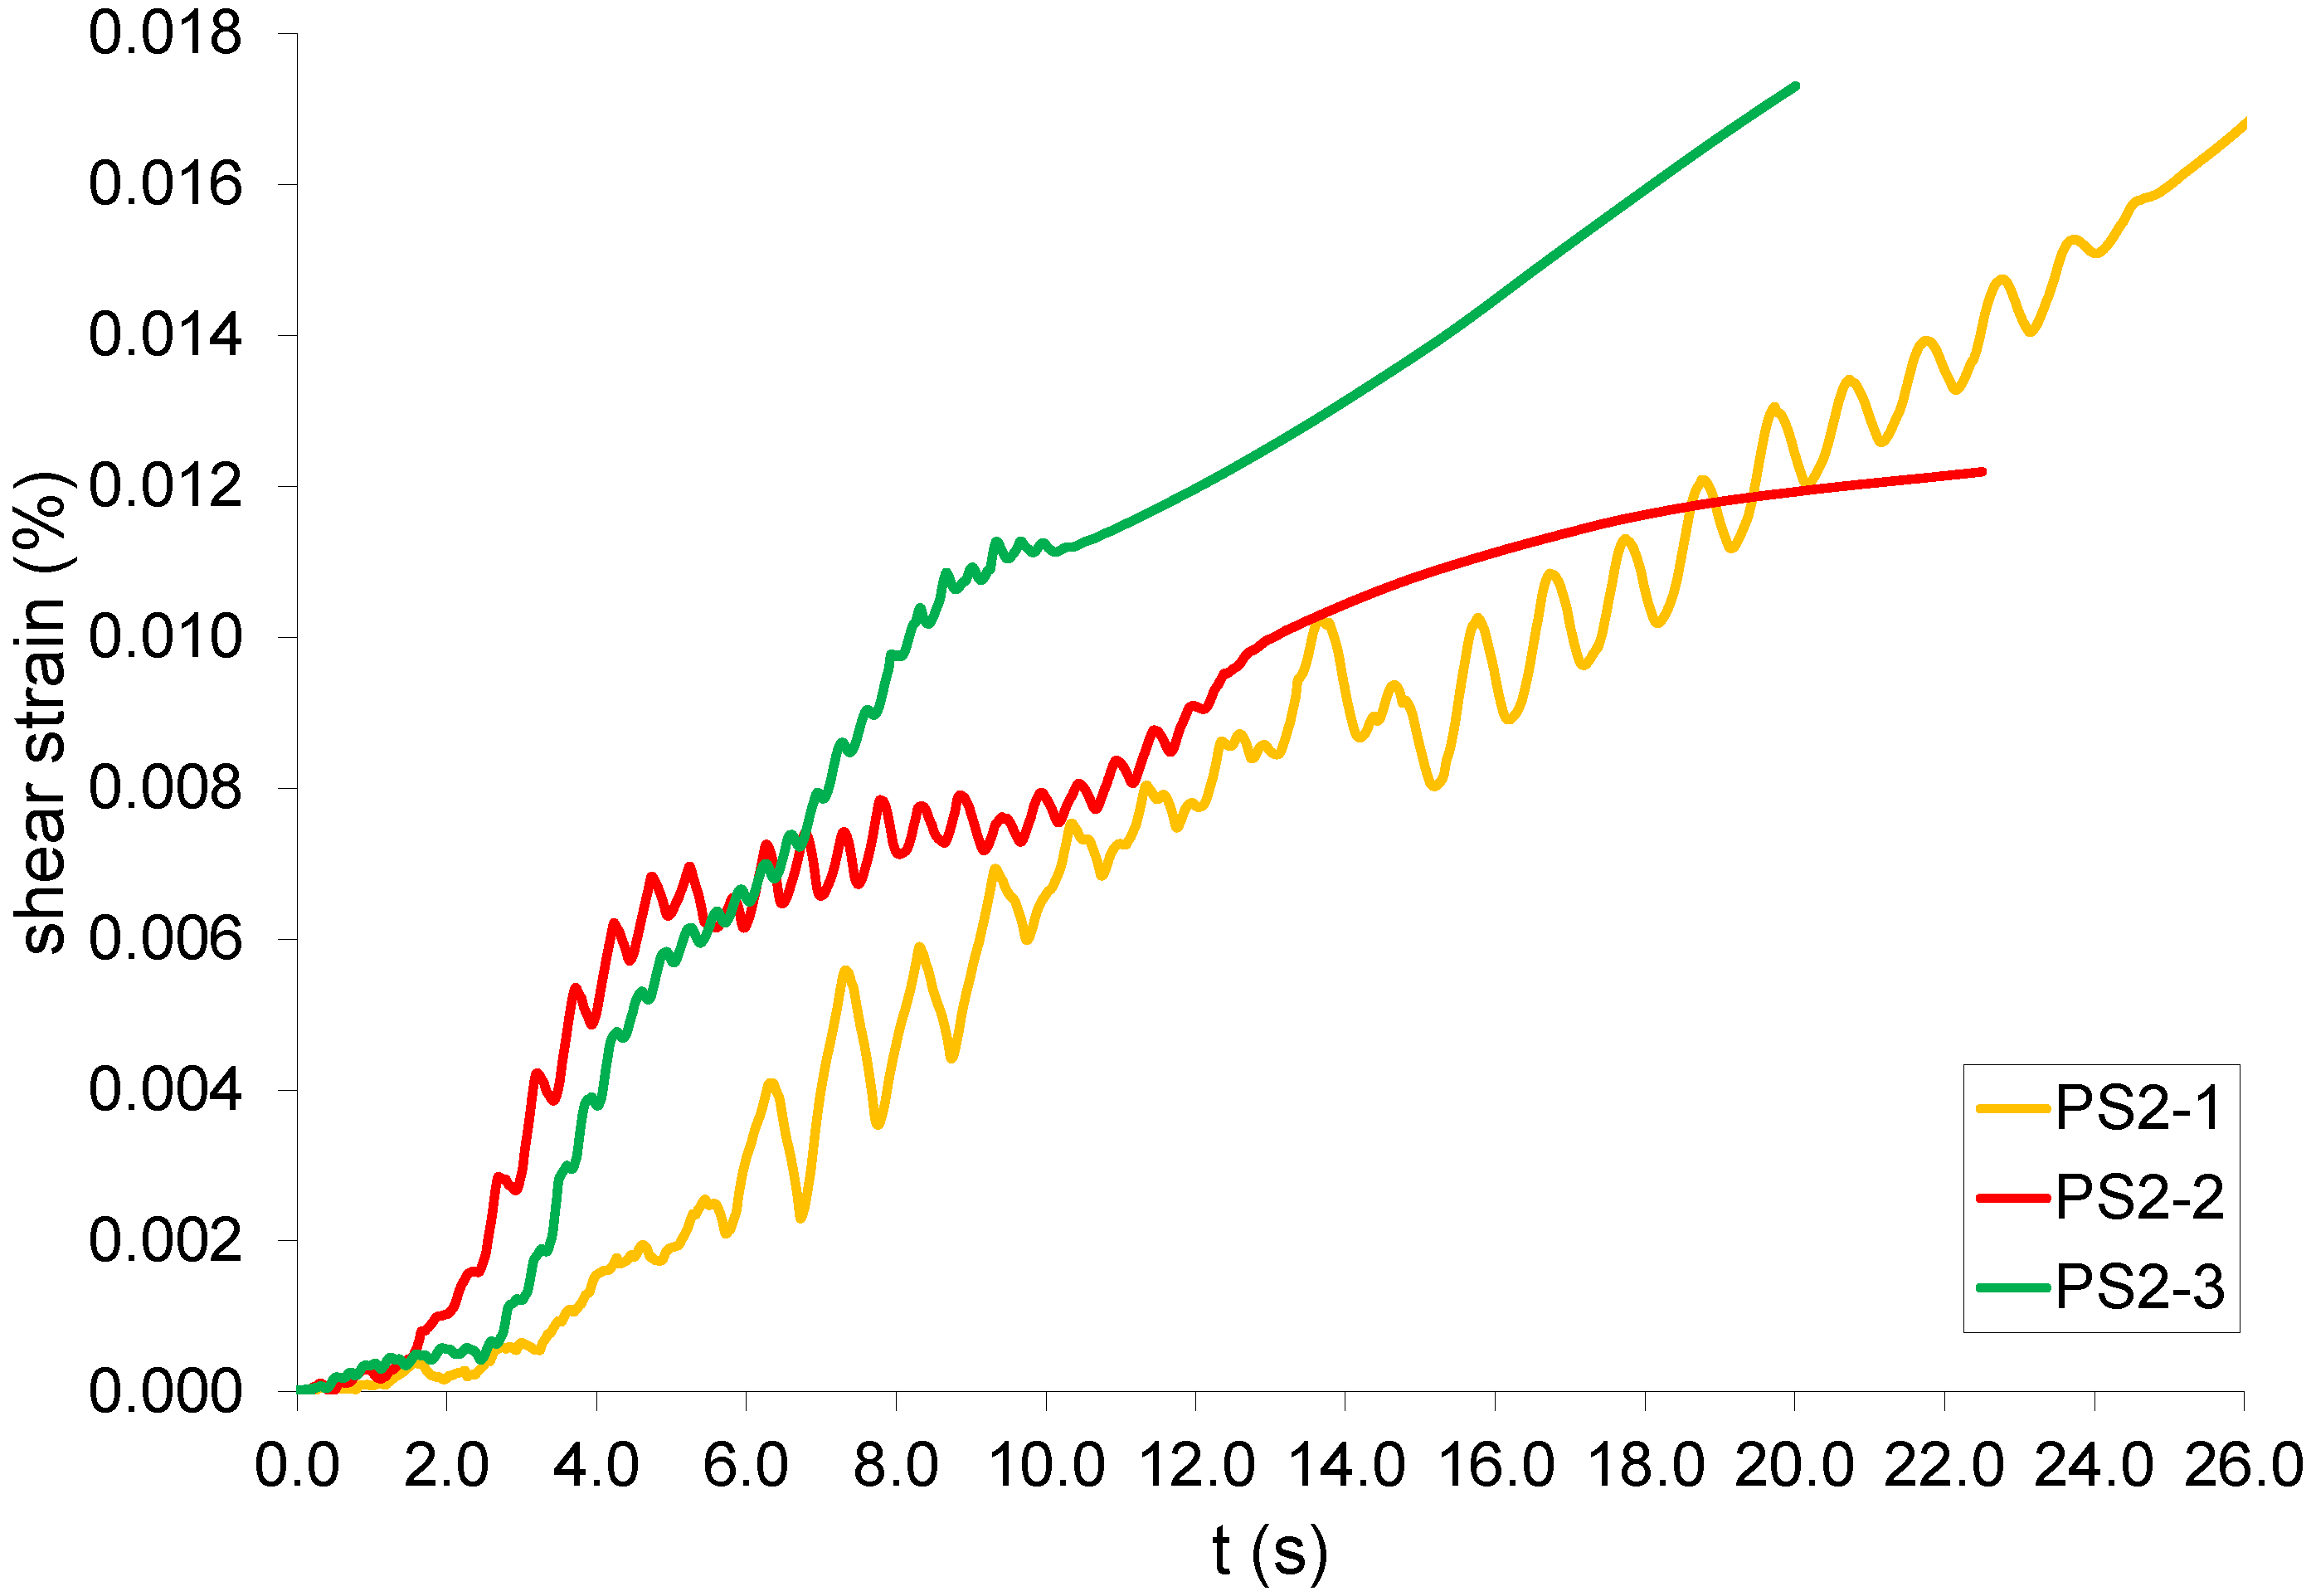
Frequency is the second factor that has been assessed via numerical modelling, keeping the number of cycles and acceleration the same (25 and 0.2 g, respectively), but changing the frequency from 1 Hz to 5 Hz. The influence of frequency on ru is shown in Figure 8, which indicates that: (1) the development of pore pressure does not depend on the frequency for the range of 2–5 Hz; in fact the various trends are almost superposed on each other; (2) for 4 Hz and 5 Hz, the soil deposit does not liquefy completely because the performed number of cycles (25) does not subject the model to a significant duration, after which soil liquefaction may occur (the maximum ru values are 0.91 and 0.87, respectively, for 4 and 5 Hz); (3) for 3 Hz, liquefaction is observed at 8 s and the maximum value of ru is 1.04; (4) for frequencies 3 Hz, 2 Hz, and 1 Hz, ru reaches the maximum values of 1.05, 1.19, and 1.61, for PS2-3, PS2-2, and PS2-1, respectively; and (5) for 1 Hz, pore pressure increases slower than for the other frequencies, showing that there is a value of frequency at which pore pressures begin to increase at a higher rate. Figure 9 shows the time histories of shear strain for the most significant cases (PS2-1; PS2-2; PS2-3) in order to assess the role of frequency in the development of the pore pressure. The results confirm what was found in [38], where three series of tests varying the frequency of base shaking were carried out to demonstrate that the frequency of base shaking at which the sand starts to liquefy depends on the density of sand.
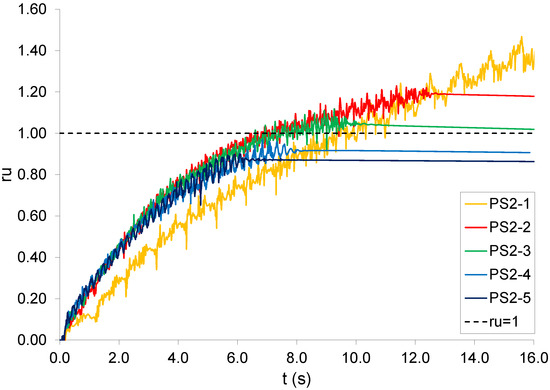
Figure 8.
Pore pressure ratios versus time for parametric study PS2.
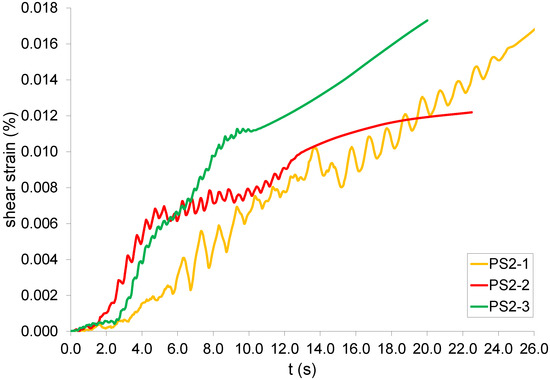
Figure 9.
Shear strain time history (PS2-1; PS2-2; PS2-3) at −5 m depth.
3.3. Amplitude
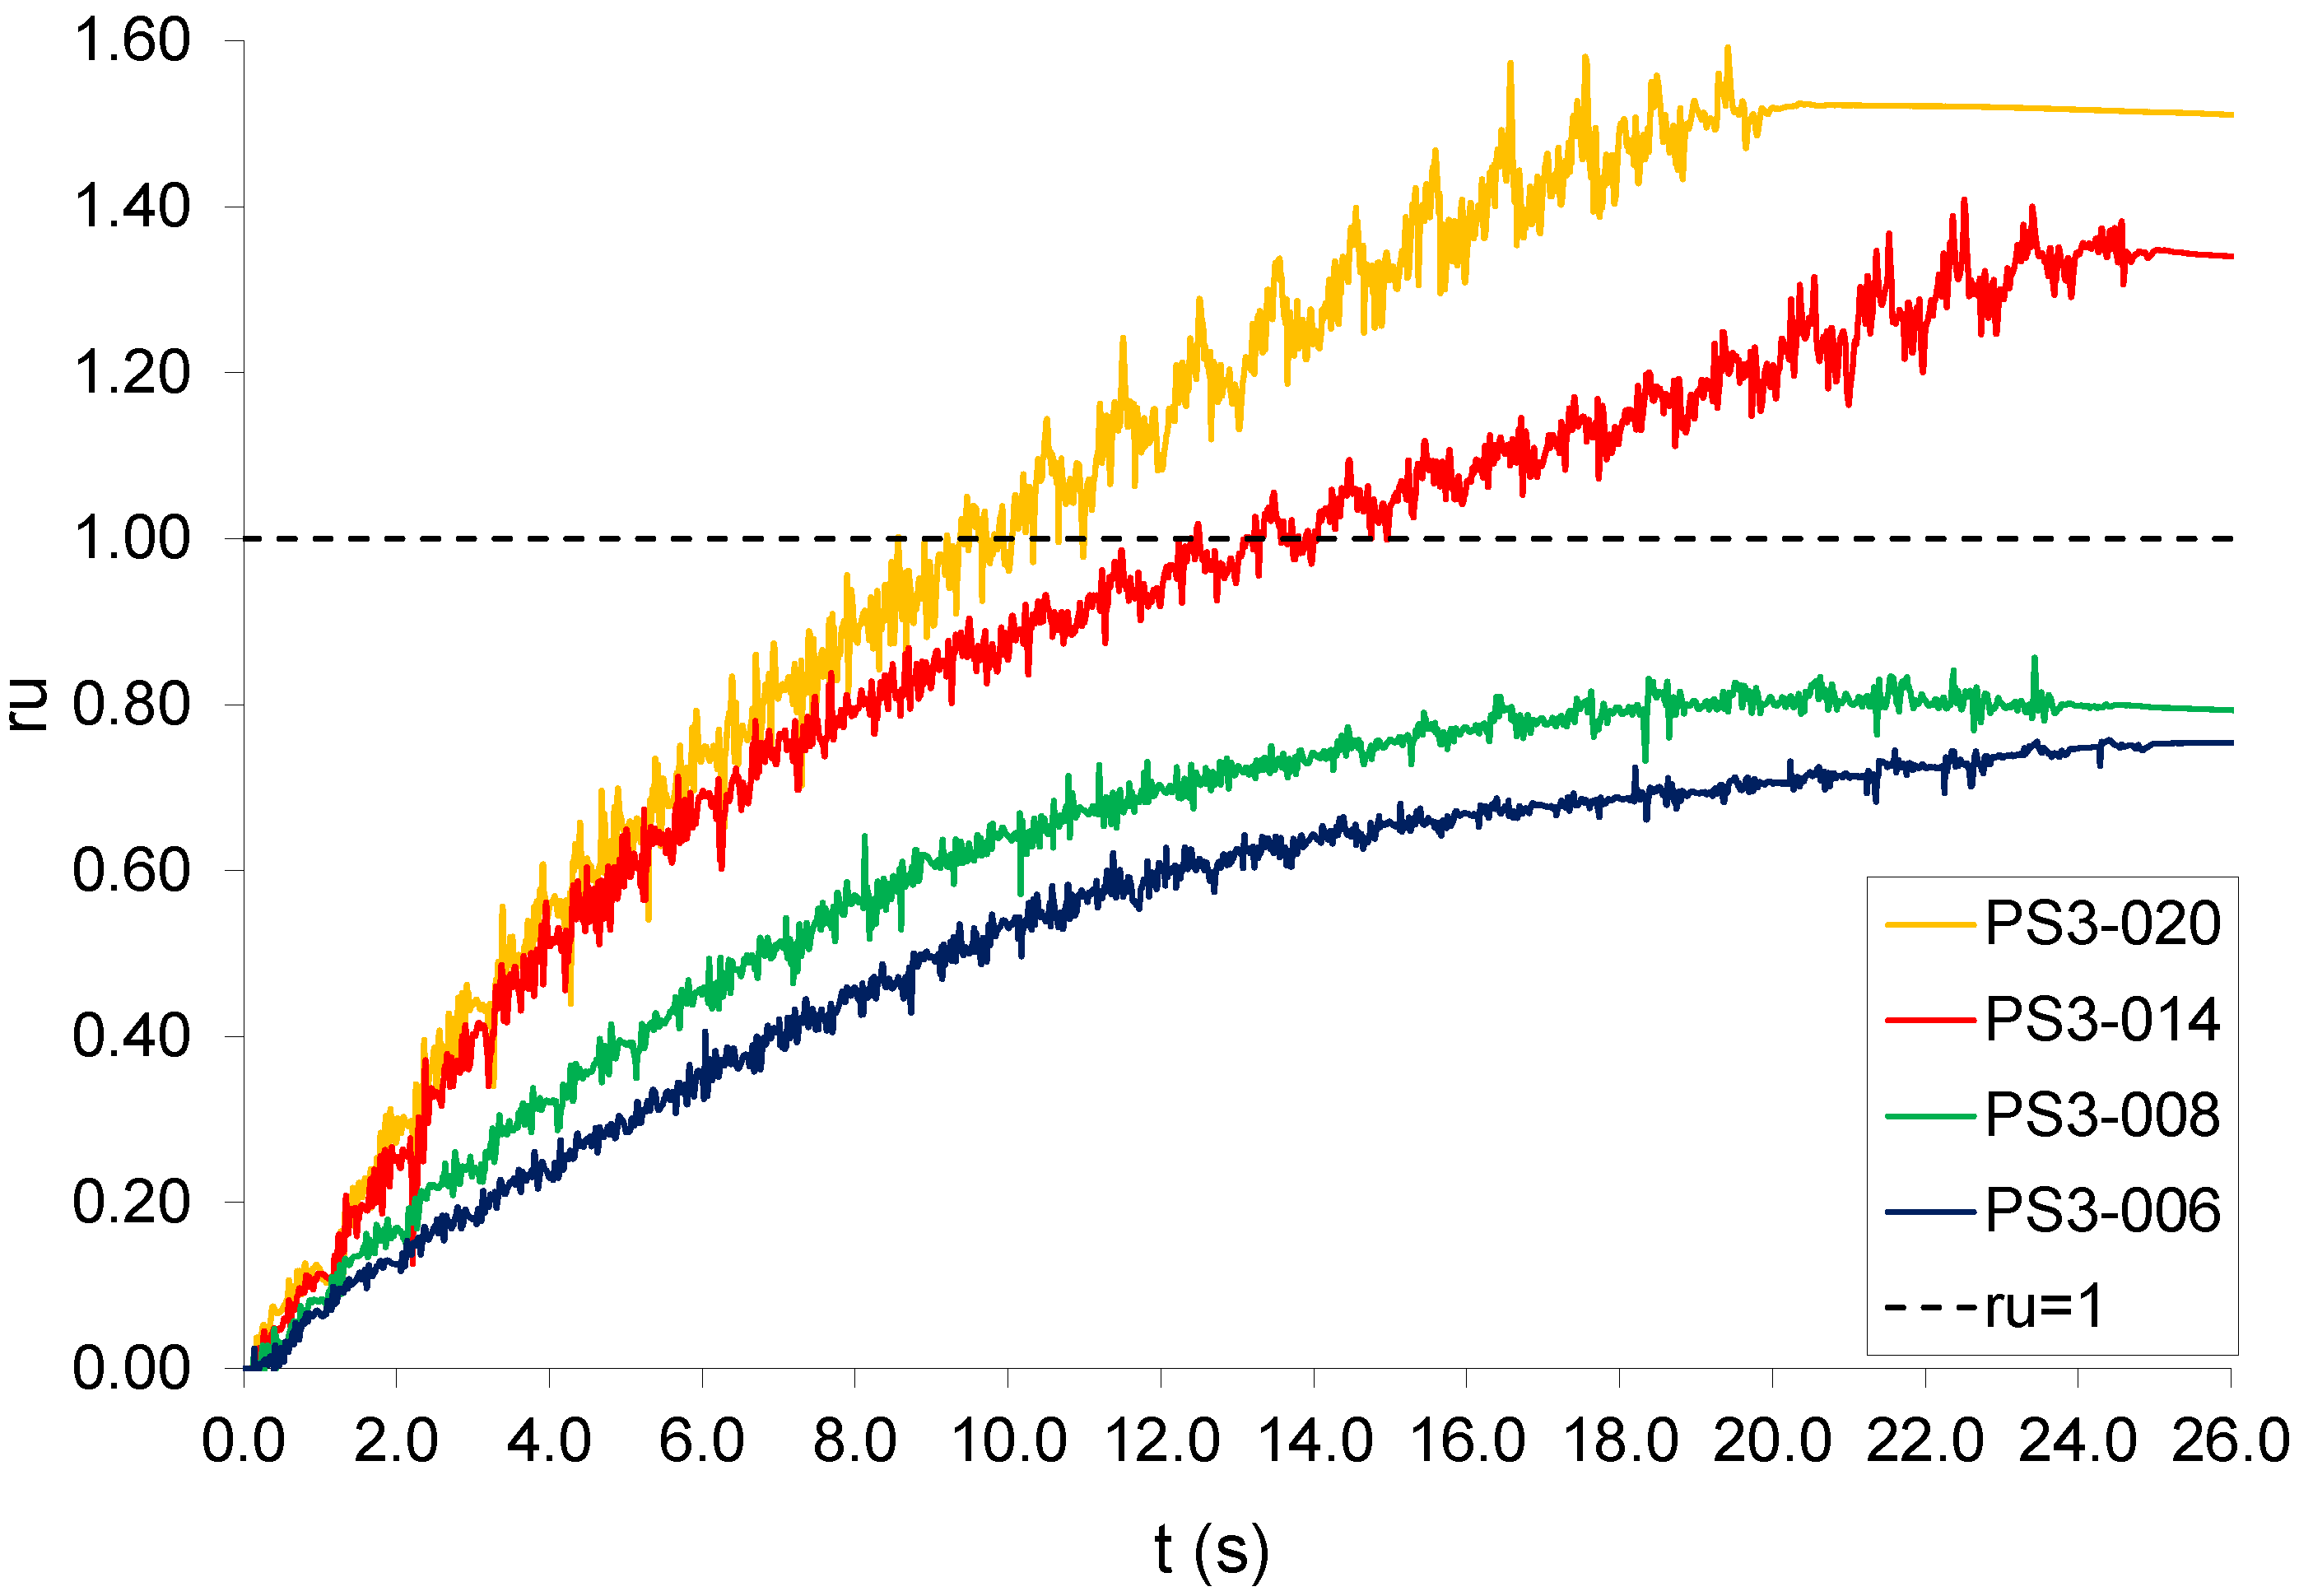
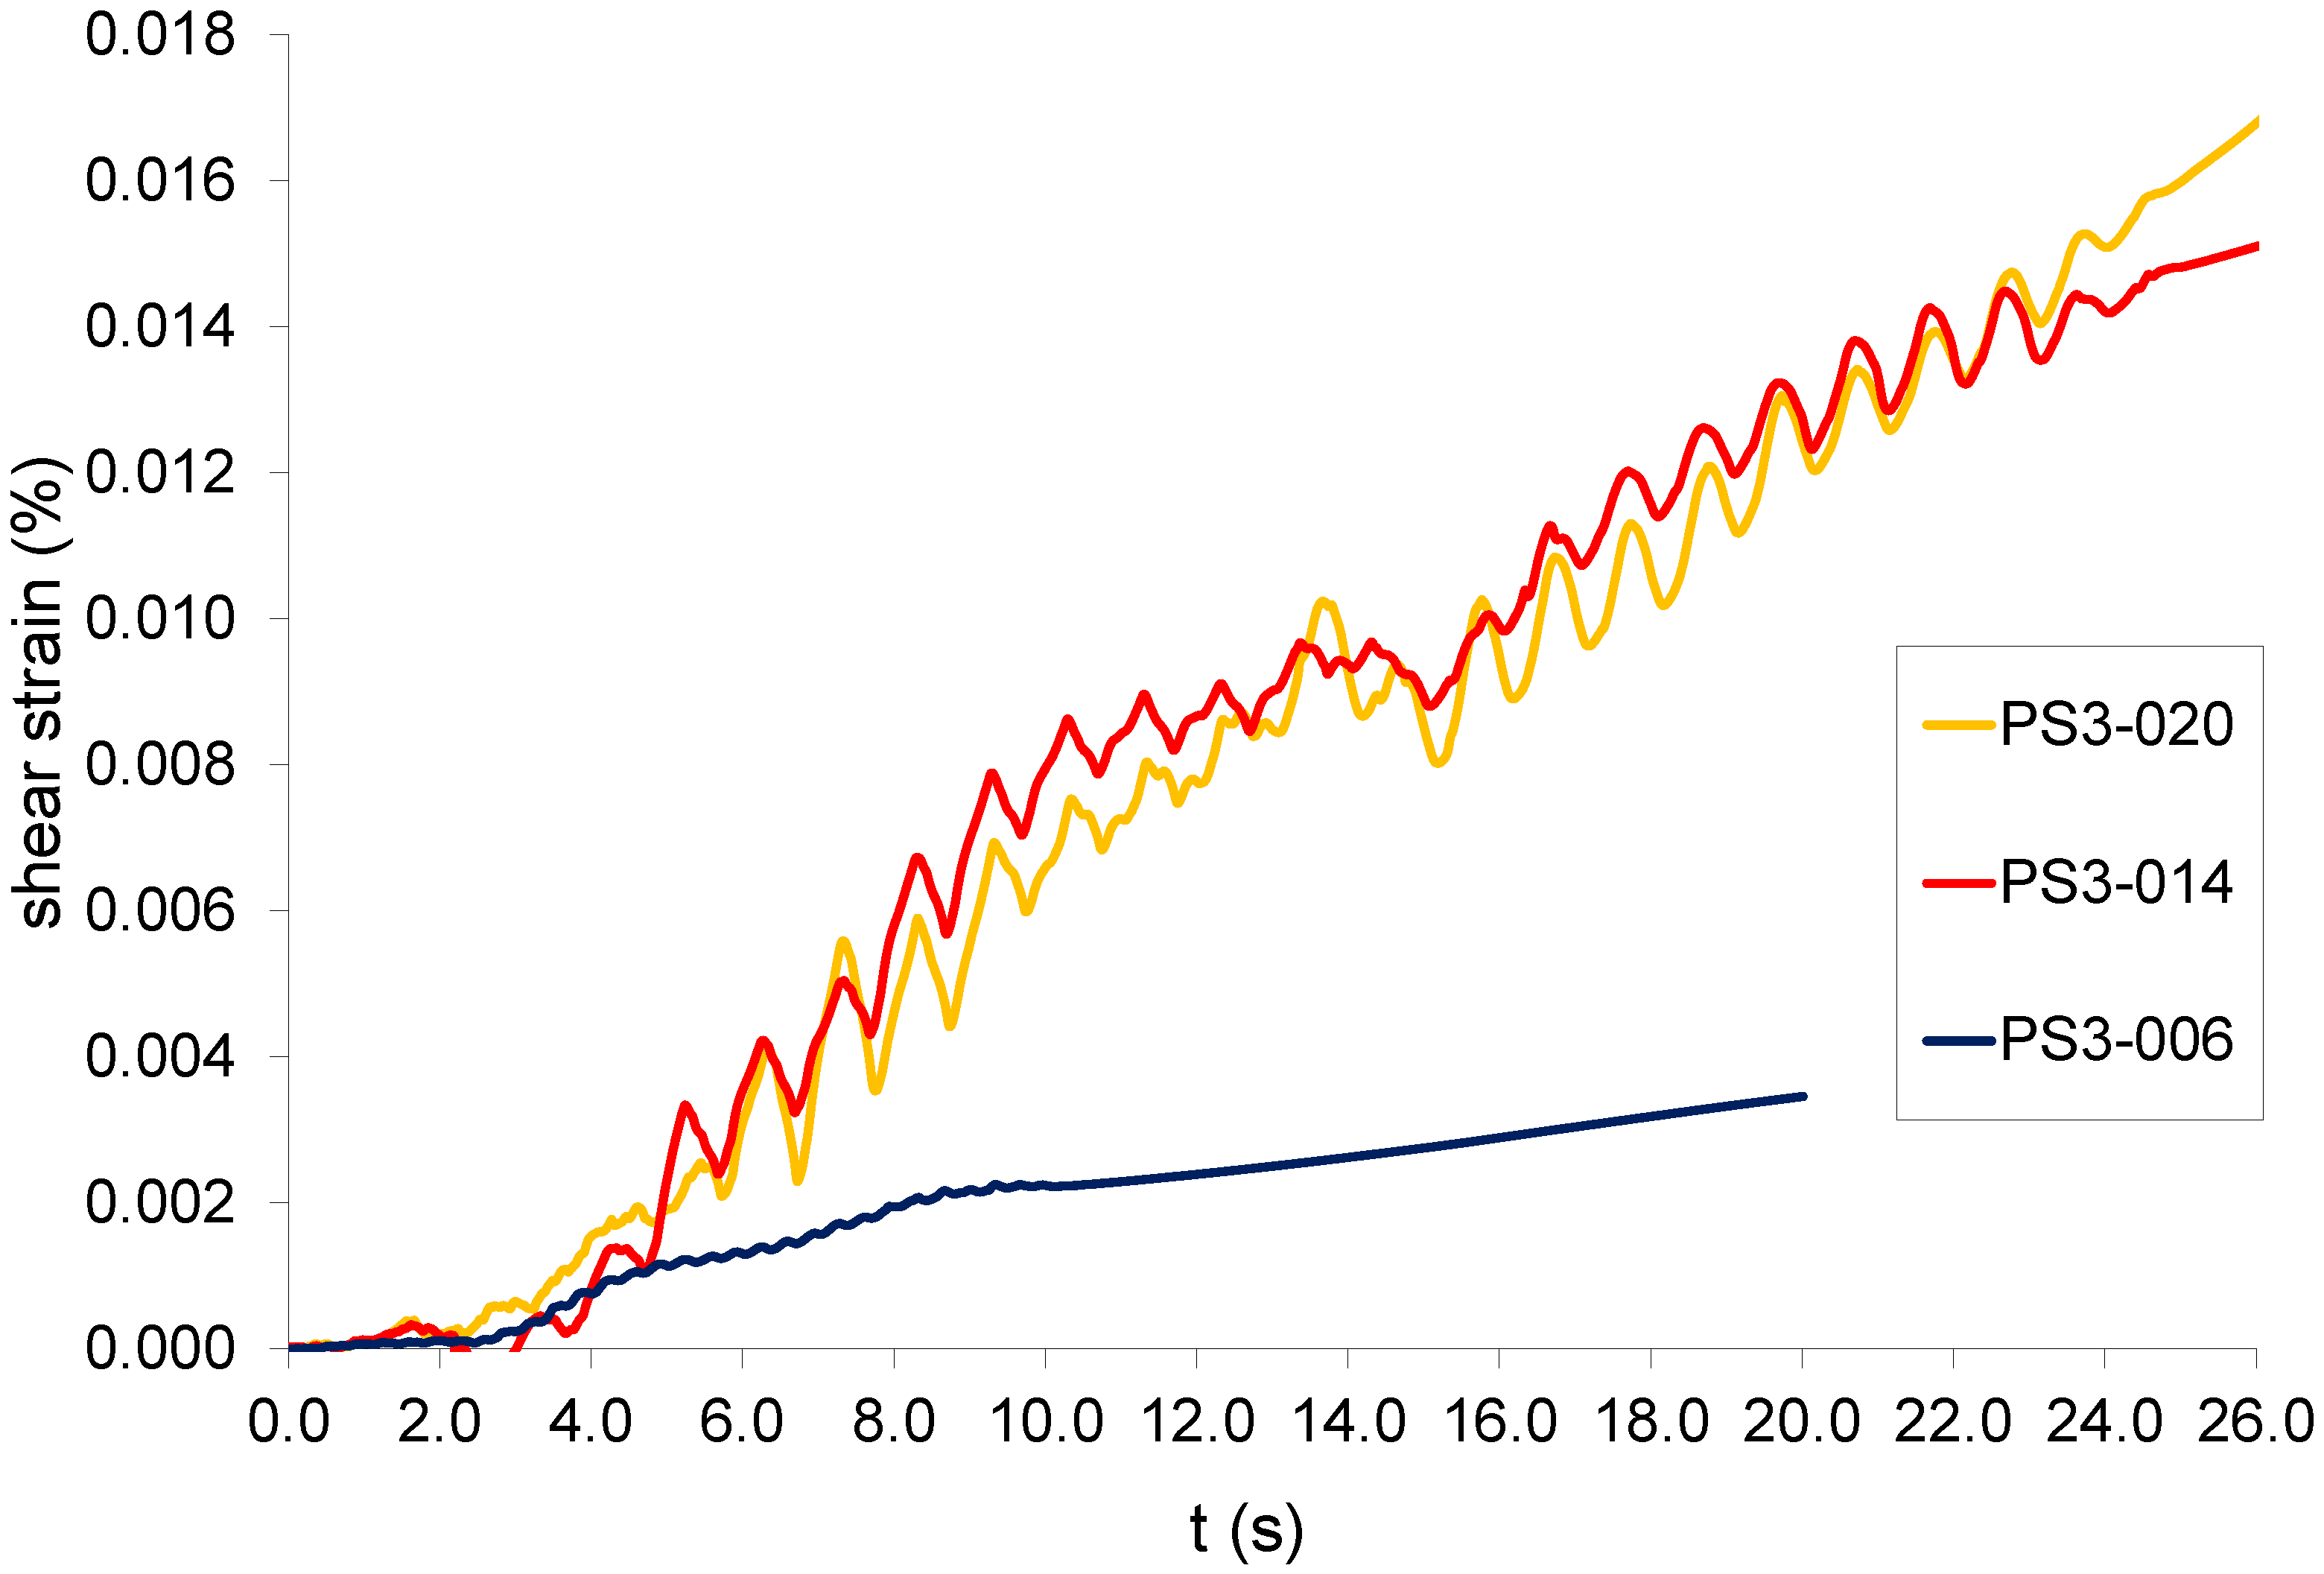
The original input motion characterized by a 0.20 g acceleration amplitude at a frequency of 1 Hz and 25 cycles, corresponding to 25 s, was then reduced in amplitude in order to study the effects of the maximum acceleration on the liquefaction-induced effects. From Figure 10, it is clearly observed that the soil response is substantially affected by the variations in acceleration amplitude. For all the acceleration amplitudes less than 0.14 g, there were increases in ru without reaching the point at which liquefaction is considered to occur (maximum ru values: 0.86 and 0.75, respectively, for 0.08 g and 0.06 g), since their curves do not reach ru = 1. For an amplitude of 0.14 g, the buildup of pore pressure is slower than that for 0.20 g, and ru reaches a maximum value of 1.35 for PS3-014, compared with 1.61 for PS3-020. It is important to consider that the time to reach liquefaction (ru = 1) decreases as the amplitude increases, as shown in [38], which demonstrated the same outcome by performing shaking table tests. In particular, the authors concluded that acceleration amplitude is the most important cyclic loading parameter that controls liquefaction: the higher the acceleration, the smaller the number of cycles needed for liquefaction with higher pore water pressure developed at any stage. This finding is important because changes in the amplitude of the input motions can cause modifications in the generation of pore water pressure, demonstrating that liquefaction depends on the level of shear strength in the soil deposit. In particular, the amount of deformation (and thus the liquefaction-induced effects) depends on the difference between the soil shear strength and shear stress required for equilibrium [55]. Figure 11 compares the time histories of the shear stress for the most significant case studies (PS3-020, PS3-014, PS3-006), demonstrating that the amplitude is fundamental in the increase in the deformations inside the soil deposit. For case study PS3-014, Figure 10 shows a downward spike in pore pressure just after 2 s, which is manifested as a negative strain in Figure 11 at the same time. Similar results are often observed in centrifuge tests [65,66].
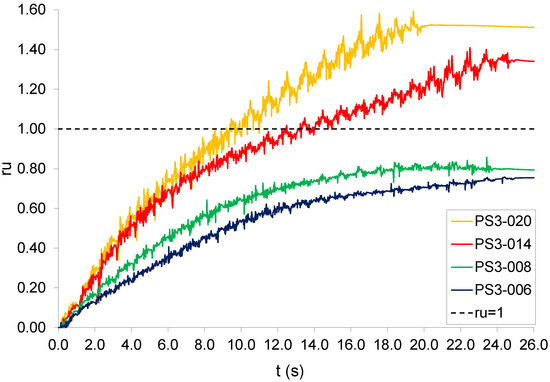
Figure 10.
Pore pressure ratios versus time for parametric study PS3.
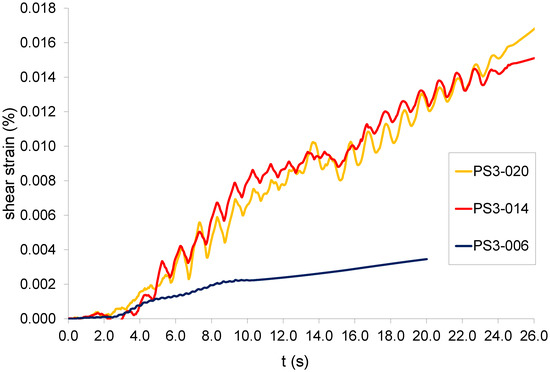
Figure 11.
Stress strain time history (PS3-020; PS3-014; PS3-006) at −5 m depth.
4. Conclusions
The paper investigates the effects of loading factors on the development of pore pressure and consequently on the liquefaction-induced effects on a soil deposit. Three parametric studies have been performed that consider the number of cycles, frequency, and duration of the input motions, and several numerical models have been compared, with specific findings as summarized below:
- The number of cycles has a profound impact on the pore water pressure generated, with longer duration sinusoidal input motions resulting in higher pressures. Further, a larger number of cycles increases the deformation of the soil and thus the shear strain accumulation.
- The role of frequency may be significant in the development of pore pressure; however, this effect is non-linear and depends on the displacement of the input motion as well as the soil characteristics. In the parametric study performed here, there was a threshold frequency where the rate of pore pressure generation increased with frequency (i.e., from 1 to 2 Hz) as well as an observed trend in which the magnitude of the maximum ru decreased with frequency.
- The soil response is substantially affected by variations in the acceleration amplitude. For all the acceleration amplitudes less than 0.14 g, there were increases in ru without reaching the point at which liquefaction is considered to occur (maximum ru values: 0.86 and 0.75, respectively, for 0.08 g and 0.06 g), since their curves do not reach ru = 1. For an amplitude of 0.14 g, the buildup of pore pressure is slower than that for 0.20 g and ru reaches a maximum value of 1.35 for PS3-014, compared with 1.61 for PS3-020. It is important to note that the time to reach liquefaction (ru = 1) decreases as the amplitude increases.
The results have been discussed by considering the existing literature, and the effects of the loading factors have been analysed on a free-field model of a realistic soil deposit. In particular, the novelty of the work consists in proposing numerical models to represent the most common experimental studies. These two approaches (experiments and numerical simulations) may be used together to support and advance modelling as whole. The advanced non-linear analyses described in this paper have been performed with the state-of-the-art 3D finite elements OpenSeesPL that may consider the mechanisms of cycle mobility inside the soil that has been previously shown in the laboratory tests. The numerical models have been described in order to detail the various assumptions that have been considered to allow the study of the various performances in terms of pore pressure development inside the soil deposit. The most significant results have been discussed in terms of shear strain relationships. Overall, the paper demonstrates that soil liquefaction may significantly depend on the loading factors, and they need to be accounted for design purposes. Although the findings are limited to the performed conditions, they may potentially be useful to propose code provisions. To this end, further parametric numerical studies on the response of other soil deposits will be performed.
Author Contributions
Please consider this paragraph that specifies the individual contributions of the authors: Conceptualization, D.F.; methodology, D.F.; software, D.F.; validation, D.F.; formal analysis, D.F.; investigation, D.F.; resources, D.F.; data curation, D.F.; writing—original draft preparation, D.F.; writing—review and editing, D.F., A.T.; visualization, D.F., A.T.; supervision, D.F.; project administration, D.F.; funding acquisition, D.F. All authors have read and agreed to the published version of the manuscript.
Funding
This research received no external funding.
Data Availability Statement
Not applicable.
Conflicts of Interest
The authors declare no conflict of interest.
References
- Castro, G. Liquefaction and cyclic mobility of saturated sands. J. Geotech. Eng. Div. 1975, 101, 551–569. [Google Scholar] [CrossRef]
- Martin, G.R.; Finn, W.D.L.; Seed, H.B. Fundamentals of liquefaction under cyclic loading. J. Geotech. Eng. Div. 1975, 101, 423–438. [Google Scholar] [CrossRef]
- Ishihara, K.; Tatsuoka, F.; Yasuda, S. Undrained deformation and liquefaction of sand under cyclic stresses. Soils Found. 1975, 15, 29–44. [Google Scholar] [CrossRef]
- Seed, H.B. Soil liquefaction and cyclic mobility evaluation for level ground during earthquakes. J. Geotech. Eng. Div. 1979, 105, 201–255. [Google Scholar] [CrossRef]
- Vaid, Y.P.; Chern, J.C.; Tumi, H. Confining pressure, grain angularity and liquefaction. J. Geotech. Eng. 1985, 111, 1229–1235. [Google Scholar] [CrossRef]
- Seed, H.B.; Tokimatsu, K.; Harder, L.; Chung, R. Influence of SPT procedures in soil liquefaction resistance evaluations. J. Geotech. Eng. 1985, 111, 1425–1445. [Google Scholar] [CrossRef]
- Poulos, S.J.; Castro, G.; France, J.W. Liquefaction evaluation procedure. J. Geotech. Eng. 1985, 111, 772–792. [Google Scholar] [CrossRef]
- Dashti, S.; Bray, J.D.; Pestana, J.M.; Riemer, M.R.; Wilson, D. Mechanisms of Seismically Induced Settlement of Buildings with Shallow Foundations on Liquefiable Soil. J. Geotech. Geoenviron. Eng. 2010, 136, 151–164. [Google Scholar] [CrossRef]
- Dashti, S.; Bray, J.D.; Pestana, J.M.; Riemer, M.R.; Wilson, D. Centrifuge Testing to Evaluate and Mitigate Liquefaction-Induced Building Settlement Mechanisms. J. Geotech. Geoenviron. Eng. 2010, 136, 918–929. [Google Scholar] [CrossRef]
- Bray, J.; Dashti, S. Liquefaction-Induced Building Movements. Bull. Earthq. Eng. 2014, 12, 1129–1156. [Google Scholar] [CrossRef]
- Boulanger, R.W.; Mejia, L.H.; Idriss, I.M. Liquefaction at Moss Landing during Loma Prieta earthquake. J. Geotech. Geoenviron. Eng. 1997, 123, 453–467. [Google Scholar] [CrossRef]
- Goh, A.T.C. Seismic liquefaction potential assessed by neural networks. J. Geotech. Geoenviron. Eng. 1995, 120, 1467–1480. [Google Scholar] [CrossRef]
- Halder, A.; Tang, W.H. Probabilistic evaluation of liquefaction potential. J. Geotech. Eng. ASCE 1979, 104, 145–162. [Google Scholar] [CrossRef]
- Juang, C.H.; Fang, S.Y.; Khor, E.H. First order reliability method for probabilistic liquefaction triggering analysis using CPT. J. Geotech. Geoenviron. Eng. ASCE 2006, 132, 337–349. [Google Scholar] [CrossRef]
- Juang, C.H.; Rosowsky, D.V.; Tang, W.H. Reliability based method for assessing liquefaction potential of soils. J. Geotech. Geoenviron. Eng. 1999, 125, 684–689. [Google Scholar] [CrossRef]
- Karamitros, D.K.; Bouckovalas, G.D.; Chaloulos, Y.K.; Andrianopoulos, K.I. Numerical analysis of liquefaction-induced bearing capacity degradation of shallow foundations on a two-layered soil profile. Soil Dyn. Earthq. Eng. 2013, 44, 90–101. [Google Scholar] [CrossRef]
- Liao, S.C.; Veneziano, D.; Whitman, R.V. Regression models for evaluating liquefaction probability. J. Geotech. Eng. 1988, 114, 389–411. [Google Scholar] [CrossRef]
- Robertson, P.K.; Wride, C.E. Evaluating cyclic liquefaction potential using the cone penetration test. Can. Geotech. J. 1998, 35, 442–459. [Google Scholar] [CrossRef]
- Seed, H.B.; Idriss, I.M. Simplified procedure for evaluating soil liquefaction potential. J. Soil Mech. Found. Div. ASCE 1971, 97, 1249–1273. [Google Scholar] [CrossRef]
- Xue, X.; Yang, X. Seismic liquefaction potential assessed by support vector machines approaches fuzzy comprehensive evaluation method. Bull. Eng. Geol. Environ. 2016, 75, 153–162. [Google Scholar] [CrossRef]
- Tokimatsu, K.; Seed, H.B. Evaluation of Settlements in Sands due to Earthquake Shaking. J. Geotech. Eng. ASCE 1987, 113, 861–878. [Google Scholar] [CrossRef]
- Ishihara, K.; Yoshimine, M. Evaluation of Settlements in Deposits Following Liquefaction during Earthquakes. Soils Found. 1992, 32, 173–188. [Google Scholar] [CrossRef]
- Orense, R.P. Assessment of liquefaction potential based on peak ground motion parameters. Soil Dyn. Earthq. Eng. 2005, 25, 225–240. [Google Scholar] [CrossRef]
- Lee, K.L.; Seed, H.B. Dynamic strength of anisotropically consolidated sand. J. Soil Mech. Found. Div. 1967, 93, 169–190. [Google Scholar] [CrossRef]
- Castro, G.; Poulos, S.J. Factors affecting liquefaction and cyclic mobility. J. Geotech. Eng. Div. 1977, 103, 501–516. [Google Scholar] [CrossRef]
- Vaid, Y.P.; Finn, W.D.L. Static shear and liquefaction potential. J. Geotech. Eng. Div. 1978, 105, 1233–1246. [Google Scholar] [CrossRef]
- Hushmand, B.; Scott, R.F.; Crouse, C.B. Centrifuge liquefaction tests in a laminar box. Geotechnique 1988, 38, 253–262. [Google Scholar] [CrossRef]
- Dobry, R.; Taboada, V.; Liu, L. Centrifuge modeling of liquefaction effects during earthquakes. In Proceedings of the 1st International Conference on Earthquake Geotechnical Engineering, Tokyo, Japan, 14–16 November 2015; Ishihara, K., Ed.; Balkema: Rotterdam, The Netherlands, 1995; Volume 3, pp. 1291–1324. [Google Scholar]
- Ye, B.; Ye, G.; Ye, W.; Zhang, F. A pneumatic shaking table and its application to a liquefaction test on saturated sand. Nat. Hazards 2013, 66, 375–388. [Google Scholar] [CrossRef]
- Ha, I.S.; Olson, S.M.; Seo, M.-W.; Kim, M.-M. Evaluation of reliquefaction resistance using shaking table tests. Soil Dyn. Earthq. Eng. 2011, 31, 682–691. [Google Scholar] [CrossRef]
- Mohajeri, M.; Towhata, I. Shake table tests on residual deformation of sandy slopes due to cyclic loading. Soils Found. 2003, 43, 91–106. [Google Scholar] [CrossRef][Green Version]
- Towhata, I.; Sesov, V.; Motamed, R. Model tests on lateral earth pressure on large group pile exerted by horizontal displacement of liquefied sandy ground. In Proceedings of the 8th US National Conference on Earthquake Engineering, San Francisco, CA, USA, 18–22 April 2006. [Google Scholar]
- Kokusho, T. Water film in liquefied sand and its effect on lateral spread. J. Geotech. Geoenviron. Eng. 1999, 125, 817–826. [Google Scholar] [CrossRef]
- Ueng, T.S.; Wu, C.W.; Cheng, H.W.; Chen, C.H. Settlements of saturated clean sand deposits in shaking table tests. Soil Dyn. Earthq. Eng. 2010, 30, 50–60. [Google Scholar] [CrossRef]
- Arulanandan, K.; Scott, R.F. Project VELACS—Control test results. J. Geotech. Eng. 1993, 119, 1276–1292. [Google Scholar] [CrossRef]
- Kutter, B.L.; Carey, T.J.; Zheng, B.L.; Gavras, A.; Stone, N.; Zeghal, M.; Liu, K. Twenty-four centrifuge tests to quantify sensitivity of lateral spreading to Dr and PGA. In Geotechnical Earthquake Engineering and Soil Dynamics V: Slope Stability and Landslides, Laboratory Testing, and In Situ Testing; American Society of Civil Engineers: Reston, VA, USA, 2018; pp. 383–393. [Google Scholar]
- Özcebe, A.G.; Giretti, D.; Bozzoni, F.; Fioravante, V.; Lai, C.G. Centrifuge and numerical modelling of earthquake-induced soil liquefaction under free-field conditions and by considering soil–structure interaction. Bull. Earthq. Eng. 2021, 19, 47–75. [Google Scholar] [CrossRef]
- Varghese, R.M.; Latha, G.M. Shaking table tests to investigate the influence of various factors on the liquefaction resistance of sands. Nat. Hazards 2014, 73, 1337–1351. [Google Scholar] [CrossRef]
- Baziara, M.H.; Nilipour, N. Evaluation of liquefaction potential using neural-networks and CPT results. Soil Dyn. Earthq. Eng. 2003, 23, 631–636. [Google Scholar] [CrossRef]
- Lai, S.Y.; Chang, W.J.; Lin, P.S. Logistic regress model for evaluating soil liquefaction probability using CPT data. J. Geotech. Geoenviron. Eng. ASCE 2006, 132, 694–705. [Google Scholar] [CrossRef]
- Samui, P.; Kim, D.; Sitharam, T.G. Support vector machine for evaluating seismic-liquefaction potential using shear wave velocity. J. Appl. Geophys. 2011, 73, 8–15. [Google Scholar] [CrossRef]
- Xue, X.H.; Yang, X.G. Seismic liquefaction potential assessed by fuzzy comprehensive evaluation method. Nat. Hazards 2014, 71, 2101–2112. [Google Scholar] [CrossRef]
- Bagheripour, M.H.; Shooshpasha, I.; Afzalirad, A. A genetic algorithm approach for assessing soil liquefaction potential based on reliability method. J. Earth Syst. Sci. 2012, 121, 45–62. [Google Scholar] [CrossRef]
- Dalvi, A.N.; Pathak, S.R.; Rajhans, N.R. Application of AHP and R3I to seismic soil liquefaction analysis. In Proceedings of the 33th International Conference on Civil Engineering, San Diego, CA, USA, 19–22 April 2012. [Google Scholar]
- Dalvi, A.N.; Snehal, R.P.; Neela, R.R. Entropy analysis for identifying significant parameters for seismic soil liquefaction. Geomech. Geoengin. Int. J. 2013, 9, 1–8. [Google Scholar] [CrossRef]
- Sheng, J.; Yuan, X.M.; Wang, Y.M.; Liu, H.S. Influence factor weights analysis of rock and soil earthquake damages: A case study from sand liquefaction. J. Nat. Disasters 2012, 21, 76–82. (In Chinese) [Google Scholar]
- Dashti, S.; Bray, J.D. Numerical Simulation of Building Response on Liquefiable Sand. J. Geotech. Geoenviron. Eng. 2013, 139, 1235–1249. [Google Scholar] [CrossRef]
- Elgamal, A.; Lu, J.; Yang, Z. Liquefaction-induced settlement of shallow foundations and remediation: 3D numerical simulation. J. Earthq. Eng. 2005, 9, 17–45. [Google Scholar] [CrossRef]
- Elgamal, A.; Lu, J.; Forcellini, D. Mitigation of Liquefaction-Induced lateral deformation in sloping stratum: Three-dimensional Numerical Simulation. J. Geotech. Geoenviron. Eng. 2009, 135, 1672–1682. [Google Scholar] [CrossRef]
- Forcellini, D. Numerical simulations of liquefaction on an ordinary building during Italian (20 May 2012) earthquake. Bulletin Earthq. Eng. 2019, 17, 4797–4823. [Google Scholar] [CrossRef]
- Forcellini, D. Soil-structure interaction analyses of shallow-founded structures on potential-liquefiable soil deposit. Soil Dyn. Earthq. Eng. 2020, 133, 106108. [Google Scholar] [CrossRef]
- Forcellini, D. Seismic Fragility for a Masonry-Infilled RC (MIRC) Building Subjected to Liquefaction. Appl. Sci. 2021, 11, 6117. [Google Scholar] [CrossRef]
- Lopez-Caballero, F.L.; Farahmand-Razavi, A.M. Numerical simulation of mitigation of liquefaction seismic risk by preloading and its effects on the performance of structures. Soil Dyn. Earthq. Eng. 2013, 49, 27–38. [Google Scholar] [CrossRef]
- Lopez-Caballero, F.L.; Farahmand-Razavi, A.M. Numerical simulation of liquefaction effects on seismic SSI. Soil Dyn. Earthq. Eng. 2008, 28, 85–98. [Google Scholar] [CrossRef]
- Forcellini, D. Probabilistic-Based Assessment of Liquefaction-Induced Damage with Analytical Fragility Curves. Geosciences 2020, 10, 315. [Google Scholar] [CrossRef]
- Lu, J.; Elgamal, A.; Yang, Z. OpenSeesPL: 3D Lateral Pile-Ground Interaction, User Manual, Beta 1.0. 2011. Available online: http://soilquake.net/openseespl/ (accessed on 13 January 2022).
- Mazzoni, S.; McKenna, F.; Scott, M.H.; Fenves, G.L. Open System for Earthquake Engineering Simulation, User Command-language Manual. Pacifc Earthquake Engineering Research Center, University of California, Berkeley, OpenSees Version 2.0. 2009. Available online: http://opensees.berkeley.edu/OpenSees/manuals/usermanual (accessed on 13 January 2022).
- Tonni, L.; Forcellini, D.; Osti, C.; Gottardi, G. Modelling liquefaction phenomena during the May 2012 Emilia-Romagna (Italy) earthquake (Modélisation des phénomènes de liquéfaction pendant le tremblement de terre du 2012 en Emilia-Romagna (Italie)). In Proceedings of the XVI Geotechnical Engineering for Infrastructure and Development (ECSMGE), Edinburgh, UK, 13–17 September 2015; ISBN 978-0-7277-6067-8. [Google Scholar]
- Zienkiewicz, O.C.; Chan, A.H.C.; Pastor, M.; Paul, D.K.; Shiomi, T. Static and dynamic behavior of soils: A rational approach to quantitative solutions: I. Fully saturated problems. Proc. R. Soc. Lond. Ser. A 1990, 429, 285–309. [Google Scholar]
- Yang, Z.; Elgamal, A.; Parra, E. A computational model for cyclic mobility and associated shear deformation. J. Geotech. Geoenviron. Eng. ASCE 2003, 129, 1119–1127. [Google Scholar] [CrossRef]
- Seed, H.B.; Wong, R.T.; Idriss, I.M.; Tokimatsu, K. Moduli and damping factors for dynamic analyses of cohesionless soils. J. Geotech. Eng. 1986, 112, 1016–1032. [Google Scholar] [CrossRef]
- Vucetic, M.; Dobry, R. Effect of soil plasticity on cyclic response. J. Geotech. Eng. 1991, 117, 89–107. [Google Scholar] [CrossRef]
- Kramer, S. Geotechnical Earthquake Engineering; Prentice Hall: Hoboken, NJ, USA, 1996; p. 07458. [Google Scholar]
- Youd, B.T.L.; Idriss, I.M. Liquefaction Resistance of Soils: Summary Report from the 1996 NCEER and 1998. NCEER/NSF Workshops on Evaluation. J. Geotech. Geoenviron. Eng. 2001, 127, 817–833. [Google Scholar] [CrossRef]
- Tang, X.; Hu, J.; Qiu, J. Identifying Significant Influence Factors of Seismic Soil Liquefaction and Analyzing their Structural Relationship. KSCE J. Civ. Eng. 2016, 20, 2655–2663. [Google Scholar] [CrossRef]
- Madabhushi, S.P.G.; Ghosh, B.; Kutter, B.L. Role of input motion in excess pore pressure generation in dynamic centrifuge modelling. Int. J. Phys. Model. Geotech. 2006, 6, 25–34. [Google Scholar] [CrossRef]
- Taboada-Urtuzuastegui, V.M.; Martinez-Ramirez, G.; Abdoun, T. Centrifuge modeling of seismic behavior of a slope in liquefiable soil. Soil Dyn. Earthq. Eng. 2002, 22, 1043–1049. [Google Scholar] [CrossRef]
Publisher’s Note: MDPI stays neutral with regard to jurisdictional claims in published maps and institutional affiliations. |
© 2022 by the authors. Licensee MDPI, Basel, Switzerland. This article is an open access article distributed under the terms and conditions of the Creative Commons Attribution (CC BY) license (https://creativecommons.org/licenses/by/4.0/).

