Abstract
This is the first study discussing the dynamics of two caldera-forming eruptions in the Banda volcanic complex (BVC) in the marine conservation zone of Banda, Maluku, Indonesia. The first and second caldera episodes are, hereafter, termed as Banda Besar and Naira, respectively. The formation of Banda Besar caldera (ca. 8 × 7 km) ejected homogeneous rhyolitic magmas (bulk-rock, 73.1–73.8 wt.% SiO2) in the following three stages: (1) sub-Plinian (BB-5a), (2) intra-sub-Plinian flow (BB-5b), and (3) caldera collapse (BB-5c and BB-5d). The BB-5a stage produced a reversely graded white pumice fall layer with moderate lithics (2–11%), which originated from a sub-Plinian eruption with an estimated plume height of 22–23 km. Subsequently, intensive erosion of wall rock (13–25%) causes conduit enlargement, leading to the partial collapse of the eruption columns, forming intra-sub-Plinian flow deposits (BB-5b). It is likely that conduit size surpassed the minimum threshold value for a buoyant plume during the final phase of the second stage, causing the complete formation of a pumice-rich pyroclastic density current (PDC) during the early-third stage (BB-5c). Finally, the evacuation of voluminous magma from the reservoir yields the first caldera collapse during the late-third stage, producing a lithic-dominated PDC with minor pumices (BB-5d). The formation of the Naira caldera (ca. 3 × 3 km) ejected homogeneous dacitic magmas (bulk-rock, 66.2–67.2 wt.% SiO2) in the following three stages: (1) early sub-Plinian (N-2a and 2b), (2) late sub-Plinian (N-2c, 2d, 2e), and (3) caldera collapse (N-2f). This research distinguishes the sub-Plinian into two stages on the basis of different vent locations (assumed from the isopach map). In particular, this research suggests that the early sub-Plinian stage (N-2a and 2b) erupted from the northern vent, producing 14 and 8 km eruption plume heights, respectively. Additionally, the late sub-Plinian stage (N-2c, 2d, 2e) was generated from a newly-formed conduit located in the relatively southern position, producing 12–17, 9, and 6 km eruption plume heights, respectively. Conduit enlargement is expected to occur during at both sub-Plinian stages, as lithic portions are considerably high (10–72%) and ultimately generate PDCs during the third stage (caldera collapse; N-2f). Because most of the erupted materials (for both caldera-forming eruptions) are emplaced in the ocean, estimating the erupted volume becomes difficult. However, with the assumption that the caldera dimension represents the erupted volume of magma (Vmagma), and that the total erupted volume (Vtotal) is a summation of Vmagma and the now-vanished pre-caldera island (Vvanished, represented by average lithic fractions), the first and second caldera might produce (at least) 35.2 and 2.4 km3 of erupted materials, scaling them as VEI (volcano explosivity index) 6 and 5, respectively. That VEI is more than enough to initiate a secondary hazard in the form of tsunamis triggered by volcanic activities.
1. Introduction
The caldera-forming eruption of Krakatau in 1883 CE (18 km3, VEI 6) is considered as one of the most devastating submarine volcanic eruptions in human existence, as the eruption claimed 36,000 victims through 2 mechanisms, namely hot and fast-moving pyroclastic density currents (PDCs), and a volcano-tsunami [1,2]. The latest eruption, the flank collapse of Anak Krakatau (a post-caldera volcano in the Krakatau caldera) in December 2018, also produced a devastating tsunami that killed more than 400 people [3]. Such examples strongly suggest that, although far from civilizations, submarine volcanoes are a major threat to human lives. Therefore, scientific investigations are highly necessary to advance a common understanding regarding their behavior and eruption dynamics.
However, until the present day, the study of submarine volcanoes is still rare (compared to inland volcanoes), mainly because they are less accessible (far from the mainland) and host very limited outcrops (most of the erupted materials are emplaced to the ocean). The Banda volcanic complex (BVC), which is situated in the marine conservation zone of Banda Sea, Maluku, Indonesia, is not an exception (Figure 1). This volcanic complex has experienced a caldera collapse event [4,5] and is considerably active (24 eruptions over the last 4 centuries, with the most recent eruption occurring in 1988 CE) [6]). However, information, such as stratigraphy, geochemistry, and eruption dynamics are still lacking. Such conditions, coupled with the fact that a volcano may experience more than one caldera-forming eruption event (e.g., the Toba caldera, Aso caldera, and the Yellowstone caldera) [7,8,9], suggest that comprehensive research into the BVC is strongly needed in order to understand the possible risks and future hazards produced by this volcanic system.
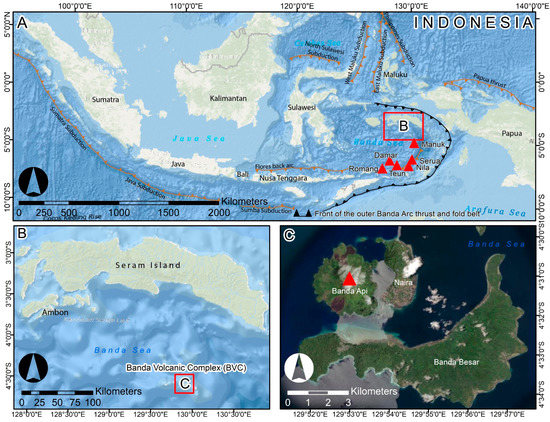
Figure 1.
The complex subduction process in the Banda Sea (A) has a role in the formation of the islands of Banda Besar, Naira, and the Banda Api volcano in the Banda volcanic complex (BVC) (B), which is situated in the marine conservation zone of the Banda Sea, Maluku, Indonesia. The present eruptive activity is located at Banda Api, as shown by a red triangle symbol (C).
In this contribution, the research aim is to reduce such a gap by presenting the first detailed stratigraphic data of two caldera-forming eruptions in the BVC, called Banda Besar (the first caldera) and Naira (the second caldera). Detailed stratigraphic sections were obtained from fieldwork, focusing on the mainland of Banda Besar and Naira Island. The thickness of each observed layer was measured in order to establish an isopach map. Subsequently, fieldwork results were combined with laboratory analyses (e.g., grain size distribution and componentry) to understand the dynamics of both caldera-forming eruptions. Moreover, petrography and bulk-rock X-Ray fluorescence (XRF) analyses were also performed to reveal the origins of magma from both caldera episodes. The results suggest that caldera-forming eruptions in the BVC tend to occur when the magma reaches gas supersaturation (indicated by the presence of a highly vesicular pumice and high water content condition from the presence of hydrous minerals) and highly evolved compositions (dacite and rhyolite), where higher gas and silica facilitates a more catastrophic eruption.
2. Banda Volcanic Complex
The Banda volcanic complex (BVC) is situated above a subduction zone between four lithospheric plates, namely the Indian–Australian, Pacific, Philippine, and Eurasian (Figure 2) [4,9]. This complex subduction process results in the formation of a curving chain of volcanoes, including Manuk, Serua, Nila, Teun, Damar, Romang, and other unmentioned submarine volcanoes (Figure 1a) [4,5,10]. There is a tendency for progressive enrichment in terms of potassium (K) and some large ion lithophile elements (LILE, such as K, Rb, Cs, Ba, and Sr) from the north towards the south, as southern Ambon (see Figure 1b) and the BVC comprises the lowest potassium (tholeiitic) and 87Sr/87Sr contents (0.7045–0.7047) compared to those of Manuk and Serua (calc-alkaline with 0.7052–0.7095 87Sr/87Sr), and Nila, Teun, and Damar (high-K calc-alkaline with 0.7065–0.7080 87Sr/87Sr) [4,5,9]. Whitford and Jezek (1979) [9] interpreted that such high 87Sr/87Sr values (0.7050–0.7095) are the result of mixing between mantle-derived components and sialic material at the top of the subducted lithospheric plate.
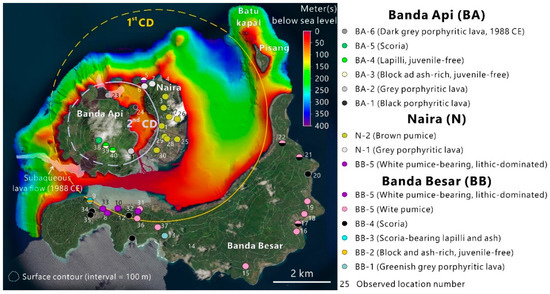
Figure 2.
Circles represent the sampling locations of this study (LOC; note that each circle’s color corresponds to a different eruptive unit). Yellow and blue lines highlight the estimated boundary of the first and second circular depressions (CD). The data source of the bathymetry and satellite images is the Pusat Hidro-Oseanografi Tentara Nasional Indonesia Angkatan Laut (PUSHIDROSAL).
Studies from Wahyudin et al. (2009), Kuna (2011), and Asy’ari et al. (2015) [11,12,13] suggest that BVC has experienced (at least) two caldera-forming eruption events, as shown by caldera structure in Banda Besar and Naira Island. However, pumice compositions from both caldera remain unknown. The reported geochemical data only includes lava, which varies from tholeiitic basalt to rhyodacite (52–68 wt.% of SiO2 with 0.28–0.91 wt.% of K2O) [4,9]. It is also important to mention that no stratigraphic log has been provided for both caldera episodes; hence, common knowledge regarding the dynamics of both caldera formations is still lacking.
Presently, the main activity of BVC takes place in the Banda Api volcano (658 m above sea level; Figure 2), with predominantly strombolian, vulcanian, phreatomagmatic, and lava flow-forming eruptions [6]. About 24 eruptions (ranging from VEI 1–3) have occurred from the Banda Api volcano during the last 4 centuries, making it one of Indonesia’s most active volcanoes [6]. The latest eruption of Banda Api occurred in 1988 CE (from 9 to 15 May), producing lava flows along a fissure-oriented northeast-southwest (NE-SW) and a vigorous sub-Plinian eruption column (directed to the northwest, NW) with a maximum height of 16.5 km [14]. The eruption scale has been estimated as VEI 3 [14].
3. Analytical Methods
3.1. Fieldwork
Fieldwork was conducted on the three main islands of BVC, namely Banda Besar, Naira, and Banda Api, with the total number of observation locations exceeding 41 (Figure 2). The objective of the fieldwork was to record all the important elements in the observed deposit (i.e., internal structure, deposit facies, thickness, clast variations and sizes, and its relative position in stratigraphy) and to collect samples for laboratory analysis.
3.2. Grain Size Distribution and Componentry
Pyroclastic samples from Banda Besar, Naira, and Banda Api were sieved using −5φ (>32 mm) to 4φ (<1/16 mm) meshes to obtain the grain size distribution (GSD). Grains varying from −5φ (>32 mm) to −2φ (4–8 mm) mesh sizes were observed and counted for componentry analysis. The total number of counted grains reached 5545.
3.3. Isopach Map, Eruption Intensity, and Plume Height
Isopach maps were drawn by interpolating tephra thickness from the observed locations. However, it is impossible to completely interpolate the isopach contour without any assumption, as most of the deposits were emplaced in the ocean (Figure 2). Because isopach shape is strongly controlled by wind [15], the evidence that Indonesia has a relatively homogeneous annual wind velocity [16,17], coupled with the fact that most of the established isopach maps of Indonesian volcanoes exhibit an ellipsoidal shape (e.g., Tambora, Merapi, Samalas, Sindoro, Salak, Kukusan, and Telaga; Sigurdsson and Carey 1989, Gertisser et al. 2012, Vidal et al. 2015, Prambada et al. 2016, Harpel et al. 2019, Mitsuoka et al. 2021, and Faral et al. 2022) [18,19,20,21,22,23,24] imply that an estimation using an ellipsoidal shape (e.g., the ellipse-approximated isopach (EAI) method of Tajima et al. 2013) [25]) is the most representative approach for estimating tephra distribution of Indonesian volcanoes.
Therefore, an ellipsoidal shape was assumed to connect the ‘missing’ isopach line for each isopach contour. However, the interpolation is limited to a 10 cm thickness isopach, as the mainland deposits are generally thicker than 10 cm (except for N-2e, which provides the interpolation of a 1 cm thickness isopach). This information is not enough for estimating the eruption intensity, as it requires information on the dispersal index (D, the area enclosed by 1 cm isopach), as well as the fragmentation index (F%, calculated using the weight % of <1 mm clasts from GSD analysis) [23,26]. To solve this issue, extrapolation of the available thickness data (obtained from fieldwork) was carried out to determine the dispersal area of a 1 cm thickness isopach. Finally, column heights were estimated by extracting the data of the maximum downwind range and crosswind range on the basis of a 0.8 mm and 1.6 mm lithic diameter, using the methods of Carey and Sparks (1986) [15].
However, the point is that an isopach’s uncertainty is strongly controlled by the number of observation locations and thickness variability [27,28]. Therefore, since the research dealt with a submarine volcano (where most of the erupted materials are deposited underwater, and each isopach in this study was made by at least 10 observation points), it is very likely that the isopach, as well as the estimated fallout tephra volume and plume heights, may be underestimated (i.e., minimum values) and include a large degree of uncertainties of at least 10% (see Figure 9 of Engwell et al. 2013) [27].
3.4. Petrography
Thin sections were observed under an optical microscope to identify the texture, phenocryst content, and mineral assemblages. Phenocryst-free bulk vesicularity ( and vesicle-free phenocryst content ( were obtained by the simple equations which follow [29]:
where and are summations of phenocryst and vesicle area An in mm2, and AT is a total thin section area.
3.5. Bulk-Rock Chemical Composition
Tephra and lava samples were analyzed using a WD XRF Axios Max at the Balai Penyelidikan dan Pengembangan Teknologi Kebencanaan Geologi (BPPTKG), Yogyakarta, Indonesia, in order to obtain the major and trace element compositions. This research’s analytical policy requires at least 5 g of powder of pressed pellets, which are obtained by powdering bulk samples using a ball mill machine.
4. Results
4.1. Stratigraphy of Banda Besar
The oldest product of Banda Besar is observed at LOC 9 (Figure 2) and corresponds to greenish-grey porphyritic lava with a columnar joint structure (BB-1). This lava is underlined by a series of pyroclastic deposits, including a crudely-stratified block- and ash-rich deposit (BB-2), and an intercalating lapilli and ash-rich (it has some ‘floating’ lapilli fragments in the finer matrices) layer (unit BB-3) (Figure 3a and Figure 4). Lithics dominate both units; however, the BB-2 unit has no juvenile material, while the BB-3 unit includes minor aphanitic scoria. Separated by ±80 m-thick outcrop hiatuses due to dense vegetation, thick (the observed thickness ranges from 46 to 558 cm), lithic-poor, and reversely graded scoria deposits named BB-4 were deposited above the oldest products and can be observed around the Banda Besar Island (Figure 2, Figure 3b and Figure 4). Scoria clasts at LOC 11, 12, 34, and 35 are typically coarser than those observed at LOC 17, 20, 21, and 22 (Figure 2), with the maximum observed clasts varying from 11 to 26 cm (block) and from 1 to 2 cm (lapilli), respectively. Similar to BB-3, the scoria of BB-4 is apparently aphyric (crystal-poor); however, vesicle textures are quite distinctive. The BB-3 scoria is typically dense and less vesicular compared to BB-4 scoria. Moreover, BB-4 deposits are apparently lithic-poor.
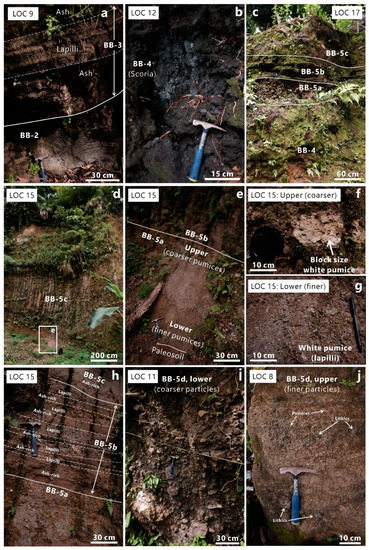
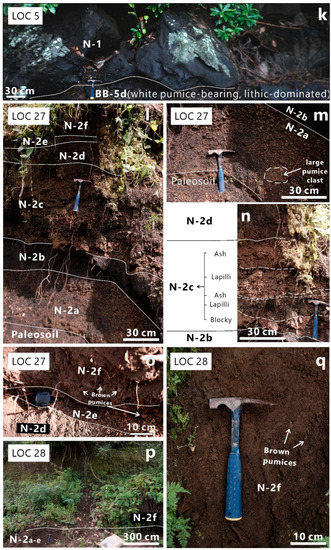
Figure 3.
(a) Outcrop image of LOC 9, showing the crudely-stratified block- and ash-rich (BB-2) and intercalating lapilli and ash-rich (BB-3) pyroclastic deposits. (b) Scoria-rich pyroclastic deposit (BB-4) at LOC 12. (c) Outcrop image of LOC 17. The BB-4 is underlined by the sequence of pumice-bearing pyroclastic deposits, including the reversely graded pumice (BB-5a), the intercalating lapilli and ash-rich pumice (BB-5b), and the massive and ash-rich pumice deposits (BB-5c). (d) Outcrop image of LOC 15, type locality of the BB-5 unit. (e–g) Detailed image of the reversely graded pumice BB-5a, where the upper part has coarser clast sizes than those of the lower part. (h) Detailed image of the BB-5b, showing the intercalation of lapilli and the ash-rich layer. (i,j) Outcrop images at LOCs 11 and 8, showing the normally graded, fine-depleted, pumice-poor, and lithic-dominated pyroclastic deposits (BB-5d). (k) Outcrop at LOC 5 showing the contact between BB-5 and Naira lava (N-1). (l) Type locality of Naira pumice deposits (N-2), consisting of six pumice layers (N2 a–f). Detailed images of N-2a (m), N 2b–d (n), and dN-2e–f (o). (p) The thickest N-2f deposit is observed at LOC 28. (q) Detailed image of N-2f.
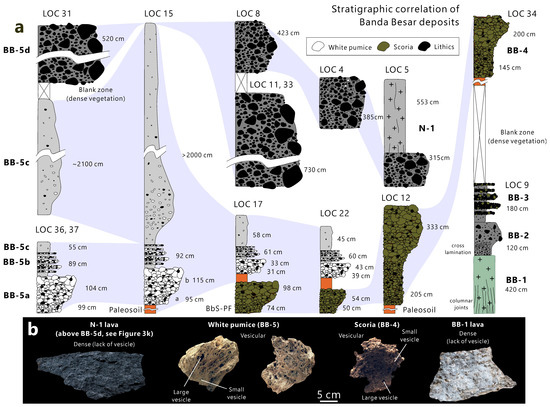
Figure 4.
(a) Stratigraphic correlation of Banda Besar eruptive units (BB-1 to BB-5). White, dark green, and black-colored grains represent white pumice, scoria, and lithics, respectively. (b) Representative images of Banda Besar white pumice, scoria, and lava. Naira lava (N-1) is also shown here, as it shows contact with BB-5d.
Further upward, at LOCs 17, 21, and 22, the BB-4 unit is underlined by a sequence of pumice-bearing deposits named BB-5 (Figure 3c and Figure 4). These BB-5 deposits consist of four main layers, namely BB-5a, BB-5b, BB-5c, and BB-5d (where the most representative exposure occur at LOC 15) (Figure 3d–h). Here, BB-5a corresponds to a thick and reversely graded pumice deposit (at LOC 15, the observed pumice clasts reached up to 6.2 cm for lapilli and 17.5 cm for block for the lower and upper part, respectively) (Figure 3e–g) that apparently include a low portion of lithics (lithic-poor). Here, BB-5b represents an intercalating lapilli and ash-rich layer (similar to BB-3, it has some ‘floating’ lapilli fragments in the finer matrices), with each layer varying from 3 to 20 cm thickness (Figure 3h) and including abundant pumice and lithic clasts.
At LOC 15, the maximum observed pumice clasts reached 4.2 cm for the lapilli layer and 2.4 cm for the ash-rich layer. The BB-5c designation corresponds to a thick (exceeding 15 m at LOC 15), massive, and ash-rich pyroclastic deposit, with relatively finer fragments (at most 0.5 cm for pumice and lithics) and matrices compared to an ash-rich layer of BB-5b. The BB-5d term represents a normally graded (the maximum clasts in the lower and upper part reached 85 and 10 cm, respectively), fine-depleted, pumice-poor, and lithic-dominated pyroclastic deposit (Figure 3i,j). Noteworthily, this unit is exclusive to the inner caldera region; it was found above the BB-5-pumice C unit (LOC 31 and 32; located at 58 and 31 m above sea level, respectively) (Figure 2) and was not observed in the flank regions. No gas pipe structure and charcoals were observed within the BB-5c and 5d units. All observed pumices (from BB-5a to 5d) are apparently white (with some displaying a pinkish surface color), aphyric (crystal-poor), and highly vesicular (rich in large and small vesicles) (Figure 4). The representative stratigraphic correlation of Banda Besar eruptive products is also shown in Figure 4.
4.2. Stratigraphy of Naira
The oldest product of Naira corresponds to massive grey porphyritic lava (N-1), which was observed at LOCs 5, 6, and 7 (Figure 2). At LOC 5, N-1 shows a sharp contact with a fine-depleted, pumice-poor, and extremely lithic-rich pumice-bearing deposit which is inferred as BB-5d (Figure 3l). Afterwards, Naira produced a thick sequence of pumice deposits (N-2) that consist of six pumice layers named as N-2a, N-2b, N-2c, N-2d, N-2e, and N-2f (Figure 3l–q). Pumices from Naira are typically brown and show slightly larger vesicle sizes (both for large and small vesicles) than those of the white pumices from Banda Besar (Figure 5).
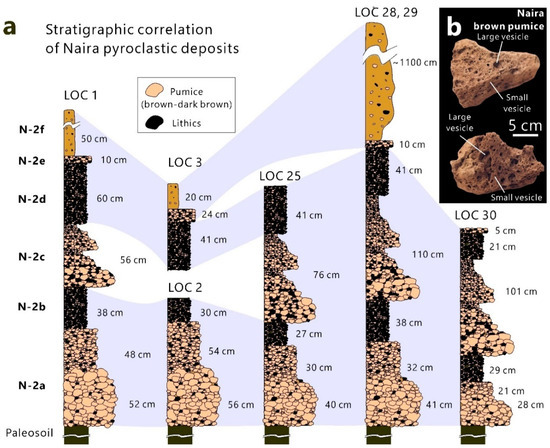
Figure 5.
(a) Stratigraphic correlation of Naira eruptive units. Brown- and black-colored grains represent brown pumice and lithics, respectively. (b) Representative images of Naira brown pumice.
The N-2a corresponds to a normally graded pumice deposit (Figure 3l,m), with the thickness varying from 49 to 110 cm. Pumices in the lower part might reach 3 cm (lapilli), slightly larger than the upper part pumices (at most 2.4 cm, lapilli). In addition, it is likely that the lower part contains more abundant lithics than the upper part. Here, N-2b is a pumice deposit that contains extremely abundant (qualitatively comprising more than half of the total deposit) lithics (Figure 3m). This research found no grain size variation throughout the whole layer (massive) and noted that the observed clasts are characteristically smaller than those of N-2a (mostly 0.2 cm, up to 1.8 cm, lapilli). The N-2c term corresponds to a pumice deposit with reverse and normally graded structures, having a relatively similar thickness to N-2a (varying from 30 to 110 cm), and is characteristically lithic-rich. The largest pumice clast in the lowermost position of N-2c reached 15 cm (blocky) (Figure 3n).
The N-2d designation display similar characteristics in terms of component and grain size to N-2b, as it corresponds to a massive and lithic-rich pumice deposit with the domination of lapilli (mostly 0.2 cm, up to 1.8 cm) (Figure 3l,n,o). The N-2e term represents the thinnest pumice layer of Naira (Figure 3l,o), as the observed thickness only varies from 5 to 24 cm. This layer contains abundant lithics similar to those of N-2a and N-2c. No grain size variation (massive) was observed in this layer, and the maximum pumice clast might exceed 3.4 cm (lapilli). The uppermost layer is a thick (±10 m at LOC 28), massive and lithic-rich pumice deposit named N-2f, having coarse ash matrices and sparse distribution of small pumice and lithic clasts (at most 1.2 cm) (Figure 3p,q). The representative stratigraphic correlation of Naira eruptive products is shown in Figure 5.
4.3. Stratigraphy of Banda Api
Based on the fieldwork observations, it was found that Banda Api produced a series of lava and pyroclastic deposits. Lava samples were collected from the north, northeast, and southeast side of Banda Api (LOC 23, 24, and 41, respectively) (Figure 2). Lava samples from LOC 24 and 41 (BA-1 and BA-2, respectively) are apparently black and grey, respectively, massive, and shows porphyritic texture. Pyroclastic samples were collected in BA-3, while the flank region (LOCs 38 and 39) includes the stratification of lithic-rich (mostly aphyric to porphyritic grey lava lithics) and juvenile-free block- and ash-rich and lapilli deposits (BA-4 and BA-5, respectively; BA-4 is located below BA-5), while the summit region (LOC 40) is a lithic-poor and massive scoria deposit. This scoria shows predominantly large vesicle sizes (lack of small vesicles) and includes very low phenocryst content (aphyric). Finally, the lava sample (BA-6) from LOC 23 corresponds to the product of the 1988 CE eruption (the most recent eruption of Banda Api), showing a dark grey color and porphyritic texture. The inner part of the 1988 CE lava is typically massive, while the outer part is fragile and displays vesicular (scoria-like) characteristics.
4.4. Depositional Mechanism
The depositional mechanism of pyroclastic deposits in BVC was determined using the median and sortation diagram of Walker (1971) [26] (Figure 6). Based on the median and sortation plot, nine units were identified as pyroclastic fall deposits (BB-4, BB-5a, N-2a, N-2b, N-2c, N-2d, N-2e, BA-4, and BA-5), five units as pyroclastic density current (PDC) deposits (BB-2, BB-5c, BB-5d, N-2f, and BA-3), and two units as the mixture of both mechanisms (BB-3 and BB-5b).
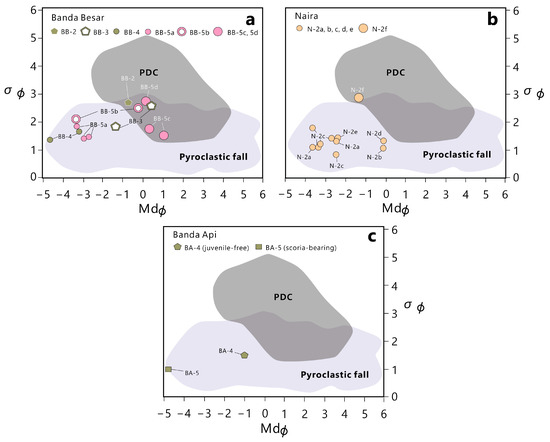
Figure 6.
Median and sortation plot for Banda Besar (a), Naira (b), and Banda Api (c) pyroclastic deposits. Note that lapilli and ash-rich samples of BB-3 and BB-5b resulted from different mechanisms, fallout, and PDC, respectively.
4.5. Summary of Components
Pumice-bearing deposits in Banda Besar (BB-5a, BB-5b, BB-5c, and BB-5d) and Naira (N-2a to N-2f) include white pumice and brown pumice as the juvenile phase, respectively. Similarly, lithics from those units correspond to volcanic lithics. Hereafter, the number fractions (total number of each component divided by the total number of counted clasts) of white pumice, brown pumice, and lithics are shown as , , and , respectively.
4.5.1. Vertical Componentry Variation of Banda Besar Pumice
Composite stratigraphy, grain size distributions (GSDs), and componentry result of the Banda Besar caldera-forming eruption deposits are shown in Figure 7. The first unit (BB-5a) is typically dominant in white pumice and lithic-poor (98% and 2% for the lower part, and 89% and 11% for the upper part, respectively). The second unit (BB-5b) results in slightly lower pumice portions compared to the BB-5a ( = 75–87%). Specifically, pyroclastic fall layers within the BB-5b result in a typically higher lithic portion than those of the BB-5b PDCs (at most 25% and 13% for the pyroclastic fall and PDC layers, respectively). Unlike units BB-5a and 5b, juvenile and lithic portions in units BB-5c and 5d vary widely. In particular, the BB-5c predominantly consists of pumice (82% for and 18% for ), while lithics dominate the BB-5d ( = 14% and = 86%).
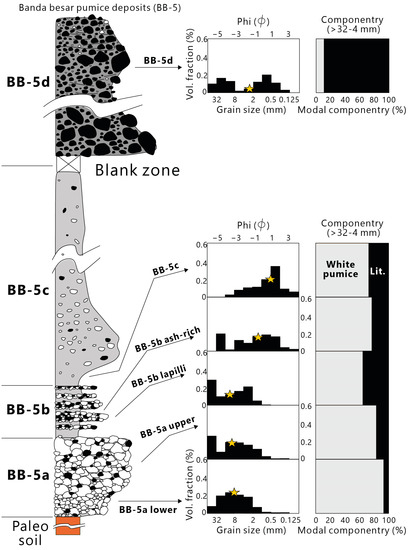
Figure 7.
Composite stratigraphy, grain size distributions (GSDs), and componentry result of the Banda Besar pumice deposits (BB-5). Star symbols in GSD histograms represent the median size. Grey and black colors in componentry represent white pumice and lithics.
4.5.2. Vertical Componentry Variation of Naira Pumice
Composite stratigraphy, grain size distributions (GSDs), and componentry result of the Naira deposits are shown in Figure 8. The lower part of the first unit (N-2a) is typically rich in lithics ( = 71% and = 29%). In contrast, the upper part of N-2a has a significantly higher juvenile portion ( = 98% and = 2%). The second unit (N-2b) shows a distinctive characteristic of N-2a, as it predominantly consisted of lithics ( = 27% and = 74%). Going upward (N-2c), brown pumice is dominating the component phase again; however, there is a tendency to decrease the juvenile portion toward the upper stratigraphic position, with and varying from 61 to 82% and from 18 to 39%, respectively. Similar to N-2b, the fourth unit (N-2d) is characterized by the domination of lithics ( = 31% and = 69%). The fifth (N-2e) and final (N-2f) units result in a relatively similar componentry and mark the re-domination of the juvenile phase, having 68% and 32%, and 64% and 36%, of brown pumice and lithics, respectively.
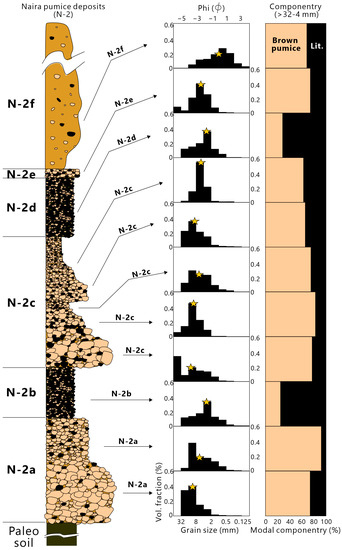
Figure 8.
Composite stratigraphy, grain size distributions (GSDs), and componentry result of the Naira pumice deposits (N-2). Star symbols in GSD histograms represent the median size. Brown and black colors in componentry represent brown pumice and lithics.
4.6. Deposit Distribution, Eruption Intensity, and Volume
Isopach maps of BB-5a and N-2 (a–e) are shown in Figure 9. Based on the maps, it is inferred that most of the ejected materials were distributed in the west-northwest direction, with the exception of N-2e, which was distributed to the north (Figure 9). This result agrees well with the fact that wind direction in the vicinity of the Banda Sea mostly goes towards the west, northwest, and north directions [16,17]. The maximum thickness of the BB-5a deposit is found to be 210 cm (observed at LOC 15, the type locality of Banda Besar pumice) (Figure 3d–g), at an approximately 2.5 km distance from the estimated vent (Figure 9). Based on the extrapolation method (Figure 10a), a deposit thickness of 1 cm is estimated to enclose an isopach area of 266.4 km2 for BB-5a, and 71.5 km2, 30.9 km2, 191.5 km2, 30.2 km2, and 13.9 km2 for N-2a, N-2b, N-2c, N-2d, and N-2e, respectively (Figure 9a). Given their nature, it is inferred that the BB-5a and N-2 (a-e) deposits resulted from a sub-Plinian eruption (Figure 9b).
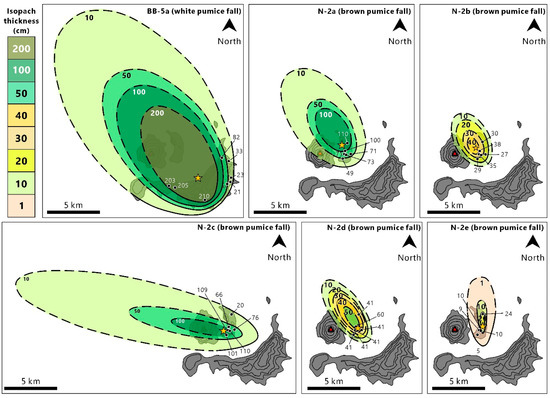
Figure 9.
Isopach maps of pyroclastic fall phases of Banda Besar white pumice fall (BB-5a) and Naira brown pumice falls (N-2a-e). This research assumed an ellipsoidal shape e.g., the ellipse-approximated isopach (EAI) method of Tajima et al. 2013) [25] to connect the ‘missing’ isopach line (shown by dashed line) for each isopach contour. The results suggest that most of the tephra were distributed in the west-northwest direction (except for N-2e), in agreement with the wind direction data from the Meteorological, Climatological, and Geophysical Agency of Indonesia [17]. Vent(s) position(s) (as shown by the yellow star symbol) were obtained by assuming a location with the thickest deposit with minimum wind influence. There is an indication of vent migration during the eruption of Naira, as suggested by the relatively northern vent position for N-2a and 2b, and the southern vent position for N-2c, 2d, and 2e.
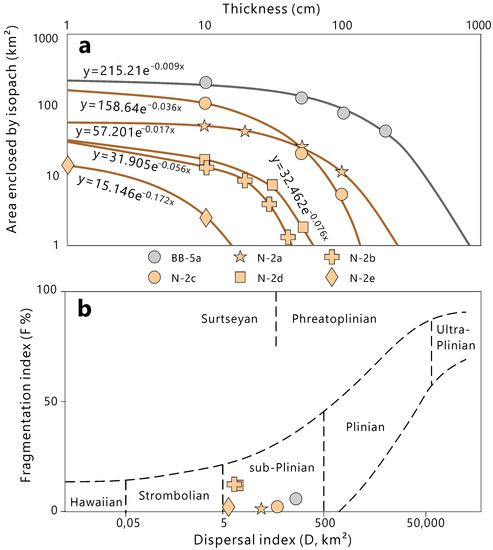
Figure 10.
(a) Correlation between area enclosed by isopach and deposit thickness. Circles correspond to data obtained from fieldwork. The area enclosed by a 1 cm isopach is estimated from the extrapolation of field data. (b) Classification of the eruption style (Walker 1973) on the basis of the fragmentation index (F, %) and dispersal index (km2). All pyroclastic fall deposits from Banda Besar and Naira (shown as light grey and light brown color) are categorized as sub-Plinian.
Based on the 0.8 and 1.6 mm lithic sizes, this research found that the plume height of BB-5a reached 22–23 km, higher than those of N-2 (a–e), which vary from 6.5 to 15.3 km (Figure 11). Following the method of Legros (2000) [30], the minimum volume of BB-5a is determined as 0.91 km3, larger than those of N-2 (0.09 km3 for N-2a, 0.02 km3 for N-2b, 0.1 km3 for N-2c, 0.02 km3 for N-2d, and 0.002 km3 for N-2e; 0.23 km3 in total). The represented data of eruptive parameters are shown in Table 1.
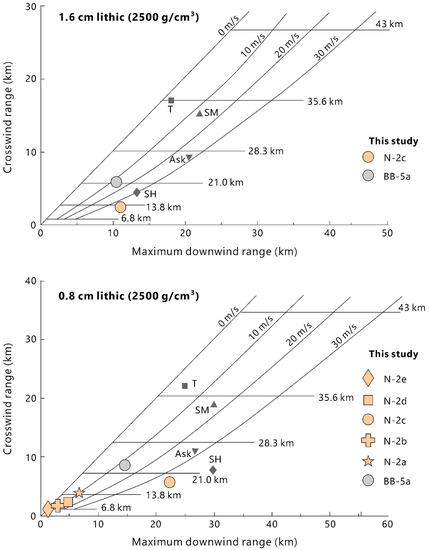
Figure 11.
Estimated column heights and wind velocities for Banda Besar and Naira pumice fall, using the methods of Carey and Sparks 1986 [15]. Grey square, triangle, reversed triangle, and diamond corresponds to the eruption of Tarawera in 1886 CE, St. Maria in 1902 CE, Askja in 1875 CE, and St. Helens in 1980 CE [15].

Table 1.
Isopach, column height, and windspeed parameters.
According to Tani et al. 2008 and Kandlbauer et al. 2013 [31,32], the total volume of erupted magma () can be estimated from the summation of and . In particular, correspond to the 3D volume of the circular depression (i.e., the , , and h values were obtained from an image processing software, such as Image-J). The dimension of the first (Banda Besar) and second (Naira) circular depressions are approximately 8 × 7 × 0.5 and 3 × 3 × 0.2 km (Figure 2), suggesting an estimated magma volume of 28.0 km3 and 1.8 km3, respectively (Table 2). Here, correspond to the volume of the pre-collapse volcanic edifice obtained from the multiplication of with average lithic fractions (0.26 and 0.35 for Banda Besar and Naira, respectively). Based on this calculation, is estimated to be 7.2 km3 for Banda Besar and 0.6 km3 for Naira. Therefore, the estimated ( + ) values are approximately 35.2 km3 for Banda Besar and 2.4 km3 for Naira (Table 2).
Table 2.
Volume estimation of Banda Besar and Naira pumice deposits.
4.7. Petrography
White pumice is slightly more crystalline and vesicular than brown pumice. In particular, the phenocryst contents (, vesicle-free) and bulk vesicularity (, phenocryst-free) of white pumice and brown pumice vary from 5.1 to 12% and 64 to 71%, and 3.1 to 7.2% and 60 to 68%, respectively (Figure 12). Plagioclase (Pl) occurs as the most dominant phenocryst phase, followed by pyroxene (Px), amphibole (Amp), and oxides (Ox) (Pl > Bt > Px > Ox). All phenocrysts are considerably small, as plagioclase sizes vary from 0.03–1.2 mm2, and pyroxene, amphibole, and oxides are less than 0.3 mm2. No disequilibrium textures (e.g., sieves, patchy zoning) were observed, as most phenocryst phases show clear, unzoned, and zoned textures.
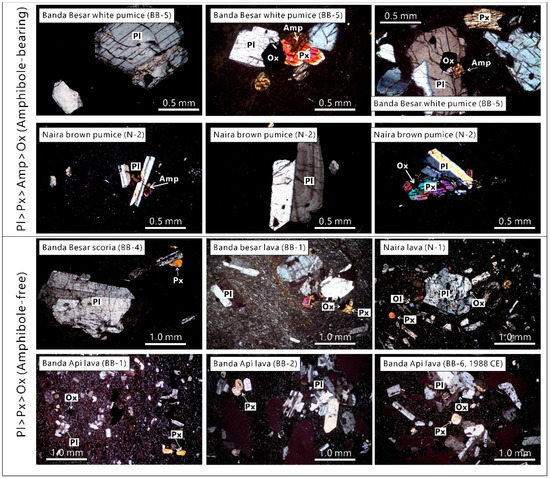
Figure 12.
Petrographic images of pumice, scoria, and lava from Banda Besar, Naira, and Banda Api eruptive units. Here, Pl, Px, Amp, and Ox correspond to plagioclase, pyroxene, amphibole, and oxides, respectively. Pumices (from Banda Besar and Naira) are characterized by the presence of amphibole (Pl > Px > Amp > Ox), whereas scoria and lavas are amphibole-free. Phenocrysts in Naira pumice are relatively smaller than those of Banda Besar, as is the pheno-crystallinity. Scoria and lava (from Banda Besar, Naira, and Banda Api) typically have larger and more abundant phenocrysts than pumice. Note the scale difference between the pumice and scoria-lava images.
For comparison, scoria and lava flows are typically denser and more crystalline than all pumices (8.5–18.3% and 35.6–45.1% , and 14.7–39.7% and 1.5–25.6% , respectively), having abundant plagioclase, followed by pyroxene and oxides, and including no amphibole (Pl > Px > Ox) (Figure 12). Most phenocrysts display clear, unzoned, and zoned textures. However, some olivine and sieve textures were also observed, but exclusive to basalt (i.e., N-1). Phenocrysts from scoria and lava flows are considerably large, where plagioclase, pyroxene, oxides, and olivine reach 2.5 mm2, 0.8 mm2, 0.3 mm2, and 0.03 mm2, respectively.
4.8. Bulk-Rock Composition
Bulk-rock compositions of pumice (white and brown) display a narrow range of silica composition, varying from 73.1–73.7 wt.% SiO2 and 66.2–67.2 wt.% SiO2, respectively (Figure 13a–d). Scoria from Banda Besar and Banda Api also show a narrow range of silica content (53.9–56.6 wt.%), but lava units are typically diverse (51.6–71.9 wt.% SiO2) (Figure 13a–d). In general (applied to all pumice, scoria, and lava units), K2O and Na2O are positively correlated with SiO2. By contrast, the other major elements (Al2O3, MgO, Fe2O3, CaO, MnO, and TiO2), as well as some trace elements (i.e., Sr, V, Cr, and Ni), exhibit a negative correlation with SiO2. Only P2O5 shows no correlation with SiO2. Interestingly, the Rb/Nb plot with SiO2 displays two contrasting patterns, namely the positive and negative correlation (Figure 13e). The positive correlation is exclusive to pumice, whereas the negative correlation corresponds to scoria and lava. The representative geochemical data of pumice and other rocks (scoria and lava) are listed in Table 3 and Table 4, respectively.
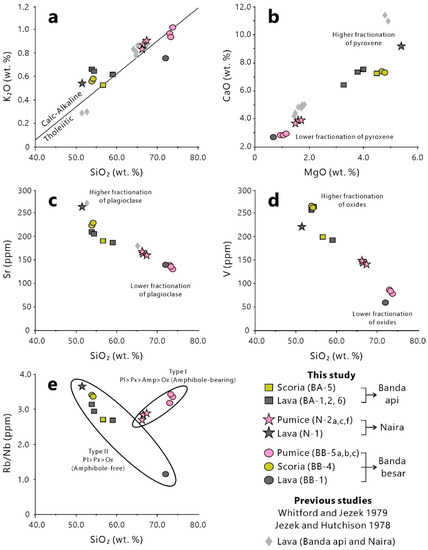
Figure 13.
(a) BVC rocks are plotted in the transitional zone between tholeiitic and low-K magma affinities. (b) Positive correlation between MgO and CaO. (c,d) SiO2 is found to be negatively correlated with Sr and V. (e) Two magma types were identified on the basis of the Rb/Nb and SiO2 plot. Type I (showing a positive correlation) is exclusive to caldera-forming eruptions and includes amphibole in the phenocryst phase. Type II (showing a negative correlation) corresponds to non-caldera-forming eruptions and contains no amphibole.
Table 3.
Bulk-rock geochemistry of the BVC pumice. All samples have been normalized to 100% (volatile-free).
Table 4.
Bulk-rock geochemistry of the BVC scoria (S) and lava (L). All samples have been normalized to 100% (volatile-free).
5. Discussion
5.1. Magmatic Origins of Banda Besar and Naira Pumice
Apparently, all eruptive products seem to be co-magmatic, as indicated by the linear correlation of some representative major and trace elements (Figure 13a–e). However, two different trends (positive and negative correlation) were crucially identified on the basis of the Rb/Nb and SiO2 plot (Figure 13e), suggesting that there were (at least) two magma types beneath BVC. Type I magma corresponds to the positively correlated Rb/Nb and SiO2. At the same time, type II represents the negatively correlated Rb/Nb and SiO2. Interestingly, the grouping agrees well with petrography data, where type I pumice includes amphibole as the main phenocryst phase, while type II pumice is amphibole-free. Moreover, the first magma variety (type I) refers to caldera-forming eruptions. In contrast, the second magma variety (type II) corresponds to the non-caldera-forming eruptions.
In general, rubidium (Rb) substitutes potassium (K) in the following three mineral phases: K-feldspar, amphibole, and biotite [33]. Because pumices from type I contain amphibole (amphibole-bearing, Pl > Px > Amp > Ox) (Figure 13e), the increasing Rb, together with the decrease in niobium (Nb) (indicated by high Rb/Nb value) towards higher SiO2 content, suggests the enrichment of amphibole during magmatic differentiation. In contrast, the decreasing Rb/Nb value towards higher SiO2 suggests the depletion and/or the absence of amphibole (Pl > Px > Ox) during magmatic differentiation (Figure 13e). As amphibole crystallization is strongly controlled by water content and temperature (i.e., supersaturation of water at lower temperature facilitates more stable amphibole crystallization and vice versa) [34,35], the assumption is that type I magma was water-saturated, while type II magma was water-undersaturated. The fact that water content is typically low in small eruptions and caldera-forming eruptions are generally water-saturated (0.4–3 wt.% and 3–6 wt.% H2O) [36] also does not deny this idea.
Moreover, this research interpretation is that Banda Besar pumices originated from different magma from Naira pumice (although both are similar type I amphibole-bearing varieties). In particular, Banda Besar pumices are typically more evolved in composition, as even the crystallinity is higher than that of Naira pumices (73.1–73.7 wt.% SiO2 with 5–12% pheno-crystallinity and 66.2–67.2 wt.% SiO2 with 3–8% pheno-crystallinity for Banda Besar and Naira, respectively). This feature is opposite to the concept of the compositionally-zoned magma chamber, where the upper magma portion with more evolved composition should include lower phenocrysts than the lower part due to fractional crystallization [7,29,37]. Therefore, this research suggests that most type I rhyolite magmas were evacuated during the first caldera formation (Banda Besar). A new type I dacitic magma formed afterward and was evacuated during the second caldera episode (Naira).
5.2. Reconstruction of Banda Besar Eruption
The BB-5a deposit marks the initial stage of the climatic Banda Besar eruption, producing a 22–23 km height of buoyant eruption column in a sub-Plinian fashion (Figure 14a). During this stage, lithic portions were low (at most 11%), suggesting a small conduit size, which is favorable for producing a stable-buoyant plume [38]. As the eruption goes on, the conduit becomes larger (indicated by the increasing lithic portions in BB-5b, at most 25%), causing the formation of partial column collapse (Figure 14b). However, it is likely that the conduit size is still at the transitional regime between buoyant plume and collapsing column (see Figure 16 in Wilson et al. 1980); therefore, the deposition of erupted materials from a sub-Plinian column and collapsing PDCs occurred simultaneously and formed an intercalating pyroclastic fall and pyroclastic density current deposits (Figure 6) known as intra-sub-Plinian flow (e.g., Maeno et al. 2007, Madden-Nadeau et al. 2021) [39,40]. Finally, the complete formation of PDCs starts when conduit size surpasses the threshold value for buoyant plume [29,38] (Figure 14c).
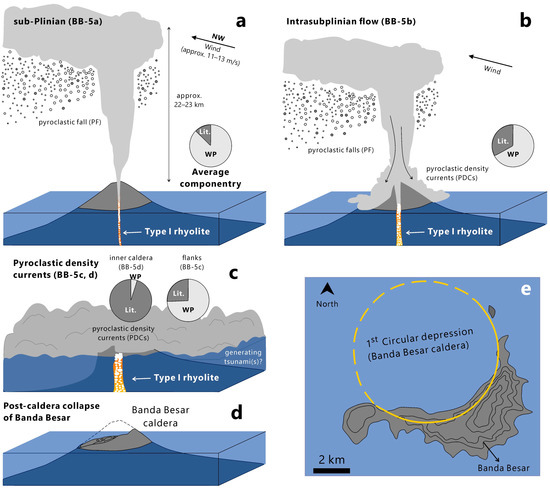
Figure 14.
Formation of Banda Besar caldera. Pie charts are componentry results, with light grey and dark grey colors representing white pumice and lithics, respectively. Wind direction (as shown by the black arrow) is obtained from the direction of isopach (see also Figure 9). (a) The first caldera episode was initiated by a 22–23 km-high sub-Plinian column, producing white pumice falls (BB-5a). (b) The explosive behavior of the sub-Plinian caused intensive conduit wall erosion (indicated by higher lithic contents), leading to partial collapses of the buoyant plume and the formation an intra-Plinian flow deposit (BB-5b). (c) When conduit size surpasses the threshold value of the buoyant plume, the eruption completely shifts to pyroclastic density current (BB-5c and 5d). Finally, the dismissal of ±35.2 km3 homogeneous rhyolite magma results in the first caldera collapse (d), forming the Banda Besar caldera (e).
The fact that BB-5c is significantly thicker than those of BB-5a and BB-5b (for instance, at LOC 15, BB-5a and BB-5b only comprise 210 cm and 60 cm, respectively, while BB-5c reaches 1500 cm) strongly suggests that the BB-5c has the longest eruption period among all units. This condition must result in the evacuation of voluminous magma from the chamber, causing the volcano to collapse and form a pumice-poor and lithic-dominated PDC deposit (14% and 86%, respectively) observed as BB-5d (Figure 14d). The occurrence of precursory pumice falls (BB-5a), intra-sub-Plinian pumice flow (BB-5b), as well as thick pumice-rich and lithic-dominated PDCs (BB-5c and 5d, respectively), is very similar to the deposits observed in the Krakatau caldera in Indonesia and the Kikai caldera in Japan [39,40]. This strongly suggests that the BB-5 unit resulted from a caldera-forming-type eruption. Finally, this first cataclysmic phase of BVC produced approximately 35.2 km3 of rhyolite magmas, scaling it as VEI 6. Such estimated plume heights and erupted volume are likely similar to those of the other submarine caldera-forming eruptions with a relatively similar magma composition (at least rhyodacite), such as the 1883 CE Krakatau eruption and the 184 ka Santorini Lower Pumice-1 (LP-1) eruption. In particular, the eruptions of Krakatau and Santorini LP-1 vented at most 21 km3 and 10km3 of erupted materials (VEI 6), respectively, and were also initiated by a sub-Plinian eruption (maximum plume heights of 25 km and 15.6 km, respectively), followed by intra-sub-Plinian flow, and terminated by thick pumice-rich PDCs that includes lag breccia [1,40,41,42].
5.3. Reconstruction of Naira Caldera-Forming Eruption
The second cataclysmic episode of the BVC (Naira eruption) shows more distinctive eruption dynamics than the first episode (Banda Besar). In particular, the Naira eruption includes a more complex sequence of fall deposits with no occurrence of intra-Plinian flow.
The first sub-Plinian phase (N-2a) marks the vent opening stage, yielding a buoyant plume that reaches up to 14 km in height (Figure 15b). Conduit erosion is expected to occur intensively, as indicated by the significant increase in lithics ( = 74%) during the second sub-Plinian phase (N-2b) (Figure 15c). The sudden increase in lithics coupled with fine-dominated and negatively skewed GSD characteristics (Figure 8) suggests that the eruption experienced a higher fragmentation index due to the occurrence of external water (most likely sea water) [43,44,45]. The fact that the ocean surrounds Naira does not deny this idea. Because lithics are typically dense, the plume from the second sub-Plinian phase must be heavier than that of the first sub-Plinian phase, as indicated by the decreasing plume height (HT = 8 km) (Figure 15c). Somehow, the vent immediately migrated to a relatively southern position (Figure 9 and Figure 15), forming the most energetic sub-Plinian eruption (N-2c) with a maximum estimated plume height of 17 km (Figure 15d).
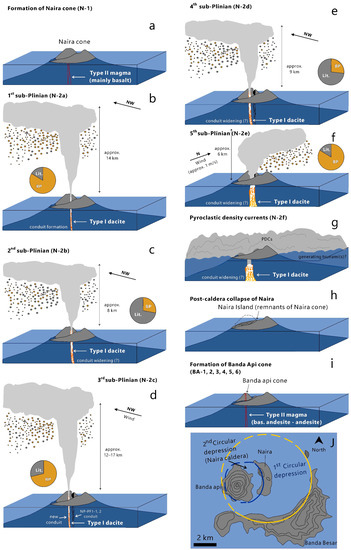
Figure 15.
Formation of the Naira caldera. Pie charts are componentry results, with brown and dark grey colors representing brown pumice and lithics, respectively. Wind direction (as shown by the black arrow) is obtained from the direction of isopach (see also Figure 9). (a) The extrusion of type II magma (N-1) constructed the Naira cone. (b) The second caldera episode was initiated by a ±14 km-high sub-Plinian column (N-2a). Next, the eruption became slightly hydromagmatic (N-2b) because the uprising magmas probably made contact with water (c). This results in higher fragmentation intensity (indicated by high lithic and ash contents) and, consequently, lowers the eruption plume height (±8 km). (d) Afterwards, the vent shifted towards the southern position and produced the most destructive sub-Plinian phase (N-2c) with a ±17 km-high eruption plume. (e) Hydromagmatic eruption occurred again during the fourth phase (N-2d), as indicated by abundant ash, high lithic contents (69%), and a low eruption plume (±9 km). (f) The eruption became magmatic again during the fifth phase (N-2e), but the plume only reached ±6 km. (g) The complete formation of pyroclastic density currents starts to take place when conduit size has surpassed the threshold value of the buoyant plume (N-2f). (h) Subsequently, the dismissal of ±2.4 km3 homogeneous dacitic magma results in the second caldera collapse, forming the Naira caldera. (i) Finally, the extrusion of type II magma constructed the present-day Banda Api cone. (j) Present-day morphology of the BVC.
An intensive conduit erosion is expected to occur again during the fourth sub-Plinian phase (N-2d; = 69%) due to the re-occurrence of external water during fragmentation (Figure 15e). The fifth phase corresponds to the weakest sub-Plinian plume (Figure 15f), possibly because the conduit has been quite large, yet is still not large enough to generate PDCs (below the threshold value of the collapsing column; see Figure 16 of Wilson et al. 1980) [38]. Finally, conduit size reached its maximum during the sixth phase, leading to the generation of massive and pumice-rich PDCs (N-2f), which marked the caldera collapse event (Figure 15g). This second cataclysmic phase of the BVC produced approximately 2.4 km3 of total erupted materials (VEI 5), close to the other small caldera-forming eruption, such as Pinatubo volcano in the Philippines and Telaga volcano in Indonesia (5 and 1.2 km3 erupted volume, respectively) [46,47].
5.4. Future Hazards
Two eruption types are observed in the BVC as follows: (1) the caldera-forming eruption and (2) the non-caldera-forming eruption. Based on this research data, it is clear that the caldera-forming eruption tends to occur under a highly mature magmatic system, namely when magma reaches rhyolitic and dacitic compositions (Figure 16). Although the non-caldera-forming eruption occurs under wide compositional variation (from basalt to rhyolite), the dominant magma compositions are basaltic andesite and andesite (Figure 16).
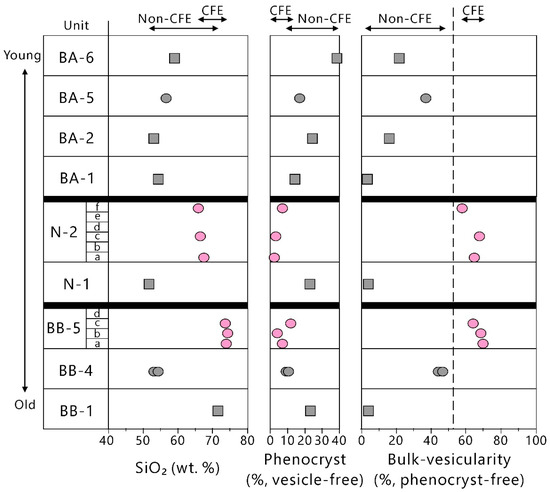
Figure 16.
Temporal variation of bulk-rock geochemistry, pheno-crystallinity (vesicle-free), and bulk-vesicularity (phenocryst-free) of the BVC eruptive products. Note that the caldera-forming eruption (CFE) tends to occur under a highly evolved, aphyric, and gas-rich magmatic condition. At the same time, the non-caldera-forming eruption (non-CFE) was sourced from less evolved, crystalline, and gas-poor magmas.
It is also clear that the essential difference between both eruption styles is controlled by magma’s physical properties, such as the abundance of phenocrysts and gas. Many studies have shown that phenocrysts behave as a counterpart in preventing flowing mechanisms (i.e., pheno-crystallinity is positively correlated with magma viscosity; McBirney and Murase 1984, Murase et al. 1985, Wood et al. 1995, Takeuchi 2011) [36,47,48,49], while bubbles provide buoyancy that is essential for rapid magma ascent (i.e., magma decompression rate is a function of bubble number density; Toramaru 2006, Shea 2017) [50,51]. Therefore, an aphyric and gas-rich (represented by low pheno-crystallinity and high vesicularity data) (Figure 16) magmatic condition must be more eruptive and buoyant than the crystalline and gas-poor magmas. This calls for a substantial and rapid magma withdrawal from the chamber (as well as preventing the conduit from stalling), which is important for generating caldera collapse. This pattern is also observed in the case of the Rabaul caldera, Papua New Guinea [52].
The present Banda Api cone has produced lava and pyroclastic materials with diverse rock compositions, ranging from basaltic andesite to dacite (Figure 16). The presence of dacitic magma may suggest that Banda Api has reached the minimum threshold of compositional value to produce a caldera-forming eruption, similar to the second caldera episode (Naira caldera) (Figure 16). Thus, there is one remaining parameter that needs to be clarified, namely the abundance of preexisting bubbles (represented as large vesicles in pyroclasts [53,54]) (Figure 4b and Figure 5b) in the present-day BVC magmas.
Many studies have shown that caldera-forming eruptions are commonly driven by buoyancy via supersaturation of preexisting bubbles in the magma chamber [53,54,55,56,57,58]. Therefore, if the present BVC magmas have been supersaturated with gas, it is not impossible for Banda Api to produce (at least) a VEI-5 eruption in the future. Keep in mind that a VEI-5 eruption is more than enough to generate a volcano-tsunami, such as at the eruption of Hunga Tonga in January 2022 [59]. Such a volcano-tsunami may become one of the most devastating secondary hazards produced by BVC (as well as a widely dispersed ashfall from pyroclastic falls and PDCs). Volcanic materials that enter the sea can undoubtedly trigger tsunamis, as happened in Montserrat at the Soufriere Hills volcano, in the Sunda Straits at the Krakatau volcano, and in West Sumbawa at the Samalas volcano. Tsunamis triggered by volcanic activities can travel across the ocean (up to hundreds of kilometer of distance) and reach nearby islands (e.g., Seram, Ambon, Buru, and Kei; see Figure 1) [60,61]. Finally, the research results pointed out that further investigations into estimating the volume of gas in the present-day BVC magmas, as well as tsunami-modeling, are highly encouraged in order to improve community and government preparedness for better mitigation.
6. Conclusions
Two caldera-forming eruptions were identified in the marine conservation zone of Banda in Maluku, Indonesia. The first episode corresponds to the formation of the Banda Besar caldera, while the second episode formed the Naira caldera. Both episodes displayed typical sequences of a caldera-forming eruption, as the eruption started by forming buoyant plumes (varying from 22 to 23 km and 6 to 17 km, respectively). It ended with thick and massive PDCs. The caldera-forming eruption of Banda Besar vented homogeneous rhyolitic magmas (73.1–73.7 wt.% SiO2), while the Naira caldera-forming eruption evacuated homogeneous dacitic magmas (66.2–67.2 wt.% SiO2); the compositional difference is responsible for generating a different pumice type (white and brown pumice, respectively).
Petrography observation and Rb/Nb and SiO2 plots identified two types of magma. The first type (type I) corresponds to phenocryst-poor (3.1–12.0% ), amphibole-bearing, and silica-rich (dacitic–rhyolitic) magmas, showing a positive correlation between Rb/Nb and SiO2. At the same time, the second type represents relatively crystalline (8.5–39.7% ), amphibole-free, and variously composed (basaltic–rhyolitic) magmas, having a negative correlation between Rb/Nb and SiO2. Because amphibole mineral is an indicator of a hydrous magmatic system, it is likely that type I magma was more supersaturated in water than type II magma. During decompression, such hydrous magmas experience a more intense vesiculation process (i.e., bubble formation) than the less hydrous ones (60.0–71.0 and 1.5–45.1% , for type I and II, respectively).
This mechanism, coupled with the distinct crystallinity condition (type I is phenocryst-poor, whereas type II is relatively phenocryst-rich), suggests that type I magma was more buoyant and eruptible than type II magma. As a result, type I magma can generate a highly explosive caldera-forming eruption, whereas the eruption of type II magma was less explosive and did not form a caldera. Given that the present Banda Api has reached basaltic andesite–dacitic magma composition (the minimum threshold composition for producing a caldera-forming eruption), picturing the volume of gas in the present magma chamber of the BVC is strongly recommended. Namely, suppose the magma is supersaturated in gas. In that case, the communities and government have to be ready, because the future eruption may be as large as the Naira eruption (VEI 5) and may trigger a secondary hazard in the form of tsunamis.
Author Contributions
Conceptualization, I.S., B.W.M. and D.S.H.; Data curation, I.S. and B.W.M.; Formal analysis, I.S., L.A., H.H., M.A.M.; Funding acquisition, D.P.S., M.A.M., B.W.M.; Investigation, I.S.; Methodology, I.S., B.W.M., D.P.S.; Project administration, D.P.S. and D.S.H.; Visualization, I.S.; Writing—original draft, I.S., B.W.M.; Writing—review & editing, I.S., B.W.M., D.P.S., L.A., H.H., M.A.M. and D.S.H. All authors have read and agreed to the published version of the manuscript.
Funding
This research was fully funded by the Pusat Hidro-Oseanografi Tentara Nasional Indonesia Angkatan Laut (PUSHIDROSAL), Indonesia, through the Expedition of Jala Citra 2-2022 “Banda”.
Data Availability Statement
Data is contained within the article.
Acknowledgments
The authors thank Haris Djoko Nugroho and Triyono for the precious discussions about Banda Naira. The authors also thank the editor and three anonymous referees for their valuable and constructive comments.
Conflicts of Interest
The authors declare no conflict of interest.
References
- Self, S.; Rampino, M.R. The 1883 eruption of Krakatau. Nature 1981, 294, 699–704. [Google Scholar] [CrossRef]
- Mandeville, C.W.; Carey, S.; Sigurdsson, H. Magma mixing, fractional crystallization and volatile degassing during the 1883 eruption of Krakatau volcano, Indonesia. J. Volcanol. Geotherm. Res. 1996, 74, 243–274. [Google Scholar] [CrossRef]
- Williams, R.; Rowley, P.; Garthwaite, M.C. Reconstructing the Anak Krakatau flank collapse that caused the December 2018 Indonesian tsunami. Geology 2019, 47, 973–976. [Google Scholar] [CrossRef]
- Jezek, P.A.; Hutchison, C.S. Banda Arc of Eastern Indonesia: Petrology and Geochemistry of the Volcanic Rocks. Bull. Volcanol. 1978, 41, 586–608. [Google Scholar] [CrossRef]
- Van Bergen, M.J.; Erfan, R.D.; Sriwana, T.; Suharyono, K.; Poorter, R.P.E.; Varekamp, J.C.; Vroon, P.Z.; Wirakusumah, A.D. Spatial geochemical variations of arc volcanism around the Banda Sea. Neth. J. Sea Res. 1989, 24, 313–322. [Google Scholar] [CrossRef]
- Center for Volcanology and Geological Hazard Mitigation (CVGHM). Data Dasar Gunung Api Indonesia. 2022. Available online: https://vsi.esdm.go.id/index.php/gunungapi/data-dasar-gunungapi (accessed on 11 September 2022).
- Chesner, C.A.; Rose, W.I. Stratigraphy of the Toba Tuffs and the evolution of the Toba Caldera Complex, Sumatra, Indonesia. Bull. Volcanol. 1991, 53, 343–356. [Google Scholar] [CrossRef]
- Kaneko, K.; Kamata, H.; Koyaguchi, T.; Yoshikawa, M.; Furukawa, K. Repeated large-scale eruptions from a single compositionally stratified magma chamber: An example from Aso volcano, Southwest Japan. J. Volcanol. Geotherm. Res. 2007, 167, 160–180. [Google Scholar] [CrossRef]
- Swallow, E.J.; Wilson, C.J.N.; Charlier, B.L.A.; Gamble, J.A. The Huckleberry Ridge Tuff, Yellowstone: Evacuation of multiple magmatic systems in a complex episodic eruption. J. Petrol. 2019, 60, 1371–1426. [Google Scholar] [CrossRef]
- Whitford, D.J.; Jezek, P.A. Origin of Late-Cenozoic lavas from the Banda Arc, Indonesia: Trace element and Sr isotope evidence. Cont. Min. Petrol. 1979, 68, 141–150. [Google Scholar] [CrossRef]
- Spakman, W.; Hall, R. Surface deformation and slab-mantle interaction during Banda arc subduction rollback. Nat. Geosci. 2010, 3, 562–566. [Google Scholar] [CrossRef]
- Wahyudin, D.; Kartadinata, M.N.; Taufiqurrahman, R.; Abdurachman, E.K.; Prambada, O.; Lusy, A.S.; Purwoto, E.; Ridwan, I. Peta Geologi Gunungapi Banda Api, Provinsi Maluku. Departemen Energi daan Sumber Daya Mineral, Pusat Vulkanologi dan Mitigasi Bencana Geologi. 2009. Available online: https://vsi.esdm.go.id/gallery/picture.php?/85 (accessed on 5 November 2022).
- Kuna, V. Subduction Factory Interaction of Subduction-Related Magma with the Overlying Lithospheric Wedge. Bachelor’s Thesis, Univerzita Karlova, Přírodovědecká fakulta, Nové Město, Czechia, 2011. Available online: http://hdl.handle.net/20.500.11956/51097 (accessed on 5 November 2022).
- Asya’ri, M.F.; Sisriany, S.; Saputra, S.D.; Habi, M.S.; Hakim, R.A.; Pribadi, M.; Khrisrachmansyah, R. The archipelascape hazard mitigation system through sasi adat of Banda Api volcano, Moluccas, Indonesia. In Proceedings of the IFLA Asia Pacific Congress 2015, Lombok, Indonesia, 7–9 September 2015; pp. 161–169. [Google Scholar]
- Carey, S.; Sparks, R.S.J. Quantitative models of the fallout and dispersal of tephra from volcanic eruption columns. Bull. Volcanol. 1986, 48, 105–125. [Google Scholar] [CrossRef]
- Pradana, M.F.; Ramadhan, G.R.E.; Noche, B. Transport Cost Optimization of Offshore Wind Turbine Installation on the Indonesia Sea. Logist. J. 2021, 2021. [Google Scholar] [CrossRef]
- Meteorological, Climatological, and Geophysical Agency (BMKG). Ocean Forecast System. 2022. Available online: https://peta-maritim.bmkg.go.id/ofs (accessed on 5 November 2022).
- Sigurdsson, H.; Carey, S. Plinian and co-ignimbrite tephra fall from the 1815 eruption of Tambora volcano. Bull. Volcanol. 1989, 51, 243–270. [Google Scholar] [CrossRef]
- Gertisser, R.; Charbonnier, S.J.; Keller, J.; Quidelleur, X. The geological evolution of Merapi volcano, Central Java, Indonesia. Bull. Volcanol. 2012, 74, 1213–1233. [Google Scholar] [CrossRef]
- Vidal, C.M.; Komorowski, J.C.; Métrich, N.; Pratomo, I.; Kartadinata, N.; Prambada, O.; Michel, A.; Cararzzo, G.; Lavigne, F.; Rodysill, J.; et al. Dynamics of the major Plinian eruption of Samalas in 1257 A.D. (Lombok, Indonesia). Bull. Volcanol. 2015, 77, 73. [Google Scholar] [CrossRef]
- Prambada, O.; Arakawa, Y.; Ikehata, K.; Furukawa, R.; Takada, A.; Wibowo, H.E.; Nakagawa, M.; Kartadinata, M.N. Eruptive history of Sundoro volcao, Central Java, Indonesia since 34 ka. Bull. Volcanol. 2012, 78, 81. [Google Scholar] [CrossRef]
- Harpel, C.J.; Kushendratno; Stimac, J.; de Harpel, C.F.A.R.; Primulyana, S. The Orange Tuff: A Late Pleistocene tephra-fall deposit emplaced by a VEI 5 silicic Plinian eruption in West Java, Indonesia. Bull. Volcanol. 2019, 81, 33. [Google Scholar] [CrossRef]
- Mitsuoka, T.; Atsushi, T.; Harijoko, A.; Wibowo, H.E. Eruption Types and Conduit Dynamics of Kukusan and Genteng Volcanoes of the Ijen Volcanic Complex, Indonesia. Kyushu Univ. Int. Rep. Ser. D Earth Planet. Sci. 2021, 35, 1–17. [Google Scholar] [CrossRef]
- Faral, A.; Lavigne, F.; Mutaqin, B.W.; Mokadem, F.; Achmad, R.; Ningrum, R.W.; Lahitte, P.; Hadmoko, D.S.; Mei, E.T.W. A 22,000-year tephrostratigraphy record of unidentified volcanic eruptions from Ternate and Tidore islands (North Maluku, Indonesia). J. Volcanol. Geotherm. Res. 2022, 423, 107474. [Google Scholar] [CrossRef]
- Tajima, Y.; Tamura, K.; Yamakoshi, T.; Tsune, A.; Tsurumoto, S. Ellipse-approximated Isopach Maps for Estimating Asfall Volume at Sakurajima Volcano. Bull. Volcanol. Soc. Jap. 2013, 58, 291–306. [Google Scholar] [CrossRef]
- Walker, G.P.L. Explosive volcanic eruptions—A new classification scheme. Geol. Rundsch. 1973, 62, 431–446. [Google Scholar] [CrossRef]
- Engwell, S.L.; Sparks, R.S.J.; Aspinall, W.P. Quantifying uncertainties in the measurement of tephra fall thickness. J. Appl. Volcanol. 2013, 2, 5. [Google Scholar] [CrossRef]
- Engwell, S.L.; Aspinall, W.P.; Sparks, R.S.J. An objective method for the production of isopach maps and implications for the estimation of tephra deposit volumes and their uncertainties. Bull. Volcanol. 2015, 77, 61. [Google Scholar] [CrossRef]
- Suhendro, I.; Toramaru, A.; Miyamoto, T.; Miyabuchi, Y.; Yamamoto, T. Magma chamber stratification of the 1815 Tambora caldera-forming eruption. Bull. Volcanol. 2021, 83, 63. [Google Scholar] [CrossRef]
- Legros, F. Minimum volume of a tephra fallout deposit estimated from a single isopach. J. Volcanol. Geotherm. Res. 2000, 96, 25–32. [Google Scholar] [CrossRef]
- Tani, K.; Fiske, R.S.; Tamura, Y.; Kido, Y.; Naka, J.; Shukuno, H.; Takeuchi, R. Sumisu volcano, Izuz-Bonin arc, Japan: Site of a silicic caldera-forming eruption from a small open-ocean island. Bull. Volcanol. 2008, 70, 547–562. [Google Scholar] [CrossRef]
- Kandlbauer, J.; Sparks, R.S.J. New estimates of the 1815 Tambora eruption volume. J. Volcanol. Geotherm. Res. 2014, 286, 93–100. [Google Scholar] [CrossRef]
- Wilson, M. Igneous Petrogenesis, a Global Tectonic Approach; Springer: Dordrecht, The Netherlands, 1989; 466p. [Google Scholar] [CrossRef]
- Dall’agnol, R.; Scaillet, B.; Pichavant, M. An Experimental Study of a Lower Proterozoic A-type Granite from the Eastern Amazonian Craton, Brazil. J. Petrol. 1999, 40, 1673–1698. [Google Scholar] [CrossRef]
- McBirney, A.R. Igneous Petrology, 3rd ed.; Jones & Bartlett Learning: Burlington, MA, USA, 2007; 550p. [Google Scholar]
- Takeuchi, S. Preeruptive magma viscosity: An important measure of magma eruptibility. J. Geophys. Res. 2011, 116. [Google Scholar] [CrossRef]
- Ginibre, C.; Wörner, G.; Kronz, A. Structure and Dynamics of the Laacher See Magma Chamber (Eifel, Germany) from Major and Trace Element Zoning in Sanidine: A Cathodoluminescence and Electron Microprobe Study. J. Petrol. 2004, 45, 2197–2223. [Google Scholar] [CrossRef]
- Wilson, L.; Sparks, R.S.J.; Walker, G.P.L. Explosive volcanic eruptions—IV. The control of magma properties and conduit geometry on eruption column behavior. Geophys. J. Int. 1980, 63, 117–148. [Google Scholar] [CrossRef]
- Maeno, F.; Taniguchi, H. Spatiotemporal evolution of a marine caldera-forming eruption, generating a low-aspect-ratio pyroclastic flow, 7.3 ka, Kikai caldera, Japan: Implication from near-vent eruptive deposits. J. Volcanol. Geotherm. Res. 2007, 167, 212–238. [Google Scholar] [CrossRef]
- Madden-Nadeau, A.L.; Cassidy, M.; Pyle, D.M.; Mather, T.A.; Watt, S.F.L.; Engwell, S.L.; Abdurrachman, M.; Nurshal, M.E.M.; Tappin, D.R. The magmatic and eruptive evolution of the 1883 caldera-forming eruption of Krakatau: Integrating field- to crystal-scale observations. J. Volcanol. Geotherm. Res. 2021, 411, 107176. [Google Scholar] [CrossRef]
- Druitt, T.H.; Mellors, R.A.; Pyle, D.M.; Sparks, R.S.J. Explosive volcanism on Santorini, Greece. Geol. Mag. 2009, 126, 95–126. [Google Scholar] [CrossRef]
- Simmons, J.M.; Cas, R.A.F.; Druitt, T.H.; Folkes, C. Complex variations during a caldera-forming Plinian eruption, including precursor deposits, thick pumice fallout, co-ignimbrite breccias and climatic lag breccias: The 184 ka Lower Pumice 1 eruption sequence, Santorini, Greece. J. Volcanol. Geotherm. Res. 2016, 324, 200–219. [Google Scholar] [CrossRef]
- Walker, G.P.L. Grain-Size Characteristics of Pyrorclastic Deposits. J. Geophys. Res. 1989, 79. [Google Scholar] [CrossRef]
- Wohletz, K.H.; Sheridan, M.F.; Brown, W.K. Particle size distributions and the sequential fragmentation/transport theory applied to volcanic ash. J. Geol. 1971, 94, 15703–15721. [Google Scholar] [CrossRef]
- Jutzeler, M.; Marsh, R.; Carey, R.J.; White, J.D.L.; Talling, P.J.; Karlstrom, L. On the fate of pumice rafts formed during the 2012 Havre submarine eruption. Nat. Commun. 2014, 5, 3660. [Google Scholar] [CrossRef]
- Bernard, A.; Knittel, U.; Weber, B.; Weis, D.; Albrecht, A.; Hattori, K.; Klein, J.; Oles, D. Petrology and Geochemistry of the 1991 eruption products of Mount Pinatubo. In Fire and Mud. Eruption and Lahars of Mount Pinatubo, Philippines; Newhall, C.G., Punongbayan, R.S., Eds.; Philippine Institute of Volcanology and Seismology: Quezon City, Philippines, 1996; pp. 767–797. [Google Scholar]
- Wood, C.P.; Nairn, I.A.; Mckee, C.O.; Talai, B. Petrology of the Rabaul caldera area, Papua New Guinea. J. Volcanol. Geotherm. Res. 1995, 69, 285–302. [Google Scholar] [CrossRef]
- McBirney, A.R.; Murase, T. Rheological Properties of Magmas. Annu. Rev. Earth Planet. Sci. 1984, 12, 337–357. [Google Scholar] [CrossRef]
- Murase, T.; McBirney, A.R.; Melson, W.G. Viscosity of the dome of Mount St. Helens. J. Volcanol. Geotherm. Res. 1985, 24, 193–204. [Google Scholar] [CrossRef]
- Toramaru, A. BND (bubble number density) decompression rate meter for explosive volcanic eruptions. J. Volcanol. Geotherm. Res. 2006, 154, 303–316. [Google Scholar] [CrossRef]
- Shea, T. Bubble nucleation in magmas: A dominantly heterogeneous process? J. Volcanol. Geotherm. Res. 2017, 343, 155–170. [Google Scholar] [CrossRef]
- Patia, H.; Eggins, S.M.; Arculus, R.J.; McKee, C.O.; Johnson, R.W.; Bradney, A. The 1994–2001 eruptive period at Rabaul, Papua New Guinea: Petrological and geochemical evidence for basalt injections into a shallow dacite magma reservoir, and significant SO2 flux. J. Volcanol. Geotherm. Res. 2017, 345, 200–207. [Google Scholar] [CrossRef]
- Toramaru, A. On the second nucleation of bubbles in magmas under sudden decompression. Earth Planet. Sci. Lett. 2014, 404, 190–199. [Google Scholar] [CrossRef]
- Suhendro, I.; Toramaru, A.; Harijoko, A.; Wibowo, H.E. The origins of transparent and non-transparent white pumice: A case study of the 52 ka Maninjau caldera-forming eruption, Indonesia. J. Volcanol. Geotherm. Res. 2022, 431, 107643. [Google Scholar] [CrossRef]
- Huppert, H.E.; Woods, A.W. The role of volatiles in magma chamber dynamics. Nature 2002, 420, 493–495. [Google Scholar] [CrossRef]
- Edmonds, M.; Woods, A.W. Exolved volatiles in magma reservoirs. J. Volcanol. Geotherm. Res. 2018, 368, 13–30. [Google Scholar] [CrossRef]
- Forni, F.; Degruyter, W.; Bachmann, O.; De Astis, G.; Mollo, S. Long-term magmatic evolution reveals the beginning of a new caldera cycle at Campi Flegrei. Sci. Adv. 2018, 4, eaat9401. [Google Scholar] [CrossRef]
- Caricchi, L.; Annen, C.; Blundy, J.; Simpson, G.; Pinel, V. Frequency and magnitude of volcanic eruptions controlled by magma injection and buoyancy. Nat. Geosci. 2014, 7, 126–130. [Google Scholar] [CrossRef]
- Terry, J.P.; Goff, J.; Winspear, N.; Bongolan, V.P.; Fisher, S. Tonga volcanic eruption and tsunami, January 2022: Globally the most significant opportunity to observe an explosive and tsunamigenic submarine eruption since AD 1883 Krakatau. Geosci. Lett. 2022, 9, 24. [Google Scholar] [CrossRef]
- Mutaqin, B.W.; Lavigne, F.; Hadmoko, D.S.; Malawani, M.N. Volcanic Eruption-Induced Tsunami in Indonesia: A Review. IOP Conf. Ser. Earth Environ. Sci. 2019, 256, 012023. [Google Scholar] [CrossRef]
- Mutaqin, B.W.; Lavigne, F.; Wassmer, P.; Trautmann, M.; Joyontono, P.; Gomez, C.; Septiangga, B.; Komorowsk, J.C.; Sartohadi, J.; Hadmoko, D.S. Evidence of unknown paleo-tsunami events along the Alas Strait, West Sumbawa, Indonesia. Geosciences 2021, 11, 46. [Google Scholar] [CrossRef]


Publisher’s Note: MDPI stays neutral with regard to jurisdictional claims in published maps and institutional affiliations. |
© 2022 by the authors. Licensee MDPI, Basel, Switzerland. This article is an open access article distributed under the terms and conditions of the Creative Commons Attribution (CC BY) license (https://creativecommons.org/licenses/by/4.0/).