Article

Crustal Structure Beneath the Arabian Shield Based on the Receiver Function Method

1
Chair of Natural Hazards and Mineral Resources, Geology and Geophysics Department, King Saud University, P.O. Box 2455, Riyadh 11451, Saudi Arabia
2
Trofimuk Institute of Petroleum Geology and Geophysics SB RAS, Prospekt Koptyuga, 3, Novosibirsk 630090, Russia
3
Institute of the Earth’s Crust SB RAS, 128 Lermontova St., Irkutsk 664033, Russia
4
Seismology Department, National Research Institute of Astronomy and Geophysics (NRIAG), Helwan 11421, Egypt
*
Authors to whom correspondence should be addressed.
Geosciences 2022, 12(11), 399; https://doi.org/10.3390/geosciences12110399
Submission received: 29 September 2022 / Revised: 21 October 2022 / Accepted: 25 October 2022 / Published: 27 October 2022
(This article belongs to the Section Geophysics)

Abstract

:
Arabian Shield occupying the western part of the Arabian Peninsula is an area where strong heterogeneities in crustal structures are associated with several factors, such as an ongoing rifting process in the Red Sea basin, massive recent effusive volcanism in several large basaltic fields (harrats), as well as traces of complex tectonic evolution of this area in Precambrian due to the accretion of several terrains. Geophysical studies of the crust give important information to identify the roles of these and other factors. Receiver function is one of the most robust and relatively inexpensive tools to derive the depths of the major interfaces, of which Moho is the most important, as well as mean velocity parameters in the crust. Based on the H-k stacking method, we have determined the Moho depths and the mean Vp/Vs ratios below a number of seismic stations distributed on the Arabian Shield. As in most of previous studies, we have identified a gradual increase of the crustal thickness from 25 km in the coastal areas of the Red Sea to ~40 km in the eastern margin of the shield. The crustal thickness distribution appears to be consistent with seismic velocity anomalies derived at 30 km depth in the tomography model by (El Khrepy, 2021). For the Vp/Vs ratio, we observe strong variations over the entire study area, and in some cases even between stations located close to each other. This is especially clear in areas of recent magmatism, such as in Harrats Lunayyir and Rahat, where stations with high Vp/Vs ratios correspond to zones with fresh monogenic cones and historical magmatic activity.

1. Introduction

Crustal structure and Moho depth are important parameters reflecting the geodynamic development of the lithosphere. In particular, the variations of crustal thickness are especially strong at boundaries between rigid lithospheric blocks and zones of recent tectonic activity. In this study, we consider the western part of the Arabian Peninsula, where the Late Proterozoic Arabian Shield is dissected by the ongoing rift processes in the basin of the Red Sea. Regarding the regime of the lithosphere extension in this area, there are several concepts presuming different mechanisms of divergent processes (e.g., [1,2,3]). Based on a recent seismic tomography model, [4] proposed that, in the basin of the Red Sea, there take place different stages of the extension ranging from continental rifting in the north to the oceanic spreading in the south. They also identified a transitional stage, in which the extension of the sea basin occurs in a dispersed system of dykes that form an area of thinned transitional crust roughly coinciding with the present Red Sea aquatory. A distinct feature of this regime is that the crust in this case is abruptly thinned close to the shore area, whereas the continental rifting presumes continuous crustal thinning without sharp changes. Thus, crustal thickness is directly associated with the processes of the lithosphere deformations; therefore, the robust information on the Moho depth might help validate or disprove hypotheses related to geodynamic processes in divergent zones.
The evolution of continental lithosphere development is another important factor determining crustal structure in the western part of Saudi Arabia. Two-thirds of the Arabian Peninsula in the east is occupied by the Phanerozoic Arabian Platform, and approximately one-third in the west is the Arabian Shield composed of Precambrian plutonic and metamorphic rocks formed due to the accretion of island arc terranes during several subduction episodes in Proterozoic [5,6,7]. In contrast to the generally flat Arabian Platform, the Arabian Shield is characterized by a ragged and elevated relief reaching an elevation of 2000 m. The eastern part of the shield, as well as the majority of the platform, is covered by thick Paleozoic and Mesozoic sediments with the thickness reaching 10 [8,9]. Initially, the Arabian Shield was united with the Nubian Shield on the African Plate, but later they were separated by the process of rifting, which began approximately 30 Ma in the area of the Afar Plume impingement [7,10,11]. Then, the extension occurred both to the northeast creating the Gulf of Aden, and to the northwest causing the opening of the Red Sea. Nowadays, the divergence rate in the Red Sea varies from 5 mm/year in the north to 16 mm/year in its southern part [12].
Another factor that may affect the crustal structure is the Neogene and Quaternary volcanism occurred along the western part of the Arabian Plate [12]. The large basaltic lava fields, also called harrats, were formed during the last 30 million years and now they cover an area of more than 180,000 km2 in total [13]. These harrats can be divided into two phases of volcanism: tholeiitic-transitional (30–20 million years ago), parallel to the margin of the Red Sea; and transitional-alkaline (12 million years ago until recently), in the direction from north to south [14]. The later observations may indicate the deep origin of magma in recent eruptions, possibly associated with the mantle plume. The fact of asymmetric distribution of harrats with respect to the Red Sea is another argument showing that the recent volcanism in Saudi Arabia is probably not directly associated with the rifting processes and rather originates from mantle sources, such as plume or asthenosphere upwelling (e.g., [15,16,17]).
Approximately twenty eruptions in Western Saudi Arabia and Yemen were recorded in historical times during the last 1500 years [18]. The most recent unrest of possible volcanic nature in this region occurred in early 2009 in Harrat –Lunayyir, which is a youngest and relatively small lava field on the western margin of the Arabian Plate [19]. This region experienced a pronounced swarm of more than 30,000 seismic events in the period from April to June 2009 with magnitudes reaching 5.7. It was explained by the intrusion of a magmatic dike, which stopped at a depth of ~2 km below the surface [19,20]. This phenomenon in Harrat–Lunayyir demonstrates that potentially destructive magmatic processes and earthquakes can occur at any time, and not only within the rifts, but also along their margins [21].
The deep structure beneath the Arabian Plate was investigated using a broad range of different geophysical methods including a number of global and regional-scale seismic tomography studies based on the body wave and surface wave data. Surface wave tomography provides more homogeneous distributions of the ray paths and therefore most of the regional-scale results on the Arabian Peninsula are obtained using this method [22,23,24,25,26,27,28,29,30,31]. The uppermost mantle structures were also studied using Pn and Sn travel times over all Asia (e.g., [32]) and the Arabian region [33], and they are generally consistent with those provided by surface wave tomography. Regional-scale mantle structures beneath Saudi Arabia were studied by [34,35] with the use of body-wave data from global seismological catalogs. A number of smaller scale models of the upper mantle were constructed using teleseismic data recorded by local networks deployed in selected areas of Afar [36], Yemen (e.g., [37,38]) and Saudi Arabia [39,40]. These studies consistently show that beneath western Arabia, the lithosphere appears to be relatively thin. Together with the existence of strong azimuthal anisotropy [18]; this fact is interpreted as the existence of a sublithosphere channel that brings hot material from the Afar Plume to the areas of harrats in Western Arabia. On the other hand, beneath the central part of the Arabian Plate, the low-velocity anomaly retrieved from seismic tomography [35] and receiver function [41] is interpreted as a plume serving as another source of volcanism.
Crustal and uppermost mantle structures in the Red Sea and surrounding areas were studied in a series of seismic tomography works by [4,17,42] with the use of body wave data recorded by regional networks of Saudi Arabia and Egypt. Moho depth and crustal structures along several profiles in Saudi Arabia were derived from several seismic active-source surveys [43,44,45,46]. An overview of all available information on the crustal structures in the Arabian Plate obtained by different methods was provided in [47]. The receiver function method has been implemented in a number of studies to evaluate the crustal thickness in Saudi Arabia [41,48,49,50,51,52]. Further improvement of the crustal structures was obtained owing to the joint inversion of the receiver function and surface wave data in [48,53,54,55]. The lithosphere–asthenosphere boundary beneath the Red Sea and Arabian Plate was studied with the use of the S-receiver function in [56,57]. Based on all these studies, there is a consensus on the general crustal features in the Arabian Plate. It is accepted that within the continental areas, the crustal thickness generally increases eastward and varies from 27 to 50 km. In the central and eastern parts of the Arabian Peninsula, the crust appears to be slightly thicker than usually observed on Precambrian shields and stable platforms in other parts of the world. In particular, on the Arabian platform near the Arabian Gulf, [58,59] reported a crust with a thickness of 46 km and 51 km. In Oman, in the southeast, based on the active-source profile, the thickness of the earth’s crust is about 41–49 km [44]. In the northern and northwestern parts of the platform, it ranges from 33 to 40 km [45,60]. The crustal Vp/Vs ratio ranges between 1.61 and 2.03, which demonstrates the highly heterogeneous structure of the crust beneath the Arabian Shield.
In the present work, we continue studying the crustal structure beneath the Arabian Shield in western part of the Arabian Peninsula with the use of the receiver function method. Our purpose is to bring an additional contribution to understanding the complex evolution of the continental blocks within the Arabian Shield, to deciphering the scenario of continent-to-ocean type of rifting in the area of the Red Sea, and well as to identifying traces of deep sources causing the recent volcanism in western Saudi Arabia. We use similar data sources and data processing workflow as in [48,51,61]. At the same time, an independent view provides confidence to the results of the crustal parameters determinations. Furthermore, in the part of interpretation, we mostly focus on the transitional area and discuss crustal thickness variations due to the opening of the Red Sea, which was not considered in much detail in the previous studies.

2. Data and Algorithms

2.1. Data Preprocessing

In our work, we used the data provided by the Saudi Geological Survey (SGS) National Seismic Network [62]. This dataset includes continuous three-component seismograms recorded in 2010 by 65 seismic stations located in the Kingdom of Saudi Arabia (Figure 1). Using the catalogue of the International Seismological Centre (ISC), we have selected 140 strongest earthquakes with magnitudes of more than 5.5 that occurred during this time at epicentral distances of 30–100 degrees (Figure 2) [63]. Note that the majority of the events occurred in an azimuthal segment of approximately 90 degrees to the northeastern direction corresponding to the subduction zones of western Pacific and Sunda Arc. For each event and for each station, we identified the arrival time of the P-wave based on the standard one-dimensional velocity model of the Earth IASP91 [64]. Then, we visually inspected the quality of records and removed some stations that recorded insufficient number of events, which reduced the total number of stations to 56.
We implemented a standard workflow of data processing for the Ps-wave receiver function analysis, which is a well-established technique mostly used for studying crustal boundaries. First, the seismograms were filtered by a bandpass filter in a range of 0.05–1.5 Hz. Then, the three-component records were rotated from the seismometer’s coordinate system, North-East-Vertical (NEZ), to the coordinates related to the arriving ray, called LQT (L is along the P-wave polarization, Q and T are perpendicular to the ray path, along the SV and SH polarizations, respectively). In the analysis, we used only the L and Q components, as the T component contains very little relevant signal for the Ps-wave receiver function. It is presumed that the L-component includes merely the direct P-wave.
The source wavelet, associated with the earthquake type and mechanism, is removed by deconvolution of the waveform at the L-component from the Q-component [65]. Ideally, this procedure should reduce the signal to a number of delta-functions corresponding to multiple reflections and conversions of the incoming wave on the major deep first-order interfaces and the free surface. The deconvolution was conducted by iterative repetition of four steps [65,66]:
  • Step 1. Calculate the cross-correlation, a(t) = ŝ(t)⊗d(t), where the symbol ⊗ denotes cross-correlation, d(t)-component of data to be deconvoluted, and ŝ(t) represents a wavelet in the time domain.
  • Step 2. Determine the delay time kΔt of the maximum amplitude ak = max |a|, for which ak–amplitude a(t) with delay time kΔt.
  • Step 3. Calculate the residual for the n-th iteration, rn(t) = d(t) − ak (t) ∗ δ(t − t0 − kΔt)
  • Step 4. Update the data taking into account the residual, d(t) = rn(t).
These four steps are repeated until one or more convergence criteria are met or the limit on the number of iterations is reached. The critical point of the iterative method is that the result can be expressed as a finite sequence of peaks. In this paper, the convergence criterion is designated as a 70% coincidence of the deconvolved signal with the original one.

2.2. Method for Estimation of Crustal Thickness and Vp/Vs Ratio

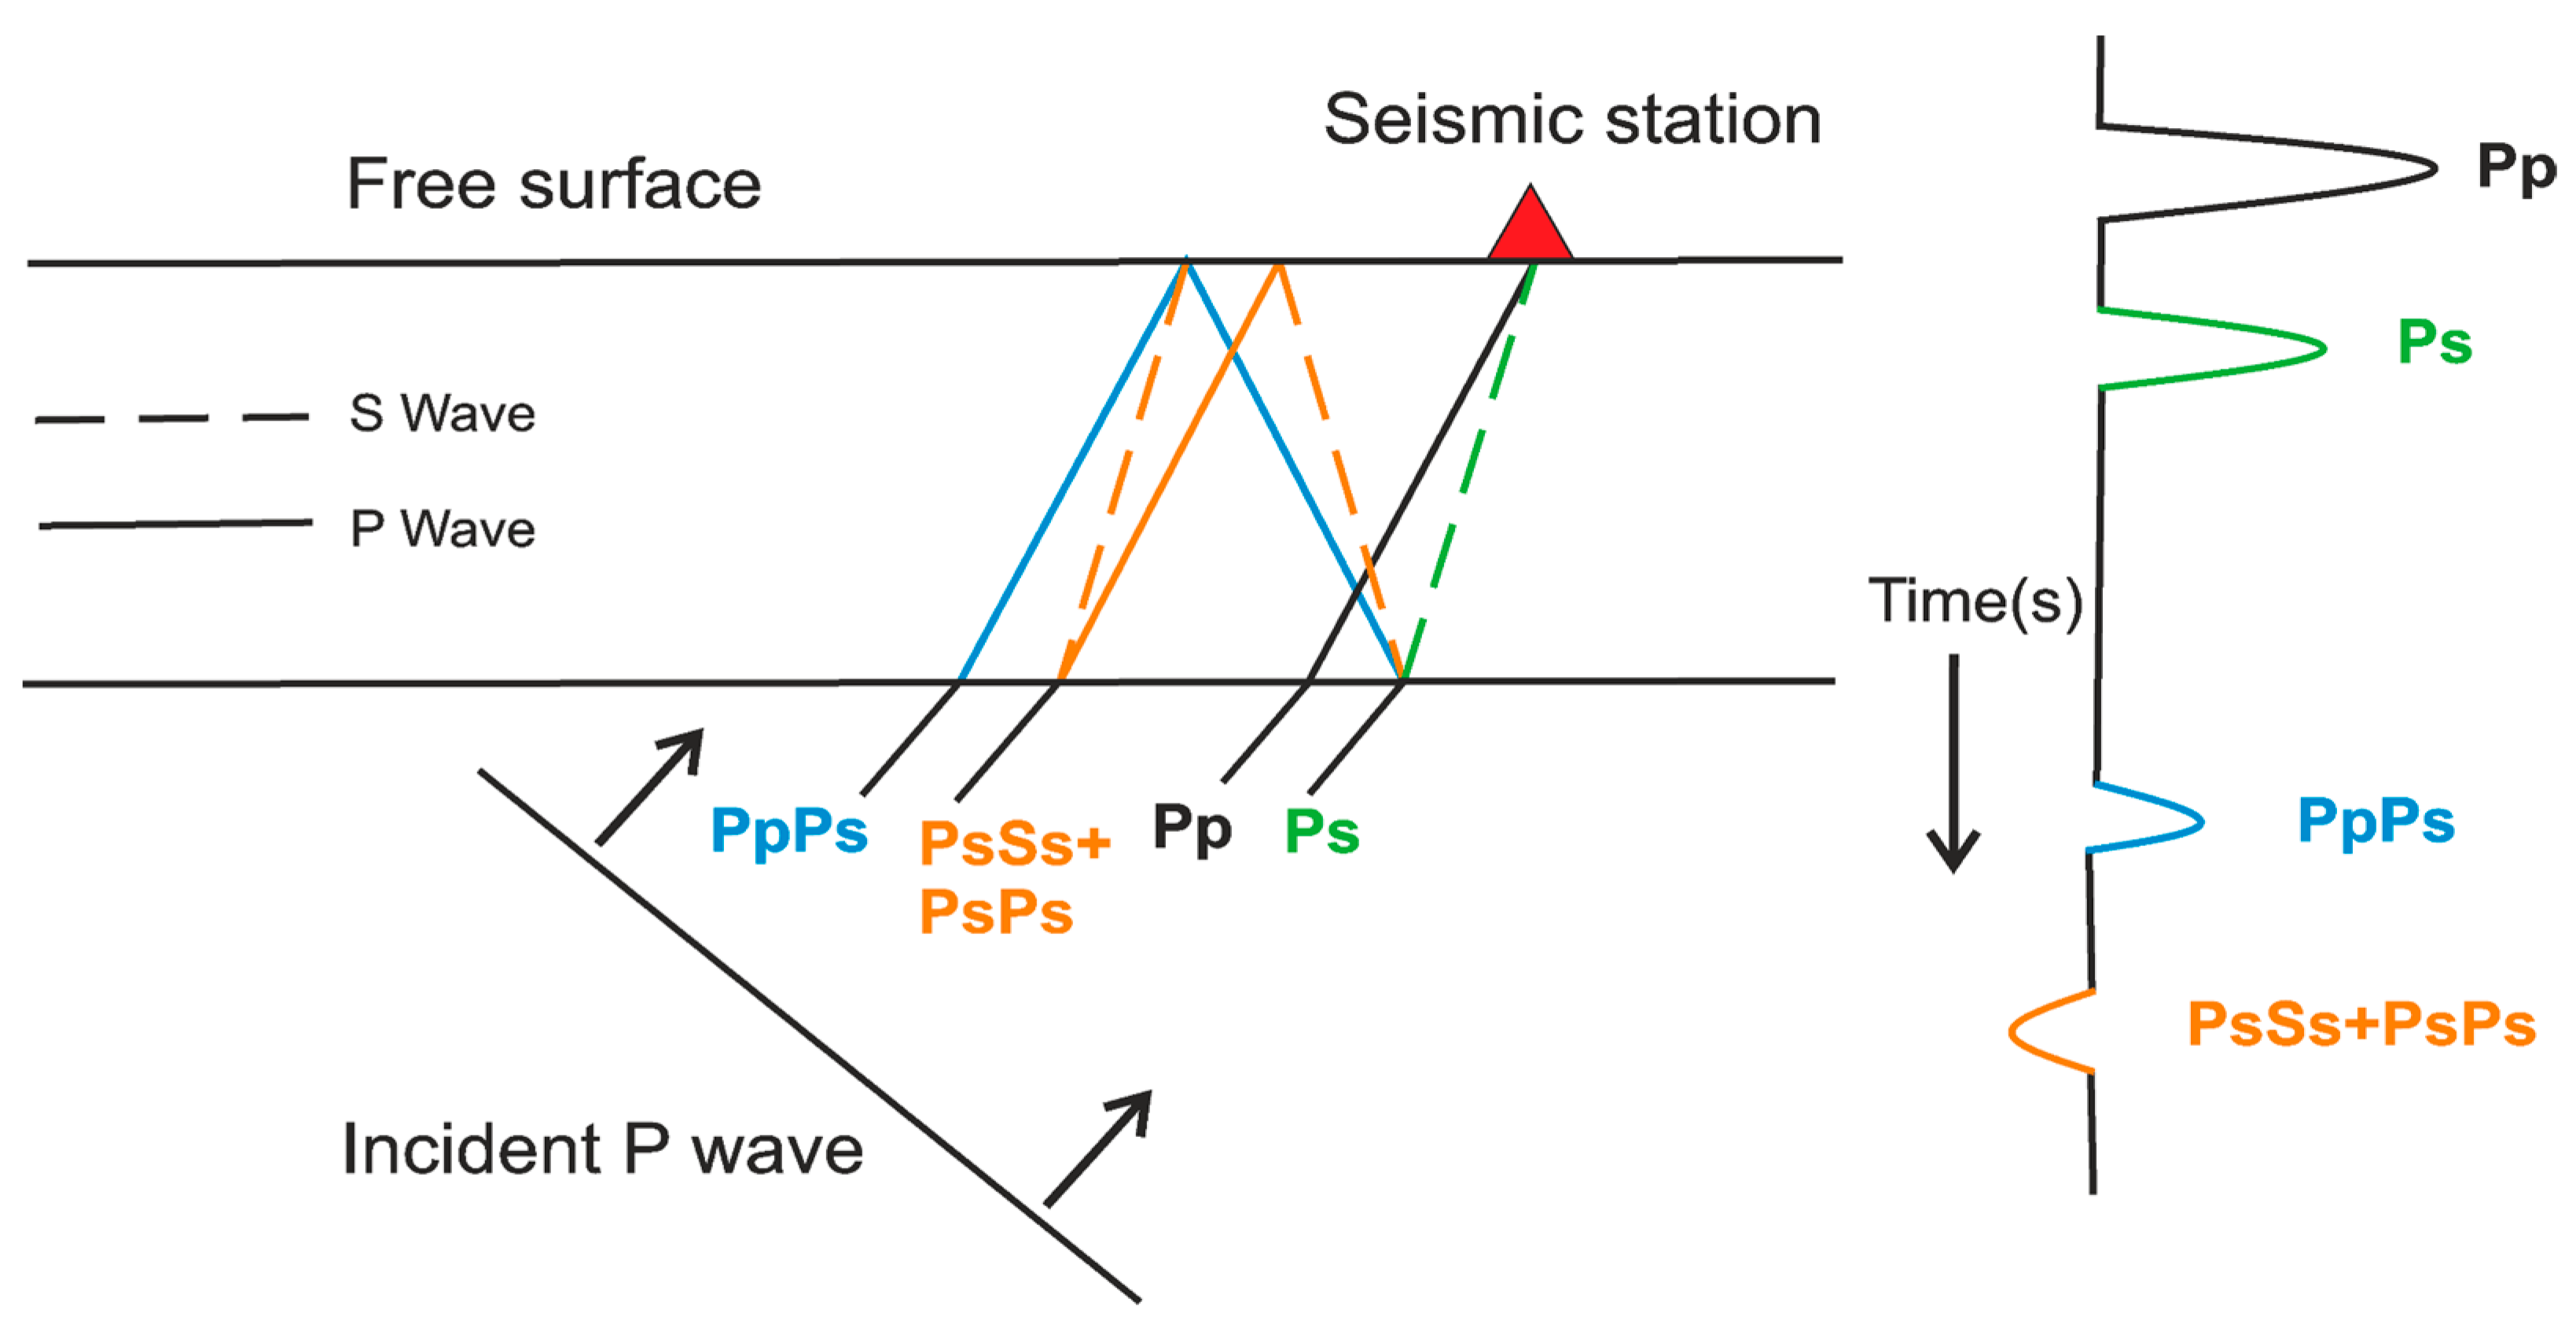
In this study, we inspected the S-wave arrivals recorded in the Q-component. We used four phases associated with the multiple conversions and reflections at the Moho interface and at free surface as illustrated in Figure 3:
  • Ps-P wave converted to the s wave during refraction at Moho;
  • PpPs-P refracted to p at Moho, reflected as P from the free surface, and then reflected as converted s at Moho);
  • PpSs (P refracted to p at Moho, reflected as converted S from the free surface, and then reflected as s at Moho);
  • PsPs (P refracted to converted s at Moho, reflected as converted P from the free surface, and then reflected as converted s at Moho).
In a 1D velocity model, the two latest phases PpSs and PsPs kinematically propagate with the same time and arrive at the station simultaneously producing a pick with an opposite polarization compared to those of Ps and PpPs. Therefore, they are considered as a single phase and denoted as 2p2s. The arrival times of all phases were corrected for the ray’s incidence angle. After these corrections, the phases were reduced to the case of vertical ray propagation and became identical for all sources at different epicentral distances, which made it possible a constructive stacking of the receiver functions for multiple events.
These three phases were used to perform the H-k staking according to the procedure proposed by [67]. In this scheme, H represents the depth of the first-order interface and k denotes the mean Vp/Vs ratio above this interface. In the case of using a single phase, for example, Ps, these two parameters cannot be determined unambiguously, as they provide nearly equal solutions in a broad range of values within an elongated trade-off zone. In the case of adding other phases, for which the trade-off zones are oriented differently, the stacking of the probability functions would considerably reduce the uncertainty area.
The method of the H-k stacking is based on the assumption that the medium consists of a horizontal isotropic homogeneous layer lying over a half-space. The travel times of the three types of phases can be calculated using formulas.
t P s ( H , k , v P , ρ ) = H [ k 2 v P 2 p 2 1 v P 2 p 2 ]
t P P P s ( H , k , v P , ρ ) = H [ k 2 v P 2 p 2 + 1 v P 2 p 2 ]
t P s P s ( H , k , v P , ρ ) = 2 H [ k 2 v P 2 p 2 ]
where H is the depth of the interface, Vp is the P-wave velocity, k is the Vp/Vs ratio, and p is the ray parameter representing the incidence angle. Based on these formulas, we can derive the signal amplitude at the Q component at the calculated travel time for a selected phase denoted as r. High amplitudes of r represent most plausible values of the velocities and interface’s depth. Here, we utilize a grid search by varying the values of H and k in ranges of plausible values that theoretically may exist in our case: 20 < H < 60 and 1.5 < k < 2.0. The average P-wave velocity in the crust was set as 6.5 km/s according to the results of previous tomography studies (e.g., [1]). The grid-search results derived for three individual phases were stacked using the formula:
s ( H , k ) = w 1 r ( t P s ) + w 2 r ( t P p P s ) w 3 r ( t P s P s )
where w are the weight parameters defined for each of the phases. These coefficients are normalized as w1 + w2 + w3 = 1. In our case, the weights were defined manually for each station to achieve the most clear determination of the stacked amplitude maximum. The most typical values were 0.4/0.3/0.3 and 0.7/0.2/0.1. The absolute maximum of the stacked function calculated using (4) is used to define the most probable values of H and k.
Examples of the H-k stacking for several stations located in different tectonic settings are presented in Figure 4, Figure 5, Figure 6, Figure 7, Figure 8 and Figure 9. In the same figures, we present also individual receiver functions (Q-channels) for the available events ranged according to the azimuth, which can be used to assess the quality of the target phase determination. The final solutions for the Moho depth and Vp/Vs ratio at all stations, for which the H-k stacking was successfully performed, are presented in Figure 10 and Figure 11. Note that for some of the stations, we could not achieve a sufficient robustness of the H-k determination due to an insufficient number of the recorded events and too low quality of data. In total, only 51 of 65 stations are presented.

3. Results and Discussion

3.1. Discussion of H-k Stacking for Individual Stations

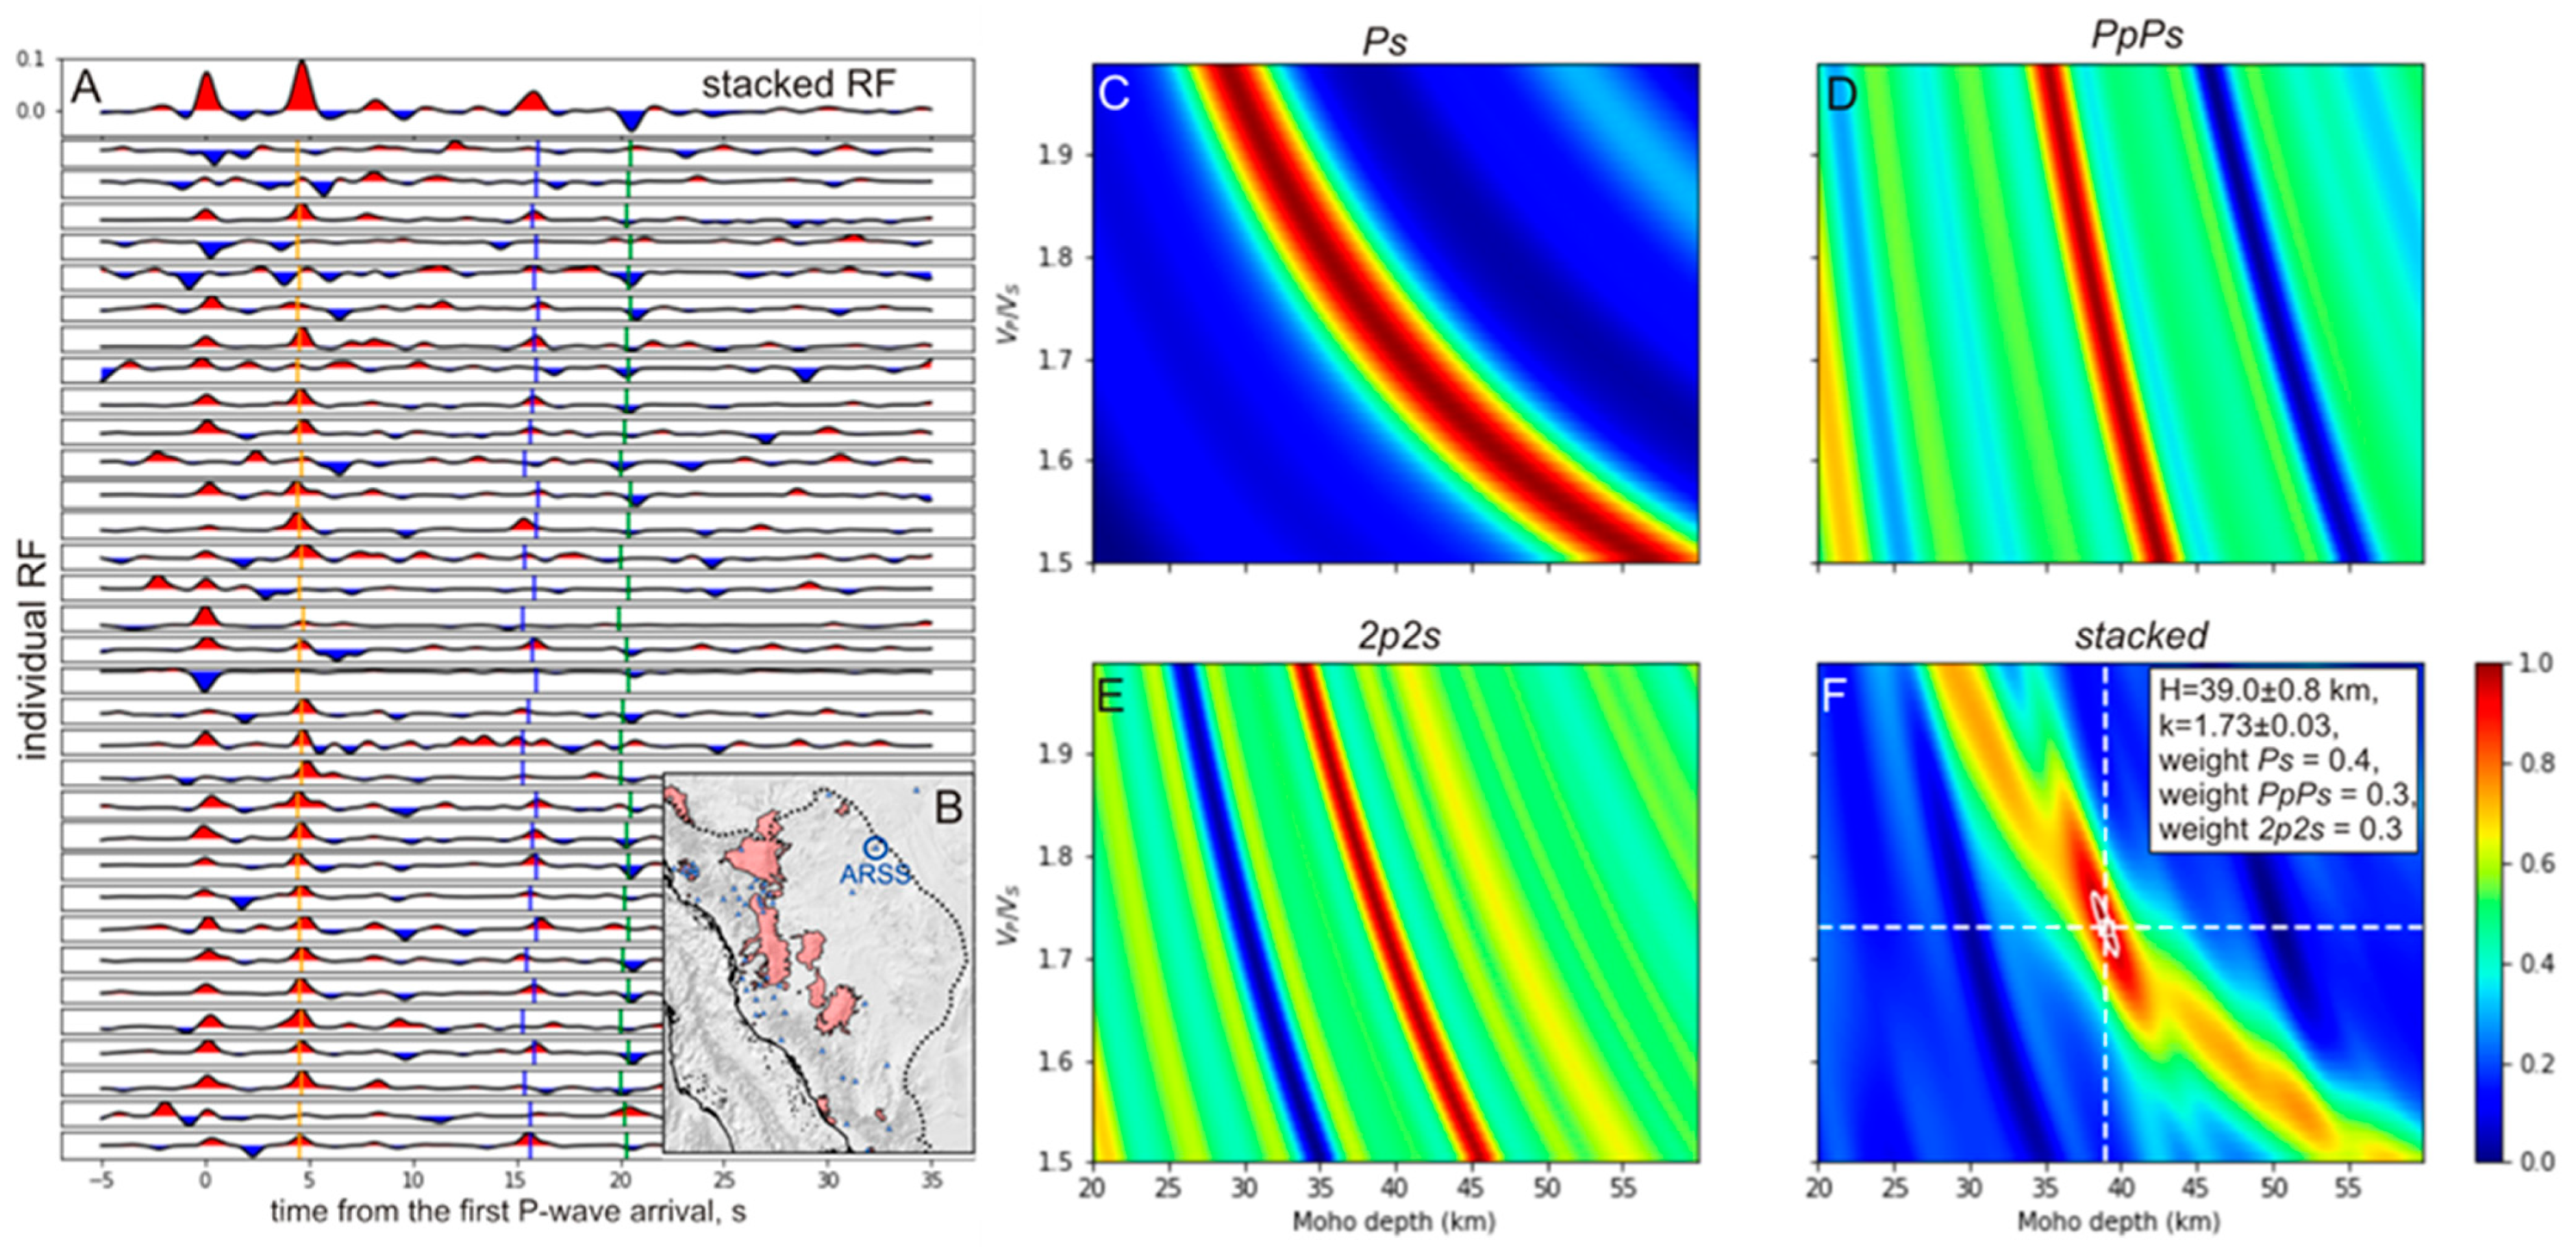
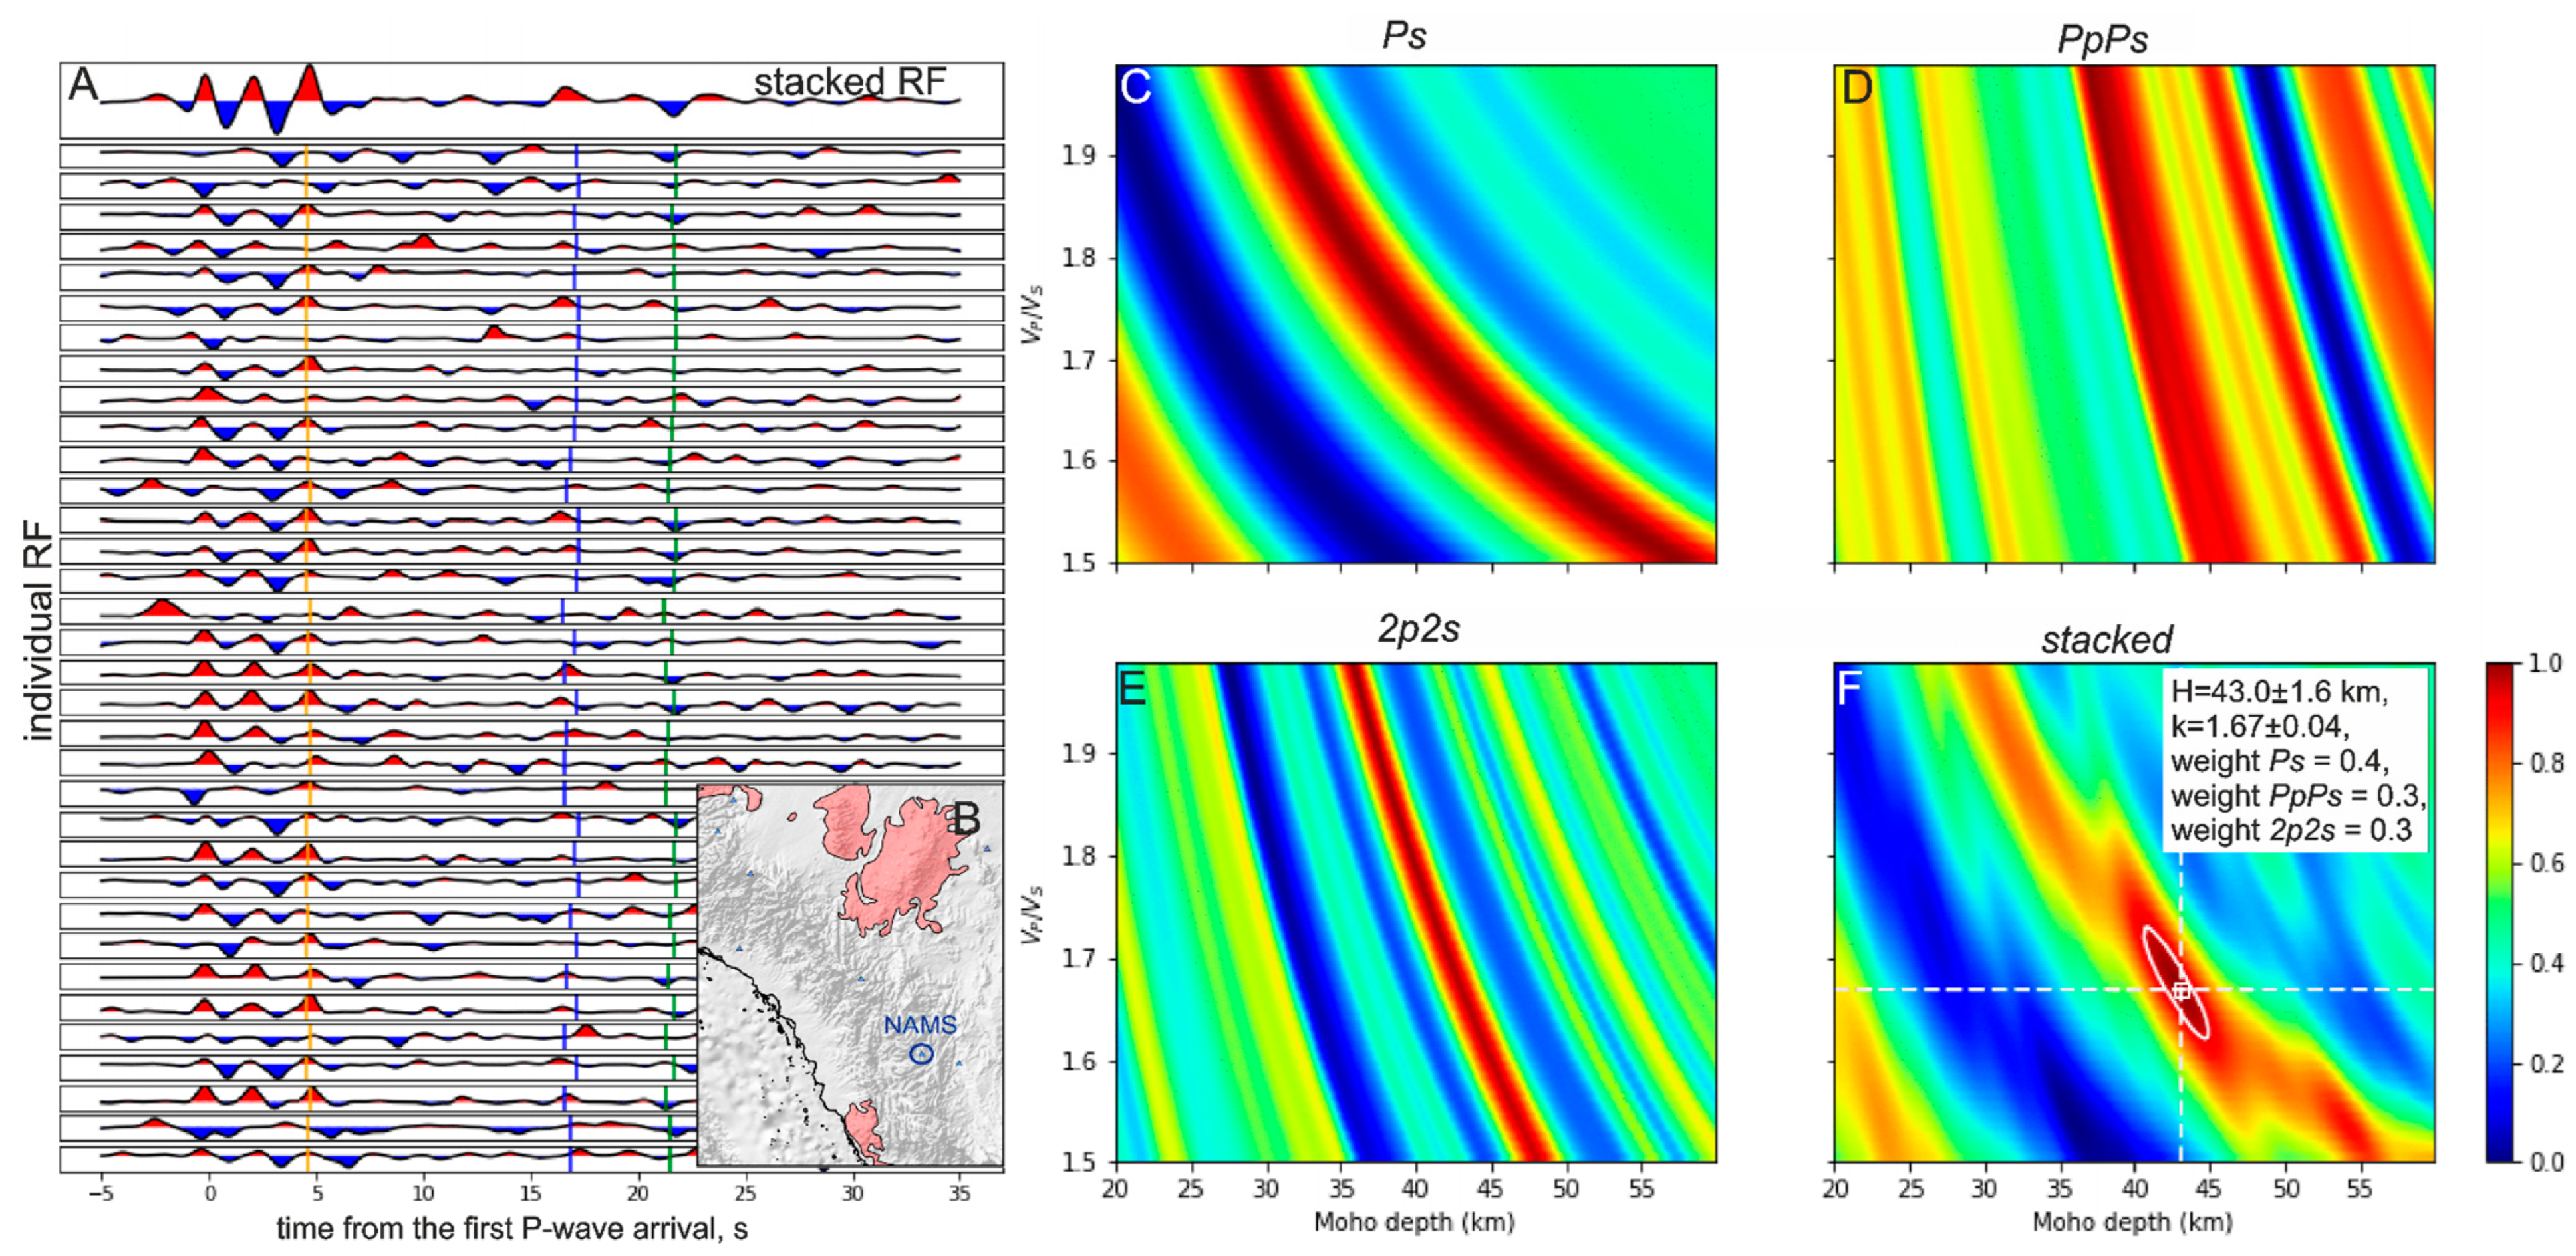
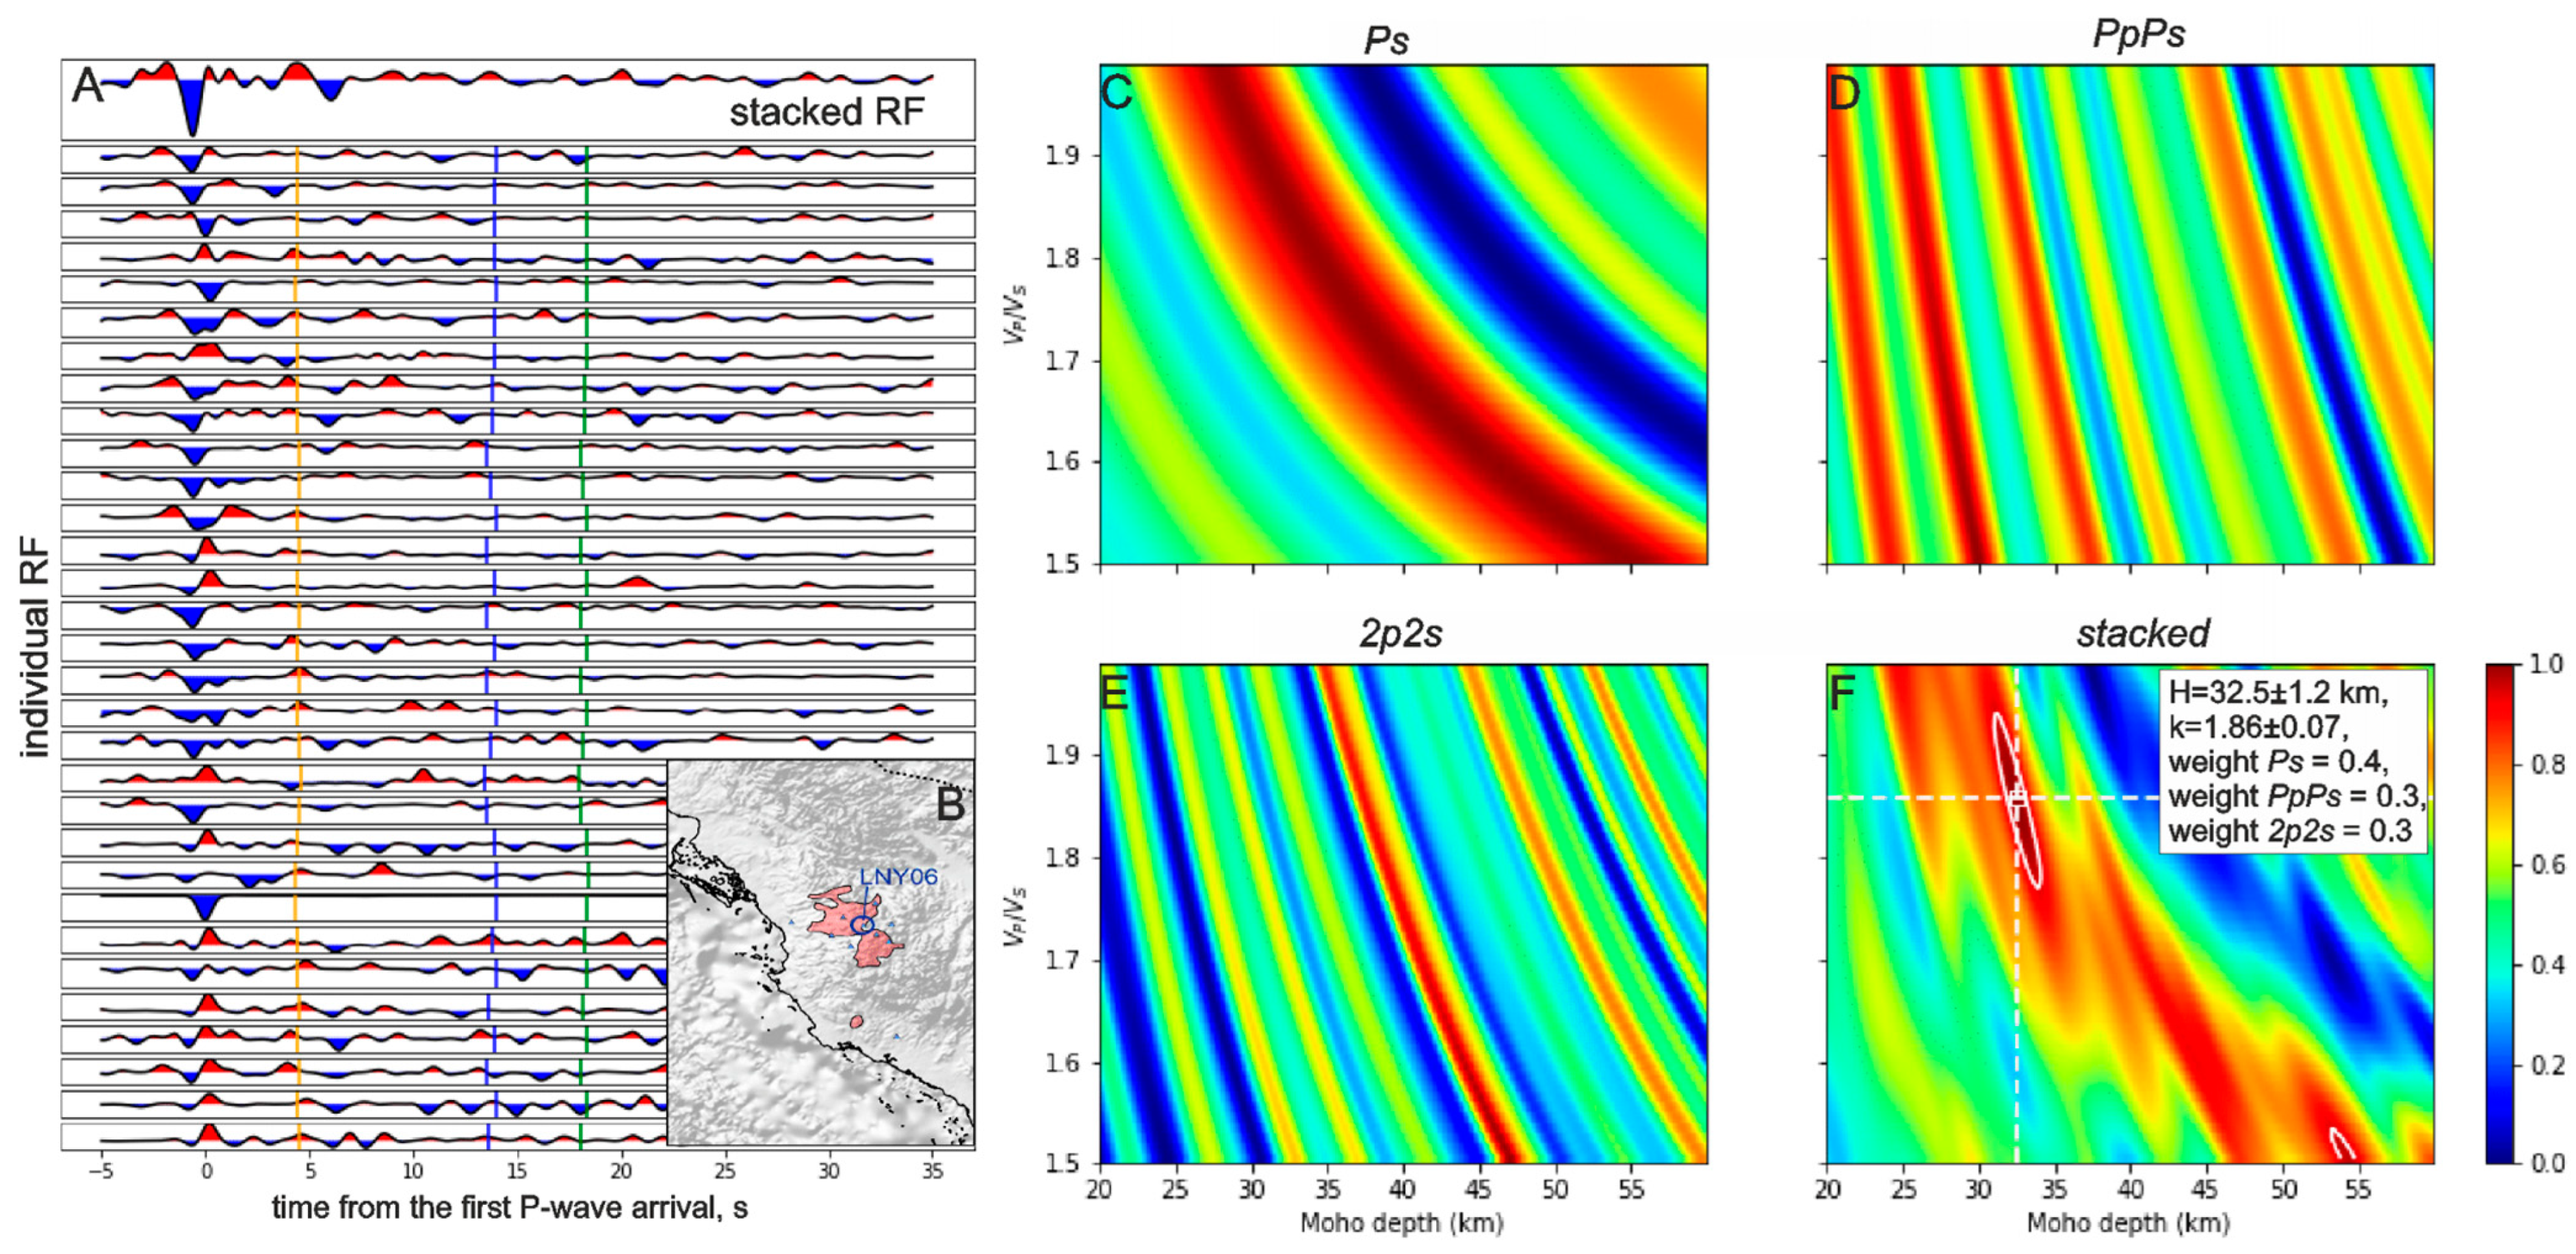
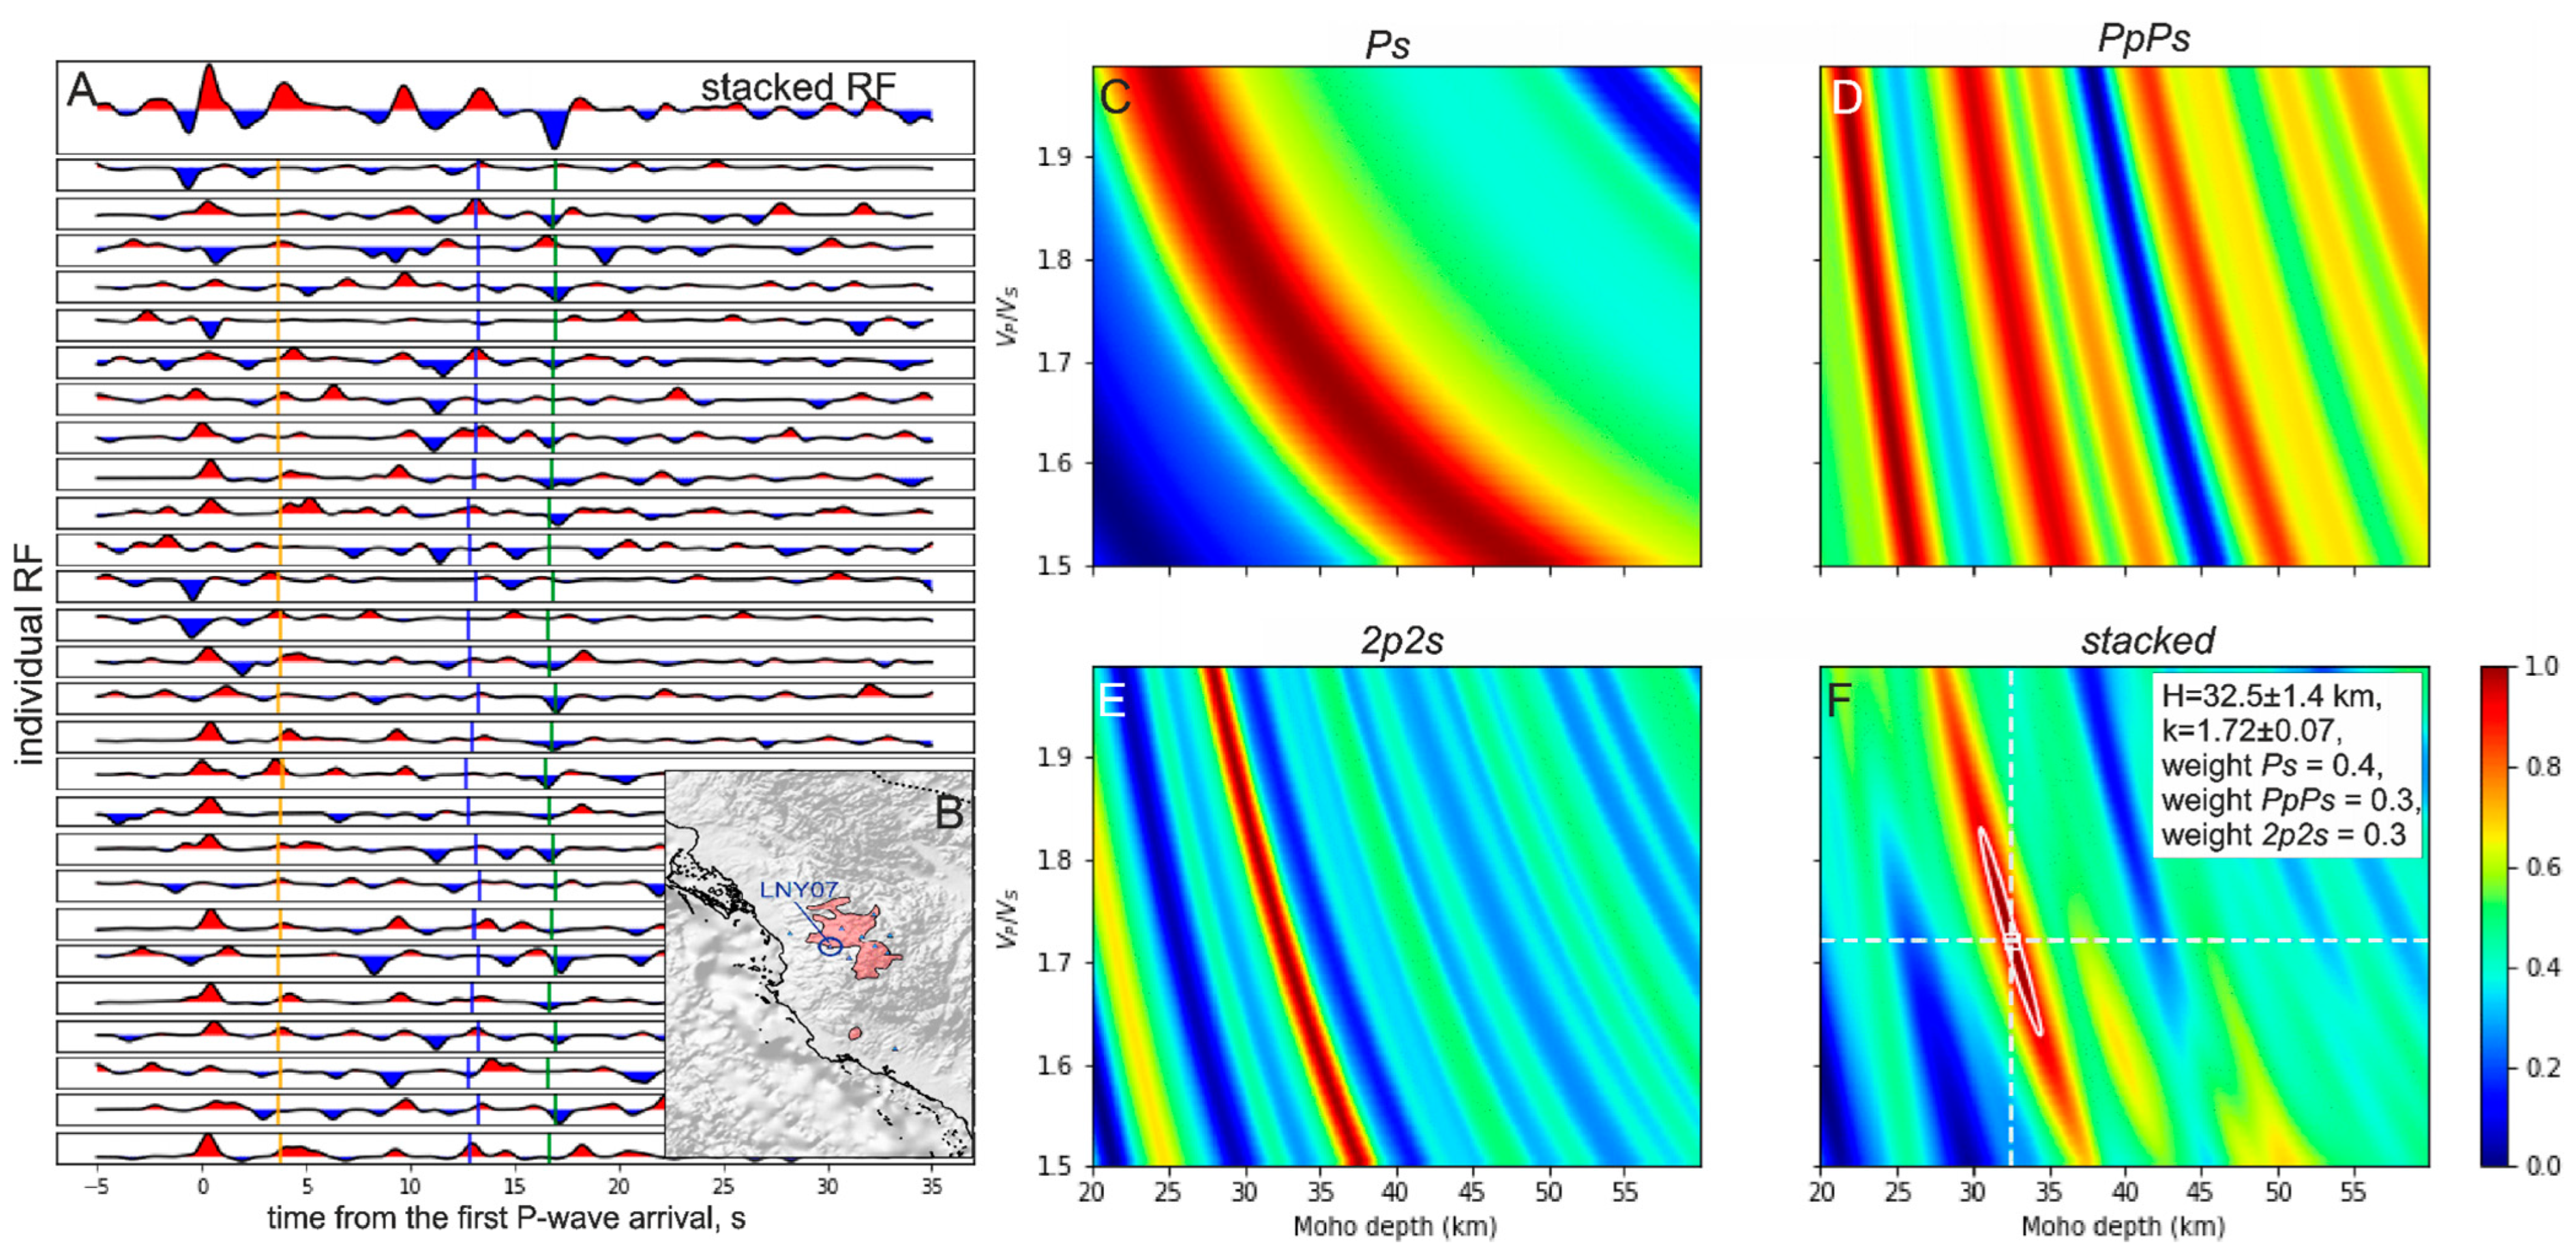
Examples of the H-k stacking for six stations corresponding to different types of structures are presented in Figure 4, Figure 5, Figure 6, Figure 7, Figure 8 and Figure 9. In each case, in panel A, we show the individual receiver functions corresponding to different events ranged according to the back azimuth. Note that most of the events occurred in an azimuthal segment of approximately 90 degrees between the northern and eastern directions. Only a few events, normally corresponding to the four to six upper lines in the panel, are located in other azimuthal segments. Unfortunately, this distribution is not favorable to identify any slope in the Moho interface. For each receiver function, we present the theoretical arrival times of the three phases taken into consideration: Ps, PpPs, and 2p2s by red, blue, and green hatches, respectively. The upper trace in panel A corresponds to the averaging of all receiver functions for the selected station. Panels C, D, and E present the grid search results for each of the Ps, PpPs, and 2p2s phases in coordinates of the Moho depth (H) versus Vp/Vs ratio (k). The panel F shows the final result of averaging with predefined weights. The most probable solution for H and k is highlighted by the white dashed lines. The numerical values of the H and k, as well as the weight values used for summation are presented in panel F.
Figure 4 demonstrates the results of H-k stacking for the station ARSS located at the northeastern margin of the Arabian Shield far from the coastal areas of the Red Sea. Here, we observe clear Ps, PpPs, and 2p2s phases in most of individual traces and almost perfectly revealing these phases in the summary trace. In the grid search plots, we see that these three phases create clearly distinguishable linear zones that cross in one point in the summary plot, which gives us an unambiguous determination for the H and k parameters. In this case, the estimated Moho depth is 43 km, and the Vp/Vs ratio is 1.67. Note that the similar high quality is achieved in most of the stations located in central parts of the Arabian Peninsula.
The next example of the H-k stacking in Figure 5 corresponds to the station NAMS located in the southern part of the study area in a mountarian region at the distance of ~100 km from the coast. Same as in the previous case, the grid search provides unambiguous intersections of all of the three maxima corresponding to the different phases. However, in panel A, the PpPs and 2p2s phases are less clear, probably because of too strong amplitude of the signal at zero time corresponding to the first arrival of the P wave. In this case, the Moho depth is equal to 43 km, and the Vp/Vs ratio is equal to 1.67. Similarly clear results were obtained for the other stations in the same area.
The other two examples correspond to two stations located in the area of Harrat–Lunayyir which is one of the youngest harrats in Saudi Arabia with a lot of relatively fresh cinder cones with the ages of less than 100 ka [14]. The most recent seismic unrest, probably associated with dike intrusions, occurred in 2009; though, without any magmatic eruption on the surface. In the cases of both stations presented in Figure 6 and Figure 7, we observe rather clear Ps and 2p2s phases, but more scattered PpPs phase. In Panel A, we can see that the target phases appear to be slightly biased with respect to the reference times, which can be explained by highly heterogeneous crustal structures in this area. Nevertheless, for both stations, in the summary traces, we clearly reveal the three target phases, which allows us to determine unambiguously the absolute probability maxima corresponding to optimal values of H and k. Note that in these two locations, the derived Moho depths appear to be identical and equal to 32.5 km, whereas the Vp/Vs ratios are significantly different: 1.86 and 1.72. The other stations in the Lunayyir area can be clearly separated in two groups with high and low Vp/Vs ratio. The interpretation of this result will be given in the Discussion section.
In Figure 8, we present another example of performing the H-k stacking in an area of recent magmatic activity for the station RHT01 located in the northern part of Harrat Rahat. This area represents one of the most active parts of this large basaltic field where at least two large historic eruptions in 641 CE and 1256 CE took place. In the individual receiver functions in panel A, we see at least two peaks at the times of ~0.8 s and 2.5 s that precede the presumed Ps phase at the time of ~4.5 s. We propose that these two phases correspond to highly contrasted interfaces in the crust associated with the accumulation of a large volume of magmatic material in the upper and middle crust. In comparison with the high magnitude of these shallow phases, the PpPs and 2p2s phases are less prominent. In addition, there are several additional peaks that might be associated with other multiple waves and that makes identification of our target phases more difficult. Nevertheless, in the H-k stacking panels, we can reveal three phases that cross each other in approximately one point giving us the most probable estimate for H and k ratio. We see that in this location, the Moho depth is equal to 35.2 km and Vp/Vs = 1.79. It should be noted that this value of Vp/Vs ratio for this station appears to be highest among all other stations in the area of Harrat–Rahat. At the same time, similarly as was observed for Harrat–Lunayyir, the Moho depths in all locations were very similar. The interpretation of this information will be provided in the Discussion section.
The final example shown in Figure 9 presents the results of the H-k stacking for station YNBS located in a coastal area of the Red Sea. In this case, the initial receiver functions in Panel A appear to be strongly scattered, which can be caused by strongly heterogeneous crustal structure and non-flat geometry of the Moho interface. We see that for some events, the target phases are regularly shifted to the positive or negative directions. In the summary receiver function for this station, we can clearly reveal the Ps phase, but the PpPs and 2p2s phases can be confused with several other peaks. Nevertheless, the H-k stacking gives us a possibility to identify three phases that cross in one point and likely correspond to the target phases. In the final summary plot, the absolute maximum of the probability function is determined unambiguously and corresponds to the Moho depth of 25.5 km and Vp/Vs = 1.87. Similar or even smaller values of crustal thickness were determined for most of the other stations in the coastal areas. However, we should admit that for some stations located close to the shore of the Red Sea, the receiver functions were too scattered that prevented finding reliable solutions. One of the main reasons for such scattering could be a strong slope of the Moho interface, which makes the seismic records for ray paths arriving from different directions non-coherent.
In Table 1, we present the final solutions for the stations for which we could obtain stable solutions with the use of the H-k stacking. In the next section, we give our interpretation of these results and compare them with other geophysical data from the literature.

3.2. Moho Depth and Vp/Vs Ratio

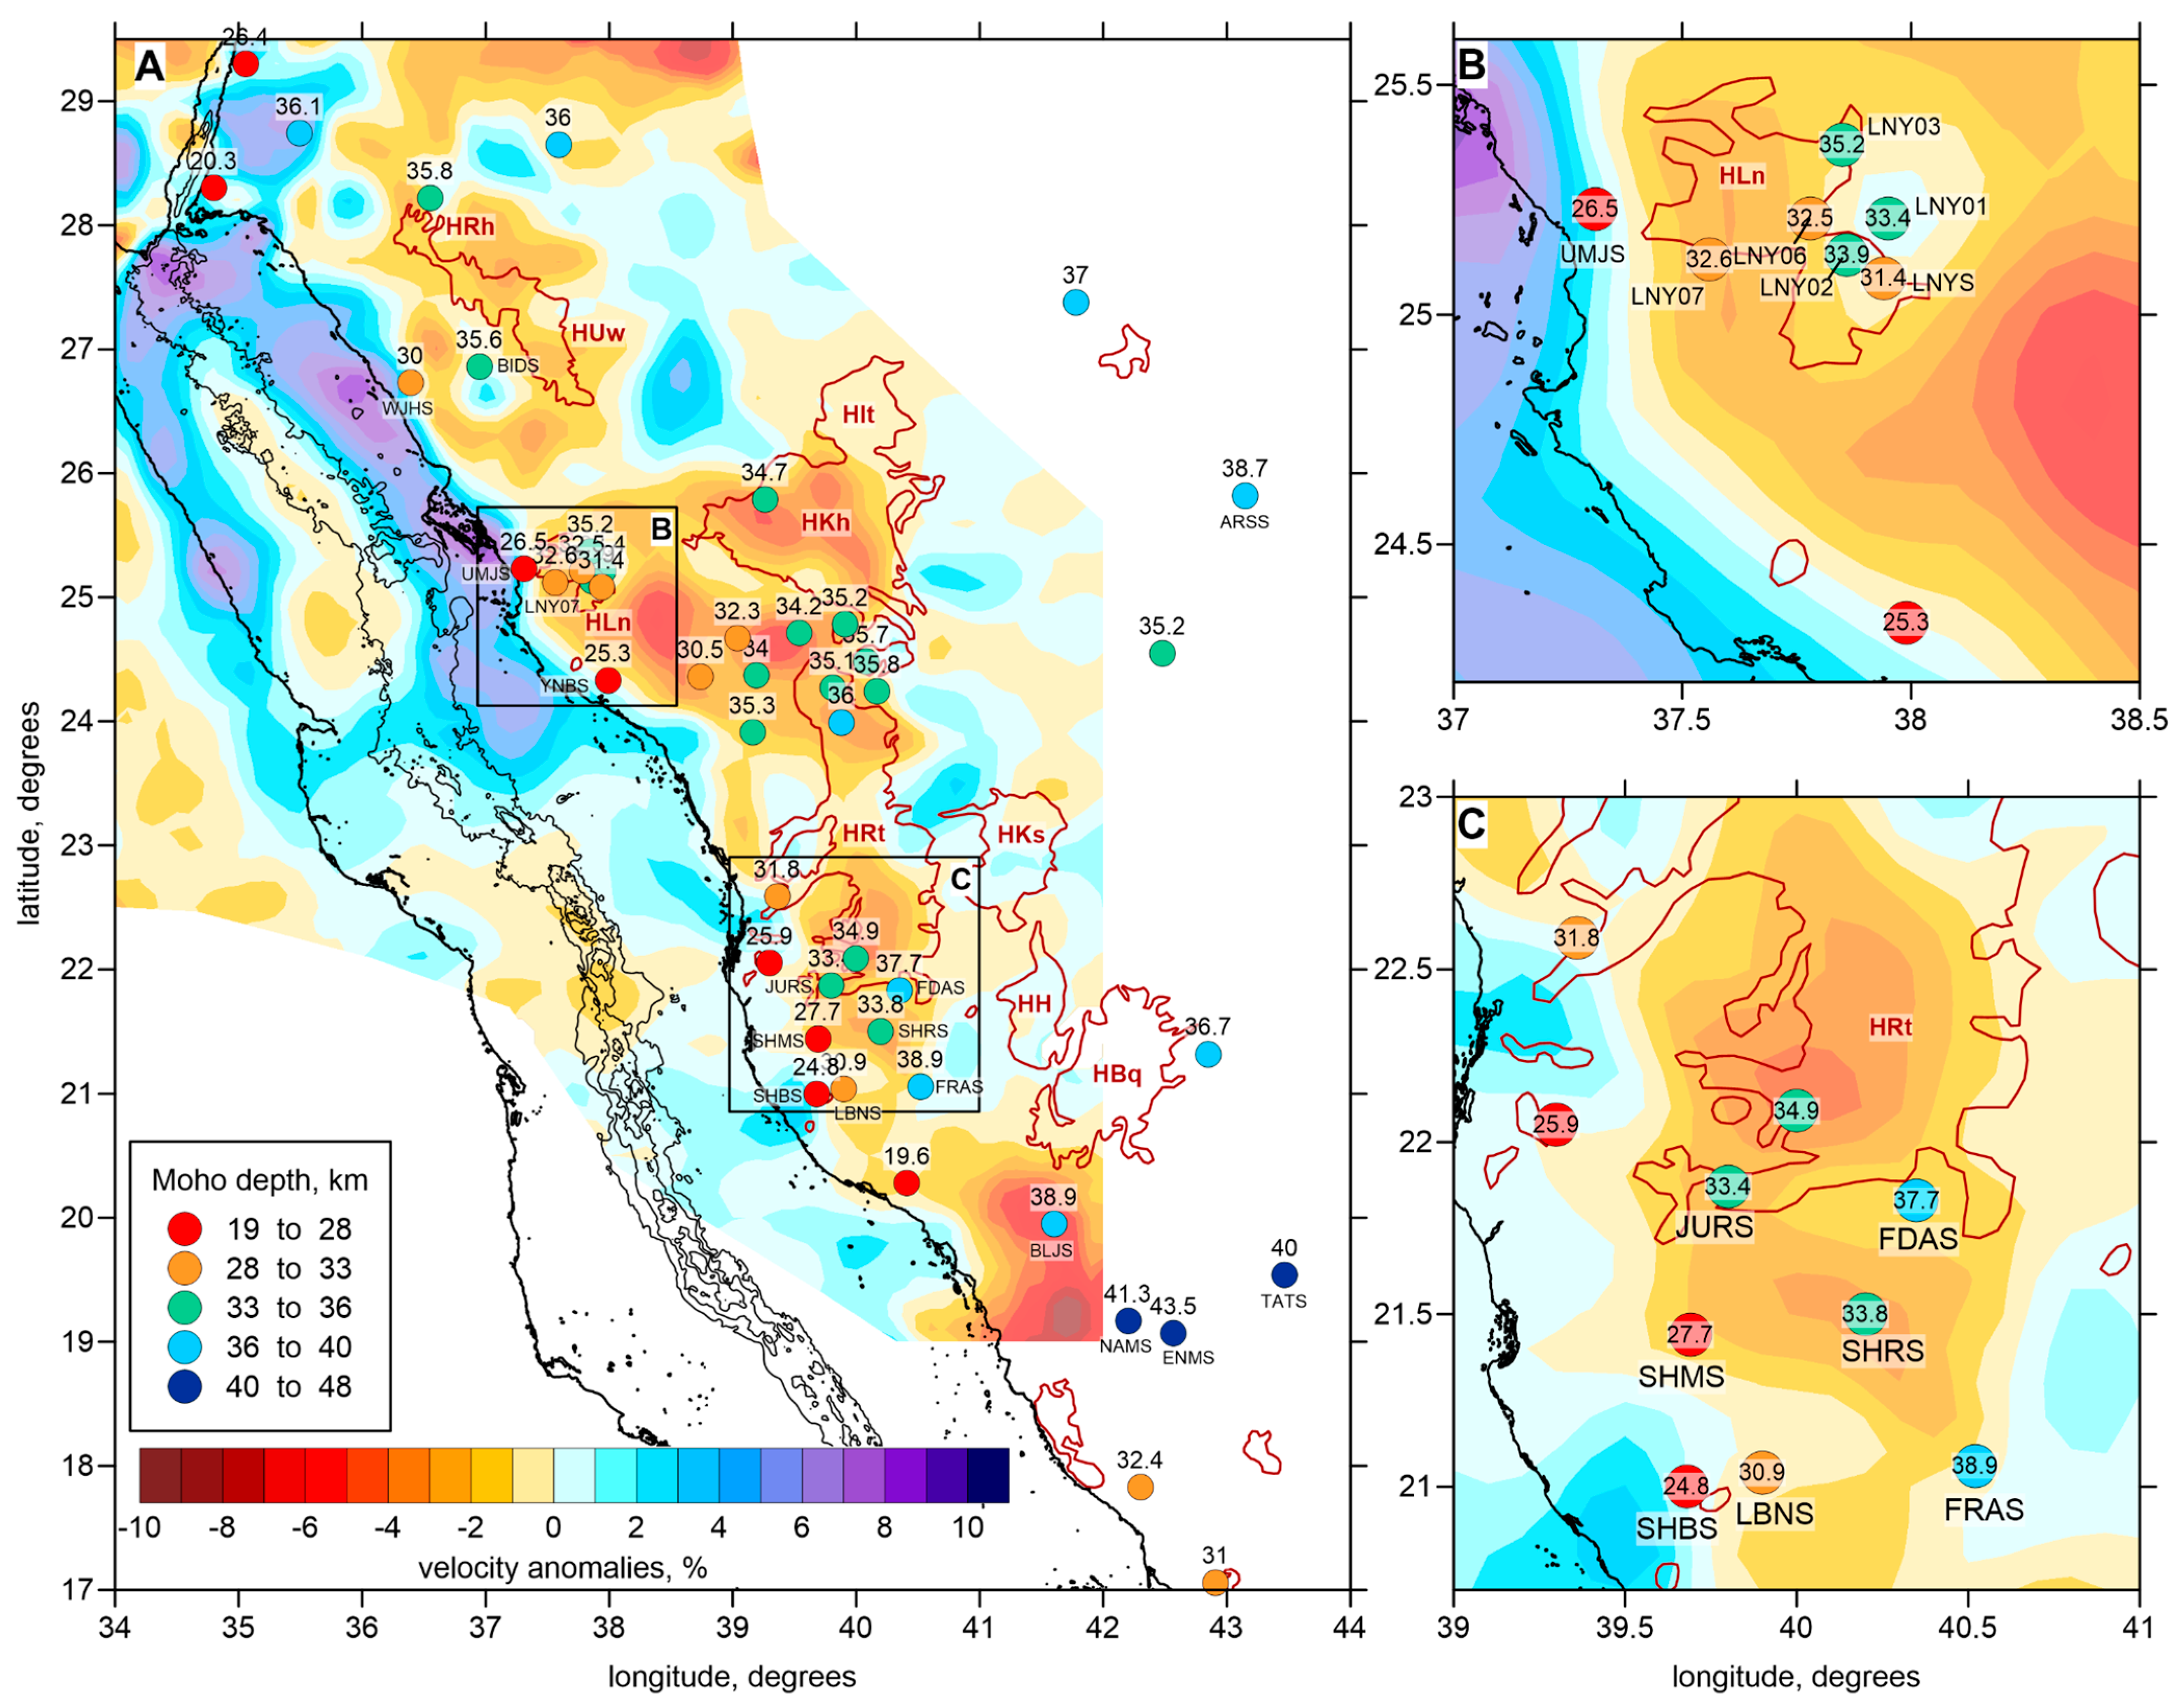
Figure 10 and Figure 11 present the summary results for the Moho depth and average Vp/Vs ratio in the crust derived in this study based on the H-k stacking technique. In addition, in the background, we present the P wave velocity anomalies at the depth of 30 km derived from the tomographic inversion of body-wave data from regional seismicity recorded by seismic stations in Saudi Arabia and Egypt [4]. These anomalies may indirectly reflect the variations of the crustal thickness: thinner crust at this depth is naturally associated with higher velocities, and thicker crust is mainly exhibited as low-velocity anomalies. However, it should be admitted that besides the crustal thickness, there are other factors affecting the seismic velocities, such as variations of the composition, temperature, presence of fluids etc.
In Figure 10, we can observe a general correlation of the Moho depth values derived from the H-k stacking and velocity anomalies at 30 km depth. Most points with the values of more than 32 km are located inside “red” anomalies, whereas the points with thinner crust are mostly attached to the “blue” areas or transitional areas between high and low velocities. The largest values of the crustal thickness of 38–43 km are observed in the eastern part of the Arabian Shield (Station ARSS with the Moho depth of 38.7 km, see also Figure 4) and at four stations in the southernmost part of the study area (39–43.5 km at stations BLJS, NAMS, ENMS, and TATS), where the highest topography is observed. These points correspond to the mature Precambrian elements of the lithosphere, which constituted the major cores of the shield. The other areas with intermediate thickness of the crust (32–38 km) may represent the transitional areas between the accreted blocks.
Below stations located near the coast of the Red Sea, the crust appears to be much thinner compared to the interplate areas and varies from 25 to 30 km (stations WJHS, UNJS, YNBS, SHMS, and SHBS). These values are still too large for the oceanic type of the crust, as expected in the basin of the Red Sea, and can be classified as transitional type. Unfortunately, our network is not dense enough to evaluate the slope of the Moho thinning. For example, between stations WJHS and BIDS in the northern part of the study area, the distance is ~50 km and crustal thickness change is 5.6 km, which demonstrates a rather weak slope. Between stations UNJS and LNY07 near Harrat–Lunayyir, the distance is ~20 km, and crustal depth change is 6.1 km, which presumes a faster gradient, but still it cannot be considered as an abrupt jump at the Moho. Similar slopes of the Moho depth variations are observed near the southern part of Harrat–Rahat (stations LBNS, SHBS, SHRS, SHMS, JURS, FDAS, and FRAS).
In general, our solutions for the Moho based on the H-k stacking are fairly well consistent with determinations using other techniques presented in previous studies [45,49,50,51,52] which confirm the high confidence of this parameter.
Less obvious features are observed in the distribution of the Vp/Vs ratio estimated from the H-k stacking (Figure 11). We observe a significant variation of this parameter (from 1.6 to 1.88), which is apparently not directly associated with large structural units in the region. Both in the coastal and in intraplate areas, we observe points with low and high values of the Vp/Vs ratio. Different values of this parameter are observed both inside and outside harrats. For example, in the Harrat–Lunayyir area, the highest Vp/Vs = 1.86 is observed at station LNY06 (Figure 11B and Figure 12). The values of 1.83, 1.78 and 1.78 are observed at LNYS, LNY02, and LNY01, respectively, and they appear to be higher than those at stations in marginal areas. Note that these four stations are located in the area with the highest concentration of monogenic cones with the age of less than 100 ka indicated by the red crosses in Figure 12 [14,20]. The station LNY06, where we determined the highest Vp/Vs, is located exactly above the area of a strong seismic unrest observed in 2009 (white points in Figure 12), which was associated with an intrusion of magmatic material [19]. For the same area, based on the local earthquake tomography, [20] found a large anomaly of high Vp/Vs ratio at depths of more than 10 km (Figure 12), which was interpreted as a steady magma reservoir that is responsible for episodic monogenic eruptions in this area. The present receiver function analysis confirms this hypothesis. On the other hand, the stations UMJS, LNY07 and LNY03 in the same region are located in areas of weaker manifestations of recent volcanism and exhibit relatively low Vp/Vs ratio in the range of 1.62–1.74.
For the Harrat–Rahat, we observe a similar situation. The station RHT01 with Vp/Vs = 179 is located in its northern part in the field called Harrat–Rashid (or Al-Madinah) (e.g., [68]), which was most active in the Holocene. It was an area where a large eruption occurred in 1256 CE with ~0.5 km3 of basaltic lava that propagated to distances of ~23 km from the vent and that stopped at only 4 km from the border of the Holy city of Al-Madinah. An earlier eruption occurred in approximately the same area in 641 CE [69]. Ref. [68] reported a number of other eruptions in the Al-Madinah area with the ages of less than 300 ka. The southern parts of Harrat–Rahat appear to be less active. The fact that the station RHT01 has the highest Vp/Vs ratio among other stations in this area and is located in this most active part of Harrat–Rahat may indicate the existence of large magmatic sources in the crust that affect the velocities of the converted waves. However, the existing data do not give any possibility to quantify the locations and properties of such magma reservoirs, as the nearly vertical teleseismic ray paths only give integral properties of all factors in the crust. The other stations located around this zone (e.g., RHT02, RHT03, RHT04) exhibit relatively low Vp/Vs ratios. Note that for all these stations, the quality of determinations of the Moho depth and Vp/Vs ratio was generally higher than in other areas. The fact that for all these stations the Moho depth was almost constant indicates that strongly variable Vp/Vs cannot be due to misinterpretation of the H-k stacking diagrams and appears to be a robust feature.
For the stations along the coast, we also observe strong variations of the Vp/Vs ratio from 1.61 to 1.88. The high values of the Vp/Vs ratio in the coastal areas might be caused by the existence of deep fault zones strongly saturated by water from the Red Sea that dissect some blocks near the coast. However, we did not find any direct proof for this assumption, which remains highly speculative.

4. Conclusions

In this article, with the use of the method of H-k stacking of receiver functions, we have determined the values of the Moho depth and average crustal Vp/Vs ratio below a number of seismic stations in the Arabian Shield. The obtained variations of the Moho depth appear to be consistent with seismic velocity anomalies at 30 km depth determined by [4], which can be used as an argument for high confidence of both results. We have also confirmed the findings of other authors based on the receiver functions and other geophysical methods that the Moho depth varies from ~25 km at the coast of the Red Sea to ~40 km below the central part of the Arabian Peninsula. Another area where the crustal thickness exceeds 40 km is located in the mountain area to the south of Harrat–al Buqum at a distance of only ~100 km from the coast of the Red Sea.
Our results did not reveal an abrupt change of crustal thickness in the coastal area of the Red Sea, as was previously predicted by [4], who proposed the existence of the transitional type of the crust with sharp boundaries. The values of the Moho depth of 25 km derived in this study for the coastal areas appear to be larger than expected for the transitional crust. This result might be due to the fact that the stations are located at some distances (10–15 km) from the coast, whereas the sharp contrast could occur directly below the coast or even offshore. To determine such features, denser networks are required, and they should be placed closer to the coast or even offshore.
The derived distribution of the Vp/Vs ratio exhibits much more contrasted variations compared to the Moho depth. In relatively small areas for stations located close to each other, the Vp/Vs can range from very low to very high values. It was found, for example, that in Harrat–Lunayyir, the stations with high Vp/Vs ratio of up to 1.8 are located in areas with a large number of monogenic cones with the ages of less that 100 ka and in a zone where a strong seismic unrest occurred in 2009. The stations with low Vp/Vs are usually located outside such areas. These findings appear to be consistent with the results of the local earthquake tomography by [20], which mapped the crustal reservoir with high Vp/Vs ratio approximately in the same location as the distributions of stations with high Vp/Vs ratio. A similar feature can be identified for Harrat–Rahat for a station with high Vp/Vs ratio that is located in the area of most active recent volcanism, where at least two historical eruptions occurred at 641 CE and 1256 CE. However, the available stations are too sparse in this region to reveal any information on the shape and physical properties of the magma-related anomaly. Therefore, it should be combined with the results of seismic tomography and other geophysical methods.

Author Contributions

Conceptualization, I.K.; Data curation, S.I.Q. and A.I.; Formal analysis, N.A.A., S.E.K. and A.J.; Investigation, A.I.; Project administration, I.K.; Supervision, I.K.; Visualization, A.I. and I.K.; Writing—original draft, I.K. All authors have read and agreed to the published version of the manuscript.

Funding

This research was gratefully supported by Researchers Supporting Project number (RSP2022R432), King Saud University, Riyadh, Saudi Arabia.

Conflicts of Interest

The authors declare no conflict of interest.

References

  1. Augustin, N.; Devey, C.W.; van der Zwan, F.M.; Feldens, P.; Tominaga, M.; Bantan, R.A.; Kwasnitschka, T. The Rifting to Spreading Transition in the Red Sea. Earth Planet Sci. Lett. 2014, 395, 217–230. [Google Scholar] [CrossRef]
  2. Martinez, F.; Cochran, J.R. Geothermal Measurements in the Northern Red Sea: Implications for Lithospheric Thermal Structure and Mode of Extension during Continental Rifting. J. Geophys. Res. Solid Earth 1989, 94, 12239–12265. [Google Scholar] [CrossRef] [Green Version]
  3. Stern, R.J.; Johnson, P.R. Constraining the Opening of the Red Sea: Evidence from the Neoproterozoic Margins and Cenozoic Magmatism for a Volcanic Rifted Margin. Geol. Setting Palaeoenvironment Archaeol. Red Sea 2018, 53–79. [Google Scholar] [CrossRef]
  4. El Khrepy, S.; Koulakov, I.; Gerya, T.; Al-Arifi, N.; Alajmi, M.S.; Qadrouh, A.N. Transition from Continental Rifting to Oceanic Spreading in the Northern Red Sea Area. Sci. Rep. 2021, 11, 1–7. [Google Scholar] [CrossRef]
  5. Schmidt, D.L.; Hadley, D.G.; Stoeser, D.B. Late Proterozoic Crustal History of the Arabian Shield, Southern Najd Province, Kingdom of Saudi Arabia. Evol. Miner. Arab.-Nubian Shield Proc. Symp. 1979, 2, 41–58. [Google Scholar] [CrossRef]
  6. Fleck, R.J.; Greenwood, W.R.; Hadley, D.G.; Anderson, R.E.; Schmidt, D.L.; Menard, H.W. Rubidium-Strontium Geochronology and Plate-Tectonic Evolution of the Southern Part of the Arabian Shield; Professional Paper; USGS: Reston, VA, USA, 1980. [CrossRef] [Green Version]
  7. Stern, R.J.; Johnson, P. Continental Lithosphere of the Arabian Plate: A Geologic, Petrologic, and Geophysical Synthesis. Earth Sci. Rev. 2010, 101, 29–67. [Google Scholar] [CrossRef]
  8. Brown, G.F. Tectonic Map of the Arabian Peninsula; Open-File Report 72-52; US Geological Survey: Reston, VA, USA, 1972. [CrossRef]
  9. Powers, R.W.; Ramirez, L.F.; Redmond, C.D.; Elberg, L.E., Jr. Geology of the Arabian Peninsula: Sedimentary Geology of Saudi Arabia; Professional Paper; United States Government Printing Office: Washington, DC, USA, 1966. [CrossRef] [Green Version]
  10. Koptev, A.; Gerya, T.; Calais, E.; Leroy, S.; Burov, E. Afar Triple Junction Triggered by Plume-Assisted Bi-Directional Continental Break-Up. Sci. Rep. 2018, 8, 1–7. [Google Scholar] [CrossRef]
  11. Bosworth, W.; Huchon, P.; McClay, K. The Red Sea and Gulf of Aden Basins. J. Afr. Earth Sci. 2005, 43, 334–378. [Google Scholar] [CrossRef]
  12. Cochran, J.R. Northern Red Sea: Nucleation of an Oceanic Spreading Center within a Continental Rift. Geochem. Geophys. Geosyst. 2005, 6, 3006. [Google Scholar] [CrossRef] [Green Version]
  13. Camp, V.E.; Roobol, M.J. Upwelling Asthenosphere beneath Western Arabia and Its Regional Implications. J. Geophys. Res. Solid Earth 1992, 97, 15255–15271. [Google Scholar] [CrossRef]
  14. Duncan, R.A.; Al-Amri, A.M. Timing and Composition of Volcanic Activity at Harrat Lunayyir, Western Saudi Arabia. J. Volcanol. Geotherm. Res. 2013, 260, 103–116. [Google Scholar] [CrossRef]
  15. Mukhopadhyay, M.; Mukhopadhyay, B.; Mogren, S.; Nandi, B.K.; Ibrahim, E. Regional Significance of Crustal and Sub-Crustal Rheological Heterogeneities beneath the Harrat Lunayyir and Their Continuity into the Neighboring Harrats, Western Saudi Arabia—Perspectives of the Afar Plume Activity. J. Afr. Earth Sci. 2022, 186, 104432. [Google Scholar] [CrossRef]
  16. Ebinger, C.J.; Sleep, N.H. Cenozoic Magmatism throughout East Africa Resulting from Impact of a Single Plume. Nature 1998, 395, 788–791. [Google Scholar] [CrossRef]
  17. El Khrepy, S.; Koulakov, I.; Al-Arifi, N. Crustal and Uppermost Mantle Structure beneath the Continental Rifting Area of the Gulf of Suez from Earthquake Tomography. Tectonophysics 2016, 668–669, 92–104. [Google Scholar] [CrossRef]
  18. Camp, V.E.; Hooper, P.R.; Roobol, M.J.; White, D.L. The Madinah Eruption, Saudi Arabia: Magma Mixing and Simultaneous Extrusion of Three Basaltic Chemical Types. Bull. Volcanol. 1987, 49, 489–508. [Google Scholar] [CrossRef]
  19. Pallister, J.S.; McCausland, W.A.; Jónsson, S.; Lu, Z.; Zahran, H.M.; el Hadidy, S.; Aburukbah, A.; Stewart, I.C.F.; Lundgren, P.R.; White, R.A.; et al. Broad Accommodation of Rift-Related Extension Recorded by Dyke Intrusion in Saudi Arabia. Nat. Geosci. 2010, 3, 705–712. [Google Scholar] [CrossRef]
  20. Koulakov, I.; El Khrepy, S.; Al-Arifi, N.; Kuznetsov, P.; Kasatkina, E. Structural Cause of a Missed Eruption in the Harrat Lunayyir Basaltic Field (Saudi Arabia) in 2009. Geology 2015, 43, 395–398. [Google Scholar] [CrossRef]
  21. Ebinger, C.; Belachew, M. Active Passive Margins. Nat. Geosci. 2010, 3, 670–671. [Google Scholar] [CrossRef]
  22. Ritsema, J.; van Heijst, H.J.; Woodhouse, J.H. Complex Shear Wave Velocity Structure Imaged beneath Africa and Iceland. Science 1999, 286, 1925–1931. [Google Scholar] [CrossRef]
  23. Rodgers, A.J.; Walter, W.R.; Mellors, R.J.; Al-Amri, A.M.S.; Zhang, Y.S. Lithospheric Structure of the Arabian Shield and Platform from Complete Regional Waveform Modelling and Surface Wave Group Velocities. Geophys. J. Int. 1999, 138, 871–878. [Google Scholar] [CrossRef] [Green Version]
  24. Ritsema, J.; van Heijst, H. New Seismic Model of the Upper Mantle beneath Africa. Geology 2000, 28, 63–66. [Google Scholar] [CrossRef]
  25. Debayle, E.; Lévêque, J.J.; Cara, M. Seismic Evidence for a Deeply Rooted Low-Velocity Anomaly in the Upper Mantle beneath the Northeastern Afro/Arabian Continent. Earth Planet. Sci. Lett. 2001, 193, 423–436. [Google Scholar] [CrossRef]
  26. Sebai, A.; Stutzmann, E.; Montagner, J.P.; Sicilia, D.; Beucler, E. Anisotropic Structure of the African Upper Mantle from Rayleigh and Love Wave Tomography. Phys. Earth Planet. Inter. 2006, 155, 48–62. [Google Scholar] [CrossRef]
  27. Montagner, J.P.; Marty, B.; Stutzmann, E.; Sicilia, D.; Cara, M.; Pik, R.; Lévêque, J.J.; Roult, G.; Beucler, E.; Debayle, E. Mantle Upwellings and Convective Instabilities Revealed by Seismic Tomography and Helium Isotope Geochemistry beneath Eastern Africa. Geophys. Res. Lett. 2007, 34. [Google Scholar] [CrossRef] [Green Version]
  28. Chang, S.J.; van der Lee, S. Mantle Plumes and Associated Flow beneath Arabia and East Africa. Earth Planet. Sci. Lett. 2011, 302, 448–454. [Google Scholar] [CrossRef]
  29. Ekström, G. A Global Model of Love and Rayleigh Surface Wave Dispersion and Anisotropy, 25-250 s. Geophys. J. Int. 2011, 187, 1668–1686. [Google Scholar] [CrossRef] [Green Version]
  30. Park, Y.; Nyblade, A.A.; Rodgers, A.J.; Al-Amri, A.; Park, Y.; Nyblade, A.A.; Rodgers, A.J.; Al-Amri, A. S Wave Velocity Structure of the Arabian Shield Upper Mantle from Rayleigh Wave Tomography. Geochem. Geophys. Geosystems 2008, 9, 1213. [Google Scholar] [CrossRef]
  31. Yao, Z.; Mooney, W.D.; Zahran, H.M.; Youssef, S.E.H. Upper Mantle Velocity Structure beneath the Arabian Shield from Rayleigh Surface Wave Tomography and Its Implications. J. Geophys. Res. Solid Earth 2017, 122, 6552–6568. [Google Scholar] [CrossRef]
  32. Ritzwoller, M.H.; Barmin, M.P.; Villaseñor, A.; Levshin, A.L.; Engdahl, E.R. Pn and Sn Tomography across Eurasia to Improve Regional Seismic Event Locations. Tectonophysics 2002, 358, 39–55. [Google Scholar] [CrossRef]
  33. Al-Lazki, A.I.; Sandvol, E.; Seber, D.; Barazangi, M.; Turkelli, N.; Mohamad, R. Pn Tomographic Imaging of Mantle Lid Velocity and Anisotropy at the Junction of the Arabian, Eurasian and African Plates. Geophys. J. Int. 2004, 158, 1024–1040. [Google Scholar] [CrossRef]
  34. Koulakov, I. High-Frequency P and S Velocity Anomalies in the Upper Mantle beneath Asia from Inversion of Worldwide Traveltime Data. J. Geophys. Res. Solid Earth 2011, 116, 4301. [Google Scholar] [CrossRef] [Green Version]
  35. Koulakov, I.; Burov, E.; Cloetingh, S.; El Khrepy, S.; Al-Arifi, N.; Bushenkova, N. Evidence for Anomalous Mantle Upwelling beneath the Arabian Platform from Travel Time Tomography Inversion. Tectonophysics 2016, 667, 176–188. [Google Scholar] [CrossRef]
  36. Stork, A.L.; Stuart, G.W.; Henderson, C.M.; Keir, D.; Hammond, J.O.S. Uppermost Mantle (Pn) Velocity Model for the Afar Region, Ethiopia: An Insight into Rifting Processes. Geophys. J. Int. 2013, 193, 321–328. [Google Scholar] [CrossRef] [Green Version]
  37. Hammond, J.O.S.; Kendall, J.M.; Stuart, G.W.; Ebinger, C.J.; Bastow, I.D.; Keir, D.; Ayele, A.; Belachew, M.; Goitom, B.; Ogubazghi, G.; et al. Mantle Upwelling and Initiation of Rift Segmentation beneath the Afar Depression. Geology 2013, 41, 635–638. [Google Scholar] [CrossRef] [Green Version]
  38. Korostelev, F.; Basuyau, C.; Leroy, S.; Tiberi, C.; Ahmed, A.; Stuart, G.W.; Keir, D.; Rolandone, F.; al Ganad, I.; Khanbari, K.; et al. Crustal and Upper Mantle Structure beneath South-Western Margin of the Arabian Peninsula from Teleseismic Tomography. Geochem. Geophys. Geosystems 2014, 15, 2850–2864. [Google Scholar] [CrossRef] [Green Version]
  39. Benoit, M.H.; Nyblade, A.A.; VanDecar, J.C.; Gurrola, H. Upper Mantle P Wave Velocity Structure and Transition Zone Thickness beneath the Arabian Shield. Geophys. Res. Lett. 2003, 30. [Google Scholar] [CrossRef]
  40. Abdelwahed, M.F.; El-Masry, N.; Moufti, M.R.; Kenedi, C.L.; Zhao, D.; Zahran, H.; Shawali, J. Imaging of Magma Intrusions beneath Harrat Al-Madinah in Saudi Arabia. J. Asian Earth Sci. 2016, 120, 17–28. [Google Scholar] [CrossRef]
  41. Vinnik, L.; Kumar, M.R.; Kind, R.; Farra, V. Super-Deep Low-Velocity Layer beneath the Arabian Plate. Geophys. Res. Lett. 2003, 30, 1415. [Google Scholar] [CrossRef]
  42. El Khrepy, S.; Koulakov, I.; Al-Arifi, N.; Petrunin, A.G. Seismic Structure beneath the Gulf of Aqaba and Adjacent Areas Based on the Tomographic Inversion of Regional Earthquake Data. Solid Earth 2016, 7, 965–978. [Google Scholar] [CrossRef] [Green Version]
  43. Mooney, W.D.; Gettings, M.E.; Blank, H.R.; Healy, J.H. Saudi Arabian Seismic-Refraction Profile: A Traveltime Interpretation of Crustal and Upper Mantle Structure. Tectonophysics 1985, 111, 173–246. [Google Scholar] [CrossRef]
  44. Gettings, M.E.; Blank, H.R.; Mooney, W.D.; Healey, J.H. Crustal Structure of Southwestern Saudi Arabia. J. Geophys. Res. Solid Earth 1986, 91, 6491–6512. [Google Scholar] [CrossRef]
  45. El-Isa, Z.; Mechie, J.; Prodehl, C.; Makris, J.; Rihm, R. A Crustal Structure Study of Jordan Derived from Seismic Refraction Data. Tectonophysics 1987, 138, 235–253. [Google Scholar] [CrossRef]
  46. Al-Lazki, A.I.; Seber, D.; Sandvol, E.; Barazangi, M. A Crustal Transect across the Oman Mountains on the Eastern Margin of Arabia. GeoArabia 2002, 7, 47–78. [Google Scholar] [CrossRef]
  47. Mechie, J.; Ben-Avraham, Z.; Weber, M.H.; Götze, H.J.; Koulakov, I.; Mohsen, A.; Stiller, M. The Distribution of Moho Depths beneath the Arabian Plate and Margins. Tectonophysics 2013, 609, 234–249. [Google Scholar] [CrossRef]
  48. Tang, Z. Multi-Scale Inference of Lithospheric Seismic Structure in Saudi Arabia. Ph.D. Thesis, Kaust, Jeddah, Saudi Arabia, 2018. [Google Scholar]
  49. Al-Damegh, K.; Sandvol, E.; Barazangi, M. Crustal Structure of the Arabian Plate: New Constraints from the Analysis of Teleseismic Receiver Functions. Earth Planet Sci. Lett. 2005, 231, 177–196. [Google Scholar] [CrossRef] [Green Version]
  50. Tkalčić, H.; Pasyanos, M.E.; Rodgers, A.J.; Gök, R.; Walter, W.R.; Al-Amri, A. A Multistep Approach for Joint Modeling of Surface Wave Dispersion and Teleseismic Receiver Functions: Implications for Lithospheric Structure of the Arabian Peninsula. J. Geophys. Res. Solid Earth 2006, 111. [Google Scholar] [CrossRef] [Green Version]
  51. Blanchette, A.R.; Klemperer, S.L.; Mooney, W.D.; Zahran, H.M. Thickness of the Saudi Arabian Crust. Thick. Saudi Arab. 2020. [Google Scholar] [CrossRef]
  52. Tang, Z.; Julià, J.; Zahran, H.; Mai, P.M. The Lithospheric Shear-Wave Velocity Structure of Saudi Arabia: Young Volcanism in an Old Shield. Tectonophysics 2016, 680, 8–27. [Google Scholar] [CrossRef] [Green Version]
  53. Tang, Z.; Mai, P.M.; Julià, J.; Zahran, H. Shear Velocity Structure Beneath Saudi Arabia From the Joint Inversion of P and S Wave Receiver Functions, and Rayleigh Wave Group Velocity Dispersion Data. J. Geophys. Res. Solid Earth 2019, 124, 4767–4787. [Google Scholar] [CrossRef] [Green Version]
  54. Mai, P.M.; Julià, J.; Tang, Z. Crustal and upper-mantle structure beneath Saudi Arabia from receiver functions and surface wave analysis. In Geological Setting, Palaeoenvironment and Archaeology of the Red Sea; Springer: Berlin/Heidelberg, Germany, 2018; pp. 307–322. [Google Scholar] [CrossRef]
  55. Julià, J.; Ammon, C.J.; Herrmann, R.B. Lithospheric Structure of the Arabian Shield from the Joint Inversion of Receiver Functions and Surface-Wave Group Velocities. Tectonophysics 2003, 371, 1–21. [Google Scholar] [CrossRef]
  56. Hansen, S.E.; Rodgers, A.J.; Schwartz, S.Y.; Al-Amri, A.M.S. Imaging Ruptured Lithosphere beneath the Red Sea and Arabian Peninsula. Earth Planet. Sci. Lett. 2007, 259, 256–265. [Google Scholar] [CrossRef] [Green Version]
  57. Liu, L.; Tong, S.; Li, S.; Qaysi, S. Sp Receiver-Function Images of African and Arabian Lithosphere: Survey of Newly Available Broadband Data. Seismol. Res. Lett. 2020, 91, 1813–1819. [Google Scholar] [CrossRef]
  58. Al-Amri, A.M.S. The Crustal and Upper-Mantle Structure of the Interior Arabian Platform. Geophys. J. Int. 1999, 136, 421–430. [Google Scholar] [CrossRef] [Green Version]
  59. Al-Amri, A.M.; Gharib, A.A. Lithospheric Seismic Structure of the Eastern Region of the Arabian Peninsula. J. Geodyn. 2000, 29, 125–139. [Google Scholar] [CrossRef]
  60. Sandvol, E.; Seber, D.; Barazangi, M.; Vernon, F.; Mellors, R.; Al-Amri, A. Lithospheric Seismic Velocity Discontinuities beneath the Arabian Shield. Geophys. Res. Lett. 1998, 25, 2873–2876. [Google Scholar] [CrossRef] [Green Version]
  61. Hosny, A.; Alraddadi, W.; Tarabulsi, Y. Moho Undulations and High Poisson’s Ratio beneath Volcanic Areas, West of Saudi Arabia: Indication of Asymmetric Lithospheric Uplift. J. Seismol. 2022, 26, 301–318. [Google Scholar] [CrossRef]
  62. Endo, E.; Zahran, H.; Nofal, H.; Hadidy, S. The Saudi National Seismic Network. Seismol. Res. Lett. 2007, 78, 439–445. [Google Scholar] [CrossRef]
  63. International Seismological Centre. On-Line Bulletin. 2022. Available online: https://doi.org/10.31905/D808B830 (accessed on 15 March 2022).
  64. Kennett, B.L.N.; Engdah, E.R. Traveltimes for Global Earthquake Location and Phase Identification. Geophys. J. Int. 1991, 105, 429–465. [Google Scholar] [CrossRef] [Green Version]
  65. Ligorría, J.P.; Ammon, C.J. Iterative Deconvolution and Receiver-Function Estimation. Bull. Seismol. Soc. Am. 1999, 89, 1395–1400. [Google Scholar] [CrossRef]
  66. Berkhout, A.J. Least-Squares Inverse Filtering and Wavelet Deconvolution. Geophysics 1977, 42, 1369–1383. [Google Scholar] [CrossRef]
  67. Zhu, L.; Kanamori, H. Moho Depth Variation in Southern California from Teleseismic Receiver Functions. J. Geophys. Res. Solid Earth 2000, 105, 2969–2980. [Google Scholar] [CrossRef] [Green Version]
  68. Downs, D.T.; Stelten, M.E.; Champion, D.E.; Dietterich, H.R.; Nawab, Z.; Zahran, H.; Hassan, K.; Shawali, J. Volcanic History of the Northernmost Part of the Harrat Rahat Volcanic Field, Saudi Arabia. Geosphere 2018, 14, 1253–1282. [Google Scholar] [CrossRef] [Green Version]
  69. Murcia, H.; Németh, K.; El-Masry, N.N.; Lindsay, J.M.; Moufti, M.R.H.; Wameyo, P.; Cronin, S.J.; Smith, I.E.M.; Kereszturi, G. The Al-Du’aythah Volcanic Cones, Al-Madinah City: Implications for Volcanic Hazards in Northern Harrat Rahat, Kingdom of Saudi Arabia. Bull. Volcanol. 2015, 77, 1–19. [Google Scholar] [CrossRef]
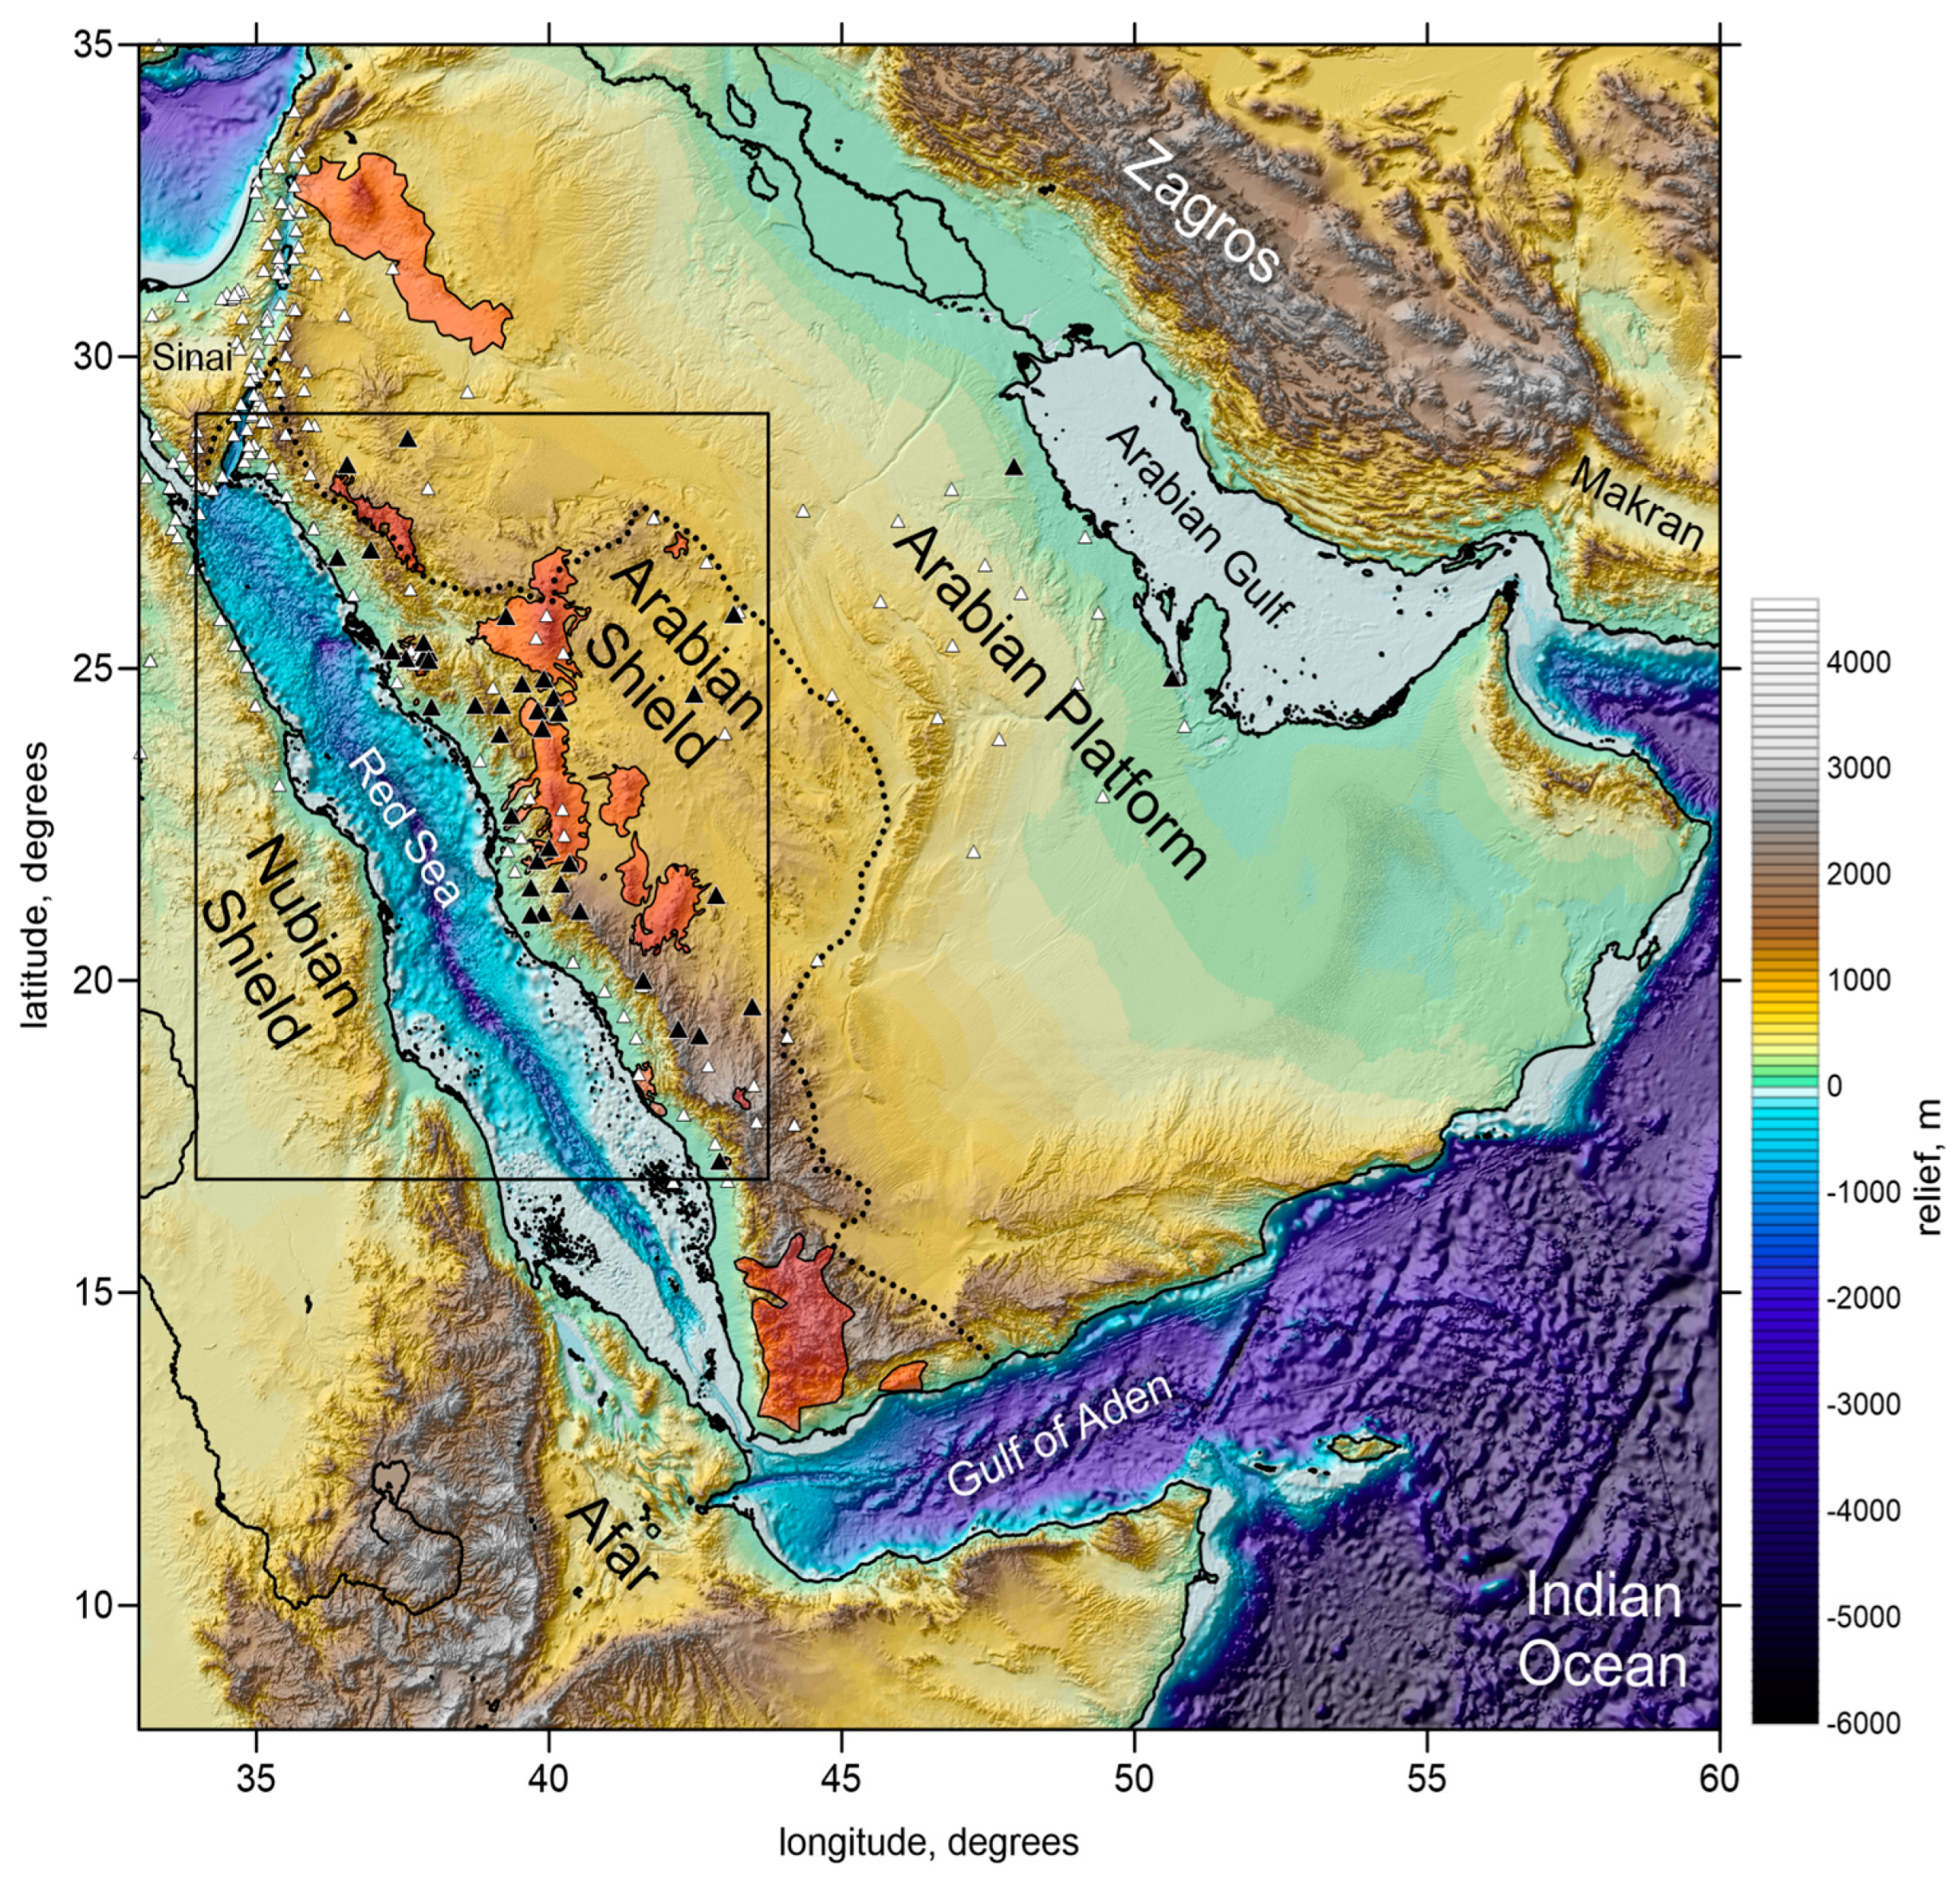
Figure 1. Arabian Plate topography and major geological units. The dotted line indicates the boundary of the Arabian Shield. The red areas highlight the Cenozoic basaltic fields (harrats). The white triangles depict the seismic stations used by [4] to build the tomography model, and the black triangles are those selected in this study for receiver-function method. Rectangle indicates a zone of particular interest of this study.
Geosciences 12 00399 g001
Figure 2. The distributions of earthquakes at teleseismic distances used in this study.
Geosciences 12 00399 g002
Figure 3. Schematic configuration of the main ray paths corresponding to the phases used for the H-k stacking. The solid and dashed lines represent the P- and S-waves, respectively.
Geosciences 12 00399 g003
Figure 4. Results of the H-k stacking for the station ARSS located on the Arabian Shield far from the Red Sea coast. (A): Individual receiver functions (Q-component). The upper trace is the average of all traces. Red, blue, and green hatches mark the theoretical arrivals of the Ps, PpPs and 2p2s phases, respectively. (B). The location of the station on the map. (CE): Grid search results for three individual phases Ps, PpPs and 2p2s. (F): Result of stacking of the results for all phases. The white dashed lines mark the best solution. The parameters of stacking and results for H and k determination are shown on the panel F.
Geosciences 12 00399 g004
Figure 5. Results of the H-k stacking for the station NAMS located on the Arabian Shield far from the Red Sea coast. (A): Individual receiver functions (Q-component). The upper trace is the average of all traces. Red, blue, and green hatches mark the theoretical arrivals of the Ps, PpPs and 2p2s phases, respectively. (B). The location of the station on the map. (CE): Grid search results for three individual phases Ps, PpPs and 2p2s. (F): Result of stacking of the results for all phases. The white dashed lines mark the best solution. The parameters of stacking and results for H and k determination are shown on the panel F.
Geosciences 12 00399 g005
Figure 6. Results of the H-k stacking for the station LNY06 located in the center of Harrat–Lunayyir exactly above the area of seismic unrest that occurred in 2009, which is presumed to be due to the magma intrusion. (A): Individual receiver functions (Q-component). The upper trace is the average of all traces. Red, blue, and green hatches mark the theoretical arrivals of the Ps, PpPs and 2p2s phases, respectively. (B). The location of the station on the map. (CE): Grid search results for three individual phases Ps, PpPs and 2p2s. (F): Result of stacking of the results for all phases. The white dashed lines mark the best solution. The parameters of stacking and results for H and k determination are shown on the panel F.
Geosciences 12 00399 g006
Figure 7. Results of the H-k stacking for the station LNY07 located in Harrat–Lunayyir close to station LNY06 shown in Figure 5, but outside the area of recent volcanic activity. Note that the Vp/Vs ratio for station LNY07 is significantly lower. (A): Individual receiver functions (Q-component). The upper trace is the average of all traces. Red, blue, and green hatches mark the theoretical arrivals of the Ps, PpPs and 2p2s phases, respectively. (B). The location of the station on the map. (CE): Grid search results for three individual phases Ps, PpPs and 2p2s. (F): Result of stacking of the results for all phases. The white dashed lines mark the best solution. The parameters of stacking and results for H and k determination are shown on the panel F.
Geosciences 12 00399 g007
Figure 8. Results of the H-k stacking for the station RHT01 located in the northern part of Harrat–Rahat. (A): Individual receiver functions (Q-component). The upper trace is the average of all traces. Red, blue, and green hatches mark the theoretical arrivals of the Ps, PpPs and 2p2s phases, respectively. (B). The location of the station on the map. (CE): Grid search results for three individual phases Ps, PpPs and 2p2s. (F): Result of stacking of the results for all phases. The white dashed lines mark the best solution. The parameters of stacking and results for H and k determination are shown on the panel F.
Geosciences 12 00399 g008
Figure 9. Results of the H-k stacking for the station YNBS located close to the coast of the Red Sea. (A): Individual receiver functions (Q-component). The upper trace is the average of all traces. Red, blue, and green hatches mark the theoretical arrivals of the Ps, PpPs and 2p2s phases, respectively. (B). The location of the station on the map. (CE): Grid search results for three individual phases Ps, PpPs and 2p2s. (F): Result of stacking of the results for all phases. The white dashed lines mark the best solution. The parameters of stacking and results for H and k determination are shown on the panel F.
Geosciences 12 00399 g009
Figure 10. The resulting values of the Moho depth at seismic stations, for which the H-k stacking was performed, for the entire area of Western Arabia (A) and two enlarged areas (B,C). The depths are indicated by colors of the circles and numbers above. The names are indicated for the stations that are mentioned in the text. The background is the distribution of the P-wave velocity anomalies at the depth of 30 km from [4]. Abbreviations for harrats indicated by the dark-red characters: HRh-ar Rahah; HUw-Uwaytid; HIt-Ithnayn; HKh-Khaybar, HLy-Lunayyir; HRt-Rahat; HKs-Kishb; HH-Hadan; HBq-al Buqum.
Geosciences 12 00399 g010
Figure 11. The resulting Vp/Vs ratios at seismic stations derived from the H-k stacking for the entire area of Western Arabia (A) and two enlarged areas (B,C). The values of the Vp/Vs ratio are indicated by colors of the circles and numbers. The names are indicated for the stations that are mentioned in the text. The background is the distribution of the P-wave velocity anomalies at the depth of 30 km from [4]. Abbreviations for harrats indicated by the dark-red characters: HRh-ar Rahah; HUw-Uwaytid; HIt-Ithnayn; HKh-Khaybar, HLy-Lunayyir; HRt-Rahat; HKs-Kishb; HH-Hadan; HBq-al Buqum.
Geosciences 12 00399 g011
Figure 12. The values of the Vp/Vs ratio for selected stations in Harrat–Lunayyir obtained with the use of the H-k stacking (colored dots, same as in Figure 11) overlapped onto the Vp/Vs ratio at the depth of 15 km derived from local earthquake tomography by [20]. The white dots indicate the locations of events that occurred during the unrest in 2009. The red crosses are the monogenic cones identified from satellite images by [20]. The dark-red contour highlights the harrat limit.
Geosciences 12 00399 g012
Table 1. Seismic stations: coordinates, Moho depth and Vp/Vs ratio.
Station NameLatitudeLongitudeCrustal Thickness (km)VP/VSLocation
AFFS24.5542.4835.21.76Shield
ARSS25.8243.1538.71.74Shield
BIDS26.8636.9535.61.67Shield
BLJS19.9541.6038.91.70Shield
ENMS19.0742.5743.51.71Shield
JLOS28.7435.4936.11.74Shield
FDAS21.8340.3537.71.65Harrat–Rahat
FRAS21.0640.5238.91.73Shield
FRJS22.5939.3631.81.61Coastal plain
JAZS17.0642.9131.01.67Coastal plain
BTHS24.0550.8546.01.68Platform
JURS21.8739.8033.41.68Harrat–Rahat
KFJS28.1947.9446.81.81Platform
KBRS25.7939.2634.71.76Harrat–Khaybar
LBNS21.0439.9030.91.75Coastal plain
LTHS20.2840.4119.61.84Coastal plain
LNY0125.2137.9533.41.78Harrat–Lunayyir
LNY0225.1337.8633.91.78Harrat–Lunayyir
LNY0325.3737.8535.21.67Harrat–Lunayyir
LNY0625.2137.7832.51.86Harrat–Lunayyir
LNY0725.1237.5632.61.74Harrat–Lunayyir
LNYS25.0837.9431.41.83Harrat–Lunayyir
MDRS22.0940.0034.91.73Harrat–Rahat
NAMS19.1742.2041.31.68Shield
QLBS28.6537.5936.01.75Shield
RHT0124.2739.8135.11.79Harrat–Rahat
RHT0224.4840.0835.71.73Harrat–Rahat
RHT0324.2440.1735.81.73Harrat–Rahat
RHT0423.9939.8836.01.74Harrat–Rahat
RHT0523.90939.1635.31.70Shield
RHT0624.3739.1934.01.70Shield
RHT0724.6739.0432.31.69Harrat–Rahat
RHT0824.7139.5434.21.78Harrat–Rahat
RHT0924.7839.9135.21.73Harrat–Rahat
RYNS21.32 42.8536.71.74Shield
RSHS28.3034.8020.31.77Coastal plain
SHBS21.0039.6824.81.80Coastal plain
SHMS21.4439.6927.71.75Coastal plain
SHRS21.5040.20 33.81.72Shield
SLWS24.8050.6437.71.88Platform
TATS19.5443.4740.01.79Shield
TBKS28.2236.5535.81.77Platform
UMJS25.2337.31 26.51.62Coastal plain
WJHS26.7336.3930.01.66Coastal plain
YNBS24.3337.9925.31.88Coastal plain
YOBS24.3638.7430.51.77Coastal plain
KHLS22.0539.3025.91.82Coastal plain
DRBS17.8342.3032.41.69Coastal plain
BOQS25.8749.3847.61.64Platform
HILS27.3841.7837.01.80Shield
HQLS29.3035.0626.41.79Platform
Publisher’s Note: MDPI stays neutral with regard to jurisdictional claims in published maps and institutional affiliations.