Abstract
The deposits of Bor and Cukaru Peki are important contributors to the Apuseni–Banat–Timok–Srednogorie (ABTS) belt’s metallogenic endowment. We use decision tree and random forest algorithms applied to zircon geochemistry data from Bor, Cukaru Peki and a selection of other localities within the ABTS. The resulting predictions, supported by high scores on the test set predictions for the random forest algorithm, suggest that it is possible to fingerprint the studied deposits and localities from the ABTS belt based on zircon geochemistry. These results take into account the multivariate geochemical patterns and can be used in combination with a widely accepted Eu anomaly indicator or assist in finding more subtle geochemical differences for systems where applying a single cut-off value does not result in a good separation between barren and mineralized rocks.
1. Introduction
The neighboring Bor and Cukaru Peki deposits are located in the Serbian segment of the Apuseni–Banat–Timok–Srednogorie belt [1,2,3]. The Apuseni–Banat–Timok–Srednogorie Late Cretaceous magmatic arc in the Carpathian–Balkan orogen (Figure 1) formed on the European margin during the closure of the Neotethys Ocean. It was subsequently deformed into a complex orogen by continental collisions. The Cu-Au mineralized arc consists of geologically distinct segments: Apuseni (Romania), Banat (Romania and Serbia), Timok (Serbia), Panagyurishte and Eastern Srednogorie segments (Bulgaria). Within this belt, deposits with the most significant Cu and Au resources include Majdanpek with 1000 Mt of ore containing 6 Mt Cu and 10.89 Moz Au, Elatzite with 350 Mt of ore containing 1.4 Mt of Cu and 2.83 Moz Au, Assarel with 354 Mt of ore containing 1.6 Mt of Cu and 2.2 Moz Au and Konak with 518 Mt of ore containing 1.2 Mt Cu and 1.12 Moz Au [4].
Measured and indicated resources of the Bor deposit amount to 5.8 Mt Cu and 260 t Au, at a cut-off grade of 0.3% Cu [5]. Cukaru Peki Lower Zone resource estimate amounts of 14.3 Mt Cu at 0.38% cut-off grade and 298.6 t Au [6]. The total amount of Cu and Au extracted from Bor is difficult to estimate, as mining operations have been going on for more than a hundred years. Still, the approximate level of production + reserves reaches a total of 6.6–6.7 Mt with higher cut-off grades, namely at 0.6% Cu for the porphyry zone and 1.5% Cu for the epithermal zone and a total of 290–302 t Au [1,2,4,7].

Figure 1.
Geological map of the South-Eastern Timok magmatic complex (TMC), with locations of Bor and Cukaru Peki deposits. Modified after [6,8,9]. Lines A—A’ and B—B’ mark the position of the deposit sections through Bor and Cukaru Peki in Figure 2.
Bor and Cukaru Peki are hosted by Phase I andesites [1], which represent the early-stage magmatism within the Timok magmatic complex. Dykes with dioritic composition were described at deep levels of the Bor porphyry deposit in early literature; one small, 1.5 m core interval was identified as a diorite dyke, syn-to post-mineral, in the upper part of the Borska Reka porphyry. Upper andesite at Cukaru Peki is texturally similar to the host rock at Bor; however, no lithology at Bor can be correlated to the lower andesite of Cukaru Peki, possibly due to faulting at Bor which juxtaposes conglomerate and Bor igneous rocks at depth (Figure 2).

Figure 2.
Cross-sections of Bor and Cukaru Peki deposits and locations of samples for U-Pb geochronology [1,2,10], with additions based on Bor and Cukaru Peki geologic documentation.
The host rock, andesite, has experienced chlorite-sericite alteration with associated magnetite-chalcopyrite-quartz vein mineralization in the deep Borska Reka porphyry, which grades into a texture–destructive sericite-kaolinite alteration zone towards the shallow part of the Borska Reka porphyry, and is overlain by an anhydrite-kaolinite alteration zone with anhydrite-sulfide veins, referred to as Tilva Ros epithermal mineralization zone and surrounded by the massive sulfide lens-like orebodies, including recently mined-out T, T1 and historic Tilva Mika, Coka Dulkan, E, E 1 and others [1,11,12].
Existing geochronological data (Figure 3) differentiate all of Timok’s magmatic events into three stages [13,14,15,16,17,18,19,20,21].
U-Pb zircon TIMS ages define the start of Phase I based on samples from Veliki Krivelj at 86.29 ± 0.32 Ma [22]. A dacite sample from the vicinity of Bor is dated at 84.28 ± 0.86 Ma [23], and the termination of Phase I is defined at 84.66 ± 0.5 Ma [22]. New ages obtained by [24] from the Nikolicevo area nearby Cukaru Peki encompass an interval from 90.97 ± 0.39 Ma to 89.49 ± 0.42 age for those samples from the deep drill-holes, similar to the age of Srednogorie Cretaceous magmatism in Bulgaria. In comparison, shallow andesites are similar to the Phase I andesites from other locations and yield ages from 85.56 ± 0.53 Ma to 84.89 ± 0.75 Ma.

Figure 3.
Geochronology of the Bor and Cukaru Peki deposits in the context of the Timok magmatic complex [15,18,20,22,24,25,26]. Start and end of Phase I, as well as end of Phase II are based on U/Pb zircon analysis and field relationships; start of Phase II cannot be constrained [20,22].
Phase I samples from Veliki Krivelj are dated at 86.12 ± 0.29 Ma and 84.17 ± 0.86 Ma [23]; post-phase II trachyte from the vicinity of Bor is at 84.28 ± 0.86 Ma. Intrusive rocks in the Western part of Timok are considered the concluding Phase III of the Timok’s magmatic activity, with ages ranging from 83.6 ± 0.5 Ma for Coka Kuruga diorite to Valja Strz monzonite with the age of 78.5 ± 1.3 [21] or 78.39 ± 0.22 Ma [23], and ages of Dumitru Potok, Kraku Ridji and Valja Strz diorite porphyries falling in between 82.5 ± 0.4 and 80.8 ± 0.6 Ma [21].
Re-Os molybdenite ages date the time of mineralization; existing ages are 86.24 ± 0.5 Ma and 85.94 ± 0.4 Ma for Bor and 87.88 ± 0.5 Ma for the nearby Veliki Krivelj [18]. These ages reflect the ore-forming events and may not reflect the age of the host rock. Bor Re-Os ages overlap with the early Phase I magmatic stage within uncertainties, but Veliki Krivelj Re-Os age is at least 0.7 Ma older than the onset of Phase I magmatism, as defined by U-Pb zircon ages [22].
K-Ar and Ar-Ar ages of hornblende and biotite from Phase I andesite cover a wide range from 89 ± 0.6 Ma to 84.3 ± 1.7 Ma for Bor and from 85.5 ± 1.3 Ma to 83 ± 1 Ma for Veliki Krivelj [17,25]. Hydrothermal minerals, such as white mica and alunite, cover ages from 86.9 ± 1.1 Ma to 84.6 ± 1.2 Ma at Bor [25,26]. Interpretation of those ages is complicated because the system remained partially open after crystallization; multiple pulses of hydrothermal activity are manifested in reopening of quartz-pyrite veins, crack seal and overgrowth of pyrite stockwork veins by anhydrite.
Mineralization at Bor could be contemporaneous with Phase I magmatism: Re-Os ages of molybdenite overlap with the early Phase I, and the uncertainties of K-Ar ages of white mica are larger than the span of the Phase I magmatism defined by U-Pb ID-TIMS of zircon, and one Re-Os age of molybdenite from Veliki Krivelj pre-dates the suggested beginning of Phase I, but post-dates the existing ages of the plagioclase–hornblende andesite from Nikolicevo area East of Cukaru Peki, South-East of Bor (Figure 3). This controversy between magmatic ages and mineralization ages calls for additional age determination and possibly reconsideration of the onset of Phase I magmatism.
2. Materials and Methods
Due to the intensive alteration overprint and the lack of well-defined magmatic contacts, vein truncations and the alignment of phenocrysts along the contacts, we selected samples for dating and geochemical analysis from the different levels of the deposit. Phase I andesite, weakly altered and barren, overlies the Borska reka porphyry and Tilva Ros epithermal orebodies, and represents the host rock (samples B67-363 and B67-507). Silicified diorite dyke with anhydrite-kaolinite alterations from the shallow level of the deposit represents a syn-to post-mineral phase, with small-scale disseminations of covellite. Samples from the deep porphyry zone of Borska Reka (BGM3-312 and BGM1-314) are heavily altered and mineralized, and could represent the more intensively altered variant of the overlying andesite volcanics, with a decreased modal abundance of plagioclase due to its alteration to sericite and kaolinite, and therefore, could be correlated to V1A and V1B in andesite phases from Cukaru Peki [24].
2.1. Zircon Geochemistry
In order to elucidate the connection between Bor and Cukaru Peki, and to test whether Bor and Cukaru Peki could have originated from the replenishment of the same magma chamber, we compare the geochemistry of zircon grains from both deposits, as well as the zircon composition of the Veliki Krivelj porphyry, located north of Bor. As an additional check, we look at a diorite sample from a relatively small Valja Strz deposit, where Cu and Au’s endowment amounts to 0.28 Mt and 97 t, respectively, [21,23] to see whether geochemical signatures that are similar between Bor and Cukaru Peki would be distinctly different for Valja Strz compared to the barren Ridan-Krepoljin samples, and to further explore the difference between mineralized magmatic pulses and those which are weakly mineralized, with potential implications of exploration criteria that could be applied to the Timok Magmatic Complex. The Ridan-Krepoljin area is considered practically barren, with a small prospect of Kucajna [27].
Drill core samples were cleaned, disaggregated with Selfrag and sieved. The fraction of 100–250 µm was processed with Methylene Iodide, followed by electrostatic separation; zircons were hand-picked under a binocular microscope; all grains were treated with one step of the chemical annealing procedure, annealing with 900 °C during 48 h, embedded in epoxy resin and polished.
In order to reveal the internal texture of the zircons and check for the presence of inherited cores, epoxy mounts were carbon-coated and investigated on the JEOL JSM-6390 LA scanning electron microscope (SEM) equipped with a Deben Centaurus panchromatic cathodoluminescence detector.
U-Pb ages and trace element contents in zircons were obtained by Laser Ablation-Inductively Coupled Plasma-Mass Spectrometry (LA-ICP-MS) at ETH Zürich, with a 193 nm Resolution (S155) ArF excimer laser coupled to an Element sector-field ICP-MS; 30 µm spots were placed in the inclusion-free interior of the grains. Age and trace element data were collected during the same run. A 5 Hz repetition rate was used and the blank signal of 20 s was followed by the ablation signal of 30 s. On-sample fluence was around 2.5–3.5 J/cm2 for zircon measurements. LA-ICP-MS intensities were processed using Iolite software to obtain the ages and trace element contents. The following standards were measured after every set of 20 sample points: GJ-1 [28], 91500 [29], AUSZ-7 [30] and Plesovice [31] for ages and NIST-612 glass standard for trace elements; zircon blank was ablated together with the standards. Although cathodoluminescence imaging revealed oscillatory zoning of the rims overgrowing the more homogeneous core, plotting the trace elements of cores vs. rims did not show any significant difference in the core/rim trace element zonation. Due to the small size of most zircons, placing the laser spot in the core would inevitably result in a mixed core and rim signal.
ICP-MS signals were processed with Iolite software [32], and the IsoplotR tool was used for plotting average ages [33]. We excluded zircon grains from the calculation if the grains showed inherited components or younger ages and did not overlap within the uncertainty with the data cluster. Grains with younger ages than the obtained mean age can be explained by recent Pb loss. For the uncertainty calculation of the average age, error propagation of 1.5% was used, based on consideration of [34].
Eu anomaly is calculated according to the following formula [35]:
where Sm and Gd values are normalized to C1 chondrite from [36], multiplied by 1.3596 after [37].
2.2. Machine Learning
Machine learning tools are gaining wider acceptance as commonly used tools for prospectivity and for statistically robust analysis of large mineral geochemistry datasets [38,39,40].
We test the application of several basic machine learning algorithms to zircon geochemistry in order to predict rock types and their association with known mineral deposits and barren occurrences. The tested algorithms include decision tree and random forest [41], implemented in Python.
The decision tree algorithm [41] predicts the target variable in a tree-like sequence of steps, with each of the steps, or nodes, representing the decision point. The simplest explanation of a decision tree based on zircon geochemistry criteria can be shown on the example in [42], suggesting that zircons with an Eu anomaly greater than 0.3 and Ce/Nd ratio greater than 5 belong to mineralized rock suites (Figure 4). The random forest algorithm takes into account multiple decision trees, using the majority vote for predicting the classification label.
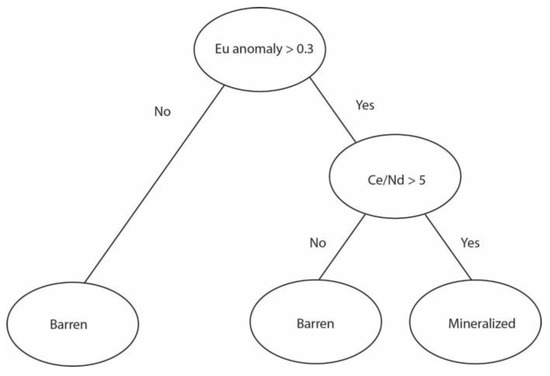
Figure 4.
Basic illustration of the decision tree algorithm applied to the zircon geochemistry.
Parameters of decision tree and random forest classifier were tuned with Grid search.
In order to estimate the quality of results produced by each algorithm, we use a classification report comparing predicted and actual values from the test dataset. To get a more detailed view of predictions, we use the confusion matrix which provides a breakdown of correctly and incorrectly predicted values for each class or deposit, where correctly classified data points lie on the diagonal of the matrix and indicate that a predicted deposit coincides with the actual deposit label. As an additional insight, the confusion matrix provides information about false positive and false negative predictions. For each predicted class, false positive values are calculated as the sum of the off-diagonal values along the column of the confusion matrix, while false negatives are the sum of the off-diagonal values along the row.
To understand the importance of each variable for making the prediction, SHAP (SHapley Additive exPlanations) values are calculated on the training set [43]. We focus on comparing the feature importance for decision tree and random forest algorithms.
3. Results
3.1. Geology of Bor and Cukaru Peki
Cukaru Peki is located 5 km south of Bor and is characterized by many similarities to Bor, in terms of mineralization styles, host rock alteration and the presence of high-sulfidation epithermal massive sulfides [2,44,45].
Representative rock types from Bor are shown in Figure 5. Samples of coherent Phase I andesite with minimal alteration represent the host rock of the Bor deposit and are texturally very similar to the VIA andesites characterized by [24], especially the least altered andesite exemplified by sample B67-258. Down the interval the degree of alteration increases: sample B67-363 is characterized by the sericite-kaolinite alteration and pyrite-anhydrite veins (Figure 5a), with chalcopyrite inclusions hosted in pyrite. The deepest sample from this drill hole located 507 m from the drill hole collar, B67-507, has experienced texture–destructive anhydrite-kaolinite alteration. Quartz veins and chalcopyrite disseminations are present in sample B67-507. All samples overly the main mineralized Borska Reka porphyry and Tilva Ros epithermal zones.
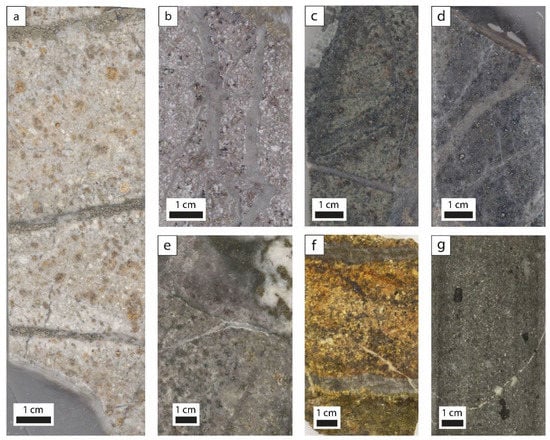
Figure 5.
Samples selected for geochronology and zircon trace element analysis. (a) Altered Phase I andesite overlying Borska Reka and Tilva Ros deposits, with pyrite-anhydrite veins; B67-373; (b) Fine-grained diorite dyke from shallow levels of Borska Reka porphyry, with sinuous quartz veins, disseminated covellite; BGM1-64; (c) Deep, heavily altered Phase I andesite from Borska Reka porphyry, with quartz-pyrite-chalcopyrite veins and pyrite-anhydrite veinlets with chlorite-sericite halos; BGM3-312; (d) Deep Borska Reka porphyry with prominent chalcopyrite-pyrite disseminations and hairline pyrite stringers; BGM1-314; (e) P1 porphyry from Cukaru Peki, pervasively altered, with anhydrite-pyrite vein crosscutting quartz-pyrite vein; TC160125B-1464.5; (f) P2 crowded diorite porphyry from Cukaru Peki, with quartz-pyrite-chalcopyrite vein cross-cut by a gypsum vein; FMTC1328-914.5; (g) Post-mineral fine-grained P10 diorite porphyry from Cukaru Peki; TC160125-1360.4. Sample labels throughout contain the number of the drill hole (i.e., BGM1) followed by the depth of the sample relative to the collar of the drill hole (i.e., 314 m).
Although clear-cut magmatic contacts are absent, one diorite porphyry dyke was logged in the core from the shallow medium-grade Borska Reka porphyry zone: sample BGM1-64 (Figure 5b) is characterized by a conspicuously equigranular texture, with sinuous quartz vein and hairline-thick magnetite veinlets.
Deep high-grade Borska Reka porphyry samples, namely BGM3-312 and BGM1-314 (Figure 5c,d), are altered to chlorite-sericite, with veins of quartz-pyrite-chalcopyrite ± anhydrite cross-cut by tiny pyrite-anhydrite-covellite veins.
Early porphyry phases from Cukaru Peki are exemplified by intensely altered P1 and P2 porphyries (Figure 5e,f); P10 post-mineral dyke is unaltered and barren (Figure 5g).
Porphyry-style mineralization is present in deeper parts of the deposit, with quartz, anhydrite, magnetite and chalcopyrite veins and chalcopyrite disseminations (Figure 6a); the top of this porphyry zone is outlined at 1000 m below the surface [45]. For comparison, the top of the porphyry-style magnetite-chalcopyrite vein mineralization (Figure 6b) at Borska reka is located at approximately 800 m depth. The transitional zone at Cukaru Peki overlies the porphyry zone, with covellite and enargite replacing chalcopyrite (Figure 6d,g); anhydrite, calcite and gypsum veins with pyrite and covellite being the prevalent vein types [46]. Epithermal veins with covellite, anhydrite and enargite cross-cut quartz-chalcopyrite-pyrite veins at Bor (Figure 6f). High-grade massive sulfides at Cukaru Peki (Figure 6i), as well as pyrite-covellite veins (Figure 6h) and hydrothermal breccias represent the shallow part of the deposit and are found at depths from 400 to 1000 m below the surface; at Bor, recently mined T and T1 massive sulfide orebodies (Figure 6j) are located at depth of 500 m below the surface, and historic Coka Dulkan and Tilva Mika were outcropping at the pre-mining surface.
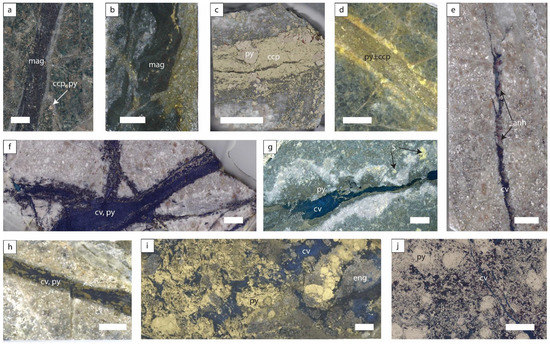
Figure 6.
Mineralization styles at Bor and Cukaru Peki. (a) Quartz-magnetite-pyrite veins, wallrock with chlorite-sericite alteration, from deep Borska Reka porphyry zone; BGM7-316; (b) Magnetite-quartz veins from Cukaru Peki, deformed and cross-cut by pyrite veins; (c) Pyrite-chalcopyrite veins with minor quartz from below the T1 massive sulfide orebody, level of -245 m; (d) Pyrite-chalcopyrite veins with prominent sericite halo from Cukaru Peki; (e) Anhydrite-covellite vein in a wallrock with kaolinite-sericite alteration, transitional zone between Borska Reka porphyry and Tilva Ros epithermal zone; BGM1-195; (f) Covellite-pyrite veins crosscutting quartz-pyrite vein from the vicinity of the Tilva Ros orebody, level of -70 m; (g,h) Pyrite-covellite vein with solid sulfur and a prominent anhydrite-kaolinite halo from Cukaru Peki; (i) Massive sulfide from Cukaru Peki, with enargite overgrown by pyrite and covellite; (j) Massive sulfide from the central part of the T orebody, dominantly covellite and pyrite, residual quartz, BB3-23. Scale bar = 1 cm.
The paragenetic sequence of the porphyry-style ore is very similar for Bor and Cukaru Peki (Figure 7 and Figure 8) [45]. There are similarities in the textural position of anhedral chalcopyrite and euhedral pyrite, both in the quartz-magnetite-chalcopyrite veins and as disseminations (Figure 8). Magnetite and hematite textures differ slightly: at Bor, hematite replaces magnetite at the rims, but also overgrows magnetite grains as laths, while at Cukaru Peki the magnetite-hematite texture is more typically martitic, with hematite pseudomorphs forming after euhedral magnetite crystals (Figure 7a,b). Comparison between anhydrite veins shows that chalcocite, while being present only as sub-micron grains in the anhydrite-sulfide veins at Cukaru Peki, is significant at Bor; pyrite textures are very similar, with inclusion- and pore-rich cores overgrown by inclusion-poor rims (Figure 7c,d). Pyrite is cracked, deformed and overgrown by covellite and chalcocite at Bor, and mostly by covellite at Cukaru Peki. Massive sulfide textures are very similar, too, with covellite being the prevalent Cu sulfide in the massive sulfide ore and enargite pre-dating Cu sulfides (Figure 7e,f). Rutile occurs throughout all the lithologies and mineralization styles: as inclusions in pyrite from the porphyry-style veins, along former parting planes of magnetite, along cleavage planes of amphibole, intergrown with quartz from the vuggy quartz overlying massive sulfides and as inclusions in residual quartz in high-grade massive sulfide ore.
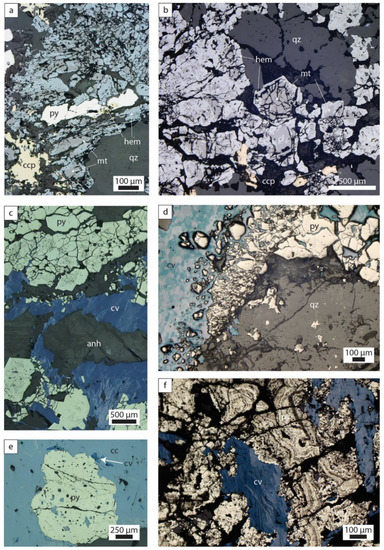
Figure 7.
Ore textures from Bor and Cukaru Peki. (a) Deep porphyry style magnetite-chalcopyrite-pyrite-quartz veins, Bor; (b) magnetite-chalcopyrite-quartz vein from Cukaru Peki; (c) Epithermal anhydrite-sulfide veins, Bor; (d) Quartz-pyrite-covellite vein from transitional zone of Cukaru Peki; (e) Bor massive sulfide, fragmented pyrite in the matrix of chalcocite and covellite; (f) Collomorph pyrite overgrown by covellite, massive sulfide from Cukaru Peki.
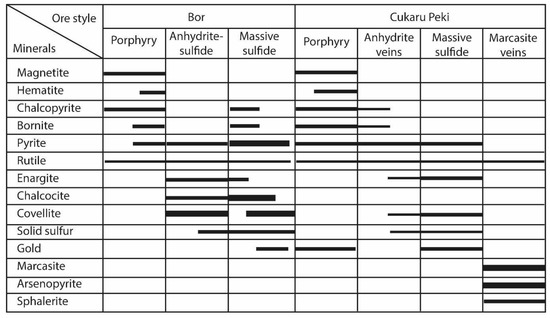
Figure 8.
Comparison of paragenetic sequences between Bor and Cukaru Peki.
Gold is present in massive sulfides in both deposits; while porphyry at Bor is characterized by elevated gold contents, no visible gold was found in the porphyry ore from Bor. On the contrary, at Cukaru Peki, gold is present as small inclusions of native gold and electrum in porphyry-style ore in porphyry-style ore but is only observed as trace elements in the massive sulfide ore (Figure 8).
3.2. Trace Element Composition of Zircons
Despite the wide usage of the Ce anomaly in previous studies [47,48,49], it has been recently shown that the magnitude of Ce anomaly can evolve from high to low values as an effect of a temperature decrease at constant oxygen fugacity [50]; this calls for a revised estimation of magma oxidation state, which in combination with Eu anomaly could represent a potential fertility discriminator [51,52,53,54].
Both Bor and Cukaru Peki are characterized by EuN/Eu*N values greater than 0.4 (Figure 9), which shows that they conform to the widely accepted criteria of europium anomaly greater than 0.3 that is typical of fertile magmas [42]; notably, late low-grade diorite at Bor and post-mineral dyke at Cukaru Peki are both characterized by Eu anomaly greater than 0.3. Samples from Ridan-Krepoljin area have notably smaller Eu anomaly, but indicate partial overlap with Bor, Nikolicevo and Cukaru Peki samples. The data from Valja Strz are clustered into two groups: one overlaps with Bor and Cukaru Peki in terms of europium anomaly, and the second cluster plots distinctly below the value of 0.3. The mean value of both clusters from Valja Strz is distinctly below the mean values of all rocks from Bor and Cukaru Peki. The mean values of normalized europium anomaly for Bor and Cukaru Peki rocks are all between 0.6 and 0.7, without any distinction between host rock volcanics and porphyries; however, both P10 from Cukaru Peki and late weakly mineralized porphyry from Bor are characterized by a wider spread of Eu anomaly values. In terms of Eu anomaly vs. Hf, re-calculated Eu anomaly values of published zircon analyses from Bulgaria [55,56] are closest to the values of late low-grade porphyry from Bor.
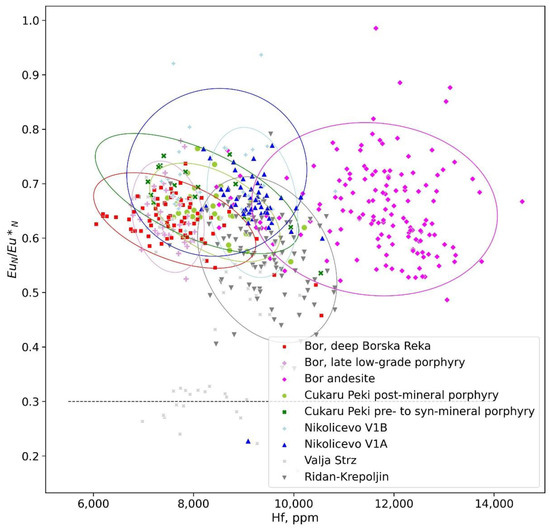
Figure 9.
EuN/Eu*N vs. Hf of zircons; data and 95% confidence ellipses, showing very close resemblance between Bor deep Borska reka andesites and Cukaru Peki porphyries, as well as an overlap between Nikolicevo, Cukaru Peki and Bor porphyries, and potentially, a lower degree of fractionation for Bor andesites. Due to large scatter of Valja Strz samples, no confidence ellipses are plotted for this sample.
Zircons from Bor host-rock andesite are characterized by distinctly greater Hf values, and they are also characterized by ages that are by 1 to 2 Ma older than the rocks from the deep Borska Reka porphyry zone. Figure 9 shows the widely accepted fertility discriminators of Eu anomaly vs. Hf [42]. In addition to data plots, 95% confidence ellipses with a diameter of 2 sigma are plotted for all samples except Valja Strz.
A total of 10,000*(EuN/Eu*N)/Y vs. GdN of zircons (Figure 10) shows the difference in the slope of the confidence ellipses for mineralized samples (steep slope) and weakly mineralized or barren samples (flat slope).
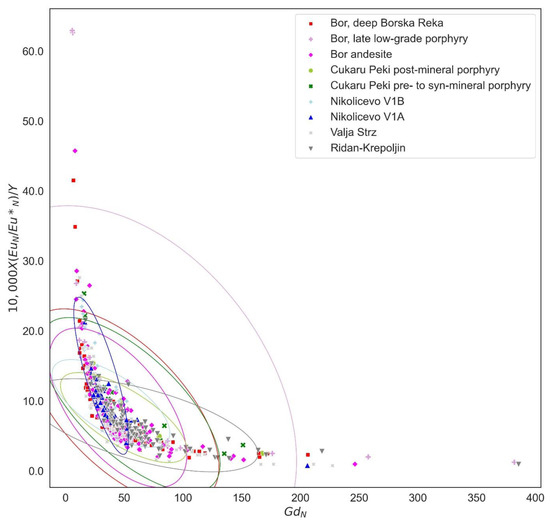
Figure 10.
10,000*(EuN/Eu*N)/Y vs. GdN of zircons, showing the difference in the slope of the confidence ellipses for mineralized samples (steep slope) and weakly mineralized or barren samples (flat slope).
Dy/Yb (Figure 11) in zircon potentially records the melt fraction [57] and can serve as another fertility discriminator, with fertile suits typically characterized by Dy/Yb below 0.3 [42]. For our sample set, the mean values of Dy/Yb for zircons from Cukaru Peki and Bor are lower than the mean values of Valja Strz zircons. However, all samples are characterized by a large spread of Dy/Yb values. Host rock andesite at Bor show elevated Dy/Yb ratios compared to deeper Borska Reka rocks, but a relatively constant trend in Eu anomaly with decreasing Dy/Yb. Samples from Medet [56] tend to show higher Dy/Yb than most of the mineralized rocks from this study, while Chelopech samples overlap with Bor porphyries and andesites, Nikolicevo and Cukaru Peki [55].
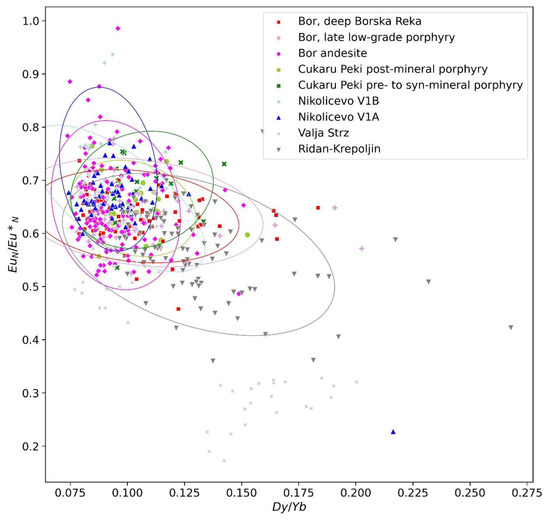
Figure 11.
EuN/Eu*N vs. Dy/Yb of zircons, showing somewhat elevated Dy/Yb for weakly mineralized Valja Strz rocks and partial overlap with widely spread values of Dy/Yb of Bor and Cukaru Peki; however, the barren Ridan-Krepoljin signature is clearly different.
Oxidation state of magmas is a potentially important fertility factor for porphyry Cu mineralization [42,51,58]. We use recent method of [59] for estimating fO2 of each sample (Figure 12), assuming the activity of SiO2 of 0.7 for quartz-undersaturated andesitic melts and TiO2 activity of 1, based on petrographic evidence of rutile being present in Bor andesites [60]; however, the magmatic nature of rutile cannot be established with certainty for hydrothermally altered rocks. Furthermore, we test if the usage of the fO2 variable can potentially contribute to further improving the separation between data points from different deposits.

Figure 12.
Eu anomaly and calculated oxidation state of magmas according to [59]. Mineralized rocks are characterized by higher Eu anomaly values than barren and weakly mineralized ones.
Yb/Gd vs. Ce/Sm ratios (Figure 13) can discriminate between the role of apatite, hornblende and titanite fractionation [37]. Bor and Veliki Krivelj partly overlap and are characterized by higher Yb/Gd ratios and a steeper slope of the trend line. Veliki Krivelj shows the flattening of the trend line for samples with Ce/Sm larger than 6. Cukaru Peki shows a relatively constant flat trend.
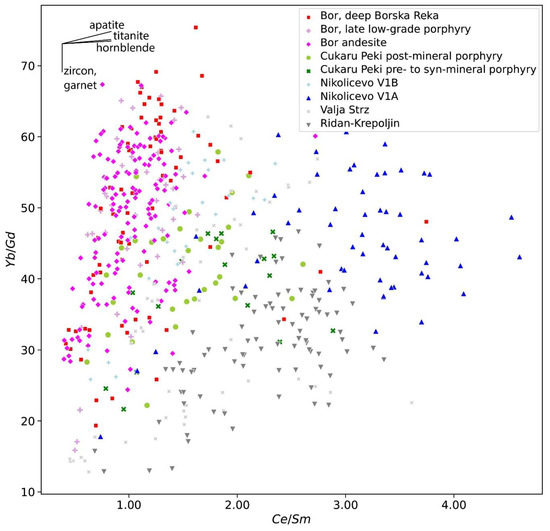
Figure 13.
Normalized Yb/Gd vs. Ce/Sm of zircons, showing separation between Bor, Cukaru Peki and Nikolicevo V1B, on one side, and Valja Strz, Ridan Krepoljin and Nikolicevo V1A. Crystal fractionation vectors from [37].
Figure 14 shows the plot of Yb/Gd vs. Th/U that is used to tell apart the effects of magma mixing and crystal fractionation. The Bor host rock, andesite, overlaps with the Borska Reka porphyry samples, but overall, is characterized by a concentration of most points around Yb/Gd value of 40 to 50. Borska Reka porphyry and Bor late, low-grade porphyry display the continuous fractionation trend from high Th/U, low Yb/Gd to low Th/U and high Yb/Gd. Cukaru Peki and Veliki Krivelj samples deviate from the fractionation trend of Bor and are characterized by higher Th/U ratios for comparable Yb/Gd values, and an overlap with Bor samples in the region of Yb/Gd from 40 to 50.
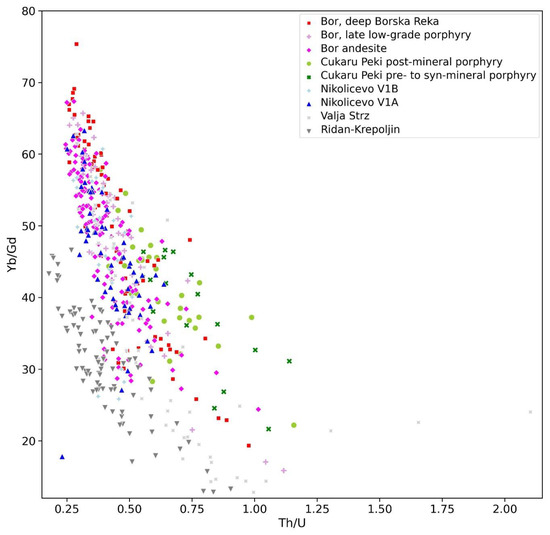
Figure 14.
Yb/Gd vs. Th/U diagram, showing the fractionation trend for Bor and the evidence of magma mixing for Cukaru Peki, and the separation between mineralized and barren samples.
3.3. Application of Machine Learning Algorithms to the Zircon Geochemistry Dataset from Timok Magmatic Complex
The purpose of this exercise is to see whether the zircons can be correctly grouped according to their origin based on their geochemical signatures (Python code in digital Supplementary Material S2). The dataset contains 798 data points, each representing geochemical data for a concordant zircon grain. Samples in this dataset include regional Timok samples, Bor, Cukaru Peki porphyries, Veliki Krivelj, weakly mineralized Valja Strz and barren Ridan-Krepoljin zone; the last two groups are from the study of [23], reanalyzed for trace elements by LA-ICP-MS; samples from the vicinity of Cukaru Peki, Nikolicevo, were included in the dataset [24]. Three outliers were removed from the dataset: one with elevated Ba content of 320 ppm, and two with elevated Ti content of 130 and 271 ppm. Ba values over 10 were identified as outilers (one data point from Bor andesite and two from Nikolicevo), as well as La values over 5 ppm (one data point from Nikolicevo, one from Valja Strz and two from Ridan-Krepoljin). Four data points with extremely high Th were excluded, all from Valja Strz. One high-U data point from Ridan-Krepoljin was excluded. Zircon geochemistry dataset is in the digital appendix (Supplementary Material S1).
As one would expect from basic geochemistry, the correlation matrix (Figure 15) shows that light REE are characterized by weak correlation, while HREE are strongly correlated to each other and are significantly correlated to Y. Pb is strongly correlated with U and, to a lesser degree, with Th, indicating minimal common Pb in the zircons. Normalized Eu anomaly is not correlated with any other element, while calculated fO2 shows significant correlation with Ce (0.73) and Th (0.77).
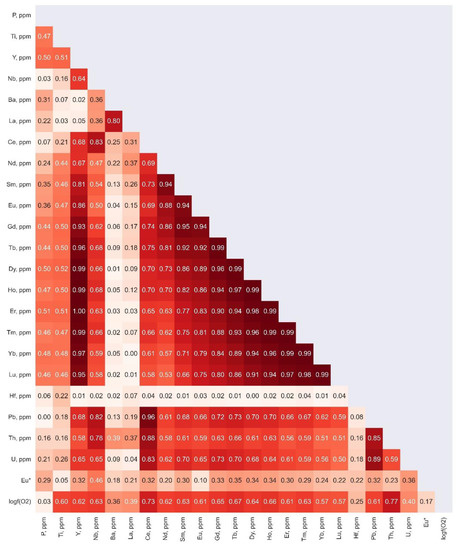
Figure 15.
Correlation matrix between different element compositions, Eu anomaly and calculated fO2 for the Timok zircon dataset.
The dataset structure is not balanced, with prevalence of certain sample groups among others. Figure 16 shows the total number of measurements for each sample and deposit.
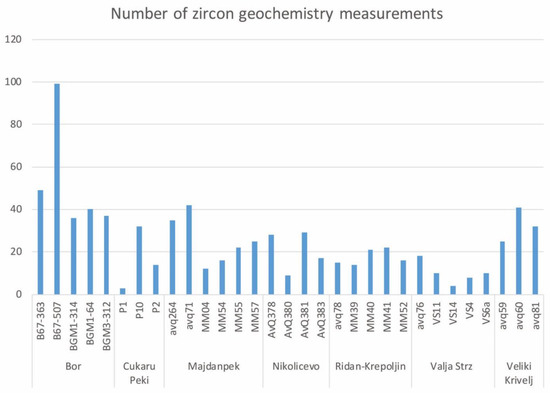
Figure 16.
Number of data points for each sample and deposit.
3.3.1. Exploratory Data Analysis
Several iterations of plotting and outlier detection and removal were performed. First, a pairplot for all of the elements was used to see if there is a good separation between the samples from different deposits (reduced version of this histogram with only four elements in Figure 17, Figure 18 and Figure 19 imply that there is relatively good separation for Hf and P when using deposits as sample groups).
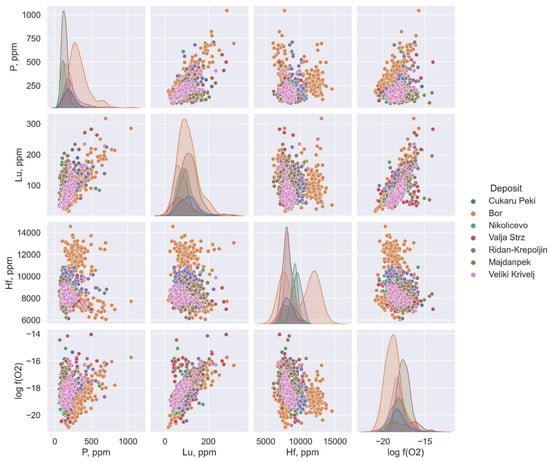
Figure 17.
Pairplot for P, Lu, Hf and the calculated log fO2, data split by deposit.
We tested the decision tree and random forest algorithms implemented in Python to see whether the zircons can be correctly linked to their location based on their geochemical signatures (Python code in Supplementary Material S2). The dataset contains 869 analyses of zircons from Timok area.
3.3.2. Workflow
Seventy percent of the dataset was used to train the decision tree algorithm, and 30% was used for testing the accuracy of prediction of the deposits or occurrences. We used all the geochemical analyses, as well as Eu and log fO2 calculated after [59] for each sample as the input, and deposit or locality name as the target label.
We calculated precision on the test dataset as the main validation metric, compared the results from different algorithms and plotted the confusion matrix to see how well the prediction works and what samples are misclassified.
3.3.3. Predictions
Figure 18 shows the confusion matrix for predicting the deposit or area based on zircon geochemistry. Generally, similar deposits get confused (for example, Nikolicevo and Cukaru Peki). The main diagonal represents correctly predicted deposits or localities, with the number of samples in each correctly predicted category.
The accuracy of prediction for the test set for different algorithms is shown in Table 1. Taking into account the lack of balance between the different sample groups, we used both the ordinary train/test split and the 10-fold cross-validation to split the dataset into training and test set.

Table 1.
Comparison of prediction accuracy for deposit and the mineralized/weakly mineralized/barren rock type, testing whether 10-fold cross-validation will change the accuracy.

Figure 18.
Confusion matrix for classifying rocks from different deposits.
We used trace element data and Eu anomaly as input variables for the decision tree and random forest classifiers. Adding log fO2, calculated after [59], did not change the accuracy of the prediction.
The feature importance plots (Figure 19) illustrate that Ba and P are the most important features contributing to the prediction of deposits, closely followed by U, Ce, Hf and Th.

Figure 19.
SHAP plot of relative feature importance for the training set, showing relative importance of each input variable for the random forest classifier, using trace elements and Eu anomaly as input variables (a), and adding calculated log fO2 (b).
4. Discussion and Conclusions
We have obtained geochemical data for zircons from Bor and Cukaru Peki, and performed a benchmark comparison to a weakly mineralized younger intrusion of Valja Strz and the barren Ridan-Krepoljin zone. The results provided the following insights into the development of magmatic systems of these deposits.
Eu anomaly vs. Hf shows that andesites at Bor are distinctly higher in Hf and plot above 0.3 in terms of Eu anomaly, while approximately half of Valja Strz zircons are characterized by lower Eu anomaly, which could reflect that Bor andesite was evolving towards suppressed plagioclase crystallization under higher oxygen fugacity conditions [35,37]. Higher Hf of older host rock volcanics at Bor can mean that the host rock andesites were emplaced before the replenishment of the magma chamber and represent evolved melts before mixing; alternatively, deep Borska Reka porphyries might represent a totally unrelated magmatic event. Generally speaking, most of the zircons from this study, as well as from the larger dataset from the Timok area [23], plot above 0.3 in terms of Eu anomaly. The comparison of Bor, Cukaru Peki, Veliki Krivelj samples to weakly mineralized Valja Strz and barren Ridanj Krepoljin suggests that the cut-off value for magmas that are capable of producing deposits with significant Cu endowment would be around 0.6 in terms of Eu anomaly in the Timok area.
Based on Th/U vs. Yb/Gd, we suggest that magma mixing was important for Cukaru Peki, while Bor rocks followed the normal fractionation trend to a greater degree.
Fractionation trends controlled by apatite, hornblende, zircon and garnet [37] in Yb/Gd vs. Ce/Sm coordinates show that in addition to different starting compositions, the role of apatite crystallization was more pronounced at Bor than at Cukaru Peki. Late low-grade porphyry at Bor is influenced by garnet crystallization, which is expressed in lower Yb/Gd at similar Ce/Sm values compared to Bor host-rock andesites; Cukaru Peki porphyries, both early mineral and late post-mineral are influenced by garnet fractionation trend to a greater degree compared to any rock types from Bor.
We have demonstrated the salient similarities and differences between Bor and Cukaru Peki and compared the geochemistry of Bor and Cukaru Peki zircons to weakly mineralized Valja Strz rocks.
Based on the dataset collected during this study and the earlier studies of [23] and [24], we demonstrate the possibility of fingerprinting the deposit or locality based on the geochemical characteristics of zircon, and prediction of mineralization potential of the magmatic rocks from the Timok region taking into account not only widely-accepted indicators like Eu value, but a more complex pattern that considers all the measured elements.
Supplementary Materials
The following are available online at https://www.mdpi.com/article/10.3390/geosciences12110396/s1, Supplementary Material S1: zircon geochemistry data, Supplementary Material S2: Python code.
Author Contributions
Conceptualization, D.K. and S.H.; methodology, A.V.Q.; data acquisition and validation, D.K., M.V. and A.V.Q.; writing—original draft preparation, D.K.; writing—review and editing, A.V.Q., M.V. and S.H. All authors have read and agreed to the published version of the manuscript.
Funding
This study was supported by the Swiss National Science Foundation, Project No. 200021_146651 Mineral resources: Physical dynamics driving chemical enrichment of rare metals.
Acknowledgments
We are grateful to RTB Bor and Rakita (currently BEM) for the field support.
Conflicts of Interest
The authors declare no conflict of interest.
References
- Janković, S.; Jelenković, R.; Koželj, D. The Bor Copper and Gold Deposit; QWERTY: Bor, Serbia, 2002. [Google Scholar]
- Jelenković, R.; Milovanović, D.; Koželj, D.; Banješević, M. The Mineral Resources of the Bor Metallogenic Zone: A Review. Geol. Croat. 2016, 69, 143–155. [Google Scholar] [CrossRef]
- Schumacher, F. The Ore Deposits of Jugoslavia and the Development of Its Mining Industry. Econ. Geol. 1954, 49, 451–492. [Google Scholar] [CrossRef]
- Baker, T. Gold ± copper Endowment and Deposit Diversity in the Western Tethyan Magmatic Belt, Southeast Europe: Implications for Exploration. Econ. Geol. 2019, 114, 1237–1250. [Google Scholar] [CrossRef]
- Tončić, T. Balance of Copper Reserves of the Bor Mine: Unpublished Reserve Statement of RTB Bor; 2018. [Google Scholar]
- Pittuck, M.; McGurk, T. NI43-101 Preliminary Economic Assessment of the Cukaru Peki Upper Zone Deposit, Serbia; Nevsun Resources, Ltd.: Vancouver, BC, Canada, 2016. [Google Scholar]
- Armstrong, R.; Kozelj, D.; Herrington, R. The Majdanpek Cu-Au Deposit of Eastern Serbia: A Review. In Super Porphyry Copper and Gold Deposits: A Global Perspective; Porter, T.M., Ed.; PGC Publishing: Linden Park, SA, Australia, 2005; Volume 2, pp. 453–466. [Google Scholar]
- Mioč, P. Osnovna Geološka Karta SFR Jugoslavije 1:10,0000; Savezni Geološki Zavod: Belgrade, Serbia, 1983. [Google Scholar]
- Đorđević, M.; Banješević, M. The Geology of the Southern Part of Timok Eruptive Area, the Interpreter Booklet and Geological Map 1:50,000; Savezno Ministarstvo za Privredu: Belgrade, Serbia, 1997. [Google Scholar]
- Starostin, V.I. Bor and Maidanpek Copper Deposits in Yugoslavia. Int. Geol. Rev. 1970, 12, 370–380. [Google Scholar] [CrossRef]
- Jelenkovic, R.; Kozelj, D.; Serafimovski, T. Some Genetic Aspects of the Bor Copper-Gold Deposit (Serbia). Geol. Maced. 2001, 15, 1–5. [Google Scholar]
- Koželj, D. Epithermal Gold Mineralization in the Bor Metallogenic Zone: Morphogenetic Types, Structural-Texture Varieties and Potentiality; Grafomed: Bor, Serbia, 2002. [Google Scholar]
- Drovenik, M.; Antonijević, I.; Mićić, I. New Reference on Magmatism and Geological Setting of the Timok Eruptive Area. Vesnik Geozavoda 1962, A 20, 67–79. [Google Scholar]
- Janković, S.; Terzić, M.; Aleksić, D.; Karamata, S.; Spasov, T.; Jovanović, M.; Miličić, M.; Mišković, V.; Grubić, A.; Antonijević, I. Metallogenic Features of Copper Deposits in the Volcano-Intrusive Complexes of the Bor District, Yugoslavia. In European Copper Deposits; Janković, S., Sillitoe, R.H., Eds.; SGA Special Publication: Lubbock, TX, USA, 1980; Volume 1, pp. 42–49. [Google Scholar]
- Janković, S.; Jovanović, M.; Karamata, S.; Lovrić, A. Isotopic Age of Some Rocks from the Timok Eruptive Area; Academy of Serbian Science and Arts, Natural Science and Mathematics: Belgrade, Serbia, 1981; Volume 48, pp. 87–94. [Google Scholar]
- Von Quadt, A.; Peytcheva, I.; Cvetkovic, V.; Banjesevic, M.; Kozelj, D. Geochronology, Geochemistry and Isotope Tracing of the Cretaceous Magmatism of East Serbia as Part of the Apuseni-Timok-Srednogorie Metallogenic Belt. Geol. Carpathia 2002, 53, 175–177. [Google Scholar]
- Clark, A.H.; Ullrich, T.D. 40Ar-39 Ar Age Data for Andesitic Magmatism and Hydrothermal Activity in the Timok Massif, Eastern Serbia: Implications for Metallogenetic Relationships in the Bor Copper-Gold Subprovince. Miner. Depos. 2004, 39, 256–262. [Google Scholar] [CrossRef]
- Zimmerman, A.; Stein, H.J.; Hannah, J.L.; Koželj, D.; Bogdanov, K.; Berza, T. Tectonic Configuration of the Apuseni-Banat-Timok-Srednogorie Belt, Balkans-South Carpathians, Constrained by High Precision Re-Os Molybdenite Ages. Miner. Depos. 2008, 43, 1–21. [Google Scholar] [CrossRef]
- Banješević, M. Upper Cretaceous Magmatic Suites of the Timok Magmatic Complex. Geol. Anal. Balk. Poluostrva 2010, 71, 13–22. [Google Scholar] [CrossRef]
- Kolb, M.; Von Quadt, A.; Peytcheva, I.; Heinrich, C.A.; Fowler, S.J.; Cvetkovic, V. Adakite-like and Normal Arc Magmas: Distinct Fractionation Paths in the East Serbian Segment of the Balkan-Carpathian Arc. J. Petrol. 2012, 54, 421–451. [Google Scholar] [CrossRef]
- Knaak, M.; Márton, I.; Tosdal, R.M.; van der Toorn, J.; Davidović, D.; Strmbanović, I.; Zdravkovic´, M.; Živanović, J.; Hasson, S. Geologic Setting and Tectonic Evolution of Porphyry Cu-Au, Polymetallic Replacement, and Sedimentary Rock-Hosted Au Deposits in the Northwest Area of the Timok Magmatic Complex, Serbia. In Tectonics and Metallogeny of the Tethyan Orogenic Belt; Richards, J.P., Ed.; Society of Economic Geologists Special Publication: Shaffer Parkway Littleton, CO, USA, 2016; Volume 19, pp. 1–28. [Google Scholar]
- Von Quadt, A.; Peytcheva, I.; Heinrich, C.; Cvetković, V.; Banjesević, M.; Andrew, C.J. Upper Cretaceous Magmatic Evolution and Related Cu–Au Mineralization in Bulgaria and Serbia; Irish Association for Economic Geology: Dublin, Ireland, 2007; pp. 861–864. [Google Scholar]
- Kolb, M. Geochronology and Isotope Geochemistry of Magmatic Rocks from Western Srednogorie (Bulgaria) and Timok Magmatic Complex (East Serbia). Ph.D. Thesis, ETH Zurich, Zurich, Switzerland, 2011. [Google Scholar]
- Banješević, M.; Cvetković, V.; Von Quadt, A.; Ljubović Obradović, D.; Vasić, N.; Pačevski, A.; Peytcheva, I. New Constraints on the Main Mineralization Event Inferred from the Latest Discoveries in the Bor Metallogenetic Zone (BMZ, East Serbia). Minerals 2019, 9, 672. [Google Scholar] [CrossRef]
- Lips, A.L.; Herrington, R.J.; Stein, G.; Kozelj, D.; Popov, K.; Wijbrans, J.R. Refined Timing of Porphyry Copper Formation in the Serbian and Bulgarian Portions of the Cretaceous Carpatho-Balkan Belt. Econ. Geol. 2004, 99, 601–609. [Google Scholar] [CrossRef]
- Lerouge, C.; Bailly, L.; Béchu, E.; Fléhoc, C.; Genna, A.; Lescuyer, J.L.; Stein, G.; Gillot, P.Y.; Kozelj, D. Age and Origin of Advanced Argillic Alteration at the Bor Cu-Au Deposit, Serbia; Mao, J., Bierlein, F.P., Eds.; Springer: Berlin/Heidelberg, Germany, 2005; pp. 41–44. [Google Scholar]
- Karamata, S.; Knežević, V.; Pecskay, Z.; Đorđević, M. Magmatism and Metallogeny of the Ridanj-Krepoljin Belt (Eastern Serbia) and Their Correlation with Northern and Eastern Analogues. Miner. Depos. 1997, 32, 452–458. [Google Scholar] [CrossRef]
- Jackson, S.E.; Pearson, N.J.; Griffin, W.L.; Belousova, E.A. The Application of Laser Ablation-Inductively Coupled Plasma-Mass Spectrometry to in Situ U–Pb Zircon Geochronology. Chem. Geol. 2004, 211, 47–69. [Google Scholar] [CrossRef]
- Wiedenbeck, M.; Alle, P.; Corfu, F.; Griffin, W.L.; Meier, M.; Oberli, F.V.; Von Quadt, A.; Roddick, J.C.; Spiegel, W. Three Natural Zircon Standards for U-Th-Pb, Lu-Hf, Trace Element and REE Analyses. Geostand. Newsl. 1995, 19, 1–23. [Google Scholar] [CrossRef]
- Kennedy, A.K.; Wotzlaw, J.F.; Schaltegger, U.; Crowley, J.L.; Schmitz, M. Eocene Zircon Reference Material for Microanalysis of U-Th-Pb Isotopes and Trace Elements. Can. Mineral. 2014, 52, 409–421. [Google Scholar] [CrossRef]
- Sláma, J.; Košler, J.; Condon, D.J.; Crowley, J.L.; Gerdes, A.; Hanchar, J.M.; Horstwood, M.S.A.; Morris, G.A.; Nasdala, L.; Norberg, N. Plešovice Zircon—A New Natural Reference Material for U–Pb and Hf Isotopic Microanalysis. Chem. Geol. 2008, 249, 1–35. [Google Scholar] [CrossRef]
- Paton, C.; Hellstrom, J.; Paul, B.; Woodhead, J.; Hergt, J. Iolite: Freeware for the Visualisation and Processing of Mass Spectrometric Data. J. Anal. At. Spectrom. 2011, 26, 2508–2518. [Google Scholar] [CrossRef]
- Vermeesch, P. IsoplotR: A Free and Open Toolbox for Geochronology. Geosci. Front. 2018, 9, 1479–1493. [Google Scholar] [CrossRef]
- Gehrels, G.E.; Valencia, V.A.; Ruiz, J. Enhanced Precision, Accuracy, Efficiency, and Spatial Resolution of U-Pb Ages by Laser Ablation–Multicollector–Inductively Coupled Plasma–Mass Spectrometry. Geochem. Geophys. Geosyst. 2008, 9, Q03017. [Google Scholar] [CrossRef]
- Dilles, J.H.; Kent, A.J.; Wooden, J.L.; Tosdal, R.M.; Koleszar, A.; Lee, R.G.; Farmer, L.P. Zircon Compositional Evidence for Sulfur-Degassing from Ore-Forming Arc Magmas. Econ. Geol. 2015, 110, 241–251. [Google Scholar] [CrossRef]
- Anders, E.; Grevesse, N. Abundances of the Elements: Meteoritic and Solar. Geochim. Cosmochim. Acta 1989, 53, 197–214. [Google Scholar] [CrossRef]
- Lee, R.G.; Dilles, J.H.; Tosdal, R.M.; Wooden, J.L.; Mazdab, F.K. Magmatic Evolution of Granodiorite Intrusions at the El Salvador Porphyry Copper Deposit, Chile, Based on Trace Element Composition and U/Pb Age of Zircons. Econ. Geol. 2017, 112, 245–273. [Google Scholar] [CrossRef]
- Zou, S.; Chen, X.; Brzozowski, M.J.; Leng, C.-B.; Xu, D. Application of Machine Learning to Characterizing Magma Fertility in Porphyry Cu Deposits. J. Geophys. Res. Solid Earth 2022, 127, e2022JB024584. [Google Scholar] [CrossRef]
- Asadi, H.H.; Porwal, A.; Fatehi, M.; Kianpouryan, S.; Lu, Y.-J. Exploration Feature Selection Applied to Hybrid Data Integration Modeling: Targeting Copper-Gold Potential in Central Iran. Ore Geol. Rev. 2015, 71, 819–838. [Google Scholar] [CrossRef]
- Zhang, S.E.; Bourdeau, J.E.; Nwaila, G.T.; Corrigan, D. Towards a Fully Data-Driven Prospectivity Mapping Methodology: A Case Study of the Southeastern Churchill Province, Québec and Labrador. Artif. Intell. Geosci. 2021, 2, 128–147. [Google Scholar] [CrossRef]
- Dangeti, P. Statistics for Machine Learning; Packt Publishing Ltd.: Birmingham, UK, 2017. [Google Scholar]
- Lu, Y.J.; Loucks, R.R.; Fiorentini, M.L.; McCuaig, T.C.; Evans, N.J.; Yang, Z.M.; Hou, Z.Q.; Kirkland, C.L.; Parra-Avila, L.A.; Kobussen, A. Zircon Compositions as a Pathfinder for Porphyry Cu ± Mo ± Au Deposits; Society of Economic Geologists Special Publication: Shaffer Pkwy Littleton, CO, USA, 2016; Volume 19, pp. 329–347. [Google Scholar]
- Lundberg, S.M.; Erion, G.; Chen, H.; DeGrave, A.; Prutkin, J.M.; Nair, B.; Katz, R.; Himmelfarb, J.; Bansal, N.; Lee, S.-I. From Local Explanations to Global Understanding with Explainable AI for Trees. Nat. Mach. Intell. 2020, 2, 56–67. [Google Scholar] [CrossRef]
- Jakubec, J.; Pittuck, M.; Samoukovic, M.; MacSporran, G.; Manojlovic, P.; Bunyard, M.; Duinker, R.; Sucharda, M. NI43-101 Technical Report—Pre-Feasibility Study for the Timok Project, Serbia; Nevsun Resources, Ltd.: Vancouver, BC, Canada, 2018. [Google Scholar]
- Velojić, M.; Jelenkovic, R.; Cvetkovic, V. Fluid Evolution of the Čukaru Peki Cu-Au Porphyry System (East Serbia) Inferred from a Fluid Inclusion Study. Geol. Croat. 2020, 73, 197–209. [Google Scholar] [CrossRef]
- Velojic, M.; Bertrandsson Erlandsson, V. Trace Elements in Different Veins in Chukaru Peki High Sulfidation Deposit, Serbia. In Proceedings of the 1st International Student Conference on Geochemistry and Mineral Deposits, Prague, Czech Republic, 8–9 November 2019. [Google Scholar]
- Ballard, J.R.; Palin, M.J.; Campbell, I.H. Relative Oxidation States of Magmas Inferred from Ce (IV)/Ce (III) in Zircon: Application to Porphyry Copper Deposits of Northern Chile. Contrib. Mineral. Petrol. 2002, 144, 347–364. [Google Scholar] [CrossRef]
- Trail, D.; Watson, E.B.; Tailby, N.D. Ce and Eu Anomalies in Zircon as Proxies for the Oxidation State of Magmas. Geochim. Cosmochim. Acta 2012, 97, 70–87. [Google Scholar] [CrossRef]
- Shen, P.; Hattori, K.; Pan, H.; Jackson, S.; Seitmuratova, E. Oxidation Condition and Metal Fertility of Granitic Magmas: Zircon Trace-Element Data from Porphyry Cu Deposits in the Central Asian Orogenic Belt. Econ. Geol. 2015, 110, 1861–1878. [Google Scholar] [CrossRef]
- Loader, M.A.; Nathwani, C.L.; Wilkinson, J.J.; Armstrong, R.N. Controls on the Magnitude of Ce Anomalies in Zircon. Geochim. Cosmochim. Acta 2022, 328, 242–257. [Google Scholar] [CrossRef]
- Hattori, K.; Wang, J.; Kobylinski, C.; Baumgartner, R.; Morfin, S.; Shen, P. Zircon Composition: Indicator of Fertile Igneous Rocks Related to Porphyry Copper Deposits. Soc. Geol. Appl. Miner. Depos. 2017, 2, 295–298. [Google Scholar]
- Loader, M.A.; Wilkinson, J.J.; Armstrong, R.N. The Effect of Titanite Crystallisation on Eu and Ce Anomalies in Zircon and Its Implications for the Assessment of Porphyry Cu Deposit Fertility. Earth Planet. Sci. Lett. 2017, 472, 107–119. [Google Scholar] [CrossRef]
- Pizarro, H.; Campos, E.; Bouzari, F.; Rousse, S.; Bissig, T.; Gregoire, M.; Riquelme, R. Porphyry Indicator Zircons (PIZs): Application to Exploration of Porphyry Copper Deposits. Ore Geol. Rev. 2020, 126, 103771. [Google Scholar] [CrossRef]
- Wang, J.; Hattori, K.; Yang, Y.; Yuan, H. Zircon Chemistry and Oxidation State of Magmas for the Duobaoshan-Tongshan Ore-Bearing Intrusions in the Northeastern Central Asian Orogenic Belt, NE China. Minerals 2021, 11, 503. [Google Scholar] [CrossRef]
- Stoykov, S.; Peytcheva, I.; von Quadt, A.; Moritz, R.; Frank, M.; Fontignie, D. Timing and Magma Evolution of the Chelopech Volcanic Complex (Bulgaria). Swiss Bull. Mineral. Petrol. 2004, 84, 101–117. [Google Scholar]
- Peytcheva, I.; von Quadt, A.; Neubauer, F.; Frank, M.; Nedialkov, R.; Heinrich, C.; Strashimirov, S. U–Pb Dating, Hf-Isotope Characteristics and Trace-REE-Patterns of Zircons from Medet Porphyry Copper Deposit, Bulgaria: Implications for Timing, Duration and Sources of Ore-Bearing Magmatism. Min. Pet. 2009, 96, 19. [Google Scholar] [CrossRef]
- Wotzlaw, J.F.; Schaltegger, U.; Frick, D.A.; Dungan, M.A.; Gerdes, A.; Günther, D. Tracking the Evolution of Large-Volume Silicic Magma Reservoirs from Assembly to Supereruption. Geology 2013, 41, 867–870. [Google Scholar] [CrossRef]
- Loucks, R.R. Distinctive Composition of Copper-Ore-Forming Arcmagmas. Aust. J. Earth Sci. 2014, 61, 5–16. [Google Scholar] [CrossRef]
- Loucks, R.R.; Fiorentini, M.L.; Henríquez, G.J. New Magmatic Oxybarometer Using Trace Elements in Zircon. J. Petrol. 2020, 61, egaa034. [Google Scholar] [CrossRef]
- Klimentyeva, D.; Driesner, T.; Von Quadt, A.; Tončić, T.; Heinrich, C. Silicate-Replacive High Sulfidation Massive Sulfide Orebodies in a Porphyry Cu-Au System: Bor, Serbia. Miner. Depos. 2020, 56, 1423–1448. [Google Scholar] [CrossRef]
Publisher’s Note: MDPI stays neutral with regard to jurisdictional claims in published maps and institutional affiliations. |
© 2022 by the authors. Licensee MDPI, Basel, Switzerland. This article is an open access article distributed under the terms and conditions of the Creative Commons Attribution (CC BY) license (https://creativecommons.org/licenses/by/4.0/).