Article

ICESat-2 Applications for Investigating Emerging Volcanoes

by
Christine Simurda
1,*,
Lori A. Magruder
1,2,
Jonathan Markel
2,
James B. Garvin
3 and
Daniel A. Slayback
3,4
1
Applied Research Laboratories, University of Texas, Austin, TX 78758, USA
2
Department of Aerospace Engineering and Engineering Mechanics, University of Texas, Austin, TX 78712, USA
3
NASA Goddard Space Flight Center, Greenbelt, MD 20771, USA
4
Science Systems & Applications, Inc., Lanham, MD 20706, USA
*
Author to whom correspondence should be addressed.
Geosciences 2022, 12(1), 40; https://doi.org/10.3390/geosciences12010040
Submission received: 11 December 2021 / Revised: 5 January 2022 / Accepted: 10 January 2022 / Published: 14 January 2022
(This article belongs to the Special Issue Scientific Assessment of Recent Natural Hazard Events)

Abstract

:
Submarine volcanism in shallow waters (<100 m), particularly in remote settings, is difficult to monitor quantitatively and, in the rare formation of islands, it is challenging to understand the rapid-paced erosion. However, these newly erupted volcanic islands become observable to airborne and/or satellite remote sensing instruments. NASA’s ICESat-2 satellite laser altimeter, combined with visible imagery (optical and microwave), provide a novel method of evaluating the elevation characteristics of newly emerged volcanoes and their subaerial eruption products. Niijima Fukutoku-Okanoba (NFO) is a submarine volcano 1300 km south of Tokyo (Ogasawara Archipelago of Japan) that periodically breaches the ocean surface to create new islands that are subsequently eroded. The recent eruption in August 2021 is a rare opportunity to investigate this island evolution using high-resolution satellite datasets with geodetic-quality ICESat-2 altimetry. Lansdat-8 and Planet imagery provide a qualitative analysis of the exposed volcanic deposits, while ICESat-2 products provide elevation profiles necessary to quantify the physical surface structures. This investigation determines an innovative application for ICESat-2 data in evaluating newly emerged islands and how the combination of satellite remote sensing (visible and lidar) to investigate these short-lived volcanic features can improve our understanding of the volcanic island system in ways not previously possible.

1. Introduction

Submarine volcanism presents as underwater fissures (and vents) built from the seafloor volcano-tectonic structure and tend to be more difficult to monitor quantitatively because of the remote locations and the absence of easy observational access (see [1,2]). These instances are predominantly located near mid-ocean ridges or subduction zones (i.e., in back-arc settings often around submarine calderas) and are difficult to measure or observe based on logistical or operational challenges. In situ measurements collected by submerged platforms, ship, uncrewed aircraft systems (drones), or diving techniques (if within the shallow water zone) are primary methods for collecting data on the phenomena but are often limited in coverage and are expensive to implement [3]. Satellite imagery can be used to visibly identify volcanic submarine eruption events in shallow waters predominantly based on the distinct discoloration in the water column [2], but is limited in specific 2D eruption characterizations. This visible coloration change from milky white to a reddish-brown is often caused by very fine materials (tephra) produced from the interaction of the surrounding seawater with the super-heated water from the underwater erupting volcano [4]. These volcanic structures provide an opportunity to investigate the early evolutionary stages of volcanic island systems, thus additional monitoring techniques need to be developed via newly available remote sensing data streams such as satellite laser altimetry (among others).
Of particular interest is the submarine volcano lifecycle between breaching the surface and the subsequent landform erosion relative to the ocean/landform interaction (e.g., Garvin et al. [1], Ramalho et al. [5], and many others). This exposure and degradation offer a unique window of understanding into the volcanic island construction processes, which are often explosive via seawater interactions. Recent studies have demonstrated the potential for satellite datasets to investigate these rare exposure/erosion cycle occurrences. Over the course of ~30 months, Garvin et al. [1] documented the erosion of a newly formed (2015) volcanic island in a back-arc setting in Tonga by estimating the volume and surface area in a series of time series digital elevation models (DEMs) created from WorldView-1, -2, -3, and Pleiades-1A satellite stereo images (calibrated with ground-based differential GPS monuments). The longevity of this volcanic island allowed the metrology of the surface volumetric evolution at a sub-meter scale using this method, complemented by monthly orbital synthetic aperture radar SAR from Canadian Space Agency’s (CSA) Radarsat-2 (Spotlight C-HH collection mode). However, most newly emerged islands typically erode rapidly, often within a few months from initial observation [2]. While nearby countries may collect periodic airborne surveys using digital cameras, this does not provide the temporal scale or geodetic-quality elevation data necessary to accurately evaluate erosional processes on these fragile volcanic structures and their dynamics. The launch of NASA’s Ice, Cloud, and Land Elevation Satellite-2 (ICESat-2), a geodetic-quality multi-beam laser altimeter, has added to the opportunity to observe and quantitatively analyze this type of volcanic system within this short time period. This study aims to determine how the incorporation of ICESat-2 data will improve these investigations, particularly by defining additional surface characteristics. For example, ICESat-2 data can provide absolute elevation data (e.g., geodetic quality, tied to a Center-of-Mass reference frame such as ITRF) at a more continuous time scale as collections occur during both the day and at night; in contrast to visible imagery, as well as unique submarine bathymetry.

1.1. Eruptions of Niijima Fukutoku-Okanoba Volcano

Niijima Fukutoku-Okanoba (NFO), located 5 km northeast of Minami-Ioto (1300 km south of Tokyo, formerly known as South Iwo Jima), is one of the most active submarine volcanoes in Japan [6]. In addition to the most recent observation of this active region (August to December 2021), previous analyses of this particular volcanic system identified five phreatomagmatic and magmatic eruptions (1904, 1914, 1986, 2005, and 2010), three of which formed new islands that subsequently eroded (1904, 1914, and 1986) [7,8,9,10,11]. This cyclic process is seen in satellite imagery that has been used to capture the emergent island, plumes, floating pumice, and discolored seawater from volcanic eruptions since 1986, including the Ohkura et al. [8] study exploiting Landsat TM imagery. However, 2D satellite imagery alone does not provide detail or measurement of the underwater structure. Using in situ echo sounder measurements, the submarine NFO platform after the 2010 eruption was determined to be conical in shape with an oval summit (elongated in the NE-SW direction) reaching 29 m below the surface before the most recent eruption, a basal diameter of ~2 km, and a height of ~200 m [9,10]. Figure 1 shows the summit structure with dimensions estimated to be 1 km by 1.5 km. As the submarine volcanic construct continues to build closer to the water surface, the discoloration caused by a submarine eruption over the years has been identified in ASTER, Landsat, AVNIR-2, and other satellite systems [11].
On 12 August 2021, indication of a surtseyan eruption was observed rising 16 km into the atmosphere with associated basal surge events. The proximity of the volcano to the ocean surface before the eruption in this case provided the conditions for the interaction of water and magmatic material that results in enhanced explosivity (e.g., surtseyan style). The eruption produced a newly exposed island formation that makes up the volcanic tuff cone likely comprised of trachyandesitic ash and pumice. Recently, an overflight by the Japan Coast Guard on 11 November 2021 reported that the size of the western island had persisted and white fumarolic plumes and bubbling on the ocean surface could be seen [13]. Further synthetic aperture radar (SAR) observations from CSA’s Radarsat Constellation Mission (RCM) acquired during 10–14 November 2021 indicate that the island had lost ~60% of its August footprint. These observations, at a 12-day repeat cycle, continue to provide invaluable insight into the event dynamics. While erosional processes have greatly affected the most recent deposited surfaces, continued activity may produce additional island building events in this highly active region, as in the recent past.

1.2. ICESat-2

The Advanced Topographic Laser Altimeter System (ATLAS) instrument onboard ICESat-2 provides laser altimetry at a wavelength of 532 nm for 6 independent beams. The primary science objective of the mission is focused on a cryospheric time series over the Polar Regions [14,15], but continual data collection over the full orbit provides elevations to a wide range of other scientific disciplines. With continued and nominal operations since 2018, the benefitted scientific applications have significantly expanded even beyond the initial mission scope [16]. The 0.7-m horizontal sampling elevation data provides high resolution surface detail that can aid in studies of remotely located sites that were previously not available. The higher level along-track products, including land and vegetation (ATL08), ocean (ATL12), and ice sheets (ATL06) for example [17,18,19], use optimized algorithms based on the surface type, derived from the ATL03 geolocated photon product input. Each product takes into account the expected signal response of a particular surface to accurately calculate the elevation estimates at relevant length scales, providing distinctive output for specific investigation goals.
The ATL08 product was developed to distinguish between multiple surfaces (ground surface and vegetation specifically) [17] by processing the ATL03-identified signal [15] with an additional noise filtering algorithm that accounts for topography and canopy cover [20]. The true ground surface and vegetation structure are further defined using algorithms to remove topographic effects and label each signal photon as terrain, canopy, or top of canopy. Canopy features are also further classified as top of canopy and canopy using a spline with constraints for the upper and lower proximity. To improve the spatial resolution of the 100-m ATL08 product, each ATL08-labeled photon is linked to the original ATL03 point cloud to provide a per photon classification establishing the original ~0.7 m resolution. This lidar product has abundant applications in the mid-latitudes and has been shown to be ideal over ocean and land contact zones, including the extraction of bathymetric and/or water column estimates [21,22,23,24]. ICESat-2 products also have an ability to provide alternative signal identification for other applications and use cases beyond those surfaces originally defined for the mission parameters. The ATL08-labeled photons specifically allow for the opportunity to evaluate the absolute elevation of surfaces that previously were solely investigated via visible imagery for 2-dimensional or derived 3-dimensional analysis based on a relative spectral response.
With the application of high spatial resolution ICESat-2 altimetry data, a multi-instrument approach creates the opportunity to investigate the cycle of emerging volcanic islands. This is applicable to the recent NFO event but also the surtseyan island in Tonga (Hunga Tonga Hunga Ha’apai) [25]. The visible satellite images provide a reasonable temporal basis for monitoring the development and erosion within the horizontal plane of emerging volcanic deposits, but most lack a vertical extent estimate. Ultimately, the tandem use of high vertical accuracy lidar data with visible data (Landsat, Sentinel, RCM SAR) provides the critical combination necessary to investigate complex surfaces while the space-based vantage point offers access to remote locations with relevant spatial and temporal detail. Recent advances in water column and bathymetric analyses from ICESat-2 data also present the possible investigation of shallow water subsurface returns, where traditional ship-based systems are highly limited due to access.

2. Materials and Methods

Visible imagery from Landsat-8 pan-sharpened C1 Level-1 Operational Land Image (OLI) at a 15 m resolution and Planet imagery at a 3 m resolution were collected over a month and a half at the highest temporal resolution possible for each system (every 16 days for Landsat 8 and daily for Planet) to evaluate the areal changes over time caused by erosion (Landsat-8 images courtesy of the U.S. Geological Survey, [26]). A total of two Landsat 8 and nine Planet imagery collections were available for this study after the removal of cloudy or non-ideal data. Planet data were manually aligned using ground control points, allowing for direct comparison between collections. These data are in addition to ongoing studies with Maxar and CSA RCM observational data focused on the quantification of the disappearance of the island in comparison to a similar event at Tonga [1,3].
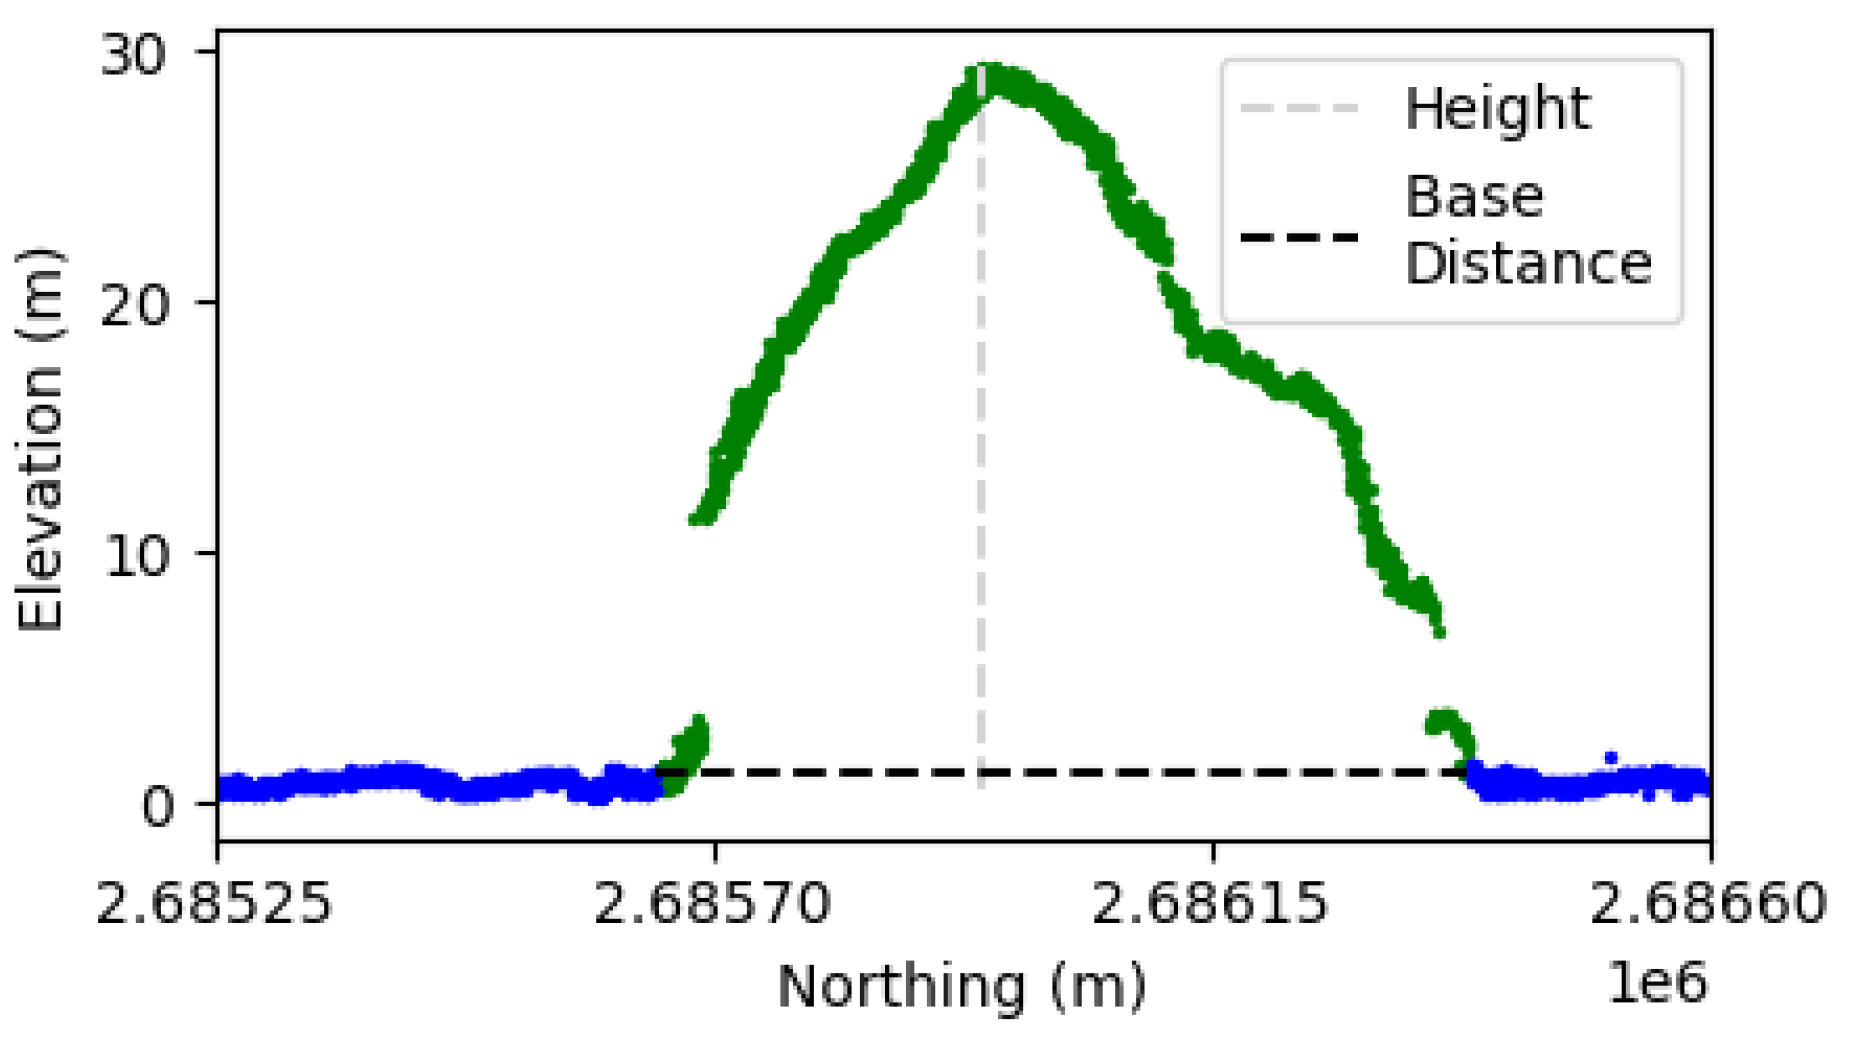
Two ICESat-2 ATL03 data collections (release 005) were manually classified to identify the signal photons-associated sea surface and exposed ground reflections. This manual process is aided by the calculated photon density/distribution aspects and the information gleaned from the photon labels in the ATL08 product (ground/canopy) that can be indexed back to the ATL03 resolution. The contact zone between ground and sea surface photons is defined by the significant and constant increase in elevation relative to the water surface accounting for wave properties. The current ATL08 algorithm does not delineate between land and sea surface photons in its labeling process, thus requiring manual classification, but can extract the terrain surface without intervention. Figure 2 depicts how physical extent metrics (height, along-track distance), and area, are estimated from the ground-labeled photons using an integration trapezoidal method for the sampled surface. The ATL03 sea surface-labeled photons were also processed using an adapted ATL08 algorithmic method outlined by Klotz et al. [27] to estimate the significant wave structure and length metrics for the region. This method relies on a smoothing Savitzky–Golay median and iterative extent filtering of the wave crests and troughs to calculate local wave properties. Additionally, to understand better the sub-surface characteristics, the number of labeled noise photons within 10 m above and 10 m below the surface were calculated. This allows for radiometric normalization (point density and scattering of the water column) by removing observed atmospheric scattering or noise points from the subaqueous environment and derive quantitative and qualitative information about the turbidity or dynamic sediment content.

3. Results

3.1. Visible Imagery: Planet

Figure 3 is a time series showing the observed 2D erosion process of the exposed tuff cone walls over roughly a month and a half from deposition of the August 2021 NFO event. The exposed part of smaller eastern side of the tuff cone is fully eroded within a few weeks of the eruption and most likely is comprised of ash and pumice, similar to prior eruptions. The exposed western section of the tuff cone is significantly more developed suggesting that the eruption deposited more material in this direction. Continued monitoring of this western island of the tuff cone can provide important information about the durability of the deposited materials from the most recent eruption to the interaction with the ocean. However, the main limitation of this type of visible evaluation is the lack of elevation data providing a more accurate estimate of total volume.

3.2. Lidar and Visible Analysis

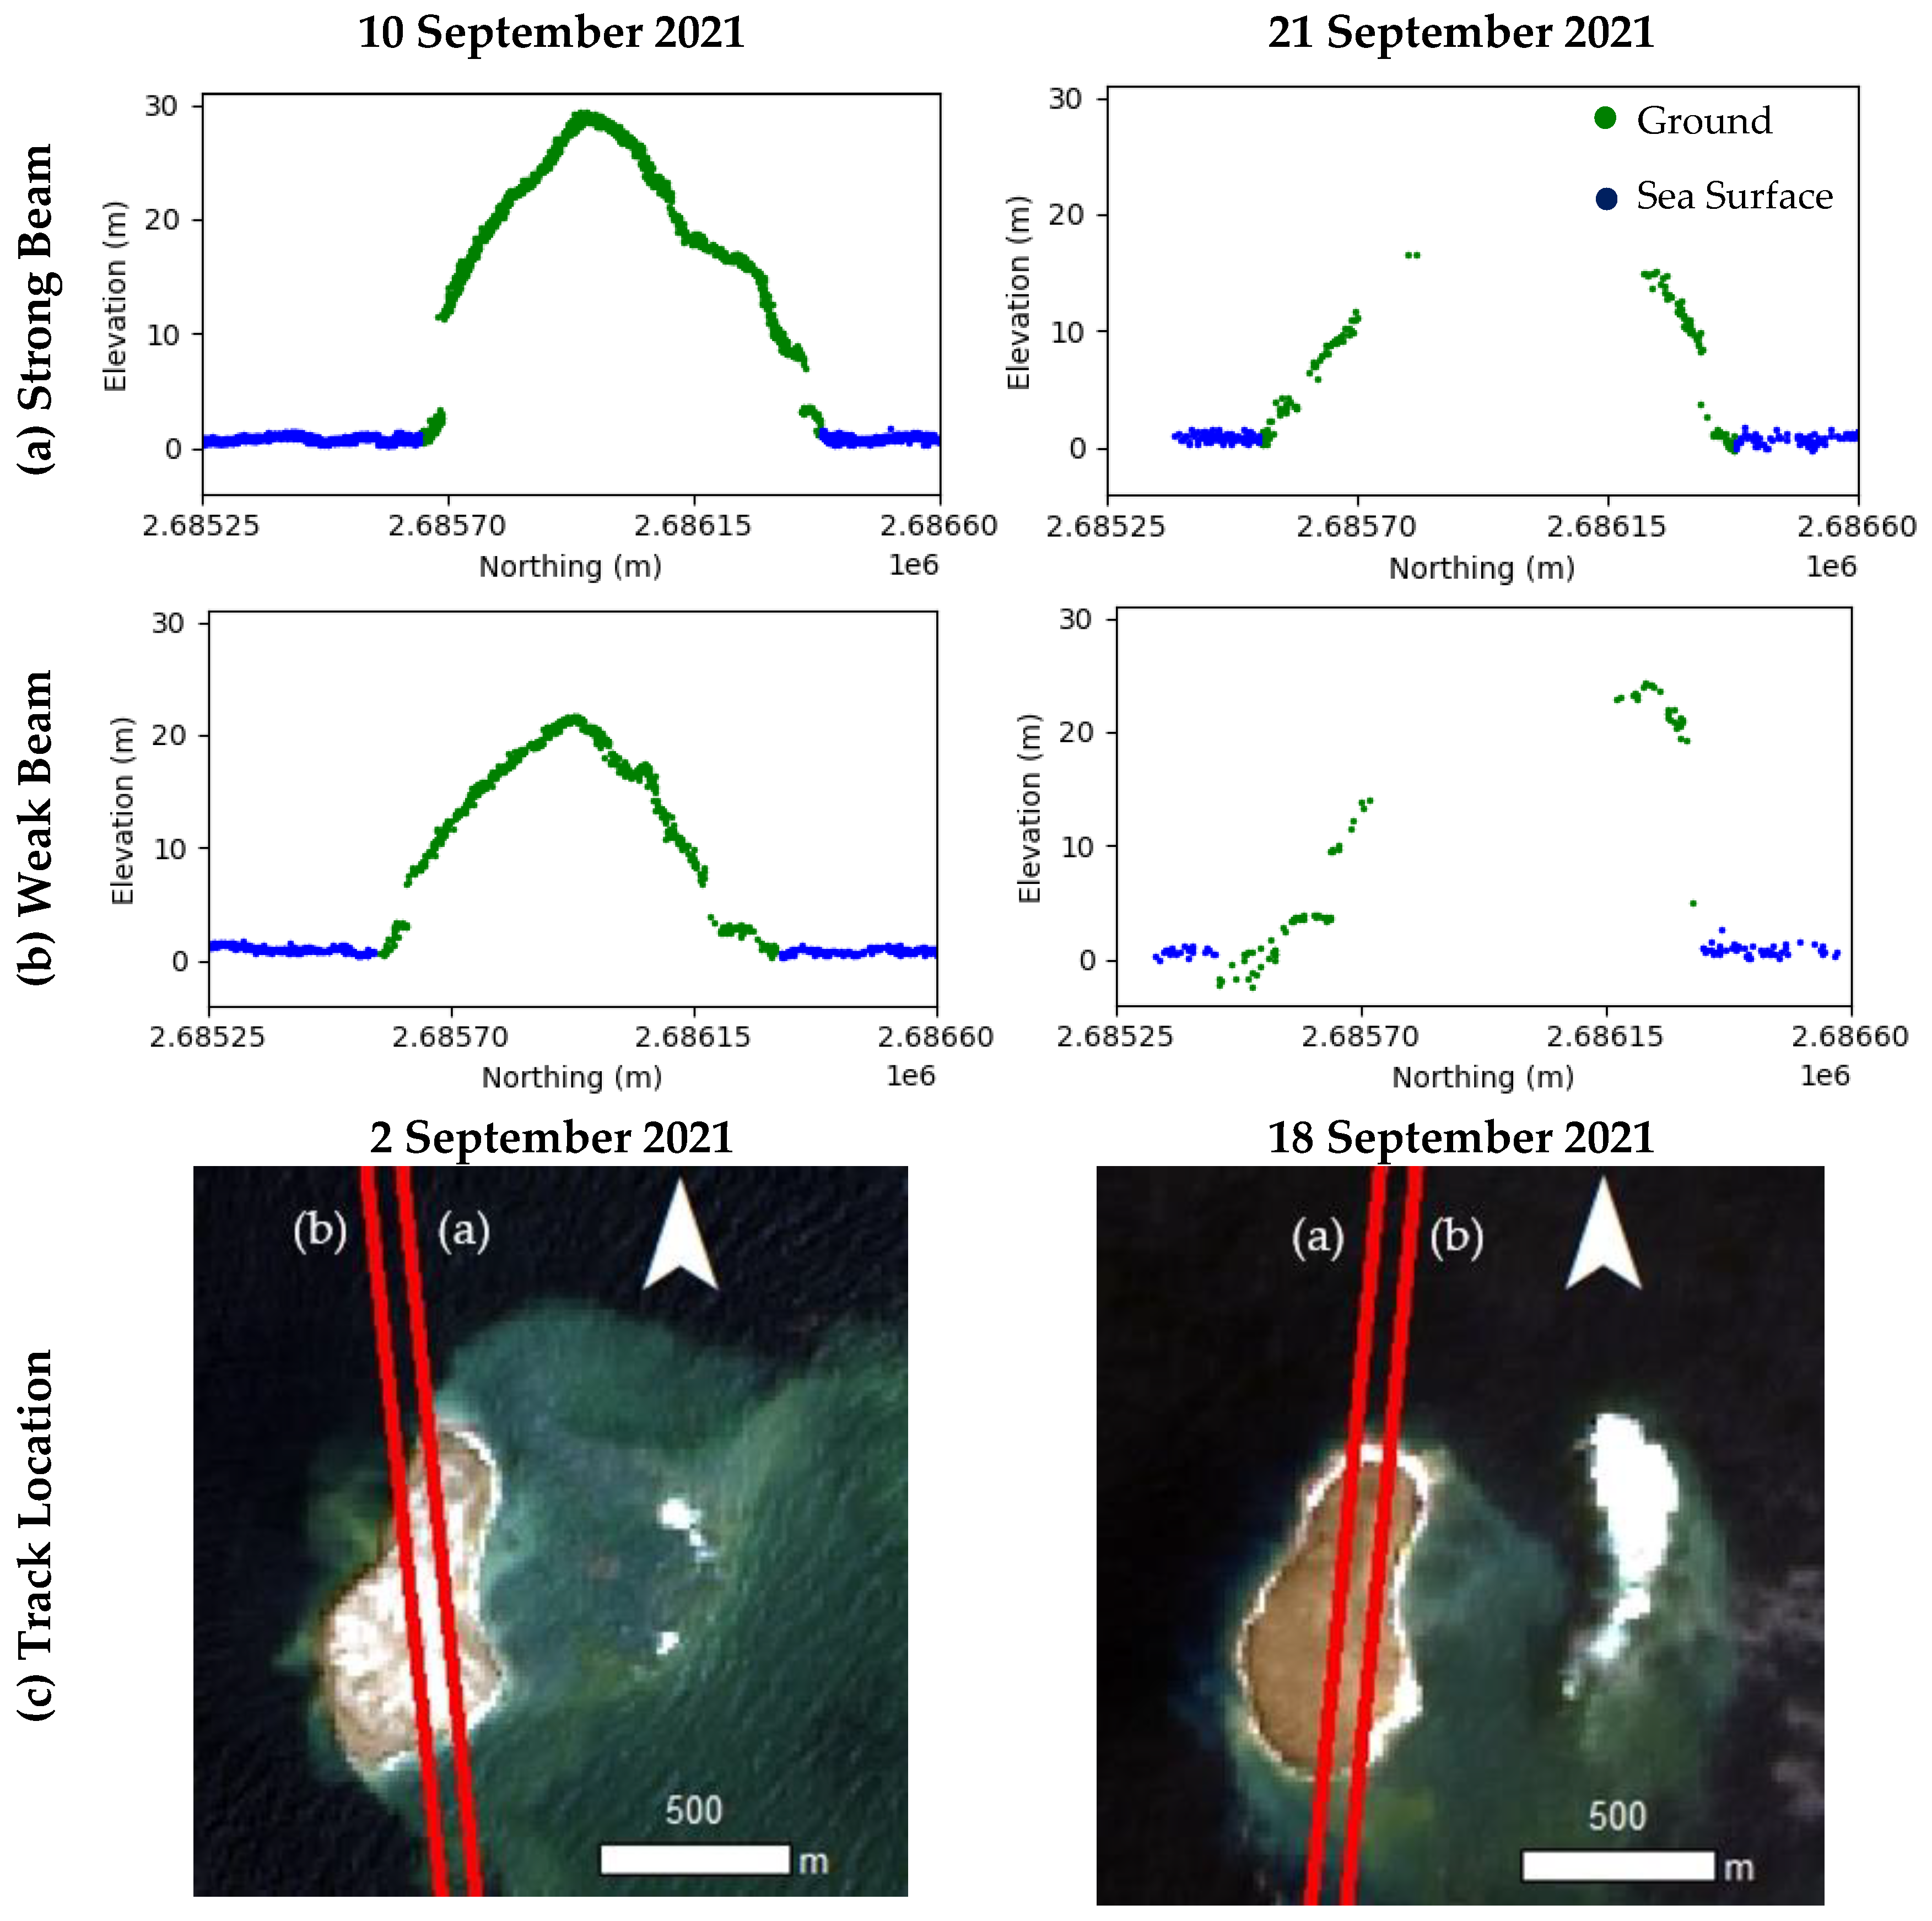
ICESat-2-labeled photons (ground and sea surface), as seen in Figure 4, offer a method to evaluate the geodetic elevation profile of the subaerial NFO island structures and aide the 2D interpretation from satellite imagery observations (Figure 3). Ground labeled photons are used to estimate the maximum height and base extent of the exposed surface at a high spatial resolution, providing a third dimension to the visible imagery. Investigating the iterative statistics, the overall shape of the ICESat-2 profile also presents the ability to estimate the vertical transect area. The combined estimates of the horizontal coverage area, from both Planet or Landsat 8 imagery, and the vertical transect area from ICESat-2 data establish a critical three-dimensional perspective of the newly-emerged island.
The ICESat-2 overpass on 10 September 2021 shows that the western island created by the August 2021 eruption of NFO had a height just under 30 m ~3.5 weeks after the primary constructional eruption phase. Strong signal responses from both the strong and weak beam collections (4:1 energy ratio) demonstrate the potential for using ICESat-2 to monitor and/or evaluate the vertical dimension of newly emerged islands. The collection orientation of the tracks also samples the widest extent of the remaining NFO Island, providing an ideal transect to estimate the vertical exposed area. However, the signal loss for both transects from the 21 September 2021 collection near the peak of the island, likely due to the presence of either clouds or atmospheric attenuation, reveals a limitation in the geometric analysis. While this later track does not allow for height and area extraction, the elevation profile may prove to be more useful with additional collections to evaluate the surfaces sampled. Table 1 provides the physical measurements of the island’s height, base width, and geographical area derived from the ICESat-2 elevations for two satellite overpasses.
The space-based lidar data can also be used to derive additional surface parameters. Depending on the alignment of the ICESat-2 track with the volcanic tuff cone (i.e., whether perpendicular or parallel), the measured topography of these lidar transects can potentially be used to evaluate changes assumedly due to sediment transport (deposition/erosion) during the eruptive event and just thereafter. With successive collections, these tracks can be used to estimate the erosion over time of newly-formed islands. However, there is still a challenge in terms of the orientation of the satellite ground-tracks and the island as often repeat measurements do not traverse over the peak of the island structure or the signal is simply obstructed by cloud cover or atmospheric scattering. Either situation prevents the use of the geometric parameterization to monitor a volcano lifecycle.

3.3. Potential Water Column Products

Characterization of the exposed surface structure is not the only advancement in investigation techniques allotted with the use ICESat-2 data. Further analysis of the ICESat-2 track from 10 September 2021 reveals a difference in the signal response within the water column between the north and south sides of the exposed volcanic structure. This is an important observation in the sense that other remote sensing techniques are not able to access the shallow submarine erosion characteristics. And, while these photons likely contain a combination of noise and signal due to the scattering of sub-surface sediment, the response correlates with erosional processes affecting the shallow water area, providing an opportunity for interpretation of the island dynamics. Suffice to say that this is one of the significant advantages of ICESat-2 bathymetric capabilities as other techniques cannot provide these shallow water estimates over time. With the realization that ICESat-2 can provide such observations, the evaluation of the lifecycle of shallow submarine erosion physics informs expectation on future events. Estimation of the wave structure from Figure 5e,f presents only a slight difference between wave heights (averaging 0.57 m on the south side vs. 0.72 m within 1 km on the north side), further reinforcing the hypothesis that the difference in water column noise is measuring an estimate of turbidity.
The location of higher photon density (south side) compares with the coloration difference in the Planet imagery in Figure 5a, suggesting the presence of eroded particles/material in the water column. Comparison of the normalized sub-surface photon returns within the shallow water zone on both sides of the island in Figure 5i,j shows, roughly, a three times greater return in the southern side, reinforcing the hypothesis of increased turbidity in this area. Further investigation of this theory may establish a quantitative method using the ATLAS radiometric response to evaluate shallow water erosion.

4. Discussion

This rapid response technique using both satellite laser altimetry and visible (and SAR) satellite imagery provides a novel method for evaluating emerging volcanic structures. Since submarine volcanism occurs predominately in more remote oceanic locations, in situ and continuous measurements are limited, which elevates the need for using the space-based vantage point to monitor the dynamics associated with these events. This effort establishes one specific combinations of instrument observations to quantify the development and erosion of volcanic systems, such as NFO, via some of the most recent on-orbit resources to fill in the gaps in our current knowledge of the physical dynamics and scientific realization. ICESat-2 products are absolute elevation profiles with high vertical and horizontal accuracy that can be used to quantify the topography, environmental characteristics, and topographic change due to island erosion in the case of repeat measurements. While visible imagery from either the Planet or Landsat-8 instruments acquire a high temporal resolution, ICESat-2 data offers the ability to quantify the physical elevation extents of the exposed structure, such as maximum height, base distance, and area, from both day and night collections. Visible imagery is limited to daytime collections and thus ICESat-2 altimetry data can improve the potential temporal resolution used to study an emerging volcanic island, as well as topographic ground-control for the time-series of meter-scale satellite stereo DEM’s as have been used when possible (as in [1]). The initial qualitative and partial quantitative analyses presented demonstrates how ICESat-2 satellite altimetry can significantly improve investigations of remote locations previously limited to space-based imagery, particularly by adding the vertical dimension.
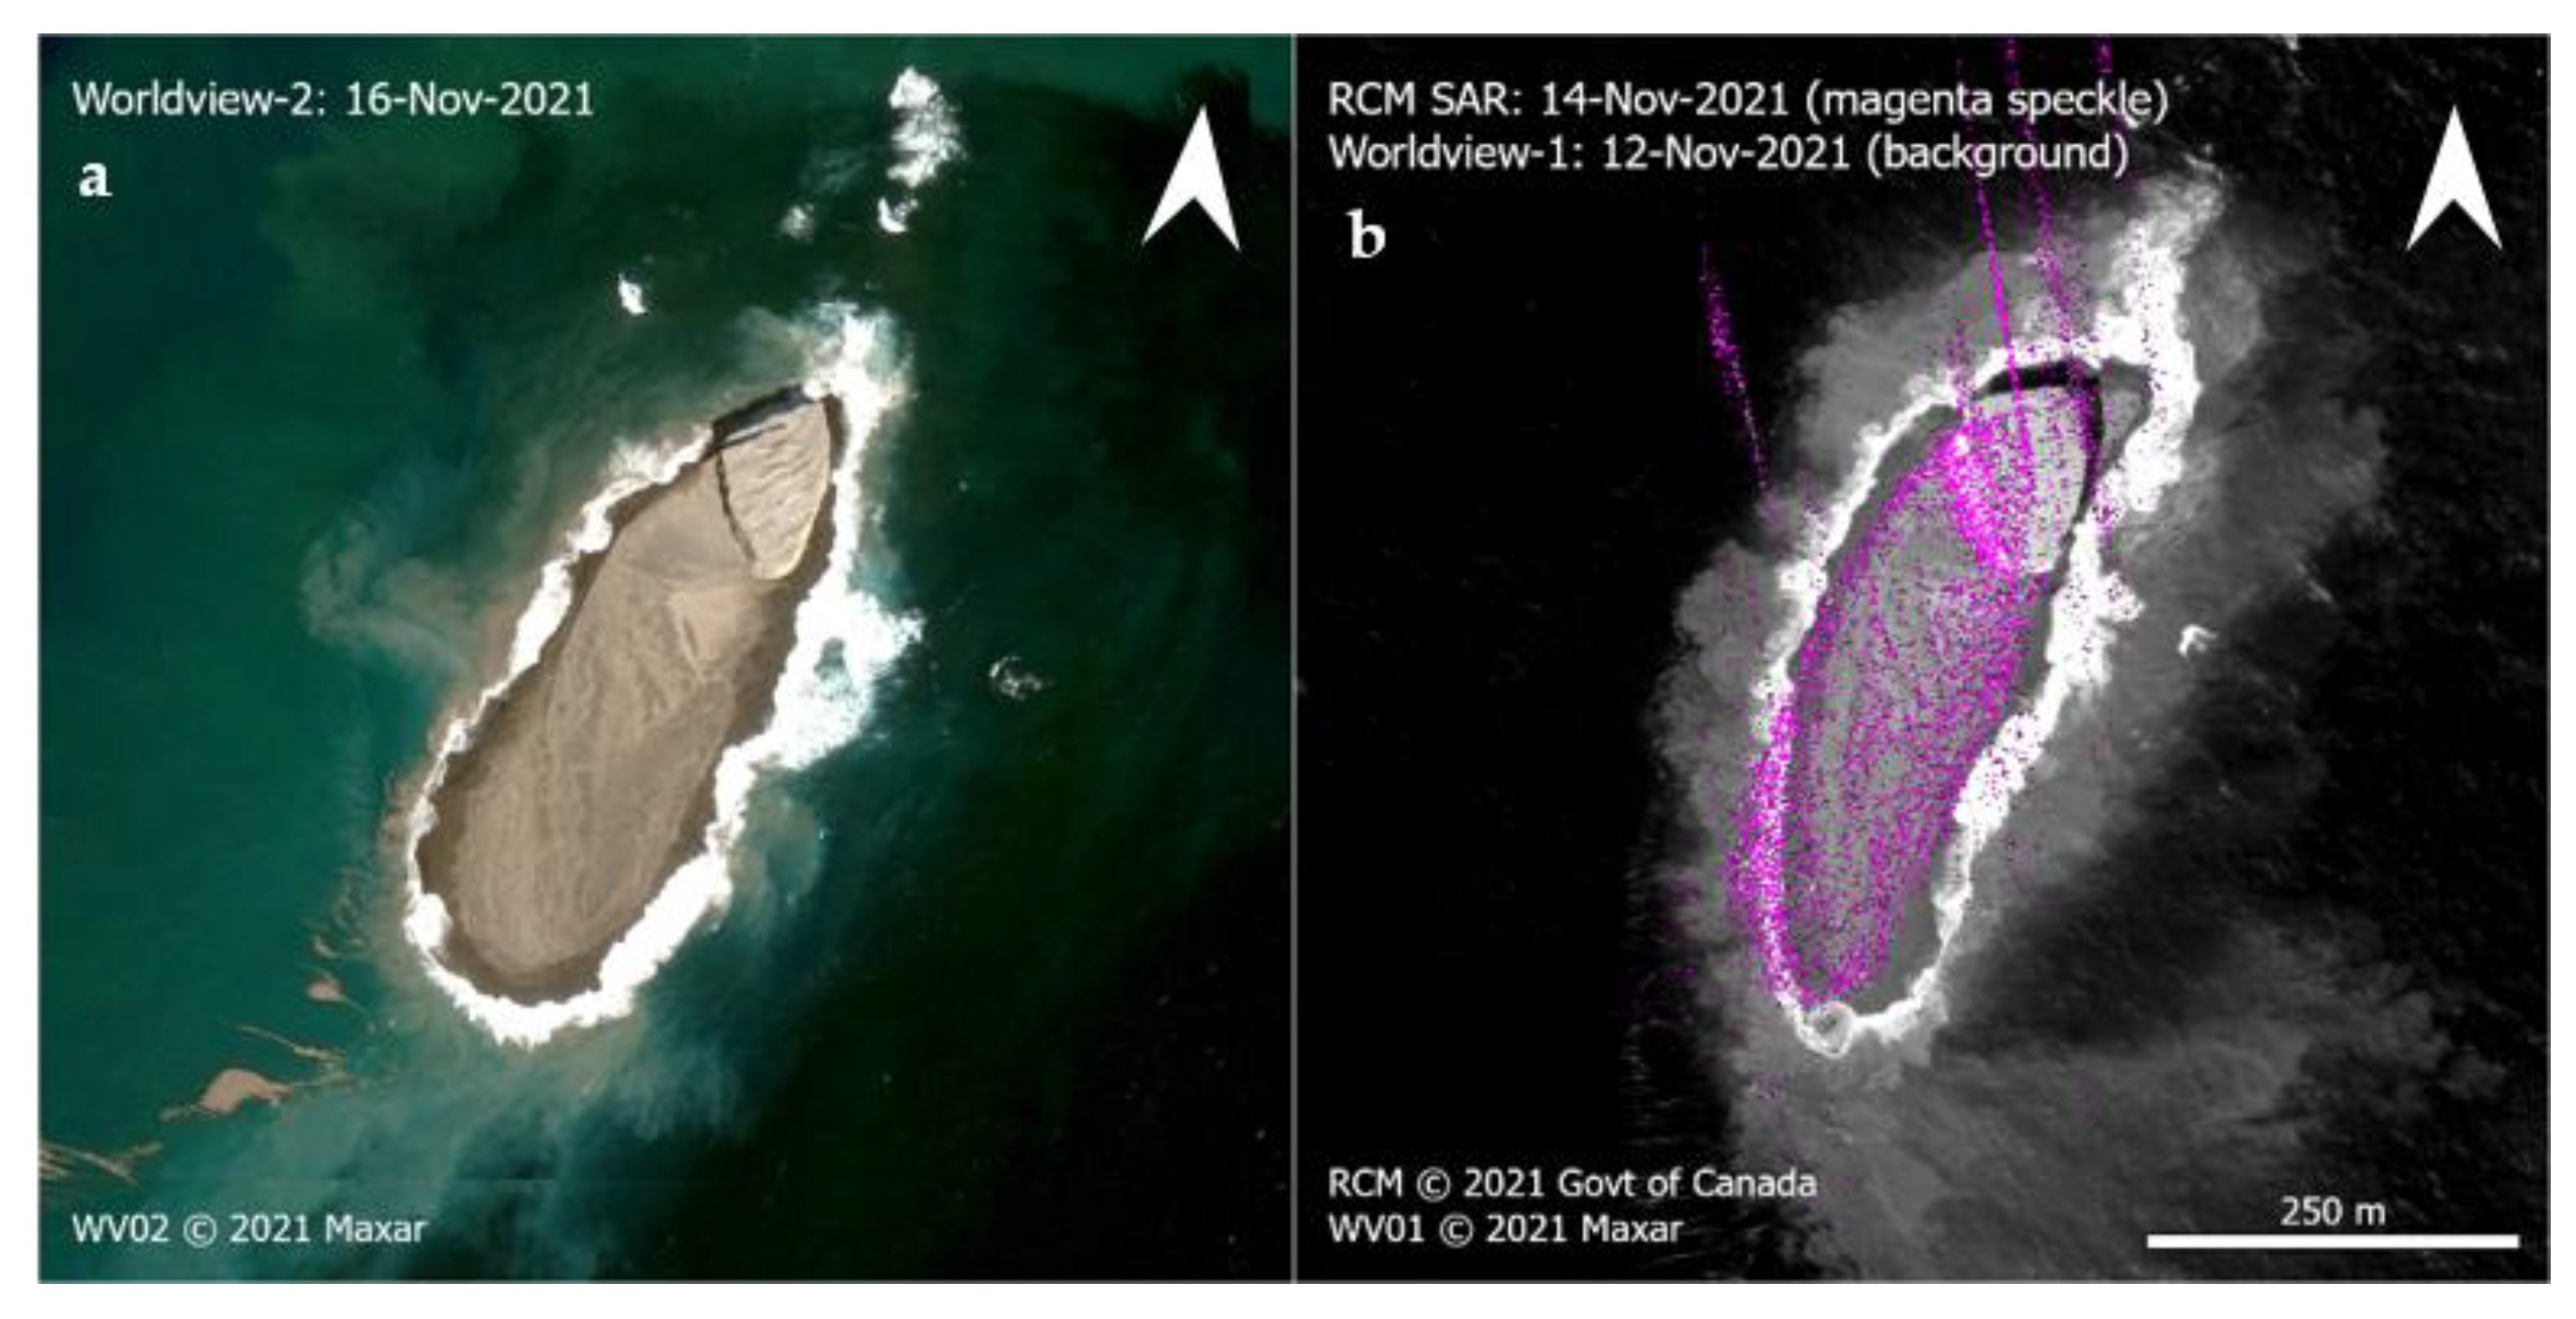
The examples herein illustrate the effectiveness of using 2D imagery with space-based lidar as a reference to the wider geospatial content of region of interest around the altimetry elevation profiles. An extension to the approach of combining elevation and imagery is clearly using multiple images to derive 3D surfaces based on relative reflectance within the spectral bands. As such, an opportunity presents for conflation of image-derived DEMs with ICESat-2 for quantitative surface structure analysis via the observational advantage of both system observations. Figure 6 is an example of this specific combination using Maxar Worldview-2 imagery and ICESat-2-labeled photons. Worldview data has been previously combined with SAR data which is transformational in the context of monitoring remotely-based emerging and vanishing islands [1], but the radar observations are often noisy in the presence of near shore coastal waves. Figure 7 provides an example of a Worldview-2 image and the coincident CSA RCM (Spotlight C-HH and HV) coincident data that highlights both the advantage of this multi-sensor approach but also some of the limitations. In these instances, ICESat-2 can assist with elevation retrievals to maintain effective characterization of the changing land mass.
This work also leverages an initial analysis of sub-surface photons within the water column as the potential path toward evaluating the turbidity and erosion within the shallow water region around the volcanic island landmass. The investigation of the normalized sub-surface photon returns around NFO highly suggests the potential to further quantify the erosional processes not only on the exposed portions of the rapidly eroding subaerial volcanic deposits but into the shallow water regions. While further investigation is necessary, significant differences between the photon returns demonstrate the possibility to quantify differences in turbidity. This study demonstrates a new application for ICESat-2 scientific studies and establishes the path toward further quantitative analysis of these unique volcanic events despite their remote locations within oceanic regions.

Author Contributions

Conceptualization, C.S., J.M. and L.A.M.; methodology, C.S. and L.A.M.; validation, C.S. and L.A.M.; formal analysis, C.S. and L.A.M.; investigation, C.S.; writing—original draft preparation, C.S.; writing—review and editing, C.S., L.A.M. and J.B.G.; visualization, C.S., J.B.G. and D.A.S.; project administration, L.A.M.; funding acquisition, L.A.M. All authors have read and agreed to the published version of the manuscript.

Funding

This work was funded through the NASA ICESat-2 science team award (PI Magruder)–80NSSC20K0964. Additional support for J.B.G. and D.A.S. came from NASA’s RRNES-06 (PI Garvin).

Data Availability Statement

The ICESat-2 data are publicly available through the National Snow & Ice Data Center (NSIDC) and Landsat 8 data are freely available on GloVis (https://icesat-2.gsfc.nasa.gov/icesat-2-data/; https://glovis.usgs.gov/; accessed on 10 October 2021). Topographic map courtesy of the Japan Coast Guard. Maxar Worldview-1 and -2 imagery © 2021 Maxar, provided under Nextview license; RADARSAT Constellation Mission Imagery © Government of Canada (2021); RADARSAT is an official mark of the Canadian Space Agency. All data used in this study meet the FAIR data standards.

Acknowledgments

The authors wish to thank the NASA ICESat-2 science team and project office for their hard work preparing the data used in this study and all of the technical expertise within the mission. Special thanks to the CSA RCM team, including Emmanuelle Albrecht and Christine Giguere (of ASC-CSA).

Conflicts of Interest

The authors declare no conflict of interest. The funders had no role in the design of the study; in the collection, analyses, or interpretation of data; in the writing of the manuscript, or in the decision to publish the results.

References

  1. Garvin, J.B.; Slayback, D.A.; Ferrini, V.; Giguere, C.; Asrar, G.R.; Andersen, K. Monitoring and Modeling the Rapid Evolution of Earth’s Newest Volcanic Island: Hunga Tonga Hunga Ha’apai (Tonga) Using High Spatial Resolution Satellite Observations. Geophys. Res. Lett. 2018, 45, 3445–3452. [Google Scholar] [CrossRef] [PubMed]
  2. Vaughan, R.G.; Webley, P.W. Satellite Observations of a Surtseyan Eruption: Hunga Ha’apai, Tonga. J. Volcanol. Geotherm. Res. 2010, 198, 177–186. [Google Scholar] [CrossRef]
  3. Matsumoto, H.; Zampolli, M.; Haralabus, G.; Stanley, J.; Mattila, J.; Ozel, N.M. Interpretation of Detections of Volcanic Activity at Ioto Island Obtained from In Situ Seismometers and Remote Hydrophones of the International Monitoring System. Sci. Rep. 2019, 9, 19519. [Google Scholar] [CrossRef] [PubMed]
  4. Ossaka, J. The Eruption of Nishinoshima Submarine Volcano and Geochemical Study of the Composition of the Ejecta and the Volcanic Activity. Chem. Today 1975, 55, 12–20. [Google Scholar]
  5. Ramalho, R.S.; Helffrich, G.; Cosca, M.; Vance, D.; Hoffmann, D.; Schmidt, D.N. Vertical Movements of Ocean Island Volancoes: Insights from a Stationary Plate Environment. Mar. Geol. 2010, 1–4, 84–95. [Google Scholar] [CrossRef]
  6. Otani, Y.; Noboru, S.; Tetsuichiro, Y.; Toshikazu, H.; Susumu, M.; Mitsuhiro, O.; Kenji, N. Observation on Fukutoku-Oka-no-Ba Submarine Volcano Eruption in 2005. Rep. Hydrogr. Oceanogr. Res. 2006, 42, 31–37. [Google Scholar]
  7. Ossaka, J. Submarine Eruptions around Japan; Tokai University Press: Tokay, Japan, 1991. [Google Scholar]
  8. Ohkura, H.; Kishi, S.; Kumagai, T.; Akutsu, T.; Ayabe, K. Volcanic Eruptions of a Submarine Volcano in the Adjacent Area of Minami-Iwojima in 1986 Detected from Landsat TM Data. Remote Sens. Soc. Jpn. 1986, 6, 65–71. [Google Scholar]
  9. Ono, T.; Otani, Y.; Kaneo, M.; Nishizawa, A. Submarine Volcano Surveys by “MAnbo-II” for the Prediction Program of Volcanic Eruptions. Tech. Bull. Hydrogr. Oceanogr. 2002, 20, 71–80. [Google Scholar]
  10. Ito, K.; Kato, S.; Takahashi, M.; Saito, A. Volcanic Topography of Fukutoku-Oka-no-ba Volcano in Izu-Ogasawara Arc After the 2010 Eruption. Rep. Hydrogr. Oceanogr. Res. 2011, 47, 9–13. [Google Scholar]
  11. Urai, M. Time Series Analysis of Discolored Seawater Reflectance Observed by Advanced Visible and Near Infrared Radiometer Type 2 (AVNIR-2) at Fukutoku-Okonaba Submarine Volcano, Japan. J. Volcanol. Geotherm. Res. 2014, 269, 23–27. [Google Scholar] [CrossRef]
  12. National Catalogue of the Active Volcanoes in Japan (Fourth Edition, English Version). Japan Meteorological Agency: Tokyo, Japan. 2013. Available online: http://www.data.jma.go.jp/svd/vois/data/tokyo/STOCK/souran_eng/menu.htm (accessed on 3 January 2022).
  13. Sennert, S.K. (Ed.) Global Volcanism Program, Report on Fukutoku-Oka-no-Ba (Japan). In Weekly Volcanic Activity Report; Smithsonian Institution and US Geological Survey: Washington, DC, USA, 2021. [Google Scholar]
  14. Markus, T.; Neumann, T.; Martino, A.; Abdalati, W.; Brunt, K.; Csatho, B.; Farrell, S.; Fricker, H.; Gardner, A.; Harding, D.; et al. The Ice, Cloud, and land Elevation Satellite-2 (ICESat-2): Science Requirements, Concept, and Implementation. Remote Sens. Environ. 2017, 190, 260–273. [Google Scholar] [CrossRef]
  15. Neumann, T.A.; Brenner, A.; Hancock, D.; Luthcke, S.B.; Lee, J.; Robbins, J.; Harbeck, K.; Saba, J.; Brunt, K.M.; Gibbons, A. ATLAS/ICESat-2 L2A Global Geolocated Photon Data, Version 4. [24°17′ N, 141°28′ W.; 24°16′ S, 141°29′ E]; NSIDC, National Snow and Ice Data Center: Boulder, CO, USA, 2020. [Google Scholar] [CrossRef]
  16. Magruder, L.; Neumann, T.; Kurtz, N. ICESat-2 Early Mission Synopsis and Observatory Performance. Earth Space Sci. 2021, 8, e2020EA001555. [Google Scholar] [CrossRef] [PubMed]
  17. Neuenschwander, A.L.; Pitts, K.L.; Jelley, B.P.; Robbins, J.; Klotz, B.; Popescu, S.C.; Nelson, R.F.; Harding, D.; Pederson, D.; Sheridan, R. ATLAS/ICESat-2 L3A Land and Vegetation Height, Version 4. [24°17′ N, 141°28′ W.; 24°16′ S, 141°29′ E]; NSIDC, National Snow and Ice Data Center Distributed Active Archive Center: Boulder, CO, USA, 2020. [Google Scholar] [CrossRef]
  18. Smith, B.; Fricker, H.A.; Gardner, A.; Siegfried, M.R.; Adusumilli, S.; Csathó, B.M.; Holschuh, N.; Nilsson, J.; Paolo, F.S.; ICESat-2 Science Team. ATLAS/ICESat-2 L3A Land Ice Height, Version 4. [24°17′ N, 141°28′ W.; 24°16′ S, 141°29′ E]; NSIDC, National Snow and Ice Data Center Distributed Active Archive Center: Boulder, CO, USA, 2020. [Google Scholar] [CrossRef]
  19. Morison, J.H.; Hancock, D.; Dickinson, S.; Robbins, J.; Roberts, L.; Kwok, R.; Palm, S.P.; Smith, B.; Jasinski, M.F.; ICESat-2 Science Team. ATLAS/ICESat-2 L3A Ocean Surface Height, Version 4. [24°17′ N, 141°28′ W.; 24°16′ S, 141°29′ E]; NSIDC, National Snow and Ice Data Center Distributed Active Archive Center: Boulder, CO, USA, 2020. [Google Scholar] [CrossRef]
  20. Neuenschwander, A.; Pitts, K. The ATL08 land and vegetation product for the ICESat-2 mission. Rem. Sens. Environ. 2018, 221, 247–259. [Google Scholar] [CrossRef]
  21. Babbel, B.J.; Parrish, C.E.; Magruder, L.A. ICESat-2 Elevation Retrievals in Support of Satellite Derived Bathymetry for Global Science Applications. Geophys. Res. Lett. 2021, 48, e2020GL090629. [Google Scholar] [CrossRef] [PubMed]
  22. Parrish, C.E.; Magruder, L.A.; Neuenschwander, A.; Forfinski-Sarkozi, N.; Alonzo, M.; Jasinski., M. Validation of ICESat-2 ATLAS Bathymetry and Analysis of ATLAS’s Bathymetric Mapping Performance. Remote Sens. 2019, 11, 1634. [Google Scholar] [CrossRef] [Green Version]
  23. Magruder, L.; Meuenschwander, A.; Klotz, B. Digital Terrain Model Elevation Corrections Using Space-Based Imagery and ICESat-2 Laser Altimetry. Remote Sens. Environ. 2021, 264, 112621. [Google Scholar] [CrossRef]
  24. Neuenschwander, A.; Guenther, E.; White, J.C.; Duncanson, L.; Montesano, P. Validation of ICESat-2 Terrain and Canopy Heights in Boreal Forests. Remote Sens. Environ. 2020, 251, 112110. [Google Scholar] [CrossRef]
  25. Facebook. NASA Earth–Photon Phrightday: Ghost Islands. 2021. Available online: https://www.facebook.com/nasaearth/videos/photon-phrightday-ghost-islands/962916660960135/ (accessed on 5 December 2021).
  26. Planet Team. Planet Application Program Interface: In Space for Life on Earth. 2017. Available online: https://api.planet.com (accessed on 30 September 2021).
  27. Klotz, B.; Neuenschwander, A.; Magruder, L.A. High-Resolution Ocean Wave and Wind Characteristics Determined by the ICESat-2 Land Surface Algorithm. Geophys. Res. Lett. 2020, 47, e2019. [Google Scholar] [CrossRef]
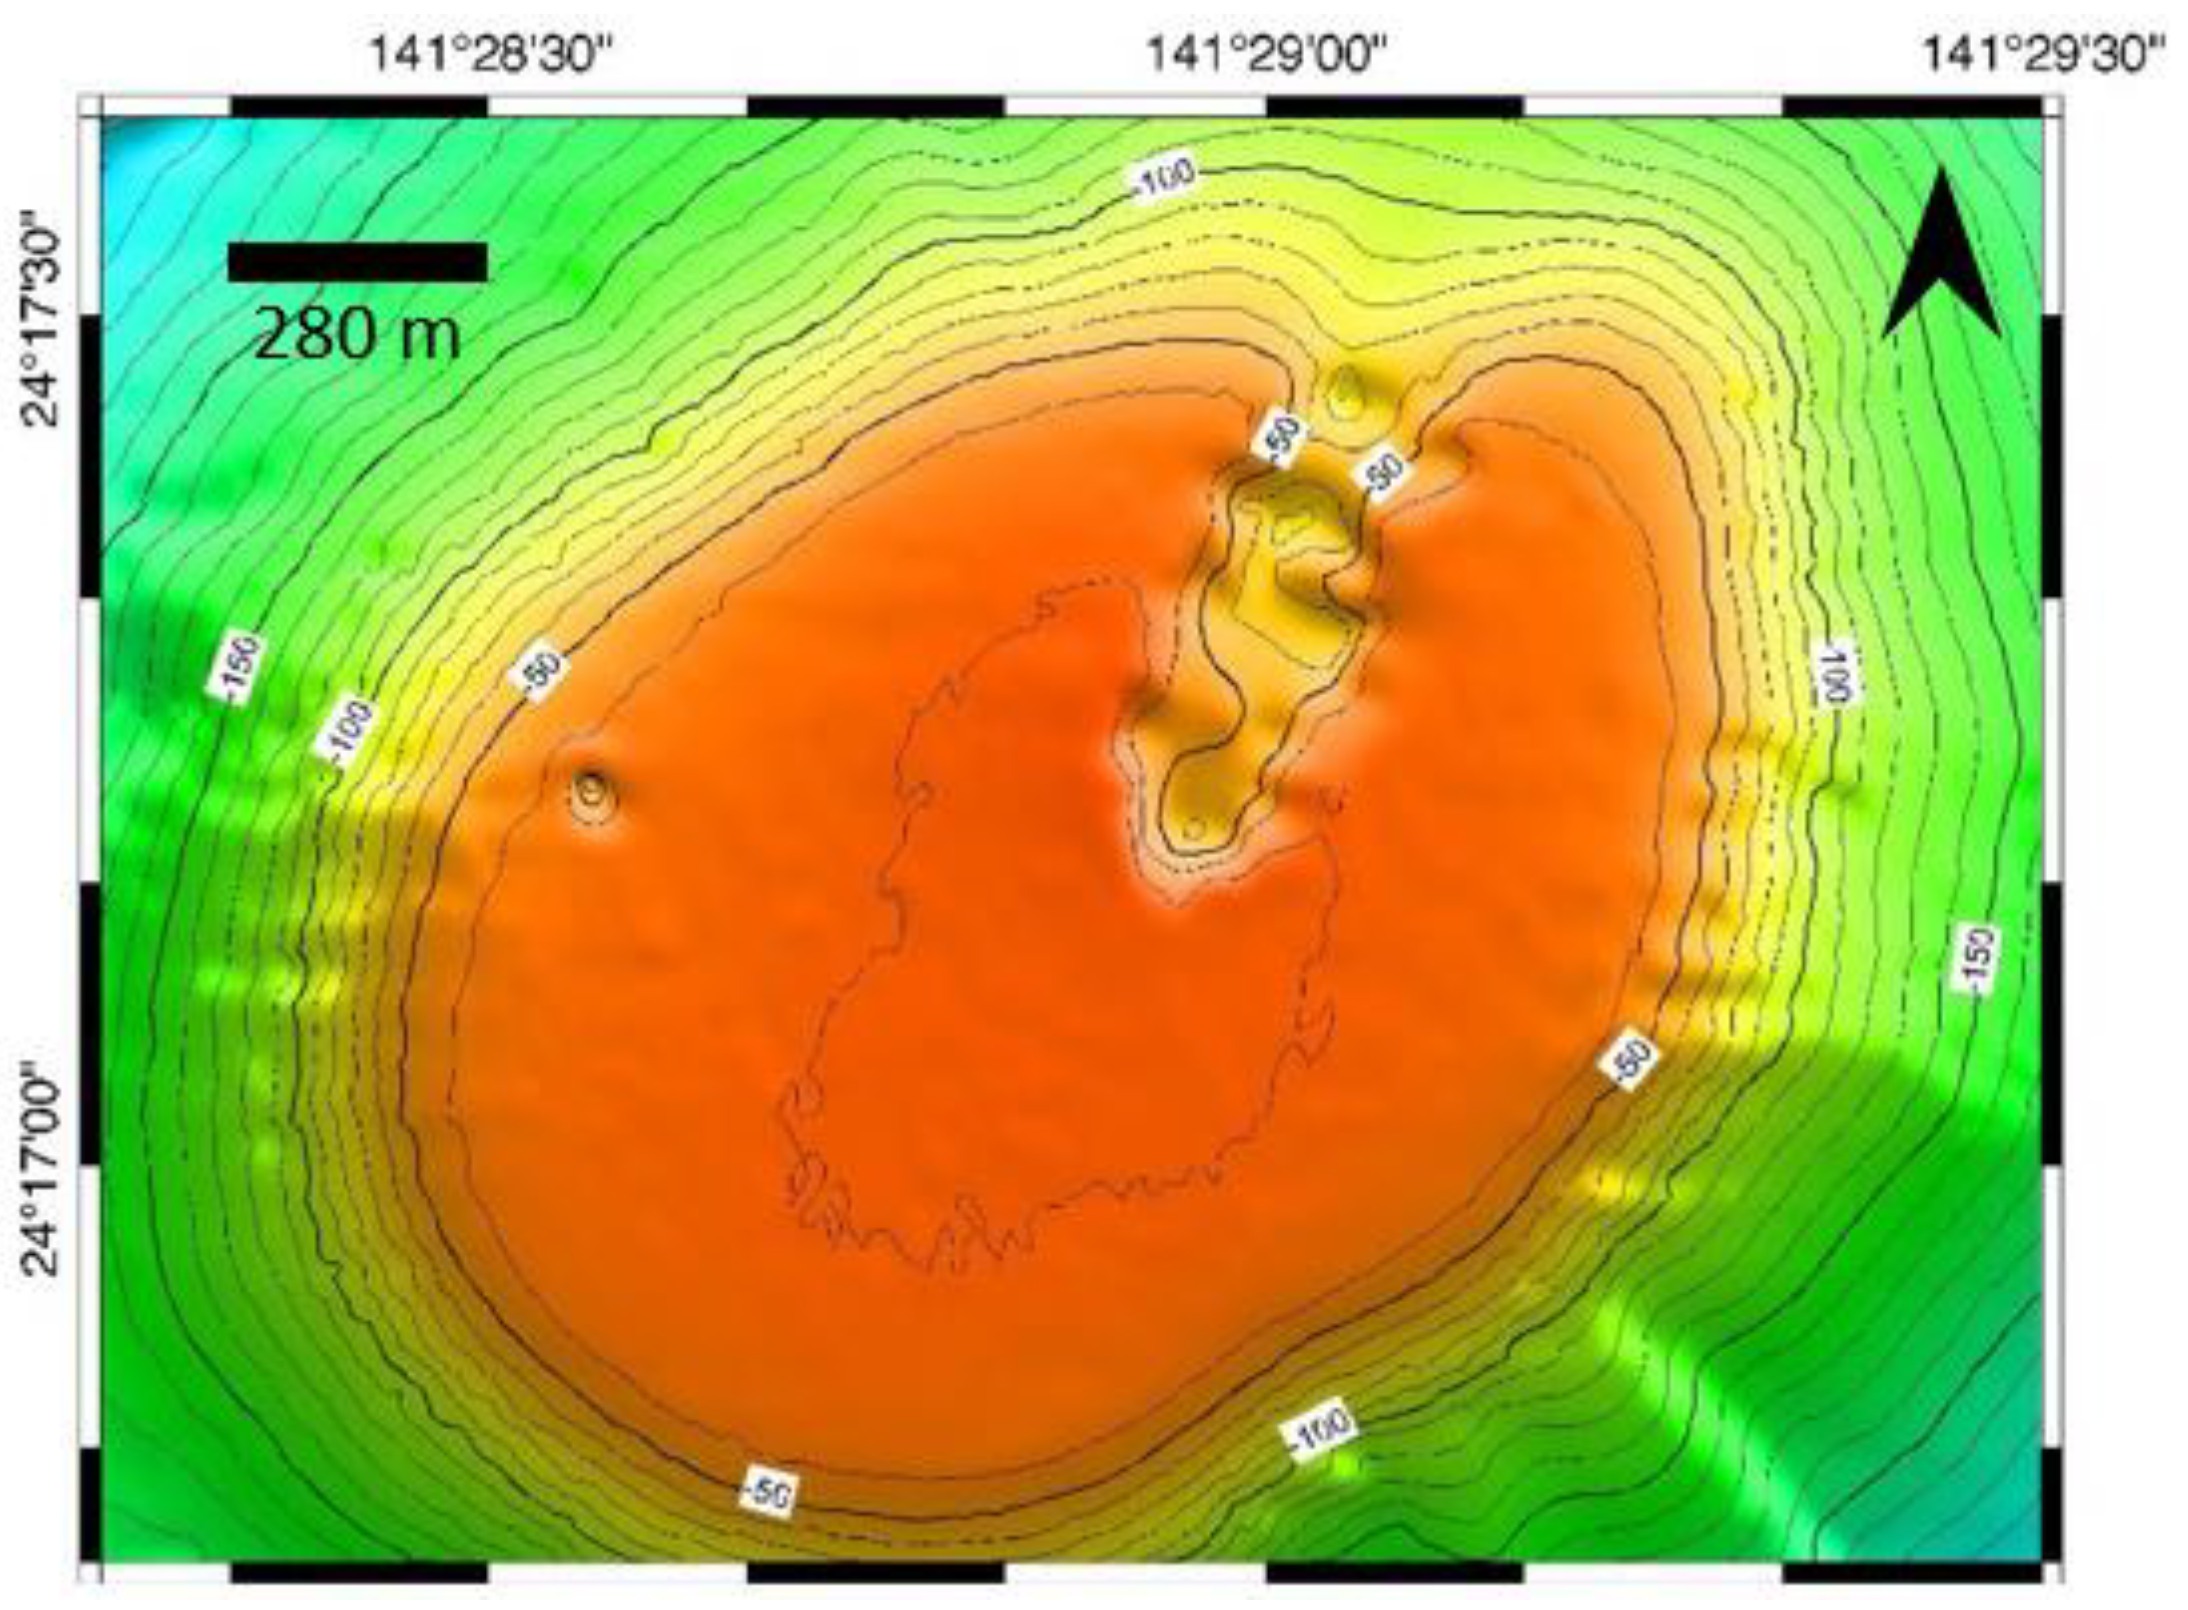
Figure 1. Topography map of submarine Niijima Fukutoku-Okanoba (NFO) after the 2010 eruption showing the bathymetric volcanic structure, modified from the map courtesy of the Japan Coast Guard [12].
Geosciences 12 00040 g001
Figure 2. Example of physical extents (maximum height and base horizontal distance) metric calculation using ICESat-2 manually-labeled ground photons and the orthorectified elevations that allow for sub-meter tracking of volcanic deposits over time as an advantage to stereo-only digital elevation model (DEM) observations.
Geosciences 12 00040 g002
Figure 3. Planet imagery of Niijima Fukutoku-Okanoba over a three-week period showing the erosion over roughly six weeks. The exposed right section of emergent volcano (originally a tuff cone) is completely eroded within the first few weeks of eruption.
Geosciences 12 00040 g003
Figure 4. ICESat-2 (a) strong and (b) weak ICESat-2 altimetry tracks manually classified as (green) ground and (blue) sea surface. (c) ICESat-2 track locations overlain on Landsat-8 pan-sharpened imagery to provide context for the altimetry data (Landsat-8 images courtesy of the U.S. Geological Survey).
Geosciences 12 00040 g004
Figure 5. Planet imagery [27] (a) within a day of ICESat-2 lidar collection (b). Analysis of ‘noise’ classified photons in the water column showing the potential to investigation erosional processes occurring after the eruption. (c,d) Depiction of wave structure captured by ICESat-2-identified sea surface photons with (e,f) the average wave height per 200 m bin. The ICESat-2 product from 10 September 2021 shows an increase in unassigned photons on the south side (g) vs. north (h). The normalized sub-surface photon returns (i,j) per 10 m along-track bin (calculated as the difference between the number of sub-surface and above surface photons within 10 m above and below the surface) show a significantly higher concentration on the south side of the island.
Geosciences 12 00040 g005
Figure 6. ICESat-2 tracks collected on 10 September 2021 overlain on a perspective view of 9 September 2021, Maxar Worldview-2 image draped over a DEM (generated from the WV02 stereo pair), displaying the geodetic topography measured via lidar altimetry. The DEM can be vertically controlled by means of the ICESat-2 to sub-meter levels, as shown here. ICESat-2 photons labeled as ground are in green and the sea surface in red.
Geosciences 12 00040 g006
Figure 7. Examples of 2D high resolution satellite images from Maxar Worldview (a) at meter resolution revealing the 20+ m (relief) remnant of the early NFO island (northern polygonal feature with light-toned appearance), and (b) CSA Radarsat Constellation Mission (RCM) C-band Spotlight SAR image (1 × 3 m resolution), with HH/HV/HH polarizations displayed in RGB, mapped atop a nearly-coincident optical image from Maxar Worldview-1. These 2D imaging datasets illustrate the dynamic state of erosion and the importance of the independent vertical perspective provided by satellite lidar altimetry (and bathymetry) from ICESat-2. RADARSAT Constellation Mission Imagery © Government of Canada (2021); RADARSAT is an official mark of the Canadian Space Agency.
Geosciences 12 00040 g007
Table 1. Physical extent calculations (height, width, and area) of exposed surface transects using ICESat-2 ground-labeled photons. Note: Extracting physical parameters is only possible for the 10 September 2021 collection due to the discontinuous photon return for the 21 September 2021 collection.
ICESat-2 DateTrackHeightBase WidthArea
10 September 2021 1gt2r28.8 m733 m13,499.9 m2
gt2l21.3 m731.4 m8950.3 m2
21 September 2021 2gt2r-853.3 m-
gt2l---
1 ICESat-2 data collection: ATL03_20210910031707_11991201_005_01. 2 ICESat-2 data collection: ATL03_20210921145752_13741207_005_01.
Publisher’s Note: MDPI stays neutral with regard to jurisdictional claims in published maps and institutional affiliations.