
Age of the Most Extensive Glaciation in the Alps


Abstract
:1. Introduction
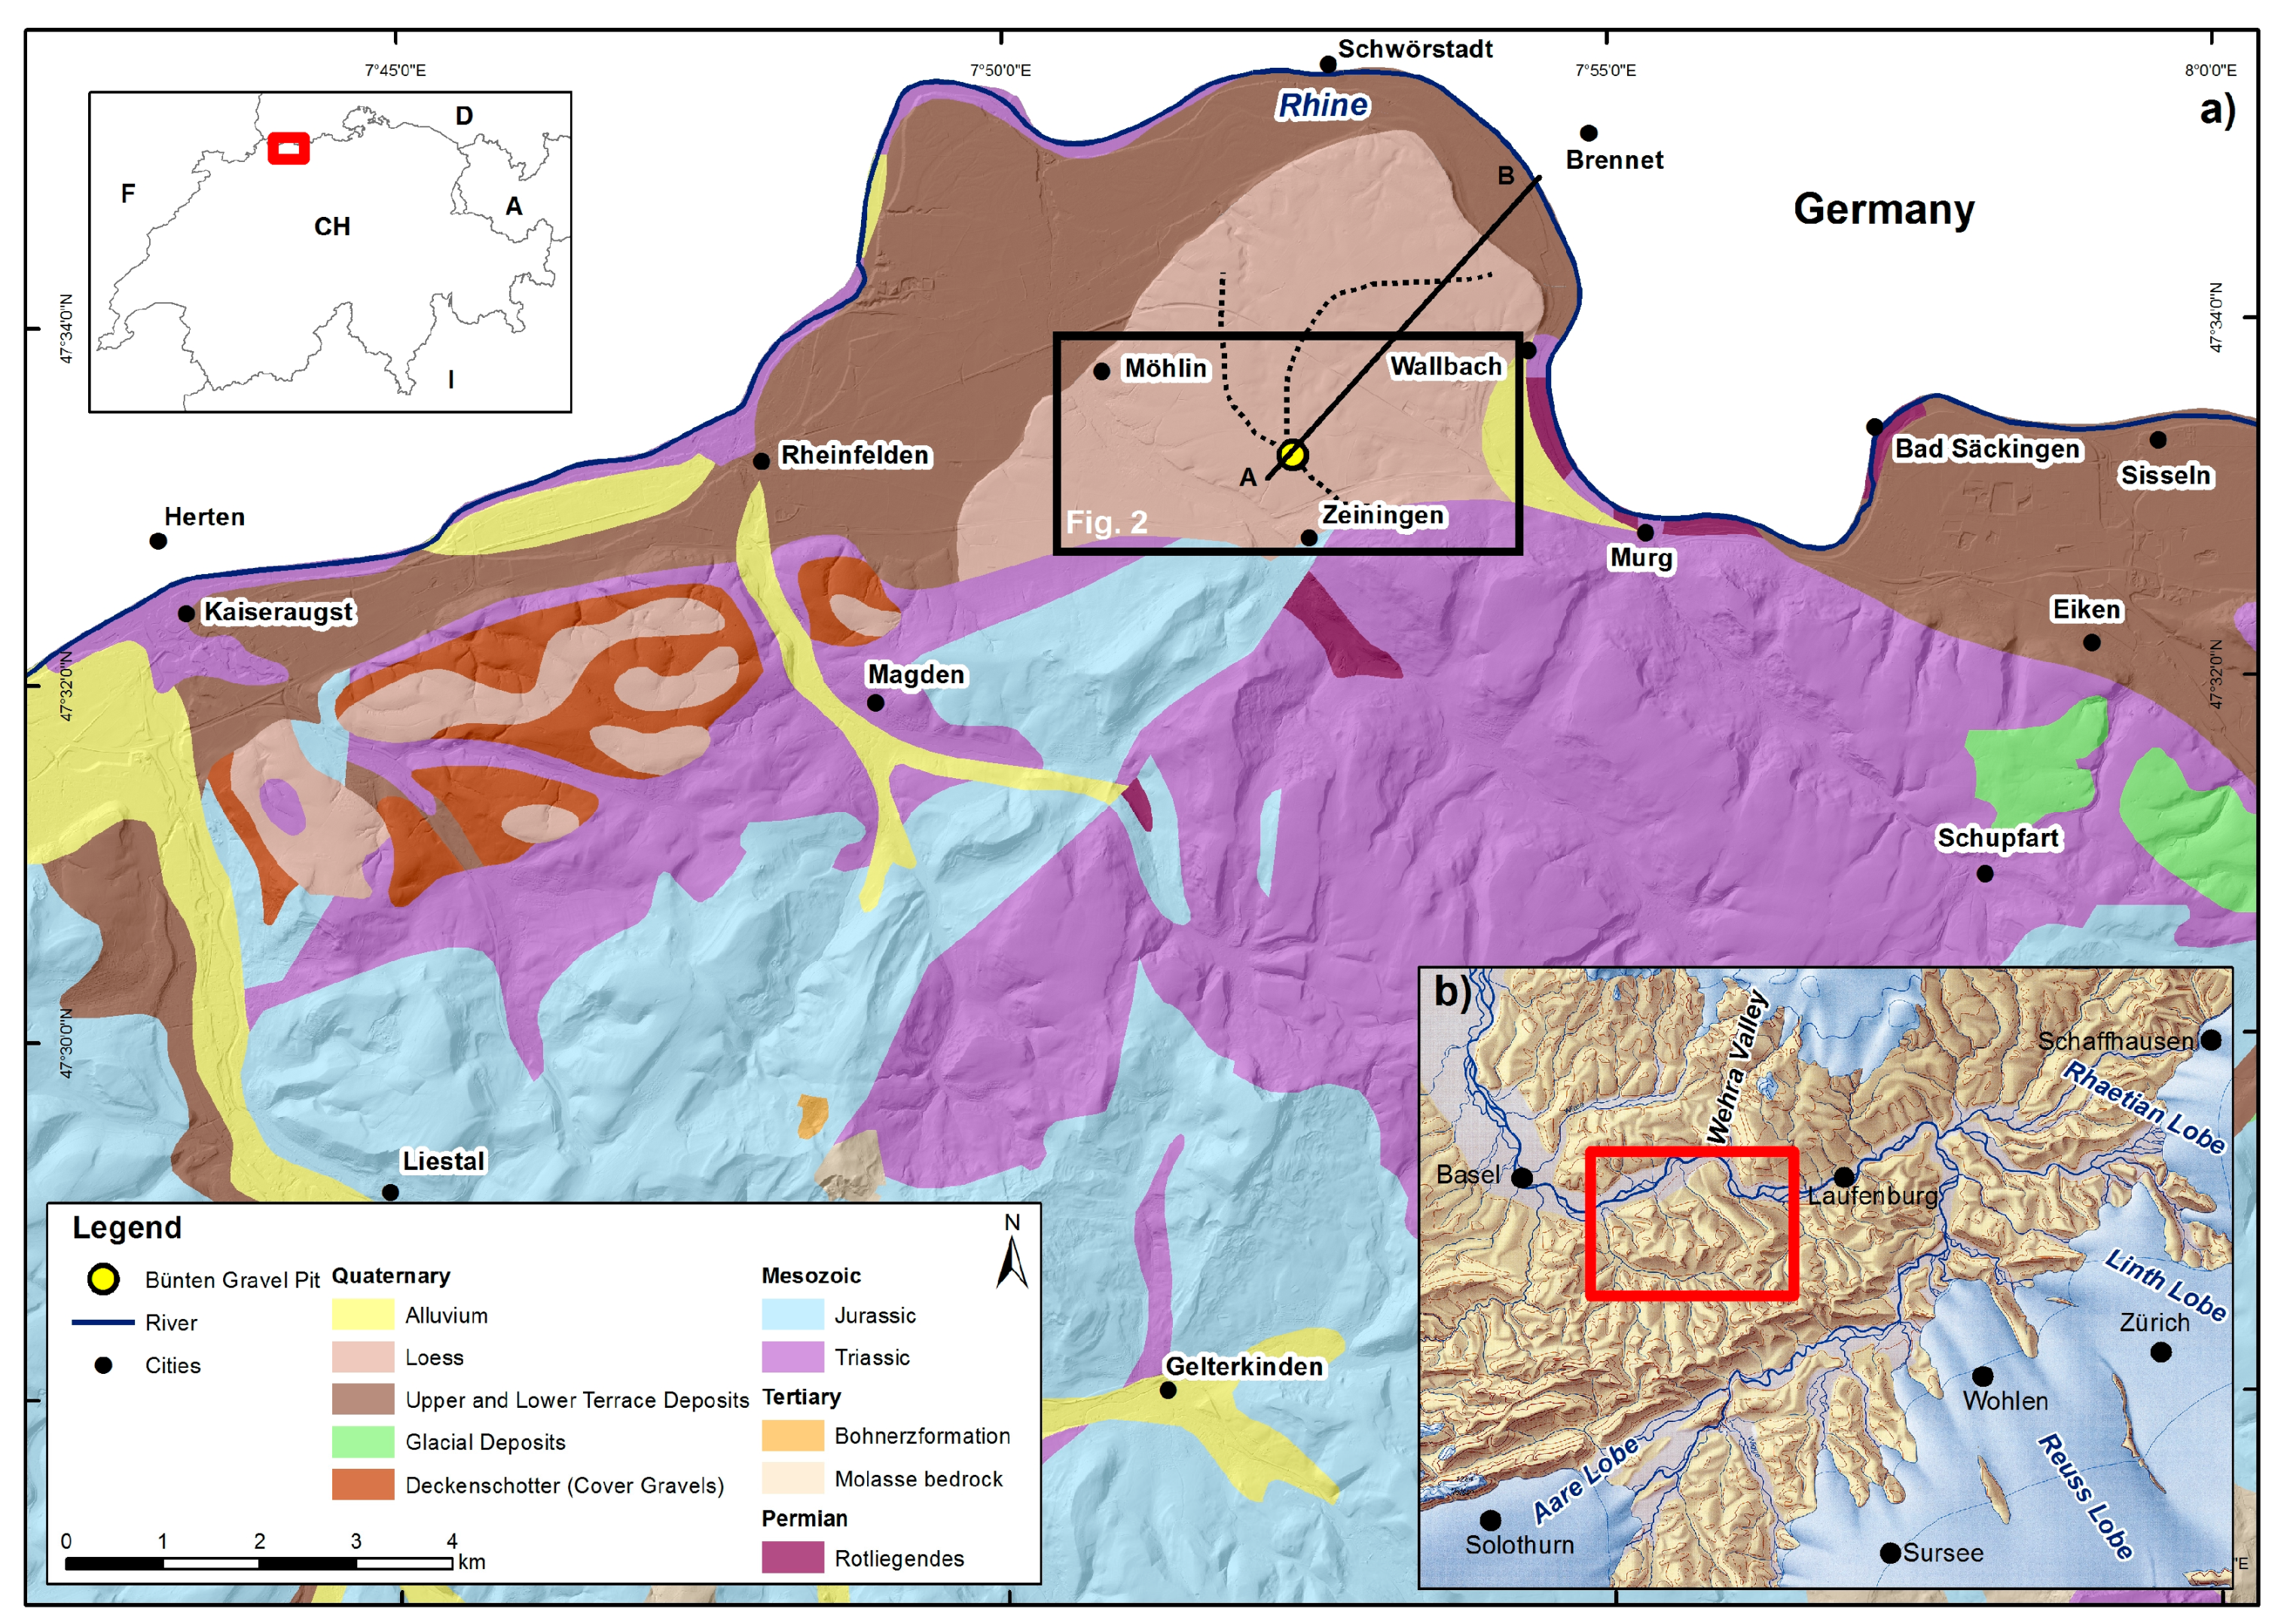
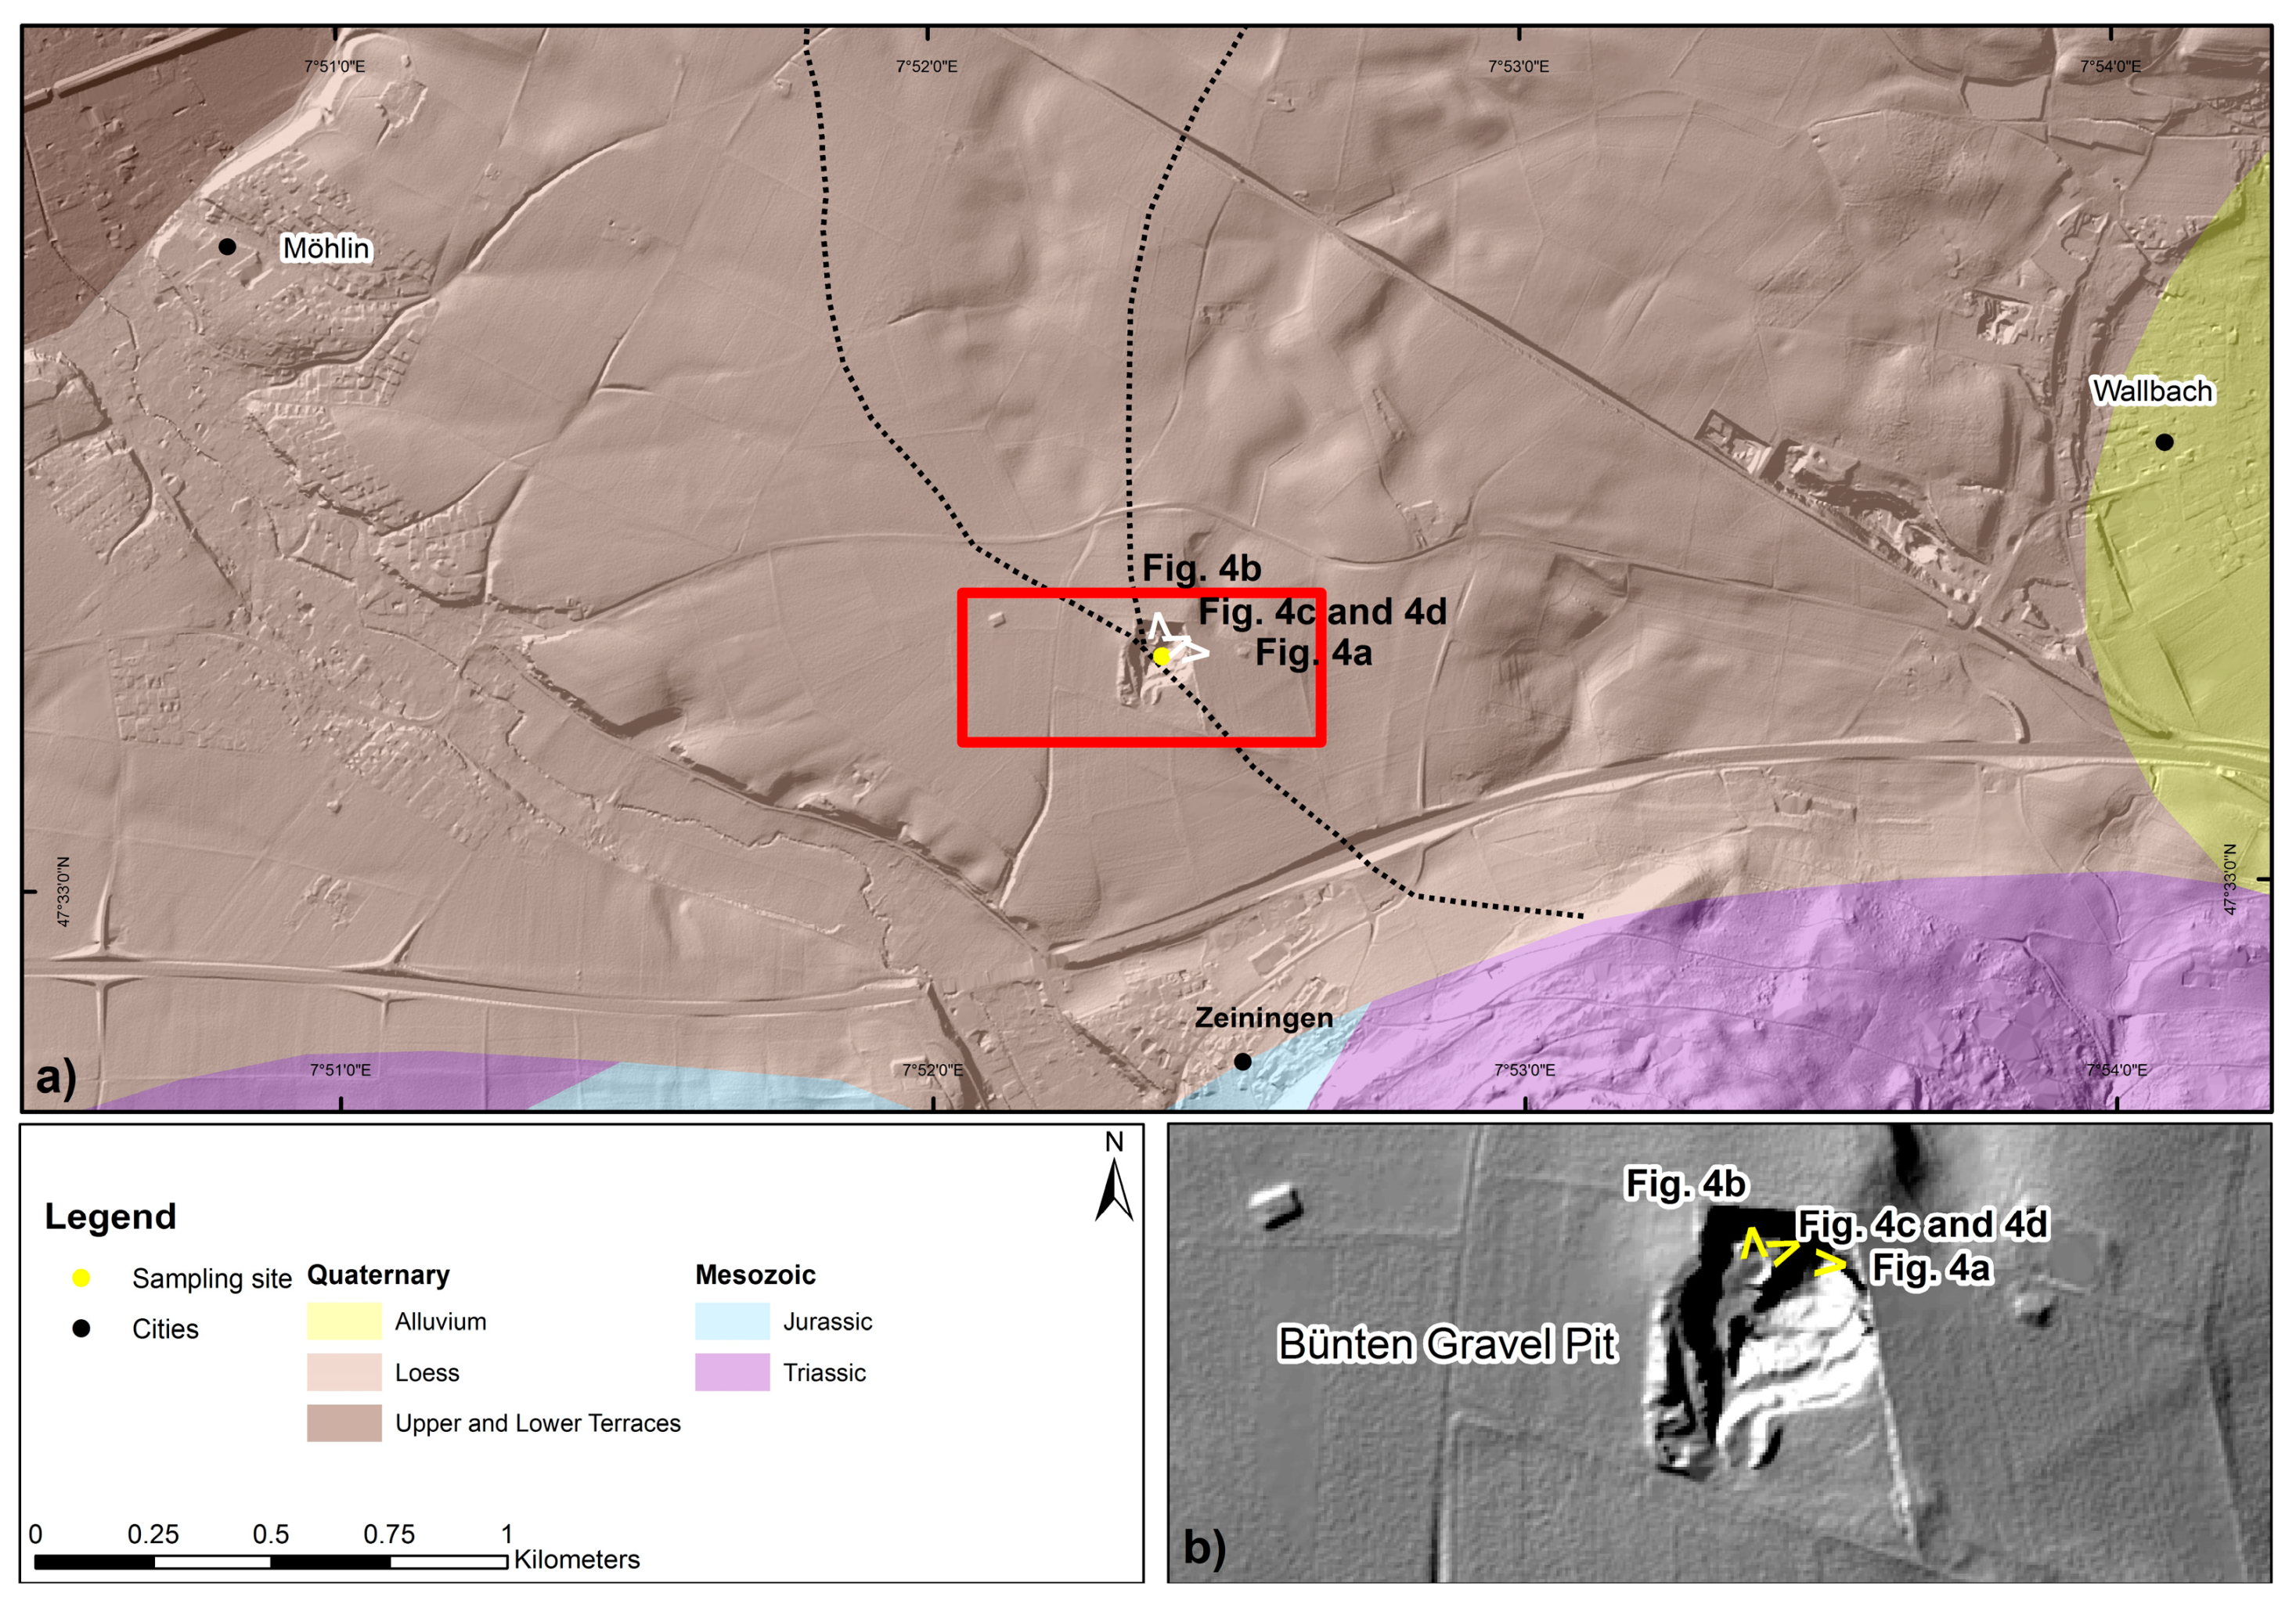
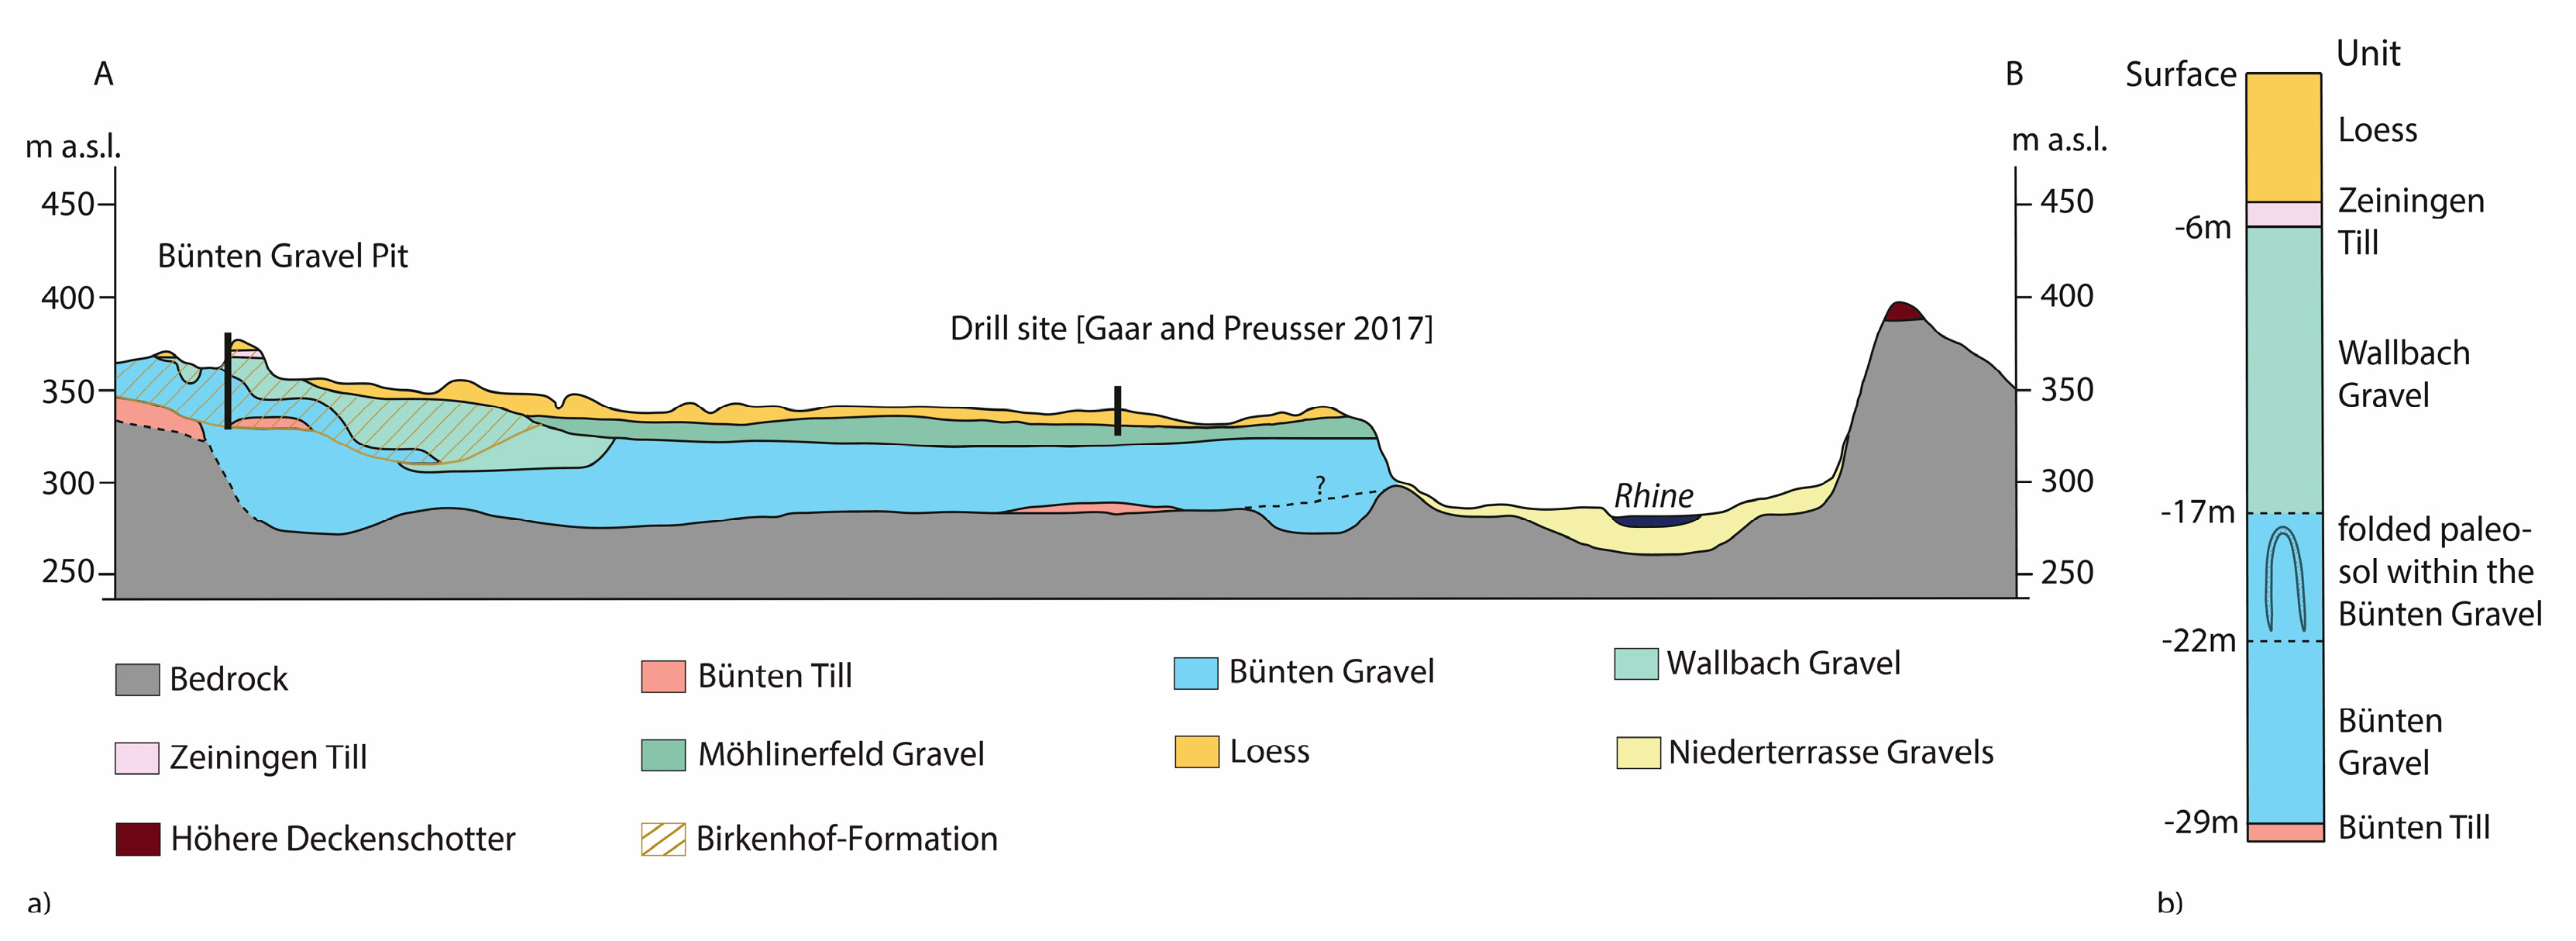
2. Study Site
3. Methodology
3.1. Sedimentary Analyses
3.2. Isochron-Burial Dating
Sampling, Sample Preparation, and Measurements
4. Results
4.1. Sedimentary Analyses
4.1.1. Sediments of the Bünten Gravel Pit
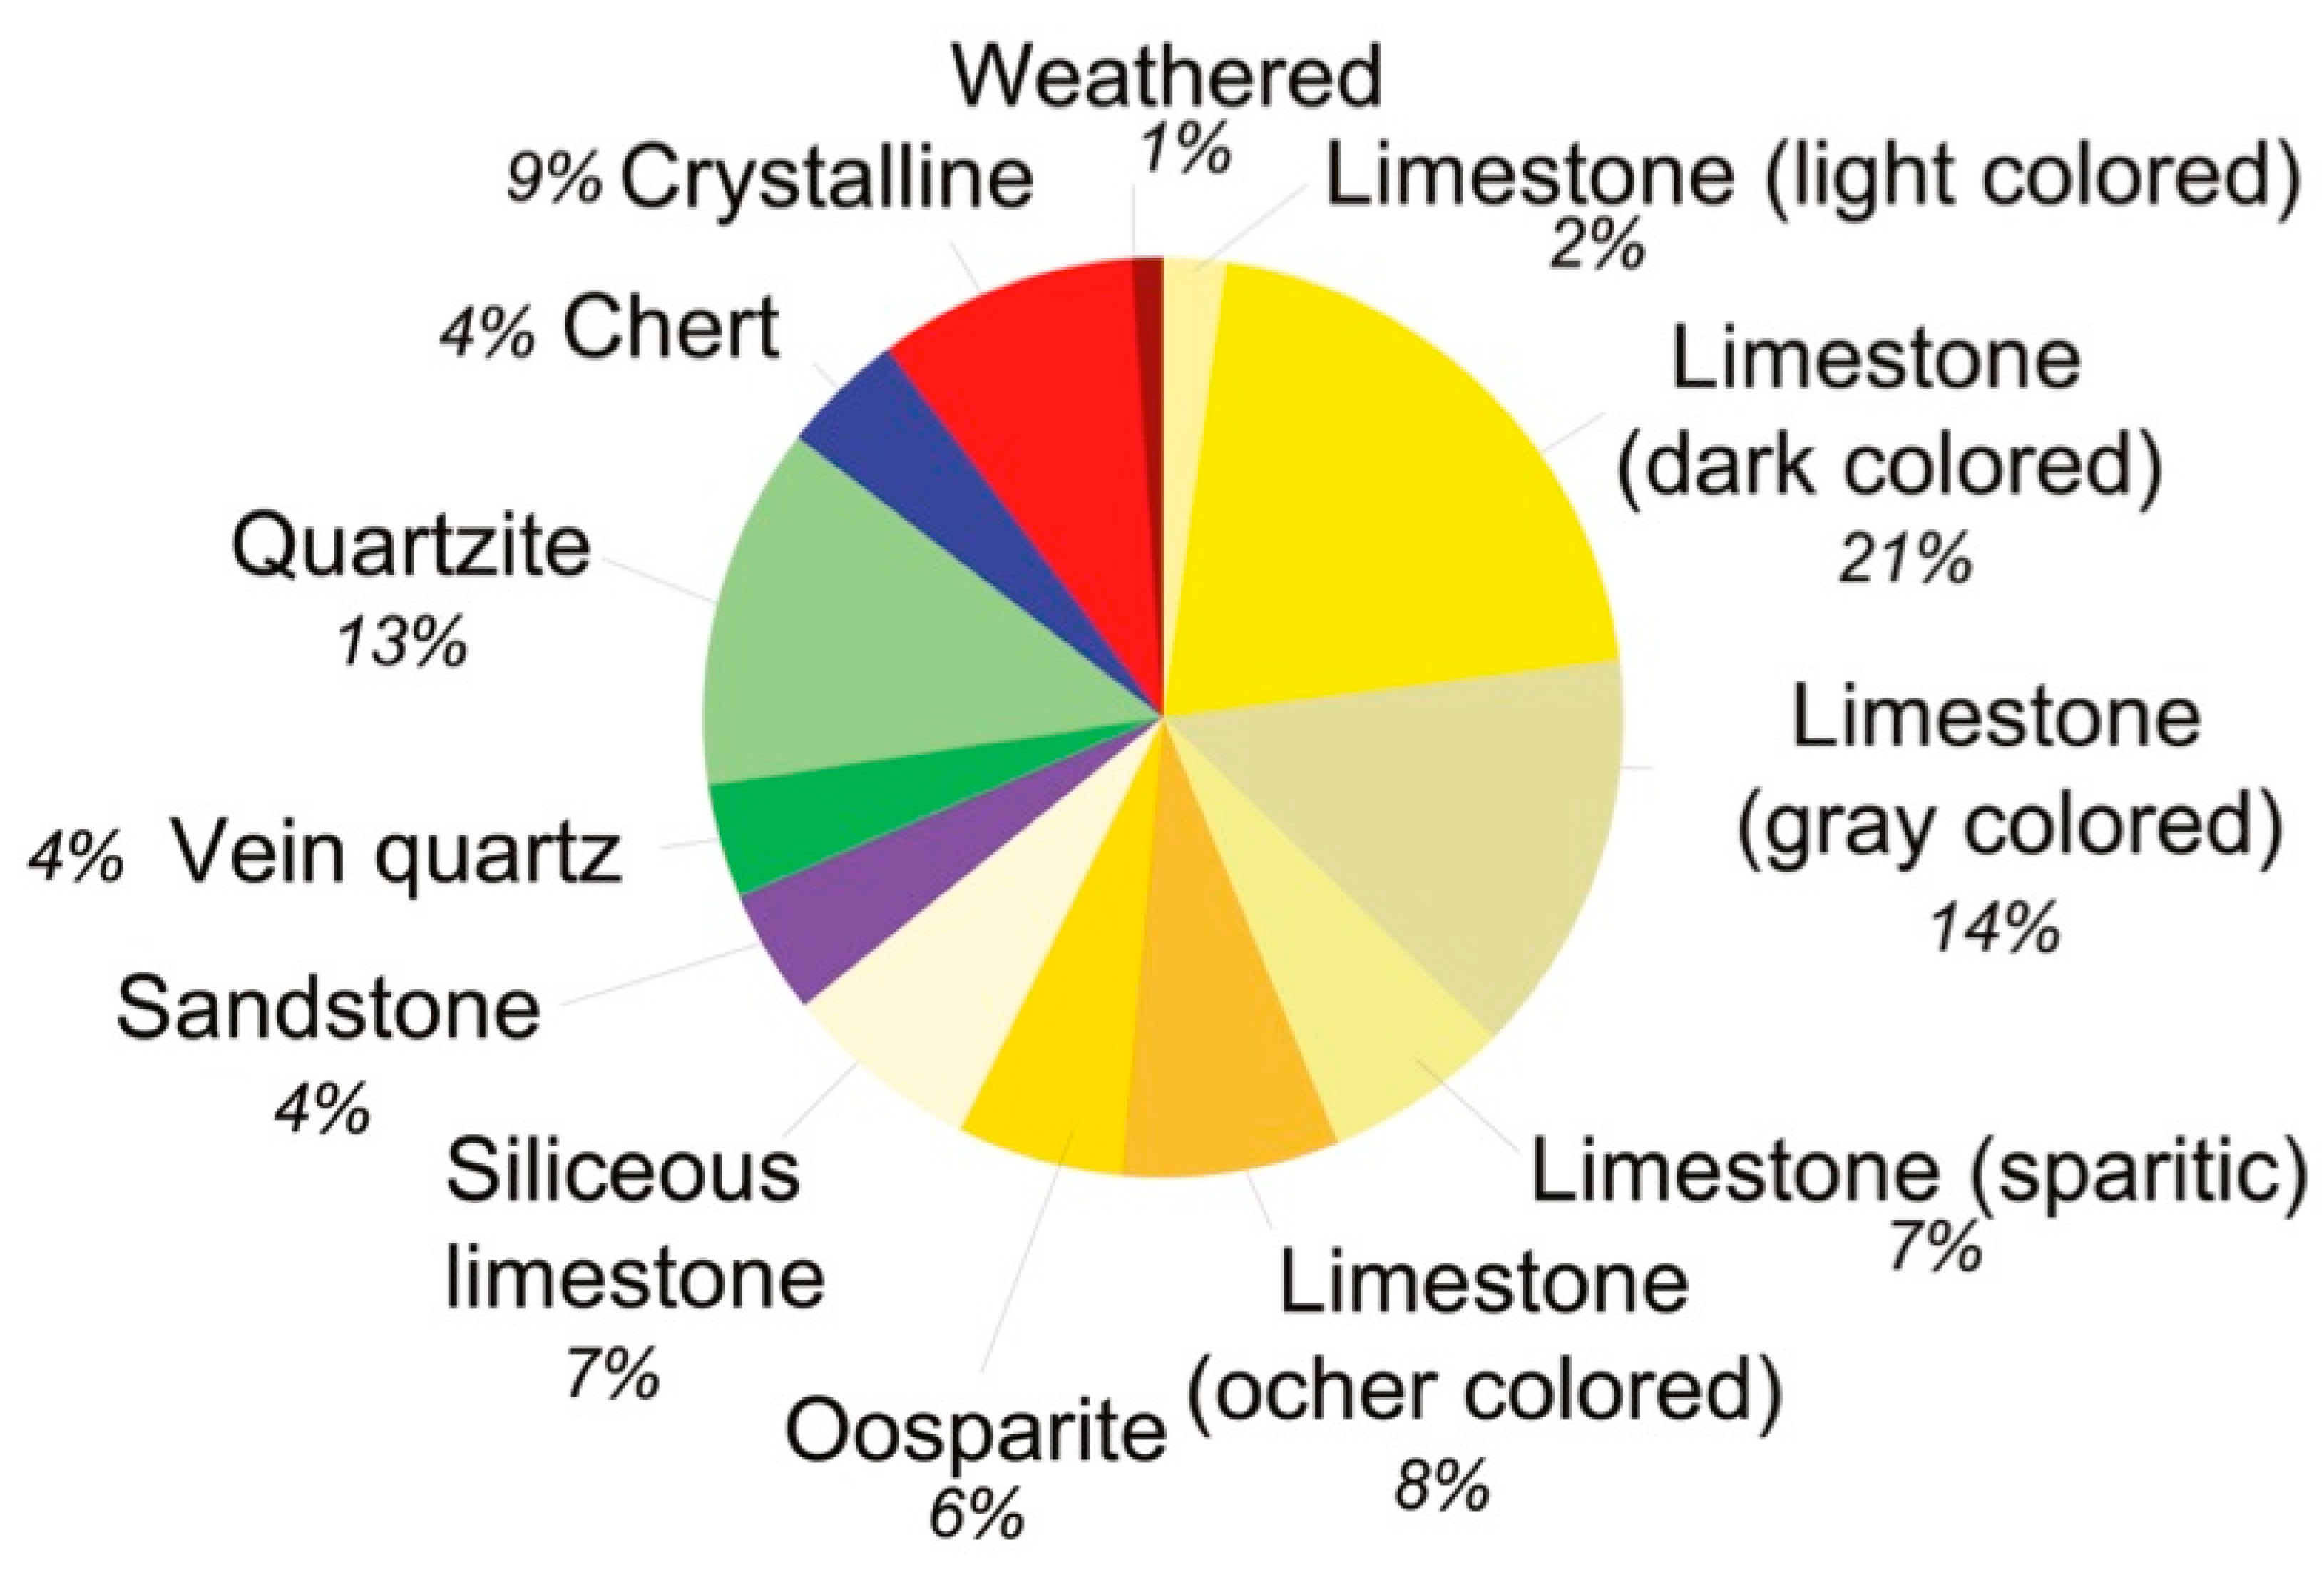
4.1.2. Clast Petrography
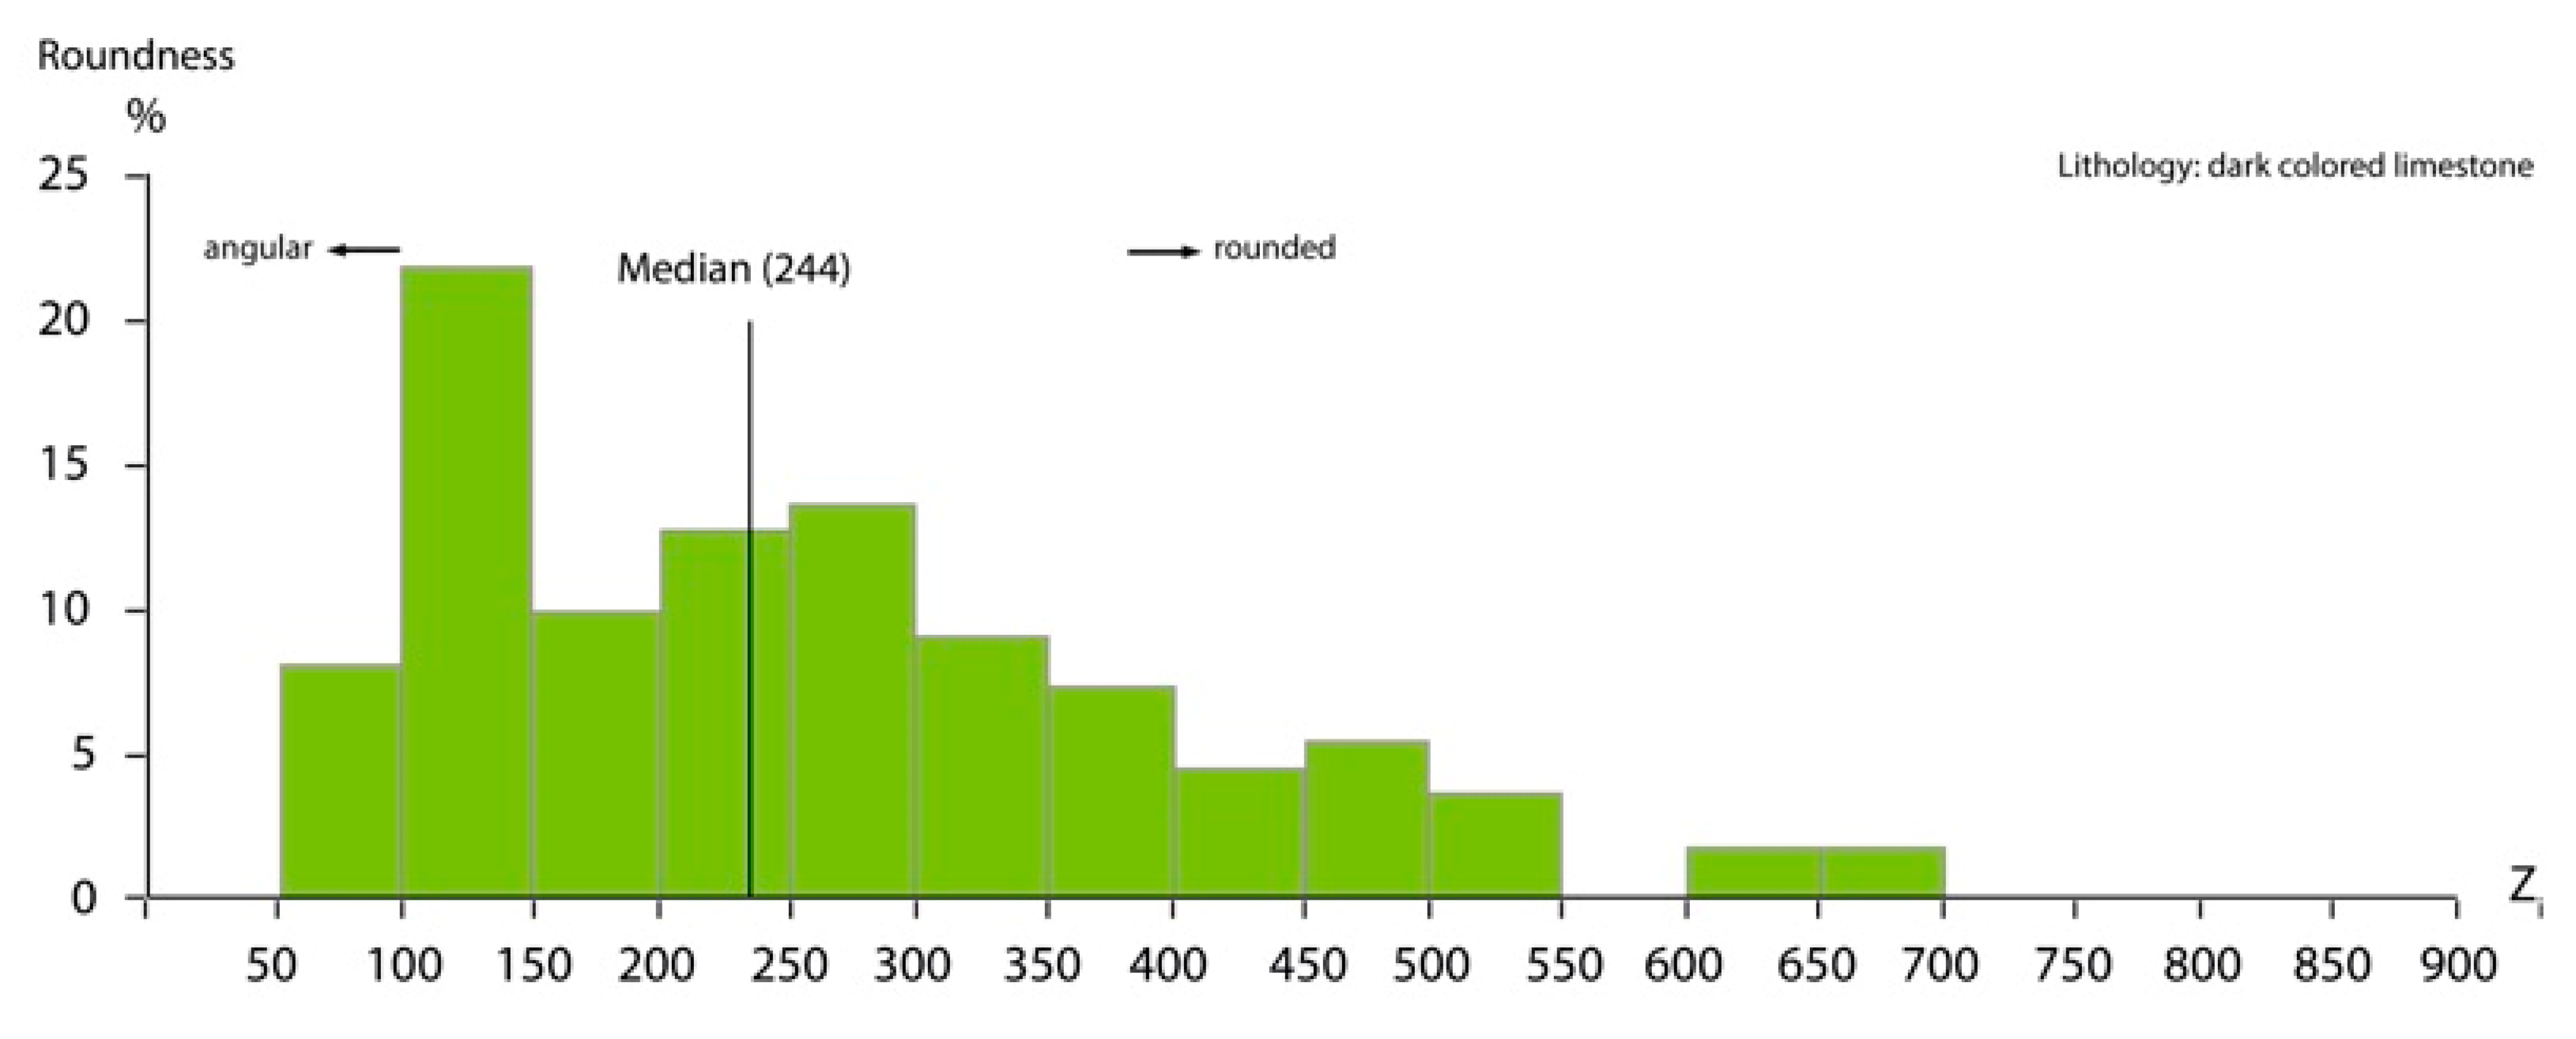
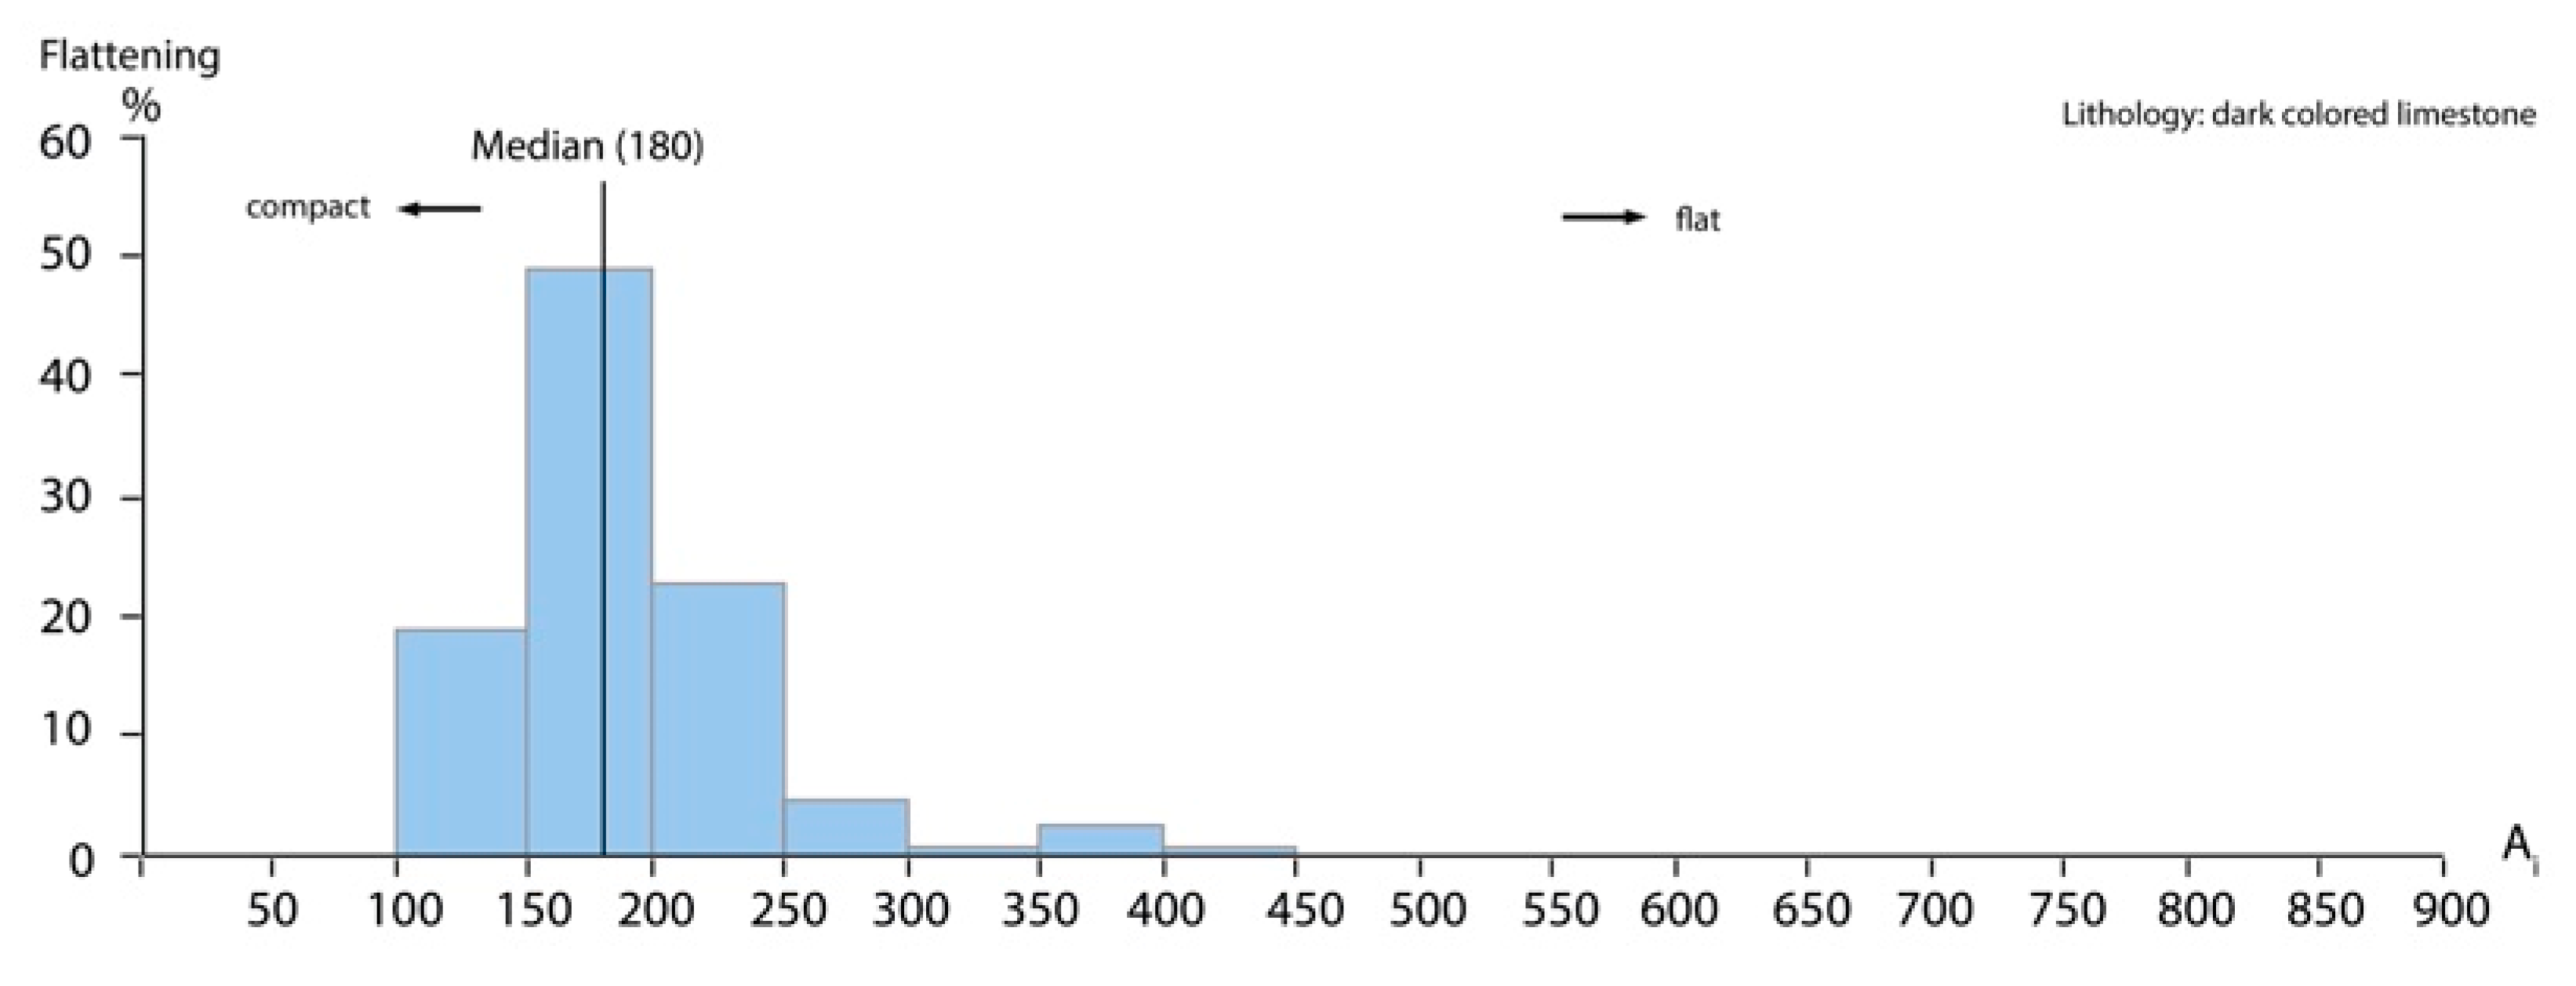
4.1.3. Clast Morphometry
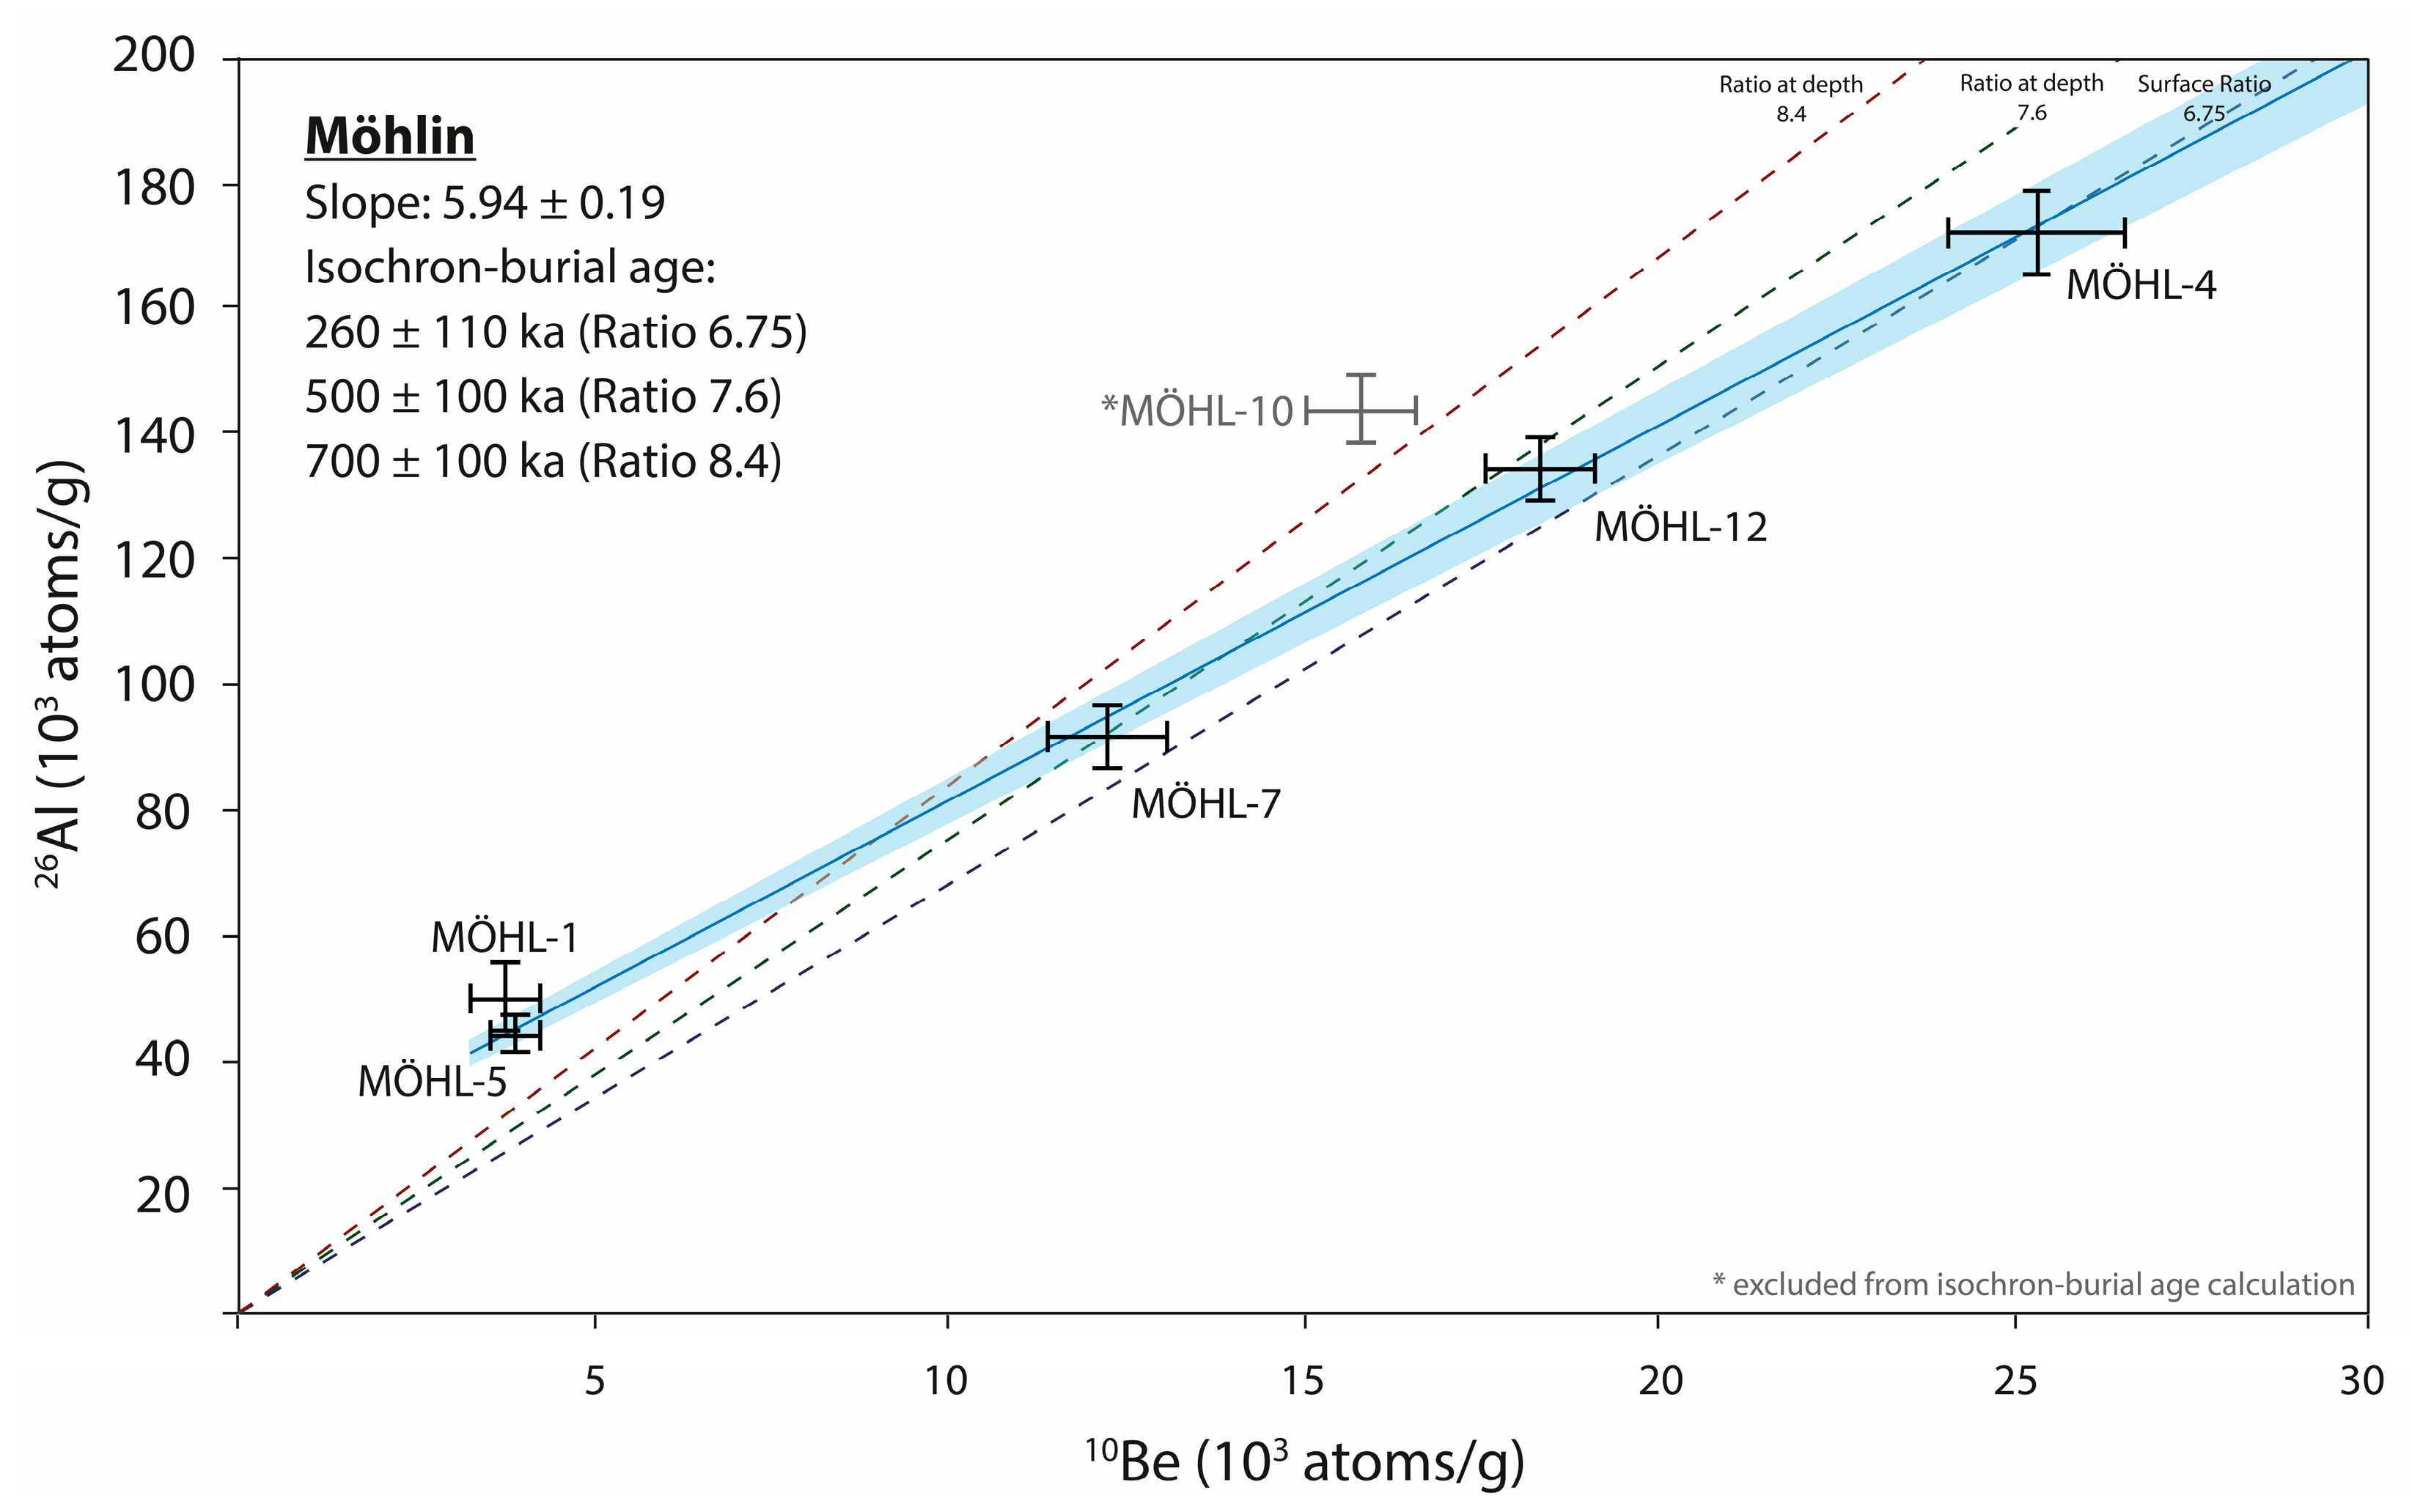
4.2. Isochron-Burial Dating
5. Discussion
5.1. Provenance of the Sediments
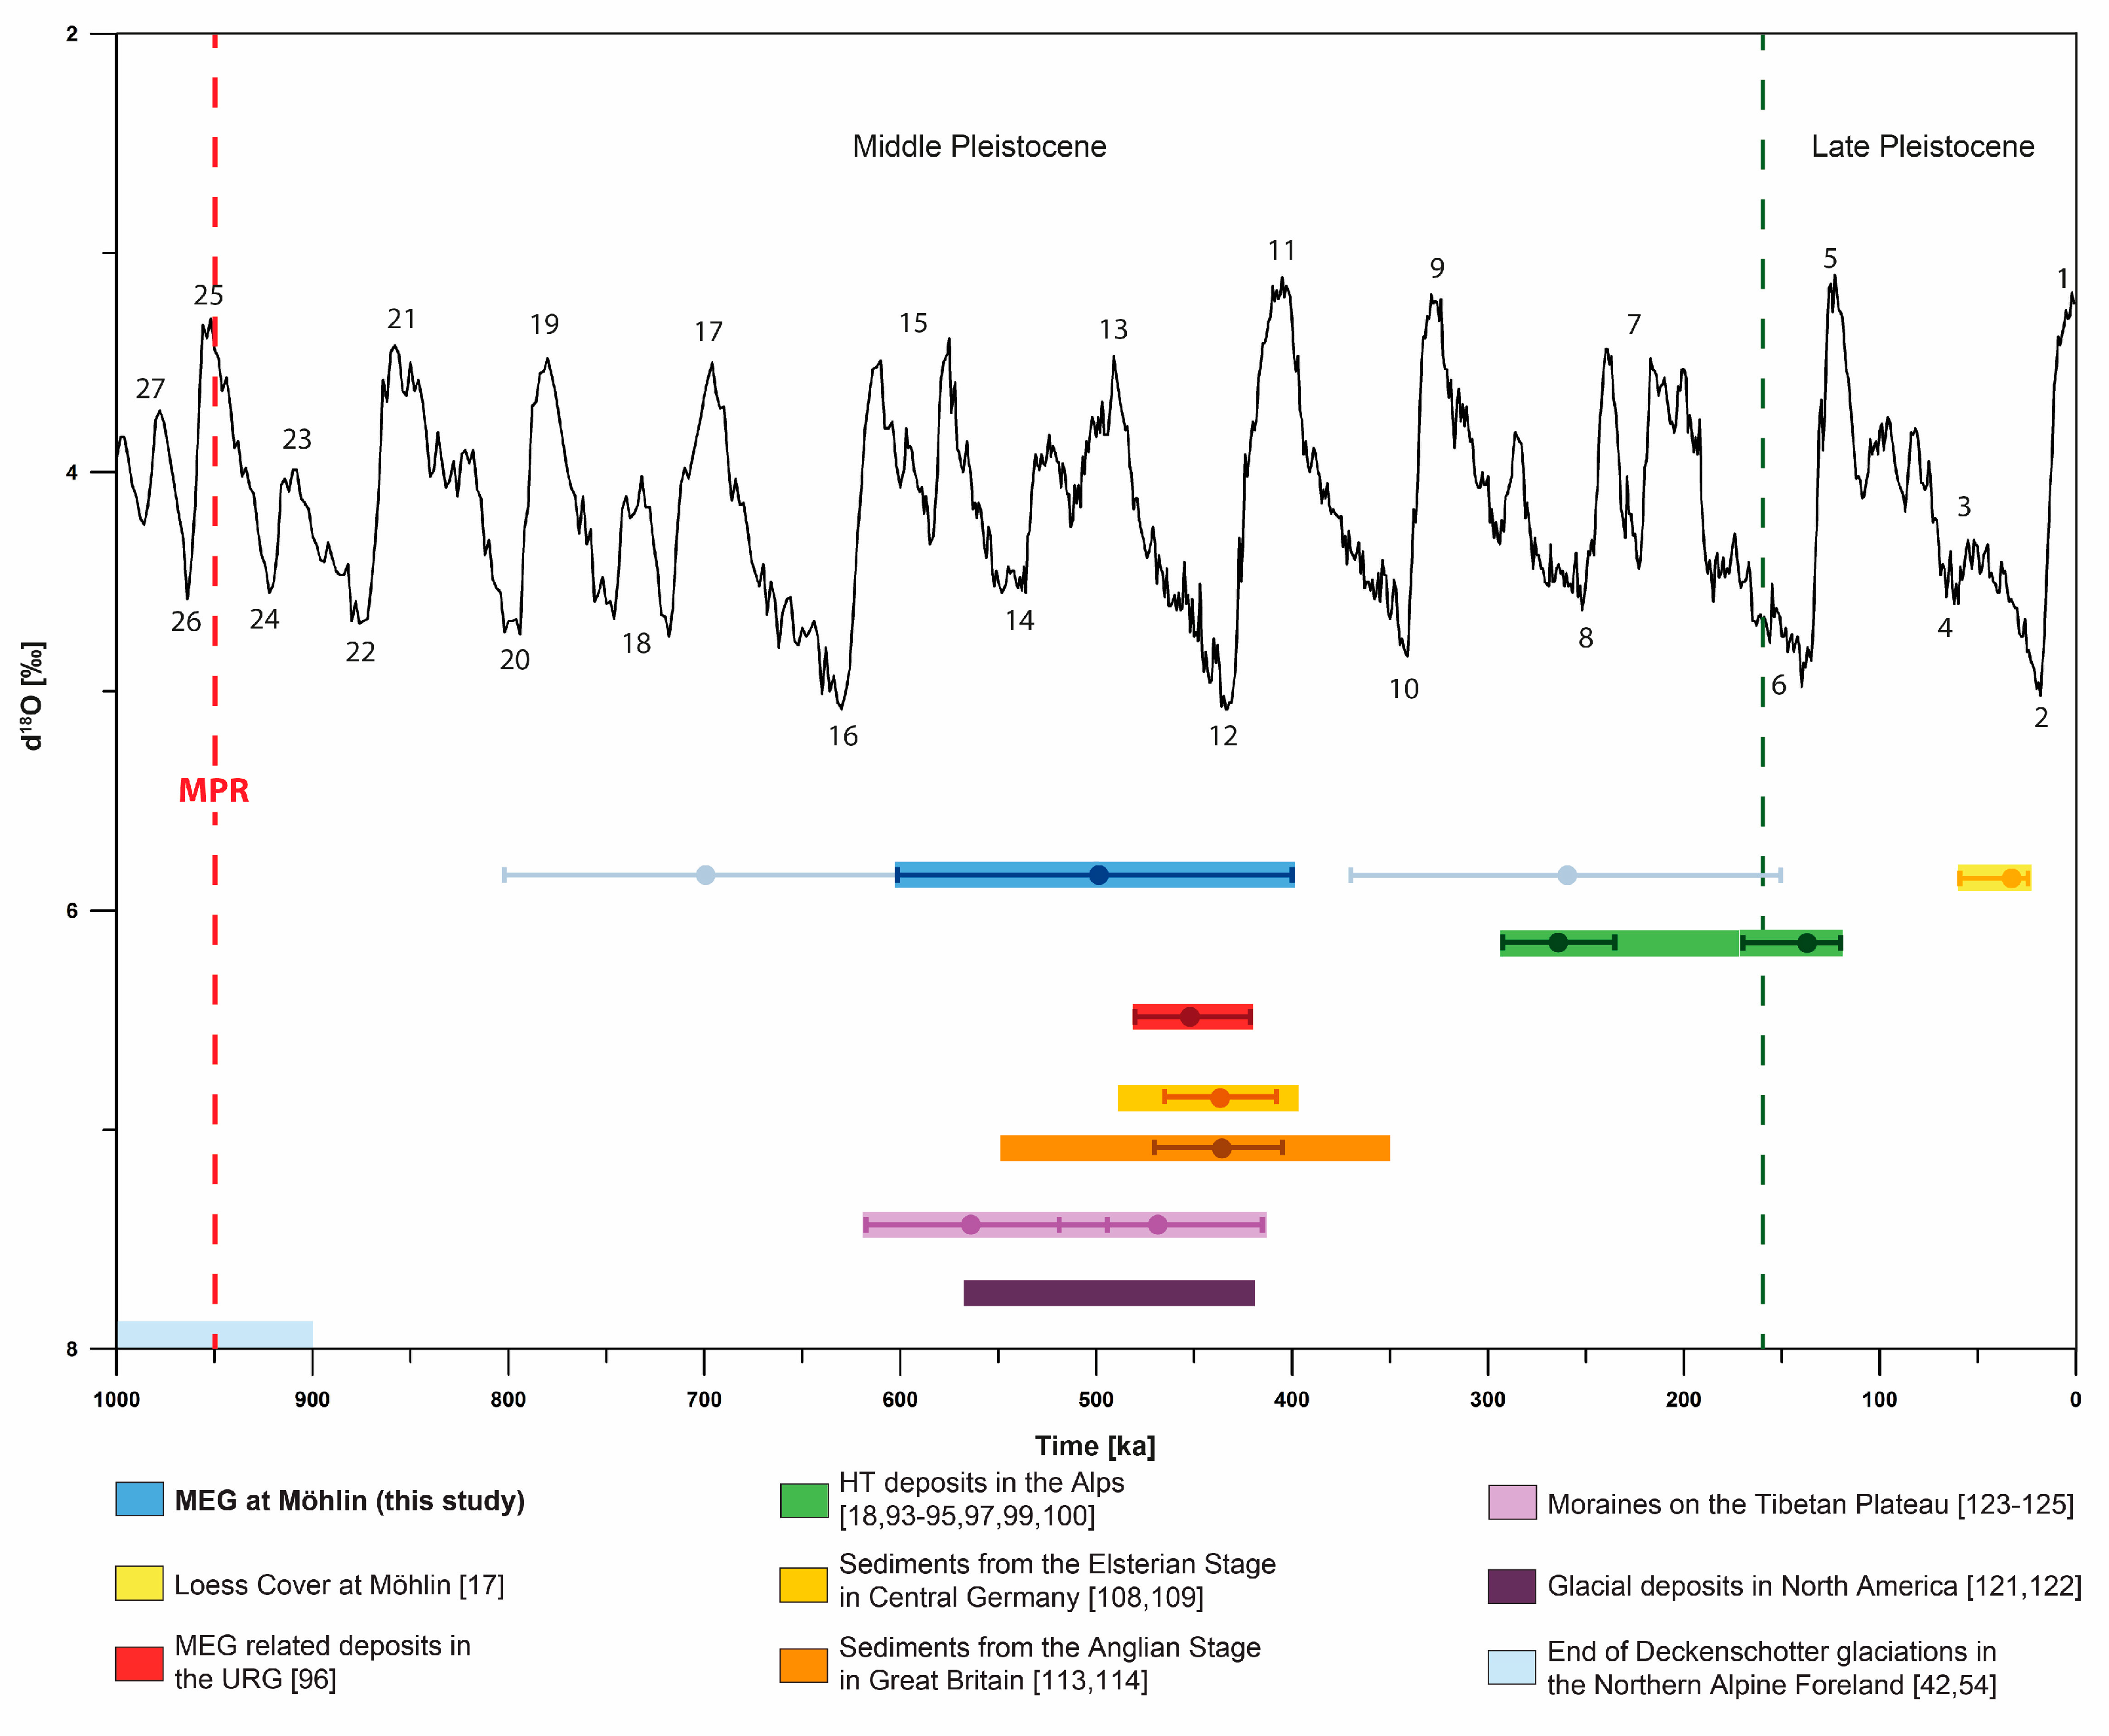
5.2. Age of the MEG in the Northern Hemisphere
6. Conclusions
Author Contributions
Funding
Data Availability Statement
Acknowledgments
Conflicts of Interest
References
- Cohen, K.M.; Finney, S.C.; Gibbard, P.L.; Fan, J.-X. The ICS International Chronostratigraphic Chart. Episodes 2013, 36, 199–204. [Google Scholar] [CrossRef] [PubMed]
- Schlüchter, C. The Swiss glacial record—A schematic summary. In Quaternary Glaciations-Extent and Chronology; Elsevier B.V.: Amsterdam, The Netherlands, 2004; Volume 2, pp. 413–418. ISBN 9780444514622. [Google Scholar]
- Graf, H.R. Stratigraphie von Mittel- und Spätpleistozän in der Nordschweiz. Beiträge zur Geol. Karte der Schweiz; Bundesamt für Landestopographie, Swisstopo: Wabern, Switzerland, 2009; Volume 168. [Google Scholar]
- Preusser, F.; Graf, H.R.; Keller, O.; Krayss, E.; Schlüchter, C. Quaternary glaciation history of northern Switzerland. E&G Quat. Sci. J. 2011, 60, 282–305. [Google Scholar] [CrossRef]
- Ellwanger, D.; Wielandt-Schuster, U.; Franz, M.; Simon, T. The Quaternary of the southwest German Alpine Foreland (Bodensee-Oberschwaben, Baden-Württemberg, Southwest Germany). E&G Quat. Sci. J. 2011, 60, 306–328. [Google Scholar] [CrossRef]
- Keller, O. Erwägungen zur Korrelation mittelpleistozäner Relikte des Rheingletschers mit der nordschweizer Stratigraphie. E&G Quat. Sci. J. 2014, 63, 19–43. [Google Scholar] [CrossRef]
- Schlüchter, C. Das Eiszeitalter in der Schweiz; Stiftung Landschaft und Kies: Rubigen, Switzerland, 2010; p. 4. [Google Scholar]
- Keller, O.; Krayss, E. Mittel-und spätpleistozäne Stratigraphie und Morphogenese in Schlüsselregionen der Nordschweiz. E&G Quat. Sci. J. 2010, 59, 88–119. [Google Scholar] [CrossRef]
- Penck, A.; Brückner, E. Die Alpen im Eiszeitalter; H. Tauchnitz: Leipzig, Germany, 1909; p. 1199. [Google Scholar]
- Frei, R. Über die Ausbreitung der Diluvialgletscher in der Schweiz. Beiträge zur Geol. Karte der Schweiz; Bundesamt für Landestopographie, Swisstopo: Wabern, Switzerland, 1912; Volume 41. [Google Scholar]
- Hantke, R. Eiszeitalter Kalt-/Warmzeit-Zyklen und Eistransport im alpinen und voralpinen Raum; Hep Verlag Ag: Bern, Switzerland, 2011; ISBN 978-3-7225-0121-5. [Google Scholar]
- Ellwanger, D. Eine landschaftsübergreifende Lockergesteinsgliederung vom Alpenrand zum Oberrhein. In Landschaftsgeschichte im europäischen Rheinland; Schirmer, W., Ed.; Lit Verlag: Münster, Germany, 2003; pp. 81–124. [Google Scholar]
- Fiebig, M.; Preusser, F. Pleistocene glaciations of the northern Alpine Foreland. Geogr. Helv. 2008, 63, 145–150. [Google Scholar] [CrossRef] [Green Version]
- Spell, T.L.; Mcdougall, I. Revisions to the Age of the Brunhes-Matuyama boundary and the Pleistocene geomagnetic polarity timescale. Geophys. Res. Lett. 1992, 19, 1181–1184. [Google Scholar] [CrossRef]
- Lisiecki, L.E.; Raymo, M.E. A Pliocene-Pleistocene stack of 57 globally distributed benthic δ18O records. Paleoceanography 2005, 20, 1–17. [Google Scholar] [CrossRef] [Green Version]
- Schlüchter, C. The Deglaciation of the Swiss-Alps: A paleoclimatic event with chronological problems. Bull. L’association Française Pour L’étude Quat. 1988, 2, 141–145. [Google Scholar] [CrossRef]
- Gaar, D.; Preusser, F. Age of the Most Extensive Glaciation of Northern Switzerland: Evidence from the scientific drilling at Möhliner Feld. E&G Quat. Sci. J. 2017, 66, 1–5. [Google Scholar] [CrossRef]
- Dehnert, A.; Preusser, F.; Kramers, J.D.; Akçar, N.; Kubik, P.W.; Reber, R.; Schlüchter, C. A multi-dating approach applied to proglacial sediments attributed to the Most Extensive Glaciation of the Swiss Alps. Boreas 2010, 39, 620–632. [Google Scholar] [CrossRef]
- Gutzwiller, A. Die Diluvialbildungen der Umgebung von Basel. Verh. Nat. Ges. Basel 1895, 10, 512–690. [Google Scholar] [CrossRef] [Green Version]
- Bini, A.; Buoncristiani, J.F.; Couterrand, S.; Ellwanger, D.; Felber, M.; Florineth, D.; Graf, H.R.; Keller, O.; Kelly, M.; Schlüchter, C.; et al. Die Schweiz während dem letzteiszeitlichen Maximums (LGM); Bundesamt für Landestopographie, Swisstopo: Wabern, Switzerland, 2009. [Google Scholar]
- Dick, K.A.; Graf, H.-R.; Müller, B.U.; Hartmann, P.; Schlüchter, C. Das nordalpine Wasserschloss und seine eiszeitgeologische Umgebung. Eclogae Geol. Helv. 1996, 89, 635–645. [Google Scholar]
- Müller-Dick, K. Das Möhlinerfeld im Hochrheintal. In DEUQUA 2000, Bern, Exkursionsführer, Exk. A1; Kelly, M., Linden, U., Schlüchter, C., Eds.; DEUQUA: Hannover, Germany, 2000; pp. 10–14. [Google Scholar]
- Pfirter, U.; Jordan, P.; Graf, H.R.; Burger, H.; Pietsch, J.; Huber, M.; Kiefer, S.; Grezet, C.; Maise, C.; Burkhalter, R. Geologischer Atlas der Schweiz 1:25‘000. Blatt Sissach (1068) mit Südteil von Blatt Rheinfelden (1048)–Erläuterungen; Bundesamt für Landestopographie, Swisstopo: Wabern, Switzerland, 2019; ISBN 9783302401003. [Google Scholar]
- Frei, R. Monographie des Schweizerischen Deckenschotters. Beiträge zur Geol. Karte der Schweiz; Bundesamt für Landestopographie, Swisstopo: Wabern, Switzerland, 1912; Volume 37. [Google Scholar]
- Graf, H.R. Die Deckenschotter der Zentralen Nordschweiz. Ph.D. Thesis, Swiss Federal Institute of Technology Zurich, Zurich, Switzerland, 1993. [Google Scholar]
- Schlüchter, C. Eiszeitliche Lockergesteine-Geologie, Genese und Eigenschaften. Ein Beitrag zu den Beziehungen zwischen fundamentaler und angewandter Eiszeitgeologie, Habilitationsschrift; Swiss Federal Institute of Technology Zurich: Zurich, Switzerland, 1989. [Google Scholar]
- Weltje, G.J.; von Eynatten, H. Quantitative provenance analysis of sediments: Review and outlook. Sediment. Geol. 2004, 171, 1–11. [Google Scholar] [CrossRef]
- Lindsey, D.A.; Langer, W.H.; Van Gosen, B.S. Using pebble lithology and roundness to interpret gravel provenance in piedmont fluvial systems of the Rocky Mountains, USA. Sediment. Geol. 2007, 199, 223–232. [Google Scholar] [CrossRef]
- Adelsberger, K.A. Sedimentology. In Encyclopedia of Geoarchaeology; Gilbert, A.S., Ed.; Springer: Dordrecht, The Netherlands, 2017; pp. 764–772. ISBN 978-1-4020-4409-0. [Google Scholar]
- Claude, A.; Akçar, N.; Ivy-Ochs, S.D.; Schlunegger, F.; Kubik, P.W.; Dehnert, A.; Kuhlemann, J.; Rahn, M.; Schlüchter, C. Timing of early Quaternary gravel accumulation in the Swiss Alpine Foreland. Geomorphology 2017, 276, 71–85. [Google Scholar] [CrossRef] [Green Version]
- Günther, D. Der Schwarzwald und seine Umgebung. Geologie-Mineralogie-Bergbau-Umwelt und Geotourismus; Rothe, P., Ed.; Gebr Borntraeger: Stuttgart, Germany, 2010; 302p. [Google Scholar]
- Benn, D.I. Clast Morphology. A Practical Guide to the Study of Glacial Sediments; Evans, D.J.A., Benn, D.I., Eds.; Routledge, Taylor & Francis Group: London, UK, 2004; pp. 78–92. [Google Scholar]
- Cailleux, A. L’indice d’émoussé: Définition et première application. Société Géologique Fr. 1947, 13, 250–252. [Google Scholar]
- Sneed, E.D.; Folk, R.L. Pebbles in the Lower Colorado River, Texas a study in particle morphogenesis. J. Geol. 1958, 66, 114–150. [Google Scholar] [CrossRef]
- Cailleux, A.; Tricart, J. Initiation a l’étude des Sables et des Galets (3 Volumes); Centre de Documentation Universitaire: Paris, France, 1959; 772p. [Google Scholar]
- Boulton, G.S. Boulder shapes and grain-size distributions of debris as indicators of transport paths through a glacier and till genesis. Sedimentology 1978, 25, 773–799. [Google Scholar] [CrossRef]
- Benn, D.I.; Ballantyne, C.K. Reconstructing the transport history of glacigenic sediments: A new approach based on the co-variance of clast form indices. Sediment. Geol. 1994, 91, 215–227. [Google Scholar] [CrossRef]
- Lukas, S.; Graf, A.; Coray, S.; Schlüchter, C. Genesis, stability and preservation potential of large lateral moraines of Alpine valley glaciers-towards a unifying theory based on Findelengletscher, Switzerland. Quat. Sci. Rev. 2012, 38, 27–48. [Google Scholar] [CrossRef]
- Chandler, D.M.; Hubbard, B. Quantifying sample bias in clast fabric measurements. Sedimentology 2008, 55, 925–938. [Google Scholar] [CrossRef]
- Boggs, S. Petrology of Sedimentary Rocks, 2nd ed.; Cambridge University Press: Cambridge, UK, 2009; ISBN 9780521897167. [Google Scholar]
- Balco, G.; Rovey, C.W. An isochron method for cosmogenic-nuclide dating of buried soils and sediments. Am. J. Sci. 2008, 308, 1083–1114. [Google Scholar] [CrossRef]
- Knudsen, M.F.; Nørgaard, J.; Grischott, R.; Kober, F.; Egholm, D.L.; Hansen, T.M.; Jansen, J.D. New cosmogenic nuclide burial-dating model indicates onset of major glaciations in the Alps during Middle Pleistocene Transition. Earth Planet. Sci. Lett. 2020, 549, 116491. [Google Scholar] [CrossRef]
- van Buuren, U.; Prins, M.A.; Wang, X.; Stange, M.; Yang, X.; van Balen, R.T. Fluvial or aeolian? Unravelling the origin of the silty clayey sediment cover of terraces in the Hanzhong Basin (Qinling Mountains, central China). Geomorphology 2020, 367, 107294. [Google Scholar] [CrossRef]
- Darling, A.L.; Karlstrom, K.E.; Granger, D.E.; Aslan, A.; Kirby, E.; Ouimet, W.B.; Lazear, G.D.; Coblentz, D.D.; Cole, R.D. New incision rates along the Colorado River system based on cosmogenic burial dating of terraces: Implications for regional controls on Quaternary incision. Geosphere 2012, 8, 1020–1041. [Google Scholar] [CrossRef] [Green Version]
- Erlanger, E.D.; Granger, D.E.; Gibbon, R.J. Rock uplift rates in South Africa from isochron burial dating of fluvial and marine terraces. Geology 2012, 40, 1019–1022. [Google Scholar] [CrossRef]
- Balco, G.; Soreghan, G.S.; Sweet, D.E.; Marra, K.R.; Bierman, P.R. Cosmogenic-nuclide burial ages for Pleistocene sedimentary fill in Unaweep Canyon, Colorado, USA. Quat. Geochronol. 2013, 18, 149–157. [Google Scholar] [CrossRef]
- Çiner, A.; Doğan, U.; Yildirim, C.; Akçar, N.; Ivy-Ochs, S.; Alfimov, V.; Kubik, P.W.; Schlüchter, C. Quaternary uplift rates of the Central Anatolian Plateau, Turkey: Insights from cosmogenic isochron-burial nuclide dating of the Kizilirmak River terraces. Quat. Sci. Rev. 2015, 107, 81–97. [Google Scholar] [CrossRef] [Green Version]
- Bender, A.M.; Amos, C.B.; Bierman, P.; Rood, D.H.; Staisch, L.; Kelsey, H.; Sherrod, B. Differential uplift and incision of the Yakima River terraces, central Washington State. J. Geophys. Res. Solid Earth 2016. [Google Scholar] [CrossRef] [Green Version]
- Schaller, M.; Ehlers, T.A.; Stor, T.; Torrent, J.; Lobato, L.; Christl, M.; Vockenhuber, C. Timing of European fluvial terrace formation and incision rates constrained by cosmogenic nuclide dating. Earth Planet. Sci. Lett. 2016, 451, 221–231. [Google Scholar] [CrossRef]
- Zhao, Z.; Granger, D.; Zhang, M.; Kong, X.; Yang, S.; Chen, Y.; Hu, E. A test of the isochron burial dating method on fluvial gravels within the Pulu volcanic sequence, West Kunlun Mountains, China. Quat. Geochronol. 2016, 34, 75–80. [Google Scholar] [CrossRef] [Green Version]
- Akçar, N.; Ivy-Ochs, S.; Alfimov, V.; Schlunegger, F.; Claude, A.; Reber, R.; Christl, M.; Vockenhuber, C.; Dehnert, A.; Rahn, M.; et al. Isochron-burial dating of glaciofluvial deposits: First results from the Swiss Alps. Earth Surf. Process. Landf. 2017, 42, 2414–2425. [Google Scholar] [CrossRef]
- Tu, H.; Shen, G.; Granger, D.; Yang, X.; Lai, Z. Isochron 26Al/10Be burial dating of the Lantian hominin site at Gongwangling in Northwestern China. Quat. Geochronol. 2017, 41, 174–179. [Google Scholar] [CrossRef]
- Litty, C.; Schlunegger, F.; Akçar, N.; Lanari, P.; Christl, M.; Vockenhuber, C. Possible climatic controls on the accumulation of Peru’s most prominent alluvial fan: The Lima Conglomerate. Earth Surf. Process. Landf. 2018, 44, 991–1003. [Google Scholar] [CrossRef] [Green Version]
- Claude, A.; Akçar, N.; Ivy-Ochs, S.; Schlunegger, F.; Kubik, P.W.; Christl, M.; Vockenhuber, C.; Kuhlemann, J.; Rahn, M.; Schlüchter, C. Changes in landscape evolution patterns in the northern Swiss Alpine Foreland during the mid-Pleistocene revolution. Geol. Soc. Am. Bull. 2019, 131, 2056–2078. [Google Scholar] [CrossRef]
- Granger, D.E.; Muzikar, P.F. Dating sediment burial with in situ-produced cosmogenic nuclides: Theory, techniques, and limitations. Earth Planet. Sci. Lett. 2001, 188, 269–281. [Google Scholar] [CrossRef] [Green Version]
- Maxeiner, S.; Synal, H.A.; Christl, M.; Suter, M.; Müller, A.; Vockenhuber, C. Proof-of-principle of a compact 300 kV multi-isotope AMS facility. Nucl. Instrum. Methods Phys. Res. Sect. B Beam Interact. Mater. At. 2019, 439, 84–89. [Google Scholar] [CrossRef]
- Christl, M.; Gautschi, P.; Synal, H.A. 10Be on the 0.3 MV MILEA System. In Annual Report 2020–Laboratory of Ion Beam Physics; Librum Publishers and Editors: Basel, Switzerland, 2021; p. 12. [Google Scholar]
- Gautschi, P.; Vockenhuber, C.; Synal, H.A. 26Al on the 0.3 MV MILEA System. In Annual Report 2020–Laboratory of Ion Beam Physics; Librum Publishers and Editors: Basel, Switzerland, 2021; p. 13. [Google Scholar]
- Balco, G.; Stone, J.O.; Lifton, N.A.; Dunai, T.J. A complete and easily accessible means of calculating surface exposure ages or erosion rates from 10Be and 26Al measurements. Quat. Geochronol. 2008, 3, 174–195. [Google Scholar] [CrossRef]
- Borchers, B.; Marrero, S.; Balco, G.; Caffee, M.; Goehring, B.; Lifton, N.; Nishiizumi, K.; Phillips, F.; Schaefer, J.; Stone, J. Geological calibration of spallation production rates in the CRONUS-Earth project. Quat. Geochronol. 2016, 31, 188–198. [Google Scholar] [CrossRef] [Green Version]
- Lal, D. Cosmic ray labeling of erosion surfaces: In situ nuclide production rates and erosion models. Earth Planet. Sci. Lett. 1991, 104, 424–439. [Google Scholar] [CrossRef]
- Stone, J.O. Air pressure and cosmogenic isotope production. J. Geophys. Res. Solid Earth 2000, 105, 753–759. [Google Scholar] [CrossRef]
- Chmeleff, J.; von Blanckenburg, F.; Kossert, K.; Jakob, D. Determination of the10Be half-life by multicollector ICP-MS and liquid scintillation counting. Nucl. Instrum. Methods Phys. Res. Sect. B: Beam Interact. Mater. At. 2010, 268, 192–199. [Google Scholar] [CrossRef] [Green Version]
- Korschinek, G.; Bergmaier, A.; Faestermann, T.; Gerstmann, U.C.; Knie, K.; Rugel, G.; Wallner, A.; Dillmann, I.; Dollinger, G.; von Gostomski, C.L.; et al. A new value for the half-life of 10Be by Heavy-Ion Elastic Recoil Detection and liquid scintillation counting. Nucl. Instrum. Methods Phys. Res. Sect. B Beam Interact. Mater. At. 2010, 268, 187–191. [Google Scholar] [CrossRef]
- Norris, T.L.; Gancarz, A.J.; Rokop, D.J.; Thomas, K.W. Half-Life of 26Al. J. Geophys. Res. 1983, 88, B331–B333. [Google Scholar] [CrossRef]
- Nishiizumi, K. Preparation of 26Al AMS standards. Nucl. Instrum. Methods Phys. Res. Sect. B Beam Interact. Mater. At. 2004, 223–224, 388–392. [Google Scholar] [CrossRef]
- Braucher, R.; Merchel, S.; Borgomano, J.; Bourlès, D.L. Production of cosmogenic radionuclides at great depth: A multi element approach. Earth Planet. Sci. Lett. 2011, 309, 1–9. [Google Scholar] [CrossRef]
- Braucher, R.; Bourlès, D.; Merchel, S.; Vidal Romani, J.; Fernadez-Mosquera, D.; Marti, K.; Léanni, L.; Chauvet, F.; Arnold, M.; Aumaître, G.; et al. Determination of muon attenuation lengths in depth profiles from in situ produced cosmogenic nuclides. Nucl. Instruments Methods Phys. Res. Sect. B Beam Interact. with Mater. Atoms 2013, 294, 484–490. [Google Scholar] [CrossRef]
- Margreth, A.; Gosse, J.C.; Dyke, A.S. Quantification of subaerial and episodic subglacial erosion rates on high latitude upland plateaus: Cumberland Peninsula, Baffin Island, Arctic Canada. Quat. Sci. Rev. 2016, 133, 108–129. [Google Scholar] [CrossRef]
- Lifton, N.; Sato, T.; Dunai, T.J. Scaling in situ cosmogenic nuclide production rates using analytical approximations to atmospheric cosmic-ray fluxes. Earth Planet. Sci. Lett. 2014, 386, 149–160. [Google Scholar] [CrossRef]
- swisstopo. Tektonische Karte der Schweiz 1:500,000; Bundesamt für Landestopographie, Swisstopo: Wabern, Switzerland, 2005. [Google Scholar]
- Pfiffner, A.O. Geologie der Alpen; 2. Auflage; Haupt Verlag: Bern, Switzerland, 2010; ISBN 978-3-8252-8416-9. [Google Scholar]
- Weissert, H.; Stössel, I. Der Ozean im Gebirge: Eine geologische Zeitreise durch die Schweiz; 2. Auflage; VDF Hochschulverlag AG an der ETH Zürich: Zurich, Switzerland, 2010. [Google Scholar]
- Pavoni, N. Geologie der Zürcher Molasse zwischen Albiskamm und Pfannenstiel. Vierteljahresschr. Nat. Ges. Zürich 1957, 102, 119–315. [Google Scholar]
- Matter, A. Sedimentologische Untersuchungen im östlichen Napfgebiet. Ecol. Geol. Helv. 1964. [Google Scholar] [CrossRef]
- Sartori, M.; Gouffon, Y.; Marthaler, M. Harmonisation et définition des unités lithostratigraphiques briançonnaises dans les nappes penniques du Valais. Eclogae Geol. Helv. 2006, 99, 363–407. [Google Scholar] [CrossRef]
- Reichelt, G. Zur Frage einer Rissvereisung des Südschwarzwaldes. Erdkunde 1960, 14, 53–58. [Google Scholar] [CrossRef]
- Pfannenstiel, M.; Rahm, G. Die Vergletscherung des Wehratales und der Wiesetäler während der Rißeiszeit. Ber. Naturf. Ges. Freibg. 1964, 54, 209–278. [Google Scholar]
- Leser, H. Zur Glazialproblematik auf Blatt Freiburg-Süd der Geomorphologischen Karte 1: 100 000 der Bundesrepublik Deutschland (GMK 100, Blatt 2). Eiszeitalt. Ggw. 1987, 37, 139–144. [Google Scholar] [CrossRef]
- Schreiner, A. Zur Quartärgeologie des unteren Wehratals und zur Frage der Vergletscherung des Dinkelberges in der Rißeiszeit (SW Deutschland). E&G Quat. Sci. J. 1995, 45, 62–74. [Google Scholar] [CrossRef]
- Suter, H.H. Zur Petrographie des Grundgebirges von Laufenburg und Umgebung (Südschwarzwald). Ph.D. Thesis, University of Zurich, Zurich, Switzerland, 1924. [Google Scholar]
- Schlüchter, C. Geologische Untersuchungen im Quartär des Aaretals südlich von Bern. Beiträge zur Geol. Karte der Schweiz; Bundesamt für Landestopographie, Swisstopo: Wabern, Switzerland, 1976; Volume 148. [Google Scholar]
- Anselmetti, F.S.; Drescher-Schneider, R.; Furrer, H.; Graf, H.R.; Lowick, S.E.; Preusser, F.; Riedi, M.A. A ~180,000 years sedimentation history of a perialpine overdeepened glacial trough (Wehntal, N-Switzerland). Swiss J. Geosci. 2010, 103, 345–361. [Google Scholar] [CrossRef] [Green Version]
- Dehnert, A.; Lowick, S.E.; Preusser, F.; Anselmetti, F.S.; Drescher-Schneider, R.; Graf, H.R.; Heller, F.; Horstmeyer, H.; Kemna, H.A.; Nowaczyk, N.R.; et al. Evolution of an overdeepened trough in the northern Alpine Foreland at Niederweningen, Switzerland. Quat. Sci. Rev. 2012, 34, 127–145. [Google Scholar] [CrossRef]
- Büchi, M.W.; Graf, H.R.; Haldimann, P.; Lowick, S.E.; Anselmetti, F.S. Multiple Quaternary erosion and infill cycles in overdeepened basins of the northern Alpine foreland. Swiss J. Geosci. 2018, 111, 133–167. [Google Scholar] [CrossRef]
- Büchi, M.W.; Lowick, S.E.; Anselmetti, F.S. Luminescence dating of glaciolacustrine silt in overdeepened basin fills beyond the last interglacial. Quat. Geochronol. 2017, 37, 55–67. [Google Scholar] [CrossRef]
- Müller, D.; Preusser, F.; Büchi, M.W.; Gegg, L.; Deplazes, G. Luminescence properties and dating of glacial to periglacial sediments from northern Switzerland. Geochronology 2020, 2, 305–323. [Google Scholar] [CrossRef]
- Lowick, S.E.; Büchi, M.W.; Gaar, D.; Graf, H.R.; Preusser, F. Luminescence dating of Middle Pleistocene proglacial deposits from northern Switzerland: Methodological aspects and stratigraphical conclusions. Boreas 2015, 44, 459–482. [Google Scholar] [CrossRef]
- Klasen, N.; Fiebig, M.; Preusser, F. Applying luminescence methodology to key sites of Alpine glaciations in Southern Germany. Quat. Int. 2016, 420, 249–258. [Google Scholar] [CrossRef]
- Rhodes, E.J. Optically stimulated luminescence dating of sediments over the past 200,000 years. Annu. Rev. Earth Planet. Sci. 2011, 39, 461–488. [Google Scholar] [CrossRef] [Green Version]
- Chapot, M.S.; Roberts, H.M.; Duller, G.A.T.; Lai, Z.P. A comparison of natural- and laboratory-generated dose response curves for quartz optically stimulated luminescence signals from Chinese Loess. Radiat. Meas. 2012, 47, 1045–1052. [Google Scholar] [CrossRef]
- Wallinga, J.; Cunningham, A.C. Encyclopedia of Scientific Dating Methods. Encycl. Sci. Dating Methods 2015, 1–9. [Google Scholar] [CrossRef]
- Rentzel, P.; Preusser, F.; Pümpin, C.; Wolf, J.J. Loess and palaeosols on the High Terrace at Sierentz (France), and implications for the chronology of terrace formation in the Upper Rhine Graben. Swiss J. Geosci. 2009, 102, 387–401. [Google Scholar] [CrossRef] [Green Version]
- Claude, A.; Akçar, N.; Ivy-Ochs, S.; Schlunegger, F.; Rentzel, P.; Pümpin, C.; Tikhomirov, D.; Kubik, P.W.; Vockenhuber, C.; Dehnert, A.; et al. Chronology of Quaternary terrace deposits at the locality Hohle Gasse (Pratteln, NW Switzerland). Swiss J. Geosci. 2017, 110, 793–809. [Google Scholar] [CrossRef]
- Klasen, N. Lumineszenzdatierung Glazifluvialer Sedimente im Nördlichen Alpenvorland (“Luminescence Dating of Glaciofluvial Sediments in the Northern Alpine Foreland”). Ph.D. Thesis, Universität zu Köln, Köln, Germany, 2008. [Google Scholar]
- Preusser, F.; Büschelberger, M.; Kemna, H.A.; Miocic, J.; Mueller, D.; May, J.-H. Exploring possible links between Quaternary aggradation in the Upper Rhine Graben and the glaciation history of northern Switzerland. Int. J. Earth Sci. 2021. [Google Scholar] [CrossRef]
- Graf, A.; Akçar, N.; Ivy-Ochs, S.; Strasky, S.; Kubik, P.W.; Christl, M.; Burkhard, M.; Wieler, R.; Schlüchter, C. Multiple advances of Alpine glaciers into the Jura Mountains in the Northwestern Switzerland. Swiss J. Geosci. 2015, 108, 225–238. [Google Scholar] [CrossRef]
- Schielein, P.; Schellmann, G.; Lomax, J.; Preusser, F.; Fiebig, M. Chronostratigraphy of the Hochterrassen in the lower Lech Valley (Northern Alpine Foreland). E&G Quat. Sci. J. 2015, 64, 15–28. [Google Scholar] [CrossRef]
- Bickel, L.; Lüthgens, C.; Lomax, J.; Fiebig, M. Luminescence dating of glaciofluvial deposits linked to the penultimate glaciation in the Eastern Alps. Quat. Int. 2015, 357, 110–124. [Google Scholar] [CrossRef] [Green Version]
- Bickel, L.; Lüthgens, C.; Lomax, J.; Fiebig, M. The timing of the penultimate glaciation in the northern Alpine Foreland: New insights from luminescence dating. Proc. Geol. Assoc. 2015, 126, 536–550. [Google Scholar] [CrossRef] [Green Version]
- Monegato, G.; Lowick, S.E.; Ravazzi, C.; Banino, R.; Donegana, M.; Preusser, F. Middle to Late Pleistocene palaeoenvironmental evolution of the southeastern Alpine Valeriano Creek succession (northeastern Italy). J. Quat. Sci. 2010, 25, 617–632. [Google Scholar] [CrossRef]
- Monegato, G.; Poli, M.E. The Pleistocene activity of the eastern Southalpine chain unravelled by the terraced staircase of the Meduna valley (NE Italy). Rend. Online Soc. Geol. Ital. 2013, 29, 108–111. [Google Scholar]
- Gianotti, F.; Forno, M.G.; Ivy-Ochs, S.; Monegato, G.; Pini, R.; Ravazzi, C. Stratigraphy of the Ivrea Morainic Amphitheatre (NW ITALY): An updated synthesis. Alp. Mediterr. Quat. 2015, 28, 29–58. [Google Scholar]
- Buoncristiani, J.F.; Campy, M. Quaternary glaciations in the French Alps and Jura. In Developments in Quaternary Science; Elsevier Inc.: Amsterdam, The Netherlands, 2011; Volume 15, pp. 117–126. ISBN 9780444534477. [Google Scholar]
- Maslin, M.A.; Ridgwell, A.J. Mid-Pleistocene revolution and the ‘eccentricity myth’. Geol. Soc. Lond. Spec. Publ. 2005, 247, 19–34. [Google Scholar] [CrossRef] [Green Version]
- Ehlers, J.; Gibbard, P.L. The extent and chronology of Cenozoic Global Glaciation. Quat. Int. 2007, 164–165, 6–20. [Google Scholar] [CrossRef]
- Eissmann, L. Quaternary geology of eastern Germany (Saxony, Saxon-Anhalt, South Brandenburg, Thüringia), type area of the Elsterian and Saalian Stages in Europe. Quat. Sci. Rev. 2002, 21, 1275–1346. [Google Scholar] [CrossRef]
- Lauer, T.; Weiss, M. Timing of the Saalian- and Elsterian glacial cycles and the implications for Middle-Pleistocene hominin presence in central Europe. Sci. Rep. 2018, 8, 1–13. [Google Scholar] [CrossRef] [Green Version]
- Roskosch, J.; Winsemann, J.; Polom, U.; Brandes, C.; Tsukamoto, S.; Weitkamp, A.; Bartholomäus, W.A.; Henningsen, D.; Frechen, M. Luminescence dating of ice-marginal deposits in northern Germany: Evidence for repeated glaciations during the Middle Pleistocene (MIS 12 to MIS 6). Boreas 2015, 44, 103–126. [Google Scholar] [CrossRef]
- Laban, C.; van der Meer, J.J.M. Pleistocene glaciation in the Netherlands. In Developments in Quaternary Science; Elsevier Inc.: Amsterdam, The Netherlands, 2011; pp. 247–260. Volume 15, ISBN 9780444534477. [Google Scholar]
- Hughes, P.D.; Gibbard, P.L. Global glacier dynamics during 100 ka Pleistocene glacial cycles. Quat. Res. 2018, 90, 222–243. [Google Scholar] [CrossRef] [Green Version]
- Preusser, F.; Reitner, J.M.; Schlüchter, C. Distribution, geometry, age and origin of overdeepened valleys and basins in the Alps and their foreland. Swiss J. Geosci. 2010, 103, 407–426. [Google Scholar] [CrossRef] [Green Version]
- Pawley, S.M.; Bailey, R.M.; Rose, J.; Moorlock, B.S.P.; Hamblin, R.J.O.; Booth, S.J.; Lee, J.R. Age limits on Middle Pleistocene glacial sediments from OSL dating, north Norfolk, UK. Quat. Sci. Rev. 2008, 27, 1363–1377. [Google Scholar] [CrossRef] [Green Version]
- Pawley, S.M.; Toms, P.; Armitage, S.J.; Rose, J. Quartz luminescence dating of Anglian Stage (MIS 12) fluvial sediments: Comparison of SAR age estimates to the terrace chronology of the Middle Thames valley, UK. Quat. Geochronol. 2010, 5, 569–582. [Google Scholar] [CrossRef]
- Astakhov, V. Ice Margins of Northern Russia revisited. In Developments in Quaternary Science; Elsevier Inc.: Amsterdam, The Netherlands, 2011; Volume 15, pp. 323–336. ISBN 9780444534477. [Google Scholar]
- Velichko, A.A.; Faustova, M.A.; Pisareva, V.V.; Gribchenko, Y.U.N.; Sudakova, N.G.; Lavrentiev, N.V. Glaciations of the East European Plain: Distribution and Chronology. Dev. Quat. Sci. 2011, 15, 337–359. [Google Scholar] [CrossRef]
- Woodward, J.C.; Hughes, P.D. Glaciation in Greece. A new record of cold stage environments in the Mediterranean. In Developments in Quaternary Sciences; Elsevier Inc.: Amsterdam, The Netherlands, 2011; Volume 15, pp. 175–198. ISBN 9780444534477. [Google Scholar]
- Hughes, P.D.; Woodward, J.C. Quaternary glaciation in the Mediterranean mountains: A new synthesis. Geol. Soc. Spec. Publ. 2017, 433, 1–23. [Google Scholar] [CrossRef]
- Hughes, P.D.; Woodward, J.C.; Gibbard, P.L.; Macklin, M.G.; Gilmour, M.A.; Smith, G.R. The glacial history of the Pindus Mountains, Greece. J. Geol. 2006, 114, 413–434. [Google Scholar] [CrossRef]
- Hughes, P.D.; Woodward, J.C.; van Calsteren, P.C.; Thomas, L.E. The glacial history of the Dinaric Alps, Montenegro. Quat. Sci. Rev. 2011, 30, 3393–3412. [Google Scholar] [CrossRef]
- Duk-Rodkin, A.; Barendregt, R.W.; Froese, D.G.; Weber, F.; Enkin, R.; Rod Smith, I.; Zazula, G.D.; Waters, P.; Klassen, R. Timing and extent of Plio-Pleistocene glaciations in north-western Canada and east-central Alaska. In Quaternary Glaciations-Extent and Chronology, Part II.; Ehlers, J., Gibbard, P.L., Eds.; Elsevier B.V.: Amsterdam, The Netherlands, 2004; Volume 2, pp. 313–345. ISBN 9780444515926. [Google Scholar]
- Rovey, C.W.; Siemens, M. Age constraints of the Middle Pleistocene till and loess sequence in northeast Missouri, USA, based on pedostratigraphy within a polygenetic paleosol. Catena 2021, 203, 105294. [Google Scholar] [CrossRef]
- Zhou, S.; Li, J.; Zhao, J.; Wang, J.; Zheng, J. Quaternary Glaciations: Extent and Chronology in China. In Developments in Quaternary Science; Elsevier Inc.: Amsterdam, The Netherlands, 2011; Volume 15, pp. 981–1002. ISBN 9780444534477. [Google Scholar]
- Zhou, S.; Wang, X.; Wang, J.; Xu, L. A preliminary study on timing of the oldest Pleistocene glaciation in Qinghai-Tibetan Plateau. Quat. Int. 2006, 154–155, 44–51. [Google Scholar] [CrossRef]
- Xu, L.; Zhou, S. Quaternary glaciations recorded by glacial and fluvial landforms in the Shaluli Mountains, Southeastern Tibetan Plateau. Geomorphology 2009, 103, 268–275. [Google Scholar] [CrossRef]


| Sample Name | Lithology | Weight (g) | a-Axis (cm) | Amount of Quartz after Leaching (g) | Al Concentration after Leaching (ppm) |
|---|---|---|---|---|---|
| MÖHL-1 | Quartzite | 1150 | 12.7 | 34 | 76 |
| MÖHL-4 | Quartzite | 660 | 12.3 | 44 | 161 |
| MÖHL-5 | Quartzite | 800 | 9.3 | 54 | 145 |
| MÖHL-7 | Quartzite | 520 | 8.2 | 36 | 94 |
| MÖHL-10 | Sandstone | 1630 | 15.3 | 46 | 138 |
| 1 MÖHL-12 | Quartz pebbles | 1610 | - | 67 | 49 |
| Sample Name | Quartz Dissolved (g) | 9Be Spike (mg) | 10Be/9Be (×10−14) | Relative Uncertainty (%) | Blank Correction (%) | 10Be Concentration (×103 Atoms/g) | Total Al (ppm) | Total Al (mg) | 26Al/27Al (×10−14) | Relative Uncertainty (%) | 26Al Concentration (×103 Atoms/g) | 26Al/10Be |
|---|---|---|---|---|---|---|---|---|---|---|---|---|
| MÖHL-1 | 34.0800 | 0.1990 | 1.24 | 10.2 | 22.2 | 3.8 ± 0.5 | 158 | 5.38 | 1.42 | 10.6 | 50.1 ± 5.3 | 13.3 ± 2.3 |
| MÖHL-4 | 43.5431 | 0.1980 | 8.60 | 4.8 | 3.2 | 25.3 ± 1.3 | 185 | 8.04 | 4.17 | 7.8 | 172.0 ± 13.4 | 6.8 ± 0.4 |
| MÖHL-5 | 49.9954 | 0.1991 | 1.75 | 7.4 | 15.8 | 3.9 ± 0.4 | 159 | 7.93 | 1.25 | 7.2 | 44.3 ± 3.2 | 11.3 ± 1.3 |
| MÖHL-7 | 35.5300 | 0.1990 | 3.55 | 6.3 | 7.8 | 12.2 ± 0.8 | 106 | 3.78 | 3.85 | 5.5 | 91.5 ± 5.0 | 7.5 ± 0.7 |
| MÖHL-10 | 45.6933 | 0.1993 | 5.71 | 4.6 | 4.8 | 15.8 ± 0.8 | 157 | 7.16 | 4.12 | 10.4 | 144.0 ± 15.0 | 9.1 ± 0.6 |
| 1 MÖHL-12 | 50.0300 | 0.2000 | 7.14 | 4.2 | 3.9 | 18.3 ± 0.8 | 63 | 3.16 | 9.56 | 3.9 | 134.5 ± 5.3 | 7.3 ± 0.4 |
Publisher’s Note: MDPI stays neutral with regard to jurisdictional claims in published maps and institutional affiliations. |
© 2022 by the authors. Licensee MDPI, Basel, Switzerland. This article is an open access article distributed under the terms and conditions of the Creative Commons Attribution (CC BY) license (https://creativecommons.org/licenses/by/4.0/).
Share and Cite
Dieleman, C.; Christl, M.; Vockenhuber, C.; Gautschi, P.; Graf, H.R.; Akçar, N. Age of the Most Extensive Glaciation in the Alps. Geosciences 2022, 12, 39. https://doi.org/10.3390/geosciences12010039
Dieleman C, Christl M, Vockenhuber C, Gautschi P, Graf HR, Akçar N. Age of the Most Extensive Glaciation in the Alps. Geosciences. 2022; 12(1):39. https://doi.org/10.3390/geosciences12010039
Chicago/Turabian StyleDieleman, Catharina, Marcus Christl, Christof Vockenhuber, Philip Gautschi, Hans Rudolf Graf, and Naki Akçar. 2022. "Age of the Most Extensive Glaciation in the Alps" Geosciences 12, no. 1: 39. https://doi.org/10.3390/geosciences12010039
APA StyleDieleman, C., Christl, M., Vockenhuber, C., Gautschi, P., Graf, H. R., & Akçar, N. (2022). Age of the Most Extensive Glaciation in the Alps. Geosciences, 12(1), 39. https://doi.org/10.3390/geosciences12010039