Article

3D Numerical Prediction of Thermal Weakening of Granite under Tension

Civil Engineering, Faculty of Built Environment, Tampere University, P.O. Box 600, FI-33014 Tampere, Finland
Geosciences 2022, 12(1), 10; https://doi.org/10.3390/geosciences12010010
Submission received: 30 November 2021 / Revised: 20 December 2021 / Accepted: 22 December 2021 / Published: 25 December 2021
(This article belongs to the Collection New Advances in Geotechnical Engineering)

Abstract

:
This paper deals with numerical prediction of temperature (weakening) effects on the tensile strength of granitic rock. A 3D numerical approach based on the embedded discontinuity finite elements is developed for this purpose. The governing thermo-mechanical initial/boundary value problem is solved with an explicit (in time) staggered method while using extreme mass scaling to increase the critical time step. Rock fracture is represented by the embedded discontinuity concept implemented here with the linear (4-node) tetrahedral elements. The rock is modelled as a linear elastic (up to fracture by the Rankine criterion) heterogeneous material consisting of Quartz, Feldspar and Biotite minerals. Due to its strong and anomalous temperature dependence upon approaching the α-β transition at the Curie point (~573 °C), only Quartz in the numerical rock depends on temperature in the present approach. In the numerical testing, the sample is first volumetrically heated to a target temperature. Then, the uniaxial tension test is performed on the cooled down sample. The simulations demonstrate the validity of the proposed approach as the experimental deterioration, by thermally induced cracking, of the rock tensile strength is predicted with a good accuracy.

1. Introduction

High temperature conditions often prevail in geotechnical and mining applications [1,2,3]. For this reason, rocks, especially those containing Quartz mineral, are prone to be affected by elevated temperatures. For Quartz bearing rocks, this is due to its α-β transition at about 573 °C [4]. The temperature effects on rock have naturally drawn considerable attention in the literature, both experimentally [1,5,6,7,8,9,10,11,12,13,14] and numerically [11,12,13,14,15,16,17].
Under elevated temperatures, the mechanical properties (e.g., the Young’s modulus and strength) of rock decrease, while some of the thermal properties increase (the thermal expansion coefficient and the specific heat) and others decrease (the thermal conductance) [7,11]. The degradation of rock strength has an extreme importance from the rock mechanical applications point of view. The major mechanism of the thermal weakening of rock strength is the thermally induced cracking, which in turn originates from the rock mineral heterogeneity [13]. It is the mismatch of the elastic properties at the grain boundaries of different minerals that leads to thermal stresses and generates cracking inside and between the grains even under uniform temperature fields (i.e., no temperature gradients present). For rocks with Quartz as a one the constituent minerals, e.g., granite, which is studied in the present paper, this heterogeneity becomes increasingly pronounced due to the exceptional behavior of Quartz. Namely, the thermal expansion of Quartz is highly nonlinear up to the α-β transition temperature. In contrast, the rest of the granite forming minerals (Fledspars and Micas) exhibit linear temperature dependence in their thermal expansion [7].
Predictive modelling of rock fracture due to elevated temperatures is an important task in geosciences. It provides knowledge on the failure mechanisms impossible or too expensive to reach by experimentation or in-situ testing. However, predicting temperature effects in rock by computational models is challenging due to cracking phenomenon, which requires numerical description of displacement discontinuities. In computational mechanics, the two main methods to simulate cracking are the finite element method (FEM) and the discrete element method (DEM). The reader can refer to [18,19] for reviews on numerical rock mechanics. As a summary of these methods, it can be stated that the DEM is naturally suited for fracture and fragmentation modelling (see [20] for an example). However, a critical drawback is the computational labor required by tracking and updating the contact configurations and neighbors of the particles that, in contrast to FEM, need not to retain their neighbors during the analysis. Within the continuum approach, such as the classical FEM, fractures (cracks) can be modelled only in an averaged manner, i.e., as localized deformation, by damage and/or plasticity models. However, FEM based models are computationally efficient and relatively simple in their calibration of the material parameters. Considerable efforts have, therefore, been devoted to enhancing the fracture description capabilities of the classical FEM. The two most notable results of this work are the embedded discontinuity FEM [21] and the extended FEM [22]. The former is chosen in the present study due to its considerably simpler implementation [23].
The weakening effect due to thermal cracking on the tensile strength of granite is numerically investigated in this paper. To this end, a staggered solution method is adopted for solving the governing thermo-mechanical problem. The granite is modelled as a linear elastic and heterogenous material up to a fracture, which is described by the embedded discontinuity finite elements. A full 3D extension of a previous model by Saksala [24] is presented. The granite elasticity properties, in contrast to [24], and tensile strength are taken as heterogeneous, i.e., individual for each rock forming mineral. Moreover, only the thermal expansion coefficient of Quartz depends on temperature in the present model, which is due to the much stronger thermal expansion behavior of Quartz (as noted above) than the other granite-forming minerals. This simplified approach is numerically validated by genuine 3D simulations.

2. Numerical Methods

2.1. Failure Model for Rock

Let a 3D domain be discretized with linear tetrahedral elements with some of them intersected by displacement discontinuities (cracks). Figure 1a shows a tetrahedron sliced by two intersecting discontinuity planes. Two such crack planes are required when modelling the thermal cracking induced weakening of the tensile strength. The reason for this is that the thermally induced cracks may have unfavorable orientations (perpendicular) with respect to the loading direction in the consequent uniaxial tension test. Thereby, as cracks cannot rotate, an element with a crack normal perpendicular to the loading axis would generate spurious stresses. This is prevented by the introduction of a new crack.
As granite is a brittle material at room temperature, the small deformation assumption is justified. Under these circumstances, the displacement and strain fields for a 4-node tetrahedron with two displacement discontinuities read
u ( x ) = k = 1 4 N k ( x ) u k e +   i = 1 2 M Γ d i ( x ) α d i   with   M Γ d i ( x ) = H Γ d i ( x ) φ Γ d i ( x ) , ( i = 1 , 2 )
ε ( x ) = k = 1 4 ( N k u k e ) s y m   i = 1 2 ( ( φ Γ d i ( x ) α d i ) s y m + δ Γ d i ( n i α d i ) s y m ) ,
where α d i is the crack opening (displacement jump) vector for crack i, and N k and u k e , being functions of placement vector x, are, respectively, the regular shape functions for the linear (4-node) tetrahedral element and nodal displacements. The crack normal is denoted by n i (for crack i). In addition, H Γ d i and δ Γ d i denote the Heaviside function and its gradient (∇), the Dirac delta function, respectively. Consistent with the constant strain of the linear tetrahedron element, the crack opening vector is also assumed elementwise constant. Thereby, α d i 0 , and (2) readily follows from taking the gradient of (1). Moreover, the terms δ Γ d i ( n i α d i ) s y m (where (⊗)sym denotes the symmetric part of the tensor product), containing the Dirac delta function, are zero only outside the discontinuity plane and can thus be ignored when solving the discretized equations of motion at the global level.
Function M Γ d i in (1) restricts the effect of α d i inside the corresponding finite element. This simplifies substantially the implementation of the kinematics, as it removes the need to treat the essential boundary conditions related to crack opening at the model boundaries (see Figure 1b for the 1D case). Function φ Γ d i in M Γ d i is selected from the shape function combinations of the element so that
φ Γ d i = arg ( max k = 1 , 2 , 3 |   n = 1 k N n · n i |   i = 1 k N n ) , ( i = 1 , 2 )
This criterion thus selects φ Γ d i so that φ Γ d i is as parallel to n i as possible. Figure 1b illustrates the displacement decomposition (1) and the relevant functions in 1D case with a single linear truss element pulled at the right end. For this case, the regular nodal displacement is u r e g = N 1 u 1 + N 2 u 2 , and function φ is the interpolation (shape) function N2. The effect of function M Γ d , i.e., the restriction of the displacement jump, α d , inside the element, is readily observed.
The FEM formulation of the above kinematics is performed within the framework of the enhanced assumed strain concept (EAS), see the details in [23,25,26]. The final equations for the spatially discretized thermo-mechanical problem are
Ω e ρ N i N j u ¨ j d Ω + Ω e σ N i d Ω = 0 , i , j = 1 N n o d e s
Ω e c ρ N i N j θ ˙ j d Ω + Ω e k N i N j θ j d Ω Ω e Q int N j d Ω = 0 , i , j = 1 N n o d e s
ϕ d i ( t Γ d i ) = 0 , t Γ d i = σ · n i , i = 1 , 2   ( if   element   has   crack ( s ) )  
σ = E : ( ε ^   i = 1 2 ( φ Γ d i α d i ) s y m ε θ ) ,
where ε ^ = k = 1 4 ( N k u k e ) s y m , and ε θ = α Δ θ I is the thermal strain with α being the thermal expansion coefficient, Δ θ is the temperature change, and I is the unit tensor. Moreover, u ¨ j is the acceleration vector, N n o d e s is the number of nodes, and N i is the shape function of node i. Furthermore, σ is the stress tensor, θ ˙ j is the time derivative of the temperature vector, θ j , at node j, ρ and c are the density and the specific heat capacity, respectively. Finally, k is the conductivity, and Q int is the internal heat production.
Equation (4) is the discretized balance of linear momentum, and Equation (5) is the discretized heat balance. Equation (6)1 is the failure criterion, where ϕ d i is the loading function and t Γ d i is the traction vector. Furthermore, Equation (6)2 is the strong form of traction balance over the crack i surface. Finally, Equation (7) is the constitutive relation for rock with E being the stiffness tensor. The only boundary condition in Equations (4)–(7) is the external volumetric heat influx Q int , which accounts for the heating in an oven. All other types of heat generation are ignored as insignificant compared to the external heat influx [15].
In tension, the rock material behaves in linear elastic manner until the tensile strength is reached. Upon violation of the Rankine criterion (the first principal stress criterion), a crack (displacement discontinuity) is introduced with a normal complying to the first principal direction. A glance at Equations (4), (6) and (7) reveals their formal similarity to the corresponding equations in plasticity theory. Consequently, the stress integration of the evolution equations can be performed with the usual stress return mapping algorithms [15,23,25]. The following traction-separation model is employed to control the crack softening (opening).
ϕ d i ( t Γ d i , κ d i , κ ˙ d i ) = n i · t Γ d i + ( ( m 1 i · t Γ d i ) 2 + ( m 2 i · t Γ d i ) 2 ) 1 / 2 ( σ t i + q d i ( κ d i , κ ˙ d i ) ) ,
q d i = h d i κ d i + s d κ ˙ d i , h d i = g d σ t e x p ( g d κ d i ) , g d = σ t G I c ,
t ˙ Γ d i = E : ( φ Γ d i α ˙ d i ) · n i ,
α ˙ d i = λ ˙ d i ϕ d i t Γ d i , κ ˙ d i = λ ˙ d i ϕ d i q d i ,
λ ˙ d i 0 , ϕ d i 0 , λ ˙ d i ϕ d i = 0 ,   ( i = 1 , 2 )
The symbols herein are as follows: κ d i , κ ˙ d i are the internal variable and the rate of it related to the softening law q d i for the discontinuity i; σ t i is the tensile strength; sd is the viscosity modulus; h d i is the softening modulus of the exponential softening law; parameter g d controls the initial slope of the softening curve. Its calibration is via the mode I fracture energy GIc. Moreover, λ ˙ d i is the crack opening increment. The loading function ϕ d i in (8) is a sum of the normal and shear terms with β being the shear retention factor. Finally, Equation (12), i.e., the Kuhn-Tucker conditions, impose the consistency akin to plasticity theory.
It should be emphasized that a crack is introduced in an element where the stress state violates the Rankine criterion, while the opening (softening) of that crack is controlled by the model in Equations (8)–(12). Moreover, even if the crack initiation is by the Rankine criterion, a crack once introduced, may open in shear mode as well. Now, another criterion for the second crack in an element already having an unfavorably oriented crack is required to carry out the tension test after the thermal treatment. The same criterion, as used in the 2D study [24], originally in [27], is used here as well. A new crack is thus generated in an element having a thermal crack upon fulfilling the condition:
If   σ 1 > σ t *   &   | n 1 · n * | < C α       with
σ t * = ( 1 | n 1 · n * | ) σ t i c + | n 1 · n * | σ t 0
where n 1 is the normal of the first crack, σ 1 and n * are the present 1st principal stress and the corresponding principal direction. The tensile strength, σ t * , for the second crack is a convex combination of the strength of the initial crack, σ t i c , and the intact tensile strength σ t 0 . The second, new, crack is introduced (only once) when the angle between the old, first, crack normal and the new principal direction is greater than α = a c o s ( C α ) . C α here is a parameter for which a value 1 / 2 (corresponding to α = 45 ° ) is used in this study.

2.2. Staggered Explicit Scheme for Solving Global Thermo-Mechanical Problem

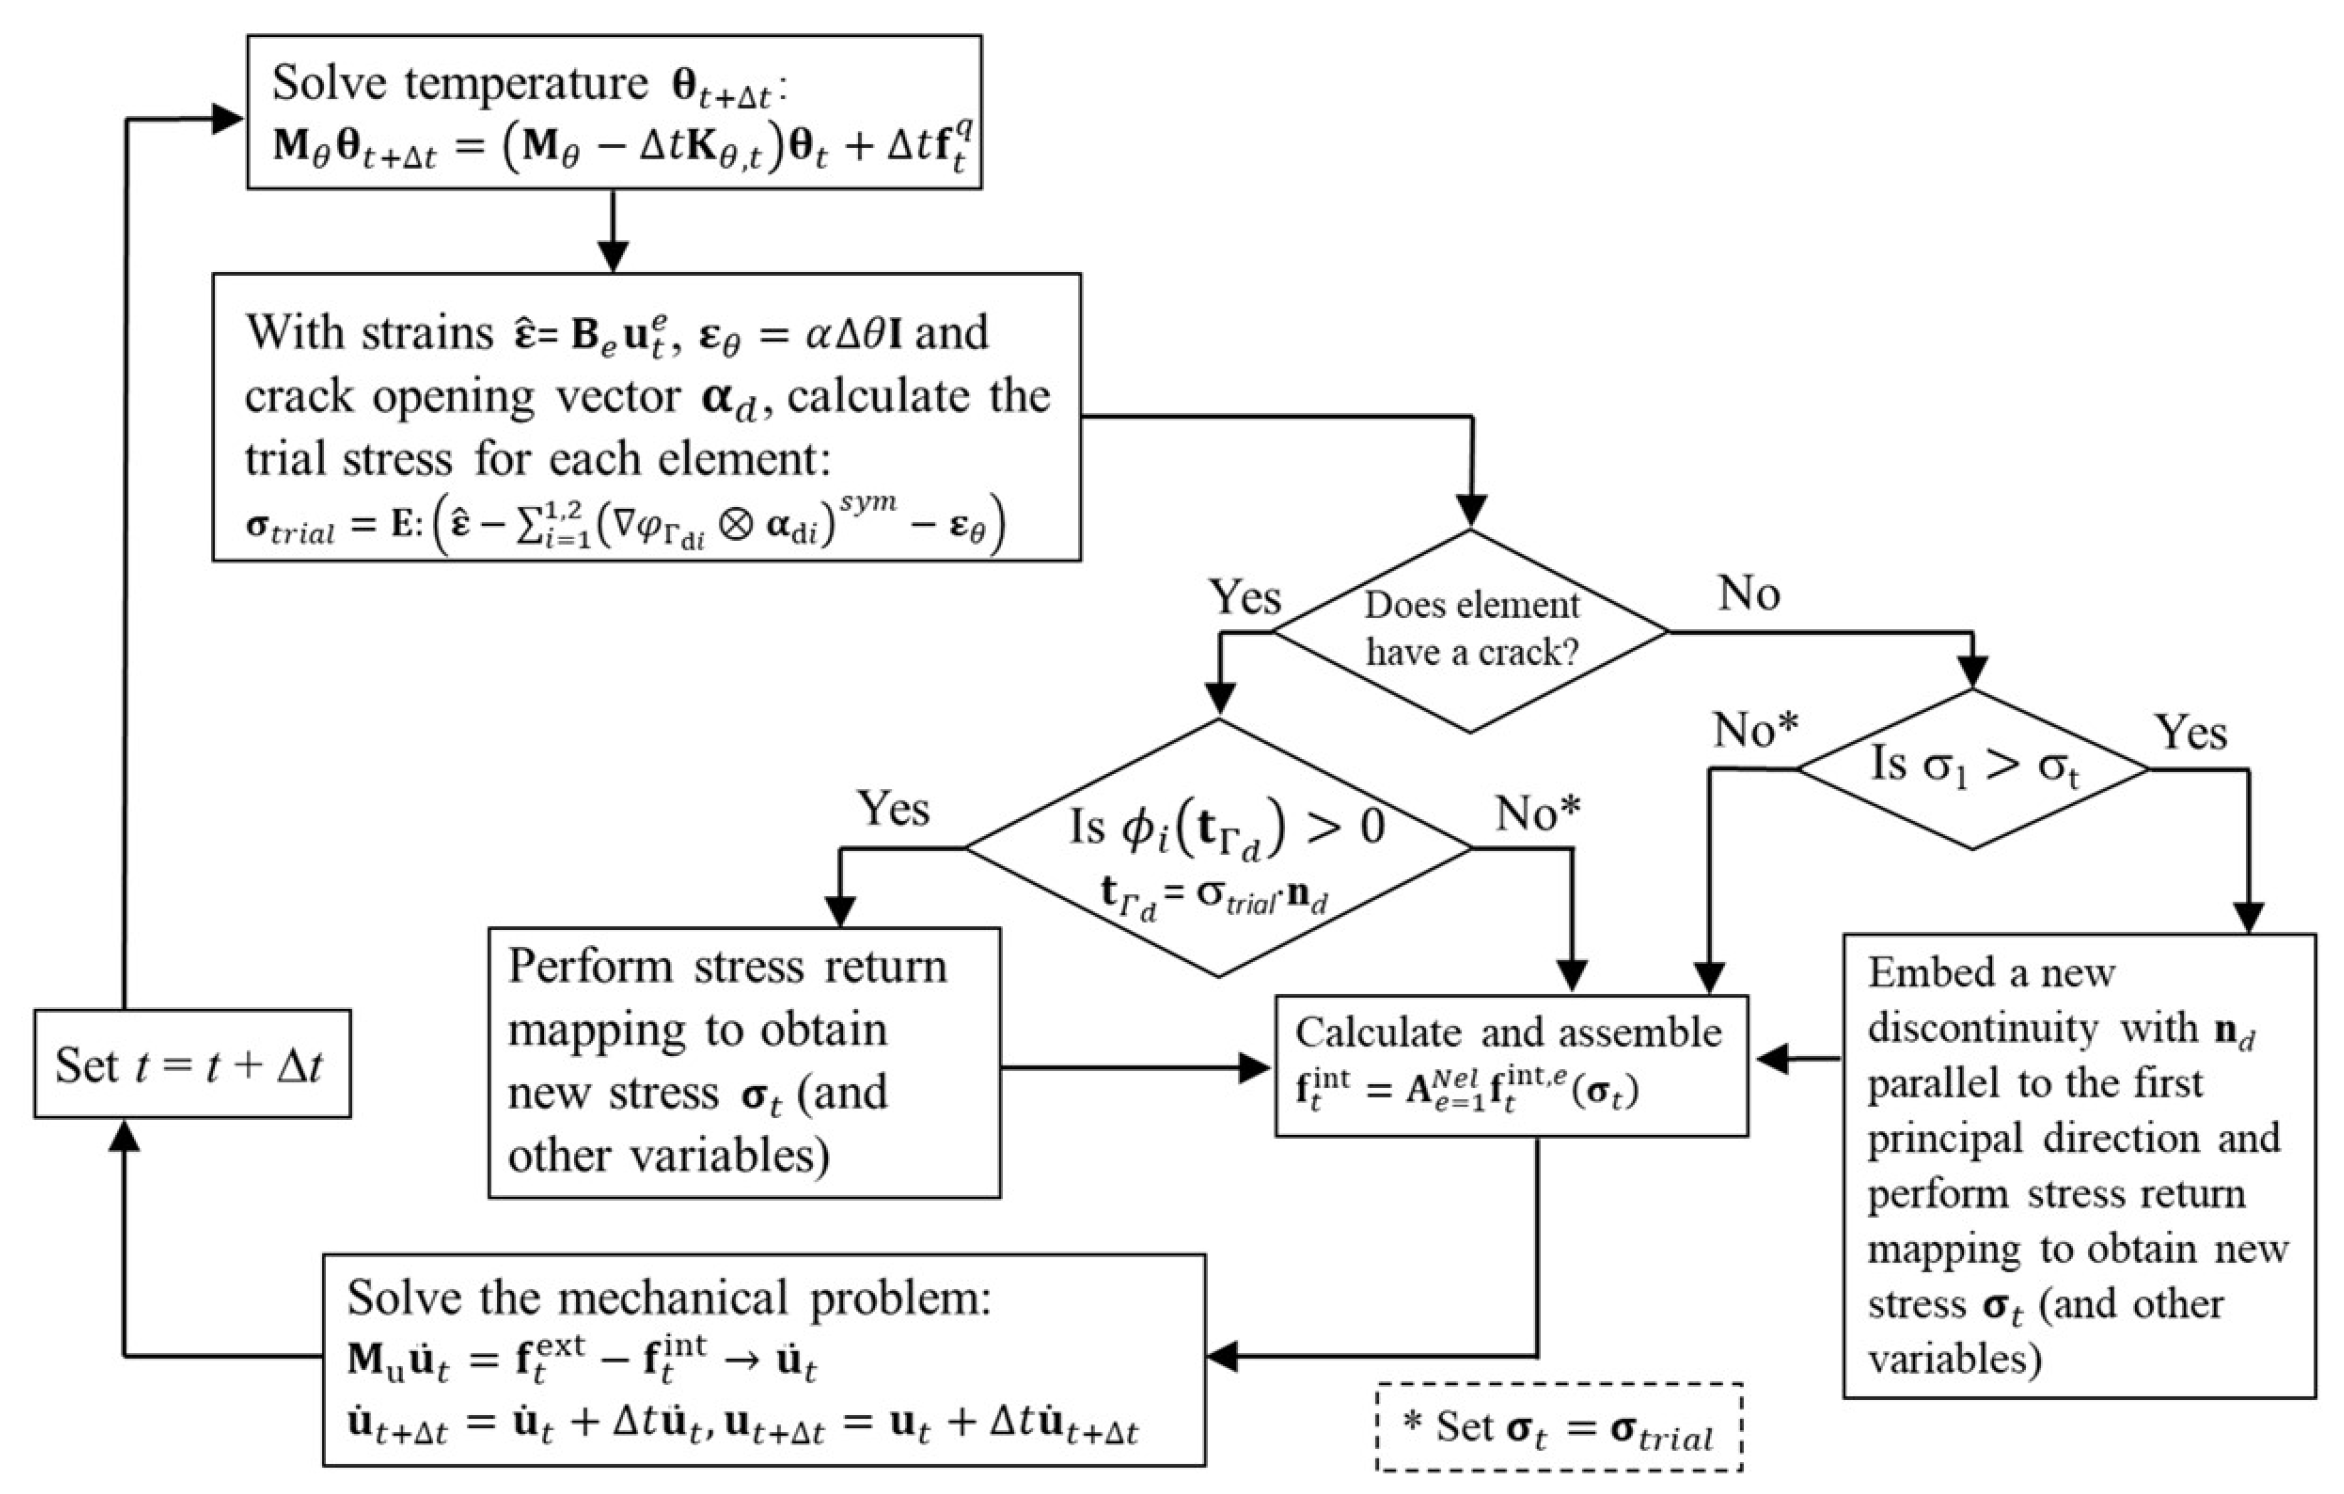
The discretized problem (Equations (4) and (5)) is solved explicitly in time with a staggered scheme [24]. Staggered solution means that, first, the new temperature vector is solved while keeping the displacement vector fixed, and second, the displacement vector is solved with fixed temperature vector. Equations (8)–(10) are solved with the standard stress return mapping. Figure 2 illustrates the flow of the solution process with the explicit Euler time integrator.
In Figure 2, the relations for solving the temperature and the displacement are the matrix forms of Equations (4) and (5). In addition, the asterisk * means that the trial traction is in the elastic region, or the trial stress is below the tensile strength. Mass scaling is used to increase the conditional time step of the explicit time stepping. This is needed since the time scale of the mechanical problem is many orders of magnitude smaller than that of the thermal problem. Finally, it is noted that the explicit time marching scheme in Figure 2 is employed in the simulations of uniaxial tension test on the intact and heated numerical rock.

3. Numerical Examples

3.1. Numerical Rock Description

Table 1 lists the mechanical and thermal property values for numerical granite taken from [11,28,29].
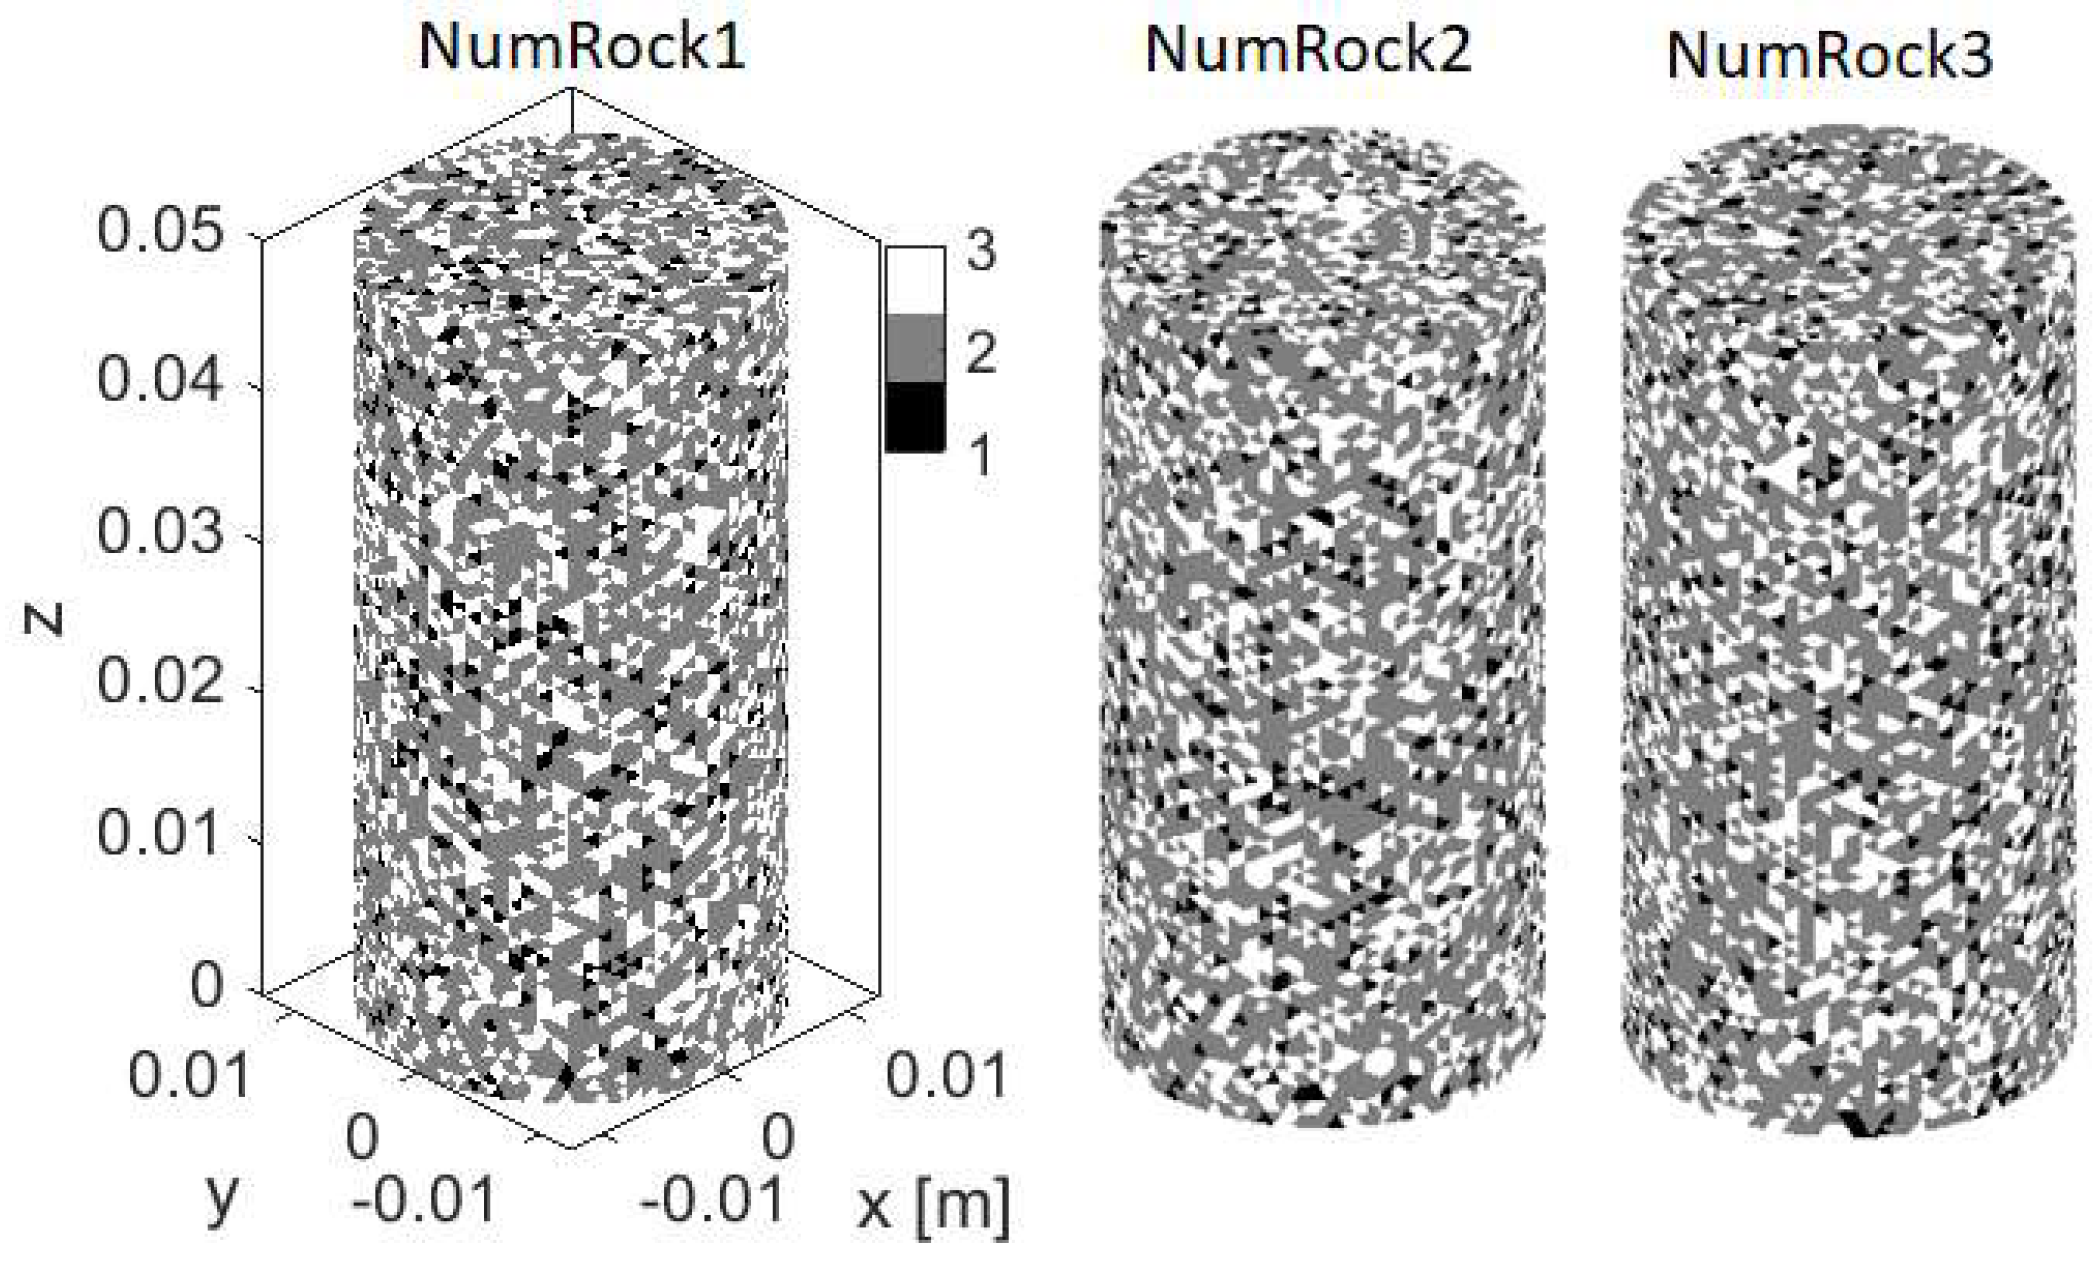
The rock heterogeneity is described by spatially random clusters of finite elements assigned to represent the constituent minerals in Table 1. The randomness in this heterogeneity description is generated as follows: An array with a length of the number of elements in the mesh containing integers 1, 2 and 3 (each coding a mineral in the mesh) is first created. The fraction (percentage) of each integer in this array corresponds to the fraction of the mineral in the rock. Next, this array is randomly permutated. A spatially random mineral mesotexture is obtained, as each entry in the array is also implicitly an element number in the mesh (1st entry is the element number 1 in the mesh etc.). Three realizations (i.e., developed with three different random permutations of the integer array just described) of numerical rock mesotextures (consisting of 206,617 elements) are shown in Figure 3. For example, the fraction of elements representing Quartz mineral in each numerical rock sample, having thus the material properties specific to Quartz in Table 1, is 0.33⋅206,617 ≈ 68,183. Finally, the shear retention factor in Equation (8) is β = 1, and the viscosity (Equation (9)) is set to sd = 0.001 MPa⋅s/m.
With respect to temperature dependence of the rock properties, a simplified approach is adopted. Accordingly, only the thermal expansion is taken as temperature dependent. The experimental setting is as follows: First, the specimen is heated slowly to the desired temperature. Then, it is left to cool down to room temperature. The uniaxial tension test is finally carried out at the room temperature. This thermal pre-treatment generates cracks into the sample causing reduction of its tensile strength.
Heterogeneous brittle rocks have inherent microflaws. Therefore, their tensile strength is an emerging property measured for the laboratory sample, not for a material point. However, in the numerical modelling, the constitutive law is described at the material point level. Thereby, it would be circular reasoning to input the experimental tensile strength at certain temperature into the material point level failure model, and then predict that same strength—the correct outcome would ensue as a matter of course.
For this reason, only the thermal expansion coefficient of Quartz is taken to depend on temperature by
α q ( θ ) = α q 0 ( 1 + 1.5 823 293 ( θ 293 ) ) ,   [ 1 / K ]
where α q 0 (= 8 × 10 6 K−1) is the thermal expansion coefficient at room temperature. Equation (15) assumes a linear thermal expansion dependence for Quartz in between 20 and 550 °C (where ( α q 550 = 2 × 10 5 K−1)), which is not realistic, as it was already noted that Quartz thermal expansion is highly nonlinear on approaching the Curie point [7]. This assumption is a feature of the present approach, which, however, will prove to predict the thermal weakening effect with a good accuracy.

3.2. Numerical Rock Heat Treatment

Uniform heating up to 300 °C and 500 °C is carried out here on the numerical rock samples. The reason for choosing these temperatures is that they often appear in the experiments [11]. Moreover, significant reduction in the tensile strength of granite only appears beyond 200 °C. Finally, after the Curie point of granite, i.e., 573 °C, the α-Quartz changes to β-Quartz involving a phase change the proper modelling of which is not trivial.
Mass scaling is used here to increase the critical time step of the explicit time stepping in Figure 2. This is enabled by the non-inertial nature of the uniform heating of rock samples. More precisely, the critical time step of the explicit time marching can be increased to 100-fold by applying a 10,000-fold density. Moreover, to secure a homogenous temperature field in the rock sample, volumetric heating is applied here with setting Q int = 1 × 10 10 W/m3 at each node of mesh. With this setting, the desired temperature 500 °C is reached at every node of the mesh in ~20,000 time-steps, which translates to a heating time of 0.1 s. The critical time step for the numerical rock sample 1 (NumRock1) is ~ 5 × 10 8 s (with the real density). Simulation results for this sample with heating up to 500 °C is shown in Figure 4.
The uniform volumetric heating applied induces considerable cracking in the rock sample, as attested in Figure 4e, where only every 100th crack normal of the total amount of the 160,634 cracks is plotted. The crack normal orientation is quite randomly distributed, i.e., no trends or preferred orientations can be observed. According to Figure 4d, showing the temperature and cumulative crack number evolution, massive cracking starts when the temperature reaches 100 °C. After reaching about 120,000 cracks, the cumulative crack number evolution proceeds with a much milder rate.
Figure 4b,c show the resulting crack opening magnitude and the stress-like softening variable qd in Equation (9). Values reaching −10 MPa indicate substantial loss of the traction bearing capacity of the cracks and, consequently, local weakening effect.
There is no reason to show results for the target temperature 300 °C because they are, for this same sample, somewhat similar since the simulation was stopped earlier, at ~0.06 s upon temperature reaching 300 °C. Moreover, the simulation results for the other numerical rock samples are not shown here either due to their similarity to those shown in Figure 4.

3.3. Numerical Tension Tests on Intact and Heat Treated Rock

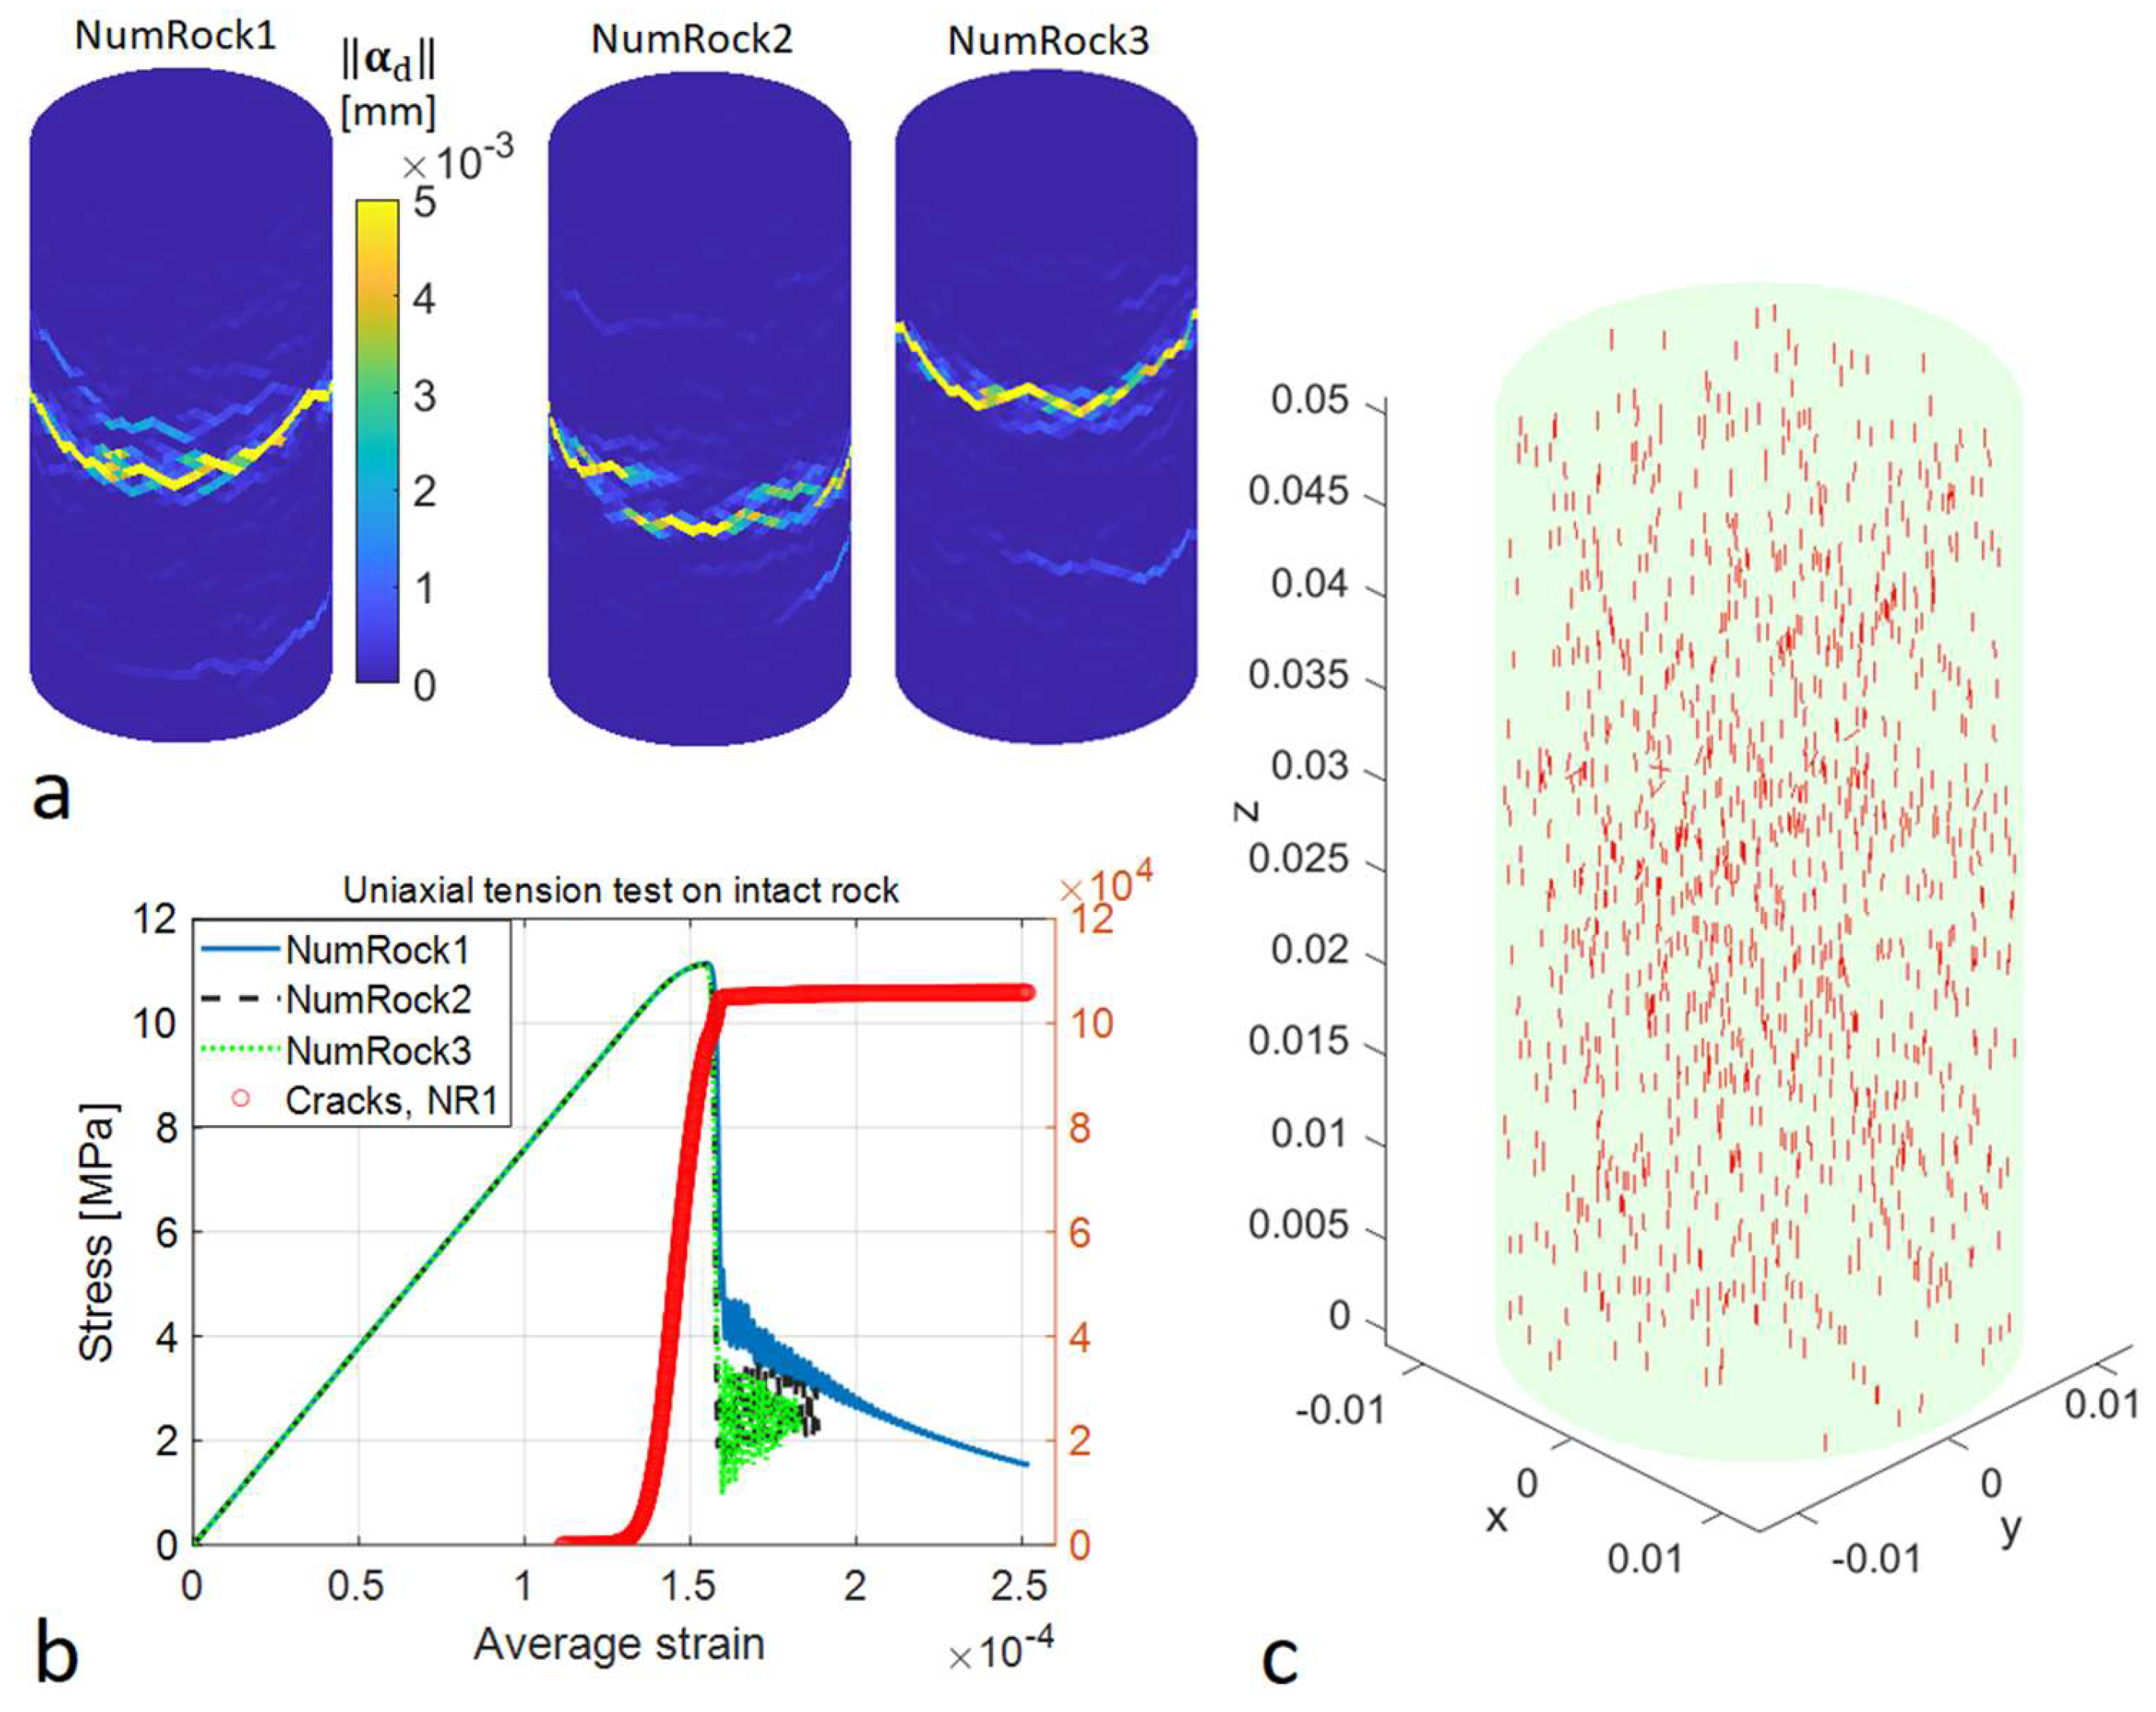
Next, uniaxial tension tests are performed on the numerical rock samples. A constant velocity boundary condition is applied at the top surface of the numerical rock. Setting the velocity to 5 mm/s turns into a strain rate of 0.1 s−1, which is low enough not to cause significant hardening effects [30]. The results are shown in Figure 5.
All the numerical samples have failed in the experimental transverse splitting mode, as attested in Figure 5a showing the magnitude of crack opening. It should be noted that there is a huge number of cracks all over the sample volume (Figure 5c), with a normal parallel (or closely so) to the loading axis, but only some of them open to create the final failure plane. Figure 5b shows the cumulative number of cracks, exceeding 100,000, as a function of the axial average strain for NumRock1. It also shows the stress-strain curves, which are strikingly similar; the tensile strength of each sample is 11.1 MPa. The reason for the insignificant deviation is likely the small element size.
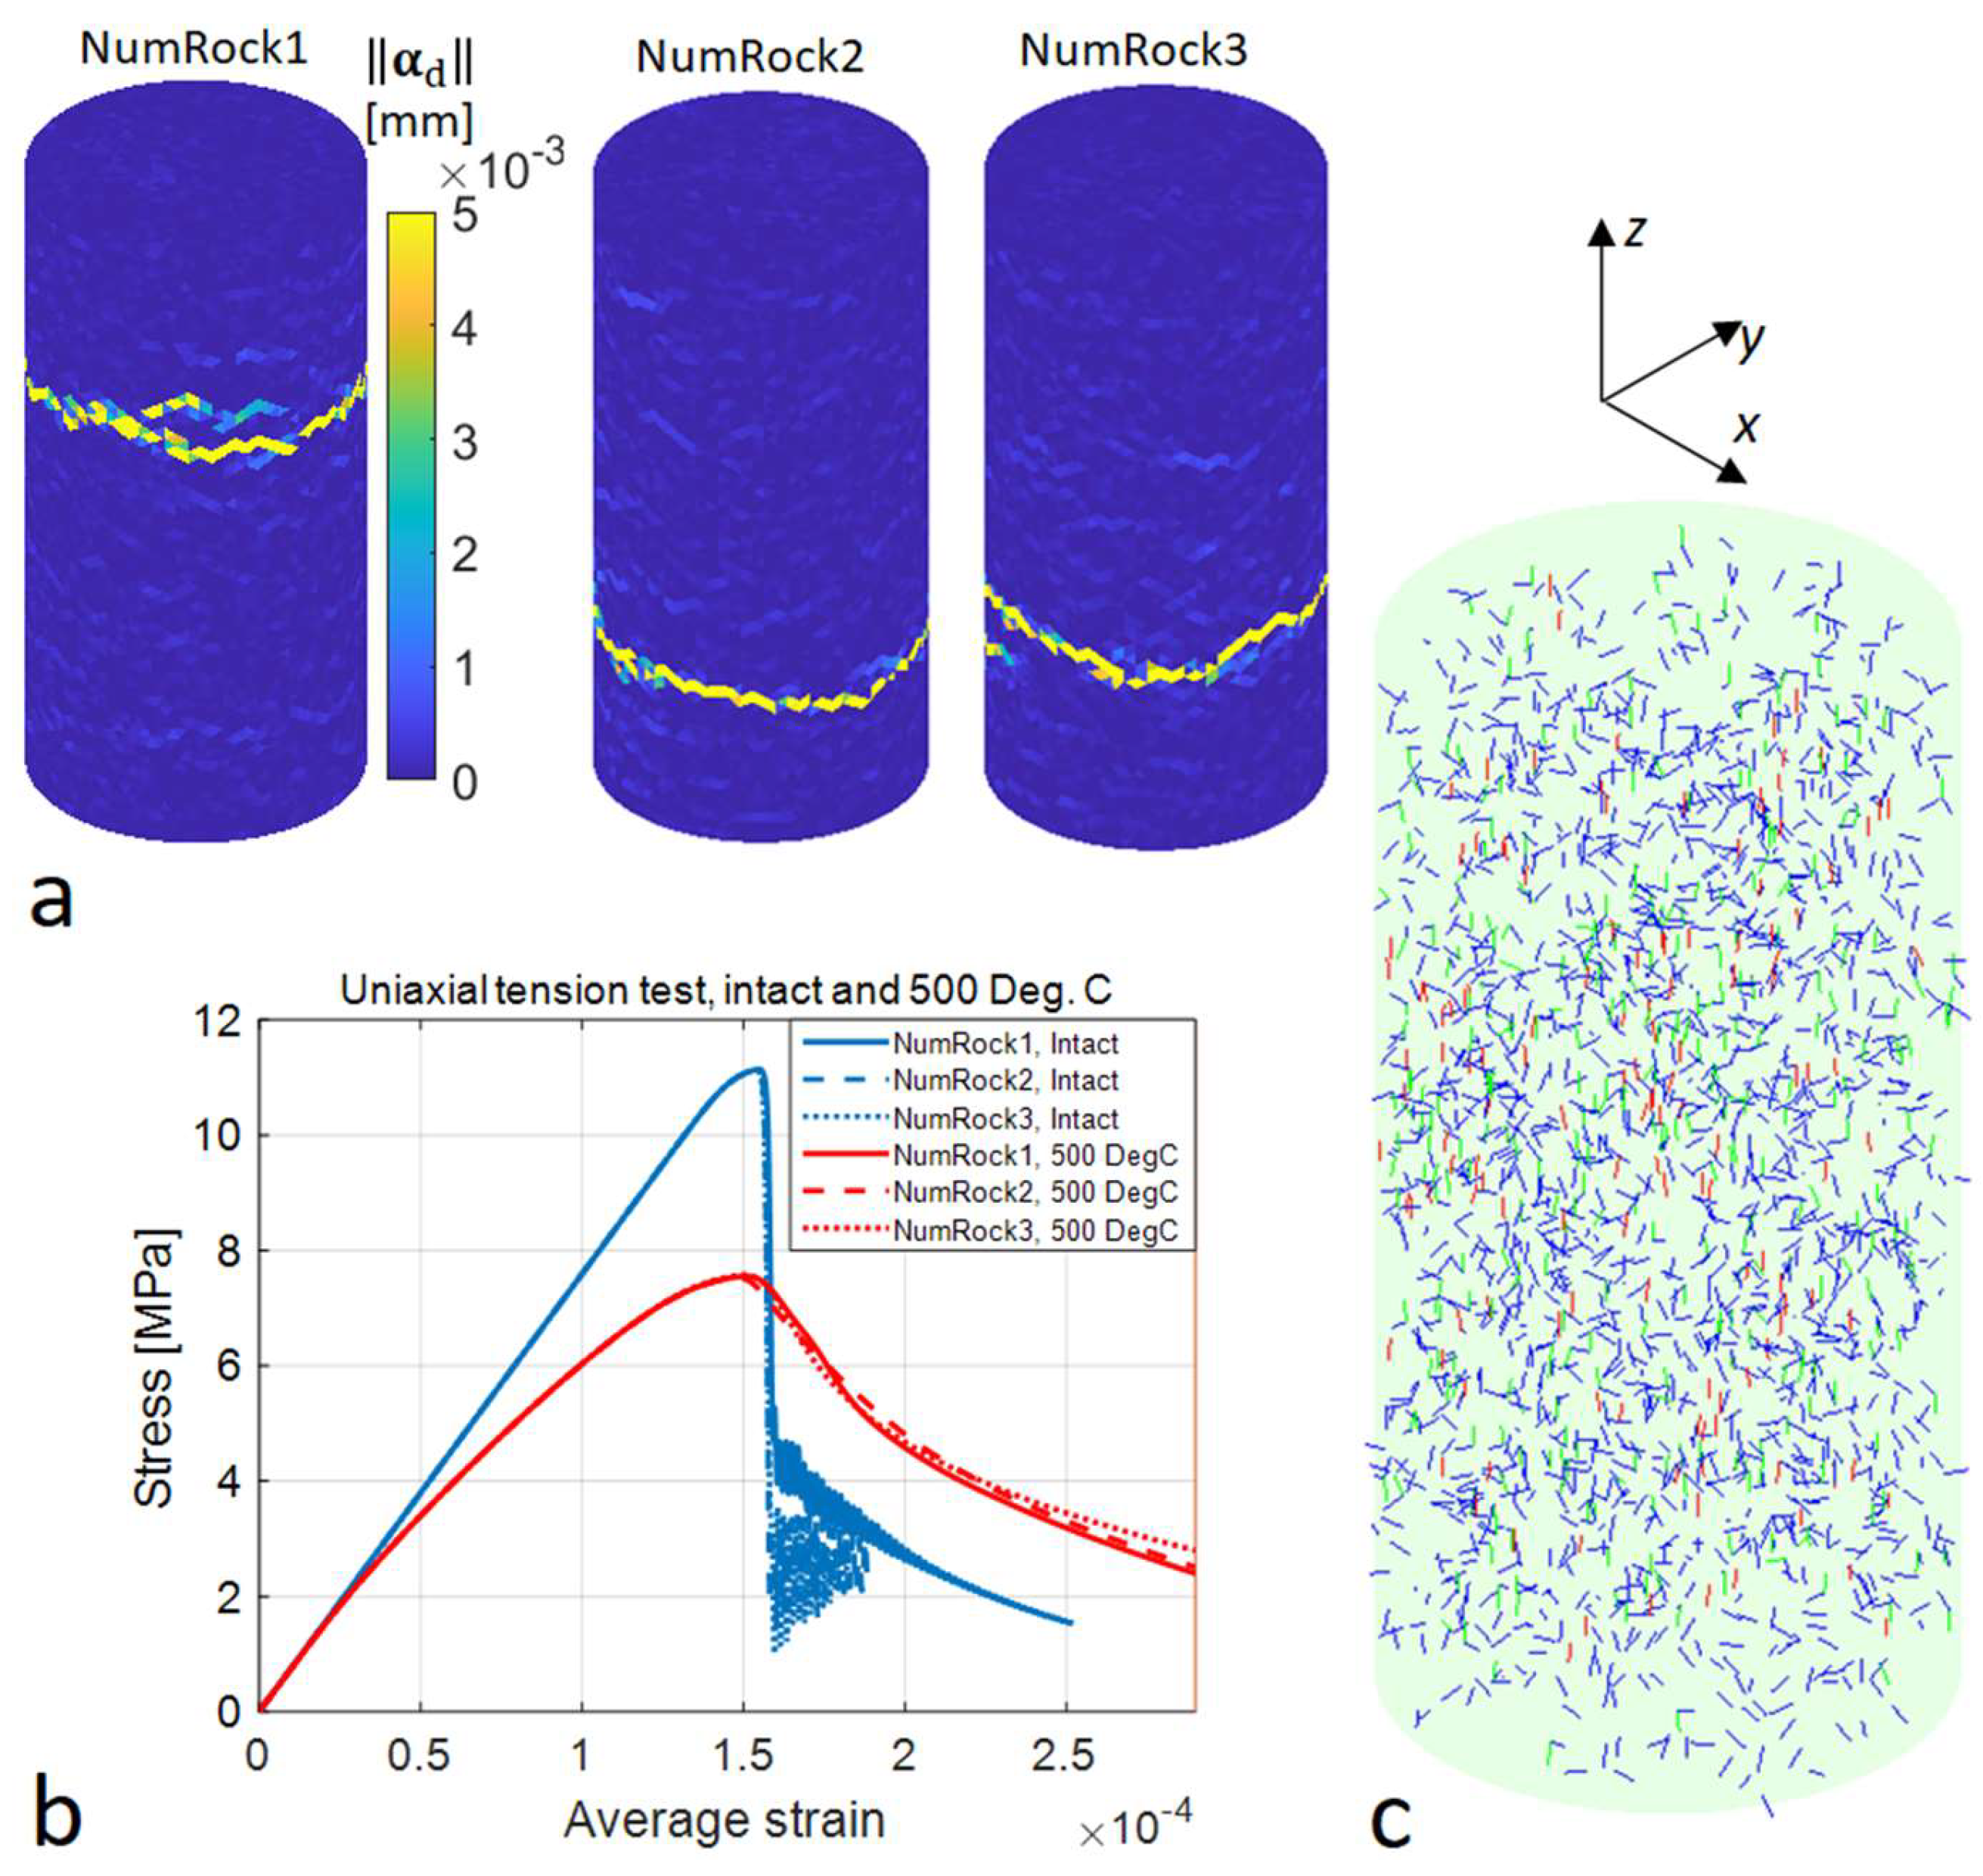
Next, the heat-treated numerical samples are submitted to the uniaxial tension test. To replicate the experiments, these simulations are performed on the naturally cooled down samples. The cooling process itself, as it should not generate more cracks (being very slow), is not simulated but imposed. This means that no thermal stresses thus exist in the samples. In addition, the thermally induced cracks are assumed to be closed, i.e., their displacement jump vectors are set to zero ( α d = 0 ). However, their orientations (crack normal) and residual strengths must be carried over to the initial state of the tension simulations. Consequently, the residual strength for an element with a thermal crack is set to σ t 0 + q d where σ t 0 is the intact tensile strength of the mineral and q d is the stress-like softening variable, with the value it reached during numerical heating. The results are shown in Figure 6 and Figure 7 for the target temperatures of 300 °C and 500 °C, respectively.
Heated (to 300 °C) samples all fail with a clear single fracture plane, albeit at different locations from those without heating (compare Figure 6a to Figure 5a). Again, there is not much deviation between the stress-strain curves of the rock samples (Figure 6b) until the post-peak softening part. However, the nonlinear pre-peak part of the curves is, due to the presence of thermal cracks, considerably more pronounced than that in the non-heated case. The resulting tensile strength of the samples is ~9.6 MPa, which is 13.5% smaller than the intact (room temperature) strength. The crack normal plot in Figure 6c shows that a new crack (green color) is initiated in many elements with an unfavorably oriented thermal crack.
Heating up to 500 °C results in more severe weakening of the samples and more nonlinear pre-peak part of the stress-strain response, as attested in Figure 7b. The tensile strength of the samples is ~7.6 MPa, i.e., 31.5% percent drop in the strength. The failure modes still show a clear single transverse crack plane but there is more diffused crack opening (all over the samples) than in the previous cases.

4. Discussion

Some features of the present model and the results are elaborated here. The simulation results are first compared to the experiments collected in [11]. For this purpose, the predicted normalized tensile strengths are plotted at different temperatures in Figure 8.
The present approach predicts the weakening effect correctly. Indeed, the predictions are within the experimental deviation, and very close to the fitted average curve, for several granites. It should be noted that the experimental curve, f σ t / σ t 0 = 0.9912 ( 1 4.10 θ / 2483.30 ) 1 / 4.10 , in Figure 8, representing the average for several granites, is averaged over a wide range of test temperatures. Furthermore, only relevant deviation bars (300 °C and 500 °C) are shown in Figure 8.
Then some features of the numerical model are discussed. The present continuum model has some advantages over the discontinuum approach, e.g., the computational effectiveness, the easiness of calibration, and the physical meaning of the model parameters. Furthermore, the inferior fracture description of the finite element method is mended to a good extent by the embedded discontinuity technology.
A staggered explicit approach was employed in the simulations of the slow heating rock samples. This process is quasi-static in nature, which enables using drastic mass scaling for the mass matrix to increase the critical time step to 100-fold in the present case. When combined with intensive volume heating of the sample, realistic 3D simulations can be performed in practical CPU times with fully explicit time marching using a laptop computer.
Heterogeneity of rock leads to degradation of strength at high temperatures. In case of granite, heterogeneity becomes stronger due to the deviant behavior of Quartz at high temperatures. In this study, the tensile strength and elasticity heterogeneity of rock forming minerals was accounted for, while homogenized values were used for the thermal properties. However, probably due to small element size, the (spatially) random element cluster description of granite heterogeneity did not generate appreciable deviation in repeated numerical tests. As for the temperature dependence, it was applied only to the Quartz thermal expansion by a linear fit representing roughly the net effect between Quartz and the rest of the granite forming minerals (Feldspars and Micas). This simplified approach is advantageous in that it is (partly) based on mechanical and thermal properties easily determinable for a rock sample. The measurement of the corresponding properties for rock mineral phases calls for much more elaborate methods. Overall, this approach is up to its task, as the thermal cracking induced rock strength degradation was successfully predicted. It is worth of emphasizing that the present model predicts the weakening effect in a non-circular way, meaning that experimental data on the temperature dependence of the tensile strength of granite is not used as a model input.
Comparing this study to that by Saksala [24], it can readily be stated that the present 3D version better represents reality, unlike the 2D version [24]. For this reason, the present predictions are more accurate than those of the 2D approach, which, being based on the plane strain assumption, cannot correctly model the cylindrical geometry of the sample used in the present investigation.
However, the present approach does not consider some of the critical textural aspects of rock as a polycrystalline material. Most critically, the grain boundaries were not modelled properly, i.e., as geometric entities that can open as a crack. A possibility to include them within the present continuum approach is to use the cohesive elements between the groups of finite elements representing the grains. However, this strategy would require much more detailed data on the rock mineral texture and the mechanical properties thereof.

5. Conclusions

A 3D extension of a 2D numerical method to predict thermal cracking induced weakening effects in the tensile strength of granitic rock was developed and validated in this paper. The study yields following conclusions:
  • An explicit staggered scheme is an effective method to solve the nonlinear coupled problem of thermal cracking due to uniform temperature fields. The present method, based on the embedded discontinuity finite elements to model rock fracture, is computationally fast and has physically meaningful model parameters.
  • The non-inertial nature of the slow heating of a rock sample to a homogeneous temperature field enables using drastic mass scaling for the mechanical part of the coupled problem. The mass scaling increases the critical time step of the explicit time stepping for the mechanical part of the governing initial/boundary value problem.
  • In terms of modelling, the major factor influencing the thermo-mechanical behavior of granitic rocks seems to be the deviant behavior of Quartz mineral. More specifically, the thermal cracking induced reduction of the tensile strength of granite can be correctly predicted by accounting for the heterogeneity of the mechanical properties (stiffness and tensile strength) and the temperature dependence of Quartz thermal expansion.
  • This method, as it does not use any experimental data on the temperature dependence of the tensile strength as a model input, replicates the experimental weakening effect in a non-circular way. The practical benefit of the method is thus a fast and reliable 3D prediction of the tensile strength of granite rock at elevated temperatures with a small set of measurable parameters of a Quartz bearing rock.
Finally, some issues to be addressed in further developments of the present approach are suggested. First, this study considered only the thermal degradation of tensile strength. However, the rock mass in nature is usually under compression. Thereby, the degradation of compressive strength due to thermal cracking needs to be investigated. This is, however, not a trivial task as it requires a compressive failure criterion.

Funding

This research was funded by Academy of Finland, grant number 298,345.

Data Availability Statement

3rd Party Data.

Conflicts of Interest

The author declares no conflict of interest.

References

  1. Kumari, W.G.P.; Ranjith, P.G.; Perera, M.S.A.; Shao, S.; Chen, B.K.; Lashin, A.; Arifi, N.A.; Rathnaweera, T.D. Mechanical behaviour of Australian Strathbogie granite under in-situ stress and temperature conditions: An application to geothermal energy extraction. Geothermics 2017, 65, 44–59. [Google Scholar] [CrossRef]
  2. Heuze, F.E. Geotechnical Modeling of High-Level Nuclear Waste Disposal by Rock Melting (No. UCRL-53183); Lawrence Livermore National Lab.: Livermore, CA, USA, 1981. [Google Scholar]
  3. Kant, M.A.; Rossi, E.; Madonna, C.; Höser, D.; von Rohr, P.R. A theory on thermal spalling of rocks with a focus on thermal spallation drilling. J. Geophys. Res. Solid Earth 2017, 122, 1805–1815. [Google Scholar] [CrossRef]
  4. Carpenter, M.A.; Salje, E.K.H.; Graeme-Barber, A.; Wruck, B.; Dove, M.T.; Knight, K.S. Calibration of excess thermodynamic properties and elastic constant variations associated with the α-β phase transition in quartz. Am. Mineral. 1998, 83, 2–22. [Google Scholar] [CrossRef] [Green Version]
  5. Gautam, P.K.; Verma, A.K.; Jha, M.K.; Sharma, P.; Singh, T.N. Effect of high temperature on physical and mechanical properties of Jalore granite. J. Appl. Geophys. 2018, 159, 460–474. [Google Scholar] [CrossRef]
  6. Heuze, F. High temperature mechanical, physical and thermal properties of granitic rocks—A review. Int. J. Rock Mech. Min. Sci. Geomech. Abstr. 1983, 20, 3–10. [Google Scholar] [CrossRef]
  7. Toifl, M.; Hartlieb, P.; Meisels, R.; Antretter, T.; Kuchar, F. Numerical study of the influence of irradiation parameters on the microwave-induced stresses in granite. Miner. Eng. 2017, 103–104, 78–92. [Google Scholar] [CrossRef]
  8. Yang, S.Q.; Ranjith, P.G.; Jing, H.W.; Tian, W.L.; Ju, Y. An experimental investigation on thermal damage and failure mechanical behavior of granite after exposure to different high temperature treatments. Geothermics 2017, 65, 180–197. [Google Scholar] [CrossRef]
  9. Yin, T.; Shu, R.; Li, X.; Wang, P.; Liu, X. Comparison of mechanical properties in high temperature and thermal treatment granite. Trans. Nonferrous Met. Soc. China 2016, 26, 1926–1937. [Google Scholar] [CrossRef]
  10. Vázquez, P.; Shushakova, V.; Gómez-Heras, M. Influence of mineralogy on granite decay induced by temperature increase: Experimental observations and stress simulation. Eng. Geol. 2015, 189, 58–67. [Google Scholar] [CrossRef]
  11. Wang, F.; Konietzky, H. Thermo-Mechanical Properties of Granite at Elevated Temperatures. and Numerical Simulation of Thermal Cracking. Rock Mech. Rock Eng. 2019, 52, 3737–3755. [Google Scholar] [CrossRef]
  12. Wang, F.; Konietzky, H.; Frühwirt, T.; Li, L.; Dai, Y. The Influence of Temperature and High-Speed Heating on Tensile Strength of Granite and the Application of Digital Image Correlation on Tensile Failure Processes. Rock Mech. Rock Eng. 2020, 53, 1935–1952. [Google Scholar] [CrossRef]
  13. Griffiths, L.; Heap, M.J.; Baud, P.; Schmittbuhl, J. Quantification of microcrack characteristics and implications for stiffness and strength of granite. Int. J. Rock. Mech. Min. Sci. 2017, 100, 138–150. [Google Scholar] [CrossRef]
  14. Zhao, Z.; Xu, H.; Wang, J.; Zhao, X.; Cai, M.; Yang, Q. Auxetic behavior of Beishan granite after thermal treatment: A microcracking perspective. Eng. Fract. Mech. 2020, 231, 107017. [Google Scholar] [CrossRef]
  15. Pressacco, M.; Saksala, T. Numerical modelling of thermal shock assisted rock fracture. Int. J. Numer. Anal. Methods Geomech. 2020, 44, 40–68. [Google Scholar] [CrossRef]
  16. Raude, S.; Laigle, F.; Giot, R.; Fernandes, R. A unified thermoplastic/viscoplastic constitutive model for geomaterials. Acta Geotech. 2016, 11, 849–869. [Google Scholar] [CrossRef]
  17. Saksala, T. Numerical modelling of adiabatic heat generation during rock fracture under dynamic loading. Numer. Anal. Methods Geomech. 2019, 43, 1770–1783. [Google Scholar] [CrossRef]
  18. Jing, L.; Hudson, J.A. Numerical methods in rock mechanics. Int. J. Rock Mech. Min. Sci. 2002, 39, 409–427. [Google Scholar] [CrossRef]
  19. Nikolić, M.; Roje-Bonacci, T.; Ibrahimbegović, A. Overview of the numerical methods for the modelling of rock mechanics problems. Teh. Vjesn./Tech. Gaz. 2016, 23, 627–637. [Google Scholar]
  20. Hamdi, P.; Stead, D.; Elmo, D. Characterizing the influence of stress-induced microcracks on the laboratory strength and fracture development in brittle rocks using a finite-discrete element method-micro discrete fracture network FDEM-μDFN approach. J. Rock Mech. Geotech. 2015, 7, 609–625. [Google Scholar] [CrossRef] [Green Version]
  21. Simo, J.C.; Oliver, J.; Armero, F. An analysis of strong discontinuities induced by strain-softening in rate-independent inelastic solids. Comput. Mech. 1993, 12, 277–296. [Google Scholar] [CrossRef]
  22. Belytschko, T.; Black, T. Elastic crack growth in finite elements with minimal remeshing. Int. J. Numer. Methods Eng. 1999, 45, 601–620. [Google Scholar] [CrossRef]
  23. Mosler, J. On advanced solution strategies to overcome locking effects in strong discontinuity approaches. Int. J. Numer. Meth. Eng. 2005, 63, 1313–1341. [Google Scholar] [CrossRef]
  24. Saksala, T. Numerical modelling of temperature effect on tensile strength of granitic rock. Appl. Sci. 2021, 11, 4407. [Google Scholar] [CrossRef]
  25. Saksala, T.; Brancherie, D.; Harari, I.; Ibrahimbegovic, A. Combined continuum damage-embedded discontinuity model for explicit dynamic fracture analyses of quasi-brittle materials. Int. J. Numer. Methods Eng. 2015, 101, 230–250. [Google Scholar] [CrossRef]
  26. Ottosen, N.S.; Ristinmaa, M. The Mechanics of Constitutive Modeling; Elsevier: Amsterdam, The Netherlands, 2005. [Google Scholar]
  27. Saksala, T.; Ibrahimbegovic, A. Thermal shock weakening of granite rock under dynamic loading: 3D numerical modelling based on embedded discontinuity finite elements. Int. J. Numer. Anal. Methods Geomech. 2020, 44, 1788–1811. [Google Scholar] [CrossRef]
  28. Zhao, D.; Zhang, S.; Wang, M. Microcrack Growth Properties of Granite under Ultrasonic High-Frequency Excitation. Adv. Civ. Eng. 2019, 2019, 3069029. [Google Scholar] [CrossRef]
  29. Mahabadi, O.K. Investigating the Influence of Micro-Scale Heterogeneity and Microstructure on the Failure and Mechanical Behaviour of Geomaterials. PhD Thesis, University of Toronto, Toronto, ON, Canada, 2012. [Google Scholar]
  30. Zhang, Q.B.; Zhao, J. A Review of Dynamic Experimental Techniques and Mechanical Behaviour of Rock Materials. Rock Mech. Rock. Eng. 2014, 47, 1411–1478. [Google Scholar] [CrossRef] [Green Version]
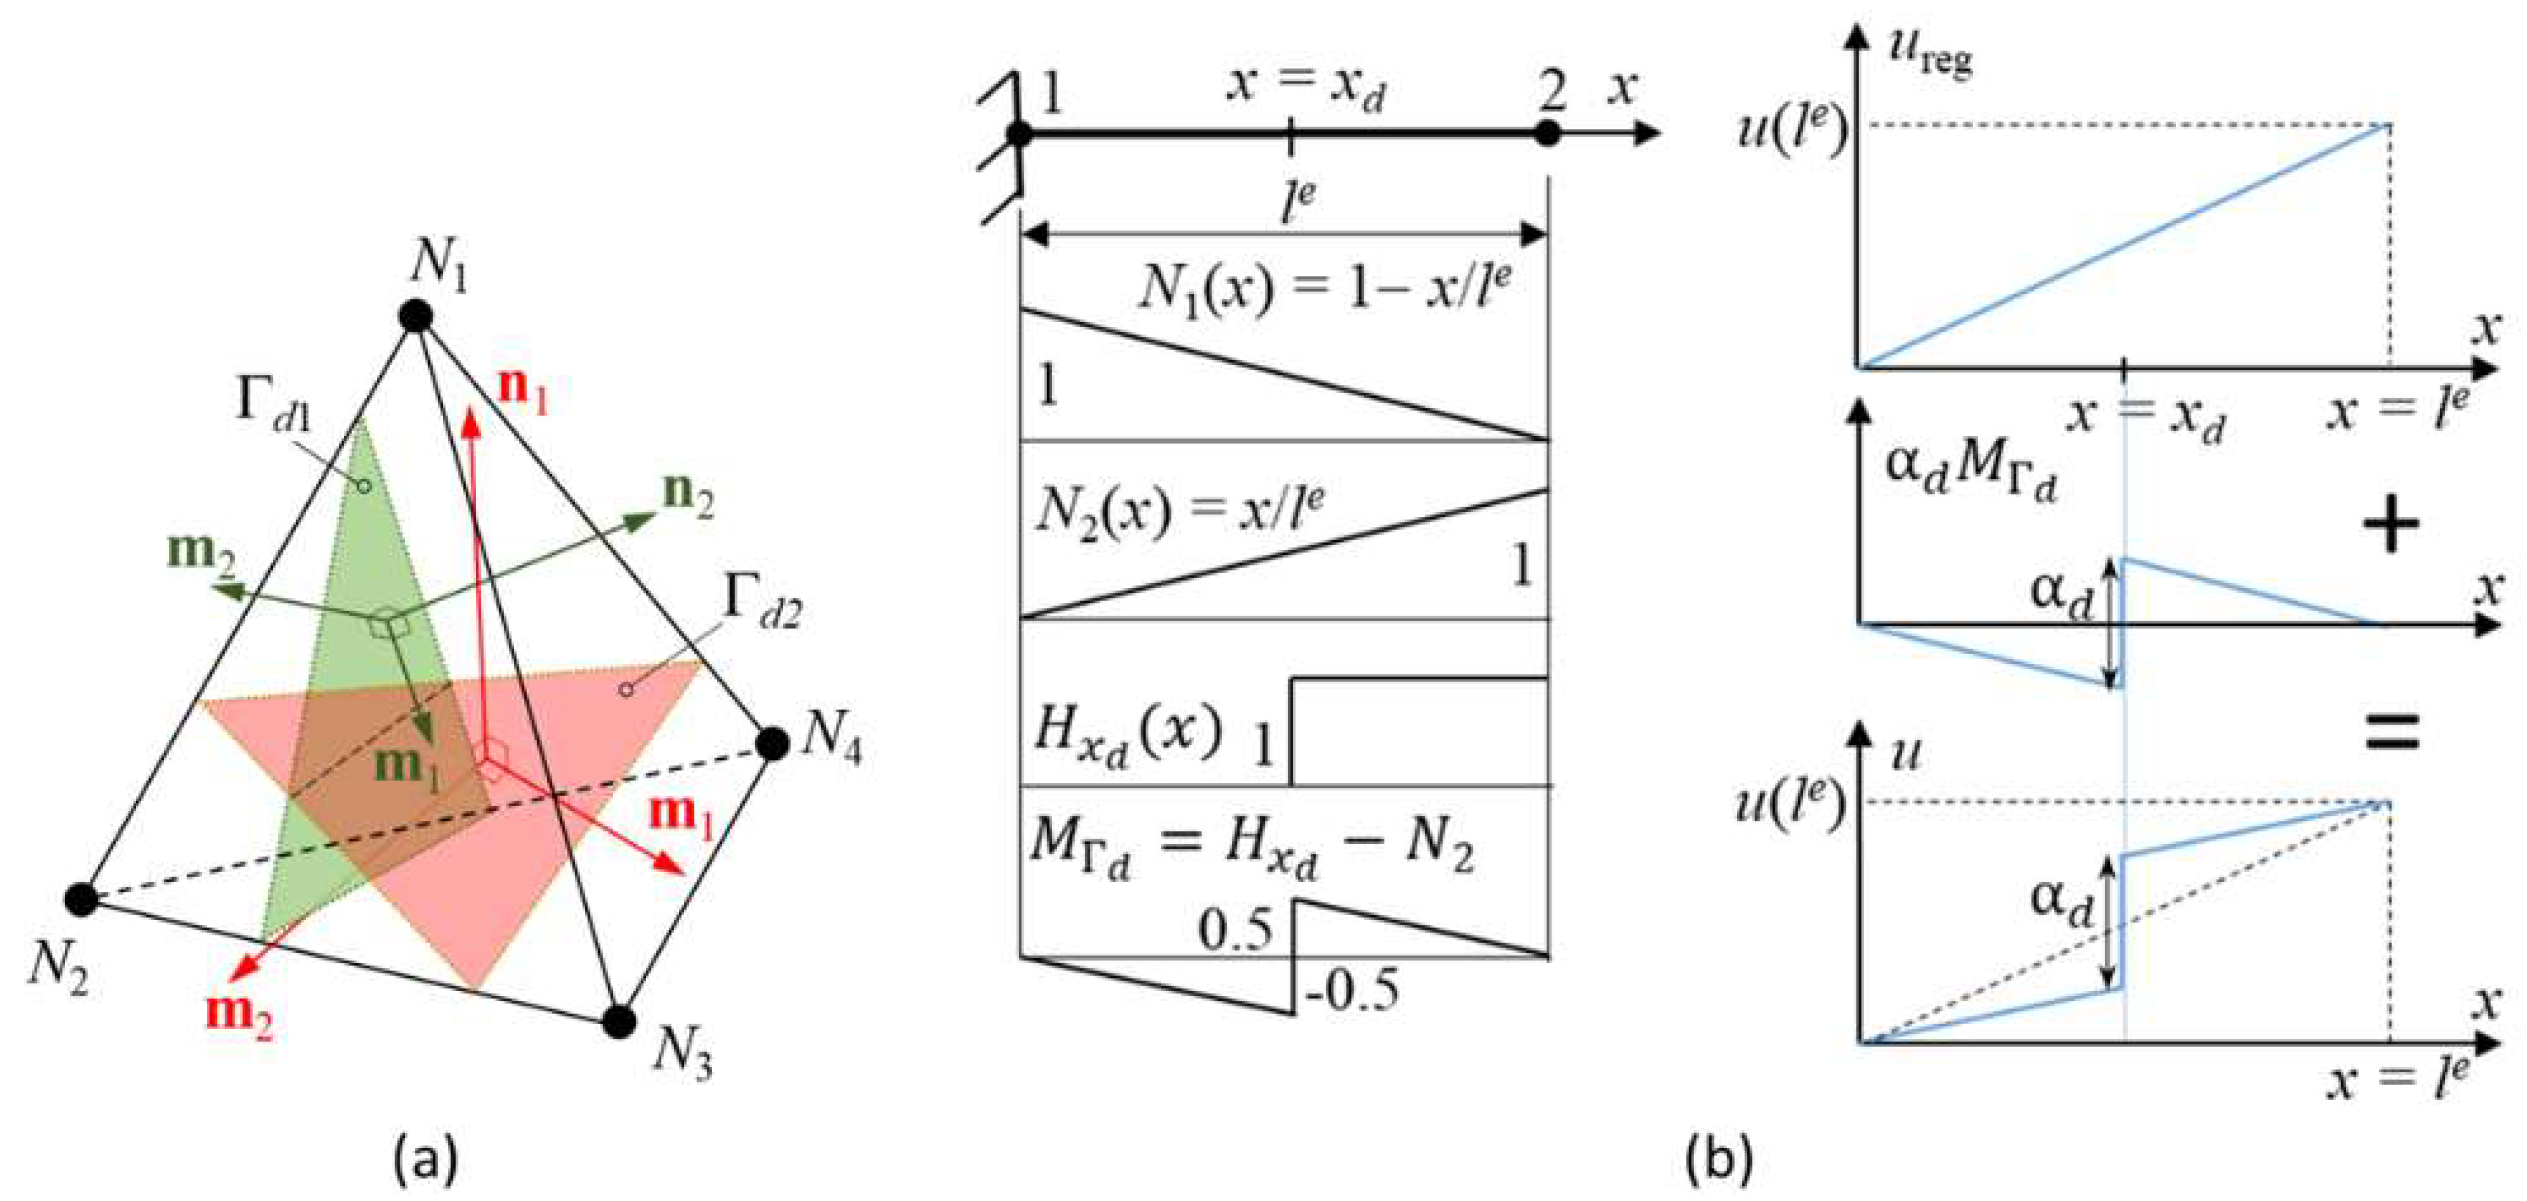
Figure 1. (a) Linear tetrahedron element with two intersecting discontinuity planes ( n 1 , m 1 , m 2 : normal and tangent vectors for cracks 1 ( Γ d 1 ) and 2 ( Γ d 2 ; Ni: interpolation function at node i); (b) Illustration of the displacement decomposition to regular and enhanced part and the corresponding functions in 1D case ( u r e g : regular displacement; u: total displacement; α d ; displacement jump; M Γ d : special function restricting the effect of α d inside the element).
Geosciences 12 00010 g001
Figure 2. The flow of the global solution process of the thermo-mechanical problem.
Geosciences 12 00010 g002
Figure 3. Numerical granite samples (Quartz = 3, Feldspar = 2, Biotite = 3).
Geosciences 12 00010 g003
Figure 4. Simulation results for heat treatment (500 °C, NumRock1): (a) Temperature field; (b) Crack opening magnitude; (c) Stress-like softening variable; (d) Temperature and cumulative crack number evolution in time; (e) Thermally induced crack normal (every 100th plotted).
Geosciences 12 00010 g004
Figure 5. Simulation results for uniaxial tension test (intact rock): (a) Crack opening magnitudes for all numerical rocks; (b) Average stress-strain curves for all numerical rocks and cumulative crack number for NumRock1; (c) Crack normals with NumRock1 (every 100th plotted).
Geosciences 12 00010 g005
Figure 6. Simulation results for uniaxial tension test (heated 300 °C): (a) Failure models represented by crack opening magnitudes; (b) Average stress-strain curves; (c) Crack normals for NumRock1 (every 100th shown, blue = thermal cracks, red = tensile cracks, green = new tensile cracks in elements with a thermal crack).
Geosciences 12 00010 g006
Figure 7. Simulation results for uniaxial tension test (heated 500 °C): (a) Failure models represented by crack opening magnitudes; (b) Average stress-strain curves; (c) Crack normals for NumRock1 (blue = thermal cracks, red = tensile cracks, green = new tensile cracks in elements with a thermal crack).
Geosciences 12 00010 g007
Figure 8. Predicted tensile strengths (normalized with the room temperature values) at different temperatures (the curve for the averaged measurements and the variation bars at 300 °C and 500 °C for different granites is reproduced after the data in [11]).
Geosciences 12 00010 g008
Table 1. Material properties for simulations.
Property/MineralQuartzFeldsparsBiotite
Young’s modulus E [GPa]907040
Poisson’s ratio ν0.10.30.2
Tensile strength σt0 [MPa]14117
Mode I fracture energy GIc [J/m2]404028
Density ρ [kg/m3]265026502650
Thermal expansion coeff. α0 [1/K] 8 × 10 6 8 × 10 6 8 × 10 6
Specific heat capacity c [J/kgK]820820820
Thermal conductivity k [W/mK]2.62.62.6
Fraction [%]33607
Publisher’s Note: MDPI stays neutral with regard to jurisdictional claims in published maps and institutional affiliations.