1. Introduction
Unsaturated soil mechanics is receiving rising interest from the academic community and the geotechnical construction industry. Some of the appeal derives from the potential use of unsaturated soil mechanics as a tool to reduce the carbon footprint of various civil engineering applications [
1,
2,
3,
4,
5]. For instance, Speranza et al. [
6] suggested that the increase in strength resulting from the suction
s may be conveniently adopted to reduce the overdesign of the retaining structures in temporary works, leading to a reduction in emissions and materials used. Dynamic centrifuge tests on a shallow foundation performed by Borghei et al. [
7] indicated that groundwater fluctuations significantly affect the seismic response of geotechnical systems and that neglecting them does not necessarily lead to safer or more economical design solutions. Several research studies investigated the effects of soil suction on the pile and piles group capacity under axial forces mainly by means of small-scale tests in cohesionless soils or numerical analyses [
2,
8,
9] and, so far, the suction effect on the bearing capacity of a single pile seems quite well established.
The influence of the unsaturated soil conditions on the response of laterally loaded piles has received less attention; despite this, it is well known that the pile behaviour is largely affected by the mechanical properties of the shallower soil layer [
7], which is often above the water table. To the best of the authors’ knowledge, only few studies have so far addressed the relevance of the soil suction on the response of laterally loaded piles in unsaturated soils [
10,
11,
12,
13]. Stacul et al. [
10] implemented a BEM model accounting for soil suction and highlighted appreciable differences on the pile’s response even in the case of a shallow water table (1 m depth).
Lalicata et al. [
11] carried out two centrifuge tests on a relatively short and rigid pile under lateral loading in an unsaturated silty soil. The soil models were compacted at two different void ratios: one loose (
e0 = 0.93) and one dense (
e0 = 0.75). The water content was nominally the same,
w = 15%. Two additional tests were conducted under saturated soil conditions to provide a baseline response for comparison purposes. The study quantified the increase in the lateral stiffness and ultimate capacity due to the suction as well as the reduction in maximum bending moment at small load level (see
Table 1). The effects of soil partial saturation on the pile response were found to depend on the soil state (loose or dense) and on the shape of the soil water retention curve, SWRC.
Centrifuge modelling was revealed to be a powerful tool to investigate soil structure interaction problems even under unsaturated soil conditions. However, due to the experimental complexities, performing a complete parametric study investigating different water table elevations and/or different types of piles was not possible. Moreover, some data such as the lateral capacity in the unsaturated soil tests, the bending moments in one test, and the soil reactions were missing or uncertain.
In order to overcome the limitations of the experimentation, a numerical model has been developed. When validated against experimental data, numerical analyses represent a useful tool to better understand the geotechnical problems and to explore different scenarios from those experimentally investigated.
This paper presents the main results of the numerical study of laterally loaded piles in unsaturated soils. The key objectives of the study are:
In the first section, the main characteristics of the centrifuge tests are briefly summarised. Next, the constitutive laws adopted for describing the hydro-mechanical soil behaviour, as well as their calibration against laboratory data, are presented. In the third section, the numerical model is presented and validated against the experimental data obtained in the centrifuge. The influence of soil partial saturation on the response of the pile is investigated, with an emphasis on the soil–pile reaction profiles. In conclusion, the last section focuses on the influence of soil suction on different types of piles.
2. Centrifuge Tests
Four centrifuge tests on a single free head pile were carried out at the IFSTTAR research centre of Nantes. The models were accelerated at 100×
g. The soil used was a B-Grade kaolin (90% fine silt and 10% clay). Soil models were statically compacted on the dry side of the Proctor curve in a tub 300 mm in diameter. The final height was 18 cm. At the base of the container, a 10 mm thick sand layer, sandwiched between geotextile, acted as drainage boundary. The top of the model was sealed with a plastic film during the tests. The initial conditions of the centrifuge tests are summarised in
Table 2.
The model pile was a closed-end aluminium tube (diameter 12 mm, thickness 1 mm). The embedment length was 150 mm. The load was applied 35 mm above the ground surface. With the exception of T05, in the other tests the pile was instrumented with ten levels of strain gages. At the prototype scale (N = 100 g) the model reproduced a 1.2 m diameter 15 m long pile with a flexural rigidity of 3.9 × 10⁶ kN·m2.
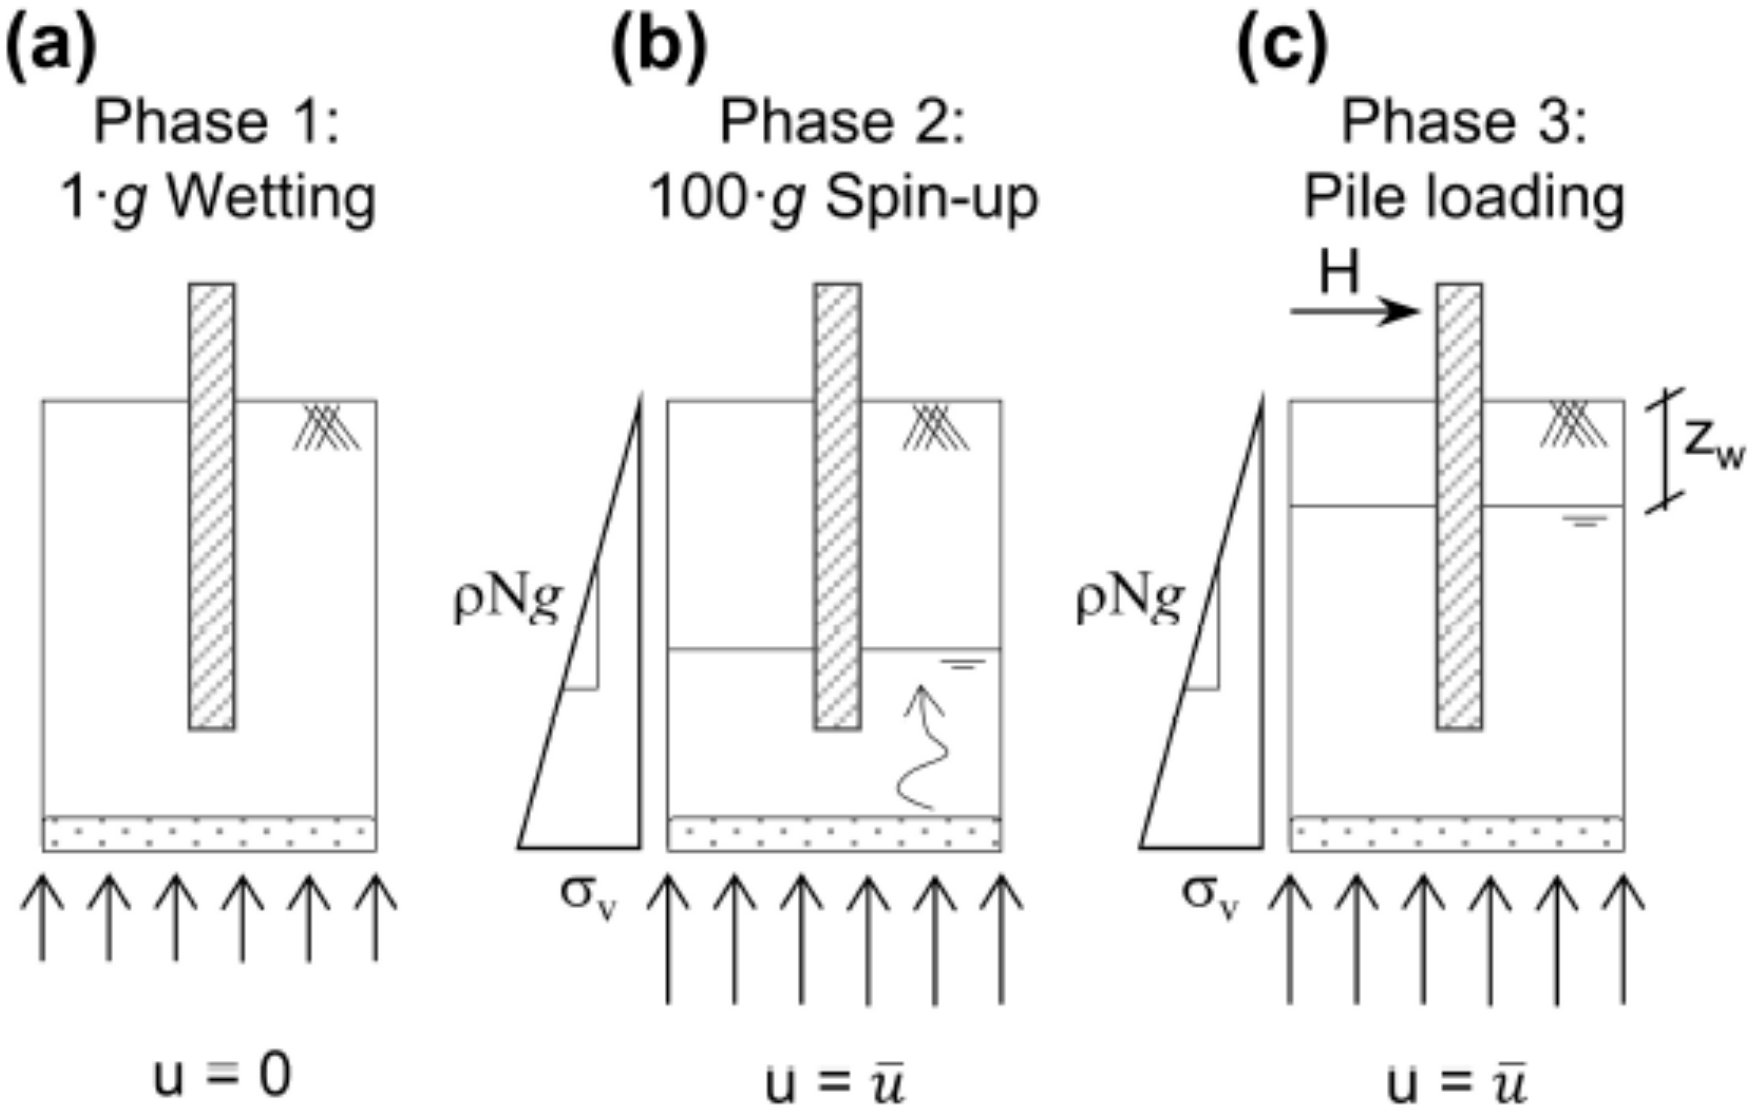
After the sample preparation, the key phases of the centrifuge tests were:
The main features of the tests are summarised in
Table 2. Further details can be found in Lalicata et al. [
11,
18,
19].
3. Constitutive Modelling
The hydraulic behaviour of B-grade kaolin is described using a modified version of the Gardner model [
20]:
where
n controls the slope of the curve and
−a/n is related to the air-entry value.
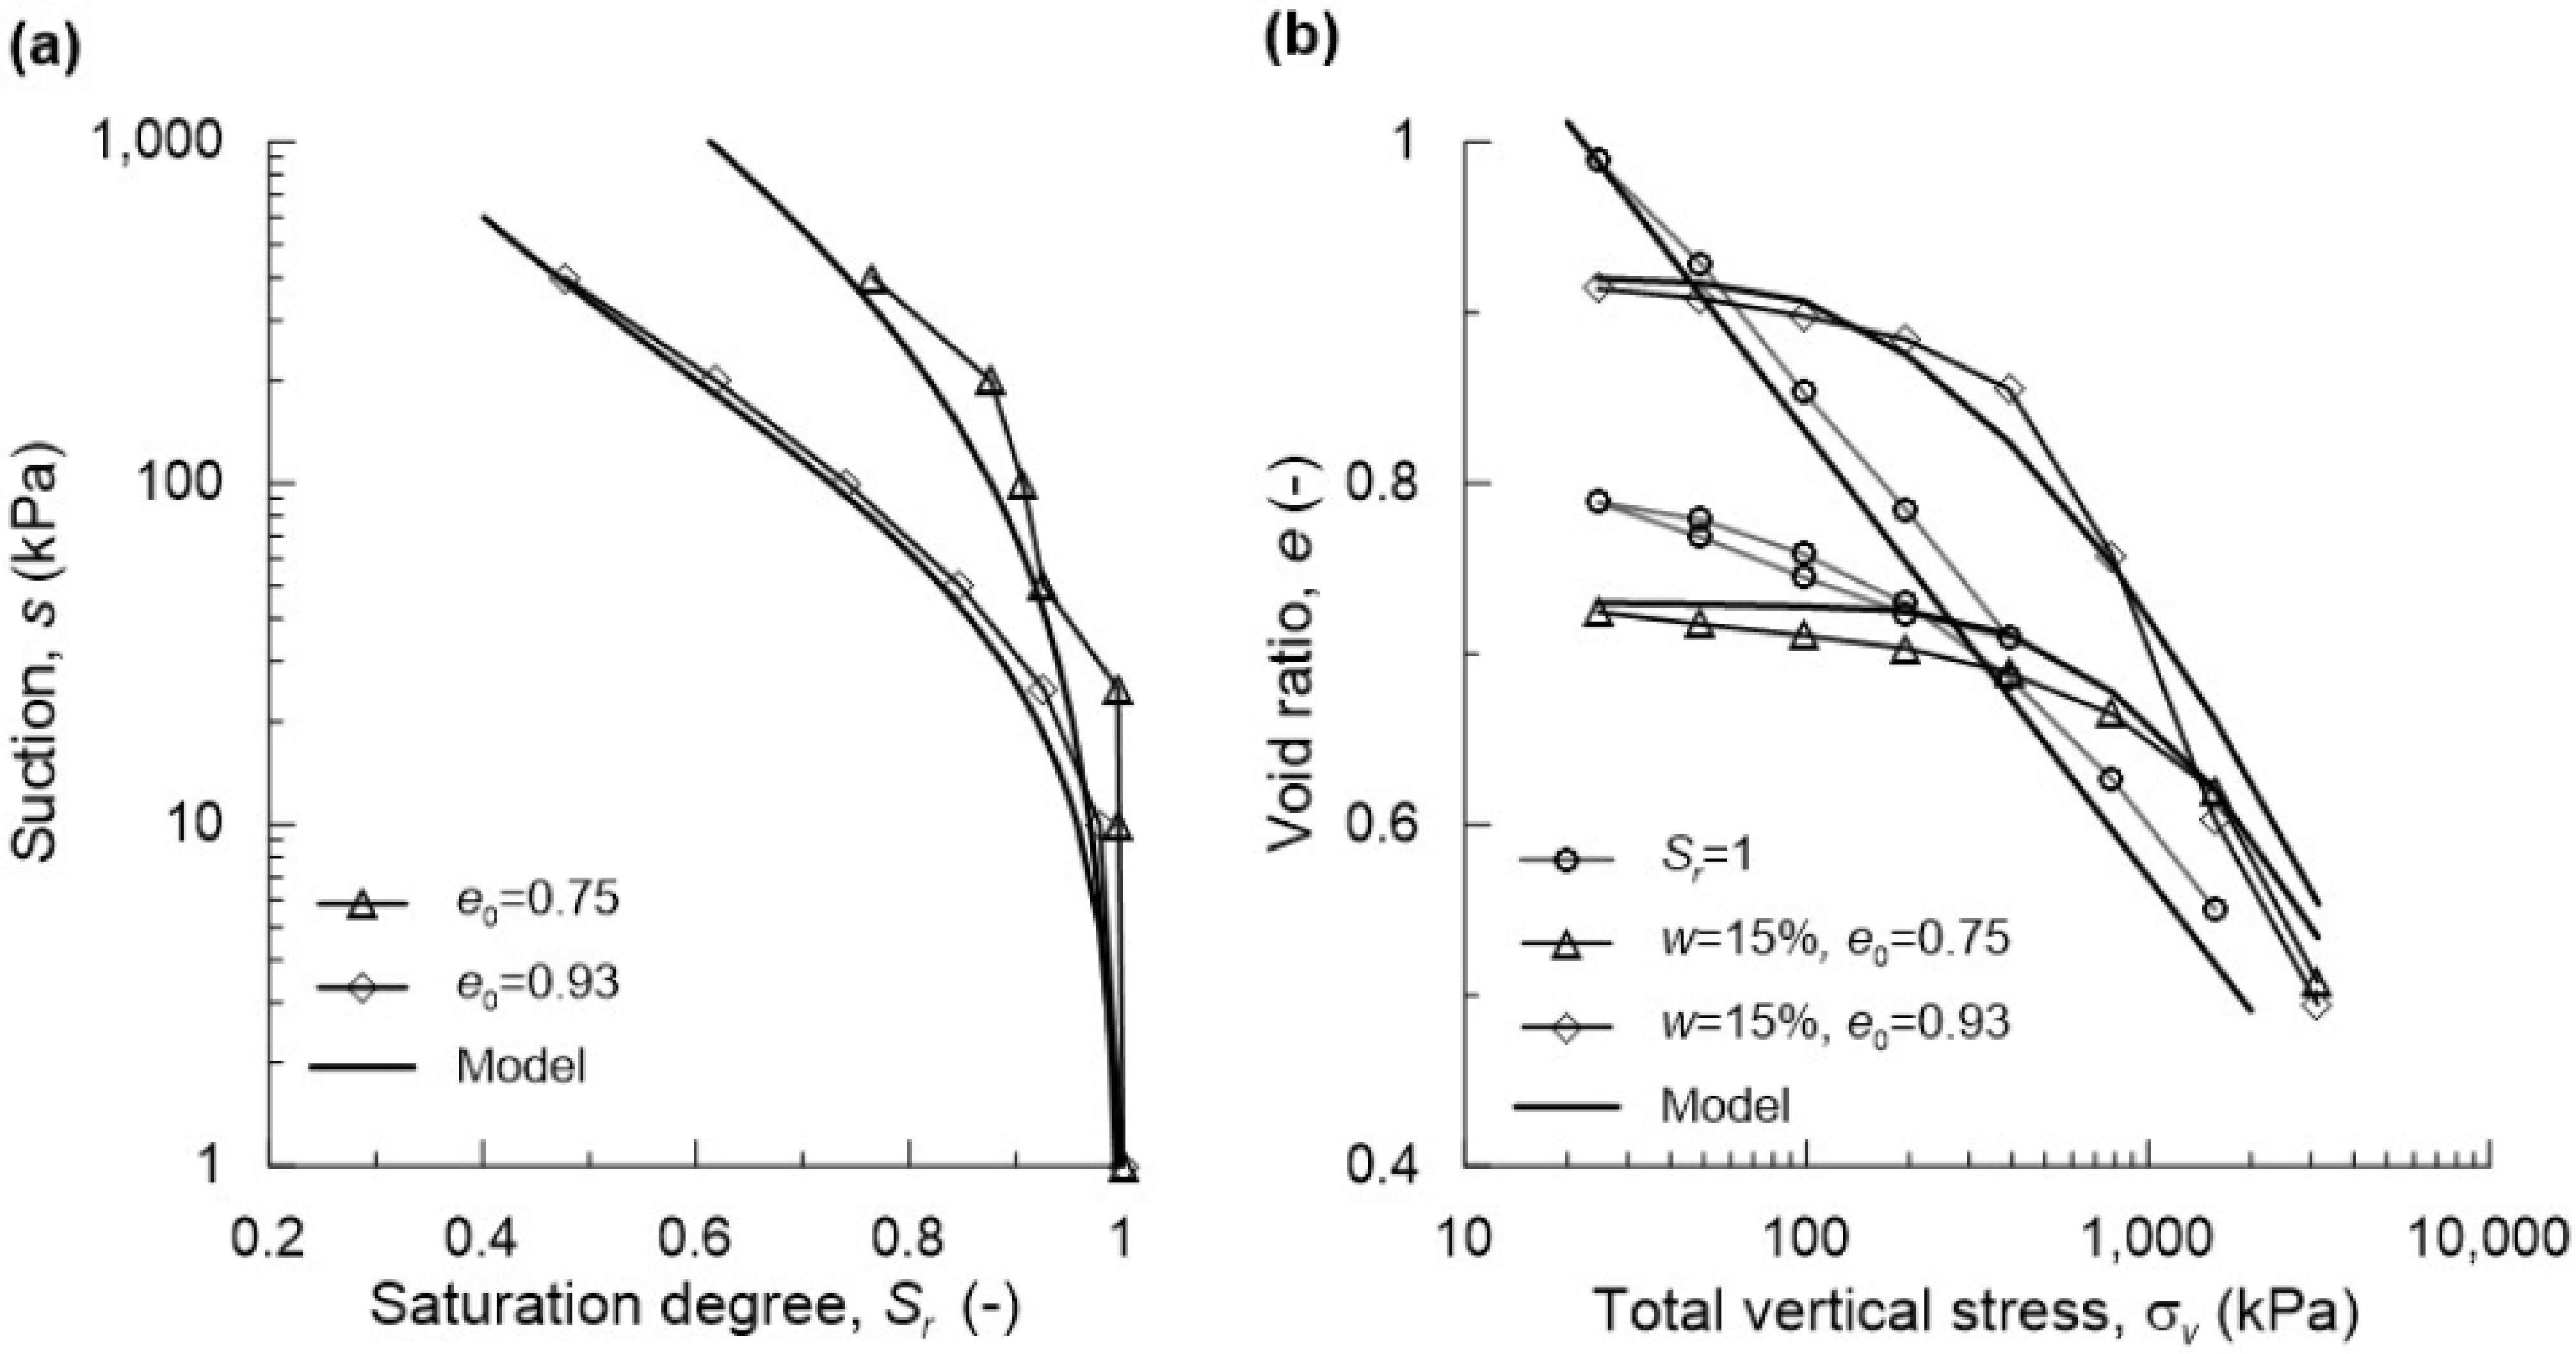
The soil water retention curve, SWRC in (Equation (1)), is calibrated against the results of wetting–drying cycles performed using a suction-controlled oedometer cell [
21] reported in [
11]. Here, only the wetting branch is reported, as it is representative of the hydraulic paths imposed in the centrifuge tests. The experimental data, in terms of saturation degree versus suction, show a marked dependency on initial void ratio (
Figure 2a), which is taken into account in the SWRC model (Equation (1)) assuming different values for
n and
a in the loose and dense soils (
n = 0.86,
a = 5.0 for
e0 = 0.93;
n = 0.65,
a = 4.95 for
e0 = 0.75).
The permeability of B-grade kaolin evolves with the saturation degree according to the following power law [
22]:
here, the saturated permeability
ksat (depending on voids ratio) was determined by oedometer and falling-head permeability tests. It assumes the values of 4.5 × 10
−9 m/s for
e0 = 0.93 and 2.0 × 10
−9 m/s for
e0 = 0.75 [
23]. The parameter
α, set equal to 2.0, was calibrated against the experimental data of the infiltration phase, by means of preliminary sensitive analyses.
The mechanical behaviour of the solid skeleton is described with a Modified Cam Clay Model (MCCM) extended to unsaturated conditions [
24]. The MCCM well-reproduces the response of fine-grained soils under a broad range of initial conditions during wetting and loading processes, as demonstrated for single elements by Casini [
25] and Casini et al. [
26] as well as by other researchers [
27,
28,
29] for boundary value problems. The model is characterised by a relatively simple mathematical formulation described in detail in Rotisciani et al. [
30]. Here, only the main features are briefly recalled emphasising the main differences from the original model by Roscoe and Burland [
31].
The model is formulated within the framework of critical state soil mechanics in terms of Bishop’s effective stresses [
32], defined as:
, with
=
[
33]. The yield surface has an elliptical shape, symmetric with respect to the isotropic axis, whose evolution is controlled by a double-hardening mechanism:
where
and
are respectively the increments of the plastic volumetric strain and saturation degree. In Equation (3), the first term coincides with the hardening law of the MCCM typically employed for saturated soils and the latter represents the hydro-mechanical coupling term introduced to capture some peculiar aspects of the hydro-mechanical behaviour of partially saturated soils (i.e., the changes in shear strength with suction and the volumetric collapse upon wetting). More specifically: (i) under drying paths, the elastic domain expands, leading to an increase in shear strength for heavy over-consolidated samples; (ii) under wetting processes, the yield surface shrinks keeping the current stress state in the elasto-plastic regime, and the solid skeleton collapses reducing its volume.
In the MCCM, the material response in the elastic domain is hypoelastic and the flow rule is associated. The values for constitutive parameters and their meaning are listed in
Table 3.
The calibration of the model was performed back-analysing a set of oedometer and triaxial tests carried out on saturated and unsaturated soil samples prepared with the same procedure adopted in the centrifuge tests and reported in [
18].
Figure 2b shows the comparison between model predictions and measurements in oedometer tests performed on a fully saturated soil sample and under constant water content. The model captures all the main aspects of the soil response experimentally observed and provides predictions in agreement with experimental data in all the tests performed.
In the MCCM, the elastic shear stiffness, Equation (4), and the constant volume shear strength, Equation (5), are stress dependent:
where
p′ is the mean effective stress. As the latter is expressed in terms of Bishop’s effective stress, the model accounts for the increase in stiffness and strength under unsaturated soil conditions.
4. Numerical Model
The centrifuge model is related to the full-scale prototype following the scaling laws [
34]. A centrifuge model accelerated of
N times the Earth’s gravity (
g), replicates a full-scale prototype
N times larger. The relevant scaling laws for this study are summarised in
Table 4. Unless otherwise stated, the simulations are performed at the prototype scale.
The pile response is studied by means of three-dimensional coupled analyses via the finite element code Abaqus/Standard. The constitutive soil model is implemented in a user-defined subroutine [
35,
36]. The hydro-mechanical behaviour of the kaolin is described with the Modified Cam Clay Model extended to unsaturated conditions and the modified Gardner SWRC previously introduced.
4.1. Three-Dimensional Model
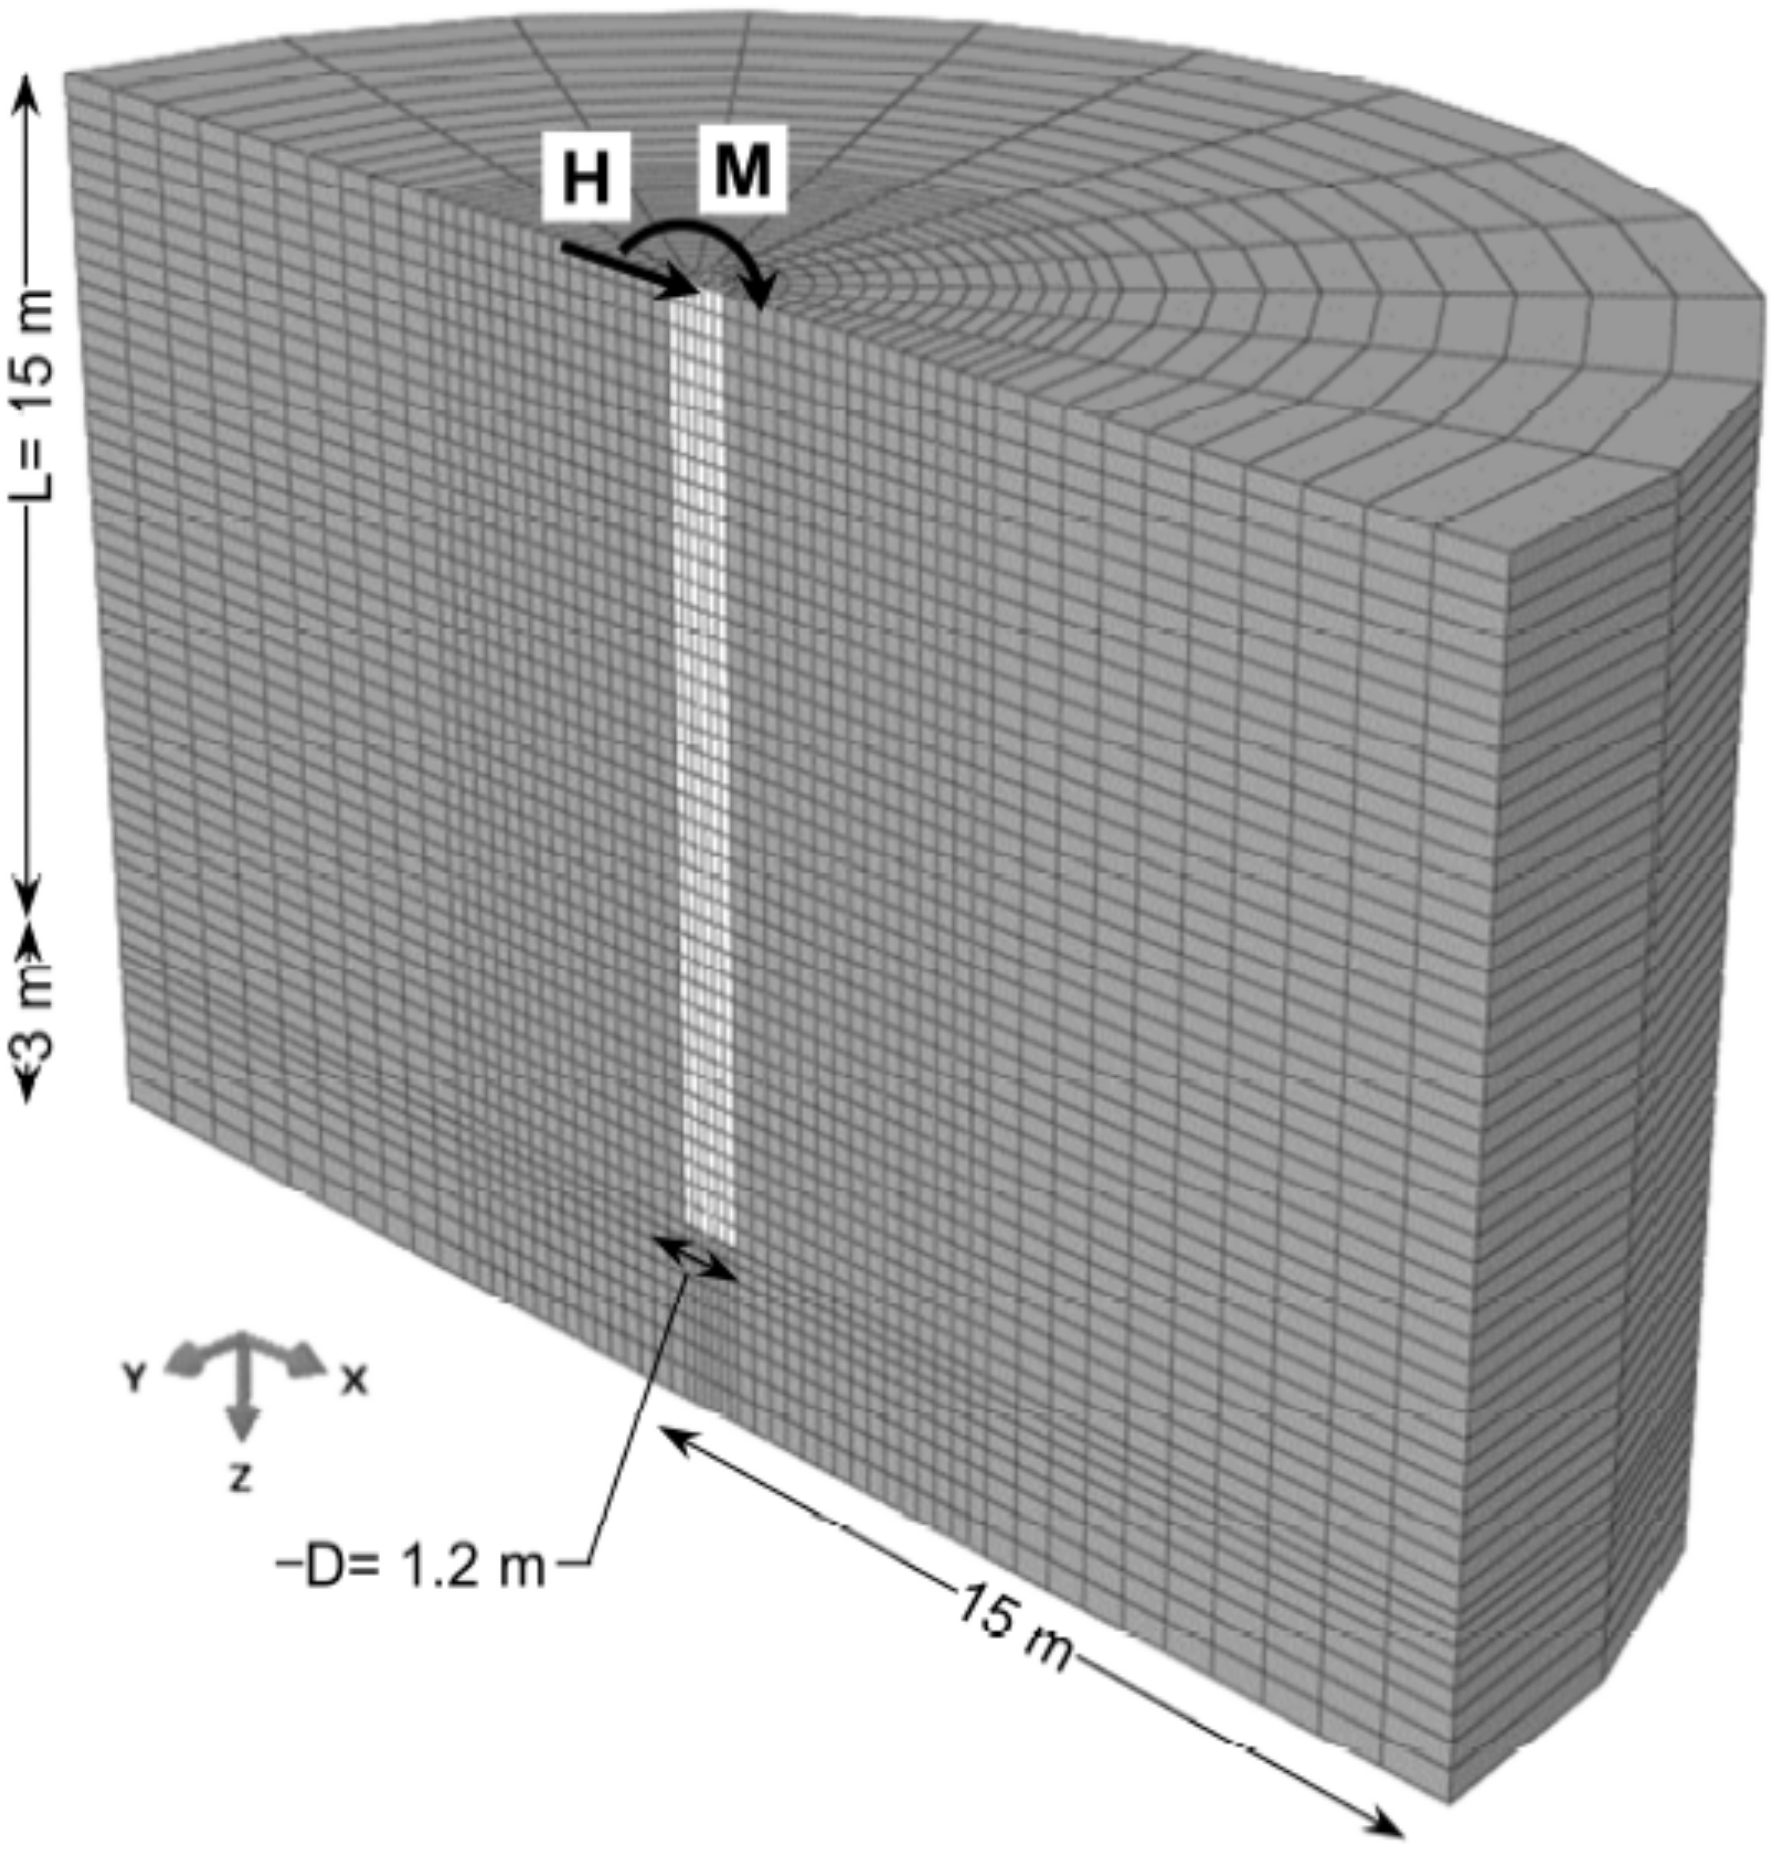
The 3D model simulates half of the cross section of the pile and the soil model taking advantage of the symmetry along the vertical plane containing the force,
Figure 3. The finite element volume, 18 m thick and 30 m wide, is discretised with three-dimensional solid continuum porous elements C3D8P for both the soil and the pile. A mesh refinement is adopted near the pile. The latter (embedded length
L = 15 m, diameter
D = 1.2 m) is installed in the centre of the soil layer, after the initial step in which the stress state from the axisymmetric analyses is applied. Quadratic beam elements B32 with null stiffness (Young Modulus
E = 1 kPa) are constrained to the central nodes of the pile, in order to efficiently obtain the bending moment profile along the pile length.
The model restricts the vertical displacements at the base. At the lateral boundaries, the displacements are constrained in the normal direction. The pile’s head is free to rotate as in the centrifuge tests. The rotation along the X-axis of all nodes belonging to the structural elements on the symmetry plane is restrained. The water table position is fixed by imposing the corresponding pore pressure value at the bottom of the model. The load is applied at a master node, rigidly connected to the nodes of the pile’s head. A concentrated moment is applied to the same node to take into account the eccentricity of load with respect to the ground level. As in the centrifuge tests, the loading rate is slow enough to ensure a drained response of the soil.
The pile is modelled as a linear elastic material with a Young’s modulus Ep = 38.3 GPa and a Poisson’s ratio υ = 0.2. The model pile in centrifuge tests was a hollow aluminium tube. For simplicity, the pile is modelled as a solid element. The same flexural rigidity, EpIp = 3.9 × 10⁶ kN·m2 (where Ip is the moment of the inertia of the pile), between the simulation and the tests, is guaranteed thanks to the adoption of an equivalent Young’ modulus Ep rather than that of the aluminium.
The soil–pile interface is described with a purely frictional Mohr–Coulomb law assuming a friction angle at the interface δ = φ′/2, where φ′ is the critical state friction angle.
4.2. Stress History of the Model
The mechanical response of fine soils depends on the history of the material. In the centrifuge tests, prior to the loading of the pile, the soil model is subjected to mechanical and hydraulic processes. These influence the final state of the soil and, consequently, the response of the pile upon loading.
Taking advantage of the symmetry of the model and of the perturbations applied, an axisymmetric analysis has been set up to reproduce the soil stress history prior to the loading of the pile. The details of this procedure are presented in Rotisciani et al. [
37]. Here, only the main aspects are reported. The results are at the model dimensions.
In the centrifuge tests, the pre-hole was slightly larger (13 mm) than the pile’s diameter (12 mm) to avoid damaging the strain gages. This small tolerance of 0.5 mm was taken into account in the axisymmetric model. When the clearance between the nodes of the pile and the nodes of the soil vanishes, the nodes interact with the same contact law used in the three-dimensional model.
The initial conditions follow from the measurements reported in
Table 5. Owning the small dimensions of the model, all state variables are considered uniformly distributed within the soil layer. The initial effective stresses are assumed to be isotropic and equal to
Sr·s; consequently, the soil results in a slight over-consolidated state [
38,
39].
The wetting process is simulated by imposing zero pore pressure at the base of the model (Phase 1). After a time period which varies depending on the specific test under consideration, the gravity loading exerted on the solid skeleton is increased 100 times (Phase 2). At the same time, the pore pressure at the base is increased to the desired value (190 kPa in T05, T09; 120 kPa in T06, T08) corresponding, at equilibrium, to a water table coinciding to the soil surface or located at 7 cm of depth.
The simulations are compared with the gathered data (surface movements, pore pressures, and volume water absorbed) with satisfying results. For the sake of brevity, the comparisons will not be shown here but they are thoroughly discussed elsewhere [
19,
37].
Figure 4 shows the profiles of the stresses and state variables during the analysis. The results refer to the test T06 (looser unsaturated test, LU).
The key findings are:
During the wetting event at 1× g, the soil swells due to the effective stress reduction and the increase in degree of saturation. Although the elastic swelling prevails, this is an elasto-plastic process because the contraction of the yielding surface following the Sr increase is faster than the effective stress reduction.
The fast g-increase, and thus the increase in the vertical total stress, entails a positive variation of the pore pressures. In the upper part of the model (z < 10.5 cm), the soil remains unsaturated, the vertical effective stress increases and the void ratio reduces. In the lower part (z > 10.5 cm) the combination of high values of degree of saturation and the high vertical stress leads to instantaneous saturation of the soil and thus to the developments of positive excess pore pressures.
In the equalisation following the g-increase, the water table gradually moves to 7 cm of depth. The dissipation of the excess pore pressures is coupled with the development of positive volumetric strains in the lower part of the model. Volumetric collapse is observed in the unsaturated zone between 3 and 10.5 cm of depth.
The void between the pile and the soil represents a free boundary for the soil as long as the void exists. During the analysis, the soil surrounding the pile deforms not only vertically, but also laterally, until closing the void and restoring, at same point, the oedometer conditions.
At the end of the equalisation in flight, the gap was completely closed for all the analyses. Therefore, this was not considered in the three-dimensional model.
4.3. Initial Conditions for the Three-Dimensional Model
The profiles (with depth) of the main variables at the end of the axisymmetric analyses, and thus the initial state of the three-dimensional model, are presented in
Figure 5:
The vertical effective stress profile varies with the elevation of the water table. The small difference in the two unsaturated cases depends on the slightly different degree of saturation with voids ratio, as in the SWRC.
Although the current stress state belongs to the yield surface in all the tests (i.e., the soil is in an elasto-plastic state), the ratio between the horizontal and the vertical effective stress, i.e., the K0 values, depends on the initial void ratios.
In the loose soil cases (LS and LU)
K0 is, practically everywhere, lower than one and close to the normal consolidated value predicted by the model [
40]. The soil is then close to a normal consolidated state.
For the dense soil cases, K0 reduces with depth but it is higher than one for the firsts 6 m and 10 m of depth in DU and DS, respectively. The soil is in extension conditions, and thus, during the pile’s loading, the stress path initially moves inside the yielding surface. The soil response is initially elastic and similar to that of an over consolidated soil, at least in the region involved in the soil–pile interaction.
The void ratio profiles give rise of the different state of the material. In LS and LU, e reduces with depth while in DU and DS is practically constant with it.
5. Analysis of the Results
5.1. Model Validation
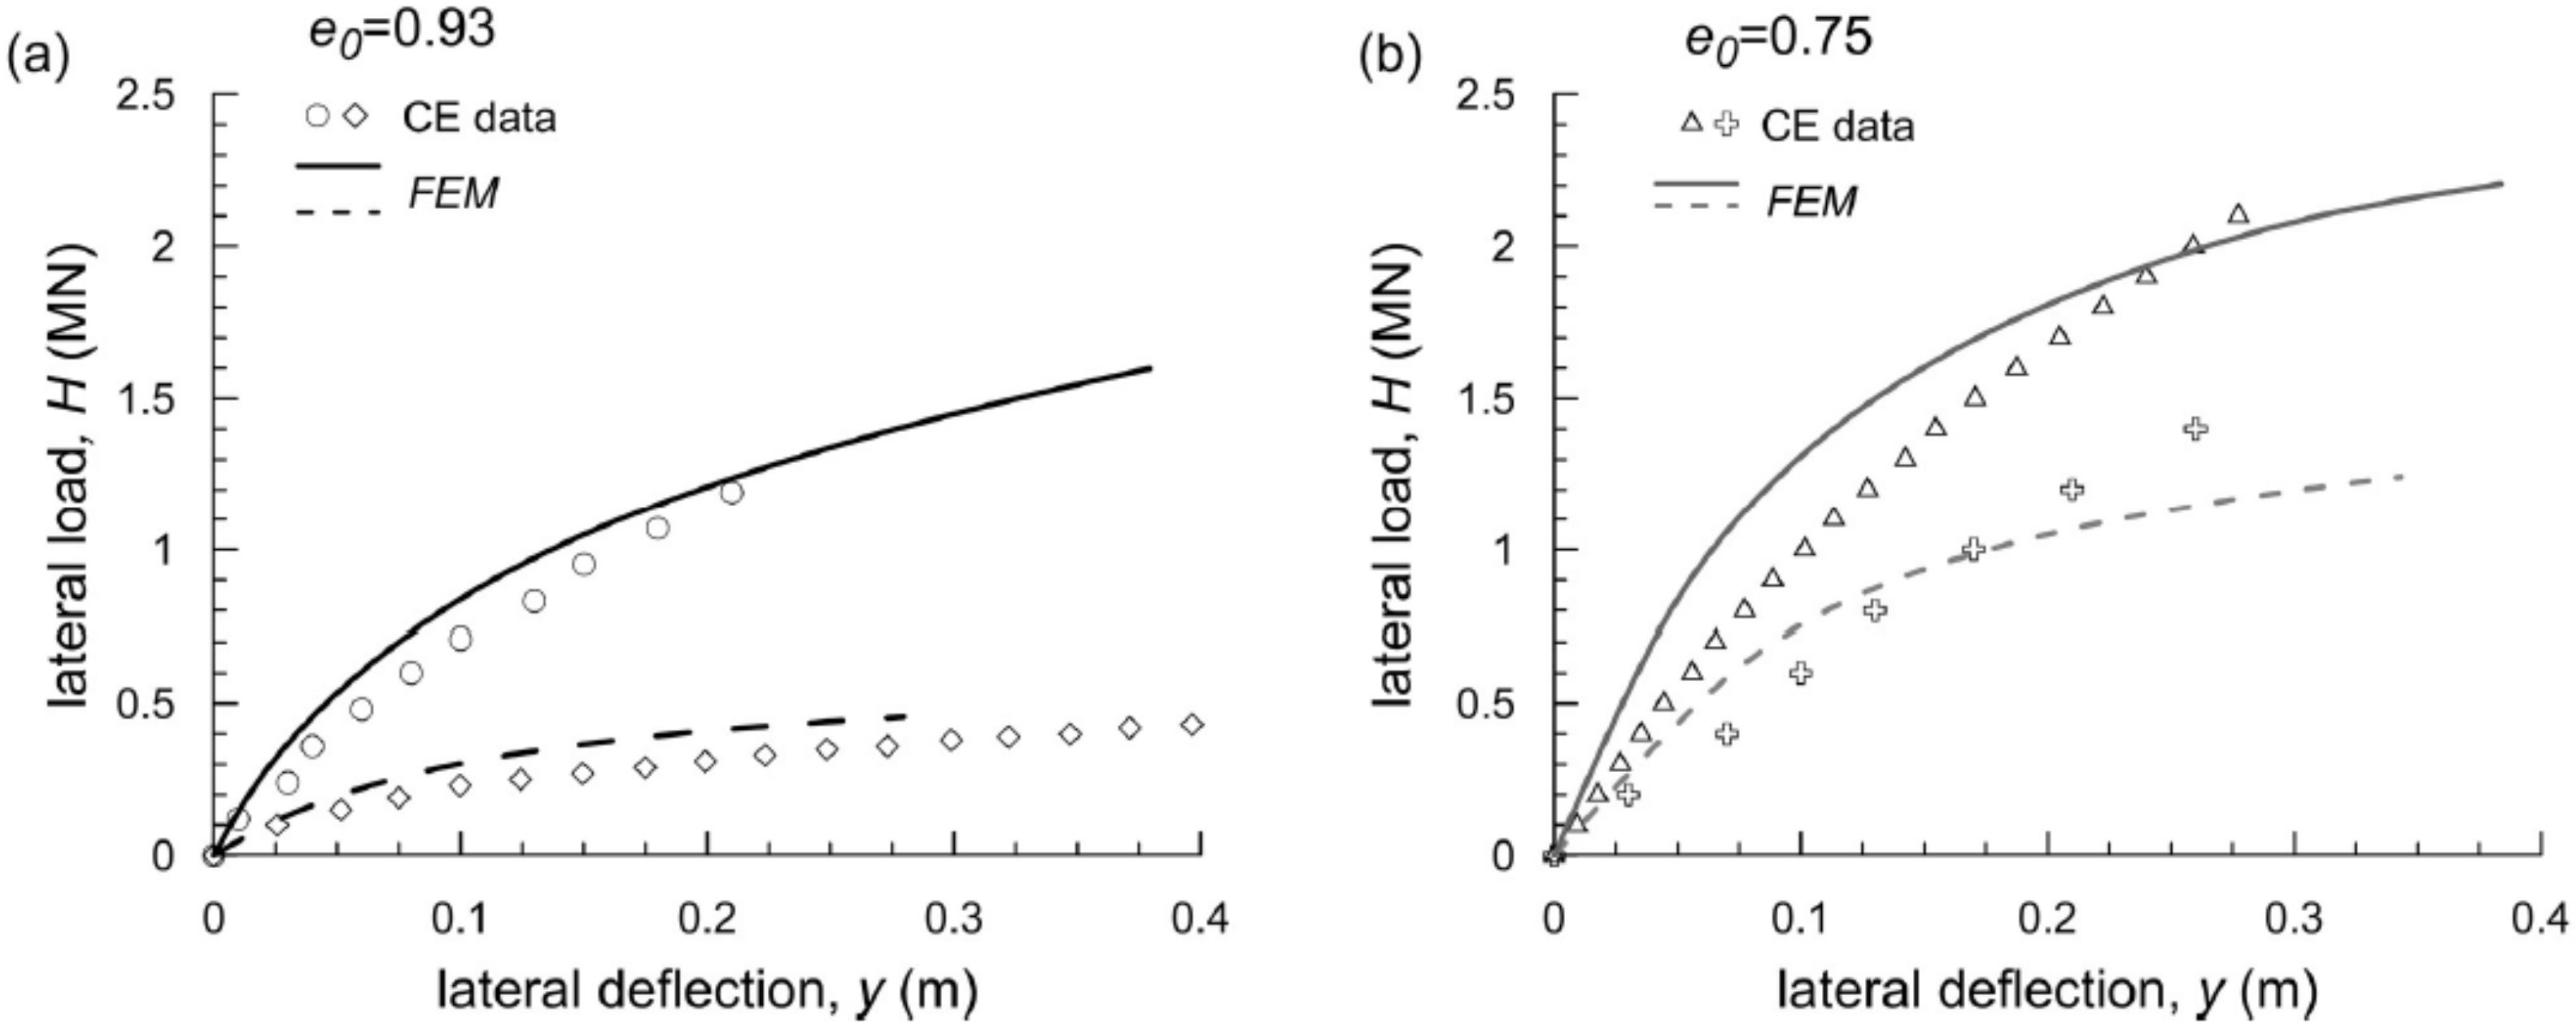
The comparison of the load-deflection relationships between experimental data (CE) and numerical predictions (FEM) is shown at the prototype scale in
Figure 6a,b for the loose and dense soil respectively. The model predictions are satisfying for the looser state over the entire range of displacements (
Figure 6a), while the model tends to overestimate the initial stiffness and underestimate the soil-yielding threshold load for the denser layer (
Figure 6b). From a qualitative point of view, the model correctly reproduces the increase in both stiffness and strength of the soil–pile system due to the presence of an unsaturated zone above the water table. As experimentally observed, the model points out that the effects of partial saturation reduce as void ratio decreases (i.e., with the increasing in stiffness of the saturated soil).
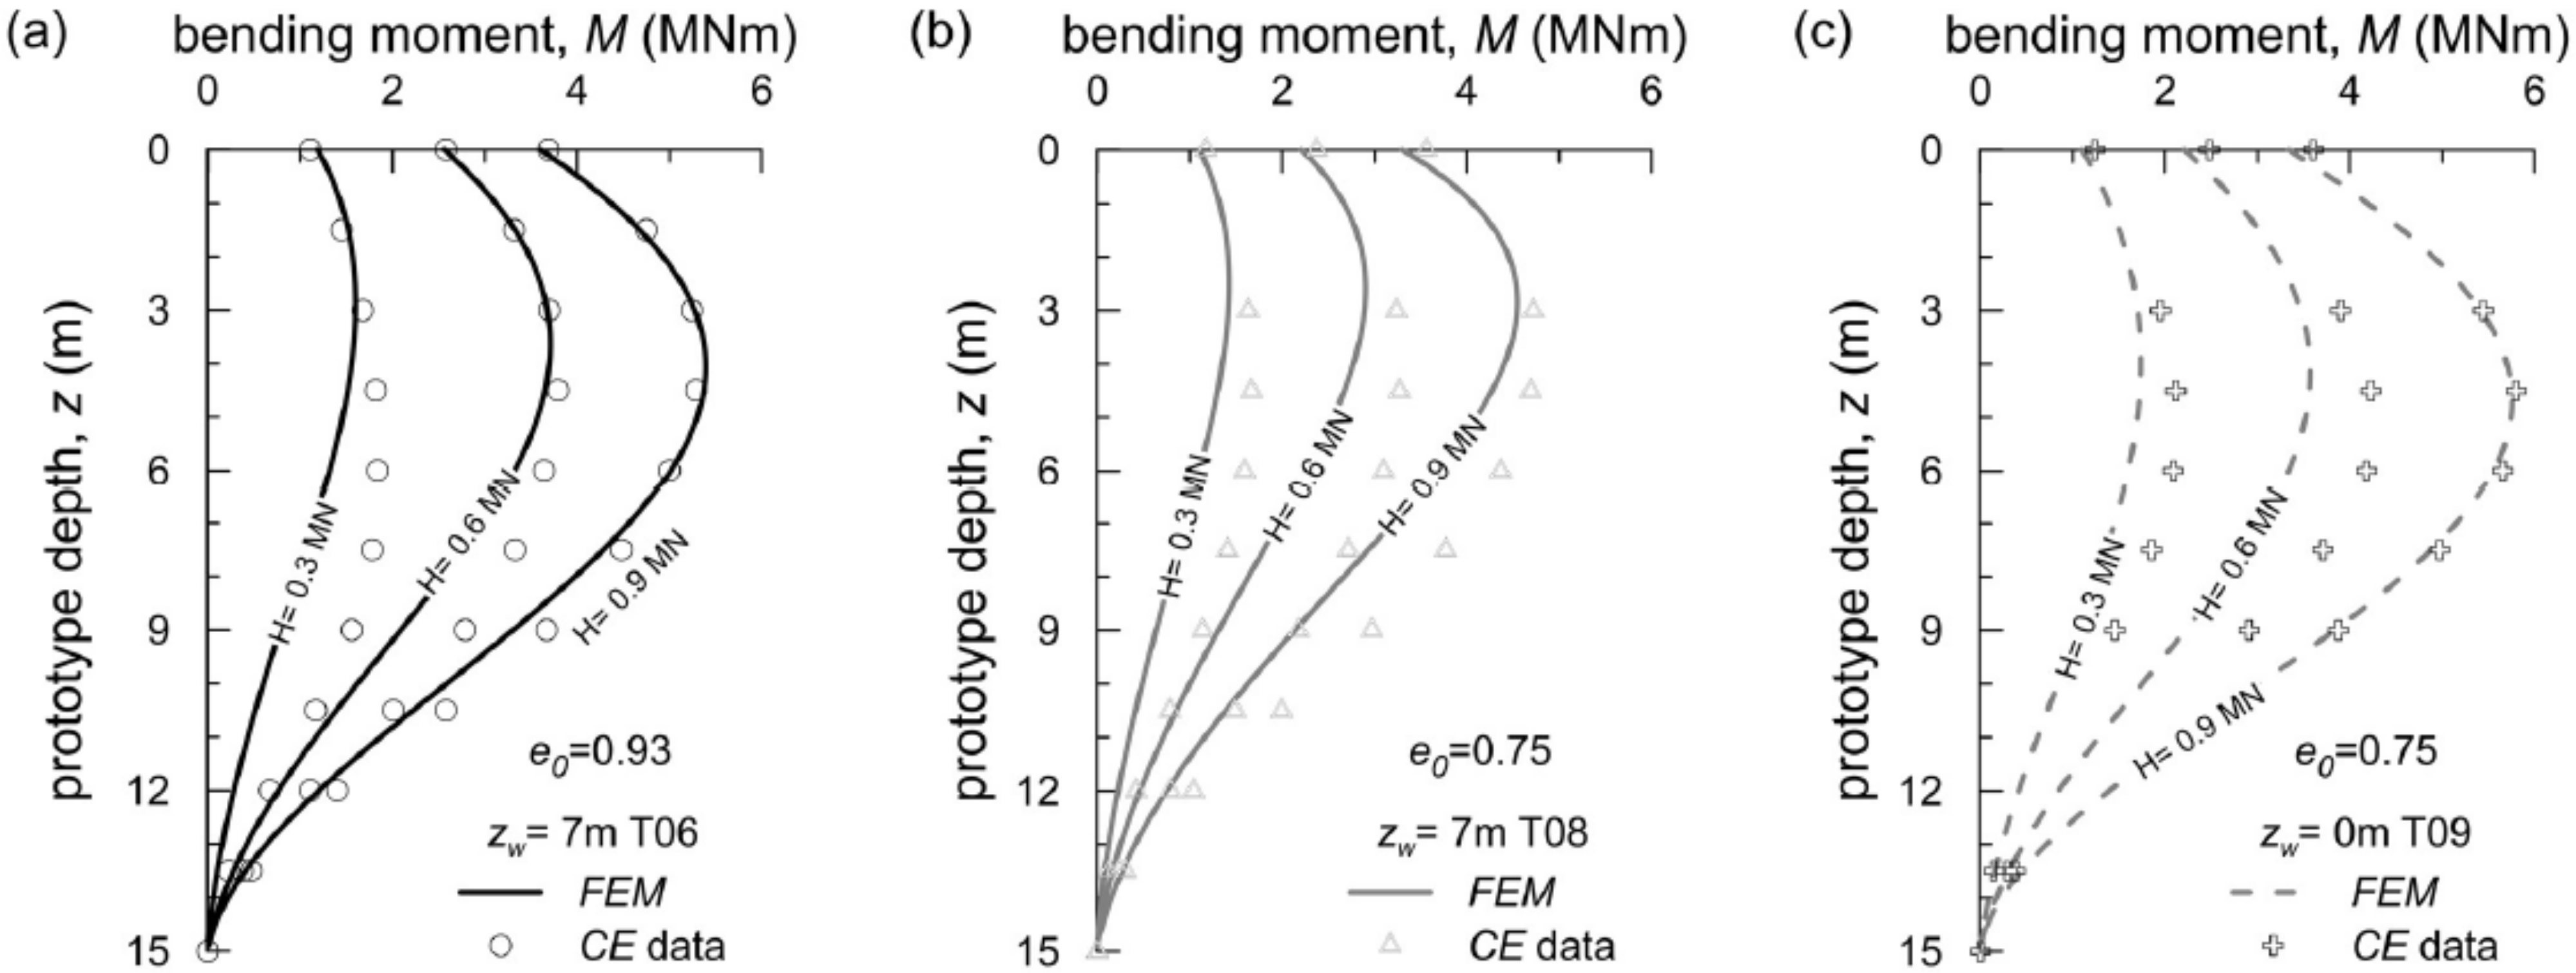
Figure 7 depicts the comparison between the experimental data and the model predictions in terms of bending moment distribution (
M) at different load levels (0.3, 0.6, and 0.9 MN) for the three tests where the measurements were available.
The model fairly reproduces the bending moment profiles at the different loading stages under unsaturated and saturated conditions with more satisfactory results for the normal consolidated case,
Figure 7a. At 0.3 MN of load, the model is more rigid of the data and the prediction of the shape of the bending moment curve is unsatisfactory, even though the value of the maximum moment is correct. The predictions improve as the external load increases. The maximum bending moment and its position well agree with the experimental data in this case.
Because of the overestimation of soil–pile initial stiffness for the dense soil (
Figure 6b), the model slightly underestimates the value of the maximum bending moment and its position along the pile depth,
Figure 7b,c.
5.2. Detailed Analysis of the NC Model
As may be expected, the model provides a better agreement with data in the loose soil cases, where the soil is essentially in a normal consolidated state. This is also the case where the effects of partial saturation are magnified. Consequently, a detailed analysis of the pile response is presented for these cases only (LS and LU) in the following section.
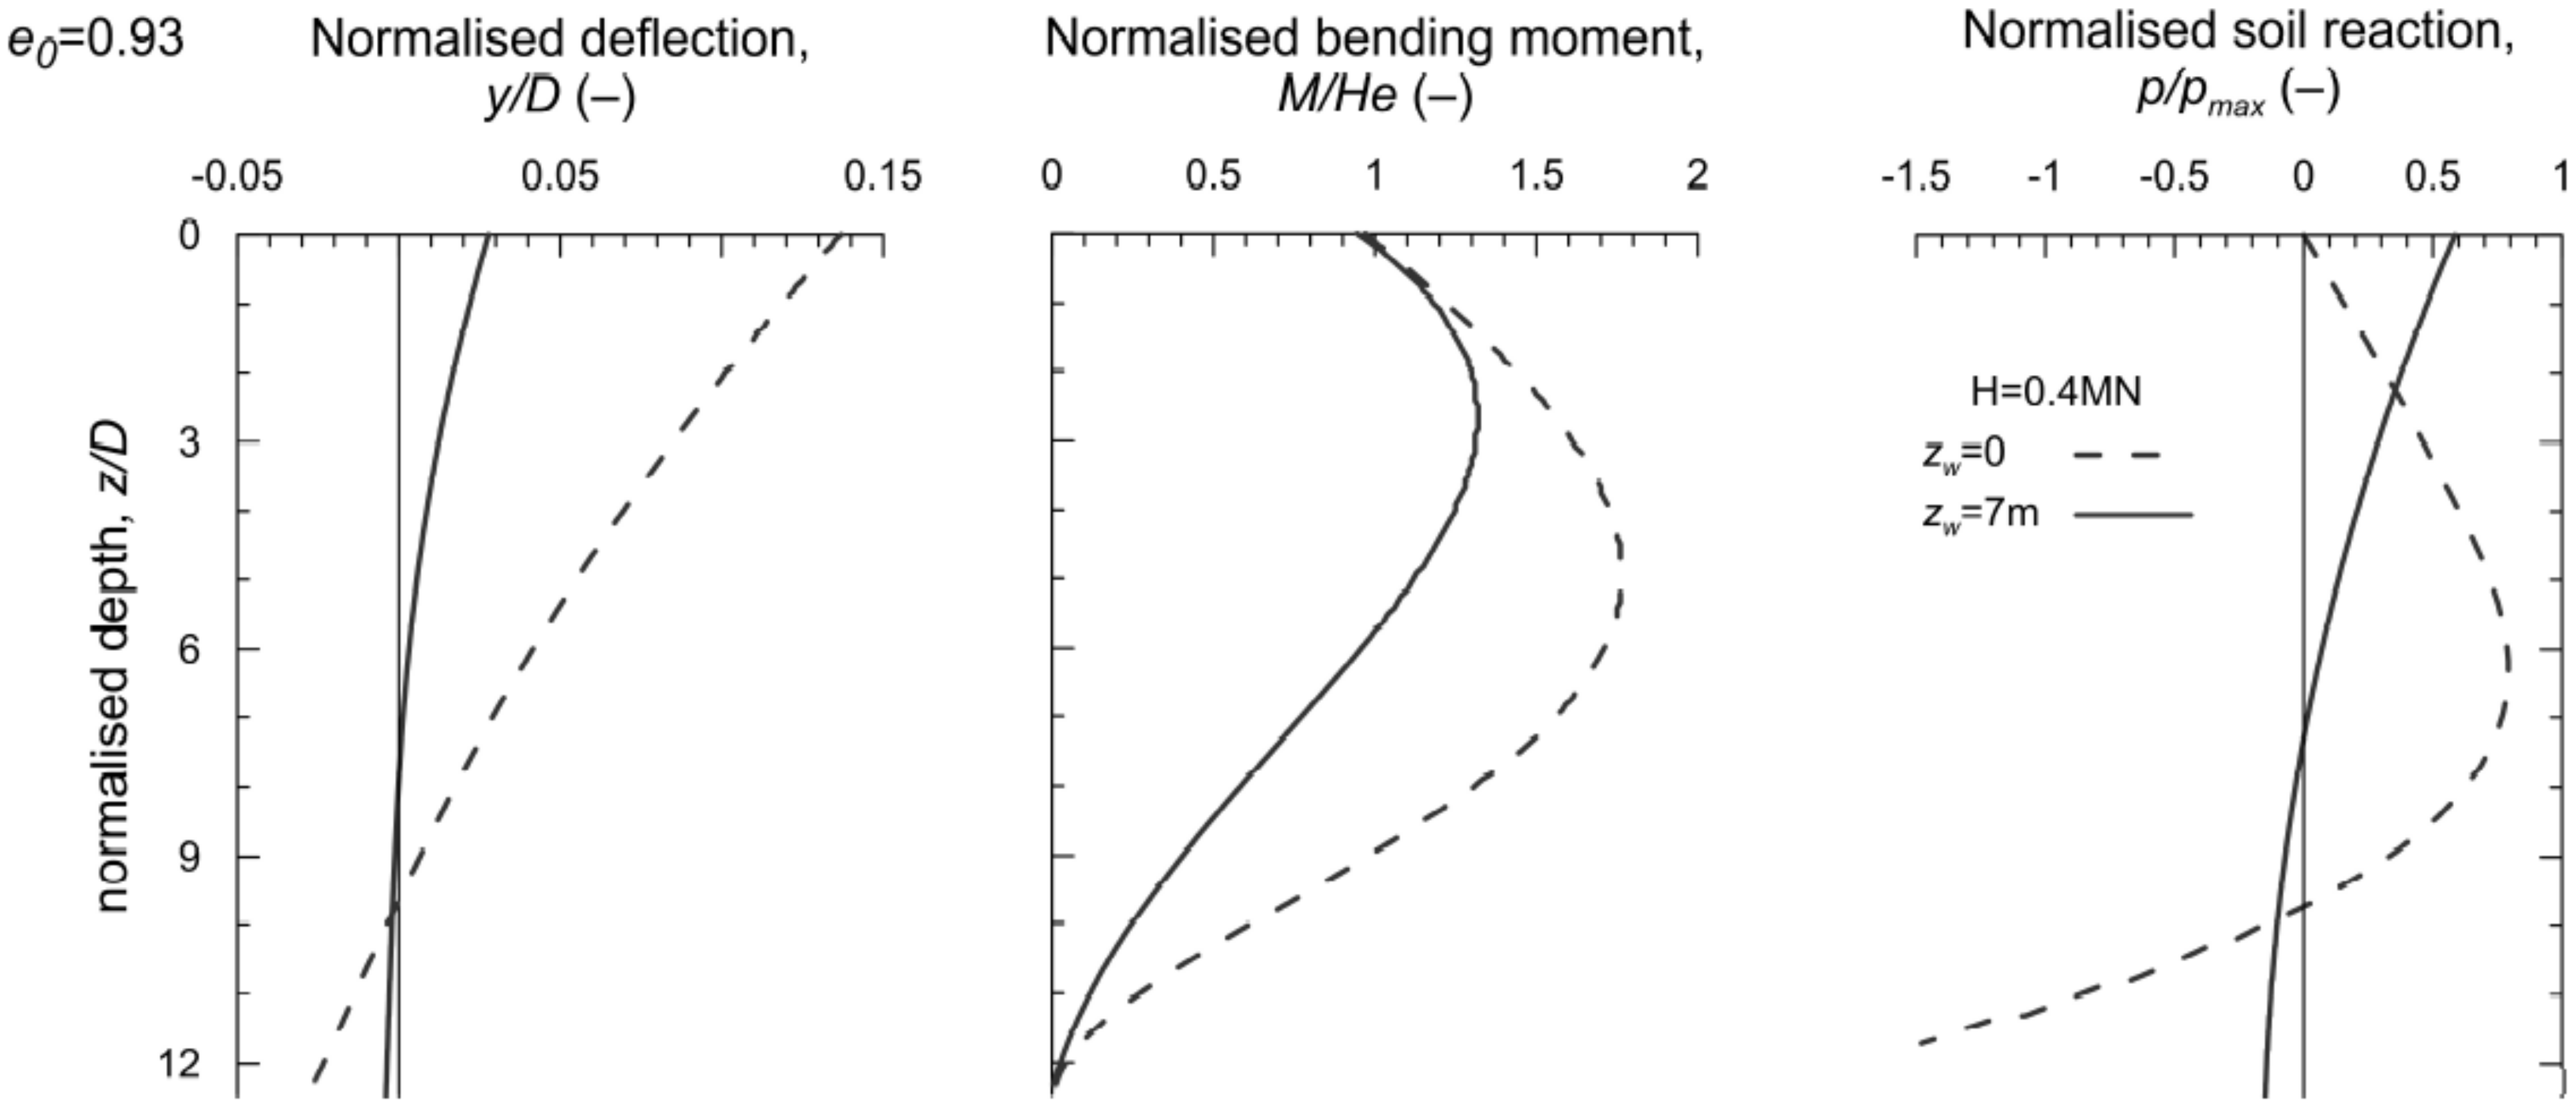
5.2.1. Global Pile’s Response
The pile response is further analysed by means of normalised profiles of deflection
y/
D, bending moment
M/
Hē (where
ē is the eccentricity of
H from the ground level), and the soil reaction
p/
pmax.
pmax is the maximum positive reaction calculated at
y/
D = 25% and identified as the failure condition. The comparison between the saturated and unsaturated conditions is presented in
Figure 8 for the load of 0.4 MN. While the deflection and the bending moment are direct output of the analysis, the soil reaction is obtained through the double derivation of the interpolating function of the bending moment. The accuracy of the result strongly depends on the class of the interpolating function and the number of points available for the calculation [
41]. In this study, a 5-intic spline is used to interpolate the bending moment profile over a 40-node beam. The validity of the calculation was verified by comparing the latter with the one resulting from the integration of the forces acting on the soil–pile interface for several loads, founding negligible differences (<2%) only for high loads.
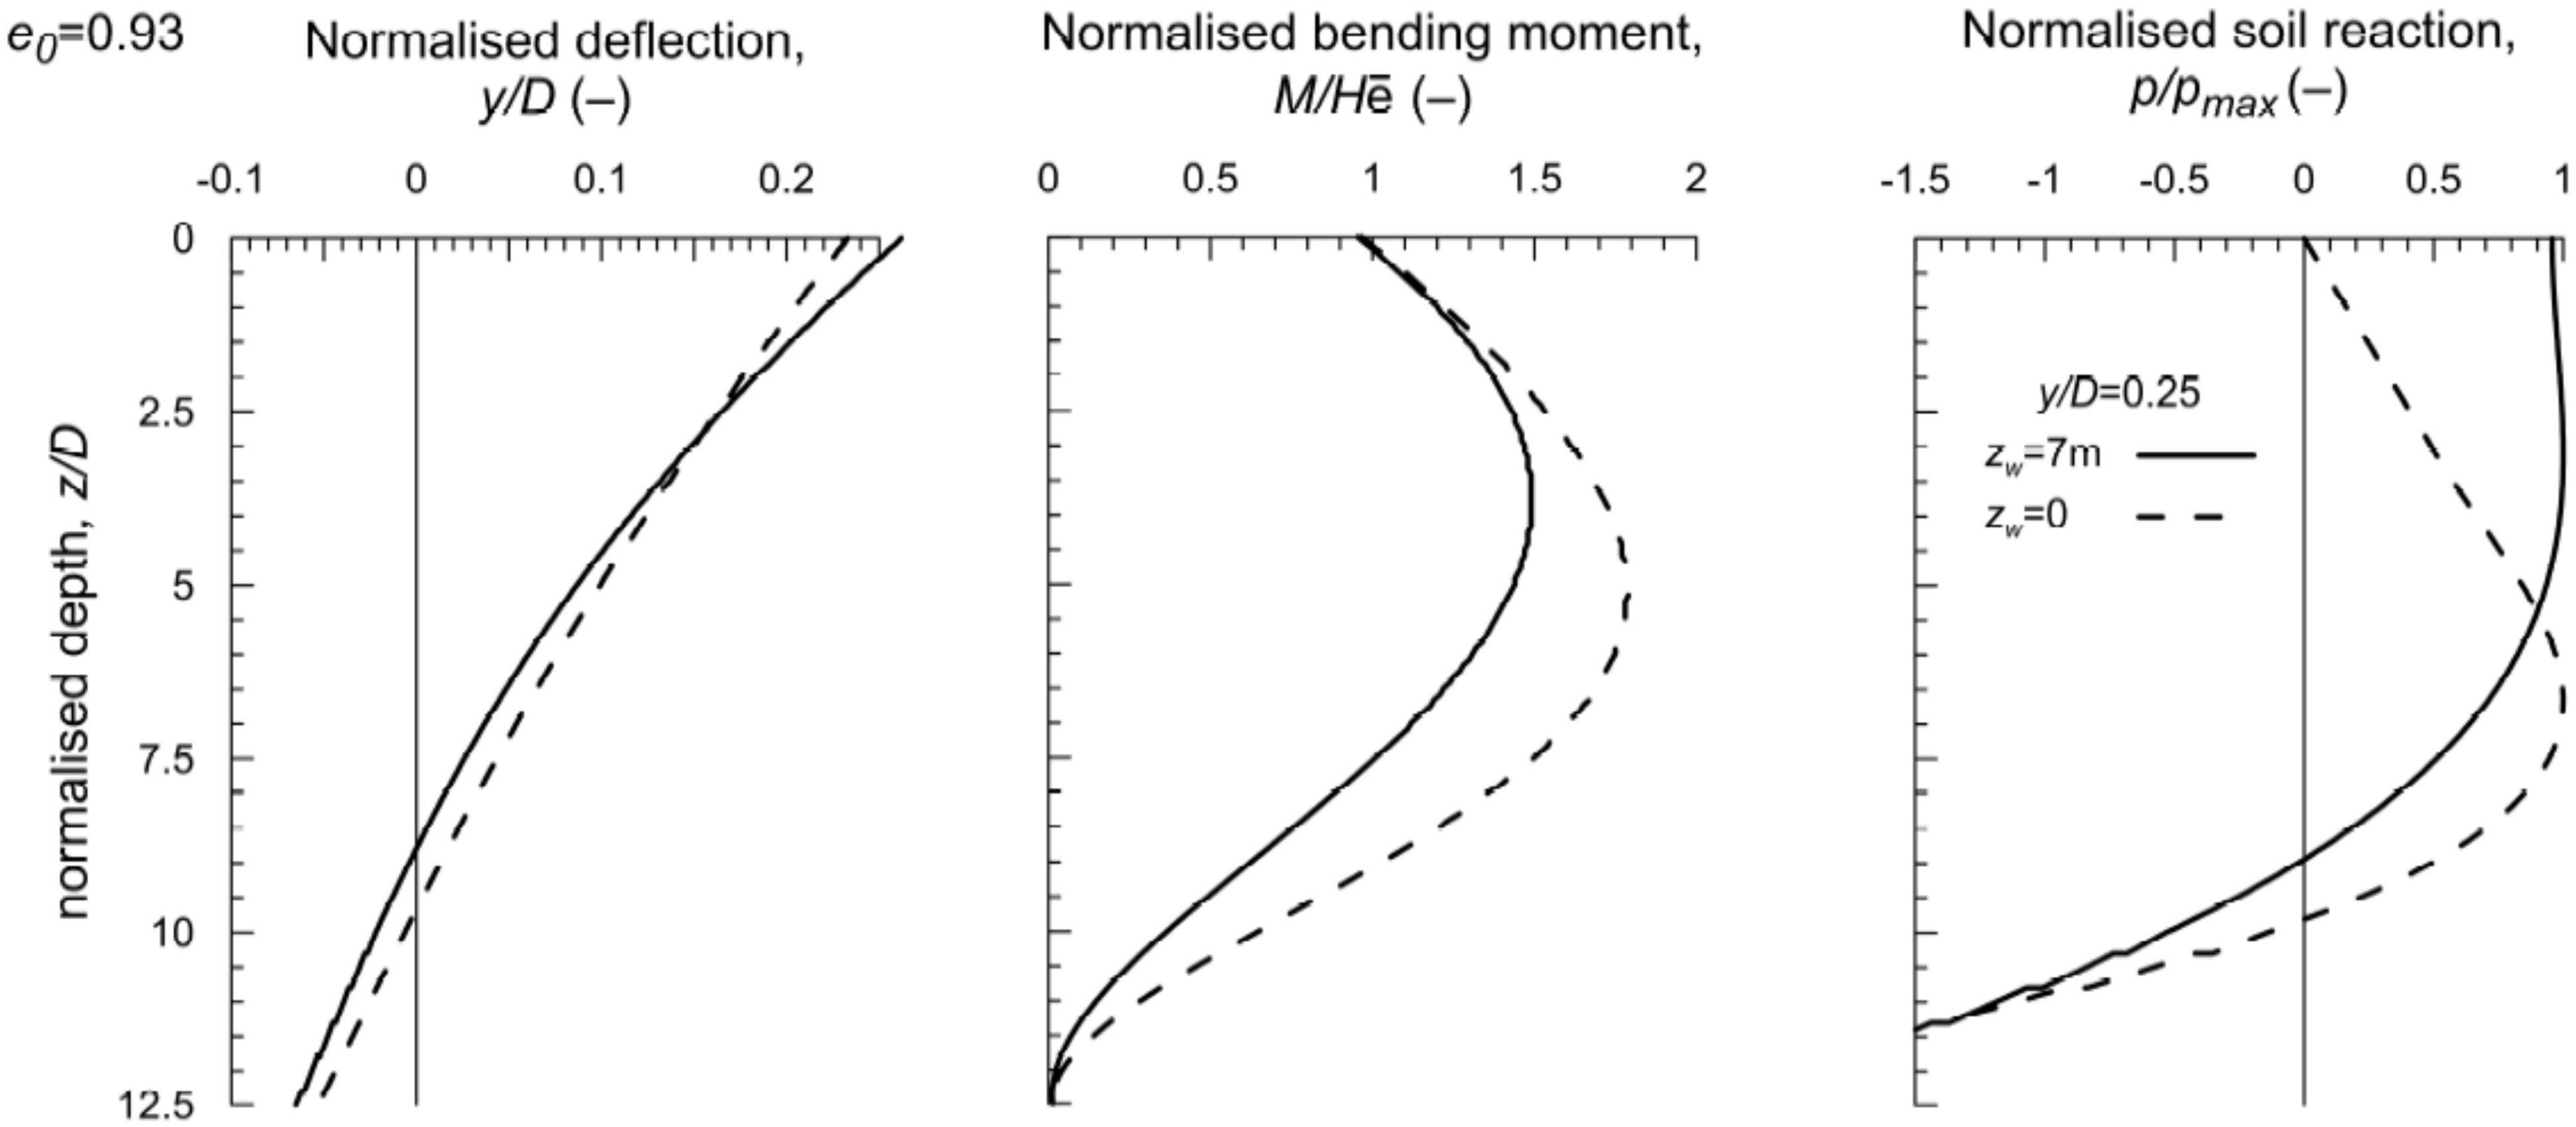
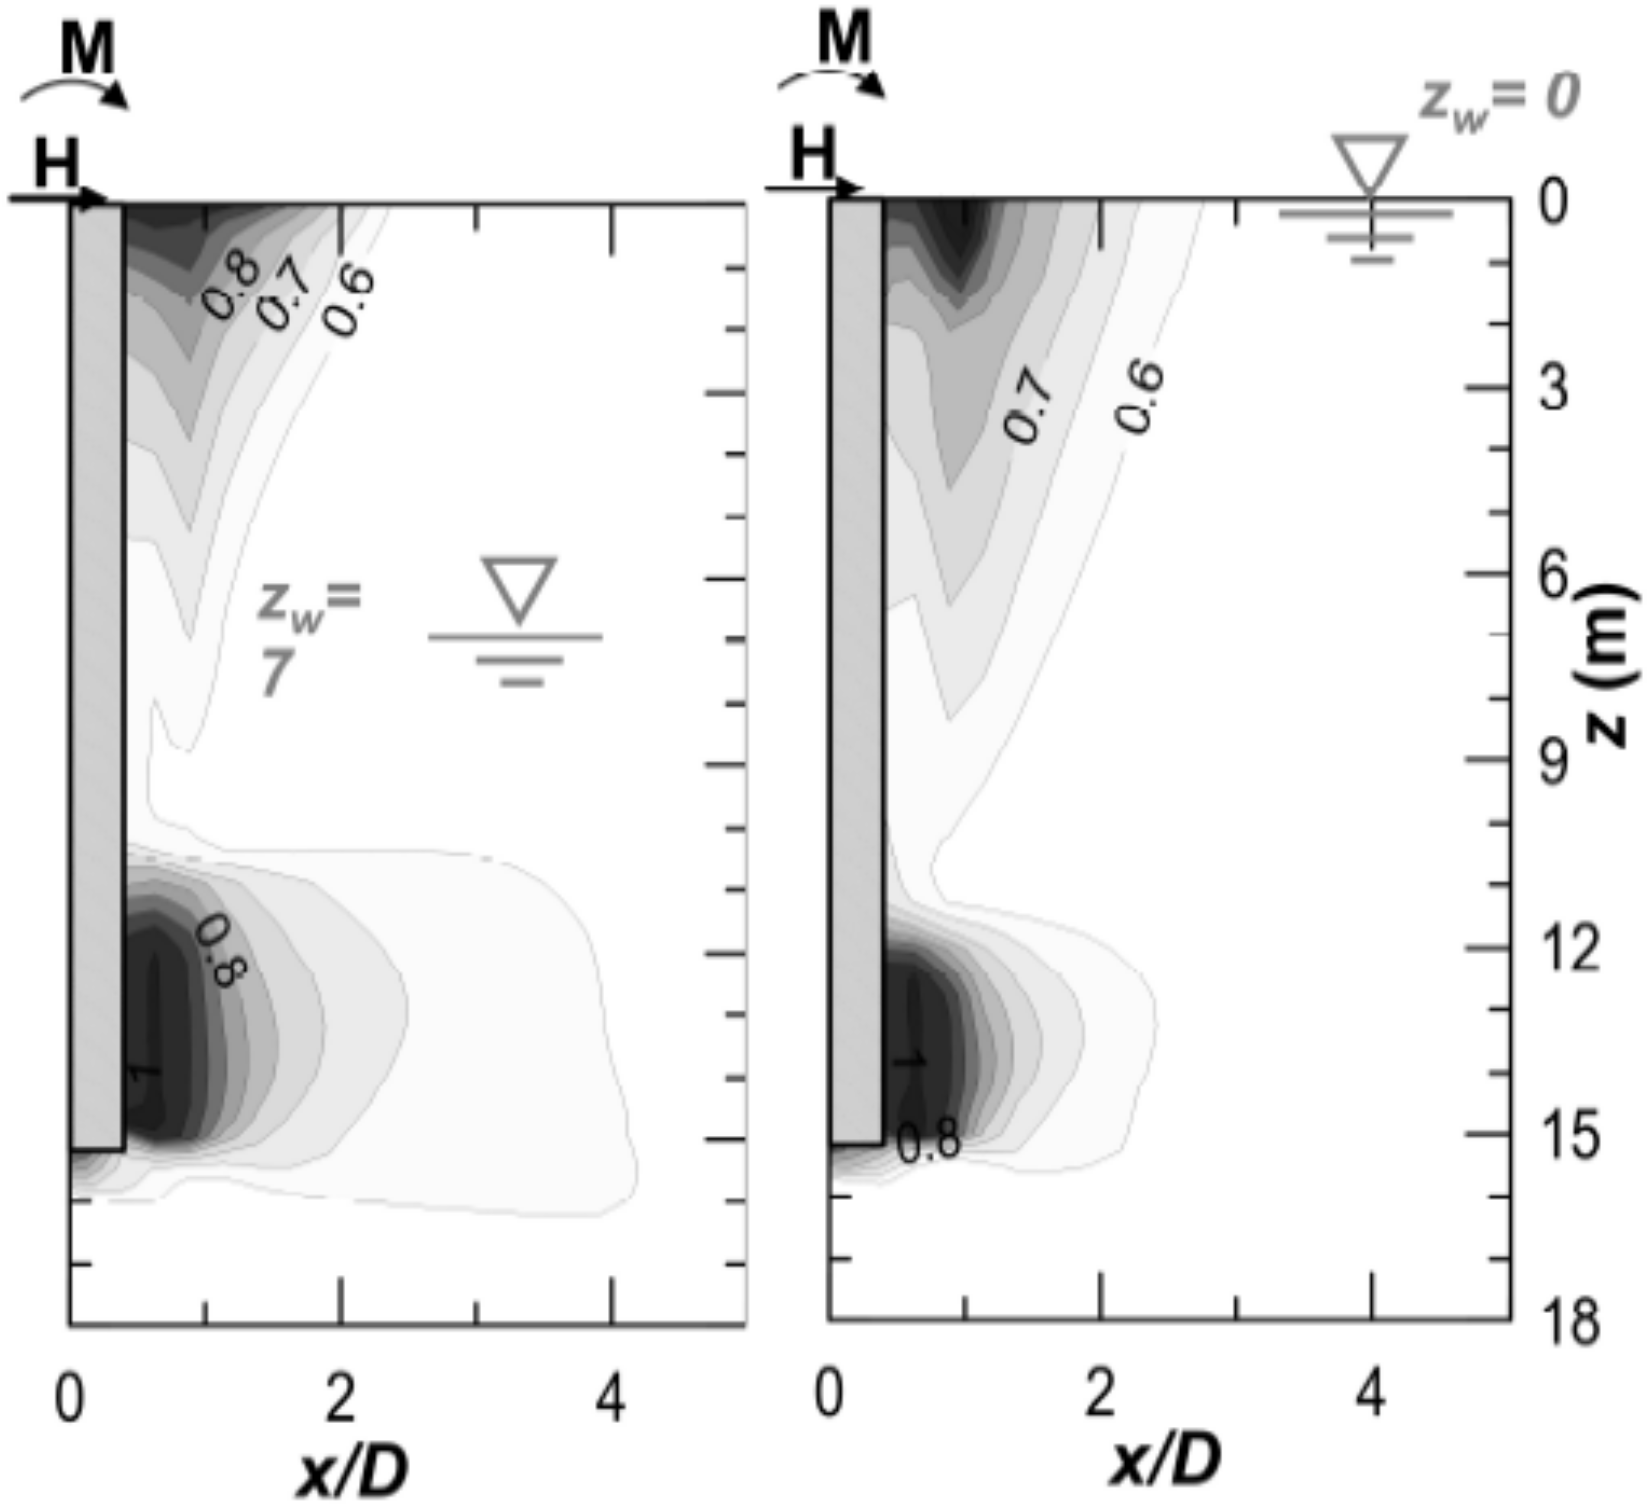
Moving from saturated to unsaturated conditions, the maximum bending moment reduces of approximately 32% and its position moves upward from 6 to 3.2 m from the ground level. This indicates a strong reduction in the significant soil volume involved in the soil–pile interaction. The soil reaction against the pile is very different in the two analysed scenarios. Indeed, under saturated conditions, the soil reaction assumes a null value at the ground level and it increases in depth up to the position of the maximum bending moment. Below this depth, it starts to decrease, changing sign at the rotation point at 10 m. Similar to the moment profile, the soil reaction involves the whole length of the pile, as expected for a very stiff pile in soft soils. On the contrary, in partial saturation regimes p/pmax is maximum at the ground level and then plummets to zero moving downward, as a consequence of effective stress states far from being null at the ground surface. The deflected shape of the pile is affected by the position of the water table. When the shallower layer is in unsaturated conditions, the horizontal displacements at the pile tip are small and the deflection occurs in the upper part of the pile. Conversely, in fully saturated conditions, the rigid rotation (at a depth of approximately 11.5 m) must be added to the lateral deflection giving values of displacement greater than those obtained under unsaturated conditions.
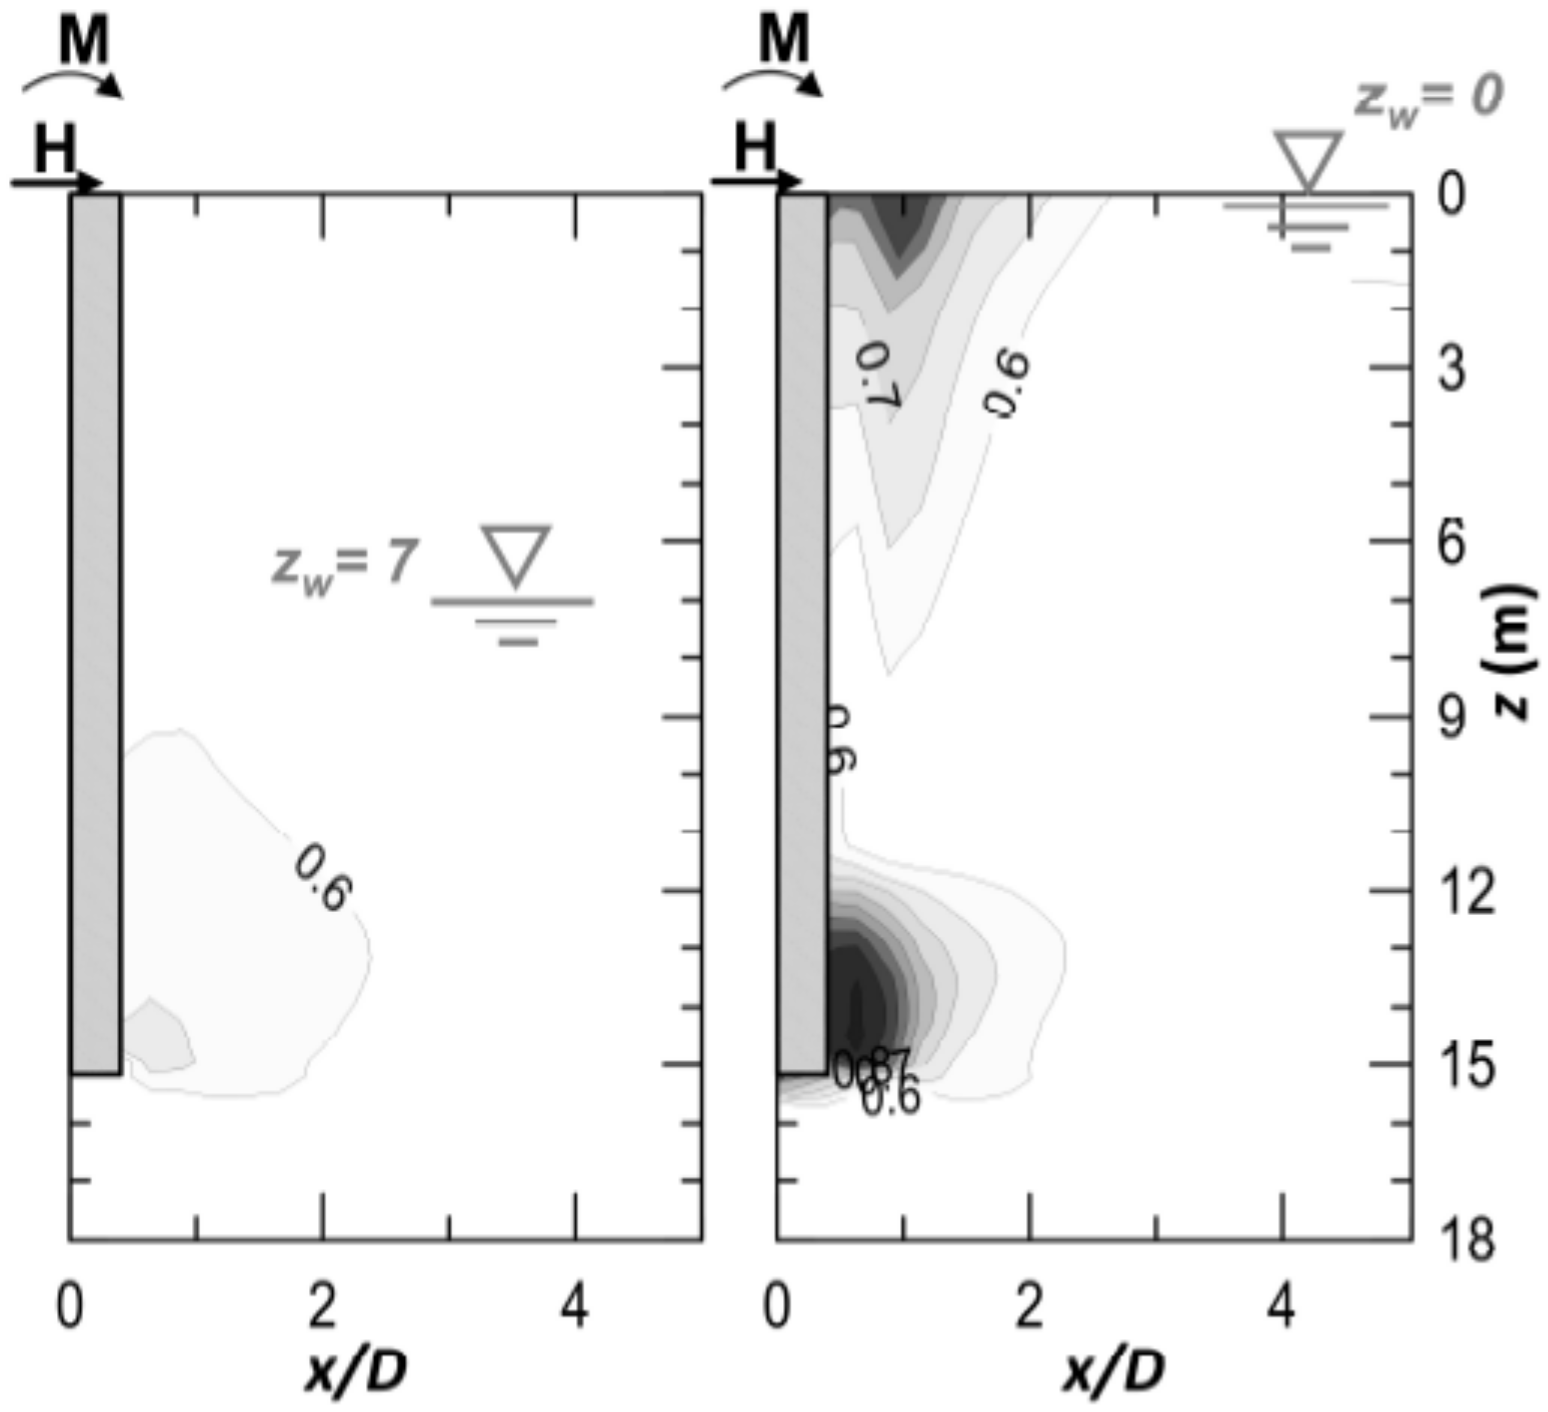
The partial saturation increases the yielding threshold of the material; thus, at the same external load, plastic strains and mobilised shear strength are smaller compared to those obtained under saturated conditions. A representative case is reported in
Figure 9, in terms of isocontours of the mobilised strength
q/
qmax (
q is the deviatoric stress and
qmax is the maximum deviatoric stress attainable at the current
p′) with depth
z and distance
x/
D for a horizontal load
H = 0.4 MN. The mobilised strength in the upper part of the soil layer under unsaturated conditions is negligible, whereas, under saturated conditions, a significant concentration of
q/
qmax is depicted near the ground surface that propagates towards the rotation point.
The pile response at large displacements (
y/
D~0.25) is analysed in
Figure 10. In both saturated and unsaturated conditions, the pile undergoes almost a rigid body motion. Indeed, the change in the strength distribution into the soil due to partial saturation is not able to modify the failure mechanisms at elevated horizontal displacements, as demonstrated by the contours of the mobilised strength in
Figure 11. It is worth noting that the external force is very different in the two cases; indeed, under unsaturated soil conditions, this is approximately three times higher than that obtained in the saturated case. It is imperative to properly take into account the significant differences in the soil reaction. Under unsaturated conditions,
p/
pmax is almost constant and equal to the maximum value up to
z = 6 m and then reduces with depth, identifying a null value at a depth of ~11 m. For
zw = 0 the reaction is similar to that observed in
Figure 8 with
H = 0.4 MN, which was very close to failure, as shown in
Figure 6.
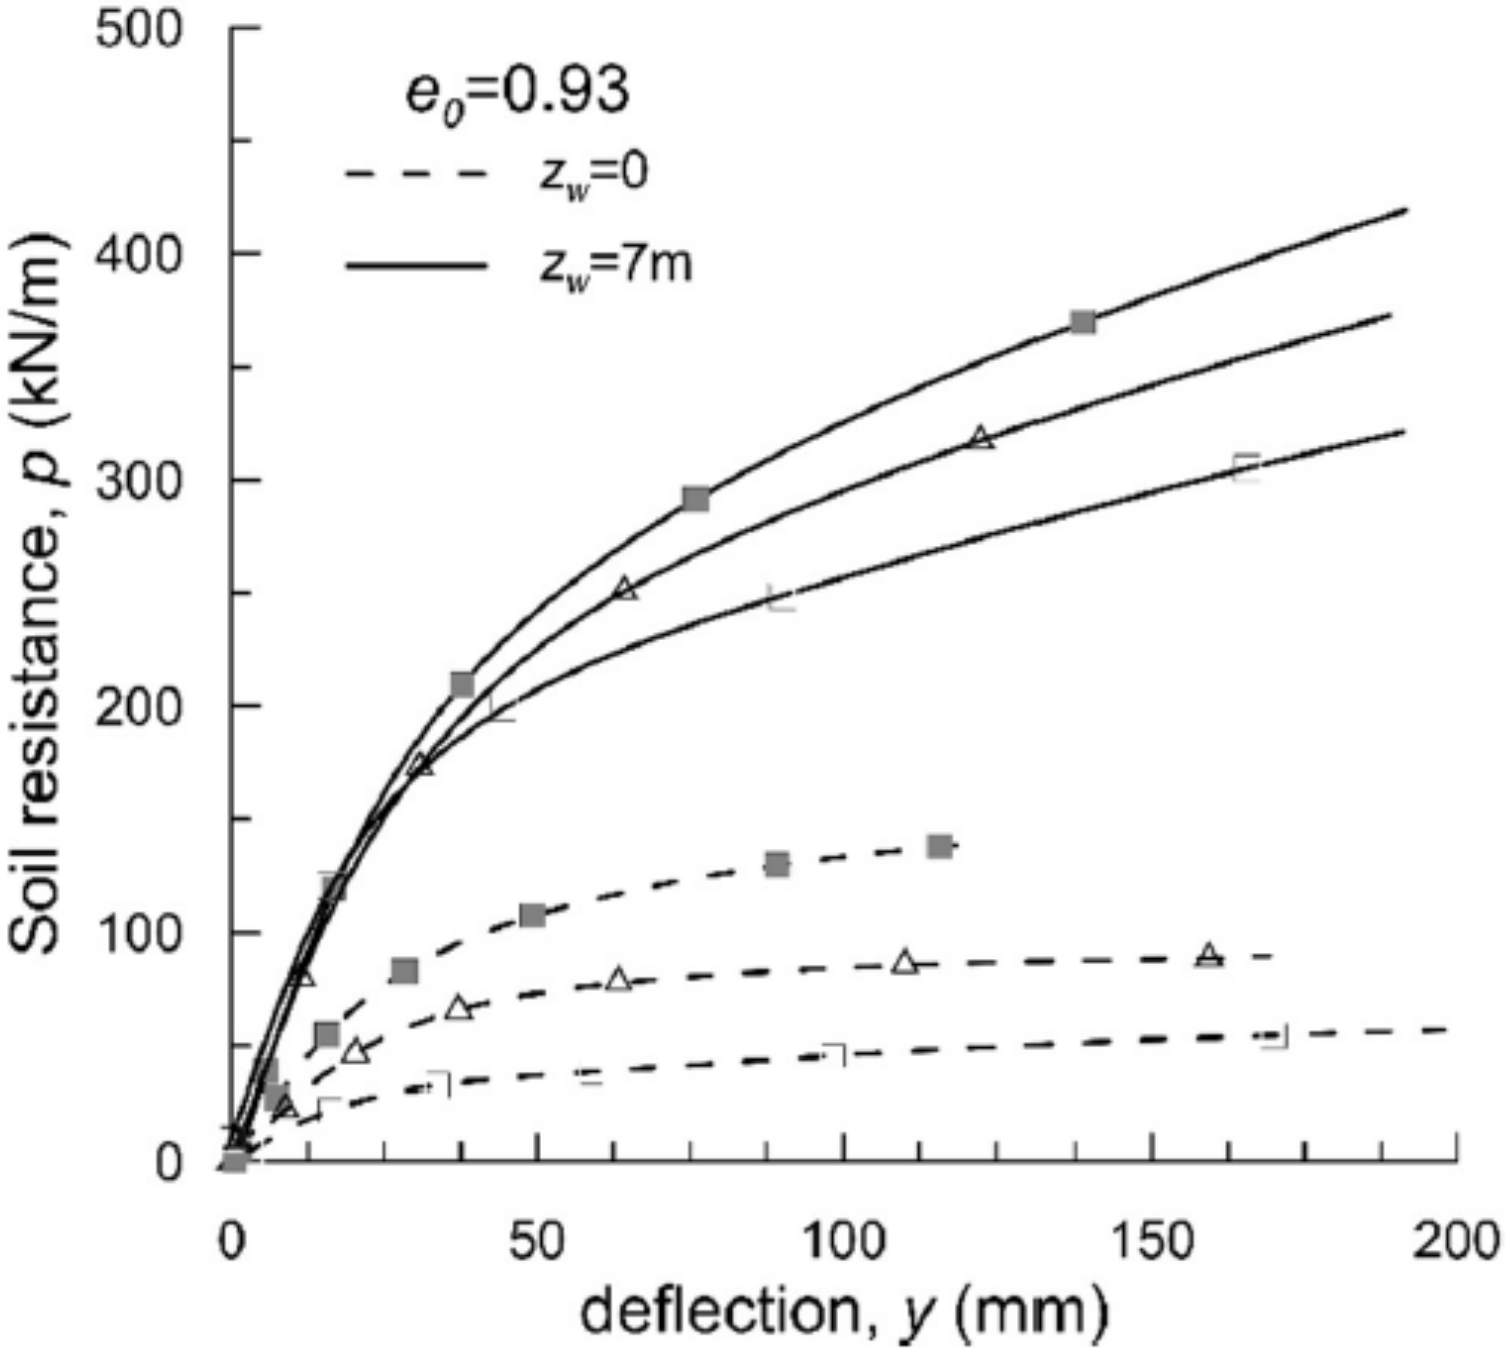
5.2.2. p-y Curves>
The numerical
p-y curves at different depths (
z = 2, 4, and 6 m) are presented in
Figure 12 for the saturated and unsaturated soil conditions. For any given displacement, the soil reaction is higher under unsaturated soil conditions than that obtained for
zw = 0. When
zw = 7 m, the curves yield for higher displacement and loading values compared to the saturated case, at any depth
z. In the displacement’s range investigated, the soil reaction keeps increasing in the unsaturated soil while it is close to the ultimate values in the other case.
5.3. Comparison with Literature Solutions
Historically,
p-y curves represent the most used method to compute the pile response under lateral loading. Assuming a Winkler formulation for the soil, several authors provided the definition of the subgrade modulus
K, the ultimate soil resistance
pu, or the shape of the
p-y relationships to be used depending on the characteristics of the soil surrounding the pile [
42,
43,
44,
45,
46,
47]. In this study, a simple hyperbola was used to fit the
p-y curves as suggested by several researchers [
48,
49]. Employing this procedure,
K and
pu are automatically provided for every elevation of the pile.
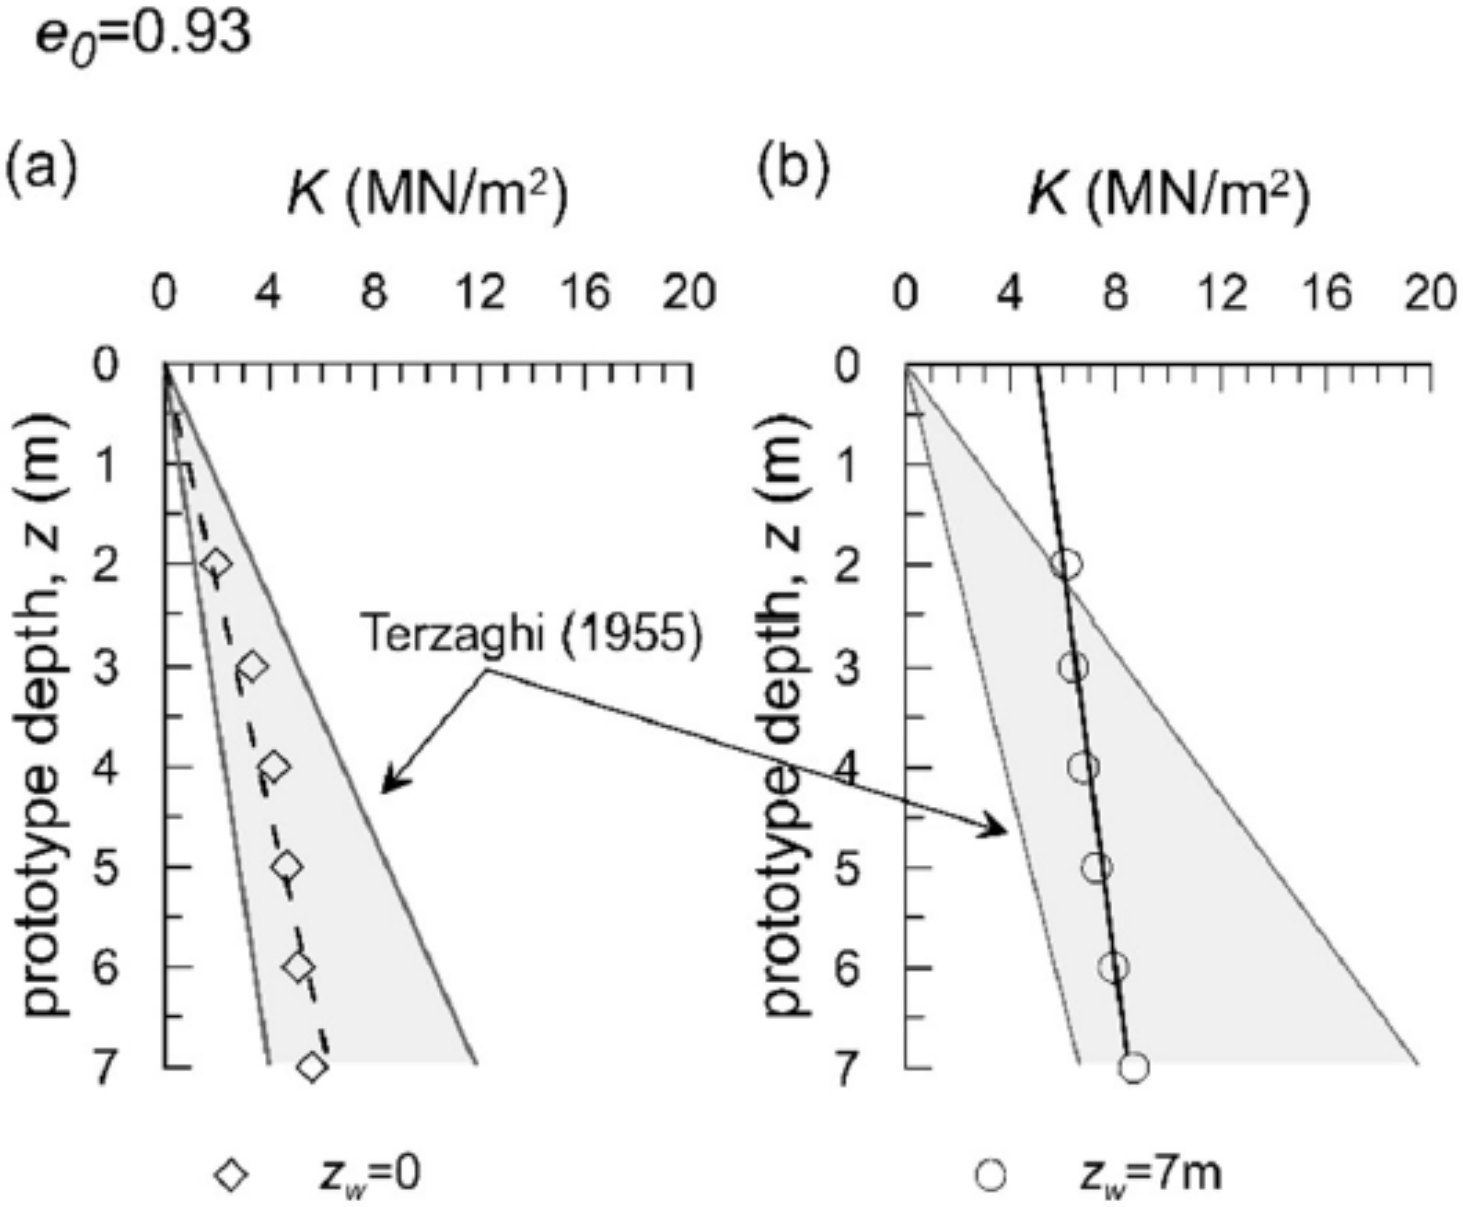
Results are presented in
Figure 13a,b and
Figure 14a,b as function of the water table position, together with the solutions usually adopted in the literature. As the loading was a drained event, the comparison is made with the solutions formulated in terms of effective stresses parameters.
As may be expected, for the saturated soil the distributions of
K and
pu linearly increase with depth starting from null values at the ground surface. The unsaturated soil exhibits significant stiffness and strength values even at
z = 0, which slightly increase with depth. Differences between the two trends tend to reduce with depth as suction decreases. In terms of stiffness, the results for
zw = 0 lie within the range suggested by Terzaghi [
42],
Figure 13a. In the unsaturated case,
zw = 7 m in
Figure 13b, the experimental results fall in the range identified by
ibid for all the depth presented although in the shallower layer,
z ≤ 2 m, the fitting trend is different. However, it is worth noticing that instead the stiffness distribution is very different from the one provided by
ibid. Terzaghi [
42] adopted two linear trends increasing with the total stress applied. The result obtained within this work shows a small increase in stiffness with depth because the total stresses increment is balanced by the progressive increase in the degree of saturation with
z, approaching the water table.
For
zw = 0 (
Figure 14a), the solutions of Broms [
50] and Reese et al. [
45] overestimate the limiting pressures distribution as the Broms’ solution is strongly conservative [
51].
For
zw = 7 m (
Figure 14b), adopting the classical assumption of dry soil above the water table (unit weight γ = 18 kN/m
3), the literature solutions fail to predict the limiting pressure both in qualitative and quantitative terms. In particular, they underestimate the soil resistance in the shallower depth and overestimate it approaching the position of the water table. Adopting the Bishop’s effective stress, the capability of the literature solutions improves even in unsaturated conditions; although, the gradient is still too high.
6. Influence of Partial Saturation on Different Type of Piles
The numerical model is able to capture the main effects of the soil partial saturation on the pile’s response experimentally observed. The comparison is particularly satisfying for normal consolidated soils. The centrifuge tests were, however, limited to one type of pile and one position of the water table. With the confidence gained in the numerical model, and without the ambition to present a complete parametric study which is beyond the scope of this work, an additional set of analyses is carried out to extend the discussion on the influence of partial saturation on the pile’s response.
The geometry, the soil properties and state (loose soil:
e0 = 0.93) as well as the hydraulic conditions are the same of the centrifuge tests described above. The flexural rigidity of the pile,
EpIp, is varied from 10
4 to 10
7 kN·m
2. This very wide interval covers the most common types of piles used in practice from the tubular steel piles to the concrete solid piles [
52,
53], and includes also the pile tested in the centrifuge by Lalicata et al. [
12] that had a flexural rigidity of 3.9 × 10
6 kN·m
2.
The response of the pile is summarised using the following parameters:
H/y, the stiffness of the load-deflection curve;
Mmax, the maximum bending moment Mmax;
zmax, the position of Mmax;
Lc, the critical length.
All these parameters are evaluated at a small displacement level, such as
y/
D = 1%, which may represent the working load conditions, Price and Wardle [
54].
The secant stiffness calculated for the saturated and unsaturated soil conditions is plotted in
Figure 15a against the flexural rigidity of the pile. In both cases, the stiffness increases with
EpIp and it is always higher under unsaturated soil conditions than under saturated conditions. For
zw = 0 m, the soil–pile stiffness is progressively less affected by the
EpIp variations when this is higher than 1 × 10
6 kN·m
2, denoting the tendency to a rigid behaviour of the pile; this threshold may move forward to
EpIp > 6 × 10
6 kN·m
2 for
zw = 7 m. The increase in secant stiffness (ISS) due to partial saturation may conveniently be expressed by:
where the subscripts
“unsat” and
“sat” are for
unsaturated and
saturated soil conditions, respectively. ISS values, presented in
Figure 15b, clearly highlights how the effects of partial saturation increase for decreasing values of
EpIp, i.e., long piles. When
EpIp > 6 × 10
6 kN·m
2 and the pile behaviour switches from long to short, the increase in the secant stiffness is minimum, although still remarkable (+200%), and it is independent from
EpIp. It is worth noting that the pile tested in the centrifuge by Lalicata et al. (2019) represents a lower bound of the beneficial effects of the partial saturation on the pile response.
The normalised maximum bending moment is reported in
Figure 16 in function of
EpIp. The trend is somehow similar to that of the secant stiffness in
Figure 15: the maximum bending moment increases with
EpIp and the gradient reduces when the pile behaves as a short pile. For
zw = 7 m the maximum bending moment is always smaller than that measured for
zw = 0. The reduction in the maximum moment due to partial saturation, defined likewise as the increase in the secant stiffness, is practically constant and equal to 20% in the explored
EpIp range.
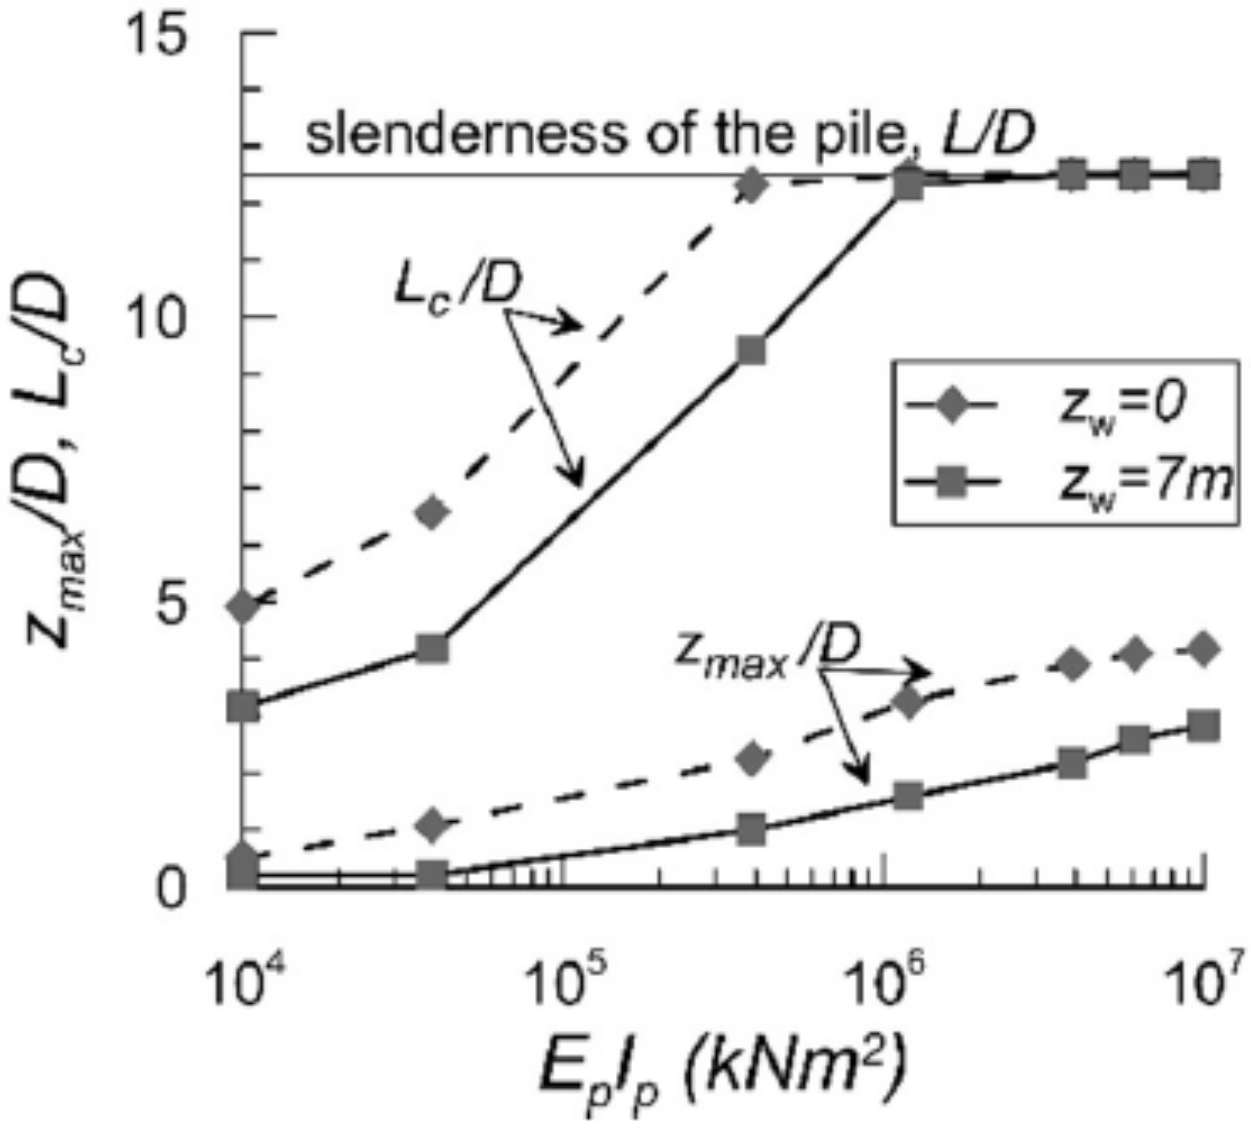
The critical length
Lc is the portion of the pile that reacts to the perturbation applied at the pile head, thus identifying the significant volume of soil involved by the pile deflection. Randolph (1981) defines
Lc as the depth where the bending moment is zero. Consequently, a flexible (or infinitively long) pile is a pile that has a total length, or more correctly a slenderness ratio
L/
D, higher than the critical slenderness of the pile
Lc/
D. Using
Lc following Randolph’s definition,
Figure 17 shows that under unsaturated soil conditions the critical slenderness ratio is always lower than that observed for
zw = 0 and that the pile behaves as a flexible pile for a wider range of
EpIp. The normalised position of the maximum bending moment,
zmax/
D, varies accordingly with
Mmax and, under unsaturated soil conditions it moves toward the ground surface of 1–2 diameters.
7. Concluding Remarks
A three-dimensional numerical model is developed to study the behaviour of piles under lateral loading in unsaturated soil conditions. The soil stress–strain response is described by the modified Cam Clay model extended to unsaturated conditions and the water retention properties are represented with the modified Gardner’s model. Both models are calibrated against laboratory data in saturated and unsaturated conditions at different water contents and void ratio.
The model is validated against the centrifuge tests results of Lalicata et al. [
12]. The comparison between model predictions and experimental data is satisfactory for normal consolidated soils under saturated and unsaturated conditions.
With the confidence gained by the model validation, the following findings may be highlighted with reference to normal consolidated states:
The model correctly captures the increase in stiffness of the pile response due to unsaturated conditions.
The value of the maximum bending moment is in agreement with the data. At small load levels, the computed bending moment profile denotes a slightly stiffer response than that experimentally measured. The prediction improves as the external load increases.
The magnitude and the shape of the soil reaction profiles against the pile are substantially influenced by the unsaturated zone.
The parameters of the p-y curves, namely, the initial stiffness and the ultimate capacity, depend on the suction level of the soil. Under unsaturated soil conditions, those parameters start from high values at the ground level and then slightly increase with depth.
Besides the increased stiffness and strength of the unsaturated soil, in this case, the improved performance of the pile also depends on the plastic strains and mobilised strength levels. For any external load applied, these factors are always smaller under unsaturated conditions.
At small displacement level (1%D), the following conclusions apply:
The impact of partial saturation on the pile response increases for flexible long piles. When the pile is short and almost rigid, the increment in the secant stiffness of the load deflection curves is minimum but still notable (+200%).
The reduction in the maximum bending moment (20%), due to unsaturated conditions, is less affected by the flexural rigidity of the piles.
The unsaturated shallower layer reduces the critical length and the depth of the maximum bending moment.
This study demonstrated the validity of the numerical model in capturing and detailing the response of laterally loaded piles in unsaturated soils. This model can be then adopted to carried out a more complete parametric study varying, for instance, the water table depth, the water retention properties of the soil, the pile head’ fixity and its stiffness.
The study also demonstrated that the methods currently used to design the piles (i.e., p-y curves) turn out to be inadequate when trying to describe the unsaturated soil reaction against the pile. Consequently, additional experimental and numerical research is needed to fill this gap in the actual knowledge.
Author Contributions
Conceptualization, L.M.L., G.M.R., A.D. and F.C.; data curation, L.M.L. and G.M.R.; formal analysis, L.M.L. and G.M.R.; investigation, L.M.L. and G.M.R.; methodology, L.M.L.; project administration, A.D. and F.C.; software, L.M.L. and G.M.R.; supervision, A.D. and F.C.; visualization, L.M.L. and G.M.R.; writing—original draft, L.M.L.; writing—review and editing, L.M.L., G.M.R., A.D. and F.C. All authors have read and agreed to the published version of the manuscript.
Funding
This research received no external funding.
Data Availability Statement
The data that support the findings of this study are available from the corresponding author upon reasonable request.
Acknowledgments
This research was performed in the framework of the GEOTRANSALP-PILE-UNSAT agreement in which the authors are involved. The institutions joining the agreement are greatly acknowledged.
Conflicts of Interest
The authors declare no conflict of interest.
Abbreviations
| b | hydro-mechanical coupling parameter of the MCCM extended to unsaturated soil conditions |
| D | outer diameter of the pile |
| Ep | Young’ modulus of the pile |
| EpIp | flexural rigidity of the pile |
| ē | eccentricity of the applied load on the pile |
| e, e0 | void ratio, initial void ratio |
| g | gravity acceleration |
| H | lateral load |
| Ip | moment of the inertia of the pile |
| K | subgrade modulus |
| K0 | horizontal to vertical stress ratio |
| k, ksat | soil permeability, saturated permeability |
| L | embedded pile length |
| M, Mmax | bending moment, maximum bending moment |
| MCSL | Slope of the critical state line in (q, p′) plane |
| N | scaling factor in the geotechnical centrifuge |
| N0 | e at p′ = 1 kPa on the saturated NCL |
| n, a | Gardener’s parameters |
| p, pmax, pu | soil reaction, maximum soil reaction, soil resistance |
| p′
| mean effective stress |
| p′c | hardening parameter |
| incremental variation of the hardening parameter |
| q, qmax | deviatoric stress, maximum deviatoric stress attainable at the current p′ |
| Sr, Sr0 | degree of saturation, initial degree of saturation |
| incremental variation of the degree of saturation |
| s | suction |
| t | time |
| u | pore pressure |
| w, w0 | gravimetric water content, initial water content |
| x | horizontal distance from the centre line of the pile |
| y | lateral deflection of the pile |
| z, zw | depth, depth of the water table |
| α | parameter of the permeability function |
| δ | friction angle of the interface |
| δij | Kronecker’s delta |
| incremental variation of plastic volumetric strain |
| γ | unit weight of soil |
| ϕ′
| critical state friction angle |
| κ | slope of URL in semi-log compressibility plane |
| λ | slope of NCL in semi-log compressibility plane |
| ν | Poisson’s ratio |
| σ′ij | effective stress component |
| σij | total stress component |
| σ′v | vertical effective stress |
References
- Tarantino, A.; El Mountassir, G.; Wheeler, S.; Gallipoli, D.; Russo, G.; Augarde, C.; Urciuoli, G.; Pirone, M.; Stokes, A.; Van De Kuilen, J.W.; et al. TERRE project: Interplay between unsaturated soil mechanics and low-carbon geotechnical engineering. E3S Web Conf. 2020, 195, 01002. [Google Scholar] [CrossRef]
- Han, Z.; Vanapalli, S.K.; Kutlu, Z.N. Modeling Behavior of Friction Pile in Compacted Glacial Till. Int. J. Géoméch. 2016, 16, 4016009. [Google Scholar] [CrossRef]
- Vahedifard, F.; Leshchinsky, B.A.; Mortezaei, K.; Lu, N. Active earth pressures for unsaturated retaining structures. J. Geotech. Geoenviron. Eng. 2015, 141, 04015048. [Google Scholar] [CrossRef]
- Jang, T.; Wang, L.; Zhang, J.; Jia, H.; Pan, J. Effect of water content on near-pile silt deformation during pile driving using PIV technology. Geomech. Eng. 2020, 23, 139–149. [Google Scholar] [CrossRef]
- Behbehani, F.; McCartney, J.S. Impacts of Unsaturated Conditions on The Ultimate Axial Capacity of Energy Piles. E3S Web Conf. 2020, 195. [Google Scholar] [CrossRef]
- Speranza, G.; Ferrari, A.; Laloui, L. A physical model for the interaction between unsaturated soils and retaining structures. E3S Web Conf. 2020, 195, 03013. [Google Scholar] [CrossRef]
- Borghei, A.; Ghayoomi, M.; Turner, M. Effects of Groundwater Level on Seismic Response of Soil–Foundation Systems. J. Geotech. Geoenviron. Eng. 2020, 146, 04020110. [Google Scholar] [CrossRef]
- Georgiadis, K.; Potts, D.M.; Zdravkovic, L. The influence of partial soil saturation on pile behaviour. Géotechnique 2003, 53, 11–25. [Google Scholar] [CrossRef]
- Al-Khazaali, M.; Vanapalli, S.K. Experimental Investigation of Single Model Pile and Pile Group Behavior in Saturated and Unsaturated Sand. J. Geotech. Geoenviron. Eng. 2019, 145, 04019112. [Google Scholar] [CrossRef]
- Stacul, S.; Squeglia, N.; Morelli, F. Laterally Loaded Single Pile Response Considering the Influence of Suction and Non-Linear Behaviour of Reinforced Concrete Sections. Appl. Sci. 2017, 7, 1310. [Google Scholar] [CrossRef] [Green Version]
- Lalicata, L.M.; Desideri, A.; Casini, F.; Thorel, L. Experimental observation on laterally loaded pile in unsaturated silty soil. Can. Geotech. J. 2019, 56, 1545–1556. [Google Scholar] [CrossRef] [Green Version]
- Cheng, X.; Vanapalli, S.K. A numerical technique for modeling the behavior of single piles in unsaturated soils. MATEC Web Conf. 2021, 337, 03012. [Google Scholar] [CrossRef]
- Cheng, X.; Vanapalli, S.K. Prediction of the nonlinear behavior of laterally loaded piles in unsaturated soils. Comput. Geotech. 2021, 140, 104480. [Google Scholar] [CrossRef]
- Mayne, P.W.; Kulhawy, F.H.; Trautmann, C.H. Laboratory Modeling of Laterally-Loaded Drilled Shafts in Clay. J. Geotech. Eng. 1995, 121, 827–835. [Google Scholar] [CrossRef]
- Randolph, M.F. The response of flexible piles to lateral loading. Géotechnique 1981, 31, 247–259. [Google Scholar] [CrossRef]
- Di Laora, R.; Rovithis, E. Kinematic Bending of Fixed-Head Piles in Nonhomogeneous Soil. J. Geotech. Geoenviron. Eng. 2015, 141, 04014126. [Google Scholar] [CrossRef] [Green Version]
- Krishnan, R.; Gazetas, G.; Velez, A. Static and dynamic lateral deflexion of piles in non-homogeneous soil stratum. Géotechnique 1983, 33, 307–325. [Google Scholar] [CrossRef] [Green Version]
- Lalicata, L.M.; Thorel, L.; Desideri, A.; Rotisciani, G.M.; Casini, F. Model preparation for unsaturated soil testing in a centrifuge environment. In Proceedings of the 4th European Conference on Physical Modelling in Geotechnics, Luleå, Sweden, 15–17 March 2020; pp. 157–162. [Google Scholar]
- Lalicata, L.M.; Rotisciani, G.M.; Desideri, A.; Casini, F.; Thorel, L. Physical modelling of piles under lateral loading in unsaturated soils. E3S Web Conf. 2020, 195, 01021. [Google Scholar] [CrossRef]
- Matlan, S.J.; Mukhlisin, M.; Taha, M.R. Performance Evaluation of Four-Parameter Models of the Soil-Water Characteristic Curve. Sci. World J. 2014, 2014, 569851. [Google Scholar] [CrossRef]
- Romero, E.; Lloret, A.; Gens, A. Development of a new suction temperature controlled oedometer cell. In Proceedings of the First International Conference on Unsaturated Soils, UNSAT ’95, Paris, France, 6–8 September 1995; pp. 533–539. [Google Scholar]
- Brooks, R.H.; Corey, T.A. Hydraulic Properties of Porous Media; Hydrology Paper, No. 3; Civil Engineering Department, Colorado State University: Fort Collins, CO, USA, 1964.
- Lalicata, L.M. Effect of Saturation Degree on the Mechanical Behaviour of a Single Pile Subjected to Lateral Forces. Ph.D. Thesis, Department of Structural and Geotechnical Engineering, Sapienza Università di Roma, Rome, Italy, 2018. (In Italian). [Google Scholar]
- Tamagnini, R. An extended cam-clay model for unsaturated soils with hydraulic hysteresis. Géotechnique 2004, 54, 223–228. [Google Scholar] [CrossRef]
- Casini, F. Deformation induced by wetting: A simple model. Can. Geotech. J. 2012, 49, 954–960. [Google Scholar] [CrossRef]
- Casini, F.; Serri, V.; Springman, S.M. Hydromechanical behaviour of a silty sand from a steep slope triggered by artificial rainfall: From unsaturated to saturated conditions. Can. Geotech. J. 2013, 50, 28–40. [Google Scholar] [CrossRef] [Green Version]
- Rotisciani, G.M.; Sciarra, G.; Desideri, A.; Casini, F. Modeling rainfall infiltration through coarse and fine-grained unsaturated geomaterials. In Proceedings of the 6th Conference on Unsaturated Soils UNSAT2014: Research & Applications, Sydney, NSW, Australia, 2–5 July 2014; pp. 521–528. [Google Scholar]
- Rotisciani, G.; Casini, F.; Desideri, A.; Sciarra, G. Hydromechanical behavior of an embankment during inundation. Can. Geotech. J. 2017, 54, 348–358. [Google Scholar] [CrossRef] [Green Version]
- Soranzo, E.; Tamagnini, R.; Wu, W. Face stability of shallow tunnels in partially saturated soil: Centrifuge testing and numerical analysis. Géotechnique 2015, 65, 454–467. [Google Scholar] [CrossRef]
- Rotisciani, G.M.; Sciarra, G.; Casini, F.; Desideri, A. Hydro-mechanical response of collapsible soils under different infiltration events. Int. J. Numer. Anal. Methods Géoméch. 2015, 39, 1212–1234. [Google Scholar] [CrossRef] [Green Version]
- Roscoe, K.H.; Burland, J.B. On the generalized stress-strain behaviour of wet clay. In Proceedings of the Symposium on Engineering Plasticity 1968, Cambridge, UK, 25–29 March 1968; pp. 535–610. [Google Scholar]
- Bishop, A.; Blight, G. Some aspects of effective stress in saturated and partly saturated soils. Géotechnique 1963, 13, 177–197. [Google Scholar] [CrossRef]
- Jommi, C. Remarks on the constitutive modelling of unsaturated soils. In Experimental Evidence and Theoretical Approaches in Unsaturated Soils; Balkema: Rotterdam, The Netherlands; pp. 139–153.
- Taylor, R.N. Geotechnical Centrifuge Technology; Chapman and Hall: Glasgow, Scotland, 2004. [Google Scholar]
- Tamagnini, R. A constitutive model for a three-phase porous material. In Computational Fluid and Solid Mechanics; Elsevier BV: Amsterdam, The Netherlands, 2003; pp. 1528–1531. [Google Scholar]
- Rotisciani, G.M.; Desideri, A.; di Prisco, C. Numerical analysis of wetting-induced instabilities in partially saturated soils under plane strain conditions. Int. J. Numer. Anal. Methods Géoméch. 2019, 43, 1867–1884. [Google Scholar] [CrossRef]
- Rotisciani, G.M.; Lalicata, L.M.; Desideri, A.; Casini, F. Numerical modelling of the response of an unsaturated silty soil under wetting and gravitational loading processes. E3S Web Conf. 2020, 195, 02012. [Google Scholar] [CrossRef]
- Biglari, M.; Mancuso, C.; D’Onofrio, A.; Jafari, M.K.; Shafiee, A. Modelling the initial shear stiffness of unsaturated soils as a function of the coupled effects of the void ratio and the degree of saturation. Comput. Geotech. 2011, 38, 709–720. [Google Scholar] [CrossRef]
- Sivakumar, V.; Wheeler, S.J. Influence of compaction procedure on the mechanical behaviour of an unsaturated compacted clay Part 1: Wetting and isotropic compression. Géotechnique 2000, 50, 359–568. [Google Scholar] [CrossRef]
- Federico, A.; Elia, G.; Murianni, A. The at-rest earth pressure coefficient prediction using simple elasto-plastic constitutive models. Comput. Geotech. 2009, 36, 187–198. [Google Scholar] [CrossRef]
- Russo, G. A method to compute the non-linear behaviour of piles under horizontal loading. Soils Found. 2016, 56, 33–43. [Google Scholar] [CrossRef] [Green Version]
- Terzaghi, K. Evaluation of Coefficients of Subgrade Reaction. Géotechnique 1955, 5, 297–326. [Google Scholar] [CrossRef]
- McClelland, B.; Focht, J.A. Soil modulus for laterally loaded piles. Transact. ASCE 1958, 123, 1049–1086. [Google Scholar] [CrossRef]
- Matlock, H. Correlation for Design of Laterally Loaded Piles in Soft Clay. In Proceedings of the 2nd Annual Offshore Technology Conference OTC, Houston, TX, USA, 22–25 April 1970; pp. 577–594. [Google Scholar]
- Reese, L.C.; Cox, W.R.; Koop, F.D. Analysis of laterally loaded piles in sand. In Proceedings of the 6th Annual Offshore Technology Conference, Houston, TX, USA, 6–8 May 1974; Volume 2, pp. 473–485. [Google Scholar]
- Reese, L.C.; Cox, W.R.; Koop, F.D. Field testing and analysis of laterally loaded piles in stiff clay. In Proceedings of the 7th Annual Offshore Technology Conference, Houston, TX, USA, 5–8 May 1975; Volume 2, pp. 672–690. [Google Scholar]
- Reese, L.C.; Van Impe, W.F. Single Piles and Pile Groups under Lateral Loading; A. A. Balkema: Rotterdam, The Netherlands, 2014; p. 463. [Google Scholar]
- Wu, D.; Broms, B.B.; Choa, V. Design of laterally loaded piles in cohesive soils using p-y curves. Soils Found. 1998, 38, 17–26. [Google Scholar] [CrossRef] [Green Version]
- Tzivakos, K.P.; Kavvadas, M.J. Numerical development of P-Y curves for soft clays. Geotechnical Engineering for Infrastructure and development. In Proceedings of the 16th European Conference on Soil Mechanics and Geotechnical Engineering, Edinburgh, Scotland, 13–17 September 2015; pp. 4091–4096. [Google Scholar]
- Broms, B.B. Lateral resistance of piles in cohesionless soils. J. Soil Mech. Foundat. Div. ASCE 1964, 90, 123–156. [Google Scholar] [CrossRef]
- Poulos, H.G.; Davis, E.H. Pile Foundation Analysis and Design; John Wiley and Sons: New York, NY, USA, 1980; p. 397. [Google Scholar]
- Landi, G. Pali soggetti a carichi orizzontali: Indagini sperimentali ed analisi. Ph.D. Thesis, Department of Geotechnical Engineering, Università degli studi Federico II, Naples, Italy, 2006. (In Italian). [Google Scholar]
- Viggiani, C.; Mandolini, A.; Russo, G. Piles and Pile Foundations; CRC Press: Boca Raton, FL, USA, 2011. [Google Scholar]
- Price, C.; Wardle, I.F. The Deformation of Vertical Piles in London Clay under Static and Cyclic Horizontal Working Loads. In Proceedings of the Conference recent developments in the design and construction of piles, London, UK, 21–22 March 1979; pp. 87–94. [Google Scholar]
Figure 1.
Centrifuge test phases. (a) phase 1; (b) phase 2; (c) phase 3.
Figure 1.
Centrifuge test phases. (a) phase 1; (b) phase 2; (c) phase 3.
Figure 2.
Numerical model calibration, (a) soil water retention curves SWRCs, (b) oedometer tests.
Figure 2.
Numerical model calibration, (a) soil water retention curves SWRCs, (b) oedometer tests.
Figure 3.
Finite element mesh of the three-dimensional model.
Figure 3.
Finite element mesh of the three-dimensional model.
Figure 4.
Stress history of the model. Profiles obtained by FEM analyses (test T06).
Figure 4.
Stress history of the model. Profiles obtained by FEM analyses (test T06).
Figure 5.
Initial condition for the three-dimensional models.
Figure 5.
Initial condition for the three-dimensional models.
Figure 6.
Load deflection curves predicted and measured: (a) loose soil, (b) dense soil.
Figure 6.
Load deflection curves predicted and measured: (a) loose soil, (b) dense soil.
Figure 7.
Distribution of bending moment measured and predicted: (a) T06 (LU); (b) T08 (DU); (c) T09 (DS).
Figure 7.
Distribution of bending moment measured and predicted: (a) T06 (LU); (b) T08 (DU); (c) T09 (DS).
Figure 8.
Pile’s response at 0.4 MN of applied load in the loose soil models.
Figure 8.
Pile’s response at 0.4 MN of applied load in the loose soil models.
Figure 9.
Shear strength mobilisation for H = 0.4 MN in the loose soil analyses.
Figure 9.
Shear strength mobilisation for H = 0.4 MN in the loose soil analyses.
Figure 10.
Pile response at large displacements (y/D = 0.25), for the loose soil.
Figure 10.
Pile response at large displacements (y/D = 0.25), for the loose soil.
Figure 11.
Shear strength mobilisation at y/D = 0.25 (loose model).
Figure 11.
Shear strength mobilisation at y/D = 0.25 (loose model).
Figure 12.
Curves p-y at different depths and water table positions for the loose model.
Figure 12.
Curves p-y at different depths and water table positions for the loose model.
Figure 13.
Profiles with depth of the initial stiffness, K, of the p-y curves predicted versus literature solution: (a) saturated conditions (LS), (b) partially saturated conditions (LU).
Figure 13.
Profiles with depth of the initial stiffness, K, of the p-y curves predicted versus literature solution: (a) saturated conditions (LS), (b) partially saturated conditions (LU).
Figure 14.
Profiles with depth of pu (limiting pressure), prediction versus literature solution: (a) saturated soil conditions (LS), (b) unsaturated soil conditions (LU).
Figure 14.
Profiles with depth of pu (limiting pressure), prediction versus literature solution: (a) saturated soil conditions (LS), (b) unsaturated soil conditions (LU).
Figure 15.
Secant stiffness (a) and increase in secant stiffness (b) in function of the flexural rigidity of the pile.
Figure 15.
Secant stiffness (a) and increase in secant stiffness (b) in function of the flexural rigidity of the pile.
Figure 16.
Maximum bending moment in function of the flexural rigidity.
Figure 16.
Maximum bending moment in function of the flexural rigidity.
Figure 17.
Position of the maximum bending moment and critical length in function of the flexural rigidity.
Figure 17.
Position of the maximum bending moment and critical length in function of the flexural rigidity.
Table 1.
Main outcomes of the centrifuge tests by Lalicata et al. [
11].
Table 1.
Main outcomes of the centrifuge tests by Lalicata et al. [
11].
| Soil State | Stiffness Increase * | Lateral Capacity Increase * | Reduction in Maximum Bending Moment |
|---|
| | (%) | (%) | (%) |
| Loose, e0 = 0.93 | +313 | +222 | Not available |
| Dense, e0 = 0.73 | +50 | +12.5 | 24% |
Table 2.
Initial conditions and main features of the centrifuge tests (after [
11]).
Table 2.
Initial conditions and main features of the centrifuge tests (after [
11]).
| | Initial Conditions | Main Features of the Loading Stage |
|---|
| Test ID * | e0 | w0 (%) | Sr0 (%) | zw (mm) | Maximum Deflection ** (mm) | Lateral Capacity |
|---|
| T05 (LS) | 0.93 | 15.03 | 42.02 | 0 | 16.5 | Reached |
| T06 (LU) | 0.93 | 14.67 | 41.01 | 70 | 3.3 | Not reached |
| T08 (DU) | 0.75 | 14.72 | 51.03 | 70 | 4.2 | Not reached |
| T09 (DS) | 0.75 | 14.72 | 51.03 | 0 | 14 | reached |
Table 3.
Mechanical parameters of the Modified Cam Clay model extended to partial saturation.
Table 3.
Mechanical parameters of the Modified Cam Clay model extended to partial saturation.
| Mechanical Parameters |
|---|
| ν | Poisson’s ratio | 0.25 |
| κ | Slope of URL * in semi-log compressibility plane | 0.04 |
| λ | Slope of NCL ** in semi-log compressibility plane | 0.113 |
| N0 | e at mean effective stress p′ = 1 kPa on the saturated NCL | 1.366 |
| MCSL | Slope of the critical state line in (q, p′) plane | 0.86 |
| b | Hydro-mechanical coupling parameter | 4.5 |
Table 4.
Scaling laws for centrifuge modelling.
Table 4.
Scaling laws for centrifuge modelling.
| Parameter | Prototype—Model Ratio |
|---|
| Length | 1/N |
| Density | 1 |
| Unit weight | N |
| Stress | 1 |
| Strain | 1 |
| Force | 1/N2 |
| Bending moment | 1/N3 |
| Flexural rigidity | 1/N4 |
| Seepage velocity | 1/N |
| Diffusion: Consolidation | 1/N2 |
| Capillary rise | 1/N |
Table 5.
Initial condition of the axisymmetric analysis.
Table 5.
Initial condition of the axisymmetric analysis.
| Test ID | Voids Ratio, e0 | p′ (kPa) | OCR |
|---|
| T05 (LS) | 0.93 | 170 | 1.7 |
| T06 (LU) | 0.93 | 170 | 1.7 |
| T09 (DS) | 0.75 | 743 | 1.2 |
| T08 (DU) | 0.75 | 743 | 1.2 |
| Publisher’s Note: MDPI stays neutral with regard to jurisdictional claims in published maps and institutional affiliations. |
© 2021 by the authors. Licensee MDPI, Basel, Switzerland. This article is an open access article distributed under the terms and conditions of the Creative Commons Attribution (CC BY) license (https://creativecommons.org/licenses/by/4.0/).


