Article

Pyrite Morphology and δ34S as Indicators of Deposition Environment in Organic-Rich Shales

1
Center for Hydrocarbon Recovery, Skolkovo Institute of Science and Technology, Bolshoy Boulevard 30, bld. 1, 121205 Moscow, Russia
2
Department of Geosciences, Mississippi State University, Mississippi State, MS 39762, USA
3
Hydroisotop GmbH, Woelkestr. 9, 85301 Schweitenkirchen, Germany
4
Department of Earth, Planetary, and Space Sciences, University of California, Los Angeles, CA 90095, USA
*
Authors to whom correspondence should be addressed.
Geosciences 2021, 11(9), 355; https://doi.org/10.3390/geosciences11090355
Submission received: 11 June 2021 / Revised: 17 August 2021 / Accepted: 19 August 2021 / Published: 24 August 2021
(This article belongs to the Special Issue Petrophysics and Geochemistry of Unconventional Reservoirs)

Abstract

:
This study is focused on the mineralogical, chemical, and isotopic characterization of pyrites from the rocks of the Bazhenov Formation (Upper Jurassic–Lower Cretaceous organic-rich shales, Western Siberia, Russia). Scanning electron microscopy (SEM) revealed pyrites of different morphologies: small and large framboids, small crystals, and large euhedral crystals; all morphotypes were usually combined into aggregates. Isotope ratio mass spectrometry (IRMS) and secondary ion mass spectrometry (SIMS) showed that small framboids and microcrystalline pyrite are isotopically light, with δ34SCDT varying from −55 to −20‰. Large framboids and euhedral crystals of pyrite are isotopically heavy with δ34SCDT up to +26‰. Both morphology and δ34S were suggested to be controlled by the redox conditions and sedimentation regime. The abundance of small framboids suggests that pyrite sedimentation occurred under anoxic conditions; the presence of the large framboids and euhedral crystals of pyrite suggest the accumulation of sediments occurred at suboxic conditions, possibly in the presence of oxygen.

1. Introduction

The Bazhenov Formation of West Siberia is one of the largest source rock formations in the world. It has been actively studied for more than two decades, and interest in understanding this formation remains high. The potential of unconventional hydrocarbon reservoirs is defined by the amount and quality of organic matter, which controls the genesis of hydrocarbons [1]. Organic matter is actively accumulated and well preserved in stagnant basins lacking oxygen, i.e., processes that occur at low oxygen (suboxic), oxygen-free (anoxic), and hydrogen sulfide (euxinic) conditions [2,3,4].
Pyrite (FeS2) is an authigenic mineral which is abundant in multicomponent organic-rich rocks [5]. It was shown that the shape and size of pyrite crystals/aggregates are sensitive to redox conditions, and therefore, the distribution of pyrite morphotypes helps reconstruct the evolution of paleoredox conditions during sedimentation [6,7,8,9]. Pyrite is present in the rocks as framboids (densely packed spherical aggregates of microcrystals), as well as crystals of different shapes and sizes, which often form layers and replace organic remnants.
One of the main directions of our research on unconventional hydrocarbons is studying the size distribution of framboids and individual pyrite crystals, as well as their sulfur isotope compositions [10,11,12,13,14,15]. Wang et al. [16] showed that the bulk sulfur isotopic composition could be misleading for determining the sedimentation environment, as pyrite undergoes significant changes during dia- and cata-genesis. Therefore, it is very important to look at the isotopic composition of individual crystals and distinguish pyrite morphology in the rocks. The main source of sulfur in such a sedimentary system is seawater, where the predominant marine aqueous species of sulfur is sulfate-ion (SO42−). Under oxygen-depleted conditions and with the presence of sulfate-reducing bacteria, sulfur is being reduced by changing its oxidation state from +6 to −2. As a result, hydrogen sulfide (H2S) is formed. There are four stable isotopes of sulfur (32S, 33S, 34S, and 36S), and 32S and 34S are the most abundant and represent more than 99% of the total sulfur isotopes [17,18]. Delta-notation δ34S is used to express the deviation of 34S/32S measured in a system from a standard material:
δ 34 S s a m p l e ( ) = ( R s a m p l e R C D T   R C D T ) 1000 ,
where R s a m p l e is a ratio of 34S/32S in a sample and R C D T is 34S/32S (=0.04416) in the Canyon Diablo Troilite standard [19,20].
The goal of our work is to estimate the potential of morphology and δ34S of pyrite in reconstructing redox conditions in the well section of the late Jurassic–early Cretaceous sedimentary rocks of the Bazhenov Formation. We conducted a lithological and geochemical study on selected rocks and minerals by first distinguishing pyrite morphotypes and their distribution in the well section, and then comparing δ34S in the bulk rock determined by Isotope Ratio Mass Spectrometry (IRMS) with δ34S in the individual pyrite crystals and framboids evaluated by Secondary Ion Mass Spectrometry (SIMS). This combined instrumental study of the sediments in the Bazhenov Formation is novel.

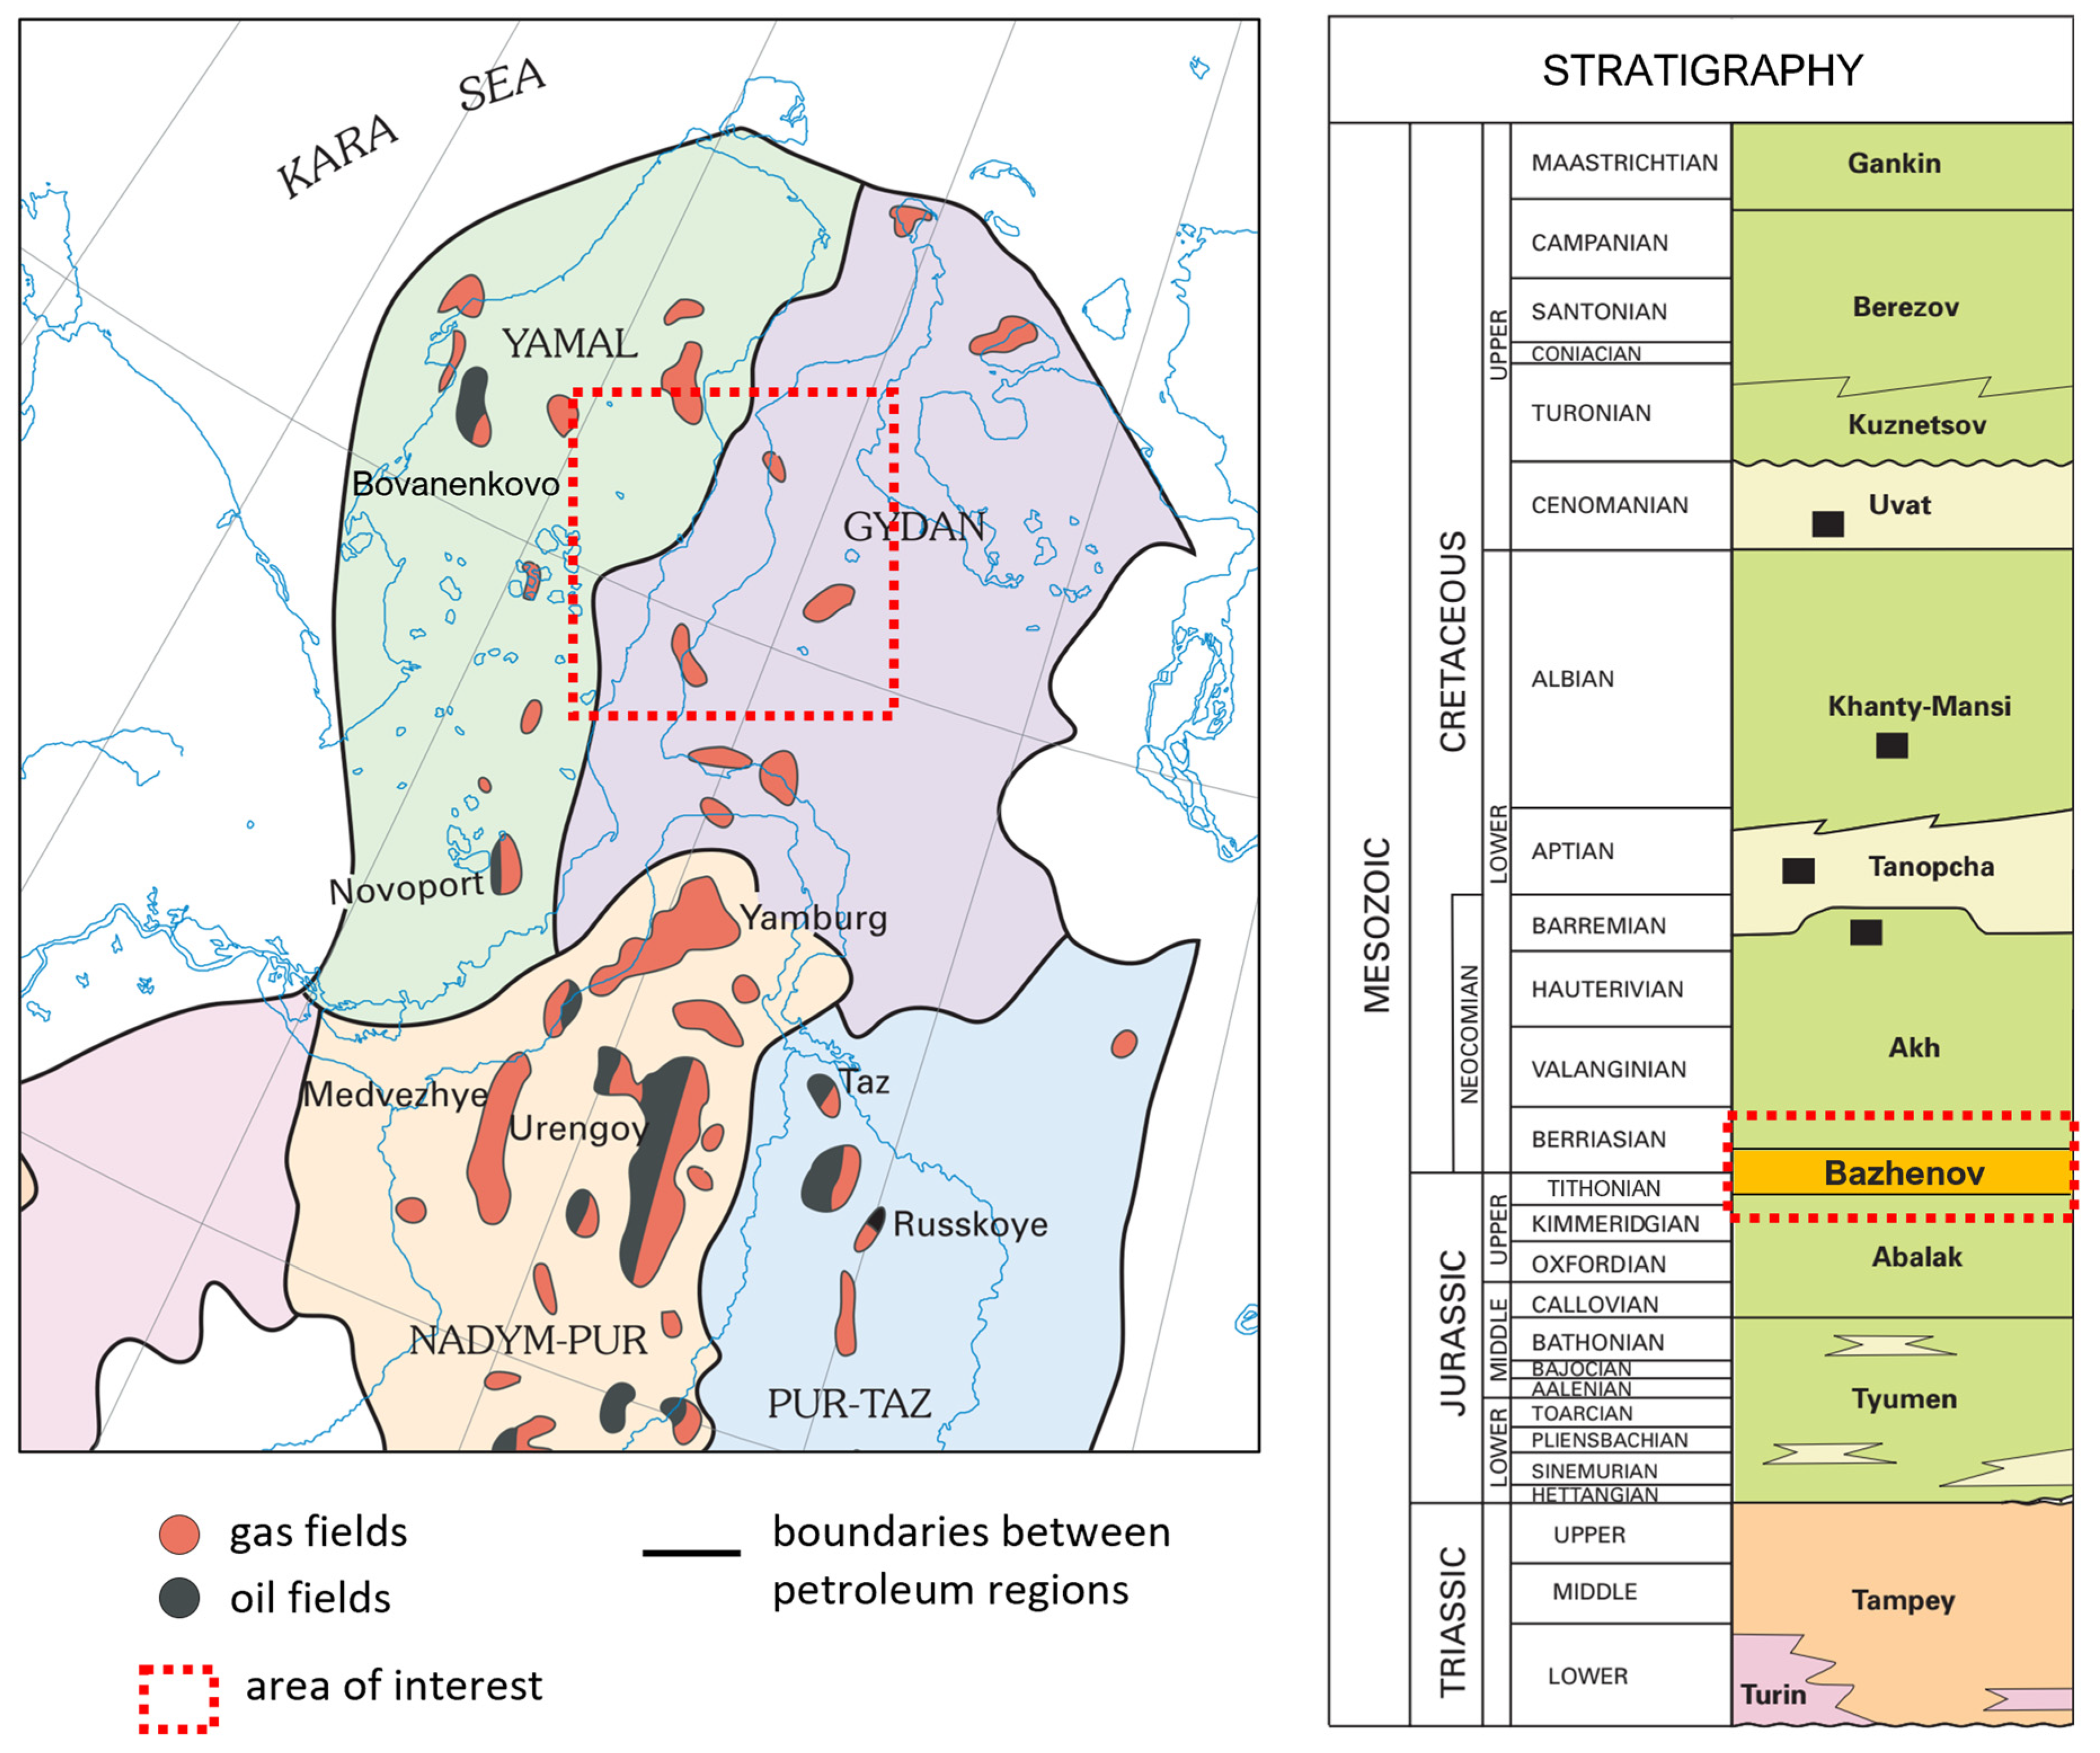
2. Geological Setting

The study area is situated in the North of the West Siberian Basin in the area of the Gydan Peninsula and encompasses the interval of the Late Jurassic to Early Cretaceous (Figure 1). Deposition of the sediments under investigation lasted for more than 8 Ma at the Jurassic-to-Cretaceous transition and corresponded to environments of the transgression of a marine basin area of more than 2 million km2. Deposits of the Bazhenov Formation are underlain by marine terrigenous deposits of the Abalak or Georgiev Formation, Upper Jurassic, and are overlain by Lower Cretaceous argillites and sand-clay clinoforms. In the opinion of Afanasiev I.S. et al. the Bazhenov basin was rather shallow-water, that being witnessed by a 200–300 m difference between occurrence depths of the shelf (undafrom) and deep-water (fondoform) parts of the Lower Cretaceous clinoforms [21]. Deposits of the central parts of the basin show biogenic sedimentation and are represented by predominantly siliceous, argillaceous–siliceous, and carbonate–argillaceous–siliceous deposits enriched in an organic matter [22,23,24,25].
Various amounts of terrigenous material as an admixture to the above-said lithology are associated with different stages of the sea-level stand. It was believed for a long time that near-bottom layers of the Bazhenov basin were hydrogen sulfide contaminated, but findings of deposit eaters and geochemical studies confirm the presence of hydrogen sulfide-free areas [26].
The Bazhenov Formation deposits are spread all over the territory of West Siberia, with the thickness of 10 to 60 m, being 30 m thick on average; occurrence depths of the formation top increase northward and are 600 m minimum and 3800 m maximum [25,27,28].
In terms of mineral composition, the Bazhenov Formation is represented by multicomponent rocks consisting of silica, clay minerals, calcite, pyrite, and feldspars in various percentage proportions. Rock composition is different in the central and peripheral parts of the formation’s distribution area. The mean content of organic carbon in Bazhenov Formation rocks is 5–10% wt.; in exceptional cases, it can reach 25%. Pyrite is a ubiquitous component of the rock. Several stages of rock pyritization are observed: finely dispersed early-generation pyrite forms organo–mineral complexes with organic matter, while later-generation pyrite is developed non-uniformly and may form thin laminae and lenses [21].
Close to the study area, large and giant gas, gas-condensate, and oil fields are situated, though quite a small number of wells with coring from the Bazhenov deposits have been drilled in the North of West Siberia, that make the material for the performed studies quite unique.
Figure 1. Research area (left) and stratigraphic column of the region (right). Figures modified after Ulmishek [29].
Geosciences 11 00355 g001

3. Materials and Methods

Samples for our study were obtained from the well core, which is in the north part of Western Siberia. These bulk samples are high-carbon thin clay–siliceous rocks that belong to the Bazhenov Formation, which corresponds to late Jurassic–early Cretaceous geologic time. Preliminarily, gamma-ray logging was recorded on a full-size core to calibrate the core recovery depths to measured depths during logging and to characterize the natural radioactivity of the rocks. Then, we applied lithological, mineralogical, and geochemical methods to evaluate: (i) rock texture; (ii) distribution of organic matter and pyrite in geological section; (iii) morphology of pyrite at micro and nanoscales; and (iv) δ34S of pyrite.

3.1. Characteristics of Texture and Organic Matter

Texture and organic matter of the selected samples were evaluated at the Skolkovo Institute of Science and Technology (Russia). A total of thirty-nine thin sections (2 cm × 3 cm in size) were prepared by slicing the core rock in the direction perpendicular to sedimentary layers for textural characterization. A total of 150 samples were collected to determine the abundance of organic matter or total organic carbon (TOC). Rock texture and distribution of organic matter were examined with a Carl Zeiss Axio Imager transmitted light polarization microscope. Micro-textures of the rocks, pyrite morphology, and major element content were examined on the freshly chipped rock fragments with two scanning electron microscopes (SEM): JSM 6610 LV (JEOL) equipped with an energy dispersive X-ray spectrometer (EDS) (IE350, OXFORD INSTRUMENTS) and Quattro S (Thermo Fisher Scientific) equipped with EDS (XFlash 6|60, Bruker). Mineral compositions of the rocks were determined with X-ray diffraction (XRD) on a Rigaku SmartLab instrument. The organic matter content and type of kerogen was evaluated with the pyrolysis Rock-Eval method on a Hawk Resource Workstation (Wildcattechnology).

3.2. Mass Spectrometry Analyses

Sulfur isotope composition and sulfur content in the bulk rocks were determined by isotope ratio mass spectrometry using an EA-IRMS system, consisting of an isotope ratio mass spectrometer IRMS Delta V plus (Thermo Fisher Scientific, Bremen, Germany) coupled to an Elemental Analyzer Thermo Scientific Flash 2000 (Thermo Fisher Scientific, Milan, Italy). The system provides combustion of total sulfur from the sample in SO2-gas at 1020 °C, with subsequent measurement of its sulfur isotope composition. The reference materials used for calibration were: Sulfate NBS 127 δ34S: +21.3‰, Methionine δ34S: +9.3‰, and 4,4-Diaminodiphenyl sulfone δ34S: +6.0‰. δ34S values are reported relative to Vienna Canyon Diablo troilite (V-CDT). Two or more technical replicates of each sample were measured with an uncertainty lower than 0.5‰.
The sulfur isotope compositions of individual crystals and pyrite aggregates were analyzed using the CAMECA ims-1290 ion microprobe in the Department of Earth, Planetary, & Space Sciences, University of California Los Angeles (USA). The samples, together with the standards (Ruttan pyrite and Chisel sphalerite) were mounted in epoxy (Buehler) and polished using 600, 800, and 1200 grit silicon carbide paper (Buehler) followed by 1 μm Al2O3 powder (Mark V Laboratories). Prior to ion microprobe, the mounts were examined with optical microscopy, coated with a 20 nm layer of gold, and examined by SEM at MSU. Sulphides were clearly visible with both microscopy techniques. EDS spectra allowed distinction between Fe and Zn sulphides embedded in the aluminosilicate matrix.
Single-spot sulphur isotope analyses (δ34S) were conducted using a ~0.25 nA Cs+ primary beam. Data were acquired in multicollection mode, with two Faraday Cups (FC for 32S and FC2 for 34S). Mass resolution was set at 3000 to isolate the peaks of interest from interferences (e.g., 32S from O2). Prior to signal collection, each spot was pre-sputtered for 30 seconds to achieve sputtering equilibrium. Each spot analysis consisted of 10 cycles for both standards and samples, with a five-second counting time in each cycle. For the standards, the average 32S count rates on the FC detector were ~4 × 10⁸ and 5 × 10⁸ cps (counts per second) for Ruttan pyrite and Chisel sphalerite respectively. The stability of the instrument was constantly monitored, and the instrumental mass fractionation was determined by analyzing the standard several times throughout each analytical session. The reproducibility of the standard (mounted together with samples) was better than 0.3‰ (standard deviation [SD]).
Instrumental mass fractionation (IMF) was calculated as:
IMF = R Standard Measured   R Standard True  
where R = 34S/32S of the standard was measured by SIMS (RMeasured) and determined independently (RTrue). IMF varied from 0.9998 to 0.9996 (i.e., from −0.4 to −1.2‰) for Ruttan pyrite, and was more constant (IMF = 0.995) for Chisel sphalerite (i.e., −5‰). According to Kozdon et al. [30], instrumental mass fractionation for chalcopyrite (−1.7‰) is lower than for sphalerite (−3.2‰). Therefore, data reported for chalcopyrite are subject to a few ‰ systematic uncertainty and should be used with extra caution. The same is applicable to isotope data in FeS.

4. Results

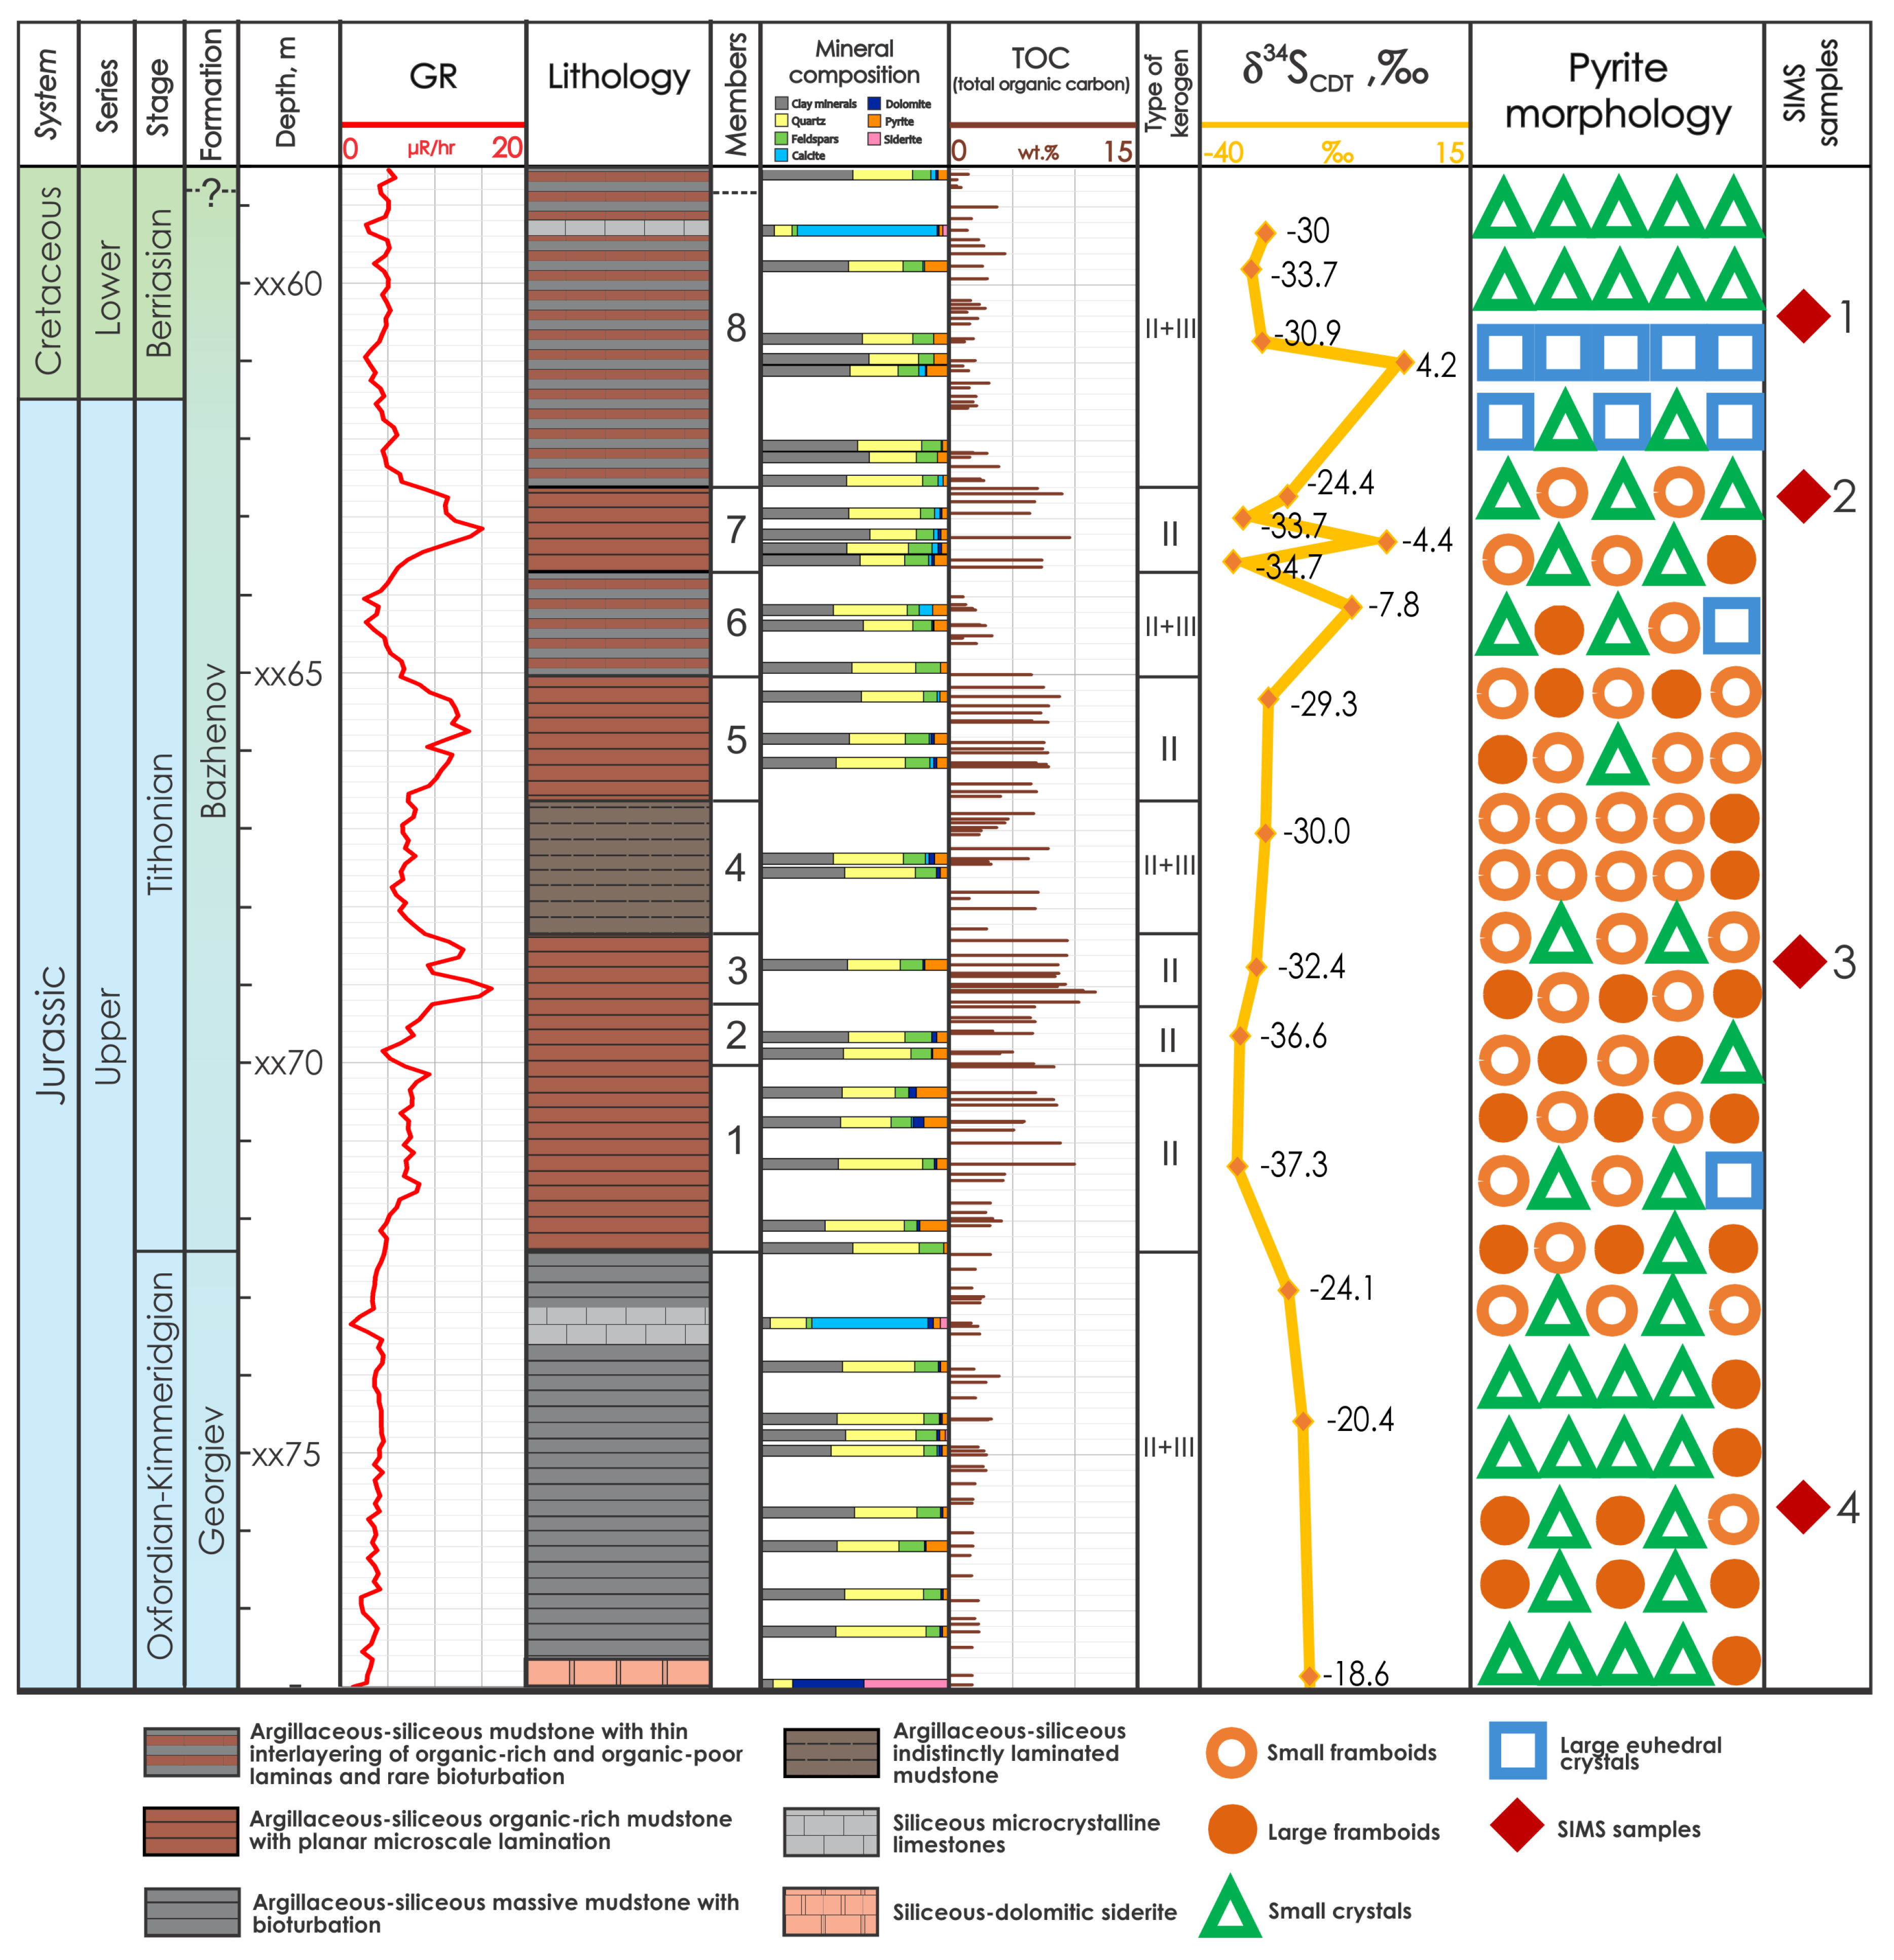
4.1. Lithology and Organic Matter

Late Jurassic–Early Cretaceous sedimentary rocks were collected from the Georgiev and the Bazhenov formations. The section consists of argillaceous–siliceous–rocks with rare lamination of carbonate rocks (Figure 2).
The rock classification scheme is based on structural characteristics and the amount of organic matter:
  • Argillaceous–siliceous mudstone with thin interlayering of organic-rich and organic-poor laminae and rare bioturbation
  • Argillaceous–siliceous organic-rich mudstone with planar microscale lamination
  • Argillaceous–siliceous massive mudstone with bioturbation
  • Argillaceous–siliceous indistinctly laminated mudstone
The rocks have similar mineral compositions and contain on average 42% clay minerals (predominantly illite), 38% quartz, up to 15% feldspars, up to 17% pyrite, and in some cases, up to 3% dolomite according to XRD analysis. Furthermore, ZnS (sphalerite or wurzite) and CuFeS2 (chalcopyrite) were found using EDS SEM in the rocks. Based on the geochemical and lithological characteristics, eight members can be distinguished (Figure 2).
The amount of total organic carbon (TOC) is one of the main criteria in classification of lithotypes and characteristics. The TOC content varied from 0.5 to 12% within the section, having an average of 4.8%. Kerogen type II was the predominant species, but kerogen of the mixed type (II+III) was present in some members. The base of the studied well corresponded to the Georgiev horizon and contained a low abundance of organic matter, on average 2.3%. The higher TOC content was present in the Bazhenov Formation, with an average value of 4.8%. In the Bazhenov Formation, members 1, 2, 3, 5, and 7 were enriched in TOC, whereas members 4, 6, and 8 were relatively depleted in TOC. In the first member, TOC varied from 2.8 to 9.9% (with an average of 5.8%) and the kerogen type was II. In the second member, the TOC variation was smaller (3.4–6.7%) and the average TOC values was 4.7%, which was slightly lower than TOC in the first member. The higher TOC values (6.4–11.6%, 8.8% on average) were found in the third member with kerogen type-II. In the higher member (№4), the kerogen changed to mixed type (II+III) with TOC of 1.4–7.3% (4.3% in average). In members 5 and 7, the predominant kerogen type was II and TOC contents were higher: 4.0–8.7% with an average of 7.1% in member 5 and 6.3–9.5% with an average of 7.6% in member 7. The mixed type of kerogen (II+III) occurred in members 6 and 8 with lower TOC of 0.5–4.3% (2% in average).

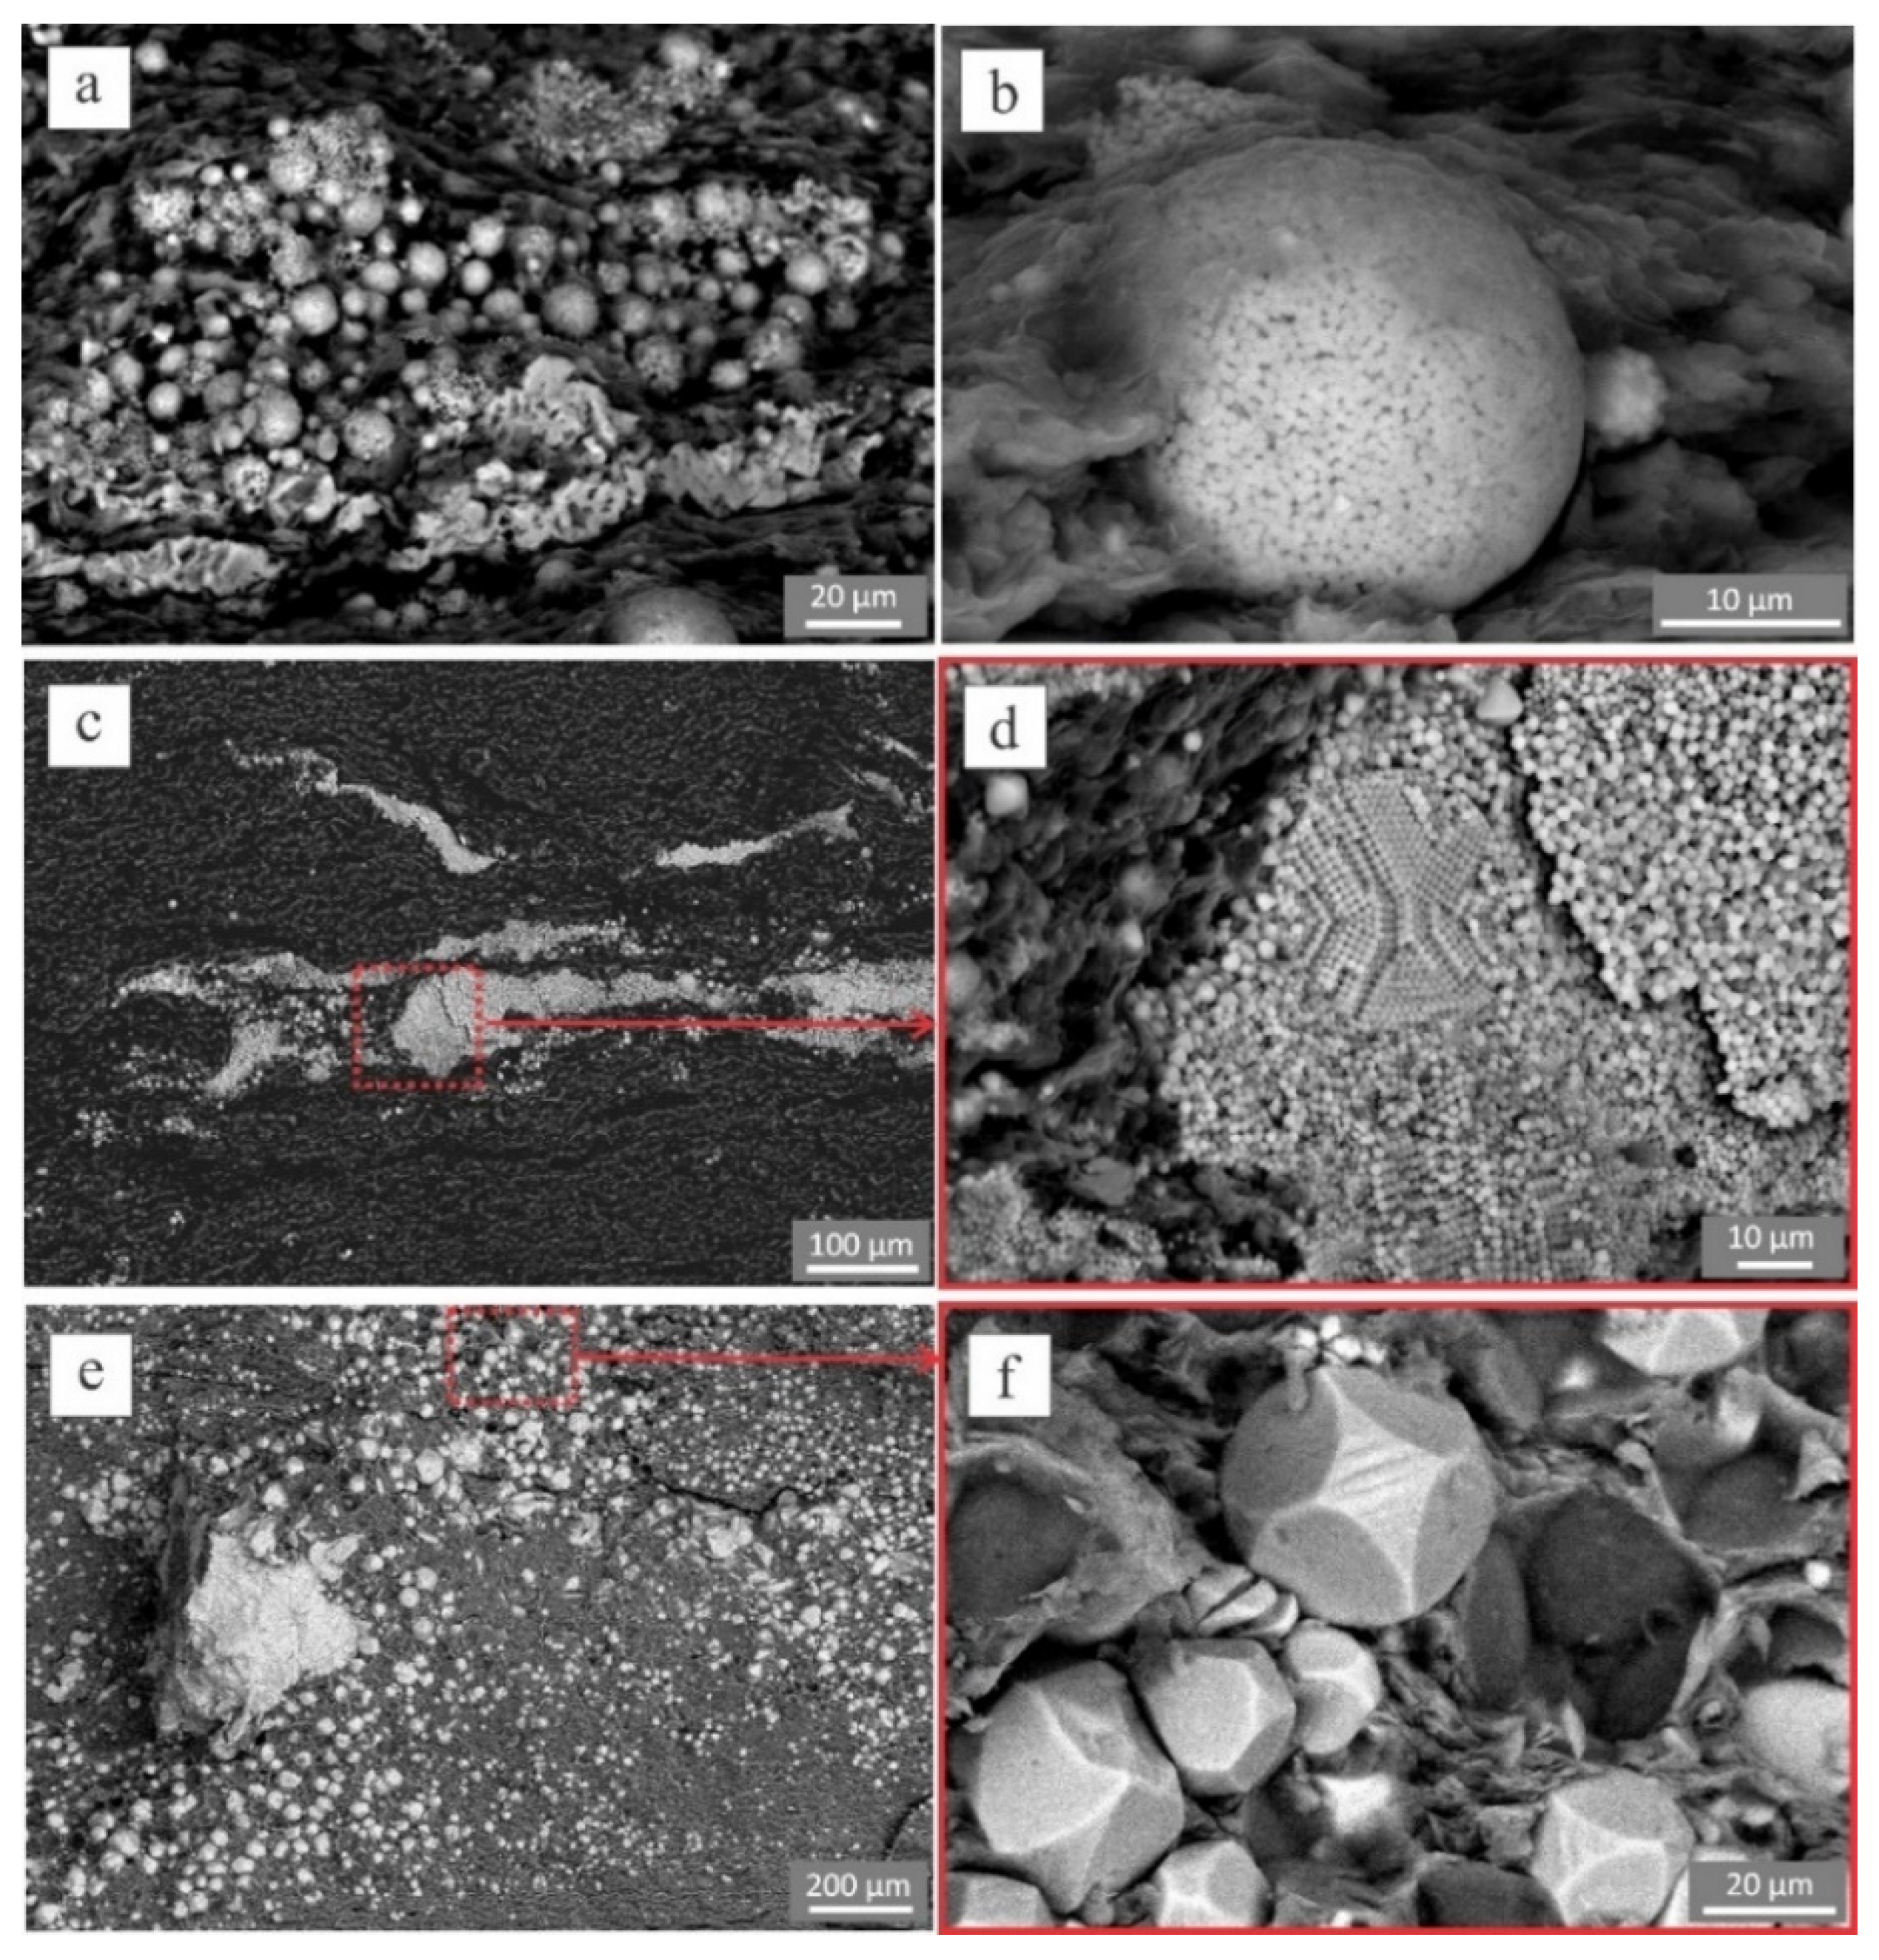
4.2. Pyrite Morphology

According to XRD analysis, the abundance of pyrite in the rocks varied from 3 to 17% (7% on average). Four morphological types of pyrite were identified using SEM (Figure 3):
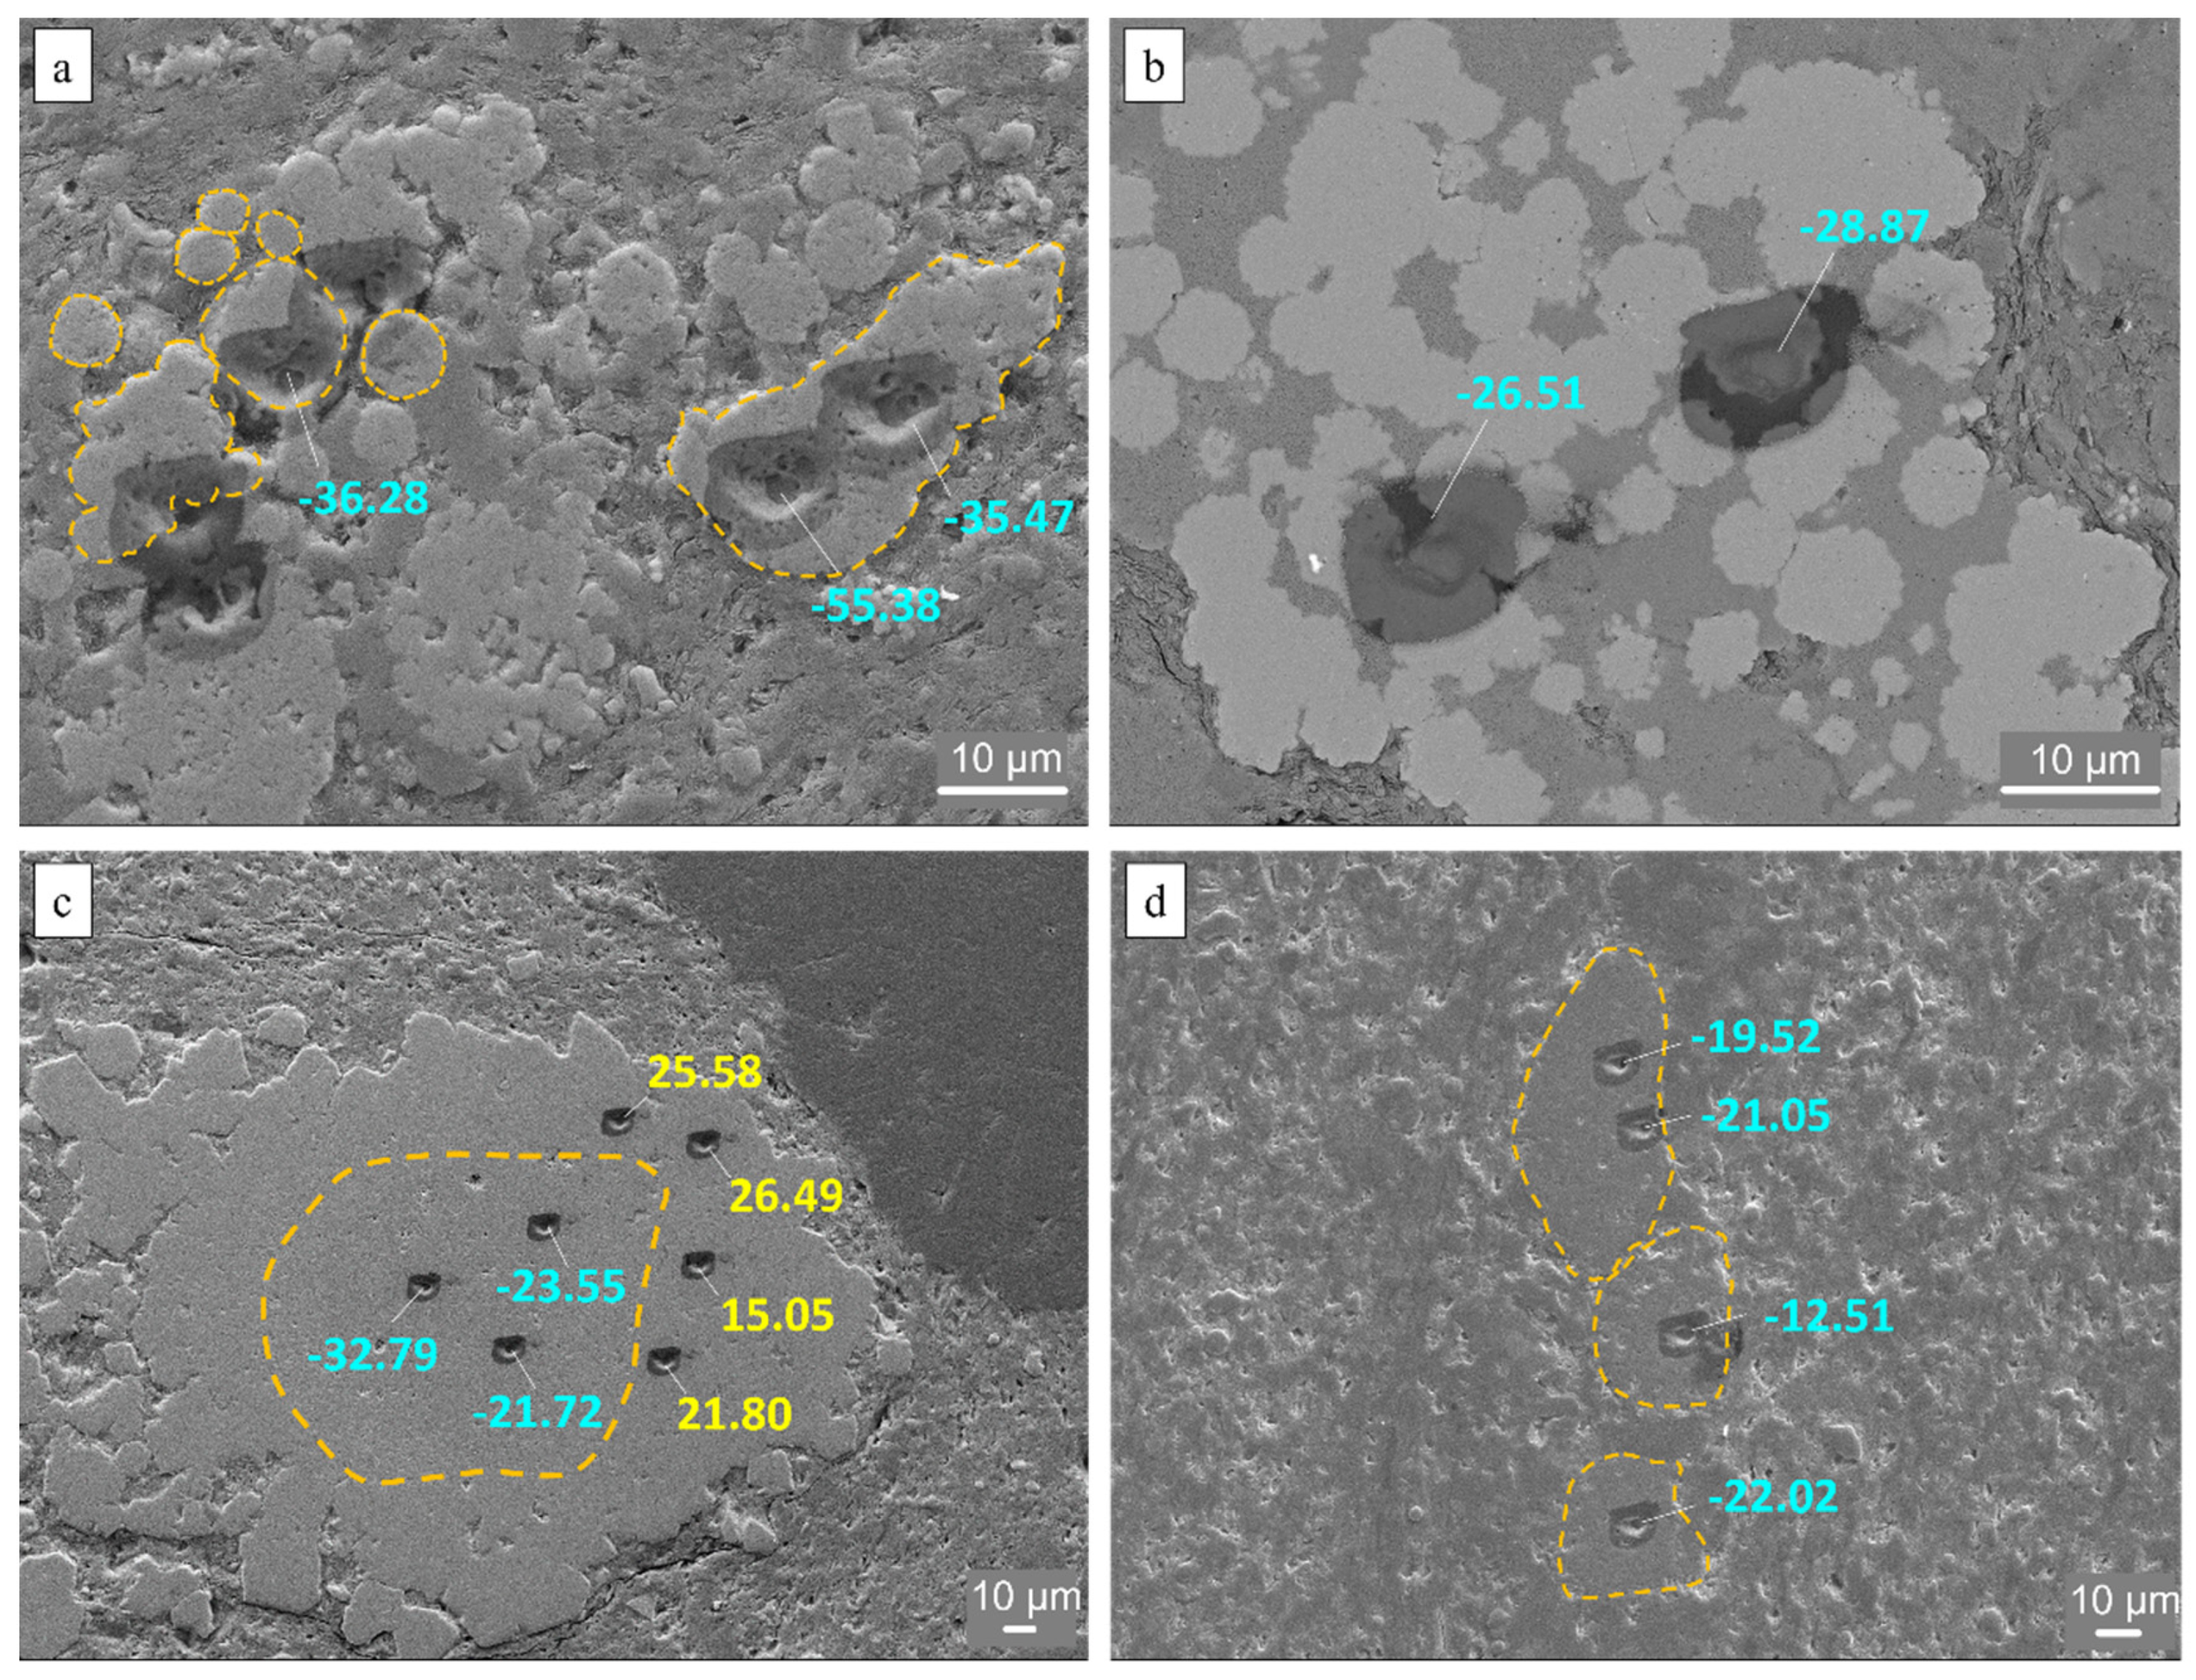
  • Small framboids (diameter 5–10 µm) concentrations of sub-micron pyrite crystals 0.5–1 µm in size (Figure 3a). These framboids were porous, abundant in the sediment layers with high carbon content, and were often associated with organic matter.
  • Large framboids were denser and less porous (without space between micro-crystals) than small framboids. Diameter of large framboids could reach 30 µm and consisted of microcrystals with the size range of 2–5 µm (Figure 3b).
  • Small crystals (1–2 µm in size) were non-uniformly distributed in lenses and layers (Figure 3c,d). Small crystals were often abundant within bioturbation traces and organic remnants.
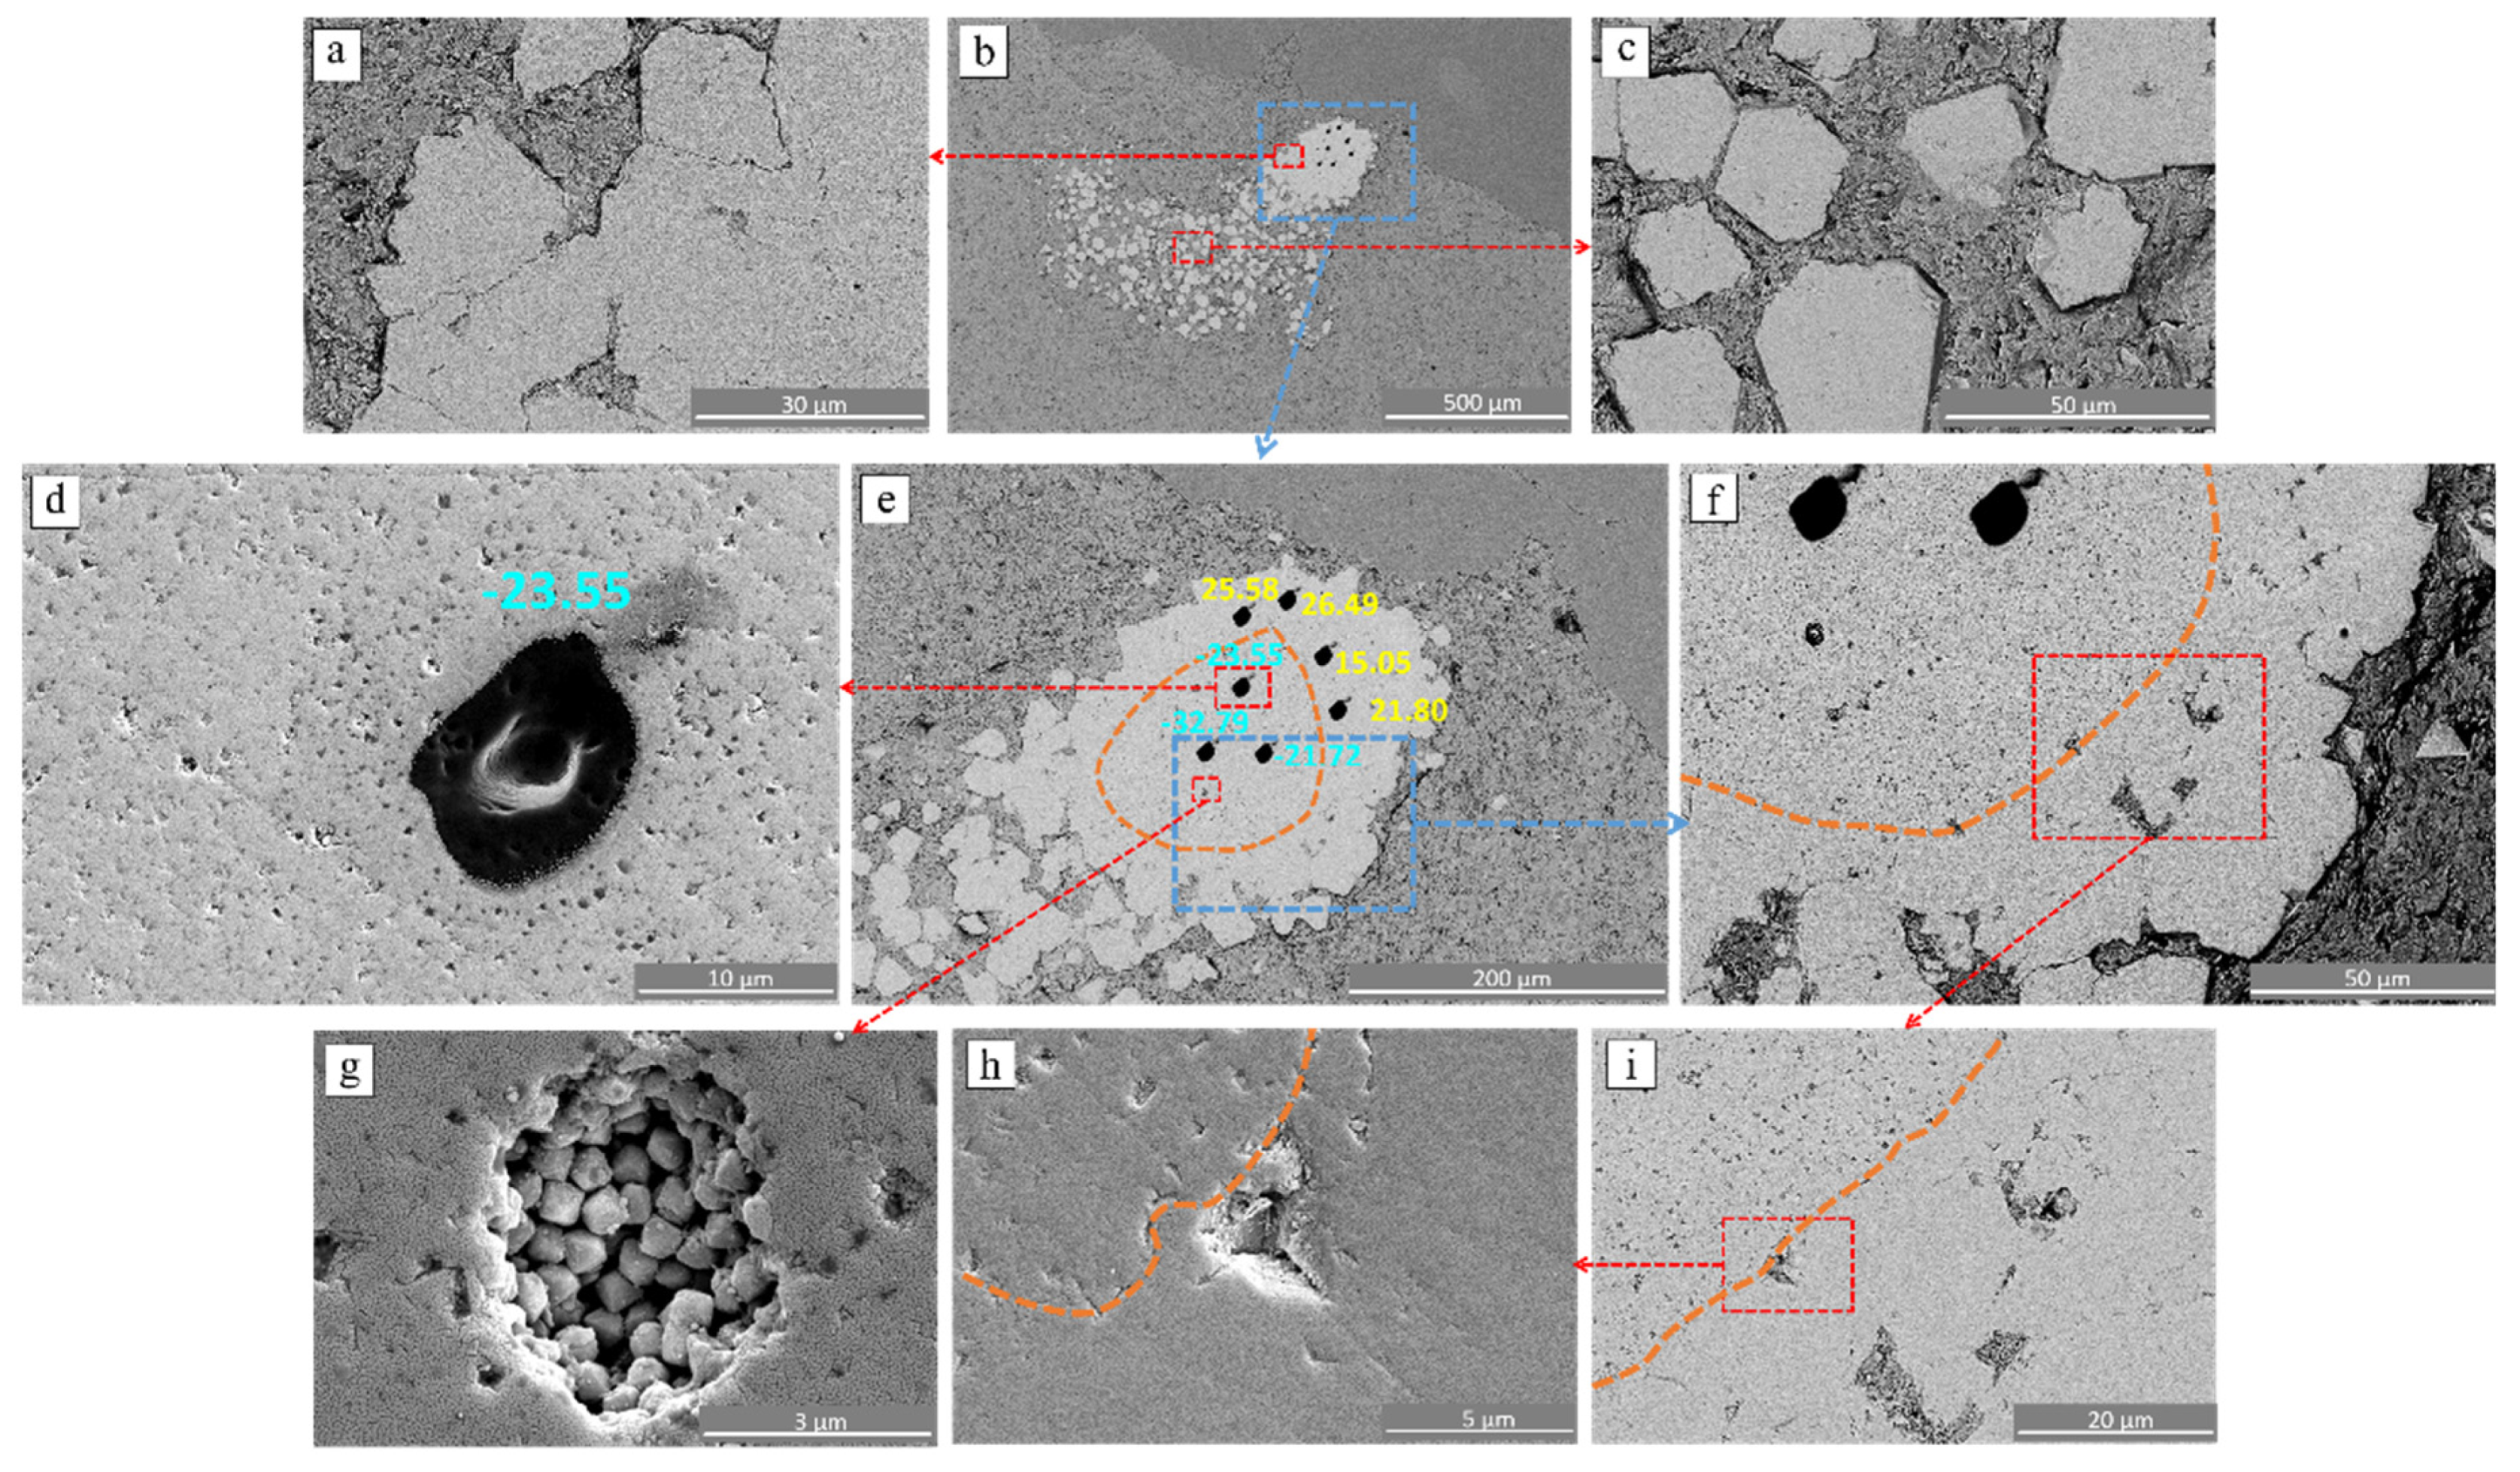
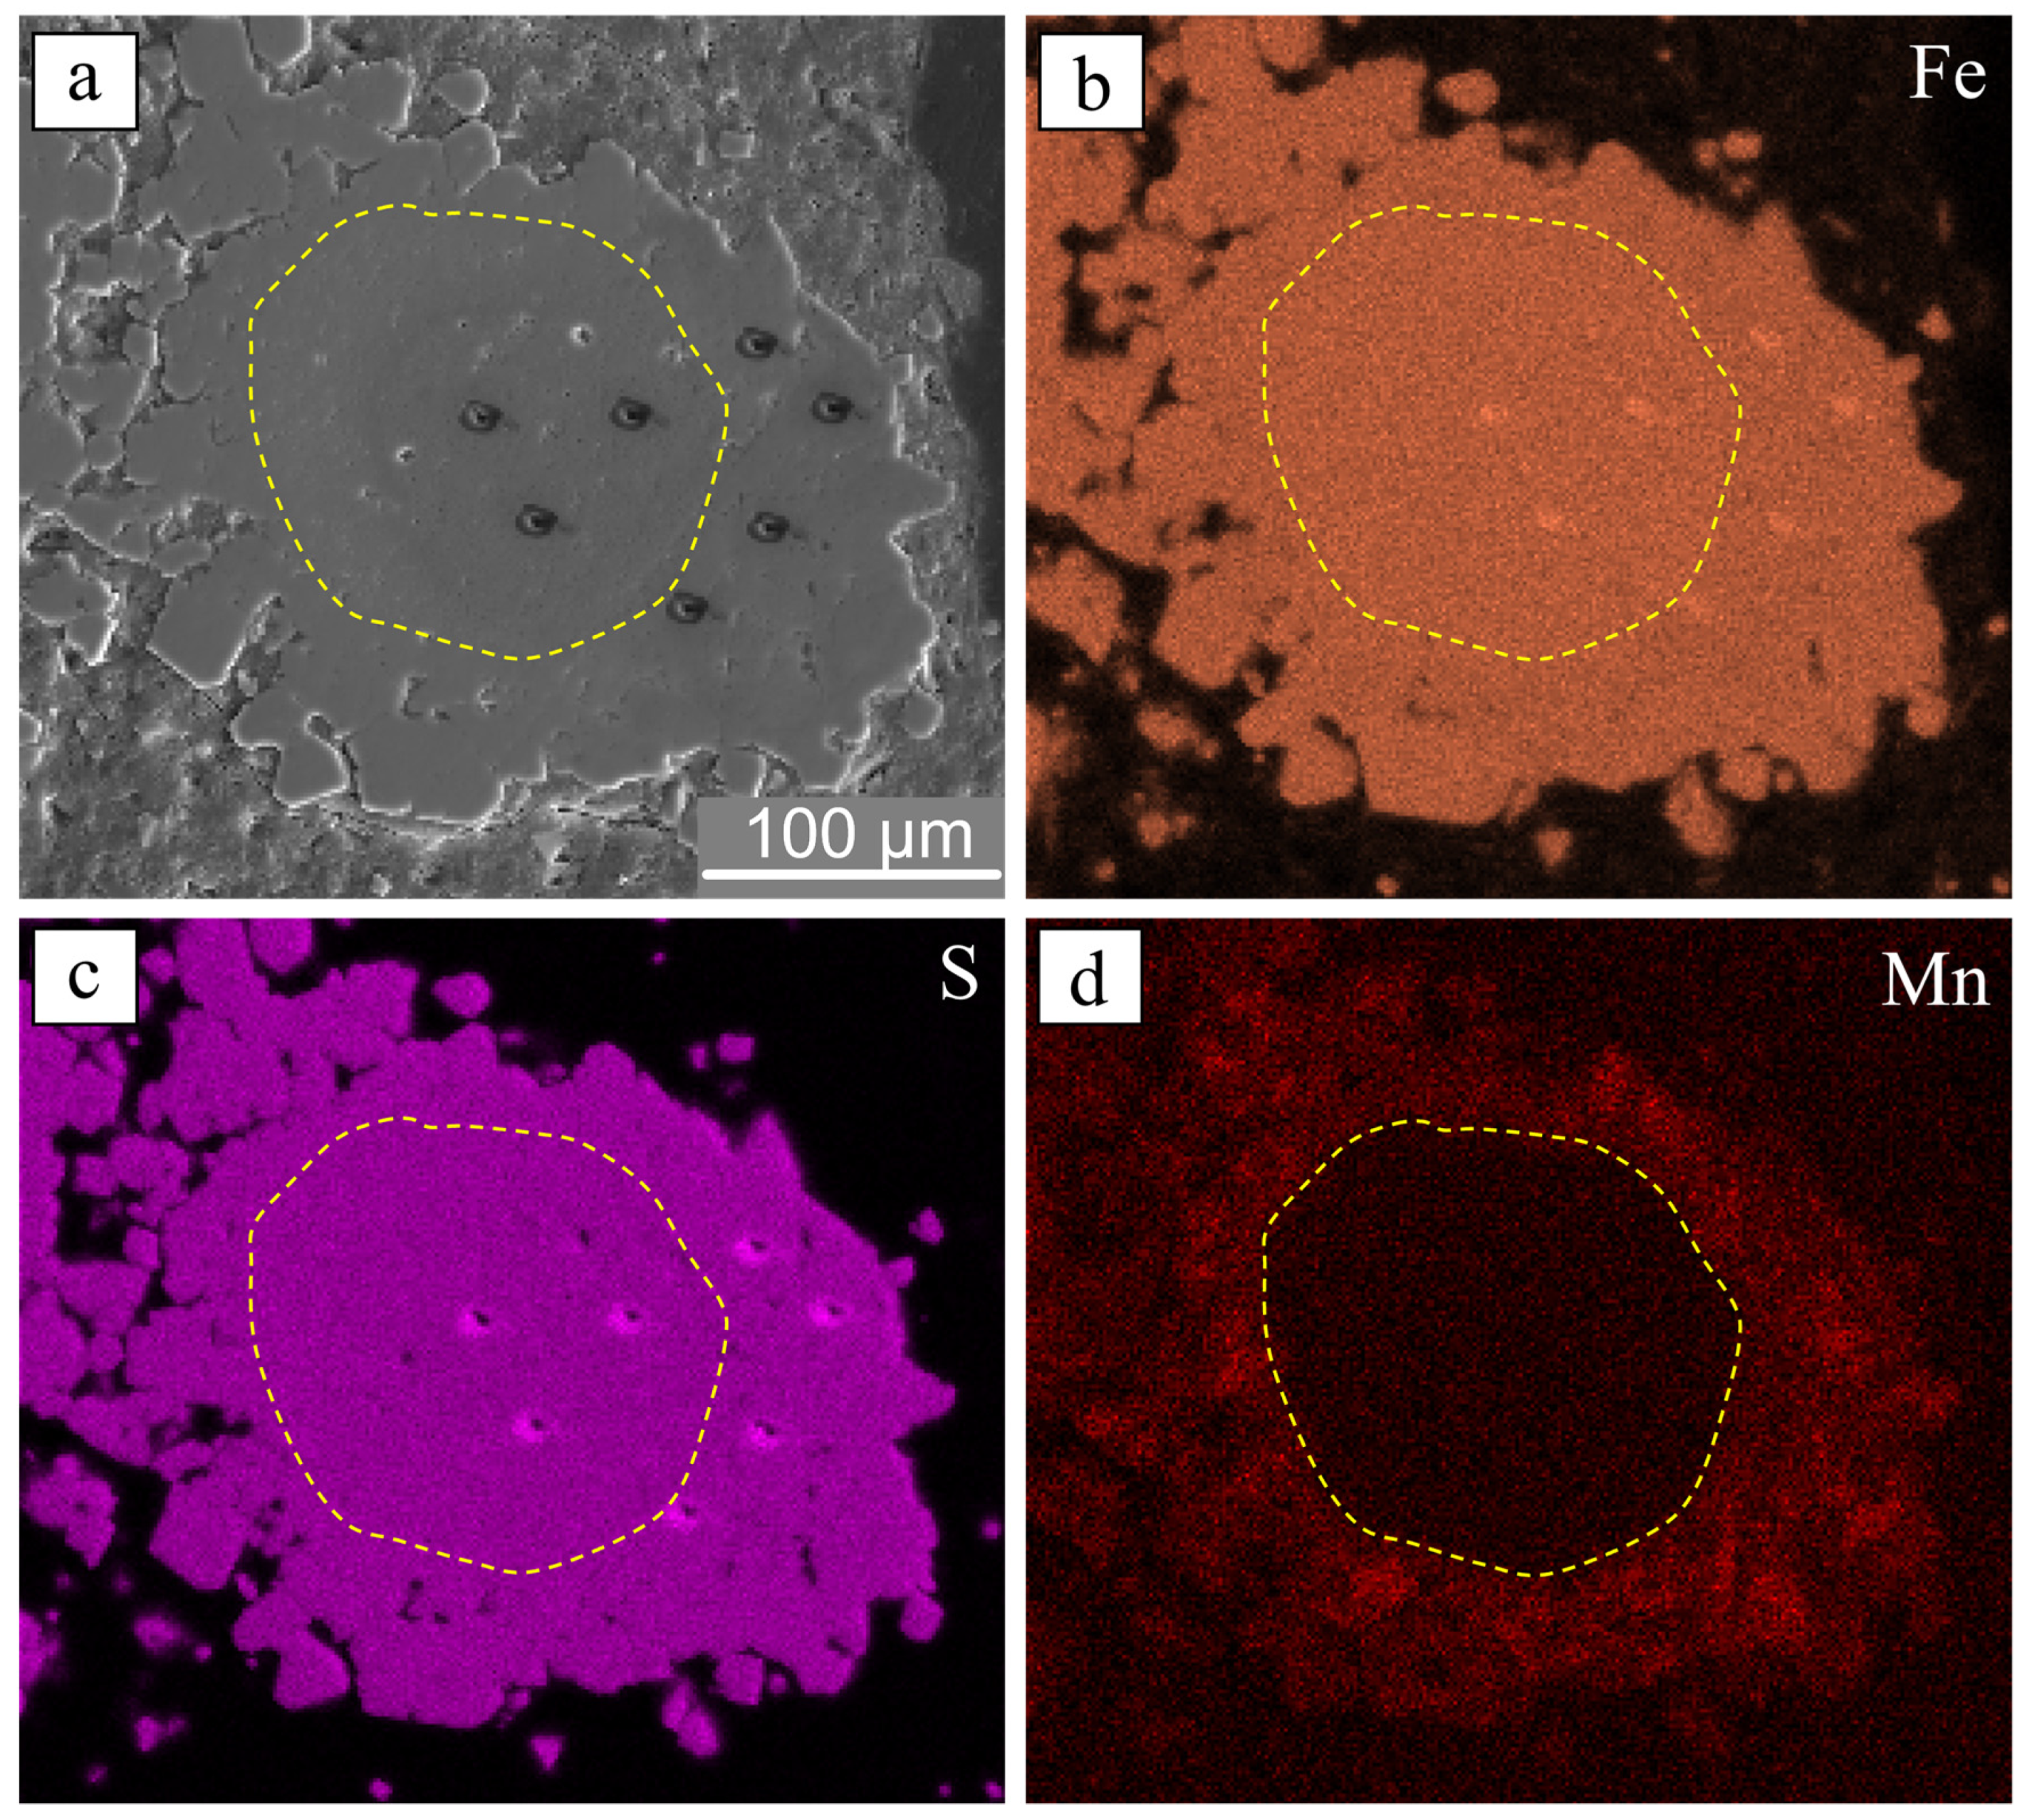
  • Large euhedral crystals (15–30 µm in size) were non-uniformly distributed in layers and aggregates within the rocks (Figure 3e,f).
Figure 2 graphically shows the different pyrite morphologies There are intervals where:
  • Framboids predominant (members 1–5);
  • Framboids alternated with small crystals, which replaced organic remnants (Georgiev Formation and members 6–8);
  • Large crystals localized in the layers of the upper portion of the section (member 8).
Additional SEM images showed the textural difference between the aggregate interior and the rim (Figure 4a–h). The inner part of the aggregate has numerous pits filled with nano-sized crystals (Figure 4e,g), whereas the outer parts have coarse crystals (Figure 4f,i,h). These coarse crystals (>10 µm) have pronounced grain boundaries (Figure 4a–c). The boundary between inner and outer portions of the aggregate is shown on Figure 4f,h,i. Moreover, SEM EDS mapping showed the presence of Mn predominantly in the outer part of the aggregate (Figure 5d), where δ34S values are positive.
Imaging with SEM EDS yielded homogeneous distribution of S and Fe within large pyrite aggregate confirming that it consist entirely of FeS2. In contrast to S and Fe, analysis shows that Mn was depleted in the center and enriched near the rim of the aggregate (Figure 5).

4.3. Sulfur Isotope Composition (Bulk IRMS)

Seventeen samples were analyzed with IRMS for evaluating bulk δ34S in the core (Figure 2). The accuracy of bulk isotope analysis is supported by the predominance of pyrite, the main host of sulfur, as only the trace amounts of ZnS sphalerite and chalcopyrite were identified with SEM EDS present in the upper portion of the section only. The obtained values of δ34SCDT varied from −37.3 to +4.2‰. Although most of the samples were isotopically light (i.e., −37.3 ≤ δ34SCDT ≤ −18.6‰), there were three samples where δ34SCDT exceeded −18‰: −7.8‰ (member 5); −4.4‰ (member 6); and +4.2‰ (member 8).

4.4. Sulfur Isotope Composition of Individual Pyrites (SIMS)

To determine δ34S of the identified morphotypes of pyrite, four samples were selected from the different members of the section (Figure 2). Thirty-six spot analyses were conducted using SIMS (Table A1) and the ranges of isotope data for each morphology in each sample are presented in Table 1. Overall, δ34SCDT varied from −55 to +26‰. The lightest sulfur (δ34SCDT = −55.38‰) was observed in small pyrite framboids (Figure 6a). The heaviest sulfur (δ34SCDT = +26.49‰) was trapped in the outer portion (rim) of the aggregate of large euhedral pyrite crystals (Figure 5c). The inner portion (center) of the same aggregate is isotopically lighter (−32.79 ≤ δ34SCDT ≤ −21.72‰) and the border between “heavy” rim and “light” center is visible on reflected light and SEM images (Figure 6c).

5. Discussion

Sulfur isotopes are useful for studying the origin of pyrite (i.e., involvement of microorganisms in crystallization process). The range of sulfur isotope composition, observed in our study, suggests pyrite crystallization was caused by microbial sulfate reduction [31], which produced isotopically light hydrogen sulfide, i.e., δ34Ssulfide-δ34Ssulfate was as large as −77‰ [32,33]. The observed variation in sulfur isotope compositions and morphologies of pyrite was likely controlled by changes in redox conditions during sedimentation and burial processes as well as by Ryleigh fractionation. At reduced or oxygen-depleted conditions, isotopically light pyrite could crystallize above the sediment-water boundary or in the upper layer of sediments having an excess of marine sulfate (i.e., open system). During diagenesis, crystallization of pyrite could occur in porewaters, where access to sulfate is restricted (i.e., system is closed) and progressively reduced sulfate became enriched in 34S. As a result, sulfide and pyrite became isotopically heavy compared to those in the open system.
In an open system, crystallization of small framboids of isotopically light syngenetic pyrite (δ34S = −62 to −50‰) is expected [32,33], which was likely the case for pyrites from our study where δ34S values of small pyrite framboids were as low as −55.38‰ (Figure 6a), suggesting pyrite formed in anoxic conditions or/and in the presence of hydrogen sulfide. The change in depositional environment from open to closed system can explain the observed wide isotopic range (Table A1). In the large pyrite aggregate, δ34S was negative in the center and positive at the rim (δ34S > + 15‰) (Figure 6c). The porous nature of the aggregate center suggests that it consists of small framboids and probably was deposited at a high rate, as was previously observed [8,34]. An increase of δ34S (from −33 to +26‰) with this aggregate can be explained by Rayleigh fractionation (discussed further in the text). In the late Jurassic, δ34Ssulfate varied from +15 to +20‰ [35] or from +17 to +18‰ [36], with the average value of 17.5‰, and therefore, the expected δ34S of accumulated pyrite should not exceed this δ34Ssulfate value. This restriction is not necessary for instantaneously precipitated pyrite. A gap between negative and positive values of δ34S in pyrite aggregate can be explained by suppression of the pyrite crystallization due to temporary oxygenation of the depositional environment. The later diagenesis allowed the development of sulfate-reducing and oxygen-depleting anaerobic microorganisms, which caused an increase in hydrogen sulfide in porewaters and crystallization of isotopically heavy, large pyrite crystals (in the rim of the large aggregate) at a probably slow growth rate. Magnall et al. [37] made a similar conclusion on their work in Canada. The lack of sulfate exchange between porewater and seawater caused progressive 34S enrichment in sulfate, hydrogen sulfide, and pyrite.
The effort was taken to explain this isotope fractionation with a Rayleigh model. A Rayleigh equation was applied to explain the isotopic fractionation by calculating the evolution of δ34S of the dissolved sulfate, instantaneous sulfide, and accumulated pyrite as a function of the fraction of sulfate (f) controlled by microbial sulfate reduction:
δ 34 S s u l f a t e = ( δ 34 S s u l f a t e 0 1000 ) · f α 1 1000 ,
δ 34 S s u l f i d e = δ 34 S s u l f a t e 72.88
δ 34 S p y r i t e = ( R s u l f a t e 0 R C D T · 1 f α 1 f 1 ) · 1000 ,
here R s u l f a t e 0 is an initial ratio of 34S/32S in sulfate (when f = 1); isotope difference between sulfide and sulfate (i.e.,   δ 34 S s u l f i d e δ 34 S s u l f a t e ) is −72.88‰ [33]; α is an apparent fractionation factor between dissolved sulfide and sulfate: α = R s u l f i d e R s u l f a t e = 1 + δ 34 S s u l f i d e δ 34 S s u l f a t e 1000 = 1 0.07288 = 0.927 ; α is not a thermodynamic fractionation factor as it depends on the reduction rate of sulfate (e.g., Fry et al. [38]). The chosen fractionation factor (0.927) is within the range of previously reported values [33,39,40]. We selected fractionation magnitude (−72.88) as a difference between δ34S of the minimum measured value in pyrite and sulfate of Jurassic seawater. The selected fractionation is bigger than those (up to −66‰) obtained in the cultured experiment of Sim et al. [41]. However, it is at the highest end of fractionation observed in natural systems (up to −72‰) by Canfield et al. [42], within the theoretic limit (−75.7‰) Otake et al. [43], and within the ranges (up to −77‰) reported in Rudnicki [32] and Brunner [33].
The selected magnitude fractionation (−72.88‰) allowed fitting bulk and SIMS data with the Rayleigh model, via adjusting the f value for accumulated and instantaneous sulfide, respectively (Figure 7). If fractionation of −66‰ from Sim et al. [41] is assumed, then the Rayleigh model cannot fit the most negative SIMS datum (i.e., −55.38‰). Evolution curves of δ34S of the remaining sulfate and instantaneous sulfide with f are always different by −72.88‰ (Figure 7a, Equations (3) and (4)). No isotope fractionation between aqueous sulfide and pyrite was assumed while plotting measured δ34Spyrite versus f determined by Equation (5). The reason why offsets between pyrite and aqueous sulfur species vary with f is that as soon as pyrite crystallized, it did not interact with sulfate or sulfide. When sulfate reduction was completed, the accumulated pyrite has δ34S values equal to the initial sulfate δ34S:   δ 34 S p y r i t e ,   f = 0 = δ 34 S s u l f a t e ,   f = 1 = δ 34 S s u l f a t e 0 = 17.5‰ (Figure 7a, dashed line).
The Rayleigh fractionation curves for accumulated pyrite and instantaneous sulfide (pyrite) fit δ34Spyrite data measured with bulk IRMS and in situ SIMS techniques, respectively (Figure 7b). The large gap between negative and positive SIMS δ34Spyrite data (Figure 7b) suggests that there was an interruption in pyrite growth (or at least a decrease of the crystallization rate), which is also shown by the distribution of δ34S within the pyrite aggregate (Figure 6c). This fact confirms the change in pyrite growth regime and suggests that the progressive development of anoxic conditions along with the exhausting of sulfate led to a reduction in Mn-oxides from sediment porewater under low Eh conditions. The higher concentration of Mn in pore water at the late stage of diagenesis contributed to the coprecipitation of Mn during formation of outer parts of pyrite aggregates [44,45]. The observed isotopic, elemental, and textural features suggest that the growth of the outer layer occurred at conditions different from those that enhanced growth of the pyrite aggregate interior. The large variability in sulfur isotopes and trace elements within a single grain of pyrite was reported by Nabhan et al. [46]. They suggested that the growth of the pyrite rim, enriched in Ni and Co and depleted in δ34S, occurred from pore fluids enriched in isotopically light sulfide and in Ni and Co derived from weathering of ultramafic rocks.

6. Conclusions

Four types of pyrite were identified in the sediments of the Bazhenov Formation of Siberia: small framboids, aggregation of small crystals, large framboids, and large euhedral crystals. Sulfur isotopes analyses show small framboids and microcrystalline pyrite are isotopically light, with δ34SCDT varying from −55 to −20‰. Large framboids and euhedral crystals of pyrite are isotopically heavy with δ34SCDT up to +26‰.
The dominating abundance of small framboids suggests that pyrite sedimentation in the section of the Bazhenov Formation occurred under anoxic conditions with the presence of hydrogen sulfide above sediment-water boundary or in the upper layer of sediments with an excess of marine sulfate. These conditions are favorable for the accumulation of organic matter. The presence of the large framboids and euhedral crystals of pyrite in several sediment layers suggests another pattern of sulfide formation. The accumulation of sediments occurred at suboxic conditions; the depositional environment was unfavorable for pyrite formation. Anoxic conditions, necessary for microbial sulfate reduction and sulfide formation, have been developed in porewater of these layers during the burial of sediments, which decreased the connectivity between the porewater and overlying seawater and formed in diagenesis a restriction in respect to the oxygen and sulphate system. Therefore, the presence of the large framboids and euhedral pyrite crystals suggest conditions unfavorable for the accumulation and preservation of organic matter.

Author Contributions

Conceptualization, A.V. and M.S.; funding acquisition, M.S.; investigation, E.I., R.G., T.K., A.V. and M.-C.L.; methodology, E.I., T.K. and R.G.; project administration, N.B. and M.S.; visualization, E.I., T.K. and R.G.; writing—original draft preparation, E.I., R.G. and N.B.; writing—review and editing, A.V., M.-C.L. and M.S. All authors have read and agreed to the published version of the manuscript.

Funding

This work was supported by the Ministry of Science and Higher Education of the Russian Federation under agreement No. 075-10-2020-119 within the framework of the development program for a world-class research center. SIMS analyses were supported by the Department of Geosciences (MSU) and the Department of Earth, Planetary, and Space Sciences (UCLA). The UCLA ion microprobe facility is partially supported by a grant from the NSF Instrumentation and Facilities program.

Data Availability Statement

Data is not available.

Acknowledgments

We thank Roobanvenkatesh Kulandaivelu Govindarajulu Thirumalai, Vladimir Poshibaev, and Olga Antipova for the help with preliminary SEM imaging (not included in publication).

Conflicts of Interest

The authors declare no conflict of interest.

Appendix A

Table A1. Detailed SIMS results.
SampleMorphologySize, µmδ34SMineral and Element Composition (EDS)
11Aggregate of euhedral crystals25015.05FeS2
21Aggregate of euhedral crystals25026.49FeS2
31Aggregate of euhedral crystals25025.58FeS2
41Aggregate of euhedral crystals25021.80FeS2
51Aggregate of euhedral crystals250−23.55FeS2
61Aggregate of euhedral crystals250−21.72FeS2
71Aggregate of euhedral crystals250−32.79FeS2
81Single crystal12−14.39CuFeS2
92Small framboid10−14.40FeS2 (contaminated Si = 5.08 at%)
102Euhedral crystal40−18.08ZnS
112Euhedral crystal40−18.56ZnS
122Large framboid?-−13.51FeS2
132Large framboid?-−15.84FeS2
142-20−15.9ZnS (contaminated with Cu, Fe, Si, Al)
152-10−10.72FeS2
162Framboid aggregate10−8.95FeS (contaminated with Zn, Si, Al)
173Aggregate of small framboids10−22.49FeS
183Small framboid10−36.28FeS2
193Aggregate of small framboids30−55.38FeS2
203Aggregate of small framboids30−35.47FeS2
213Consolidated aggregate72−19.52FeS2
223Consolidated aggregate72−21.05FeS2
233Consolidated aggregate27−12.51FeS2
243Consolidated aggregate27−22.02FeS2
254Aggregate of small framboids20−22.87-
264Aggregate of small framboids20−30.39-
274Aggregate of small framboids-−40.51-
284Aggregate of small framboids-−26.02-
294Aggregate of small framboids-−30.79-
304Aggregate of small framboids7–10?−16.96-
314Aggregate of small framboids7−28.87FeS2
324Aggregate of small framboids10−26.51FeS
334Small framboid7–10?−18.11FeS
344Small framboid5−20.59FeS (contaminated with Mn)
354Small framboid7−14.35FeS (contaminated with Mn)
364Small framboid7−31.12FeS (contaminated with Mn)
Isotope data for CuFeS2 and FeS are subject to a few permille errors because of the absence of matrix-matched SIMS standards. Therefore, these data should be used with caution.

References

  1. Jiang, Z.; Zhang, W.; Liang, C.; Wang, Y.; Liu, H.; Chen, X. Basic Characteristics and Evaluation of Shale Oil Reservoirs. Pet. Res. 2016, 1, 149–163. [Google Scholar] [CrossRef]
  2. Tyson, R.V. Organic Matter Preservation: The Effects of Oxygen Deficiency. In Sedimentary Organic Matter; Springer: Dordrecht, The Netherlands, 1995; pp. 119–149. ISBN 978-94-010-4318-2. [Google Scholar]
  3. Gorsline, D.S.; Tyson, R.V.; Pearson, T.H. Modern and Ancient Continental Shelf Anoxia. PALAIOS 1993, 8, 307. [Google Scholar] [CrossRef]
  4. Kristensen, E. Organic Matter Diagenesis at the Oxic/Anoxic Interface in Coastal Marine Sediments, with Emphasis on the Role of Burrowing Animals. Hydrobiologia 2000, 426, 1–24. [Google Scholar] [CrossRef]
  5. Fisher, I.S.J.; Hudson, J.D. Pyrite Geochemistry and Fossil Preservation in Shales. Philos. Trans. R. Soc. Lond. B 1985, 311, 167–169. [Google Scholar] [CrossRef]
  6. Wilkin, R.T.; Barnes, H.L.; Brantley, S.L. The Size Distribution of Framboidal Pyrite in Modern Sediments: An Indicator of Redox Conditions. Geochim. Cosmochim. Acta 1996, 60, 3897–3912. [Google Scholar] [CrossRef]
  7. Wang, P.; Huang, Y.; Wang, C.; Feng, Z.; Huang, Q. Pyrite Morphology in the First Member of the Late Cretaceous Qingshankou Formation, Songliao Basin, Northeast China. Palaeogeogr. Palaeoclimatol. Palaeoecol. 2013, 385, 125–136. [Google Scholar] [CrossRef]
  8. Liu, Z.; Chen, D.; Zhang, J.; Lü, X.; Wang, Z.; Liao, W.; Shi, X.; Tang, J.; Xie, G. Pyrite Morphology as an Indicator of Paleoredox Conditions and Shale Gas Content of the Longmaxi and Wufeng Shales in the Middle Yangtze Area, South China. Minerals 2019, 9, 428. [Google Scholar] [CrossRef] [Green Version]
  9. Raiswell, R.; Berner, R.A. Pyrite and Organic Matter in Phanerozoic Normal Marine Shales. Geochim. Cosmochim. Acta 1986, 50, 1967–1976. [Google Scholar] [CrossRef]
  10. Wilkin, R.T.; Barnes, H.L. Formation Processes of Framboidal Pyrite. Geochim. Cosmochim. Acta 1997, 61, 323–339. [Google Scholar] [CrossRef]
  11. Soliman, M.F.; El Goresy, A. Framboidal and Idiomorphic Pyrite in the Upper Maastrichtian Sedimentary Rocks at Gabal Oweina, Nile Valley, Egypt: Formation Processes, Oxidation Products and Genetic Implications to the Origin of Framboidal Pyrite. Geochim. Cosmochim. Acta 2012, 90, 195–220. [Google Scholar] [CrossRef]
  12. Kozina, N.; Reykhard, L.; Dara, O.; Gordeev, V. Framboidal Pyrite Formation in the Bottom Sediments of the South Caspian Basin under Conditions of Hydrogen Sulfide Contamination. Russ. J. Earth Sci. 2018, 18, 1–10. [Google Scholar] [CrossRef]
  13. Berner, R.A. Sedimentary Pyrite Formation: An Update. Geochim. Cosmochim. Acta 1984, 48, 605–615. [Google Scholar] [CrossRef]
  14. Berner, R.A. Burial of Organic Carbon and Pyrite Sulfur in the Modern Ocean: Its Geochemical and Environmental Significance. Am. J. Sci. 1982. [Google Scholar] [CrossRef]
  15. Blood, D.R.; Lash, G.G. Dynamic redox conditions in the Marcellus Shale as recorded by pyrite framboid size distributions. In Geological Society of America Special Papers; Geological Society of America: McLean, VA, USA, 2015; Volume 515, pp. 153–168. ISBN 978-0-8137-2515-4. [Google Scholar]
  16. Wang, W.; Hu, Y.; Muscente, A.D.; Cui, H.; Guan, C.; Hao, J.; Zhou, C. Revisiting Ediacaran Sulfur Isotope Chemostratigraphy with in Situ NanoSIMS Analysis of Sedimentary Pyrite. Geology 2021, 49, 611–616. [Google Scholar] [CrossRef]
  17. Loka Bharathi, P.A. Sulfur Cycle. In Encyclopedia of Ecology; Elsevier: Amsterdam, The Netherlands, 2008; pp. 3424–3431. ISBN 978-0-08-045405-4. [Google Scholar]
  18. Parkes, R.J.; Sass, H. Deep Sub-Surface. In Encyclopedia of Microbiology; Elsevier: Amsterdam, The Netherlands, 2009; pp. 64–79. ISBN 978-0-12-373944-5. [Google Scholar]
  19. Beaudoin, G.; Taylor, B.E.; Rumble, D.; Thiemens, M. Variations in the Sulfur Isotope Composition of Troilite from the Cañon Diablo Iron Meteorite. Geochim. Cosmochim. Acta 1994, 58, 4253–4255. [Google Scholar] [CrossRef]
  20. Seal, R.R. Sulfur Isotope Geochemistry of Sulfide Minerals. Rev. Mineral. Geochem. 2006, 61, 633–677. [Google Scholar] [CrossRef]
  21. Afanasiev, I.S.; Gavrilova, E.V.; Birun, E.M.; Kalmykov, G.A.; Balushkina, N.S. Bazhenov Formation. Overall Review, Unsolved Problems. Sci. Tech. Bull. MK Rosneft 2010, 4, 20–25. [Google Scholar]
  22. Gurova, T.I.; Kazarinov, V.P. Lithology and Paleogeography of the West Siberian Plain in Terms of Petroleum Potential; Gostoptekhizdat: Moscow, Russia, 1962. (In Russian) [Google Scholar]
  23. Golbert, A.V.; Markova, L.G.; Polyakova, I.D.; Saks, V.N.; Teslenko, Y.V. Paleolandscapes of West Siberia in the Jurassic, Cretaceous and Paleogene; Saks, V.N., Ed.; Nauka: Moscow, Russia, 1968. (In Russian) [Google Scholar]
  24. Zubkov, M.Y. Rocks of the Bazhenovo and Abalak Formations, Central Krasnoleninsk Arch, Western Siberia: Composition, Structure, and Formation Conditions. Lithol. Miner. Resour. 2001, 36, 33–42. [Google Scholar] [CrossRef]
  25. Kontorovich, A.E.; Yan, P.A.; Zamirailova, A.G.; Kostyreva, E.A.; Eder, V.G. Classification of Rocks of the Bazhenov Formation. Russ. Geol. Geophys. 2016, 57, 1606–1612. [Google Scholar] [CrossRef]
  26. Zakharov, V.A.; Zanin, Y.N.; Zamirailova, A.G. First Find of Trace Fossils in High-Carbon Black Shales of the Bazhenov Formation, West Siberia. Geol. Geofiz. 1998, 39, 402–405. [Google Scholar]
  27. Kontorovich, A.E.; Ershov, S.V.; Kazanenkov, V.A.; Karogodin, Y.N.; Kontorovich, V.A.; Lebedeva, N.K.; Nikitenko, B.L.; Popova, N.I.; Shurygin, B.N. Cretaceous Paleogeography of the West Siberian Sedimentary Basin. Russ. Geol. Geophys. 2014, 55, 582–609. [Google Scholar] [CrossRef]
  28. Ryzhkova, S.V.; Burshtein, L.M.; Ershov, S.V.; Kazanenkov, V.A.; Kontorovich, A.E.; Kontorovich, V.A.; Nekhaev, A.Y.; Nikitenko, B.L.; Fomin, M.A.; Shurygin, B.N.; et al. The Bazhenov Horizon of West Siberia: Structure, Correlation, and Thickness. Russ. Geol. Geophys. 2018, 59, 846–863. [Google Scholar] [CrossRef]
  29. Ulmishek, G.F. Petroleum Geology and Resources of the West Siberian Basin, Russia; US Geological Survey: Reston, VA, USA, 2003.
  30. Kozdon, R.; Williford, K.; Kita, N.; Huberty, J.; Fournelle, J.; Valley, J. In Situ Sulfur Isotope Analysis of Sphalerite and Other Sulfides by SIMS: Precision vs. Accuracy. In Proceedings of the Astrobiology Science Conference 2010: Evolution and Life: Surviving Catastrophes and Extremes on Earth and Beyond, League City, TX, USA, 26–29 April 2010. [Google Scholar]
  31. Thiel, J.; Byrne, J.M.; Kappler, A.; Schink, B.; Pester, M. Pyrite Formation from FeS and H2S Is Mediated through Microbial Redox Activity. Proc. Natl. Acad. Sci. USA 2019, 116, 6897–6902. [Google Scholar] [CrossRef] [Green Version]
  32. Rudnicki, M.D.; Elderfield, H.; Spiro, B. Fractionation of Sulfur Isotopes during Bacterial Sulfate Reduction in Deep Ocean Sediments at Elevated Temperatures. Geochim. Cosmochim. Acta 2001, 65, 777–789. [Google Scholar] [CrossRef]
  33. Brunner, B.; Bernasconi, S.M. A Revised Isotope Fractionation Model for Dissimilatory Sulfate Reduction in Sulfate Reducing Bacteria. Geochim. Cosmochim. Acta 2005, 69, 4759–4771. [Google Scholar] [CrossRef]
  34. Sawlowicz, Z. Pyrite Framboids and Their Development: A New Conceptual Mechanism. Geol. Rundsch. 1993, 82, 148–156. [Google Scholar] [CrossRef]
  35. Strauss, H. The Isotopic Composition of Sedimentary Sulfur through Time. Palaeogeogr. Palaeoclimatol. Palaeoecol. 1997, 132, 97–118. [Google Scholar] [CrossRef]
  36. Kampschulte, A.; Strauss, H. The Sulfur Isotopic Evolution of Phanerozoic Seawater Based on the Analysis of Structurally Substituted Sulfate in Carbonates. Chem. Geol. 2004, 204, 255–286. [Google Scholar] [CrossRef]
  37. Magnall, J.M.; Gleeson, S.A.; Stern, R.A.; Newton, R.J.; Poulton, S.W.; Paradis, S. Open System Sulphate Reduction in a Diagenetic Environment–Isotopic Analysis of Barite (Δ34S and Δ18O) and Pyrite (Δ34S) from the Tom and Jason Late Devonian Zn–Pb–Ba Deposits, Selwyn Basin, Canada. Geochim. Cosmochim. Acta 2016, 180, 146–163. [Google Scholar] [CrossRef] [Green Version]
  38. Fry, B.; Gest, H.; Hayes, J.M. 34S/32S Fractionation in Sulfur Cycles Catalyzed by Anaerobic Bacteria. Appl. Environ. Microbiol. 1988, 54, 250–256. [Google Scholar] [CrossRef] [PubMed] [Green Version]
  39. Werne, J.P.; Lyons, T.W.; Hollander, D.J.; Formolo, M.J.; Sinninghe Damsté, J.S. Reduced Sulfur in Euxinic Sediments of the Cariaco Basin: Sulfur Isotope Constraints on Organic Sulfur Formation. Chem. Geol. 2003, 195, 159–179. [Google Scholar] [CrossRef]
  40. Claypool, G.E. Ventilation of marine sediments indicated by depth profiles of pore water sulfate and δ34S. In The Geochemical Society Special Publications; Elsevier: Amsterdam, The Netherlands, 2004; Volume 9, pp. 59–65. ISBN 978-0-444-51647-3. [Google Scholar]
  41. Sim, M.S.; Bosak, T.; Ono, S. Large Sulfur Isotope Fractionation Does Not Require Disproportionation. Science 2011, 333, 74–77. [Google Scholar] [CrossRef]
  42. Canfield, D.E.; Farquhar, J.; Zerkle, A.L. High Isotope Fractionations during Sulfate Reduction in a Low-Sulfate Euxinic Ocean Analog. Geology 2010, 38, 415–418. [Google Scholar] [CrossRef]
  43. Otake, T.; Lasaga, A.C.; Ohmoto, H. Ab Initio Calculations for Equilibrium Fractionations in Multiple Sulfur Isotope Systems. Chem. Geol. 2008, 249, 357–376. [Google Scholar] [CrossRef]
  44. Eaton, A. The Impact of Anoxia on Mn Fluxes in the Chesapeake Bay. Geochim. Cosmochim. Acta 1979, 43, 429–432. [Google Scholar] [CrossRef]
  45. De Baar, H.J.W.; German, C.R.; Elderfield, H.; van Gaans, P. Rare Earth Element Distributions in Anoxic Waters of the Cariaco Trench. Geochim. Cosmochim. Acta 1988, 52, 1203–1219. [Google Scholar] [CrossRef]
  46. Nabhan, S.; Wiedenbeck, M.; Milke, R.; Heubeck, C. Biogenic Overgrowth on Detrital Pyrite in ca. 3.2 Ga Archean Paleosols. Geology 2016, 44, 763–766. [Google Scholar] [CrossRef]
Figure 2. Well section: stratigraphy, gamma ray log, stratigraphic column, mineral composition of the rocks, amount of organic matter, types of kerogen and distribution of δ34S. Pyrite morphology column shows relative proportion of different morphotypes in the rocks investigated with SEM. Diamonds on the right column correspond to the samples selected for SIMS isotope analyses.
Geosciences 11 00355 g002
Figure 3. Morphologies of pyrite in the studied sediments (SEM images in secondary electrons mode): (a) Small framboids; (b) Large framboids; (c,d) Small crystals; and (e,f) Large euhedral crystals. Scale bars shown on each image.
Geosciences 11 00355 g003
Figure 4. SEM images of an aggregate of large euhedral crystals: (a) Large euhedral crystals in the rim of the aggregate; (b) General view of the aggregate; (c) Separated large euhedral crystals; (d) Porous structure in the inner part of the aggregate; and (e) δ34S values obtained using SIMS. The dashed orange line shows the boundary between inner and outer parts of the aggregate; (f,h,i) Red box is section near boundary between inner and outer parts of the large aggregate (inner negative, outer positive); (g) Nanocrystals in the inner part; and (h,i) Boundary between inner (negative values of δ34S) and outer (positive values of δ34S) of the aggregate.
Geosciences 11 00355 g004
Figure 5. SEM EDS mapping results: (a) SEM image of aggregate of large euhedral crystals. Dark spots show SIMS analytical points; (b) Distribution of iron (Fe); (c) Distribution of sulfur (S); and (d) Distribution of manganese (Mn). Yellow dashed line shows the boundary between outer Mn-enriched zone and interior Mn-scarce zones.
Geosciences 11 00355 g005
Figure 6. SEM images with δ34S values in the pyrites of different morphologies: (a,b) Aggregates of small pyrite framboids; (c) Aggregate of large euhedral pyrite crystals—dashed line shows the boundary between positive and negative parts of the aggregate in terms of dS34; and (d) Consolidated aggregates of framboids or small pyrite crystals.
Geosciences 11 00355 g006
Figure 7. Rayleigh fractionation calculations showing (a) Isotope evolution of aqueous sulfate, instantaneous sulfide, and accumulated pyrite with remained fraction of sulfate ( f ). The dashed line is the δ34S value of marine sulfate in the late Jurassic (17.5‰); (b) The δ34S data obtained by IRMS (bulk) and SIMS (in situ) techniques are placed on the accumulated and instantaneous curves by adjusting f values.
Geosciences 11 00355 g007
Table 1. SIMS data.
Table 1. SIMS data.
SampleNumber of PointsMorphologySize, µmδ34SCDT, ‰
17Aggregate of euhedral crystals250*150 (−32)–(+26)
22Large framboids10–15(−14)–(−16)
33Aggregate of small framboids30 (−55)–(−35)
34Consolidated aggregate of small crystals or framboids30–70 (−22)–(−12)
45Aggregate of small crystals or framboids15–20 (−40)–(−22)
43Aggregate of small framboids7–10 (−17)–(−29)
Publisher’s Note: MDPI stays neutral with regard to jurisdictional claims in published maps and institutional affiliations.

