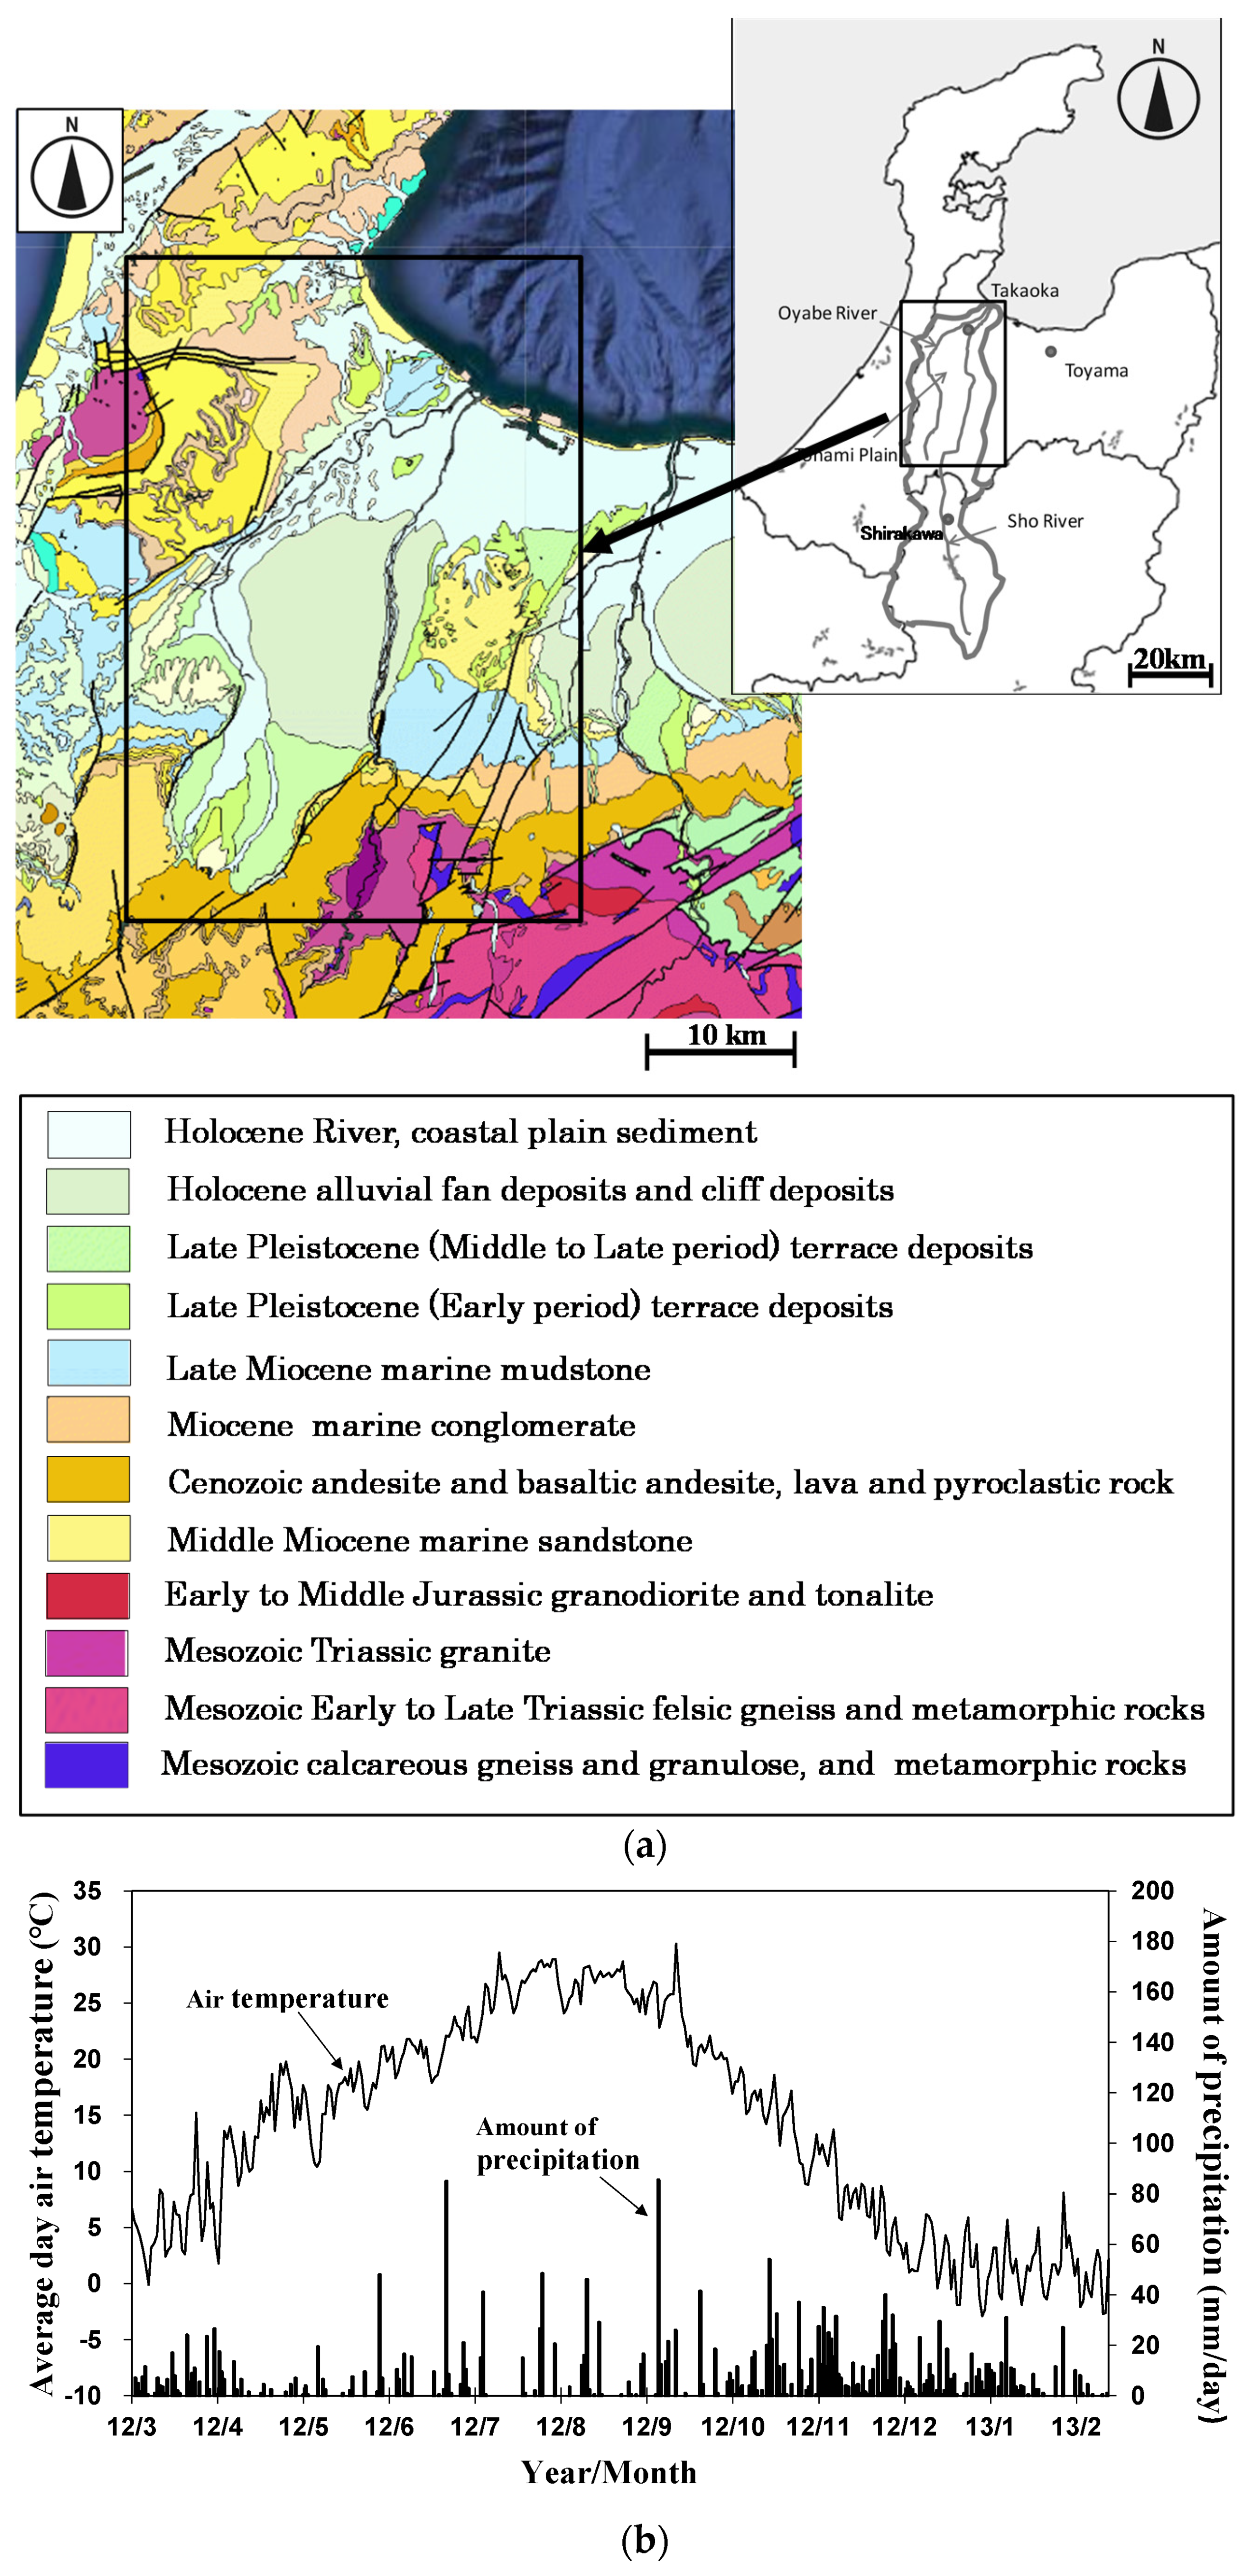
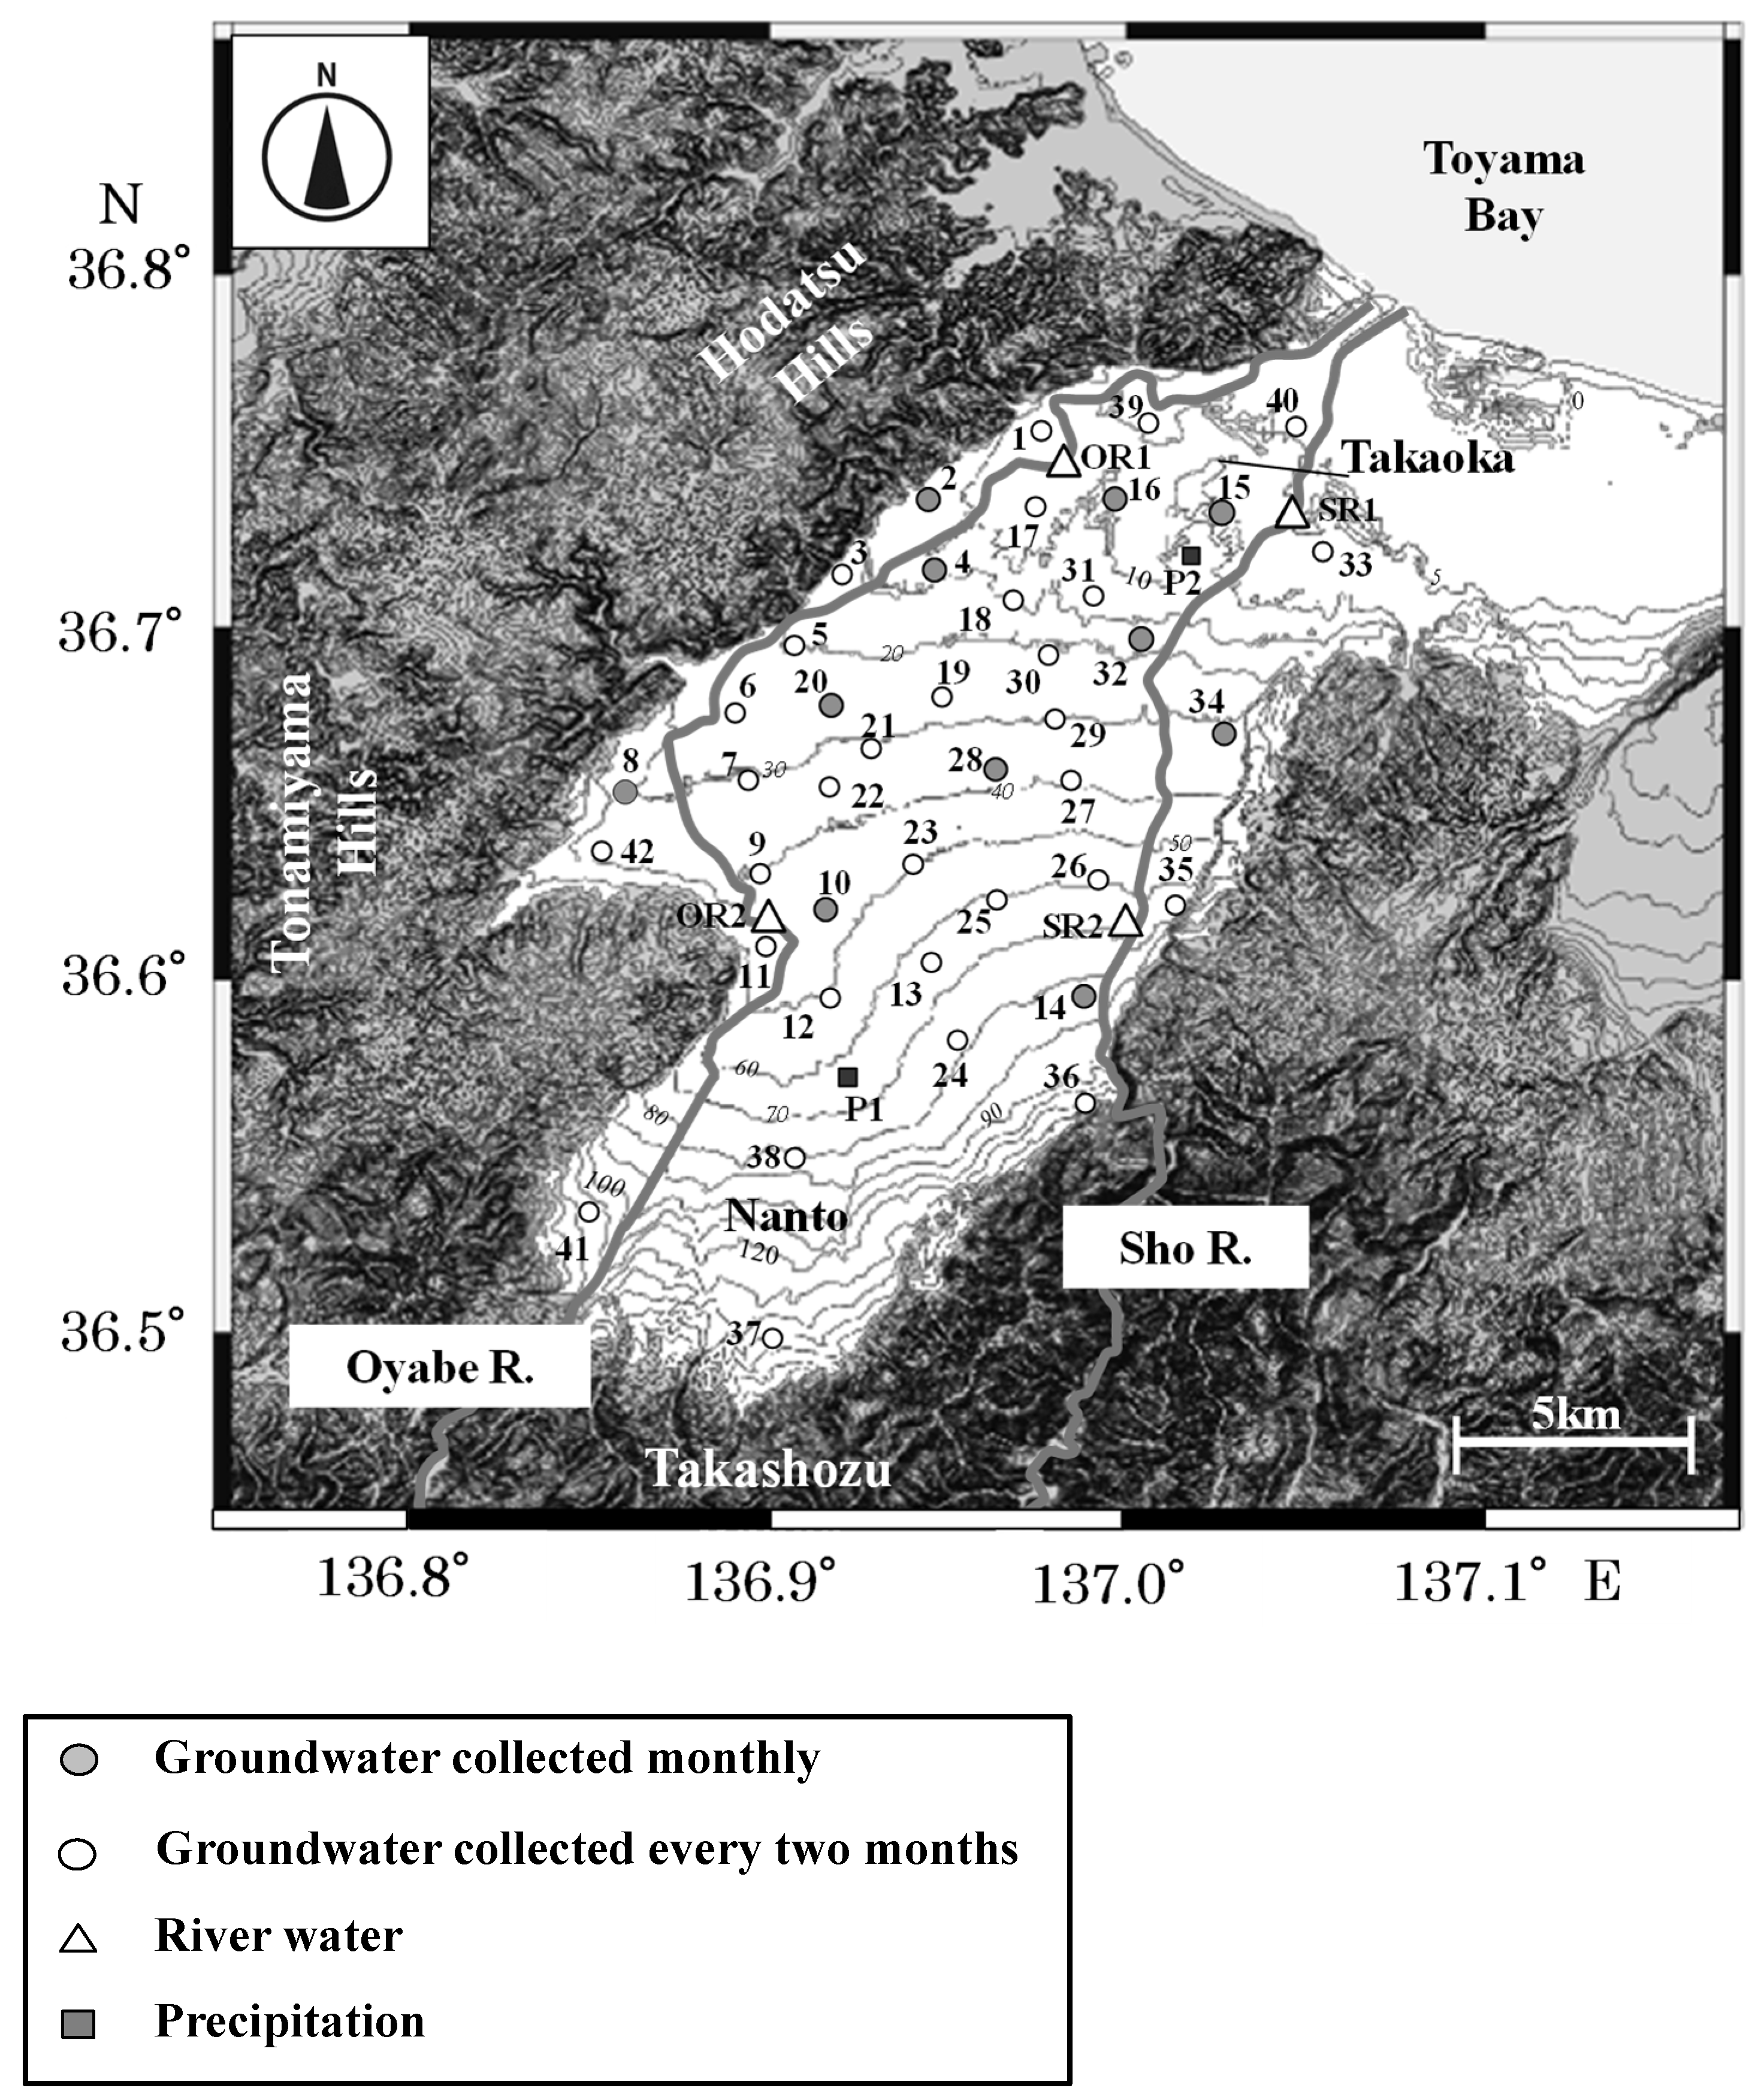
Figure 2.
Location of water samples in Sho River alluvial fan. The contour intervals are 10 m.
Figure 2.
Location of water samples in Sho River alluvial fan. The contour intervals are 10 m.
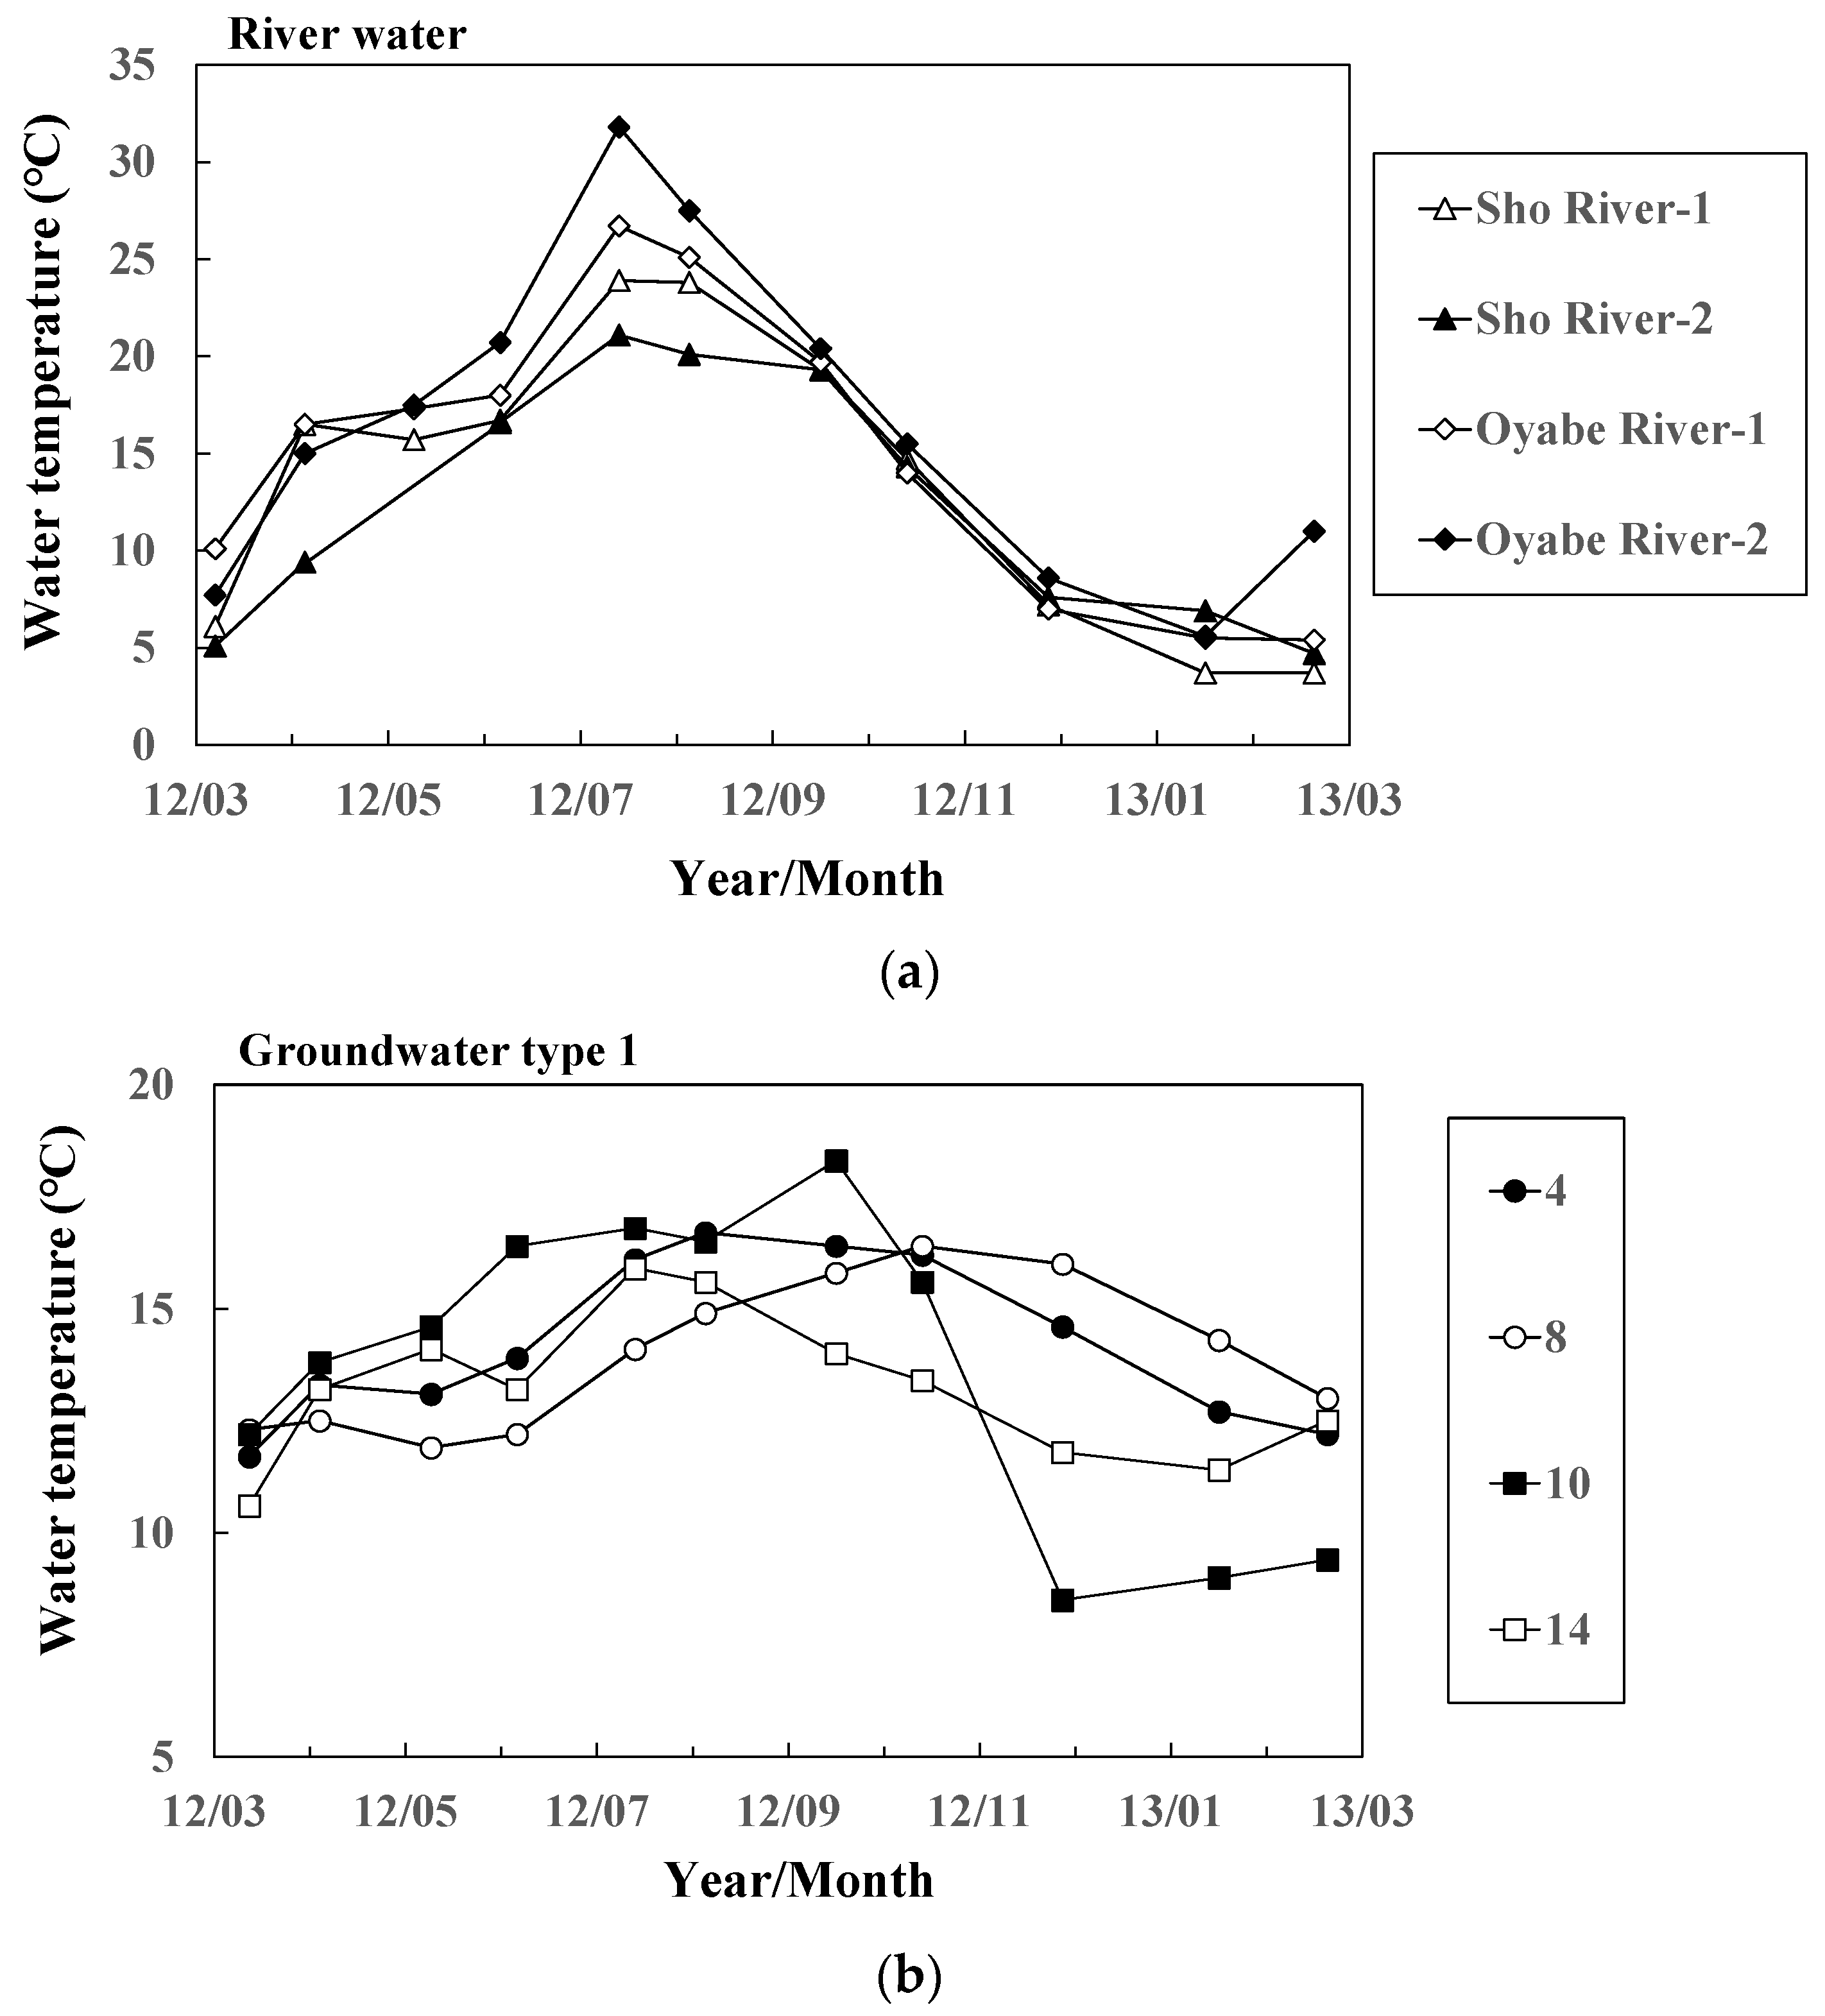
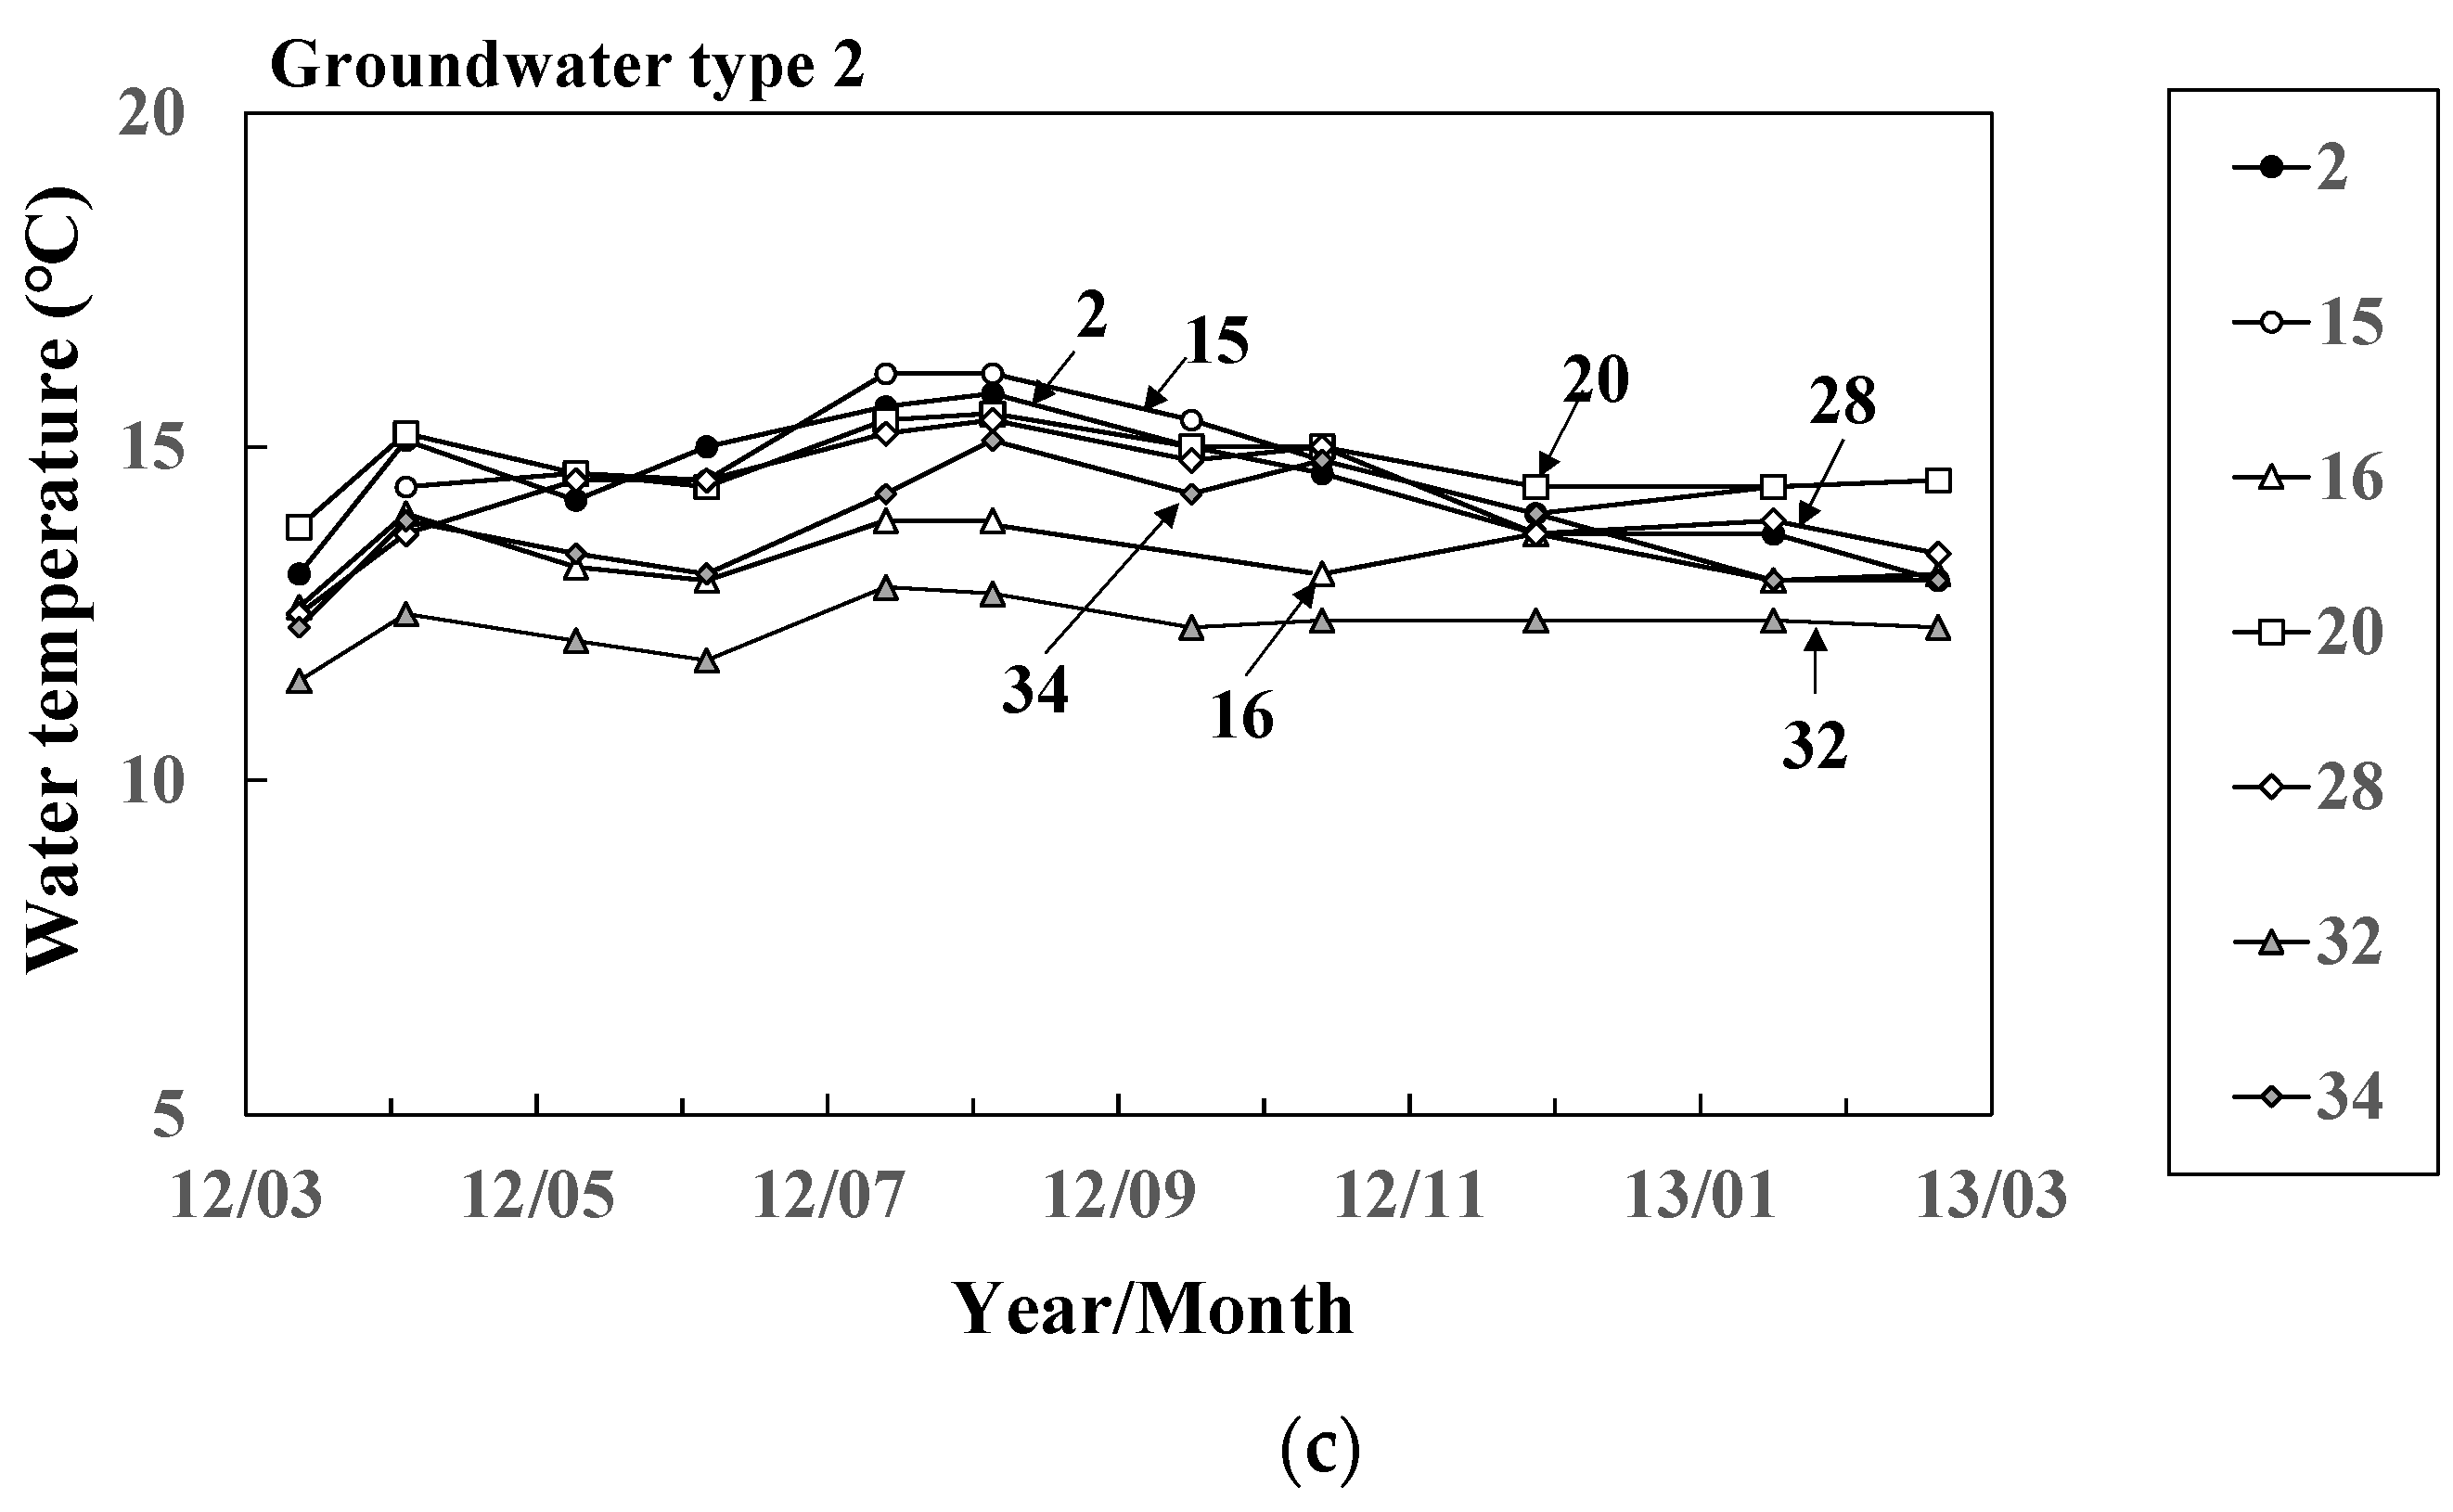
Figure 3.
Seasonal variation of water temperature of (a) river water and groundwater ((b) Types 1 and (c) 2 at 11 representative sites.
Figure 3.
Seasonal variation of water temperature of (a) river water and groundwater ((b) Types 1 and (c) 2 at 11 representative sites.
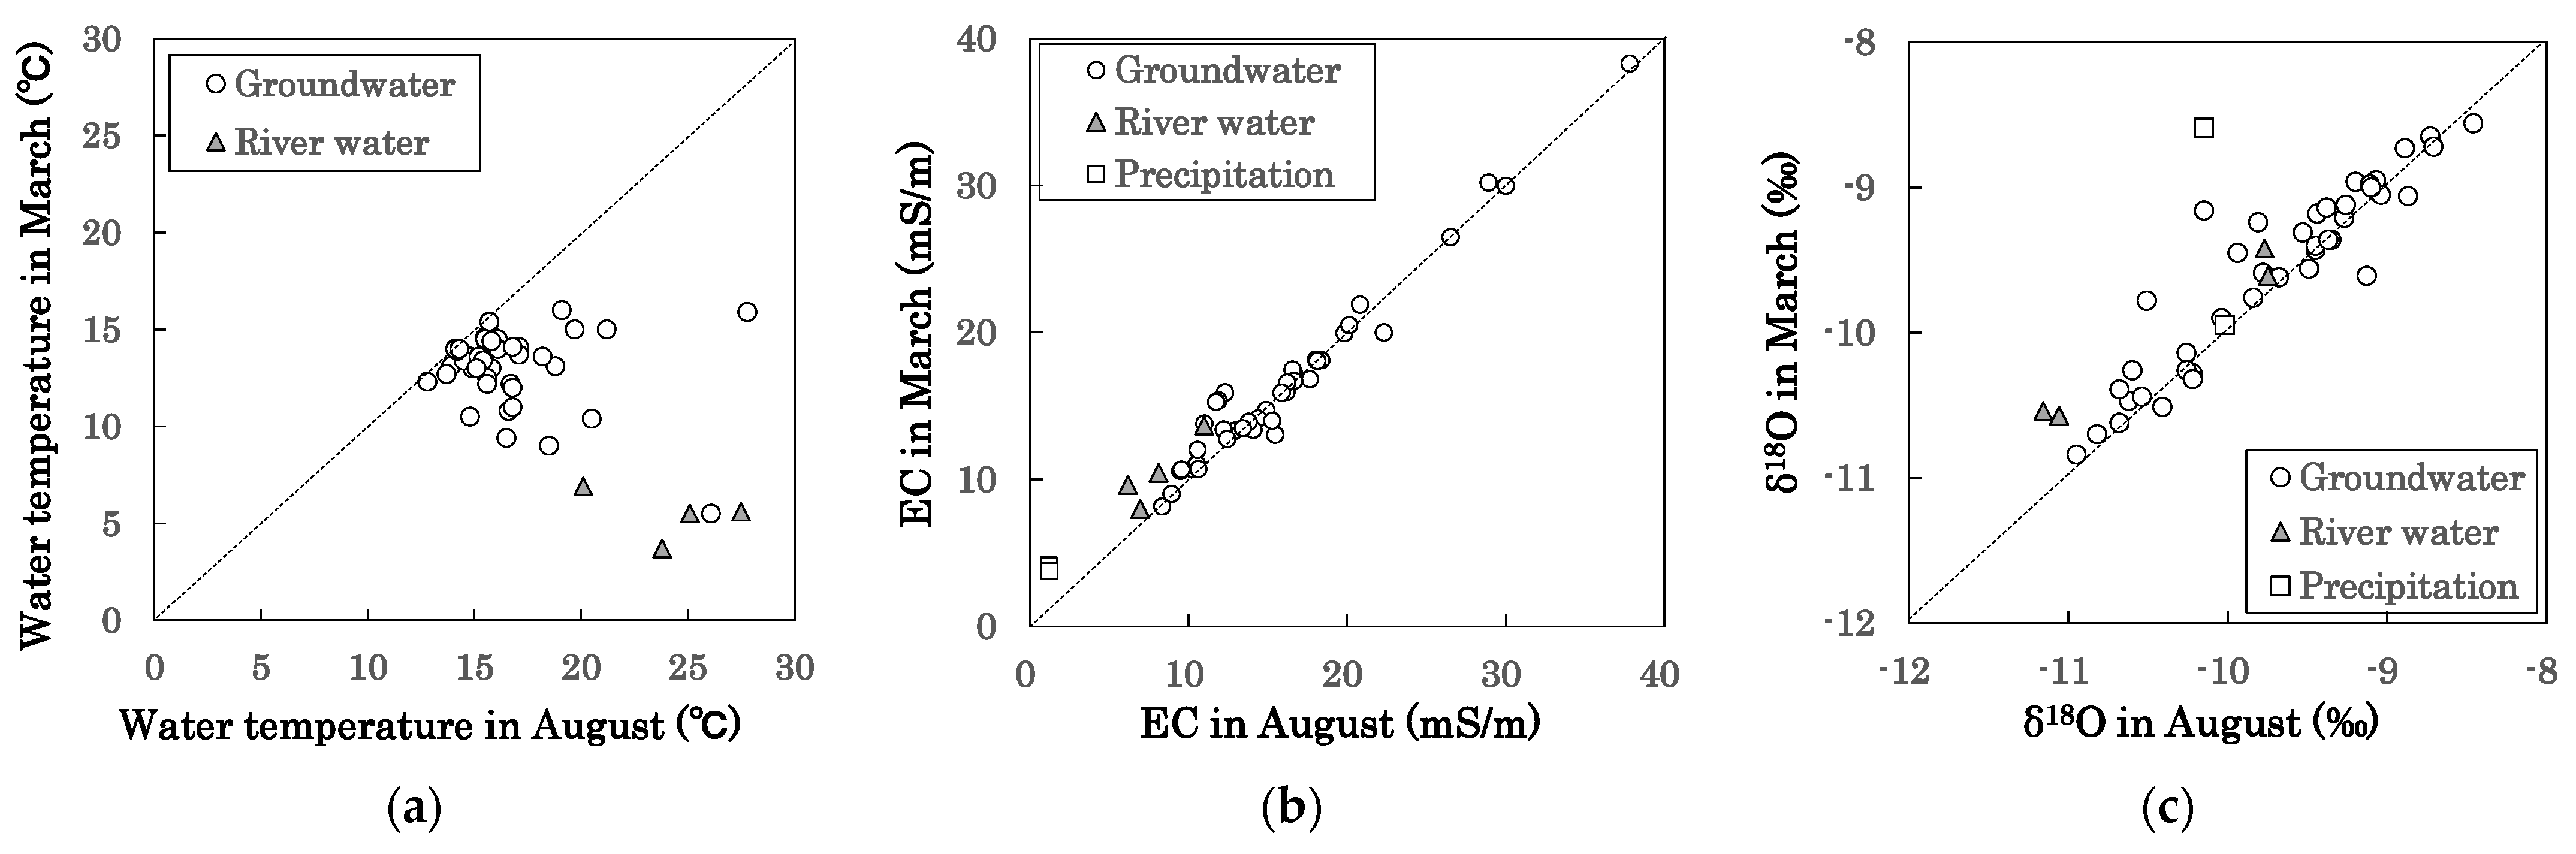
Figure 4.
(a) Temperature, (b) EC, and (c) δ18O difference for groundwater and river water between August and March. The broken lines indicate constant values throughout a year at each sampling site.
Figure 4.
(a) Temperature, (b) EC, and (c) δ18O difference for groundwater and river water between August and March. The broken lines indicate constant values throughout a year at each sampling site.
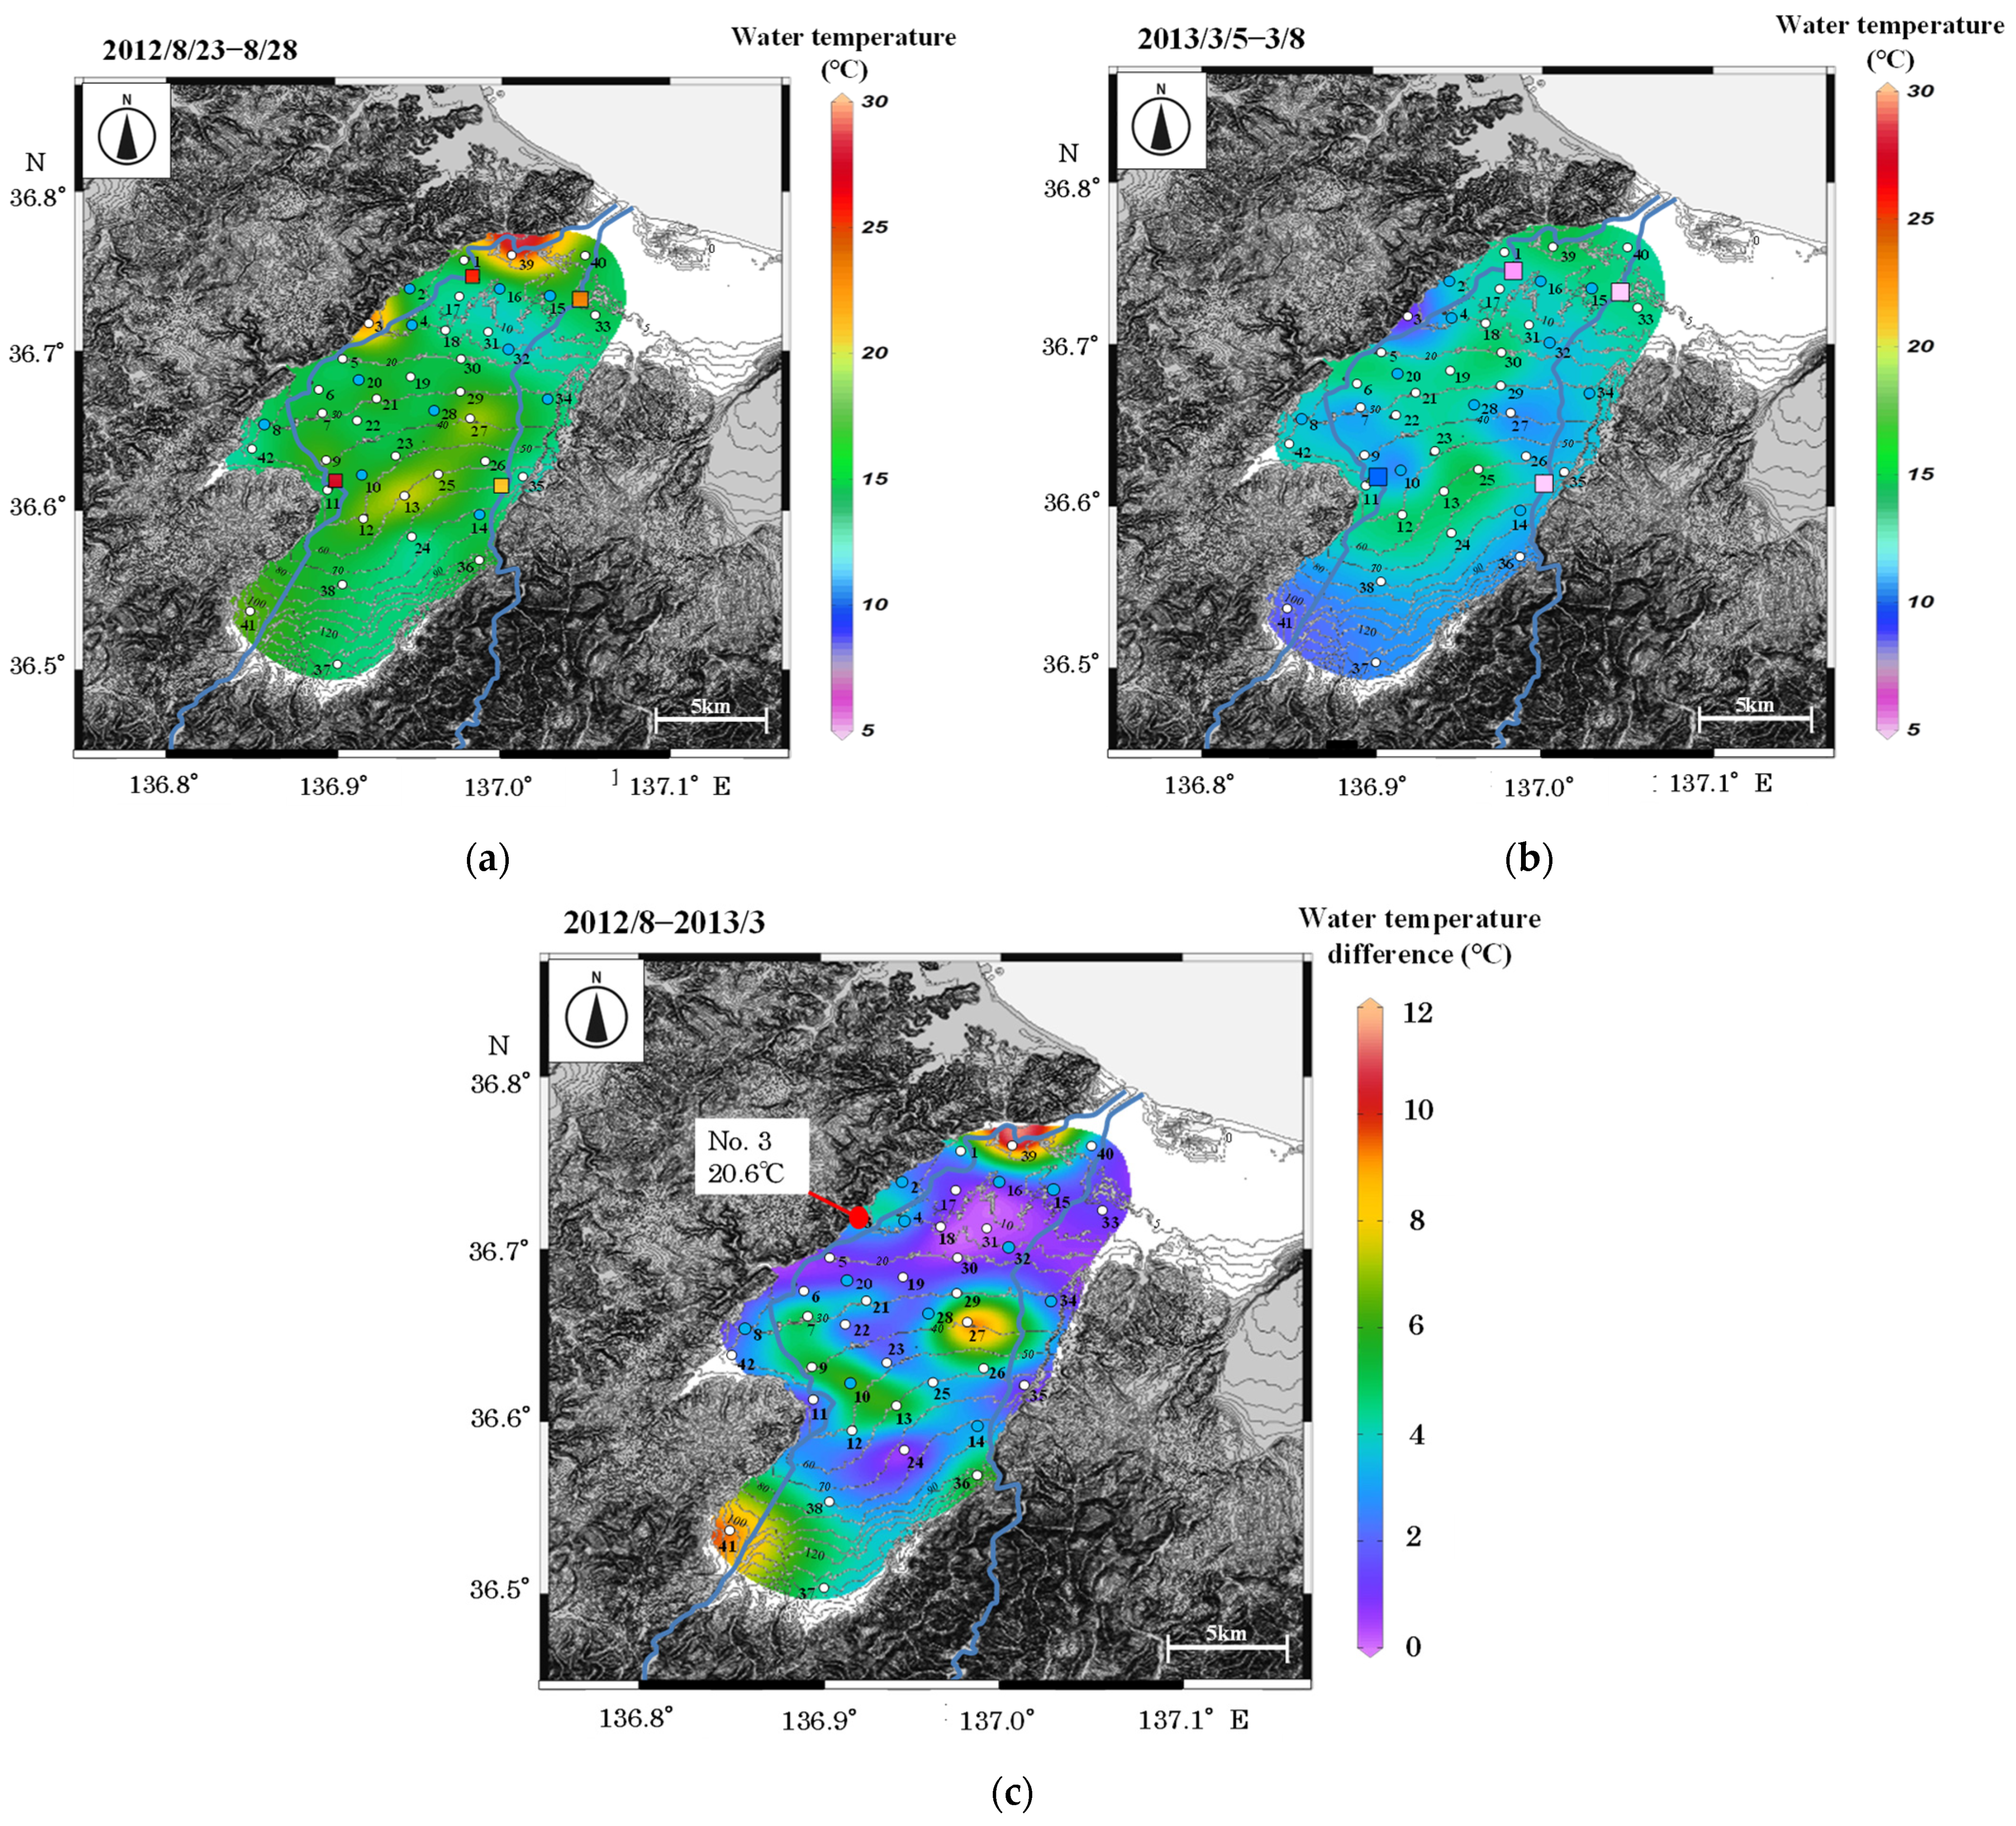
Figure 5.
Contour map of groundwater temperature in (a) 2012/8/23–8/28 and (b) 2013/3/5–3/8. (c) Water temperature differences between 2012/8 and 2013/3. Temperatures of river water are shown by color of the squares.
Figure 5.
Contour map of groundwater temperature in (a) 2012/8/23–8/28 and (b) 2013/3/5–3/8. (c) Water temperature differences between 2012/8 and 2013/3. Temperatures of river water are shown by color of the squares.
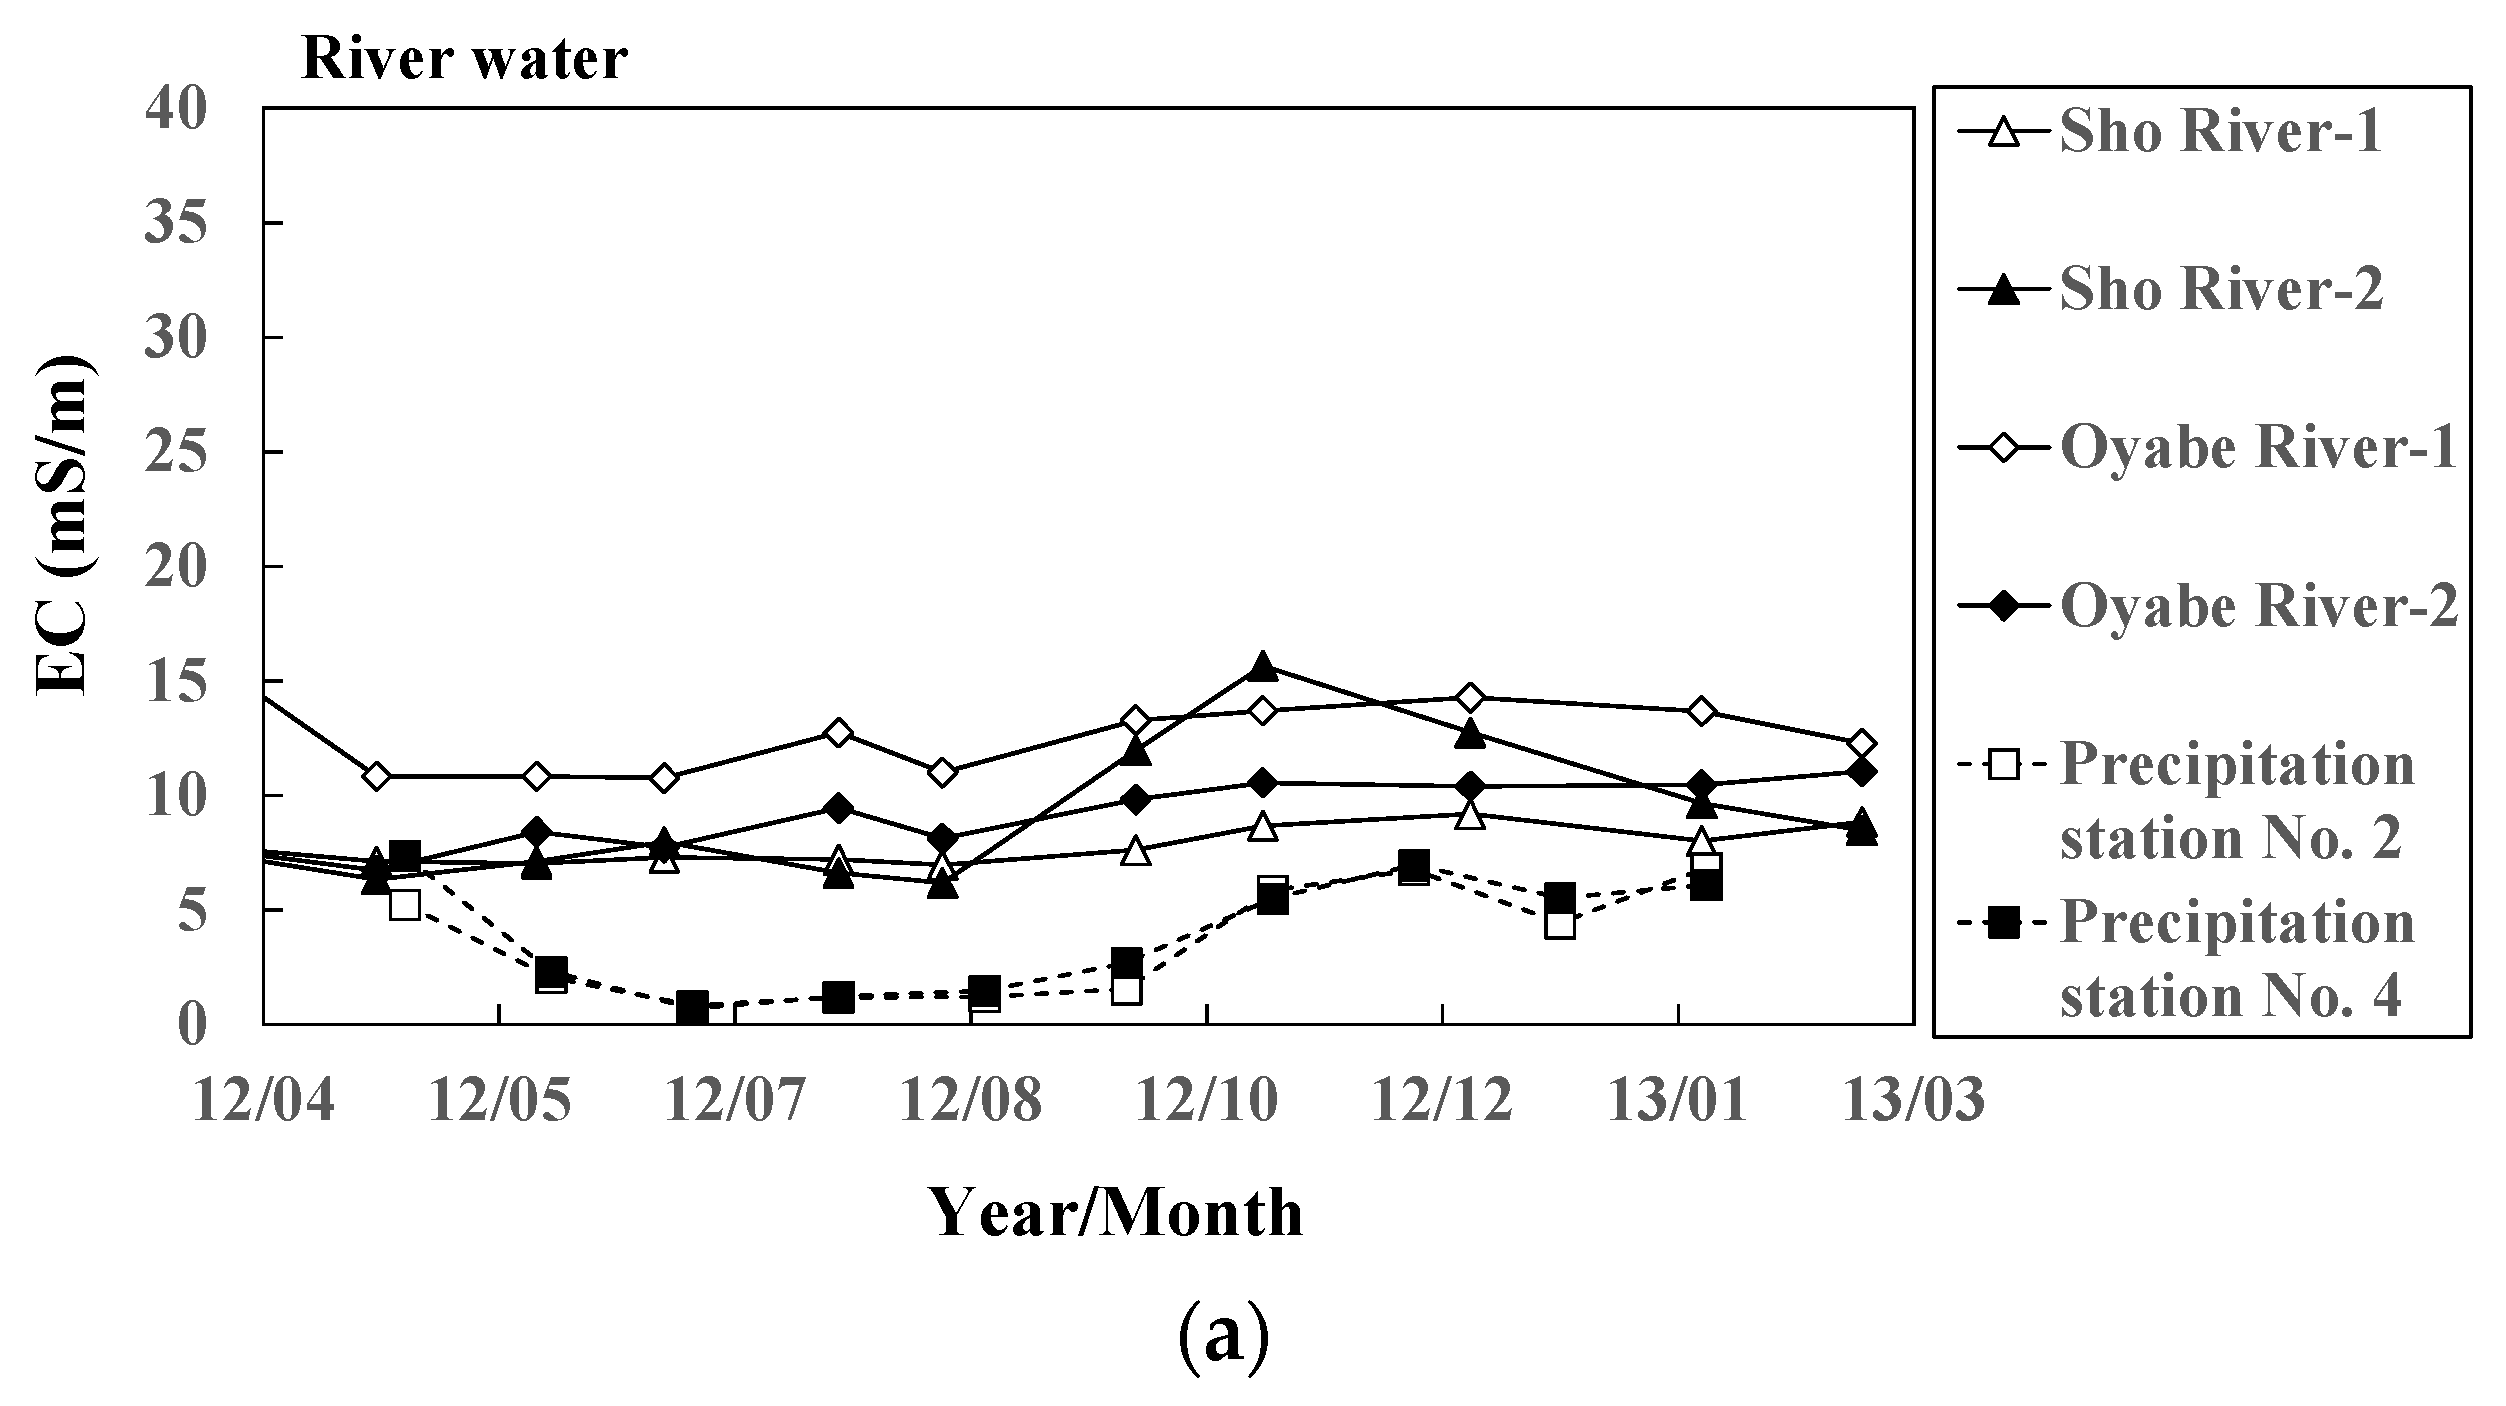
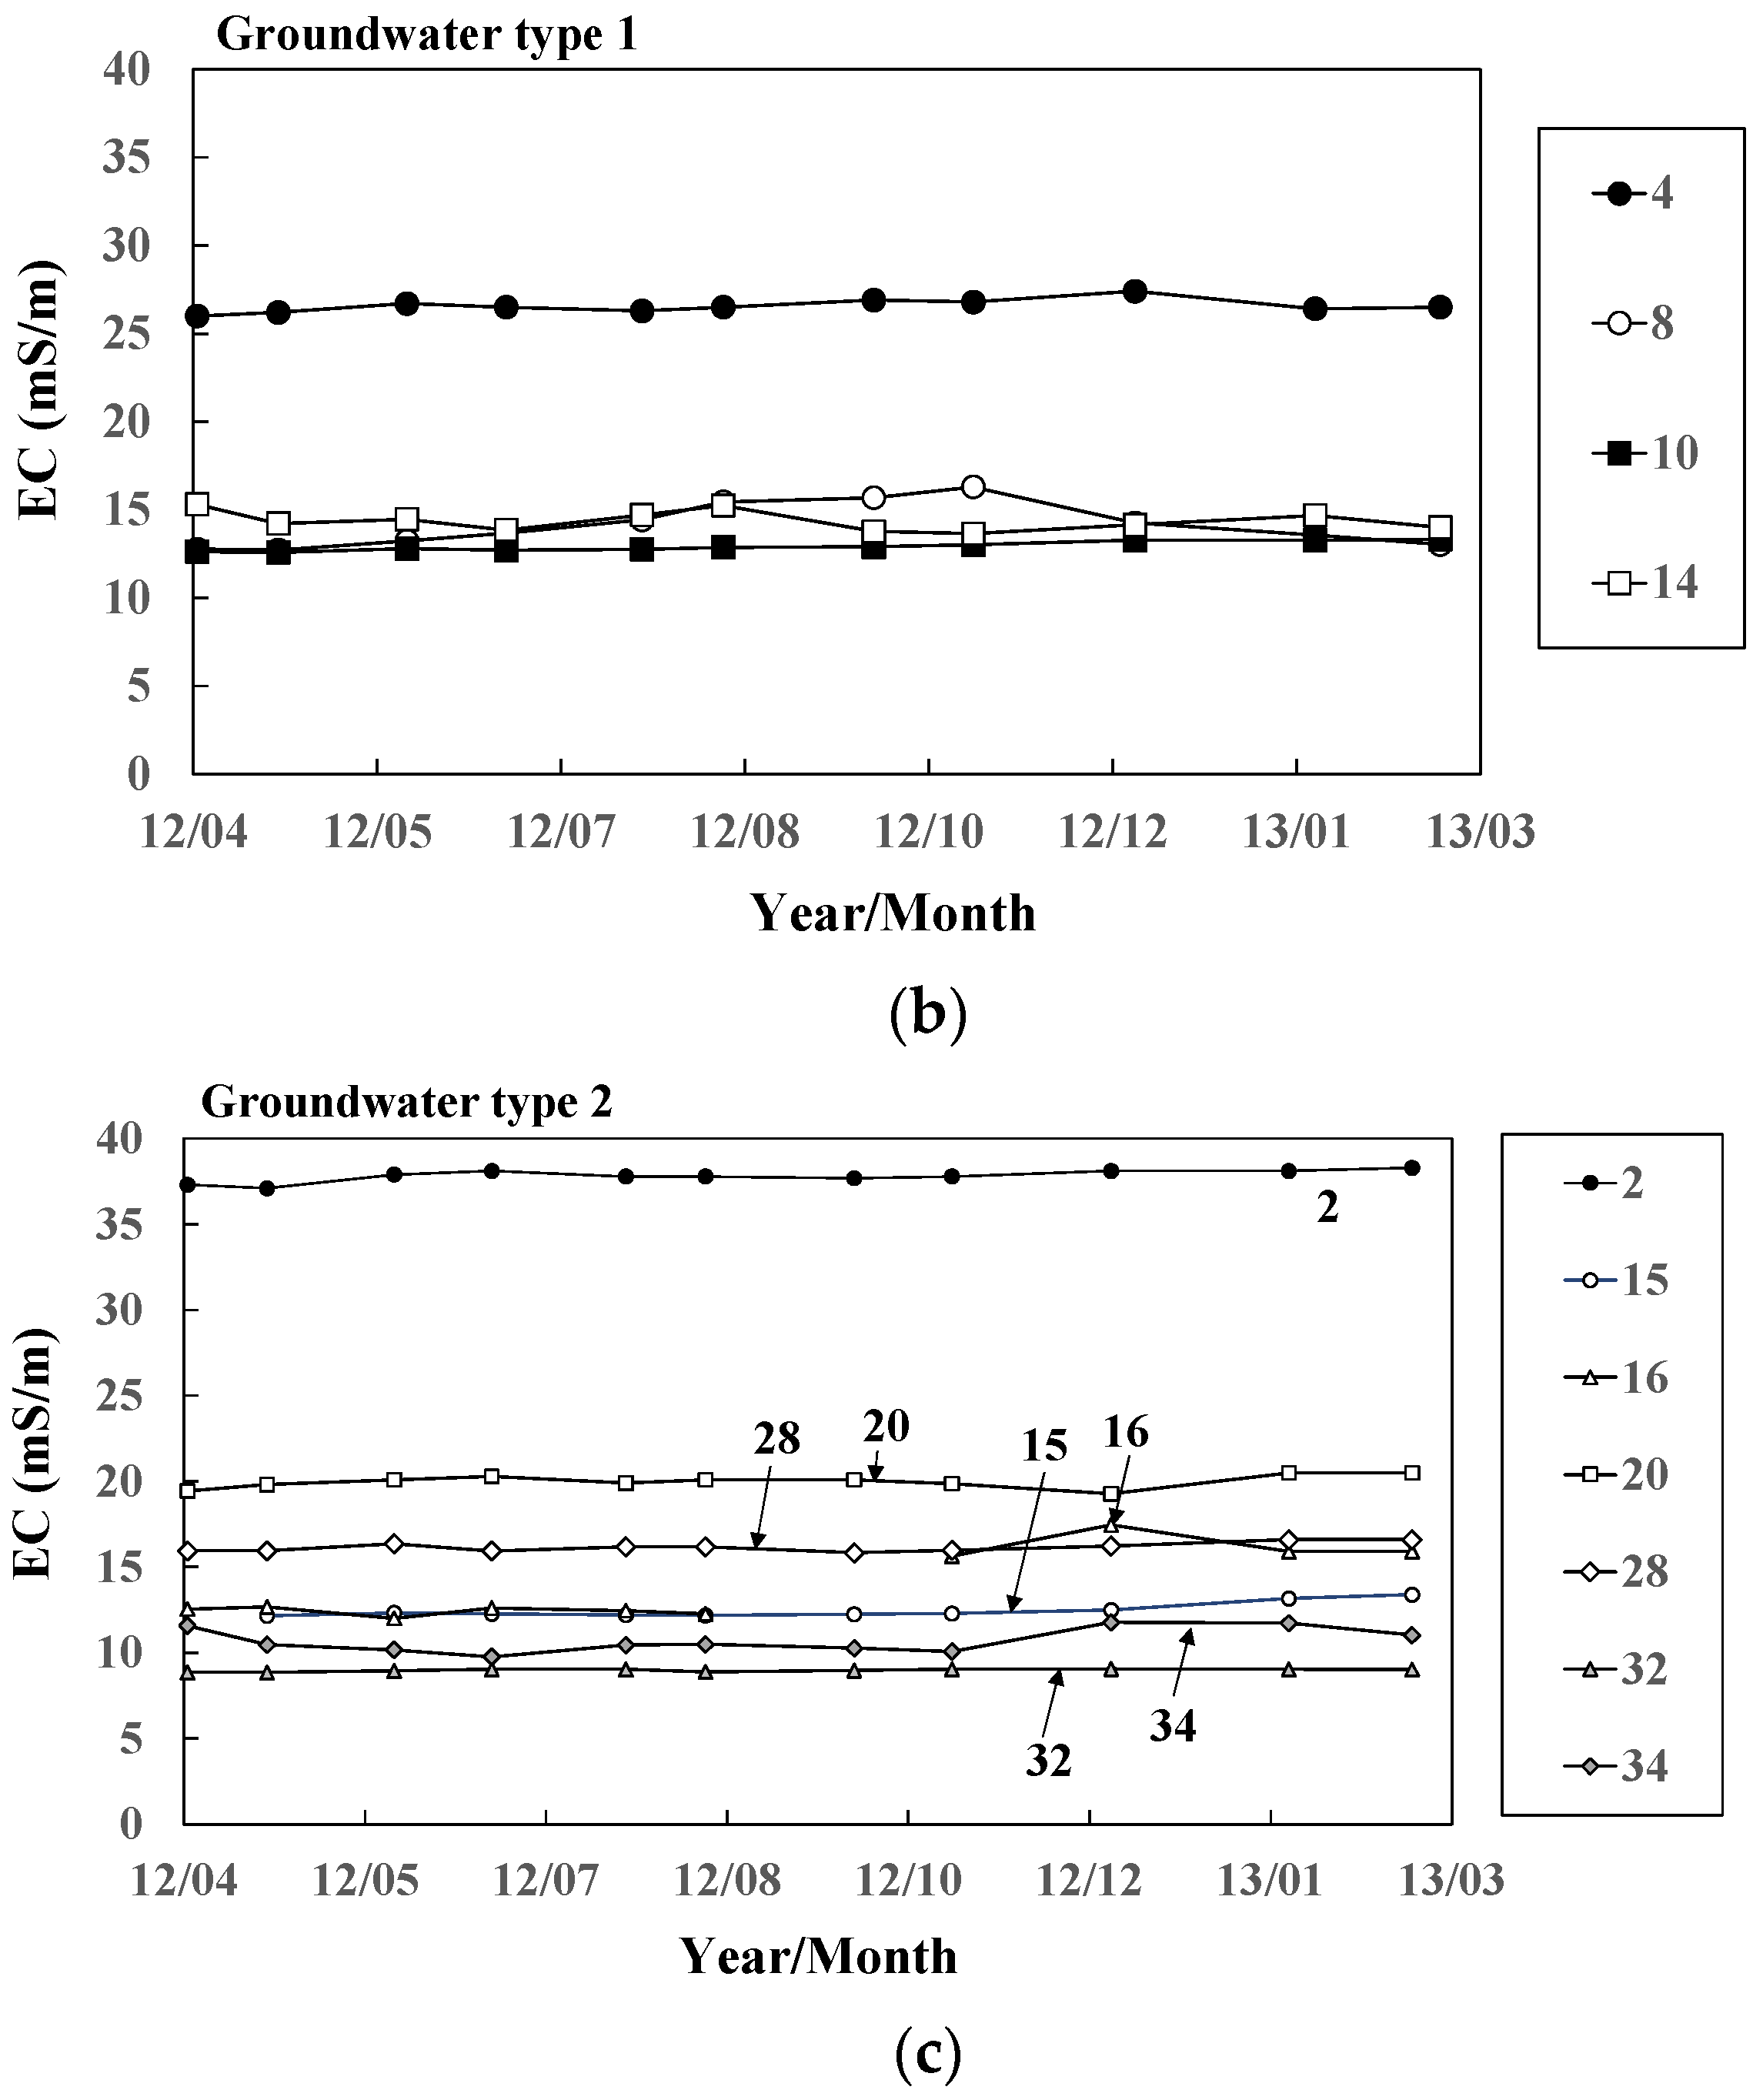
Figure 6.
Seasonal variation of electric conductivity in (a) river water and groundwater ((b) Types 1 and (c) 2) at 11 representative sites.
Figure 6.
Seasonal variation of electric conductivity in (a) river water and groundwater ((b) Types 1 and (c) 2) at 11 representative sites.
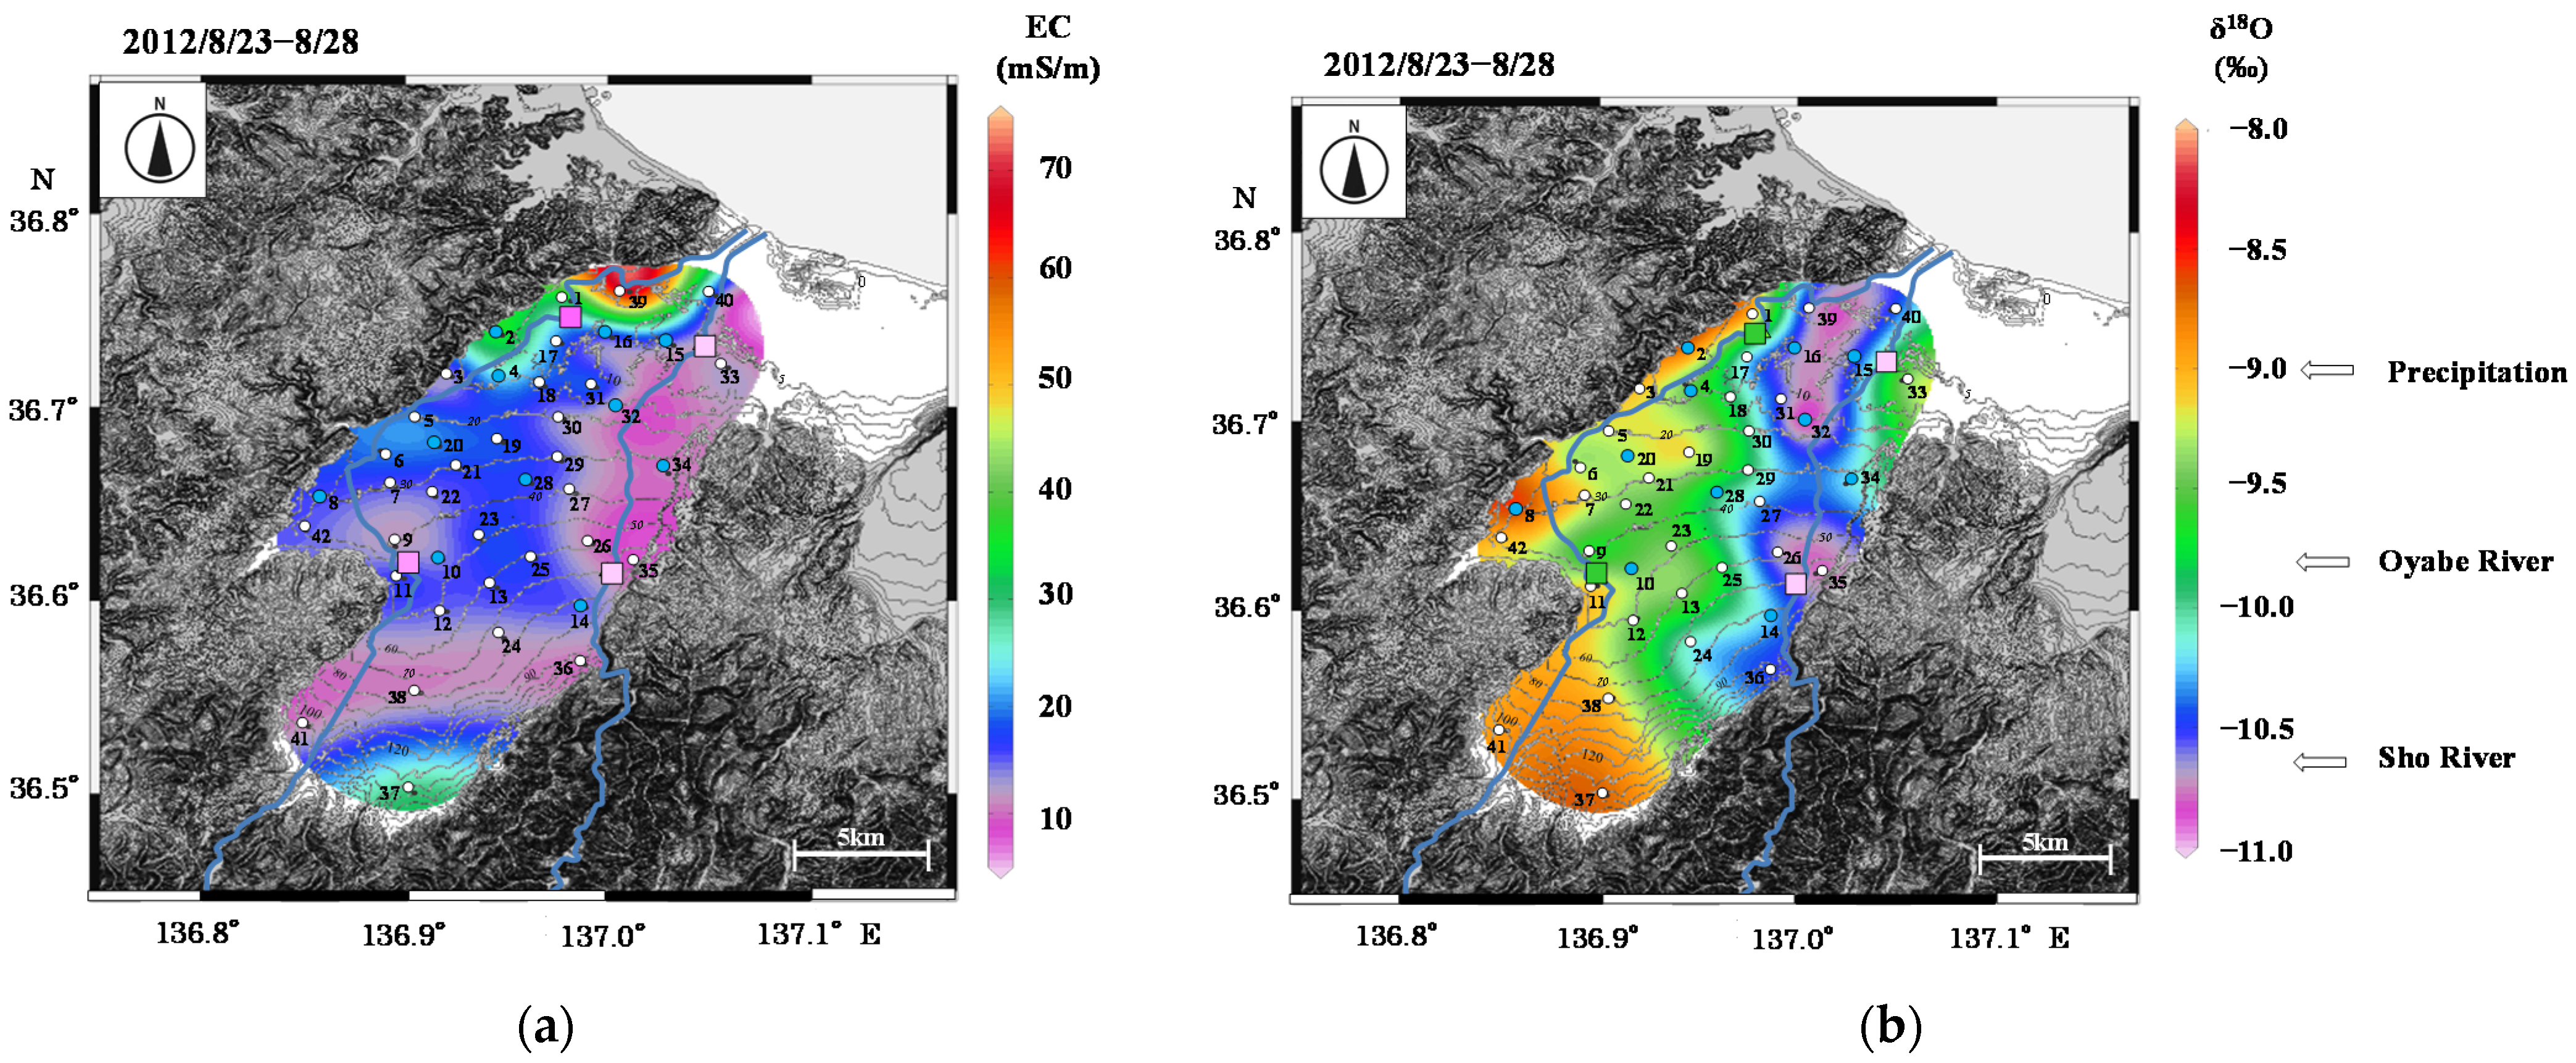
Figure 7.
Contour maps of (a) EC and (b) δ18O for groundwater samples in August 2012.
Figure 7.
Contour maps of (a) EC and (b) δ18O for groundwater samples in August 2012.
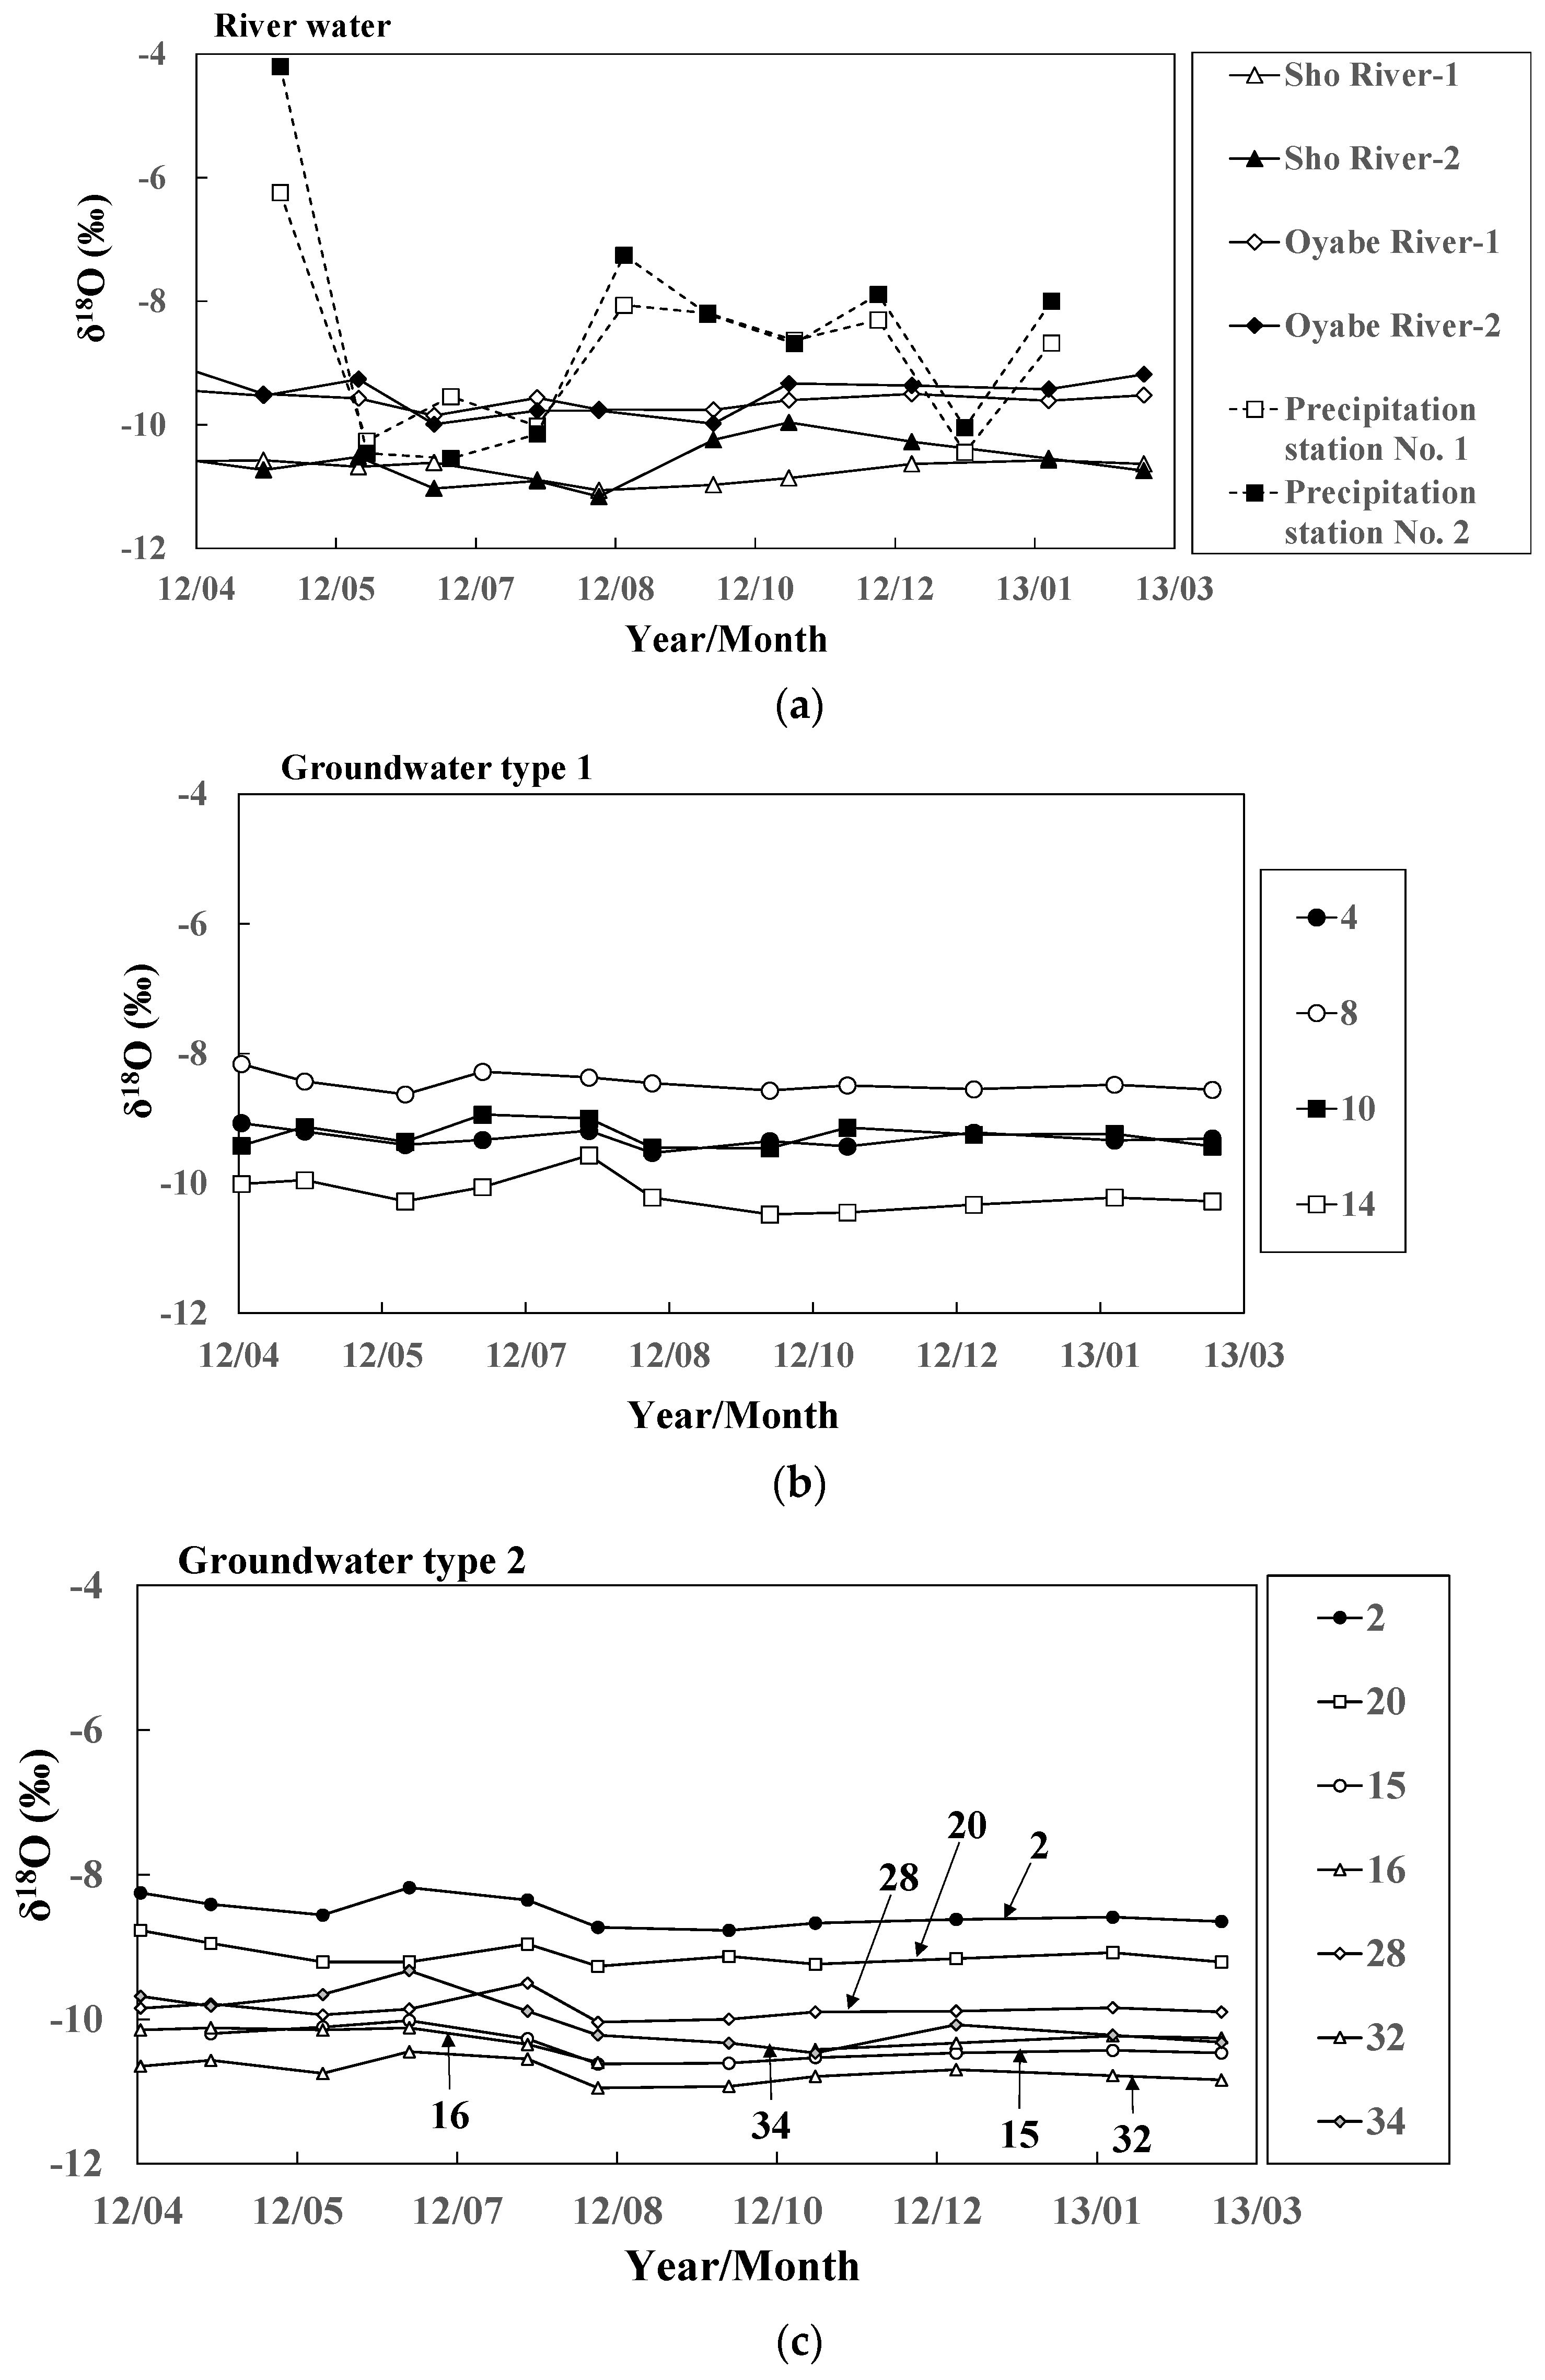
Figure 8.
Seasonal variations of δ18O values for (a) river water and groundwater ((b) Types 1 and (c) 2) at 11 representative sites.
Figure 8.
Seasonal variations of δ18O values for (a) river water and groundwater ((b) Types 1 and (c) 2) at 11 representative sites.
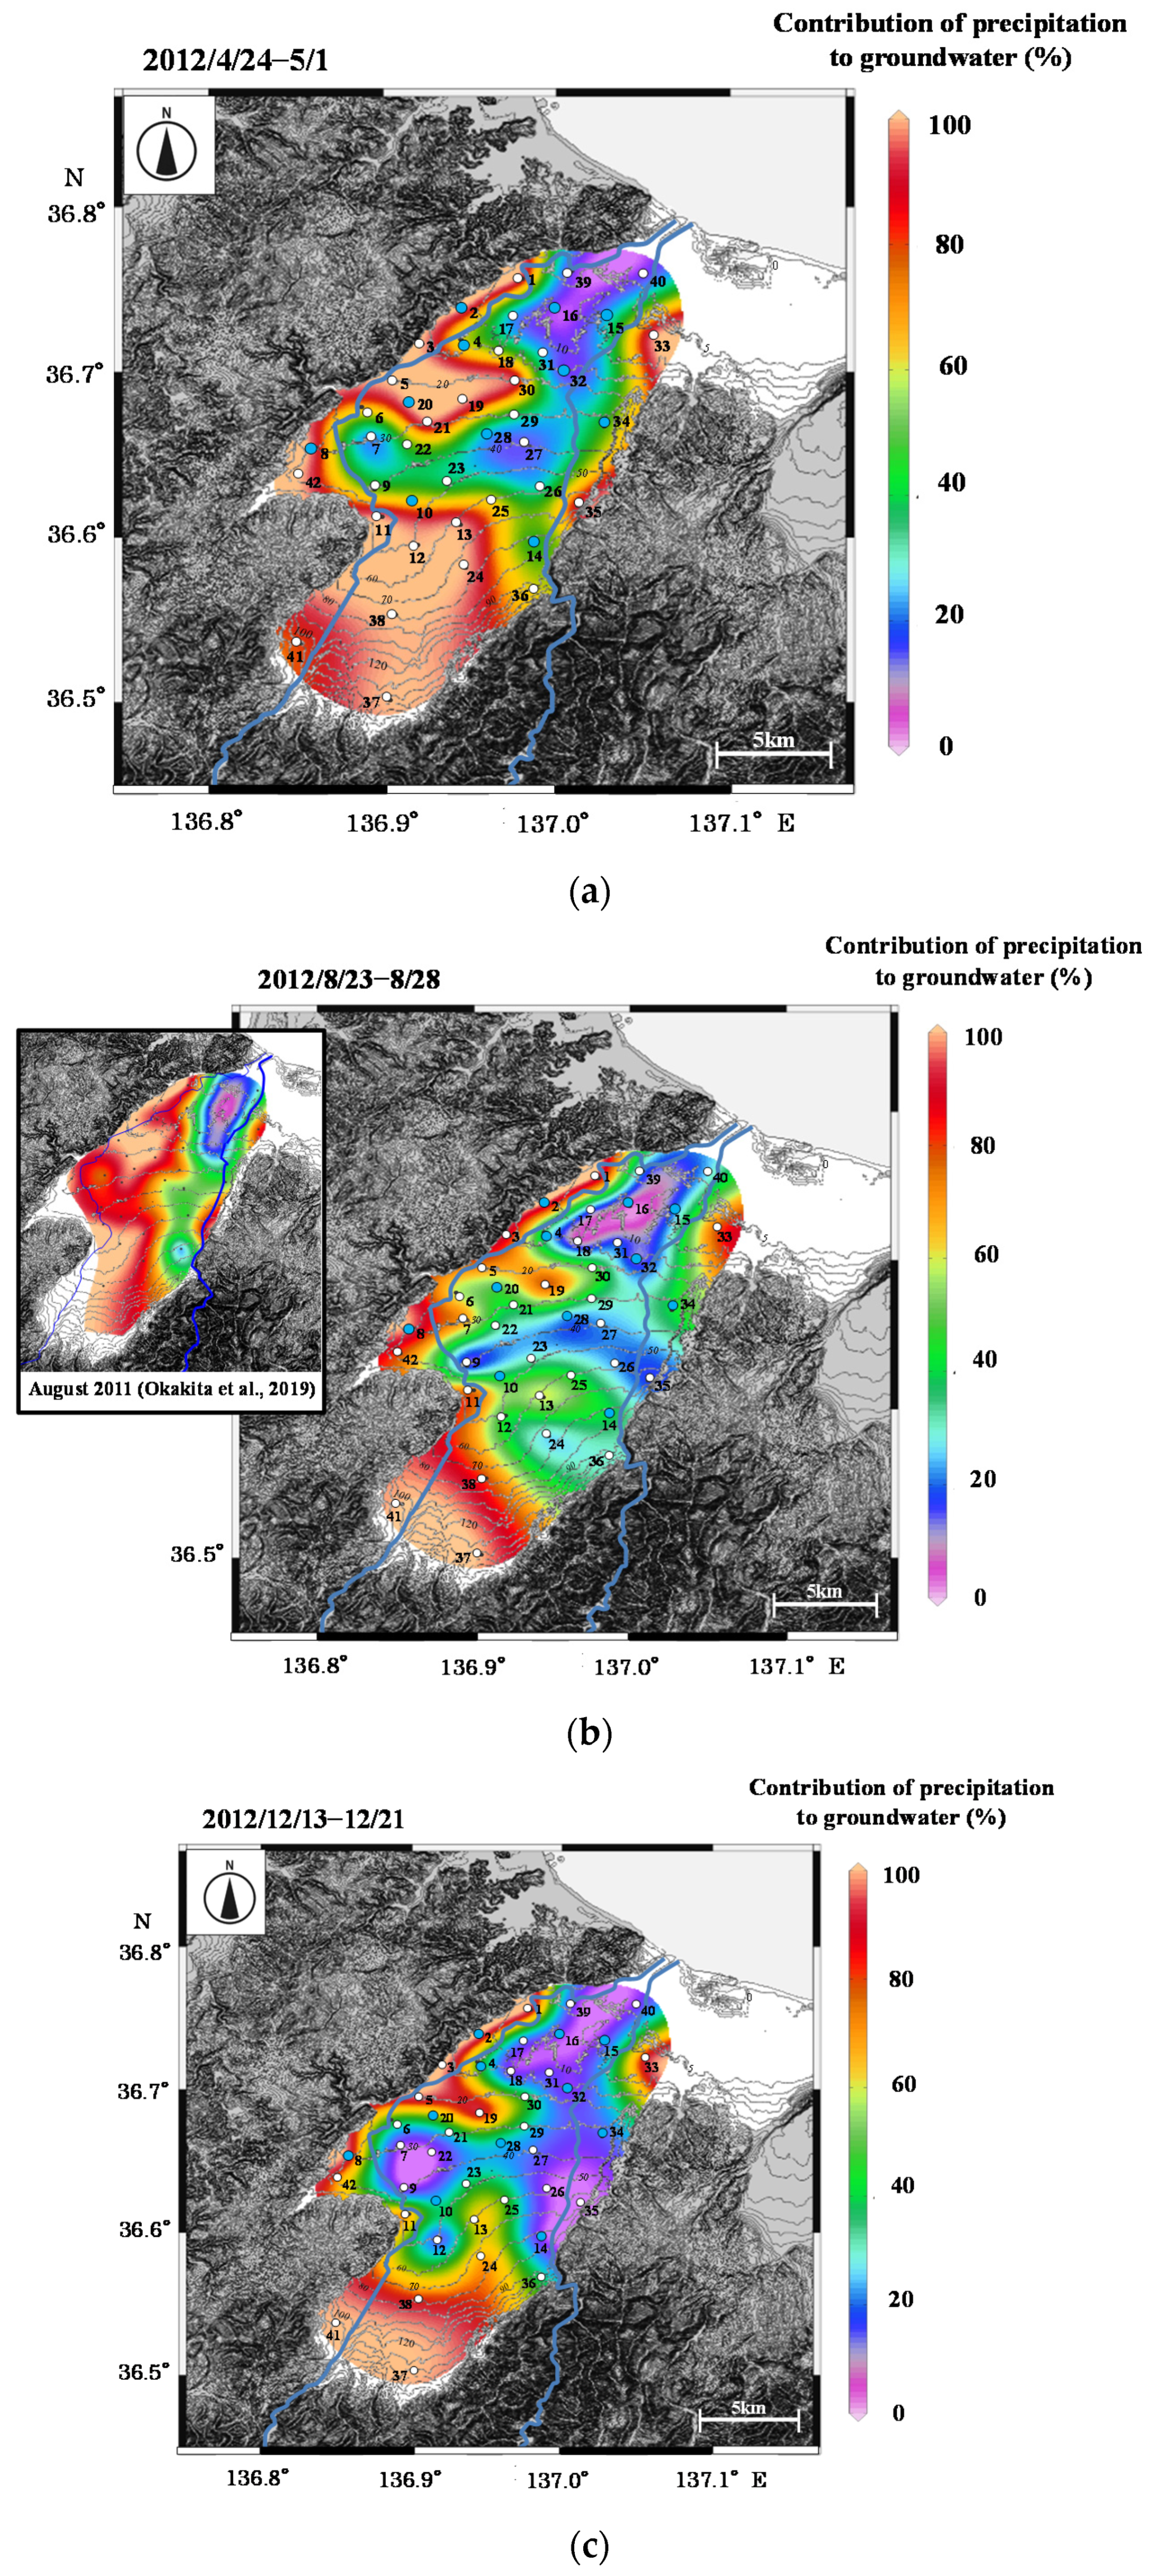
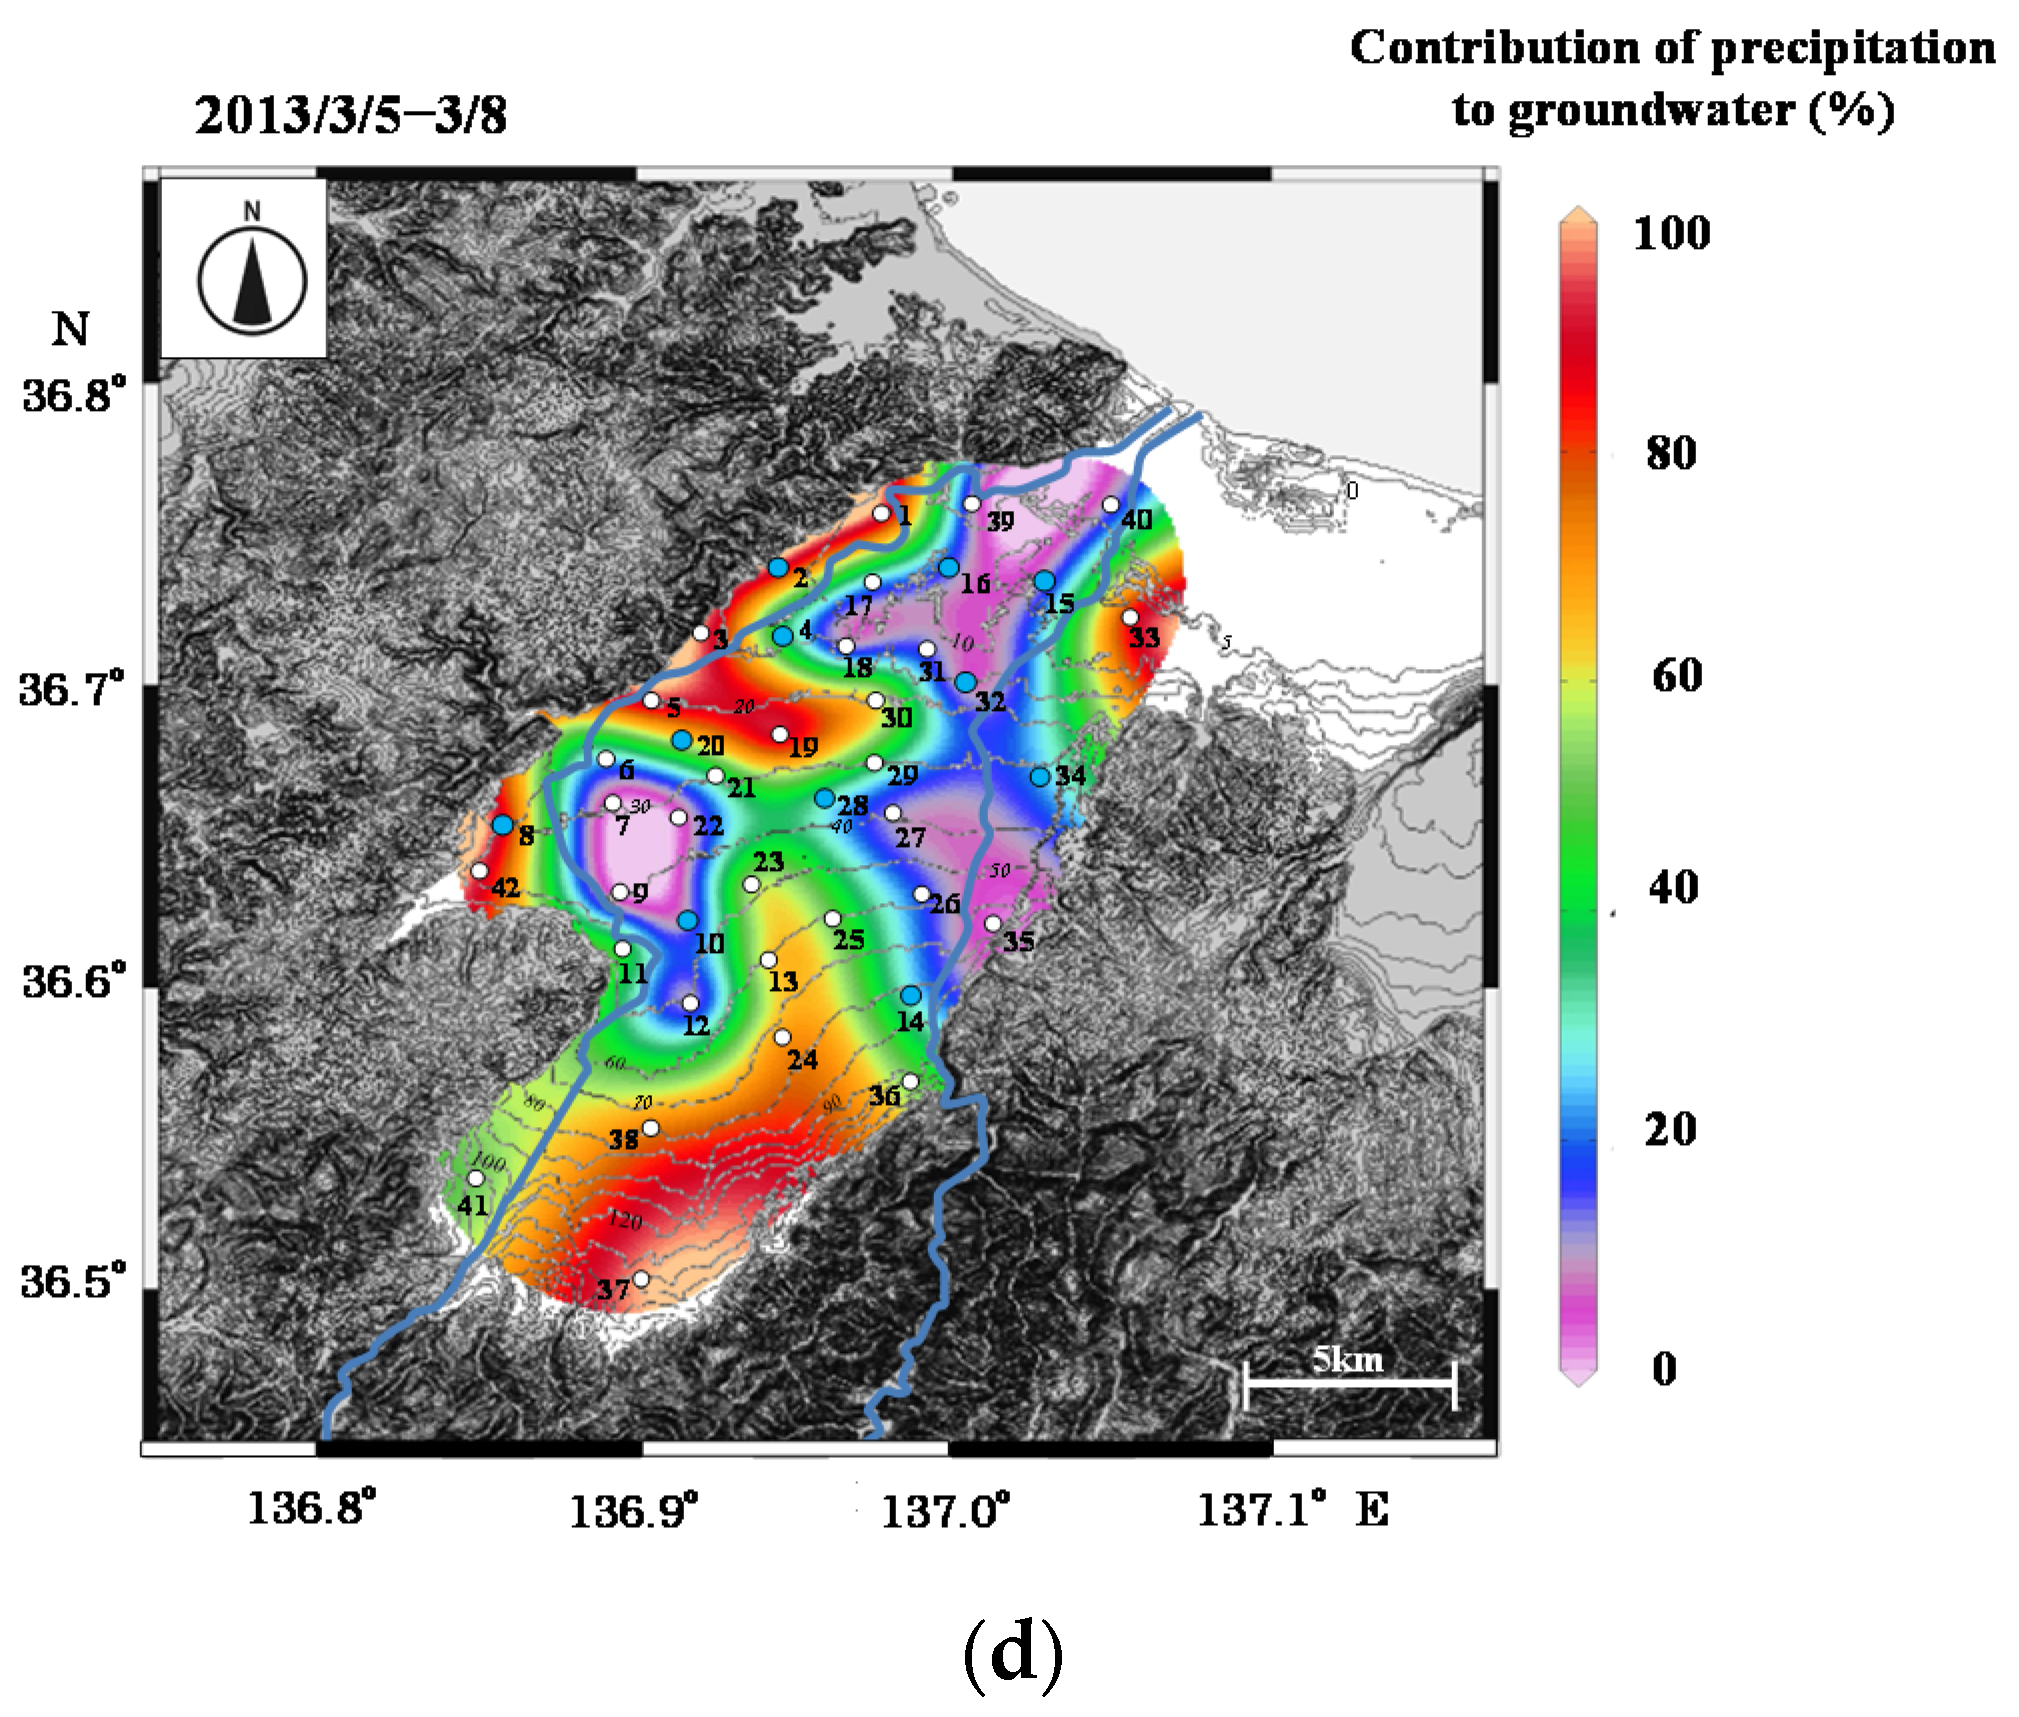
Figure 9.
Contour maps of contribution of precipitation to groundwater in (
a) 2012/4/24–5/1, (
b) 2012/8/23–8/28, (
c) 2012/12/13–12/21, and (
d) 2013/3/5–5/8. In
Figure 9b, a contour map in August 2011 is also shown, which was modified from Okakita et al. [
37].
Figure 9.
Contour maps of contribution of precipitation to groundwater in (
a) 2012/4/24–5/1, (
b) 2012/8/23–8/28, (
c) 2012/12/13–12/21, and (
d) 2013/3/5–5/8. In
Figure 9b, a contour map in August 2011 is also shown, which was modified from Okakita et al. [
37].
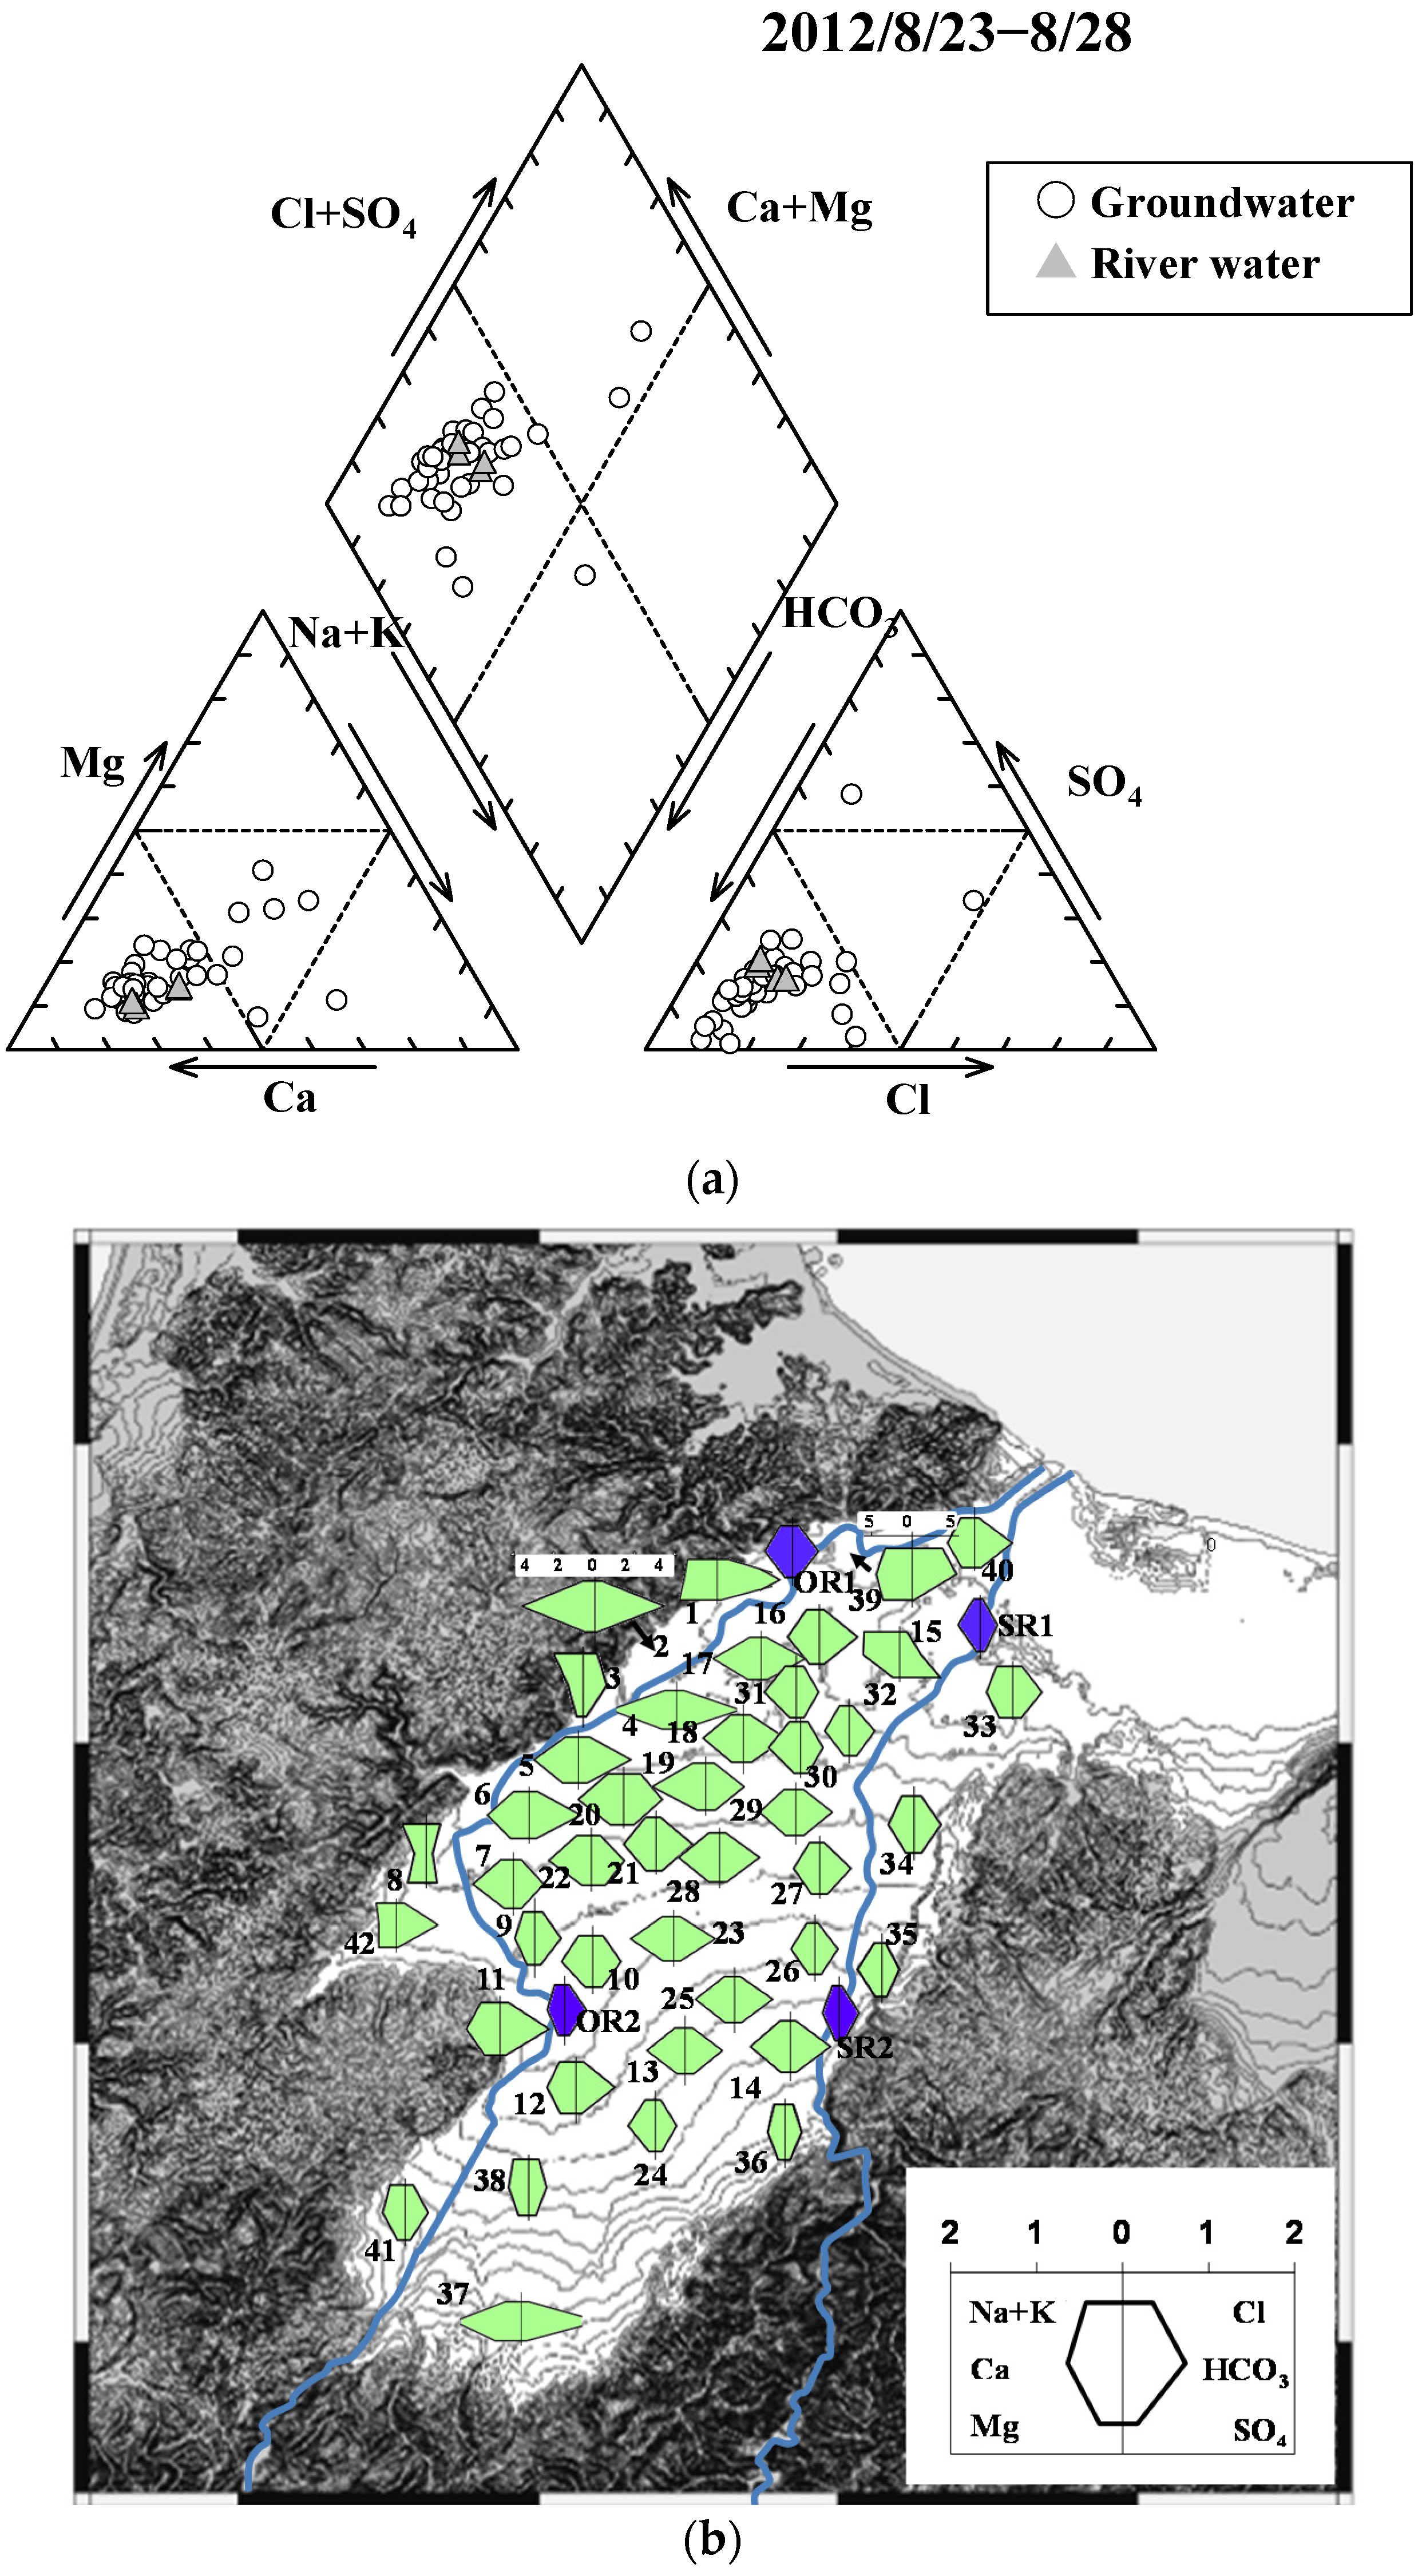
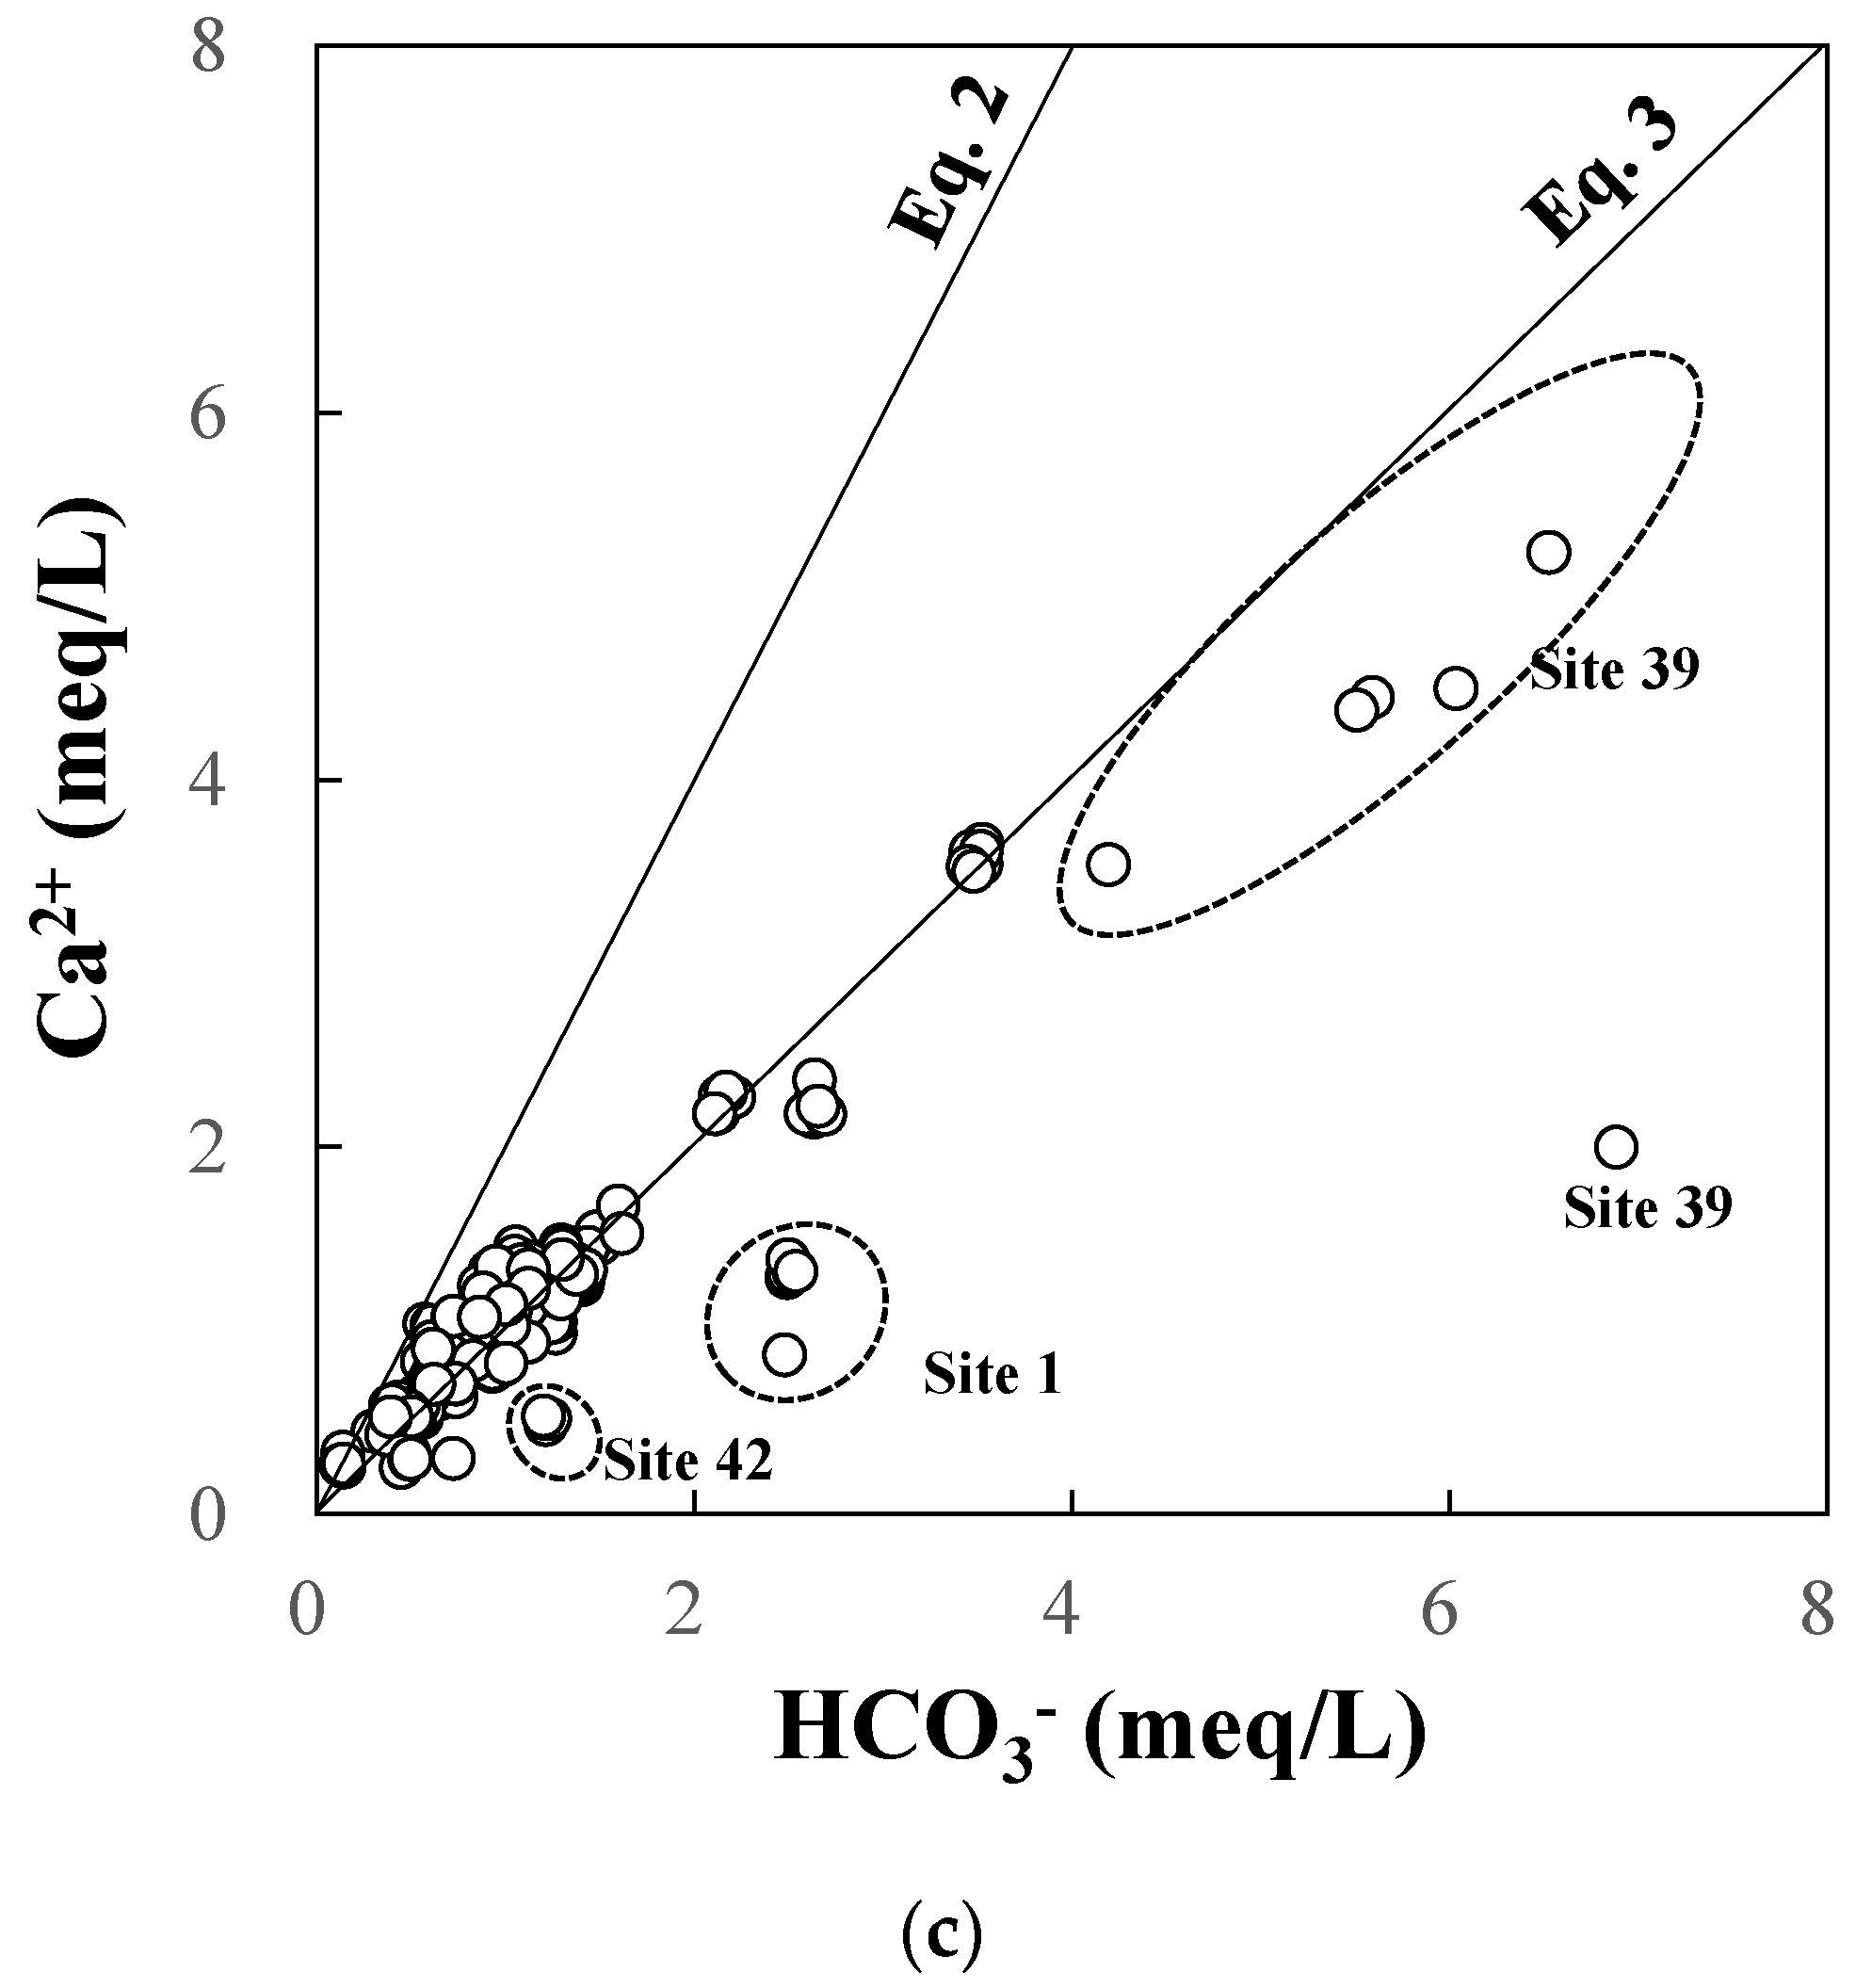
Figure 10.
(a) Piper and (b) Stiff diagrams of groundwater and river water. (c) HCO3− vs. Ca2+. Solid lines correspond to Equations (2) and (3) in the text. Gray and black colors correspond to groundwater and river water, respectively.
Figure 10.
(a) Piper and (b) Stiff diagrams of groundwater and river water. (c) HCO3− vs. Ca2+. Solid lines correspond to Equations (2) and (3) in the text. Gray and black colors correspond to groundwater and river water, respectively.
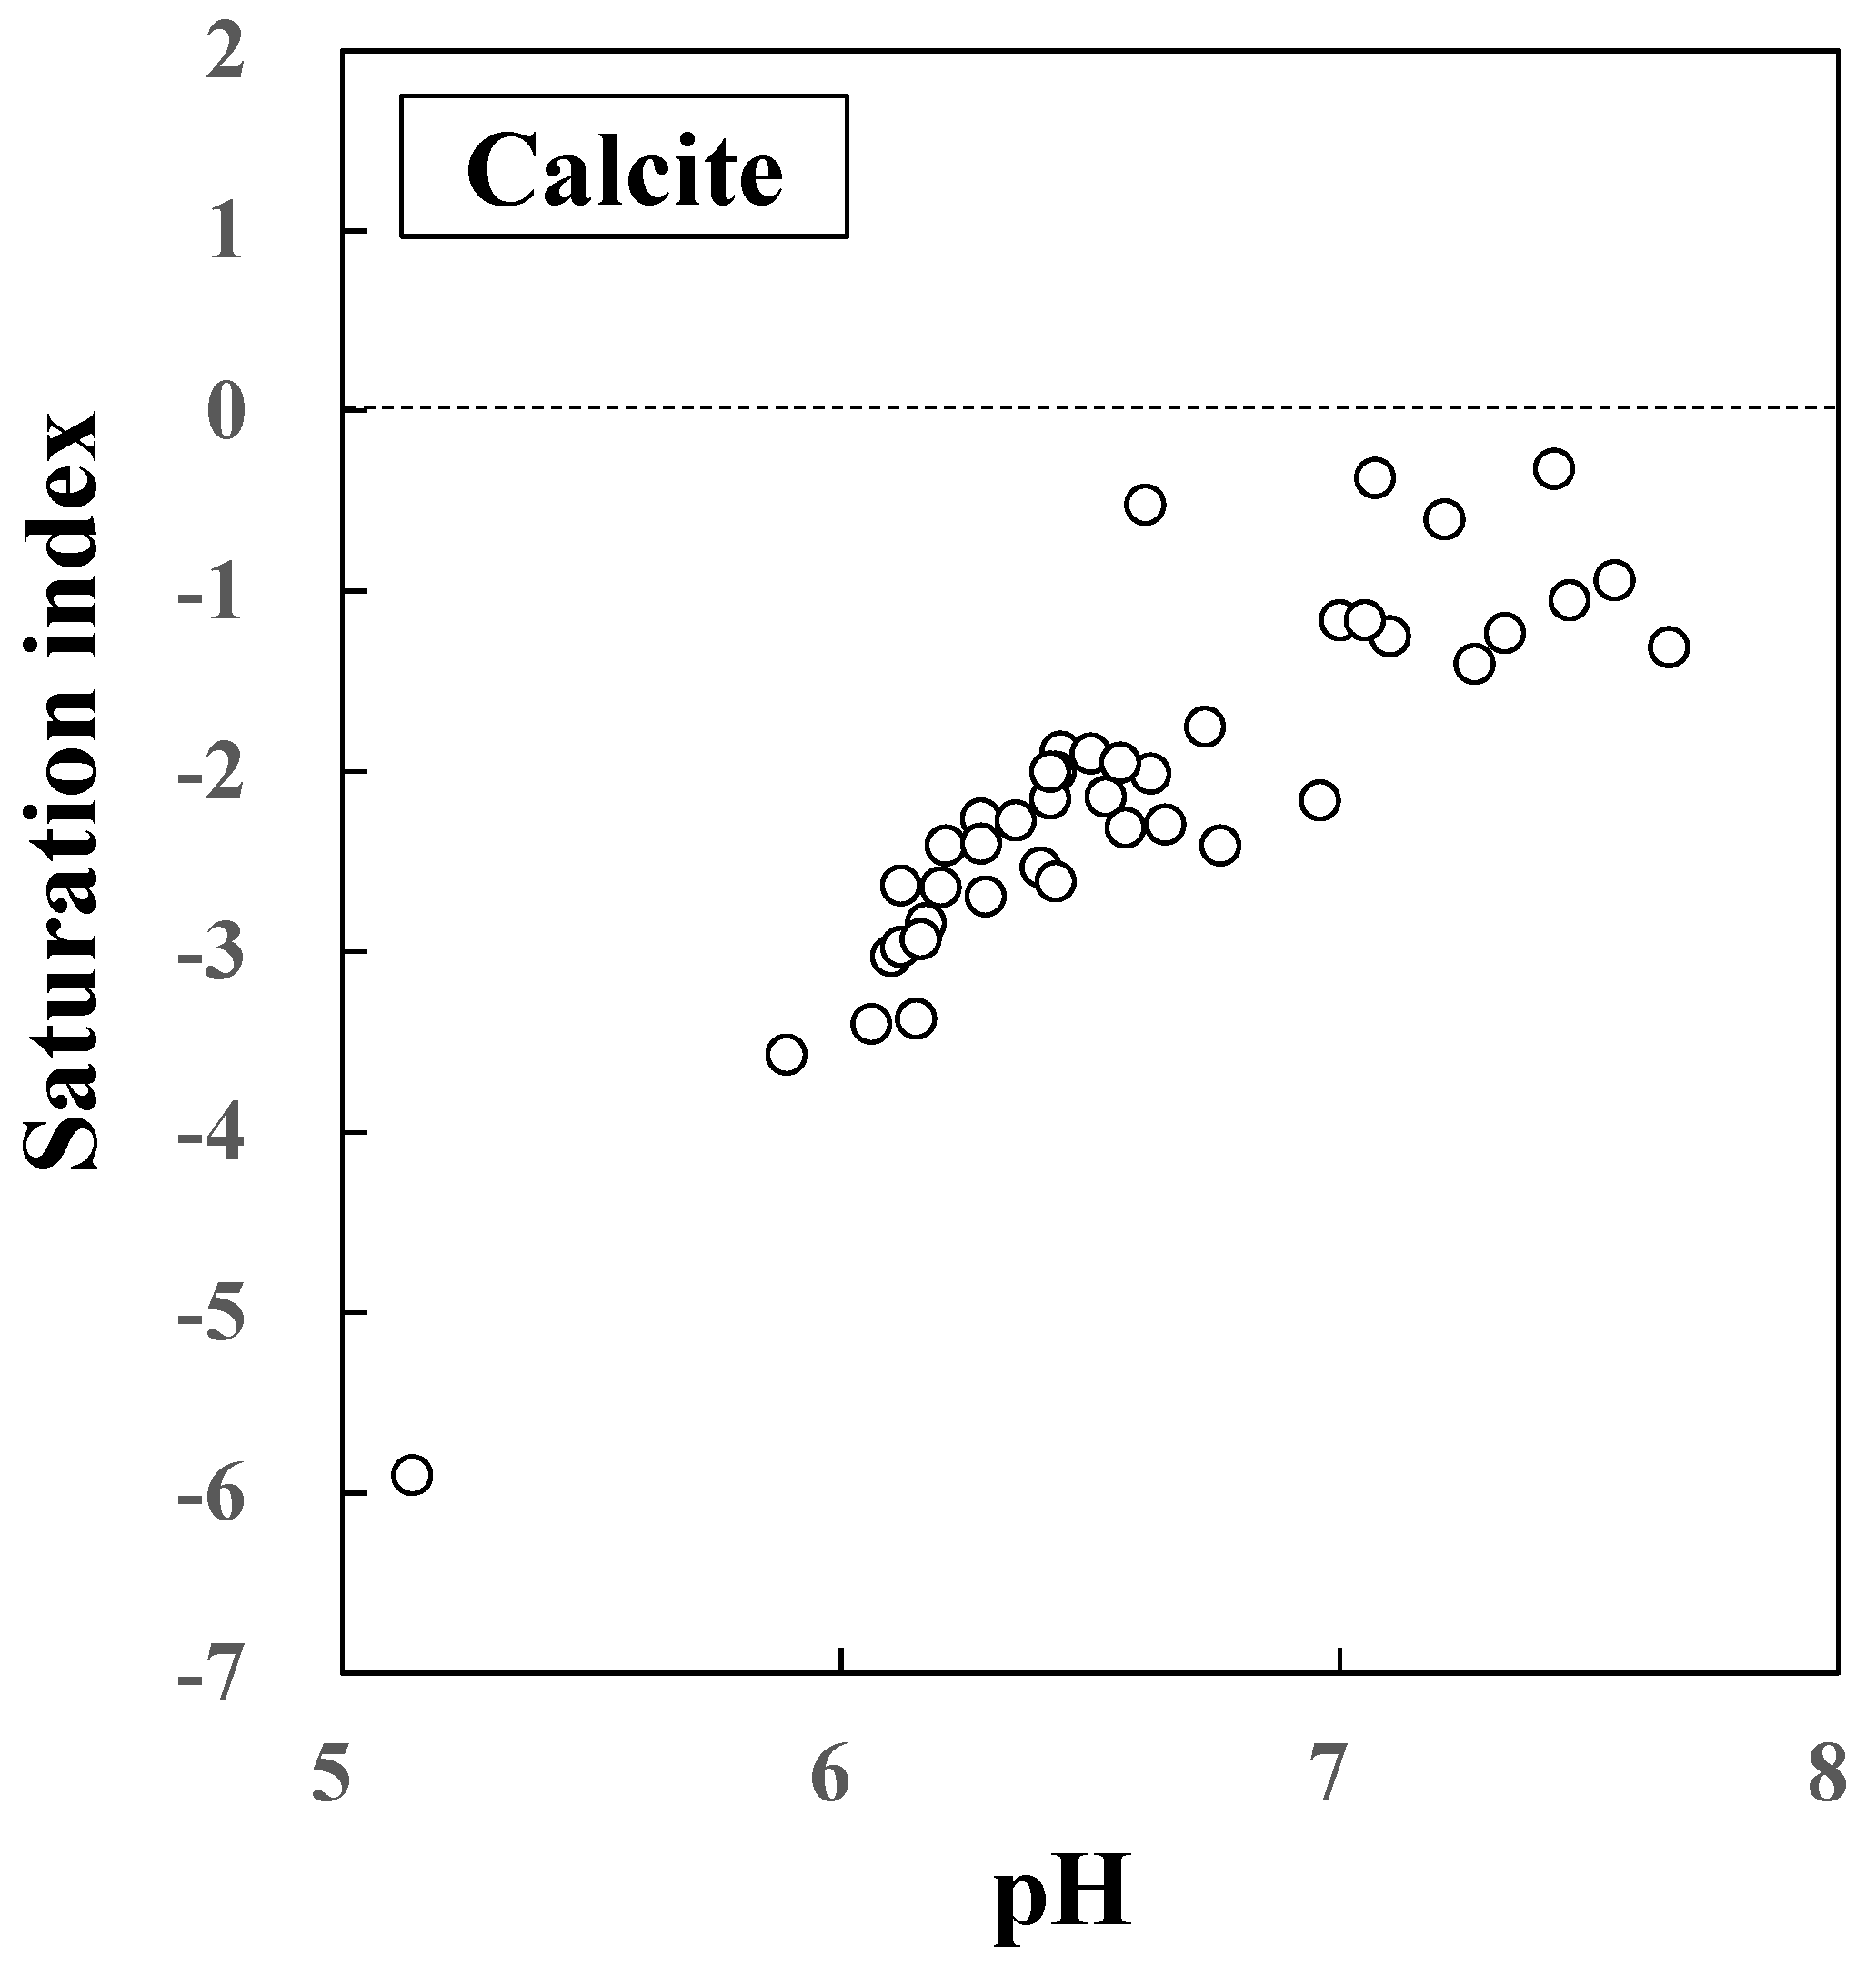
Figure 11.
Saturation index of CaCO3 (Calcite) component in the groundwater.
Figure 11.
Saturation index of CaCO3 (Calcite) component in the groundwater.
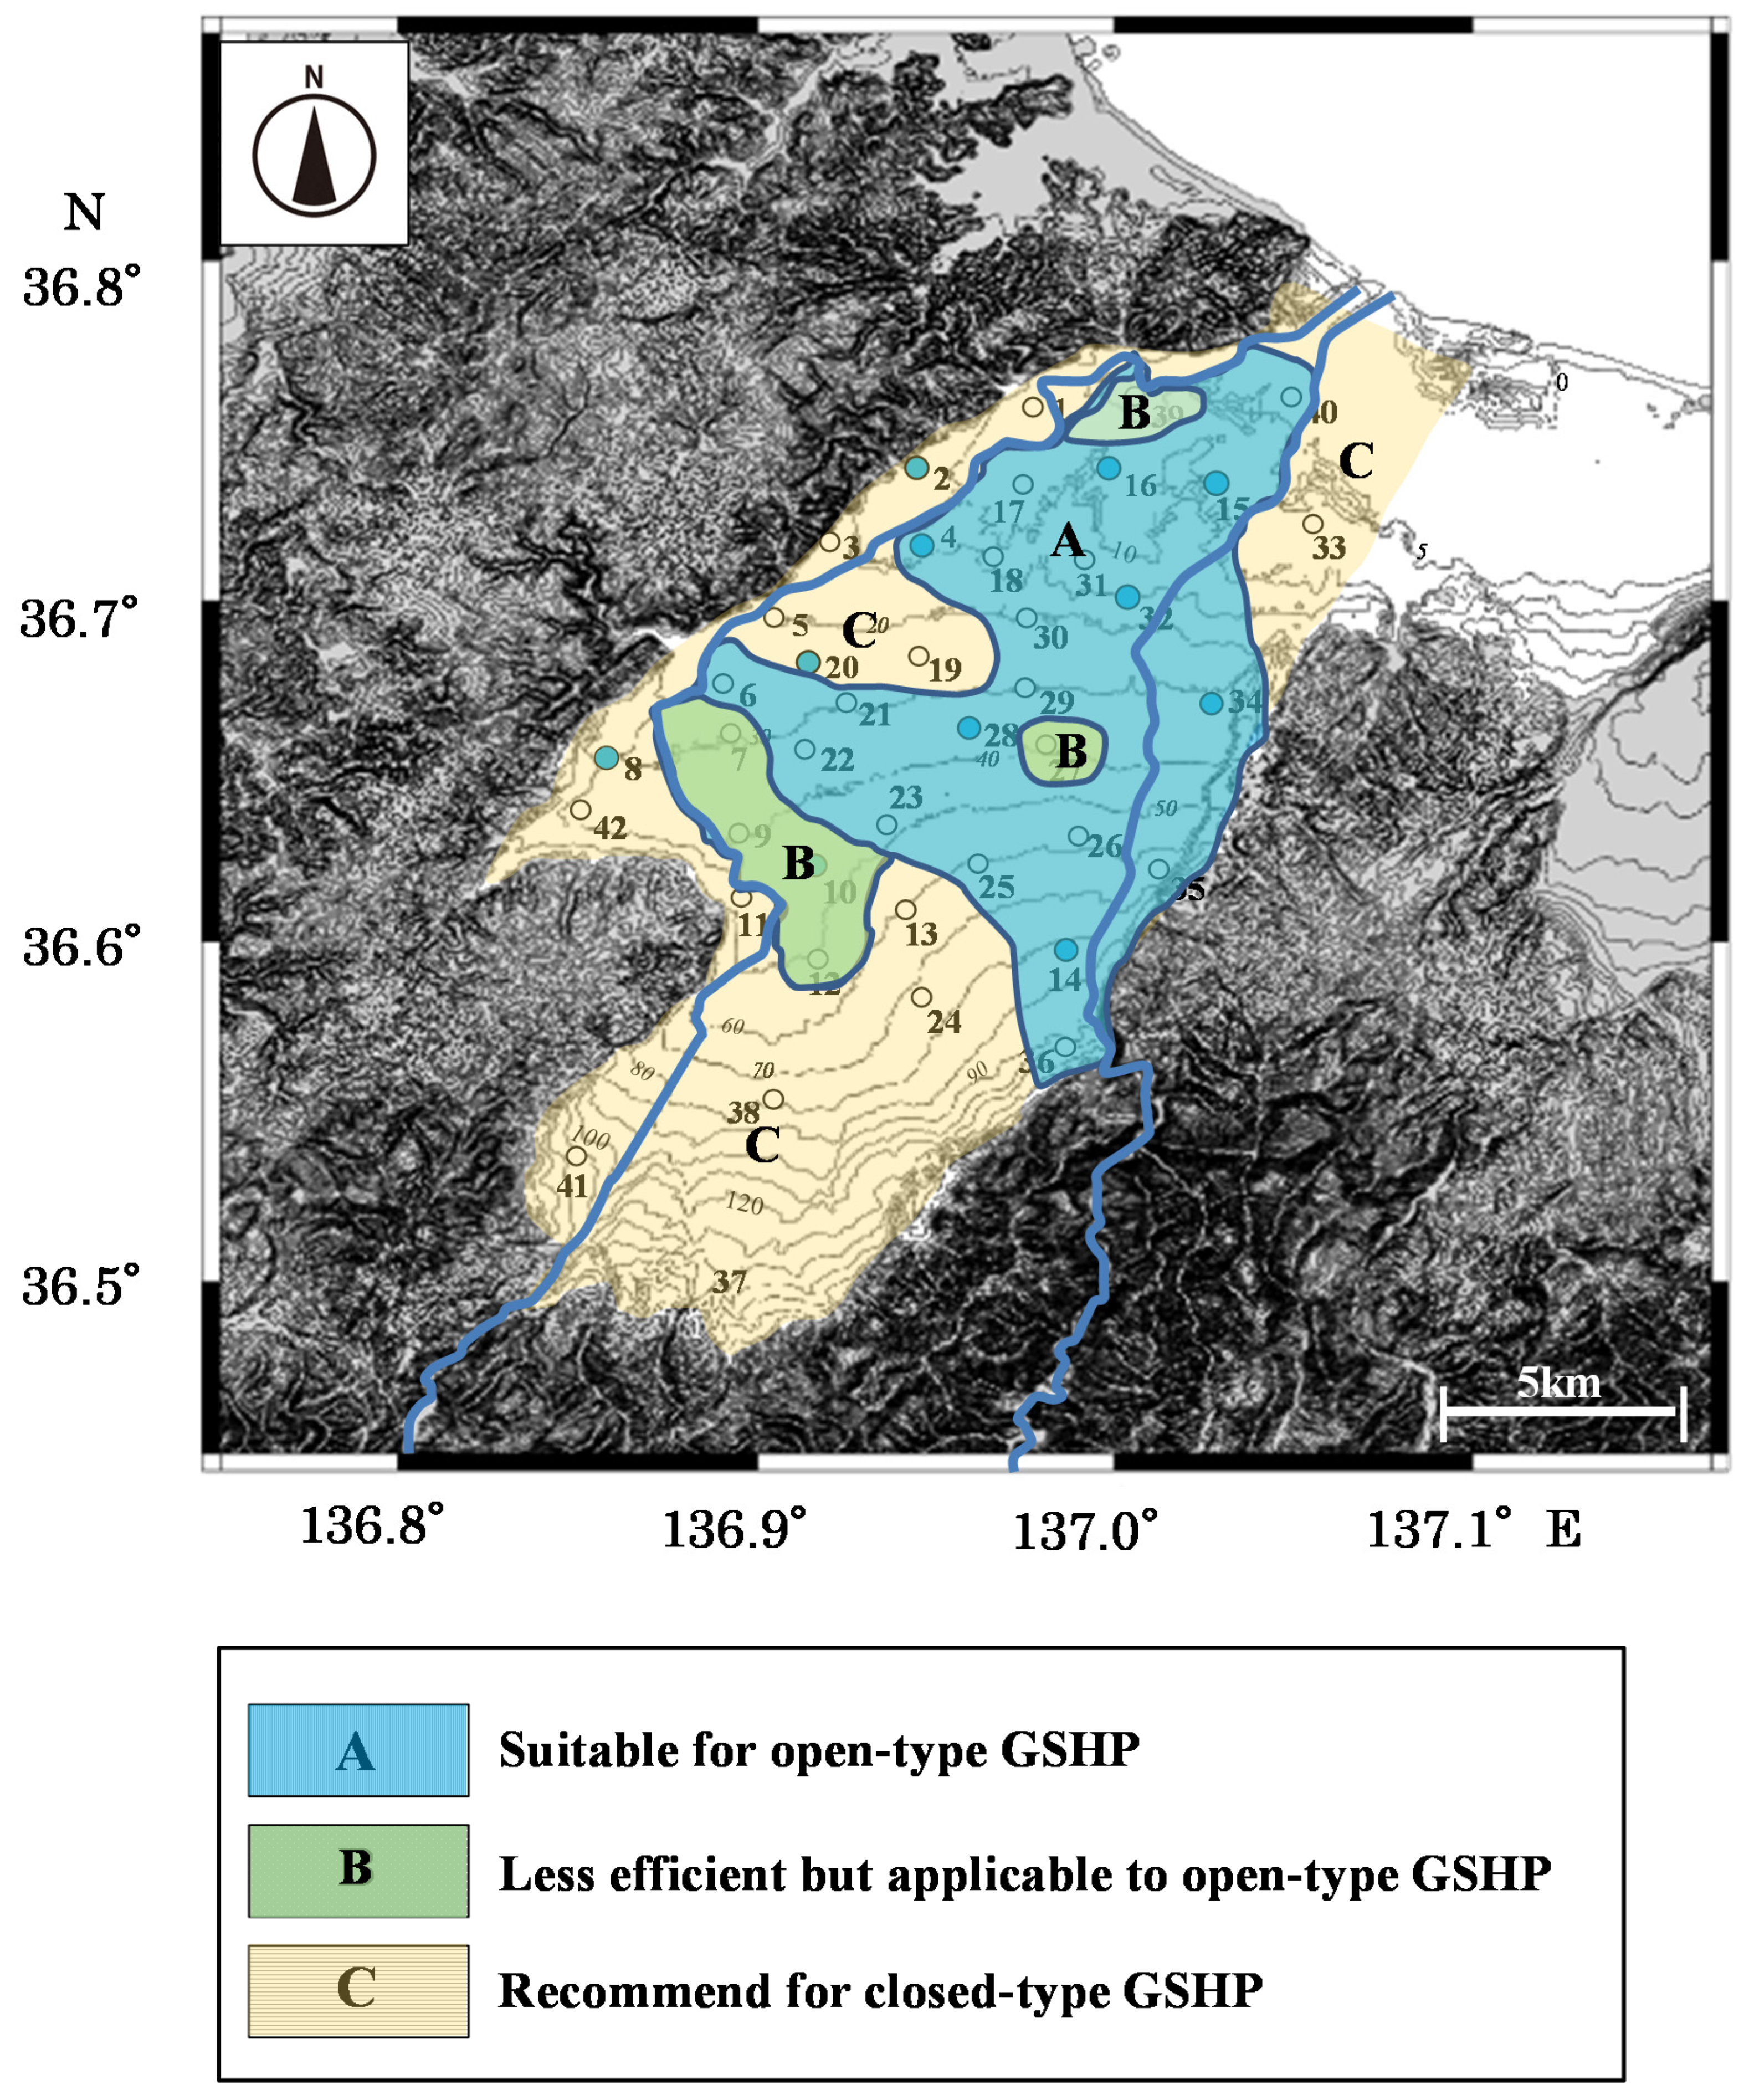
Figure 12.
A map showing the study area where open-type ground source heat-pump systems (GSHPs) are recommended. Region A—suitable for open-type GSHP; Region B—less efficient to applicable to open-type GSHP; Region C—recommend for closed-type GSHP.
Figure 12.
A map showing the study area where open-type ground source heat-pump systems (GSHPs) are recommended. Region A—suitable for open-type GSHP; Region B—less efficient to applicable to open-type GSHP; Region C—recommend for closed-type GSHP.
Table 1.
Sample sites for groundwater and river water in the Sho River alluvial fan.
Table 1.
Sample sites for groundwater and river water in the Sho River alluvial fan.
| Locality No. | Latitude (°) | Longitude (°) | Elevation (m) |
|---|
| Groundwater |
| 1 | 36.7553 | 136.9783 | 7 |
| 2 | 36.7380 | 136.9450 | 11 |
| 3 | 36.7168 | 136.9205 | 16 |
| 4 | 36.7194 | 136.9429 | 12 |
| 5 | 36.6955 | 136.9036 | 21 |
| 6 | 36.6793 | 136.8859 | 26 |
| 7 | 36.6609 | 136.8930 | 31 |
| 8 | 36.6542 | 136.8574 | 34 |
| 9 | 36.6305 | 136.8932 | 40 |
| 10 | 36.6238 | 136.9158 | 47 |
| 11 | 36.6144 | 136.8975 | 45 |
| 12 | 36.5978 | 136.9180 | 55 |
| 13 | 36.6098 | 136.9424 | 64 |
| 14 | 36.5997 | 136.9853 | 83 |
| 15 | 36.7328 | 137.0277 | 11 |
| 16 | 36.7366 | 136.9981 | 7 |
| 17 | 36.7336 | 136.9737 | 8 |
| 18 | 36.7119 | 136.9657 | 14 |
| 19 | 36.6834 | 136.9455 | 26 |
| 20 | 36.6816 | 136.9145 | 25 |
| 21 | 36.6702 | 136.9242 | 31 |
| 22 | 36.6561 | 136.9124 | 38 |
| 23 | 36.6337 | 136.9358 | 50 |
| 24 | 36.5842 | 136.9458 | 78 |
| 25 | 36.6247 | 136.9610 | 61 |
| 26 | 36.6321 | 136.9886 | 59 |
| 27 | 36.6575 | 136.9805 | 42 |
| 28 | 36.6628 | 136.9591 | 37 |
| 29 | 36.6742 | 136.9735 | 30 |
| 30 | 36.6954 | 136.9749 | 21 |
| 31 | 36.7115 | 136.9906 | 15 |
| 32 | 36.7013 | 137.0020 | 17 |
| 33 | 36.7214 | 137.0542 | 10 |
| 34 | 36.6678 | 137.0255 | 36 |
| 35 | 36.6210 | 137.0101 | 70 |
| 36 | 36.5708 | 136.9850 | 114 |
| 37 | 36.5058 | 136.9023 | 169 |
| 38 | 36.5563 | 136.9054 | 81 |
| 39 | 36.7600 | 137.0067 | 4 |
| 40 | 36.7579 | 137.0485 | 3 |
| 41 | 36.5394 | 136.8511 | 122 |
| 42 | 36.6389 | 136.8500 | 38 |
| River water |
| SR1 (Sho R.) | 36.7351 | 137.0438 | 3 |
| SR2 (Sho R.) | 36.5899 | 136.9920 | 96 |
| OR1 (Oyabe R.) | 36.7487 | 136.9798 | 3 |
| OR2 (Oyabe R.) | 36.61764 | 136.89894 | 45 |
Table 2.
Water temperature, pH, electric conductivity (EC), oxidation–reduction potential (ORP), and δ18O composition for groundwater samples in the Sho River alluvial fan on 2 April 2012.
Table 2.
Water temperature, pH, electric conductivity (EC), oxidation–reduction potential (ORP), and δ18O composition for groundwater samples in the Sho River alluvial fan on 2 April 2012.
| Sample No. | Sampling Date | Temp | pH | EC | ORP | δ18O |
|---|
| °C | | mS/m | mV | ‰ |
|---|
| 2 | 2 April 2012 | 13.1 | 7.44 | 37.3 | 153 | −8.3 |
| 4 | 2 April 2012 | 11.7 | 7.69 | 26.0 | 157 | −9.1 |
| 8 | 2 April 2012 | 12.3 | 6.14 | 12.8 | 240 | −8.2 |
| 10 | 2 April 2012 | 12.2 | 7.09 | 12.6 | 187 | −9.4 |
| 14 | 2 April 2012 | 10.6 | 7.27 | 15.3 | 185 | −10.0 |
| 15 | - | - | - | - | - | - |
| 16 | 2 April 2012 | 12.6 | 7.91 | 12.6 | 137 | −10.2 |
| 20 | 2 April 2012 | 13.8 | 7.01 | 19.4 | 184 | −8.8 |
| 28 | 2 April 2012 | 12.5 | 7.24 | 16.0 | 196 | −9.9 |
| 32 | 2 April 2012 | 11.5 | 8.1 | 8.9 | 163 | −10.7 |
| 34 | 2 April 2012 | 12.3 | 7.82 | 11.6 | 189 | −9.7 |
Table 3.
Water temperature, pH, electric conductivity (EC), oxidation–reduction potential (ORP), chemical, and δ18O composition for groundwater samples in the Sho River alluvial fan on 24 April to 1 May 2012.
Table 3.
Water temperature, pH, electric conductivity (EC), oxidation–reduction potential (ORP), chemical, and δ18O composition for groundwater samples in the Sho River alluvial fan on 24 April to 1 May 2012.
| Sample No. | Sampling Date | Temp | pH | EC | ORP | Na+ | K+ | Mg2+ | Ca2+ | Cl− | NO3− | SO42− | HCO3− | SiO2 | δ18O |
|---|
| °C | | mS/m | mV | mg/L | ‰ |
|---|
| 1 | 24 April 2012 | 16.5 | 6.85 | 29.0 | 95 | 19.0 | 3.8 | 15.7 | 25.9 | 13.4 | 0.4 | 6.1 | 152 | 38.1 | −8.4 |
| 2 | 24 April 2012 | 15.1 | 7.07 | 37.1 | 106 | 12.0 | 1.7 | 5.4 | 71.0 | 13.5 | 0.6 | 3.7 | 214 | 33.0 | −8.4 |
| 3 | 24 April 2012 | 13.5 | 8.28 | 10.5 | 65 | 11.1 | 4.5 | 1.4 | 6.1 | 10.9 | 2.9 | 3.1 | 43.9 | 60.0 | −8.6 |
| 4 | 24 April 2012 | 13.3 | 7.23 | 26.2 | 115 | 8.4 | 1.2 | 6.0 | 45.7 | 9.1 | 7.9 | 7.8 | 130 | 20.7 | −9.2 |
| 5 | 24 April 2012 | 15.3 | 7.55 | 20.5 | 163 | 8.2 | 1.0 | 5.5 | 29.6 | 10.5 | 2.4 | 9.9 | 91.1 | 32.7 | −8.4 |
| 6 | 24 April 2012 | 15.2 | 6.76 | 19.3 | 160 | 8.8 | 0.9 | 6.0 | 25.1 | 8.9 | 3.5 | 10.4 | 85.5 | 34.0 | −9.1 |
| 7 | 24 April 2012 | 15.9 | 6.66 | 13.9 | 165 | 6.5 | 0.9 | 2.6 | 19.1 | 7.7 | 3.5 | 10.3 | 49.5 | 21.2 | −9.5 |
| 8 | 24 April 2012 | 12.5 | - | 12.7 | 219 | 7.3 | 6.6 | 4.6 | 5.2 | 10.1 | 20.9 | 13.2 | 8.7 | 17.5 | −8.4 |
| 9 | 24 April 2012 | 13.1 | - | 12.2 | 159 | 6.9 | 0.9 | 2.7 | 14.7 | 8.6 | 4.2 | 7.3 | 41.1 | 17.9 | −9.2 |
| 10 | 24 April 2012 | 13.8 | - | 12.6 | 163 | 7.3 | 0.7 | 2.7 | 15.7 | 8.8 | 3.7 | 8.0 | 43.1 | 21.5 | −9.1 |
| 11 | 25 April 2012 | 14.5 | 7.62 | 17.4 | 167 | 10.6 | 0.8 | 4.8 | 20.4 | 8.1 | 4.5 | 7.6 | 73.9 | 31.8 | −8.5 |
| 12 | 27 April 2012 | 17.3 | 7.65 | 14.0 | 173 | 8.3 | 0.7 | 4.3 | 16.4 | 6.9 | 3.7 | 7.9 | 57.0 | 19.5 | −9.0 |
| 13 | 1 May 2012 | 17.5 | 6.93 | 16.0 | 172 | 6.0 | 1.0 | 2.6 | 25.3 | 6.6 | 6.3 | 11.2 | 61.8 | 21.9 | −8.9 |
| 14 | 1 May 2012 | 13.2 | 8.01 | 14.2 | 157 | 4.7 | 0.9 | 2.7 | 23.3 | 5.4 | 3.1 | 8.2 | 62.2 | 15.6 | −10.0 |
| 15 | 1 May 2012 | 14.4 | 8.07 | 12.2 | 158 | 5.1 | 0.7 | 2.6 | 19.6 | 3.9 | 1.3 | 7.3 | 55.8 | 24.9 | −10.1 |
| 16 | 24 April 2012 | 14.0 | 8.16 | 12.7 | 50 | 5.9 | 0.7 | 2.6 | 18.2 | 4.1 | 2.0 | 6.9 | 56.9 | 23.2 | −10.1 |
| 17 | 28 April 2012 | 14.3 | 7.68 | 17.6 | 120 | 6.6 | 1.0 | 4.5 | 27.3 | 5.7 | 3.8 | 8.7 | 83.0 | 22.9 | −9.9 |
| 18 | 24 April 2012 | 14.2 | 7.57 | 16.6 | 92 | 6.4 | 1.0 | 3.5 | 24.9 | 7.2 | 5.6 | 10.9 | 67.2 | 24.2 | −9.2 |
| 19 | 24 April 2012 | 15.8 | 7.17 | 17.8 | 145 | 6.9 | 1.1 | 2.8 | 28.0 | 8.3 | 7.6 | 13.4 | 65.0 | 21.5 | −8.8 |
| 20 | 24 April 2012 | 15.2 | 6.36 | 19.8 | 168 | 9.2 | 1.3 | 3.9 | 23.7 | 20.0 | 5.2 | 12.9 | 60.0 | 25.9 | −9.0 |
| 21 | 28 April 2012 | 16.5 | 7.23 | 16.4 | 109 | 7.2 | 1.1 | 2.4 | 24.0 | 8.5 | 5.6 | 16.8 | 55.0 | 22.8 | −8.6 |
| 22 | 28 April 2012 | 15.4 | 7.23 | 14.0 | 108 | 7.1 | 1.0 | 2.1 | 18.6 | 8.5 | 4.3 | 12.3 | 44.2 | 20.3 | −9.2 |
| 23 | 1 May 2012 | 14.7 | 7.32 | 17.9 | 168 | 6.5 | 1.1 | 3.2 | 28.5 | 7.0 | 4.4 | 9.7 | 78.0 | 22.5 | −9.1 |
| 24 | 28 April 2012 | 14.4 | 7.48 | 12.3 | 146 | 5.1 | 1.4 | 1.6 | 17.7 | 6.4 | 6.5 | 10.3 | 37.7 | 12.7 | −8.9 |
| 25 | 1 May 2012 | 17.7 | 6.95 | 16.3 | 168 | 5.6 | 1.1 | 2.7 | 27.0 | 6.3 | 5.2 | 9.1 | 69.4 | 22.9 | −9.3 |
| 26 | 28 April 2012 | 14.2 | 7.69 | 9.9 | 128 | 4.0 | 0.7 | 1.7 | 14.5 | 4.0 | 1.8 | 8.0 | 36.4 | 13.9 | −10.2 |
| 27 | 24 April 2012 | 17.8 | - | 12.4 | 158 | 4.9 | 0.8 | 2.4 | 18.9 | 4.3 | 2.6 | 8.9 | 51.4 | 18.3 | −10.0 |
| 28 | 1 May 2012 | 13.7 | 7.62 | 16.0 | 154 | 5.5 | 0.9 | 3.2 | 24.5 | 6.0 | 4.2 | 10.0 | 67.0 | 18.3 | −9.8 |
| 29 | 1 May 2012 | 14.2 | 7.63 | 15.4 | 171 | 6.0 | 1.0 | 2.9 | 23.3 | 6.8 | 4.8 | 10.8 | 59.9 | 21.2 | −9.6 |
| 30 | 1 May 2012 | 14.2 | 7.36 | 13.9 | 181 | 6.0 | 1.3 | 1.6 | 21.2 | 7.4 | 7.9 | 9.6 | 45.0 | 17.2 | −8.9 |
| 31 | 1 May 2012 | 13.5 | 7.79 | 21.7 | 158 | 21.7 | 1.1 | 2.1 | 20.8 | 7.1 | 3.5 | 56.0 | 34.7 | 16.9 | −10.1 |
| 32 | 28 April 2012 | 12.5 | 8.3 | 8.9 | 112 | 4.9 | 0.5 | 1.5 | 12.7 | 3.6 | 1.4 | 9.8 | 31.2 | 22.3 | −10.6 |
| 33 | 1 May 2012 | 14.9 | 7.21 | 13.7 | 213 | 7.8 | 1.0 | 3.8 | 14.6 | 8.7 | 5.2 | 10.1 | 43.4 | 22.5 | −9.0 |
| 34 | 28 April 2012 | 13.9 | 7.46 | 10.5 | 152 | 5.7 | 0.8 | 1.9 | 14.1 | 5.4 | 2.5 | 7.5 | 38.9 | 15.2 | −9.8 |
| 35 | 25 April 2012 | 15.9 | 6.76 | 14.1 | 167 | 9.4 | 1.1 | 3.2 | 15.2 | 13.6 | 4.0 | 7.6 | 41.3 | 17.9 | −9.1 |
| 36 | 25 April 2012 | 11.9 | 7.54 | 10.6 | 144 | 5.4 | 1.0 | 2.3 | 11.9 | 11.5 | 4.7 | 6.6 | 23.6 | 11.0 | −9.6 |
| 37 | 28 April 2012 | 11.9 | 7.60 | 29.1 | 118 | 11.8 | 1.1 | 10.5 | 45.3 | 9.6 | 1.4 | 7.0 | 161 | 38.0 | −8.5 |
| 38 | 28 April 2012 | 13.9 | 6.81 | 11.1 | 173 | 7.5 | 1.1 | 3.1 | 10.3 | 9.6 | 5.9 | 8.2 | 26.7 | 16.4 | −8.9 |
| 39 | 1 May 2012 | 25.3 | 6.71 | 113.5 | -2 | 86.7 | 6.3 | 49.6 | 40.1 | 150 | 1.9 | 13.0 | 420 | 53.3 | −10.5 |
| 40 | 1 May 2012 | 19.5 | 7.64 | 13.2 | 67 | 7.2 | 0.7 | 3.6 | 17.2 | 4.2 | 1.4 | 8.2 | 58.8 | 24.5 | −10.5 |
| 41 | 28 April 2012 | 10.0 | 6.28 | 8.7 | 185 | 5.5 | 1.3 | 1.7 | 9.1 | 7.9 | 5.6 | 5.9 | 18.1 | 21.4 | −9.1 |
| 42 | 28 April 2012 | 14.0 | 7.72 | 14.7 | −40 | 12.7 | 2.3 | 6.5 | 10.6 | 8.3 | 0.1 | 2.7 | 73.9 | 60.8 | −8.8 |
Table 4.
Water temperature, pH, electric conductivity (EC), oxidation–reduction potential (ORP), and δ18O composition for groundwater samples in the Sho River alluvial fan on 29 May 2012.
Table 4.
Water temperature, pH, electric conductivity (EC), oxidation–reduction potential (ORP), and δ18O composition for groundwater samples in the Sho River alluvial fan on 29 May 2012.
| Sample No. | Sampling Date | Temp | pH | EC | ORP | δ18O |
|---|
| °C | | mS/m | mV | ‰ |
|---|
| 2 | 29 May 2012 | 14.2 | 7.11 | 37.9 | 210 | −8.6 |
| 4 | 29 May 2012 | 13.1 | 7.26 | 26.7 | 227 | −9.4 |
| 8 | 29 May 2012 | 11.9 | 5.44 | 13.2 | 286 | −8.6 |
| 10 | 29 May 2012 | 14.6 | 6.40 | 12.8 | 223 | −9.4 |
| 14 | 29 May 2012 | 14.1 | 7.10 | 14.5 | 190 | −10.3 |
| 15 | 29 May 2012 | 14.6 | 7.54 | 12.3 | 194 | −10.1 |
| 16 | 29 May 2012 | 13.2 | 7.45 | 12.0 | 214 | −10.2 |
| 20 | 29 May 2012 | 14.6 | 6.21 | 20.1 | 294 | −9.2 |
| 28 | 29 May 2012 | 14.5 | 6.61 | 16.4 | 258 | −9.9 |
| 32 | 29 May 2012 | 12.1 | 7.61 | 9.0 | 190 | −10.8 |
| 34 | 29 May 2012 | 13.4 | 6.43 | 10.2 | 179 | −9.7 |
Table 5.
Water temperature, pH, electric conductivity (EC), oxidation–reduction potential (ORP), chemical, and δ18O composition for groundwater samples in the Sho River alluvial fan on 23 June to 26 June 2012.
Table 5.
Water temperature, pH, electric conductivity (EC), oxidation–reduction potential (ORP), chemical, and δ18O composition for groundwater samples in the Sho River alluvial fan on 23 June to 26 June 2012.
| Sample No. | Sampling Date | Temp | pH | EC | ORP | Na+ | K+ | Mg2+ | Ca2+ | Cl− | NO3− | SO42− | HCO3− | SiO2 | δ18O |
|---|
| °C | | mS/m | mV | mg/L | ‰ |
|---|
| 1 | 25 June 2012 | 15.4 | 6.99 | 29.4 | 74 | 18.5 | 3.3 | 15.5 | 26.3 | 13.8 | 0.4 | 6.2 | 152 | 38.8 | −8.8 |
| 2 | 25 June 2012 | 15 | 7.13 | 38.1 | 178 | 11.9 | 1.9 | 5.5 | 73.2 | 13.6 | 0.7 | 4.0 | 215 | 32.6 | −8.2 |
| 3 | 25 June 2012 | 18.9 | 6.90 | 9.6 | 181 | 10.7 | 4.0 | 1.2 | 5.2 | 10.8 | 3.5 | 2.9 | 27.2 | 54.2 | −8.4 |
| 4 | 25 June 2012 | 13.9 | 7.37 | 26.5 | 194 | 8.3 | 0.9 | 6.0 | 43.8 | 8.9 | 7.8 | 7.8 | 129 | 22.4 | −9.3 |
| 5 | 25 June 2012 | 14.5 | 6.56 | 21.2 | 221 | 8.0 | 0.9 | 5.9 | 30.8 | 10.5 | 2.5 | 10.2 | 91.9 | 32.5 | −8.7 |
| 6 | 25 June 2012 | 14.6 | 6.57 | 19.8 | 220 | 8.9 | 0.9 | 6.2 | 25.6 | 8.8 | 2.9 | 10.4 | 85.9 | 31.4 | −9.2 |
| 7 | 25 June 2012 | 15.4 | 6.26 | 14.3 | 203 | 6.5 | 1.0 | 2.4 | 18.9 | 7.6 | 3.7 | 9.8 | 50.0 | 21.0 | −9.2 |
| 8 | 25 June 2012 | 12.2 | 5.44 | 13.7 | 263 | 7.5 | 6.8 | 4.8 | 5.3 | 10.6 | 23.2 | 12.9 | 8.6 | 17.8 | −8.3 |
| 9 | 26 June 2012 | 17.1 | 6.50 | 11.0 | 162 | 6.2 | 0.7 | 2.2 | 12.6 | 7.7 | 3.5 | 6.7 | 39.3 | 16.2 | −9.6 |
| 10 | 26 June 2012 | 16.4 | 6.40 | 12.7 | 273 | 7.4 | 0.7 | 2.6 | 14.8 | 8.6 | 3.7 | 7.8 | 43.1 | 21.1 | −8.9 |
| 11 | 25 June 2012 | 13.7 | 6.86 | 17.2 | 191 | 10.6 | 0.9 | 5.0 | 20.5 | 8.1 | 4.6 | 7.6 | 75.5 | 32.6 | −9.0 |
| 12 | 26 June 2012 | 15.9 | 6.45 | 14.0 | 228 | 8.1 | 0.7 | 4.1 | 15.6 | 6.8 | 3.8 | 7.8 | 56.6 | 19.2 | −8.8 |
| 13 | 23 June 2012 | 15.4 | 6.22 | 16.0 | 175 | 5.9 | 1.0 | 2.4 | 24.4 | 6.3 | 6.0 | 10.6 | 60.9 | 22.1 | −8.9 |
| 14 | 23 June 2012 | 13.2 | 7.06 | 13.9 | 181 | 4.6 | 0.8 | 2.7 | 21.5 | 5.1 | 2.9 | 7.8 | 60.0 | 15.9 | −10.1 |
| 15 | 26 June 2012 | 14.5 | 7.56 | 12.3 | 174 | 5.2 | 0.7 | 2.6 | 18.7 | 4.0 | 1.3 | 7.4 | 55.0 | 24.1 | −10.0 |
| 16 | 26 June 2012 | 13 | 7.30 | 12.6 | 194 | 5.7 | 0.7 | 2.6 | 17.0 | 4.1 | 1.9 | 6.8 | 55.4 | 22.9 | −10.1 |
| 17 | 26 June 2012 | 13.1 | 7.07 | 18.1 | 212 | 6.5 | 0.8 | 4.3 | 26.2 | 5.6 | 3.7 | 8.5 | 83.0 | 22.1 | −10.1 |
| 18 | 26 June 2012 | 13 | 6.36 | 16.9 | 227 | 6.3 | 1.0 | 3.6 | 25.1 | 7.4 | 5.8 | 11.3 | 66.2 | 20.0 | −9.5 |
| 19 | 26 June 2012 | 15.6 | 6.15 | 18.1 | 227 | 6.8 | 1.1 | 2.8 | 27.6 | 8.2 | 7.9 | 13.3 | 65.8 | 19.7 | −9.1 |
| 20 | 26 June 2012 | 14.4 | 6.23 | 20.3 | 264 | 8.6 | 1.2 | 3.7 | 26.2 | 19.5 | 5.1 | 12.9 | 58.3 | 23.9 | −9.2 |
| 21 | 26 June 2012 | 16.1 | 6.31 | 15.5 | 162 | 7.3 | 1.0 | 2.5 | 23.8 | 8.6 | 5.7 | 17.3 | 53.4 | 22.5 | −8.7 |
| 22 | 26 June 2012 | 14.2 | 6.21 | 14.1 | 184 | 7.0 | 0.8 | 1.9 | 18.4 | 8.9 | 4.2 | 11.7 | 43.4 | 19.8 | −9.1 |
| 23 | 26 June 2012 | 15.1 | 6.61 | 18.0 | 177 | 6.2 | 1.0 | 3.3 | 27.5 | 7.1 | 3.7 | 9.2 | 79.3 | 20.1 | −9.4 |
| 24 | 23 June 2012 | 12.6 | 6.13 | 11.4 | 201 | 4.5 | 1.2 | 1.3 | 16.7 | 6.0 | 4.5 | 9.6 | 34.0 | 11.8 | −9.1 |
| 25 | 26 June 2012 | 17.2 | 6.50 | 16.9 | 310 | 5.5 | 0.9 | 2.8 | 26.2 | 6.6 | 5.2 | 9.3 | 70.0 | 21.2 | −9.4 |
| 26 | 23 June 2012 | 14 | 6.68 | 9.3 | 191 | 3.9 | 0.7 | 1.4 | 14.5 | 3.9 | 1.5 | 7.6 | 35.9 | 13.4 | −10.6 |
| 27 | 23 June 2012 | 15 | 6.61 | 12.3 | 156 | 4.9 | 0.8 | 2.3 | 18.5 | 4.5 | 2.7 | 9.0 | 50.4 | 19.1 | −10.3 |
| 28 | 26 June 2012 | 14.5 | 6.69 | 15.9 | 388 | 5.6 | 0.9 | 3.2 | 25.7 | 6.5 | 4.5 | 10.5 | 65.3 | 20.0 | −9.9 |
| 29 | 26 June 2012 | 14.5 | 6.45 | 16.0 | 663 | 6.3 | 0.9 | 3.0 | 22.9 | 7.3 | 4.8 | 11.2 | 59.8 | 21.8 | −9.7 |
| 30 | 23 June 2012 | 13.8 | 6.13 | 13.4 | 236 | 5.6 | 1.1 | 1.5 | 19.1 | 7.6 | 6.4 | 9.5 | 43.2 | 16.8 | −9.3 |
| 31 | 23 June 2012 | 13.1 | 6.49 | 22.2 | 222 | 21.7 | 1.1 | 2.0 | 20.4 | 7.5 | 3.5 | 57.5 | 37.3 | 16.5 | −10.2 |
| 32 | 26 June 2012 | 11.8 | 7.58 | 9.0 | 164 | 4.9 | 0.5 | 1.4 | 12.0 | 3.5 | 1.2 | 9.6 | 31.5 | 23.0 | −10.5 |
| 33 | 26 June 2012 | 14.5 | 6.10 | 13.5 | 249 | 7.6 | 0.9 | 3.9 | 14.1 | 8.8 | 5.3 | 10.2 | 44.2 | 22.8 | −8.9 |
| 34 | 25 June 2012 | 13.1 | 6.52 | 9.8 | 183 | 5.2 | 0.8 | 1.8 | 13.5 | 5.2 | 2.2 | 7.3 | 35.1 | 15.1 | −9.3 |
| 35 | - | - | - | - | - | - | - | - | - | - | - | - | - | - | - |
| 36 | 23 June 2012 | 11.8 | 6.30 | 9.8 | 222 | 5.4 | 1.1 | 2.0 | 10.8 | 9.1 | 3.0 | 6.5 | 24.5 | 11.0 | −9.7 |
| 37 | 23 June 2012 | 12.2 | 7.51 | 29.5 | 197 | 11.4 | 1.1 | 10.7 | 43.4 | 9.8 | 1.5 | 7.4 | 160 | 39.6 | −8.6 |
| 38 | 23 June 2012 | 12.8 | 6.14 | 11.0 | 257 | 7.3 | 1.1 | 2.9 | 8.9 | 9.6 | 5.7 | 8.0 | 26.0 | 15.9 | −8.6 |
| 39 | 26 June 2012 | 30.5 | 6.57 | 86.8 | 16 | 74.9 | 4.7 | 41.6 | 90.2 | 134 | 2.5 | 12.5 | 368 | 51.2 | −10.3 |
| 40 | 26 June 2012 | 16.4 | 7.55 | 13.3 | 134 | 7.4 | 0.6 | 3.6 | 16.8 | 4.3 | 1.4 | 8.3 | 58.4 | 23.4 | 10.2 |
| 41 | 23 June 2012 | 14 | 5.97 | 10.3 | 304 | 6.5 | 1.6 | 2.1 | 9.8 | 9.3 | 4.0 | 6.1 | 27.8 | 24.7 | 8.2 |
| 42 | 25 June 2012 | 13.2 | 7.49 | 15.0 | 97 | 12.5 | 2.3 | 6.2 | 9.8 | 8.4 | 0.1 | 1.0 | 73.9 | 62.0 | 9.0 |
Table 6.
Water temperature, pH, electric conductivity (EC), oxidation–reduction potential (ORP), and δ18O composition for groundwater samples in the Sho River alluvial fan on 1 August 2012.
Table 6.
Water temperature, pH, electric conductivity (EC), oxidation–reduction potential (ORP), and δ18O composition for groundwater samples in the Sho River alluvial fan on 1 August 2012.
| Sample No. | Sampling Date | Temp | pH | EC | ORP | δ18O |
|---|
| °C | | mS/m | mV | ‰ |
|---|
| 2 | 1 August 2012 | 15.6 | 7.06 | 37.8 | 211 | −8.4 |
| 4 | 1 August 2012 | 16.1 | 7.19 | 26.3 | 235 | −9.2 |
| 8 | 1 August 2012 | 14.1 | 5.18 | 14.4 | 298 | −8.4 |
| 10 | 1 August 2012 | 16.8 | 6.22 | 12.8 | 207 | −9.0 |
| 14 | 1 August 2012 | 15.9 | 6.92 | 14.7 | 168 | −9.6 |
| 15 | 1 August 2012 | 16.1 | 7.51 | 12.2 | 249 | −10.3 |
| 16 | 1 August 2012 | 13.9 | 7.20 | 12.5 | 180 | −10.4 |
| 20 | 1 August 2012 | 15.4 | 6.03 | 19.9 | 245 | −9.0 |
| 28 | 1 August 2012 | 15.2 | 6.45 | 16.2 | 221 | −9.5 |
| 32 | 1 August 2012 | 12.9 | 7.43 | 9.0 | 213 | −10.6 |
| 34 | 1 August 2012 | 14.3 | 6.15 | 10.5 | 191 | −9.9 |
Table 7.
Water temperature, pH, electric conductivity (EC), oxidation–reduction potential (ORP), chemical, and δ18O composition for groundwater samples in the Sho River alluvial fan on 23 August to 28 August 2012.
Table 7.
Water temperature, pH, electric conductivity (EC), oxidation–reduction potential (ORP), chemical, and δ18O composition for groundwater samples in the Sho River alluvial fan on 23 August to 28 August 2012.
| Sample No. | Sampling Date | Temp | pH | EC | ORP | Na+ | K+ | Mg2+ | Ca2+ | Cl− | NO3− | SO42− | HCO3− | SiO2 | δ18O |
|---|
| °C | | mS/m | mV | mg/L | ‰ |
|---|
| 1 | 23 August 2012 | 17.1 | 7.00 | 28.9 | 83 | 18.1 | 3.4 | 14.7 | 17.5 | 13.8 | 0.2 | 6.4 | 151 | 34.8 | −8.9 |
| 2 | 23 August 2012 | 15.8 | 7.07 | 37.8 | 187 | 12.0 | 2.2 | 5.2 | 72.4 | 13.7 | 0.7 | 4.1 | 211 | 34.9 | −8.7 |
| 3 | 23 August 2012 | 26.1 | 6.76 | 10.2 | 229 | 10.9 | 4.6 | 1.4 | 6.0 | 10.5 | 2.9 | 3.3 | 30.0 | 66.8 | −9.1 |
| 4 | 23 August 2012 | 16.7 | 7.21 | 26.5 | 239 | 8.4 | 1.3 | 5.7 | 43.9 | 8.9 | 7.8 | 8.0 | 130 | 21.4 | −9.5 |
| 5 | 23 August 2012 | 15.5 | 6.44 | 20.8 | 256 | 7.7 | 0.9 | 5.6 | 30.9 | 10.2 | 2.4 | 10.0 | 90.3 | 34.9 | −9.2 |
| 6 | 23 August 2012 | 15.8 | 6.43 | 19.8 | 236 | 8.9 | 0.9 | 6.0 | 25.8 | 9.2 | 3.1 | 10.7 | 85.8 | 31.9 | −9.4 |
| 7 | 23 August 2012 | 16.6 | 6.20 | 14.9 | 231 | 6.8 | 1.0 | 2.7 | 21.3 | 8.3 | 4.1 | 10.6 | 49.6 | 19.1 | −9.1 |
| 8 | 23 August 2012 | 14.9 | 5.14 | 15.5 | 291 | 7.9 | 7.9 | 5.4 | 6.3 | 12.2 | 32.6 | 11.8 | 8.2 | 16.8 | −8.5 |
| 9 | 27 August 2012 | 18.8 | 6.40 | 11.0 | 152 | 6.2 | 0.7 | 2.3 | 12.9 | 6.5 | 3.2 | 6.6 | 45.0 | 15.5 | −9.8 |
| 10 | 27 August 2012 | 16.5 | 6.29 | 12.9 | 216 | 7.4 | 0.7 | 2.7 | 15.3 | 8.9 | 3.8 | 8.0 | 43.4 | 20.4 | −9.5 |
| 11 | 23 August 2012 | 14.8 | 6.73 | 17.6 | 217 | 10.2 | 0.8 | 4.6 | 19.8 | 8.2 | 4.7 | 7.7 | 77.0 | 32.8 | −9.0 |
| 12 | 28 August 2012 | 19.7 | 6.53 | 14.4 | 221 | 8.2 | 0.7 | 4.3 | 16.3 | 6.9 | 4.0 | 8.1 | 56.1 | 17.6 | −9.5 |
| 13 | 28 August 2012 | 21.2 | 6.28 | 16.2 | 194 | 6.2 | 1.1 | 2.6 | 25.9 | 6.5 | 5.9 | 10.9 | 60.6 | 19.3 | −9.4 |
| 14 | 28 August 2012 | 15.6 | 7.10 | 15.3 | 228 | 4.9 | 0.9 | 2.9 | 24.3 | 5.6 | 3.2 | 8.5 | 66.5 | 15.9 | −10.2 |
| 15 | 23 August 2012 | 16.1 | 7.46 | 12.2 | 243 | 5.0 | 0.6 | 2.4 | 18.3 | 3.9 | 1.2 | 7.2 | 53.9 | 22.1 | −10.6 |
| 16 | 23 August 2012 | 13.9 | 7.33 | 12.3 | 195 | 5.8 | 0.7 | 2.5 | 17.4 | 3.9 | 1.7 | 6.4 | 55.1 | 20.8 | −10.6 |
| 17 | 27 August 2012 | 14.5 | 7.05 | 18.0 | 233 | 7.1 | 1.0 | 4.7 | 29.1 | 5.9 | 3.9 | 9.1 | 83.6 | 22.2 | −10.3 |
| 18 | 27 August 2012 | 14.2 | 6.42 | 16.7 | 253 | 6.5 | 1.1 | 3.5 | 25.7 | 7.3 | 5.6 | 11.0 | 66.8 | 19.8 | −9.8 |
| 19 | 27 August 2012 | 15.6 | 6.21 | 18.3 | 291 | 7.0 | 1.1 | 2.8 | 29.2 | 8.5 | 8.2 | 13.5 | 64.2 | 19.5 | −9.1 |
| 20 | 27 August 2012 | 15.5 | 6.12 | 20.1 | 264 | 8.9 | 1.3 | 3.7 | 27.1 | 19.3 | 5.0 | 12.9 | 59.0 | 22.6 | −9.3 |
| 21 | 27 August 2012 | 18.2 | 6.28 | 16.5 | 174 | 7.4 | 1.1 | 2.5 | 24.4 | 8.5 | 5.7 | 18.0 | 53.3 | 20.0 | −9.3 |
| 22 | 27 August 2012 | 15.2 | 6.17 | 14.1 | 191 | 7.0 | 0.9 | 1.9 | 18.8 | 9.6 | 4.1 | 11.6 | 42.3 | 18.4 | −9.5 |
| 23 | 27 August 2012 | 16.1 | 6.42 | 18.1 | 166 | 6.5 | 1.2 | 3.2 | 28.3 | 7.1 | 4.8 | 9.9 | 78.6 | 20.5 | −9.4 |
| 24 | 28 August 2012 | 14.1 | 6.10 | 11.9 | 246 | 4.7 | 1.2 | 1.3 | 18.0 | 5.2 | 5.0 | 10.0 | 39.1 | 11.5 | −10.2 |
| 25 | 28 August 2012 | 19.1 | 6.50 | 16.6 | 229 | 5.5 | 0.9 | 2.7 | 27.2 | 6.6 | 5.1 | 9.5 | 69.0 | 18.9 | −9.7 |
| 26 | 28 August 2012 | 16.8 | 6.65 | 9.5 | 264 | 3.7 | 0.7 | 1.5 | 13.3 | 3.8 | 1.8 | 7.5 | 36.5 | 13.8 | −10.7 |
| 27 | 28 August 2012 | 20.5 | 6.62 | 12.4 | 190 | 4.9 | 0.8 | 2.4 | 17.9 | 4.5 | 2.9 | 8.8 | 50.2 | 17.5 | −10.3 |
| 28 | 27 August 2012 | 15.4 | 6.56 | 16.2 | 231 | 5.4 | 0.9 | 2.9 | 23.6 | 6.3 | 4.3 | 10.2 | 66.9 | 19.1 | −10.0 |
| 29 | 27 August 2012 | 17.1 | 6.35 | 15.9 | 703 | 6.4 | 0.9 | 2.9 | 23.5 | 7.6 | 4.8 | 11.6 | 60.5 | 20.2 | −9.8 |
| 30 | 27 August 2012 | 15.7 | 6.12 | 11.7 | 454 | 5.2 | 1.1 | 1.3 | 17.5 | 6.4 | 4.2 | 9.2 | 38.7 | 15.6 | −9.9 |
| 31 | 27 August 2012 | 14.3 | 6.57 | 22.3 | 389 | 21.7 | 1.3 | 2.0 | 20.4 | 7.9 | 3.2 | 55.6 | 37.0 | 16.6 | −10.4 |
| 32 | 27 August 2012 | 12.8 | 7.66 | 8.9 | 325 | 4.8 | 0.6 | 1.4 | 11.8 | 3.4 | 1.2 | 9.5 | 30.5 | 22.0 | −11.0 |
| 33 | 27 August 2012 | 15.8 | 6.16 | 13.8 | 356 | 7.6 | 1.0 | 3.8 | 14.2 | 8.5 | 5.3 | 9.9 | 45.0 | 21.4 | −9.4 |
| 34 | 28 August 2012 | 15.1 | 6.43 | 10.5 | 225 | 5.1 | 0.7 | 1.9 | 13.8 | 5.6 | 2.5 | 7.5 | 37.3 | 14.8 | −10.2 |
| 35 | 28 August 2012 | 13.7 | 6.96 | 8.3 | 314 | 3.7 | 0.6 | 1.7 | 11.5 | 3.5 | 1.7 | 6.0 | 25.3 | 13.0 | −10.8 |
| 36 | 28 August 2012 | 16.8 | 6.06 | 9.5 | 328 | 5.4 | 1.1 | 1.9 | 10.1 | 7.0 | 3.3 | 6.6 | 29.2 | 11.8 | −10.5 |
| 37 | 28 August 2012 | 14.8 | 7.43 | 30.0 | 71 | 11.4 | 1.2 | 10.3 | 43.8 | 9.6 | 1.7 | 7.8 | 157.9 | 41.0 | −8.7 |
| 38 | 28 August 2012 | 15.6 | 6.15 | 10.5 | 292 | 7.0 | 1.2 | 2.6 | 9.1 | 8.8 | 5.3 | 8.1 | 26.0 | 15.5 | −9.1 |
| 39 | 28 August 2012 | 27.8 | 6.61 | 75.0 | 44 | 74.3 | 5.9 | 43.4 | 89.2 | 138 | 1.9 | 13.9 | 341 | 52.2 | −10.7 |
| 40 | 28 August 2012 | 16.8 | 7.55 | 13.4 | 138 | 7.2 | 0.6 | 3.6 | 16.4 | 4.4 | 1.6 | 8.5 | 60.3 | 22.8 | −10.5 |
| 41 | 28 August 2012 | 18.5 | 5.89 | 10.6 | 303 | 6.7 | 2.0 | 2.2 | 10.6 | 6.9 | 4.2 | 6.1 | 33.7 | 25.8 | −8.9 |
| 42 | 23 August 2012 | 14.1 | 7.27 | 14.9 | −85 | 12.4 | 2.2 | 6.4 | 10.5 | 8.2 | 0.1 | 1.0 | 73.4 | 60.6 | −9.1 |
Table 8.
Water temperature, pH, electric conductivity (EC), oxidation–reduction potential (ORP), and δ18O composition for groundwater samples in the Sho River alluvial fan on 3 October 2012.
Table 8.
Water temperature, pH, electric conductivity (EC), oxidation–reduction potential (ORP), and δ18O composition for groundwater samples in the Sho River alluvial fan on 3 October 2012.
| Sample No. | Sampling Date | Temp | pH | EC | ORP | δ18O |
|---|
| °C | | mS/m | mV | ‰ |
|---|
| 2 | 3 October 2012 | 15.0 | 6.81 | 37.7 | 223 | −8.8 |
| 4 | 3 October 2012 | 16.4 | 6.96 | 26.9 | 227 | −9.4 |
| 8 | 3 October 2012 | 15.8 | 4.84 | 15.7 | 286 | −8.6 |
| 10 | 3 October 2012 | 18.3 | 5.86 | 12.9 | 248 | −9.5 |
| 14 | 3 October 2012 | 14.0 | 6.70 | 13.8 | 252 | −10.5 |
| 15 | 3 October 2012 | 15.4 | 6.91 | 12.3 | 228 | −10.6 |
| 16 | - | - | - | - | - | - |
| 20 | 3 October 2012 | 15.0 | 6.02 | 20.1 | 269 | −9.1 |
| 28 | 3 October 2012 | 14.8 | 6.38 | 15.9 | 234 | −10.0 |
| 32 | 3 October 2012 | 12.3 | 6.91 | 9.0 | 196 | −10.9 |
| 34 | 3 October 2012 | 14.3 | 6.05 | 10.3 | 201 | −10.3 |
Table 9.
Water temperature, pH, electric conductivity (EC), oxidation–reduction potential (ORP), chemical, and δ18O composition for groundwater samples in the Sho River alluvial fan on 30 October to 1 November 2012.
Table 9.
Water temperature, pH, electric conductivity (EC), oxidation–reduction potential (ORP), chemical, and δ18O composition for groundwater samples in the Sho River alluvial fan on 30 October to 1 November 2012.
| Sample No. | Sampling Date | Temp | pH | EC | ORP | Na+ | K+ | Mg2+ | Ca2+ | Cl− | NO3− | SO42− | HCO3− | SiO2 | δ18O |
|---|
| °C | | mS/m | mV | mg/L | ‰ |
|---|
| 1 | 30 October 2012 | 15.6 | 7.00 | 29.5 | 72 | 18.8 | 3.8 | 15.2 | 26.5 | 13.8 | 0.4 | 6.2 | 154 | 37.7 | −8.9 |
| 2 | 30 October 2012 | 14.6 | 7.07 | 37.8 | 226 | 12.2 | 2.0 | 5.5 | 72.4 | 13.8 | 0.7 | 4.1 | 214 | 29.0 | −8.7 |
| 3 | 30 October 2012 | 16.6 | 7.10 | 10.1 | 185 | 11.0 | 5.0 | 1.4 | 6.0 | 10.4 | 3.0 | 3.4 | 30.0 | 60.5 | −8.9 |
| 4 | 30 October 2012 | 16.2 | 7.27 | 26.8 | 239 | 8.9 | 1.5 | 6.2 | 45.6 | 9.3 | 8.1 | 8.0 | 135 | 21.2 | −9.4 |
| 5 | 30 October 2012 | 14.7 | 6.57 | 20.3 | 282 | 8.3 | 1.0 | 5.5 | 29.2 | 10.4 | 2.7 | 10.4 | 87.5 | 34.8 | −9.1 |
| 6 | 30 October 2012 | 15.0 | 6.58 | 19.7 | 283 | 9.0 | 1.0 | 6.1 | 26.7 | 9.4 | 3.8 | 10.5 | 85.8 | 31.2 | −9.4 |
| 7 | 30 October 2012 | 15.0 | 6.27 | 14.2 | 240 | 6.6 | 1.0 | 2.5 | 19.5 | 8.3 | 3.8 | 9.9 | 49.6 | 21.0 | −9.6 |
| 8 | 30 October 2012 | 16.4 | 5.32 | 16.3 | 317 | 8.5 | 9.0 | 5.9 | 6.8 | 12.8 | 36.7 | 11.2 | 8.3 | 19.8 | −8.5 |
| 9 | 30 October 2012 | 14.2 | 6.49 | 11.7 | 178 | 6.6 | 0.7 | 2.5 | 15.1 | 5.7 | 3.2 | 6.4 | 45.0 | 16.8 | −9.9 |
| 10 | 31 October 2012 | 15.6 | 6.65 | 13.0 | 217 | 7.4 | 0.7 | 2.7 | 16.1 | 9.1 | 3.8 | 7.7 | 43.2 | 20.6 | −9.1 |
| 11 | 30 October 2012 | 14.0 | 6.81 | 17.6 | 208 | 11.0 | 0.9 | 5.2 | 21.1 | 8.2 | 4.7 | 7.7 | 77.0 | 30.5 | −9.0 |
| 12 | 31 October 2012 | 15.2 | 6.62 | 14.4 | 222 | 8.2 | 0.7 | 4.3 | 17.1 | 6.9 | 3.8 | 8.0 | 57.6 | 18.7 | −9.5 |
| 13 | 31 October 2012 | 15.0 | 6.30 | 15.6 | 210 | 5.9 | 1.1 | 2.4 | 24.4 | 6.6 | 5.8 | 11.1 | 60.7 | 20.4 | −9.4 |
| 14 | 1 November 2012 | 13.4 | 7.36 | 13.6 | 350 | 4.6 | 0.8 | 2.8 | 22.4 | 5.1 | 2.8 | 7.6 | 59.5 | 15.6 | −10.5 |
| 15 | 1 November 2012 | 14.8 | 7.39 | 12.3 | 280 | 5.1 | 0.8 | 2.5 | 19.5 | 4.1 | 1.3 | 7.4 | 55.0 | 23.1 | −10.5 |
| 16 | 1 November 2012 | 13.1 | 7.30 | 15.6 | 250 | 6.4 | 0.9 | 3.7 | 24.9 | 4.9 | 2.7 | 8.3 | 73.1 | 22.5 | −10.4 |
| 17 | 1 November 2012 | 13.6 | 7.10 | 18.0 | 269 | 6.6 | 0.9 | 4.4 | 27.4 | 5.7 | 3.7 | 8.9 | 83.4 | 21.9 | −10.1 |
| 18 | 30 October 2012 | 13.9 | 6.44 | 17.1 | 286 | 6.5 | 1.0 | 3.6 | 26.1 | 7.4 | 5.8 | 11.3 | 67.0 | 21.8 | −9.6 |
| 19 | 1 November 2012 | 14.3 | 6.20 | 17.7 | 330 | 6.8 | 1.1 | 2.7 | 27.9 | 8.5 | 7.9 | 13.3 | 65.9 | 20.1 | −8.9 |
| 20 | 1 November 2012 | 15.0 | 6.16 | 19.9 | 316 | 8.8 | 1.2 | 3.7 | 27.2 | 20.0 | 4.9 | 12.9 | 59.0 | 24.7 | −9.2 |
| 21 | 1 November 2012 | 14.0 | 6.35 | 17.1 | 224 | 7.3 | 1.1 | 2.6 | 24.6 | 8.5 | 5.6 | 17.8 | 52.6 | 21.7 | −9.2 |
| 22 | 1 November 2012 | 13.6 | 6.46 | 13.6 | 310 | 6.9 | 0.9 | 2.2 | 18.3 | 9.2 | 3.8 | 10.2 | 42.3 | 21.6 | −9.5 |
| 23 | 30 October 2012 | 15.0 | 6.59 | 17.9 | 201 | 6.5 | 1.1 | 3.4 | 29.4 | 7.1 | 3.7 | 9.3 | 78.8 | 19.0 | −9.3 |
| 24 | 31 October 2012 | 14.4 | 6.11 | 13.3 | 238 | 5.5 | 1.4 | 1.6 | 19.9 | 6.1 | 7.1 | 11.0 | 42.1 | 12.5 | −9.6 |
| 25 | 31 October 2012 | 17.4 | 6.48 | 17.0 | 161 | 5.5 | 1.1 | 2.9 | 27.6 | 6.4 | 5.0 | 9.4 | 71.9 | 20.1 | −9.6 |
| 26 | 31 October 2012 | 13.8 | 6.43 | 9.4 | 231 | 3.8 | 0.7 | 1.6 | 14.9 | 3.4 | 1.4 | 7.4 | 36.5 | 13.7 | −10.8 |
| 27 | 31 October 2012 | 15.1 | 6.55 | 12.2 | 162 | 4.8 | 0.7 | 2.2 | 18.7 | 4.3 | 2.4 | 8.8 | 50.2 | 18.0 | −10.3 |
| 28 | 30 October 2012 | 15.0 | 6.70 | 16.0 | 274 | 5.6 | 0.9 | 3.1 | 25.2 | 6.3 | 4.3 | 10.1 | 66.9 | 19.9 | −9.9 |
| 29 | 1 November 2012 | 14.2 | 6.55 | 15.7 | 665 | 6.1 | 0.9 | 3.0 | 23.7 | 6.9 | 4.7 | 11.2 | 59.9 | 20.3 | −9.8 |
| 30 | 1 November 2012 | 15.7 | 6.14 | 13.0 | 293 | 5.8 | 1.2 | 1.4 | 20.0 | 6.2 | 4.5 | 9.1 | 46.2 | 17.2 | −10.0 |
| 31 | 1 November 2012 | 14.0 | 6.55 | 21.4 | 311 | 22.6 | 1.3 | 2.0 | 20.6 | 10.9 | 3.0 | 54.1 | 37.1 | 15.9 | −10.3 |
| 32 | 1 November 2012 | 12.4 | 7.51 | 9.0 | 255 | 4.9 | 0.6 | 1.5 | 12.9 | 3.4 | 1.2 | 9.5 | 31.6 | 22.4 | −10.8 |
| 33 | 31 October 2012 | 15.8 | 6.20 | 13.9 | 300 | 7.9 | 1.0 | 4.1 | 15.5 | 8.5 | 5.5 | 10.2 | 45.0 | 25.1 | −9.2 |
| 34 | 31 October 2012 | 14.8 | 6.42 | 10.1 | 220 | 5.0 | 0.7 | 1.8 | 14.1 | 4.7 | 2.2 | 7.2 | 37.3 | 15.1 | −10.5 |
| 35 | 31 October 2012 | 12.6 | 7.06 | 7.7 | 205 | 3.5 | 0.6 | 1.5 | 11.8 | 3.1 | 1.4 | 5.8 | 30.3 | 12.4 | −10.7 |
| 36 | 31 October 2012 | 17.5 | 6.20 | 10.5 | 274 | 5.9 | 1.3 | 2.2 | 12.4 | 7.9 | 4.7 | 7.1 | 29.2 | 12.4 | −10.2 |
| 37 | 31 October 2012 | 14.6 | 7.45 | 30.6 | 20 | 11.9 | 1.5 | 10.9 | 43.7 | 9.9 | 1.5 | 7.2 | 164 | 38.6 | −8.6 |
| 38 | 31 October 2012 | 16.1 | 6.08 | 11.4 | 275 | 8.2 | 1.4 | 3.3 | 10.1 | 8.1 | 6.0 | 8.7 | 30.7 | 18.4 | −9.1 |
| 39 | 1 November 2012 | 23.0 | 6.60 | 91.4 | 30 | 66.9 | 5.9 | 40.0 | 87.8 | 118 | 1.2 | 12.5 | 335.7 | 38.5 | −10.5 |
| 40 | 1 November 2012 | 14.2 | 7.35 | 13.4 | 265 | 7.4 | 0.7 | 3.7 | 17.2 | 4.3 | 1.4 | 8.4 | 60.3 | 23.2 | −10.5 |
| 41 | 31 October 2012 | 18.0 | 5.97 | 10.7 | 268 | 7.4 | 2.2 | 2.4 | 11.4 | 6.7 | 4.3 | 6.1 | 34.5 | 28.0 | −8.8 |
| 42 | 30 October 2012 | 14.0 | 7.33 | 15.0 | −74 | 12.5 | 2.4 | 6.4 | 10.5 | 8.3 | 0.3 | 1.2 | 75.0 | 53.8 | −9.1 |
Table 10.
Water temperature, pH, electric conductivity (EC), oxidation–reduction potential (ORP), chemical, and δ18O composition for groundwater samples in the Sho River alluvial fan on 13 December to 21 December 2012.
Table 10.
Water temperature, pH, electric conductivity (EC), oxidation–reduction potential (ORP), chemical, and δ18O composition for groundwater samples in the Sho River alluvial fan on 13 December to 21 December 2012.
| Sample No. | Sampling Date | Temp | pH | EC | ORP | Na+ | K+ | Mg2+ | Ca2+ | Cl− | NO3− | SO42− | HCO3− | SiO2 | δ18O |
|---|
| °C | | mS/m | mV | mg/L | ‰ |
|---|
| 1 | 13 December 2012 | 13.0 | 7.25 | 29.8 | 143 | 18.1 | 3.7 | 16.1 | 27.9 | 13.8 | 0.2 | 6.1 | 152 | 42.9 | −8.8 |
| 2 | 13 December 2012 | 13.7 | 7.32 | 38.1 | 163 | 12.3 | 2.0 | 6.0 | 70.8 | 13.9 | 0.6 | 4.3 | 210 | 31.3 | −8.6 |
| 3 | 13 December 2012 | 6.0 | 6.56 | 10.9 | 185 | 11.0 | 4.6 | 1.4 | 6.7 | 11.2 | 3.0 | 3.5 | 29.7 | 60.1 | −8.9 |
| 4 | 13 December 2012 | 14.6 | 7.34 | 27.4 | 183 | 8.5 | 1.1 | 6.1 | 46.2 | 9.1 | 7.9 | 8.3 | 132 | 20.6 | −9.2 |
| 5 | 13 December 2012 | 14.0 | 6.53 | 22.3 | 220 | 8.2 | 0.8 | 6.0 | 33.7 | 10.9 | 1.5 | 10.2 | 97.3 | 29.4 | −9.0 |
| 6 | 13 December 2012 | 14.4 | 6.55 | 20.1 | 206 | 8.9 | 0.9 | 6.1 | 25.8 | 9.2 | 3.8 | 10.5 | 84.6 | 32.6 | −9.3 |
| 7 | 13 December 2012 | 12.4 | 6.29 | 13.8 | 230 | 6.3 | 0.9 | 2.4 | 18.9 | 7.9 | 3.5 | 9.6 | 46.7 | 21.3 | −9.7 |
| 8 | 13 December 2012 | 16.0 | 5.19 | 14.3 | 272 | 7.7 | 7.3 | 4.8 | 5.4 | 11.0 | 25.8 | 13.0 | 7.7 | 18.7 | −8.6 |
| 9 | 21 December 2012 | 12.5 | 6.58 | 12.6 | 234 | 6.9 | 0.8 | 2.8 | 15.8 | 6.9 | 4.5 | 6.7 | 47.4 | 17.0 | −9.5 |
| 10 | 21 December 2012 | 8.5 | 6.69 | 13.3 | 238 | 7.3 | 0.9 | 2.8 | 16.3 | 9.3 | 3.8 | 7.7 | 42.5 | 20.8 | −9.3 |
| 11 | 14 December 2012 | 13.7 | 6.90 | 17.6 | 242 | 10.6 | 0.7 | 5.0 | 20.9 | 8.0 | 4.6 | 7.4 | 75.4 | 29.0 | −9.0 |
| 12 | 19 December 2012 | 14.3 | 6.30 | 14.3 | 262 | 8.2 | 0.7 | 4.4 | 16.6 | 7.2 | 4.2 | 8.4 | 56.7 | 18.9 | −9.4 |
| 13 | 19 December 2012 | 14.0 | 6.38 | 16.1 | 224 | 6.0 | 1.0 | 2.6 | 25.5 | 6.7 | 6.0 | 11.0 | 60.9 | 20.9 | −9.3 |
| 14 | 14 December 2012 | 11.8 | 7.28 | 14.2 | 194 | 4.6 | 0.9 | 2.7 | 22.3 | 5.1 | 2.9 | 7.6 | 60.5 | 15.6 | −10.3 |
| 15 | 13 December 2012 | 14.0 | 7.44 | 12.5 | 204 | 4.9 | 0.7 | 2.5 | 18.6 | 4.2 | 1.4 | 7.3 | 55.0 | 23.4 | −10.5 |
| 16 | 13 December 2012 | 13.7 | 7.41 | 17.5 | 176 | 9.9 | 0.9 | 3.4 | 22.6 | 11.3 | 2.6 | 7.6 | 67.7 | 20.5 | −10.3 |
| 17 | 20 December 2012 | 13.0 | 7.13 | 18.2 | 202 | 6.6 | 0.9 | 4.5 | 26.5 | 5.7 | 3.8 | 8.9 | 82.5 | 21.6 | −10.2 |
| 18 | 20 December 2012 | 13.6 | 6.55 | 17.2 | 227 | 6.2 | 1.0 | 3.5 | 24.9 | 7.1 | 5.6 | 10.9 | 66.1 | 22.4 | −9.7 |
| 19 | 21 December 2012 | 13.7 | 6.28 | 18.6 | 244 | 6.8 | 1.2 | 2.8 | 28.2 | 8.4 | 7.6 | 13.2 | 63.9 | 20.1 | −9.0 |
| 20 | 21 December 2012 | 14.4 | 6.38 | 19.3 | 240 | 8.4 | 1.3 | 3.6 | 26.6 | 17.0 | 4.8 | 12.8 | 55.9 | 24.7 | −9.2 |
| 21 | 21 December 2012 | 12.5 | 6.55 | 17.3 | 210 | 7.5 | 1.1 | 2.6 | 25.1 | 9.1 | 5.9 | 19.2 | 52.4 | 22.1 | −9.2 |
| 22 | 21 December 2012 | 13.3 | 6.42 | 13.6 | 242 | 7.0 | 0.9 | 2.1 | 18.1 | 9.0 | 3.7 | 10.2 | 42.6 | 21.6 | −9.4 |
| 23 | 21 December 2012 | 13.4 | 6.75 | 18.1 | 224 | 6.5 | 1.2 | 3.3 | 28.9 | 6.8 | 3.5 | 9.1 | 79.1 | 20.1 | −9.3 |
| 24 | 19 December 2012 | 14.6 | 6.08 | 15.1 | 252 | 6.4 | 1.8 | 2.1 | 21.4 | 7.7 | 8.7 | 12.1 | 43.8 | 13.9 | −9.1 |
| 25 | 19 December 2012 | 13.4 | 6.58 | 16.7 | 236 | 5.6 | 1.1 | 2.8 | 27.4 | 6.3 | 5.1 | 9.3 | 68.9 | 20.7 | −9.6 |
| 26 | 19 December 2012 | 11.6 | 6.77 | 10.6 | 226 | 4.1 | 0.7 | 1.7 | 16.0 | 4.1 | 2.9 | 7.4 | 39.0 | 14.5 | −10.6 |
| 27 | 19 December 2012 | 10.6 | 6.52 | 12.6 | 237 | 5.0 | 0.9 | 2.5 | 18.3 | 4.4 | 2.7 | 8.8 | 50.3 | 19.0 | −10.3 |
| 28 | 21 December 2012 | 13.7 | 6.83 | 16.2 | 243 | 5.5 | 0.9 | 3.1 | 25.4 | 5.9 | 4.1 | 10.1 | 66.6 | 19.2 | −9.9 |
| 29 | 19 December 2012 | 13.7 | 6.44 | 15.7 | 244 | 6.1 | 1.0 | 3.0 | 23.6 | 6.7 | 4.6 | 11.4 | 60.0 | 21.0 | −9.8 |
| 30 | 21 December 2012 | 13.7 | 6.35 | 14.3 | 291 | 6.1 | 1.3 | 1.6 | 20.4 | 6.4 | 5.3 | 9.0 | 49.8 | 18.0 | −9.8 |
| 31 | 21 December 2012 | 14.0 | 6.78 | 20.9 | 225 | 21.2 | 1.3 | 1.8 | 18.9 | 7.7 | 2.9 | 50.1 | 37.1 | 16.1 | −10.4 |
| 32 | 19 December 2012 | 12.4 | 7.50 | 9.1 | 206 | 4.9 | 0.6 | 1.4 | 12.4 | 3.4 | 1.2 | 9.2 | 32.5 | 22.9 | −10.7 |
| 33 | 19 December 2012 | 14.6 | 6.18 | 13.8 | 233 | 8.0 | 1.1 | 4.2 | 15.5 | 8.6 | 5.5 | 10.0 | 45.3 | 22.8 | −9.1 |
| 34 | 19 December 2012 | 14.0 | 6.61 | 11.8 | 212 | 5.3 | 0.8 | 2.1 | 15.9 | 8.2 | 3.3 | 7.8 | 37.8 | 14.8 | −10.1 |
| 35 | 19 December 2012 | 12.1 | 7.06 | 8.0 | 197 | 3.5 | 0.7 | 1.6 | 11.2 | 3.3 | 1.4 | 5.7 | 30.2 | 12.5 | −10.9 |
| 36 | 19 December 2012 | 14.5 | 6.26 | 10.8 | 259 | 5.8 | 1.3 | 2.2 | 12.3 | 8.3 | 7.9 | 6.6 | 26.5 | 11.6 | −9.7 |
| 37 | 19 December 2012 | 12.0 | 7.50 | 30.7 | 223 | 11.1 | 1.0 | 9.4 | 47.5 | 9.3 | 1.6 | 8.2 | 161 | 39.9 | −8.6 |
| 38 | 19 December 2012 | 15.7 | 6.10 | 11.6 | 273 | 8.0 | 1.4 | 3.3 | 10.2 | 8.1 | 6.7 | 8.1 | 31.2 | 16.4 | −9.0 |
| 39 | 20 December 2012 | 17.0 | 6.81 | 65.0 | 75 | 44.4 | 4.5 | 28.5 | 70.9 | 89.7 | 0.9 | 12.6 | 256 | 41.4 | −10.5 |
| 40 | 14 December 2012 | 13.6 | 7.69 | 13.5 | 174 | 7.2 | 0.7 | 3.7 | 17.0 | 4.3 | 1.5 | 8.4 | 60.0 | 22.9 | −10.5 |
| 41 | 19 December 2012 | 9.4 | 6.11 | 9.1 | 271 | 6.1 | 1.4 | 1.9 | 8.7 | 9.0 | 4.2 | 4.7 | 22.4 | 19.3 | −8.6 |
| 42 | 13 December 2012 | 12.0 | 7.31 | 15.1 | −44 | 12.3 | 2.4 | 6.3 | 10.7 | 8.4 | 0.1 | 1.1 | 73.2 | 59.0 | −9.0 |
Table 11.
Water temperature, pH, electric conductivity (EC), oxidation–reduction potential (ORP), and δ18O composition for groundwater samples in the Sho River alluvial fan on 31 January 2013.
Table 11.
Water temperature, pH, electric conductivity (EC), oxidation–reduction potential (ORP), and δ18O composition for groundwater samples in the Sho River alluvial fan on 31 January 2013.
| Sample No. | Sampling Date | Temp | pH | EC | ORP | δ18O |
|---|
| °C | | mS/m | mV | ‰ |
|---|
| 2 | 31 January 2013 | 13.7 | 7.11 | 38.1 | 166 | −8.6 |
| 4 | 31 January 2013 | 12.7 | 7.29 | 26.4 | 222 | −9.3 |
| 8 | 31 January 2013 | 14.3 | 5.39 | 13.6 | 291 | −8.5 |
| 10 | 31 January 2013 | 9.0 | 6.63 | 13.3 | 266 | −9.2 |
| 14 | 31 January 2013 | 11.4 | 7.11 | 14.7 | 160 | −10.2 |
| 15 | 31 January 2013 | 14.4 | 7.22 | 13.2 | 131 | 10.4 |
| 16 | 31 January 2013 | 13.0 | 7.32 | 15.9 | 116 | 10.2 |
| 20 | 31 January 2013 | 14.4 | 6.25 | 20.5 | 241 | 9.1 |
| 28 | 31 January 2013 | 13.9 | 6.71 | 16.6 | 220 | 9.8 |
| 32 | 31 January 2013 | 12.4 | 7.39 | 9.0 | 224 | 10.8 |
| 34 | 31 January 2013 | 13.0 | 6.20 | 11.7 | 218 | 10.2 |
Table 12.
Water temperature, pH, electric conductivity (EC), oxidation–reduction potential (ORP), chemical, and δ18O composition for groundwater samples in the Sho River alluvial fan on 5 March to 8 March 2013.
Table 12.
Water temperature, pH, electric conductivity (EC), oxidation–reduction potential (ORP), chemical, and δ18O composition for groundwater samples in the Sho River alluvial fan on 5 March to 8 March 2013.
| Sample No. | Sampling Date | Temp | pH | EC | ORP | Na+ | K+ | Mg2+ | Ca2+ | Cl− | NO3− | SO42− | HCO3− | SiO2 | δ18O |
|---|
| °C | | mS/m | mV | mg/L | ‰ |
|---|
| 1 | 6 March 2013 | 14.1 | 7.28 | 30.2 | 170 | 18.9 | 3.8 | 14.7 | 26.6 | 14.3 | 0.2 | 6.3 | 155 | 31.4 | −8.7 |
| 2 | 6 March 2013 | 13.0 | 7.23 | 38.3 | 208 | 12.4 | 2.0 | 6.2 | 70.2 | 13.4 | 0.5 | 4.1 | 212 | 35.5 | −8.7 |
| 3 | 6 March 2013 | 5.5 | 7.27 | 10.7 | 235 | 11.2 | 4.8 | 1.4 | 6.1 | 11.0 | 2.9 | 3.3 | 30.3 | 60.4 | −9.0 |
| 4 | 6 March 2013 | 12.2 | 7.39 | 26.5 | 200 | 8.5 | 1.0 | 6.3 | 43.8 | 9.9 | 8.1 | 8.5 | 128 | 23.0 | −9.3 |
| 5 | 6 March 2013 | 14.6 | 6.64 | 21.9 | 244 | 9.2 | 1.1 | 6.5 | 30.7 | 10.7 | 1.6 | 10.0 | 98.3 | 31.5 | −9.0 |
| 6 | 6 March 2013 | 14.7 | 6.65 | 20.0 | 250 | 9.1 | 1.1 | 6.2 | 26.7 | 9.3 | 3.6 | 10.6 | 86.7 | 30.6 | −9.4 |
| 7 | 5 March 2013 | 10.8 | 6.36 | 14.7 | 245 | 6.9 | 1.0 | 2.6 | 19.0 | 8.3 | 3.5 | 9.2 | 50.1 | 22.2 | −9.6 |
| 8 | 6 March 2013 | 13.0 | 5.40 | 13.0 | 285 | 7.3 | 7.0 | 4.3 | 5.5 | 9.9 | 19.0 | 14.3 | 8.5 | 18.0 | −8.6 |
| 9 | 5 March 2013 | 13.1 | 6.45 | 13.8 | 264 | 7.4 | 1.0 | 2.9 | 16.5 | 9.5 | 4.4 | 6.5 | 46.4 | 17.9 | −9.2 |
| 10 | 5 March 2013 | 9.4 | 6.45 | 13.3 | 296 | 7.6 | 0.8 | 2.8 | 15.5 | 9.5 | 3.8 | 7.7 | 43.6 | 21.8 | −9.4 |
| 11 | 6 March 2013 | 13.6 | 6.90 | 16.8 | 245 | 9.6 | 0.9 | 4.5 | 18.8 | 7.7 | 4.5 | 7.0 | 68.3 | 33.0 | −9.1 |
| 12 | 8 March 2013 | 15.0 | 6.55 | 14.2 | 260 | 8.1 | 0.7 | 4.0 | 15.9 | 6.2 | 3.8 | 7.5 | 56.5 | 19.4 | −9.4 |
| 13 | 8 March 2013 | 15.0 | 6.42 | 16.0 | 180 | 6.2 | 1.0 | 2.7 | 24.1 | 6.7 | 5.8 | 10.2 | 62.5 | 20.8 | −9.4 |
| 14 | 8 March 2013 | 12.5 | 7.33 | 14.0 | 225 | 4.7 | 0.8 | 2.8 | 22.2 | 5.3 | 3.0 | 7.9 | 62.3 | 15.7 | −10.3 |
| 15 | 5 March 2013 | 14.5 | 7.46 | 13.4 | 263 | 5.3 | 0.7 | 2.9 | 20.6 | 4.3 | 1.2 | 7.4 | 61.8 | 23.2 | −10.5 |
| 16 | 6 March 2013 | 13.1 | 7.58 | 15.9 | 235 | 6.3 | 0.9 | 3.6 | 23.6 | 4.8 | 2.9 | 7.8 | 78.8 | 24.1 | −10.3 |
| 17 | 5 March 2013 | 13.4 | 7.38 | 18.2 | 222 | 6.8 | 1.0 | 4.5 | 26.2 | 5.5 | 3.7 | 8.2 | 83.9 | 25.0 | −10.1 |
| 18 | 5 March 2013 | 13.9 | 6.57 | 17.1 | 277 | 6.4 | 1.1 | 3.6 | 24.9 | 7.0 | 5.6 | 10.7 | 67.4 | 23.2 | −9.6 |
| 19 | 5 March 2013 | 14.3 | 6.30 | 18.1 | 270 | 7.0 | 1.3 | 3.0 | 27.2 | 8.2 | 7.1 | 13.1 | 65.9 | 20.7 | −9.0 |
| 20 | 5 March 2013 | 14.5 | 6.28 | 20.5 | 265 | 8.6 | 1.3 | 3.8 | 27.1 | 15.7 | 4.5 | 11.5 | 57.6 | 26.2 | −9.2 |
| 21 | 5 March 2013 | 13.6 | 6.41 | 17.5 | 219 | 7.4 | 1.2 | 2.7 | 24.2 | 7.9 | 4.9 | 16.3 | 53.7 | 23.0 | −9.1 |
| 22 | 5 March 2013 | 13.6 | 6.35 | 13.4 | 250 | 7.0 | 1.0 | 2.2 | 17.5 | 8.7 | 3.7 | 10.1 | 42.5 | 22.2 | −9.6 |
| 23 | 5 March 2013 | 14.0 | 6.51 | 18.1 | 248 | 6.5 | 1.1 | 3.4 | 27.9 | 6.9 | 4.2 | 9.3 | 79.1 | 21.4 | −9.2 |
| 24 | 8 March 2013 | 14.0 | 6.17 | 15.4 | 226 | 6.0 | 1.8 | 2.1 | 21.7 | 10.4 | 6.3 | 12.4 | 44.1 | 14.3 | −9.2 |
| 25 | 8 March 2013 | 16.0 | 6.52 | 16.7 | 191 | 5.7 | 1.0 | 2.9 | 26.8 | 6.3 | 4.8 | 8.3 | 68.2 | 22.6 | −9.6 |
| 26 | 5 March 2013 | 12.0 | 6.70 | 10.6 | 270 | 4.2 | 0.8 | 1.8 | 16.0 | 5.2 | 2.7 | 7.9 | 38.7 | 16.7 | −10.4 |
| 27 | 5 March 2013 | 10.4 | 6.87 | 12.8 | 213 | 5.0 | 0.8 | 2.5 | 16.8 | 4.5 | 2.7 | 8.3 | 50.4 | 21.5 | −10.3 |
| 28 | 5 March 2013 | 13.4 | 6.49 | 16.6 | 478 | 5.7 | 1.1 | 3.3 | 24.7 | 6.2 | 4.4 | 9.9 | 68.3 | 23.1 | −9.9 |
| 29 | 5 March 2013 | 13.7 | 6.51 | 15.9 | 663 | 6.3 | 1.0 | 3.1 | 22.9 | 7.0 | 4.7 | 11.0 | 61.0 | 22.8 | −9.8 |
| 30 | 5 March 2013 | 15.4 | 6.16 | 15.3 | 250 | 6.6 | 1.5 | 1.9 | 21.5 | 8.7 | 6.1 | 8.8 | 52.4 | 19.6 | −9.5 |
| 31 | 8 March 2013 | 14.0 | 6.67 | 20.0 | 241 | 21.3 | 1.3 | 2.1 | 18.1 | 7.2 | 2.7 | 48.7 | 37.5 | 19.0 | −10.5 |
| 32 | 8 March 2013 | 12.3 | 7.69 | 9.0 | 209 | 4.9 | 0.6 | 1.5 | 11.9 | 3.5 | 1.6 | 8.5 | 32.6 | 25.2 | −10.8 |
| 33 | 8 March 2013 | 14.4 | 6.22 | 13.9 | 291 | 7.9 | 1.1 | 3.8 | 14.3 | 8.3 | 4.7 | 9.3 | 44.8 | 21.4 | −9.1 |
| 34 | 8 March 2013 | 13.0 | 6.45 | 11.0 | 220 | 5.8 | 0.8 | 2.0 | 14.2 | 6.6 | 2.8 | 6.8 | 37.8 | 16.3 | −10.3 |
| 35 | 8 March 2013 | 12.7 | 7.05 | 8.2 | 268 | 3.6 | 0.6 | 1.7 | 11.3 | 4.0 | 2.0 | 5.9 | 29.8 | 14.9 | −10.7 |
| 36 | 8 March 2013 | 11.0 | 6.40 | 10.7 | 280 | 5.6 | 1.1 | 2.2 | 11.9 | 10.4 | 5.7 | 6.3 | 24.2 | 12.3 | −9.8 |
| 37 | 8 March 2013 | 10.5 | 7.55 | 30.0 | 238 | 11.9 | 1.2 | 9.9 | 44.6 | 10.6 | 1.4 | 7.7 | 162 | 42.4 | −8.7 |
| 38 | 8 March 2013 | 12.2 | 6.17 | 12.0 | 300 | 7.9 | 1.3 | 3.2 | 10.7 | 10.3 | 6.3 | 7.7 | 30.6 | 17.6 | −9.0 |
| 39 | 5 March 2013 | 15.9 | 6.74 | 103.8 | -210 | 60.5 | 6.3 | 42.0 | 105 | 121 | 3.1 | 12.0 | 398 | 50.3 | −10.6 |
| 40 | 5 March 2013 | 14.1 | 7.61 | 13.5 | 191 | 7.3 | 0.7 | 3.7 | 16.5 | 4.5 | 1.8 | 8.3 | 61.1 | 25.3 | −10.4 |
| 41 | 6 March 2013 | 9.0 | 6.03 | 10.7 | 299 | 6.5 | 1.6 | 2.3 | 10.7 | 10.7 | 4.9 | 5.4 | 23.7 | 24.0 | −9.1 |
| 42 | - | - | - | - | - | - | - | - | - | - | - | - | - | - | - |
Table 13.
Water temperature, pH, EC, oxidation–reduction potential (ORP), and δ18O composition for river water samples in the Sho River alluvial fan.
Table 13.
Water temperature, pH, EC, oxidation–reduction potential (ORP), and δ18O composition for river water samples in the Sho River alluvial fan.
| Sample No. | Sampling Date | Temp | pH | EC | ORP | Na+ | K+ | Mg2+ | Ca2+ | Cl− | NO3− | SO42− | HCO3− | SiO2 | δ18O |
|---|
| °C | | mS/m | mV | mg/L | ‰ |
|---|
| SR1-Mar | 28 March 2012 | 6.1 | 7.28 | 7.6 | 111 | 4.12 | 0.55 | 1.17 | 10.96 | 4.61 | 1.61 | 6.05 | 25.99 | 16.74 | −10.59 |
| SR2-Mar | 28 March 2012 | 5.1 | 7.6 | 7.24 | 141 | 3.86 | 0.47 | 1.12 | 9.74 | 4.15 | 1.61 | 5.33 | 25.93 | 12.42 | −10.56 |
| OR1-Mar | 28 March 2012 | 10.1 | 8.05 | 14.85 | 132 | 11.17 | 2.78 | 2.43 | 15.63 | 16.40 | 2.94 | 9.57 | 41.36 | 10.16 | −9.08 |
| OR2-Mar | 28 March 2012 | 7.7 | 7.87 | 7.44 | 133 | 5.45 | 0.66 | 1.54 | 7.62 | 6.45 | 2.98 | 4.27 | 22.27 | 10.36 | −9.44 |
| SR1-Apr | 25 April 2012 | 16.5 | 7.65 | 7.11 | 147 | 3.31 | 0.47 | 1.08 | 10.96 | 3.83 | 1.05 | 4.47 | 28.30 | 9.47 | −10.57 |
| SR2-Apr | 25 April 2012 | 9.4 | 8.06 | 6.32 | 85 | 2.80 | 0.39 | 0.86 | 9.58 | 3.12 | 1.49 | 4.03 | 23.18 | 9.01 | −10.73 |
| OR1-Apr | 25 April 2012 | 16.5 | 8.27 | 10.82 | 141 | 7.98 | 1.76 | 1.78 | 12.36 | 9.75 | 2.23 | 6.44 | 33.61 | 12.62 | −9.5 |
| OR2-Apr | 25 April 2012 | 15 | 7.59 | 6.71 | 147 | 4.85 | 0.59 | 1.23 | 6.53 | 6.10 | 2.23 | 3.60 | 18.36 | 10.43 | −9.53 |
| SR1-May | 29 May 2012 | 15.7 | 7.68 | 7.02 | 180 | 3.33 | 0.43 | 0.96 | 11.14 | 2.94 | 0.87 | 5.09 | 32.21 | 8.45 | −10.68 |
| SR2-May | 29 May 2012 | - | 7.33 | 7.11 | 167 | 3.79 | 0.43 | 1.24 | 10.96 | 3.51 | 1.05 | 5.14 | 23.12 | 9.03 | −10.52 |
| OR1-May | 29 May 2012 | 17.3 | 7.64 | 10.81 | 213 | 6.09 | 1.06 | 2.13 | 14.59 | 6.56 | 1.74 | 7.16 | 40.69 | 10.93 | −9.57 |
| OR2-May | 29 May 2012 | 17.5 | 7.36 | 8.4 | 226 | 4.92 | 0.78 | 1.59 | 10.36 | 5.74 | 1.80 | 5.57 | 29.04 | 8.77 | −9.26 |
| SR1-Jun | 25 June 2012 | 16.7 | 7.44 | 7.28 | 191 | 3.15 | 0.47 | 1.01 | 10.82 | 2.87 | 0.99 | 5.48 | 28.98 | 9.23 | −10.61 |
| SR2-Jun | 25 June 2012 | 16.6 | 7.85 | 7.95 | 146 | 4.30 | 0.55 | 1.43 | 11.82 | 4.68 | 0.93 | 5.67 | 30.87 | 9.12 | −11.03 |
| OR1-Jun | 25 June 2012 | 18 | 7.35 | 10.74 | 183 | 5.56 | 1.02 | 2.07 | 14.57 | 5.85 | 1.80 | 6.68 | 41.24 | 12.86 | −9.85 |
| OR2-Jun | 25 June 2012 | 20.7 | 8.78 | 7.7 | 121 | 4.44 | 0.78 | 1.59 | 11.46 | 4.54 | 1.55 | 5.24 | 32.70 | 10.50 | −9.99 |
| SR1-Aug1 | 1 August 2012 | 23.9 | 7.58 | 7.18 | 195 | 3.26 | 0.59 | 1.05 | 11.28 | 2.69 | 0.93 | 5.52 | 29.22 | 10.14 | −10.89 |
| SR2-Aug1 | 1 August 2012 | 21.1 | 7.28 | 6.6 | 217 | 2.69 | 0.51 | 0.94 | 10.40 | 2.41 | 1.12 | 4.85 | 25.86 | 9.64 | −10.91 |
| OR1-Aug1 | 1 August 2012 | 26.7 | 7.72 | 12.72 | 219 | 7.20 | 1.29 | 2.65 | 17.07 | 6.98 | 1.74 | 8.69 | 47.70 | 9.55 | −9.56 |
| OR2-Aug1 | 1 August 2012 | 31.8 | 8.7 | 9.43 | 133 | 5.22 | 1.06 | 1.74 | 12.04 | 5.21 | 1.61 | 6.24 | 33.79 | 14.06 | −9.77 |
| SR1-Aug2 | 23 August 2012 | 23.8 | 7.53 | 6.94 | 232 | 3.17 | 0.59 | 0.92 | 10.60 | 2.62 | 0.74 | 5.72 | 25.38 | 10.04 | −11.06 |
| SR2-Aug2 | 23 August 2012 | 20.1 | 7.33 | 6.16 | 193 | 2.60 | 0.51 | 0.91 | 9.42 | 2.27 | 0.74 | 5.24 | 21.47 | 9.41 | −11.16 |
| OR1-Aug2 | 23 August 2012 | 25.1 | 7.37 | 10.98 | 215 | 6.02 | 1.41 | 1.98 | 13.45 | 6.06 | 1.92 | 7.54 | 38.67 | 13.07 | −9.75 |
| OR2-Aug2 | 23 August 2012 | 27.5 | 8.76 | 8.1 | 136 | 5.06 | 0.94 | 1.67 | 11.02 | 4.96 | 1.36 | 5.72 | 28.37 | 10.50 | −9.77 |
| SR1-Oct1 | 3 October 2012 | 19.3 | 6.81 | 7.59 | 270 | 3.68 | 0.63 | 1.13 | 11.88 | 3.19 | 1.05 | 5.91 | 28.18 | 10.25 | −10.97 |
| SR2-Oct1 | 3 October 2012 | 19.3 | 7.08 | 11.95 | 213 | 7.43 | 0.70 | 2.61 | 14.53 | 6.77 | 2.17 | 7.68 | 43.31 | 12.63 | −10.24 |
| OR1-Oct1 | 3 October 2012 | 19.7 | 6.89 | 13.27 | 260 | 7.89 | 1.80 | 2.74 | 16.69 | 7.48 | 2.73 | 8.89 | 48.01 | 17.10 | −9.76 |
| OR2-Oct1 | 3 October 2012 | 20.4 | 6.86 | 9.8 | 208 | 5.95 | 1.49 | 1.91 | 11.96 | 5.67 | 2.48 | 5.96 | 34.95 | 13.03 | −9.98 |
| SR1-Oct2 | 30 October 2012 | 14.7 | 7.5 | 8.66 | 210 | 4.41 | 0.66 | 1.33 | 12.81 | 4.40 | 1.05 | 6.96 | 31.54 | 10.08 | −10.86 |
| SR2-Oct2 | 31 October 2012 | 14.3 | 7.52 | 15.64 | 211 | 10.83 | 1.02 | 3.60 | 17.62 | 14.32 | 2.36 | 9.61 | 51.18 | 11.47 | −9.96 |
| OR1-Oct2 | 30 October 2012 | 14 | 7.35 | 13.68 | 207 | 8.09 | 1.29 | 2.85 | 18.02 | 7.55 | 2.29 | 9.94 | 49.17 | 14.93 | −9.60 |
| OR2-Oct2 | 30 October 2012 | 15.5 | 6.89 | 10.54 | 210 | 7.31 | 0.98 | 2.44 | 13.07 | 6.91 | 1.86 | 6.00 | 41.24 | 13.60 | −9.33 |
| SR1-Dec | 14 December 2012 | 7.2 | 7.45 | 9.16 | 186 | 4.14 | 0.55 | 1.23 | 12.93 | 5.39 | 1.43 | 7.54 | 30.26 | 9.98 | −10.63 |
| SR2-Dec | 14 December 2012 | 7.6 | 8.19 | 12.73 | 171 | 6.99 | 0.70 | 2.54 | 15.67 | 8.22 | 1.98 | 7.83 | 39.10 | 10.93 | −10.27 |
| OR1-Dec | 13 December 2012 | 7 | 7.56 | 14.27 | 156 | 11.20 | 1.21 | 2.46 | 13.57 | 16.48 | 2.79 | 7.49 | 35.56 | 13.89 | −9.50 |
| OR2-Dec | 13 December 2012 | 8.6 | 7.43 | 10.38 | 232 | 7.10 | 0.98 | 2.06 | 10.46 | 9.71 | 2.73 | 5.43 | 30.20 | 13.49 | −9.36 |
| SR1-Jan | 31 January 2013 | 3.7 | 7.5 | 7.98 | 157 | 3.91 | 0.51 | 1.05 | 10.62 | 4.89 | 1.18 | 5.86 | 26.60 | 10.03 | −10.57 |
| SR2-Jan | 31 January 2013 | 6.9 | 7.6 | 9.63 | 201 | 5.36 | 0.55 | 1.58 | 11.78 | 7.20 | 1.49 | 6.44 | 29.71 | 10.29 | −10.54 |
| OR1-Jan | 31 January 2013 | 5.5 | 7.3 | 13.67 | 165 | 9.36 | 1.09 | 2.57 | 15.31 | 11.52 | 2.48 | 8.31 | 38.37 | 14.72 | −9.61 |
| OR2-Jan | 31 January 2013 | 5.6 | 7.46 | 10.44 | 211 | 7.63 | 0.82 | 2.02 | 10.52 | 9.36 | 2.29 | 4.90 | 27.02 | 12.98 | −9.42 |
| SR1-Mar | 6 March 2013 | 3.7 | 7.76 | 8.83 | 218 | 4.74 | 0.55 | 1.45 | 11.66 | 6.27 | 1.36 | 6.77 | 39.47 | 10.82 | −10.63 |
| SR2-Mar | 6 March 2013 | 4.7 | 7.86 | 8.45 | 216 | 4.25 | 0.63 | 1.07 | 11.18 | 5.39 | 1.24 | 5.67 | 22.75 | 10.98 | −10.74 |
| OR1-Mar | 6 March 2013 | 5.4 | 7.68 | 12.26 | 220 | 7.77 | 0.94 | 2.20 | 13.37 | 9.93 | 2.79 | 7.64 | 35.93 | 13.30 | −9.52 |
| OR2-Mar | 6 March 2013 | 11 | 7.59 | 11.03 | 221 | 7.01 | 0.82 | 2.27 | 11.82 | 9.71 | 2.54 | 4.95 | 33.06 | 12.82 | −9.18 |


