Article

The Study of Uranium Accumulation in Marine Bottom Sediments: Effect of Redox Conditions at the Time of Sedimentation

1
Skolkovo Institute of Science and Technology, Skoltech Center for Hydrocarbon Recovery, Bolshoy Boulevard 30, bld. 1, 121205 Moscow, Russia
2
Petroleum Geology Department, Lomonosov Moscow State University, GSP-1, Leninskie Gory, 119991 Moscow, Russia
3
Hydroisotop GmbH, Woelkestrasse 9, 85301 Schweitenkirchen, Bayern, Germany
4
Vernadsky Institute of Geochemistry and Analytical Chemistry, st. Kosygina, 19, 119991 Moscow, Russia
*
Author to whom correspondence should be addressed.
Geosciences 2021, 11(8), 332; https://doi.org/10.3390/geosciences11080332
Submission received: 31 May 2021 / Revised: 30 June 2021 / Accepted: 17 July 2021 / Published: 6 August 2021
(This article belongs to the Special Issue Radioisotopes Studies in the Geosciences)

Abstract

:
To evaluate the effect of redox conditions at the sedimentation stage on uranium content and U/TOC ratio in marine source rocks, we analyzed the accumulation of uranium in modern marine bottom sediments formed in different redox conditions. The behavior of uranium from bottom sediments formed in oxidizing and sub-oxidizing settings has been studied on the sediments of the Upper Pleistocene–Holocene age accumulated in the coastal area of the White Sea (Kandalaksha Gulf). We studied the content of uranium, Eh, pH, TOC, C, H, N, and S element and isotope compositions and other parameters in two sampled columns of bottom sediments at a depth of 0–2.5 m. The composition of sediments was typical for the shelf zone where marine genesis mixes with the continental run-off. The upper layer of sediments (0–50 cm) were characterized by oxidizing conditions (Eh ~ 400 mV); with the increase in depth, redox conditions changed from oxidizing to reducing (−0 ÷ −200 mV). The uranium concentration in the upper layer was 1–1.5 ppm, U/TOC ratio varied in the range of 0.8–1.1 ppmU/%TOC. The uranium content and U/TOC ratio increased up to the values of 2.6 ppm and 1.4 ppmU/%TOC at a depth of 0.5–2.5 m, respectively, but the general content of uranium in the studied environment was close to the values characterizing continental run-off. The results obtained for the White Sea sediments were compared with the sediment of the Black Sea, formed in the anoxic conditions of hydrogen sulfide contamination. In these conditions, the uranium content varied from 10 to 20 ppm. The obtained data were interpreted using thermodynamic modeling of the uranium forms in the seawater at different pH and Eh. This study demonstrated that the change of redox conditions from oxidizing to reducing leads to increased uranium content due to a decrease in uranium’s solubility in water. These results show that oxidation–reduction potential could be one of the most important factors controlling uranium content in black shales formed in the marine environment.

1. Introduction

The study of modern marine deposits at the early diagenesis stage provides an opportunity to analyze in detail the processes and factors affecting the content and composition of organic matter and inorganic compounds in source rocks formed in marine conditions tens and hundreds of millions of years ago. In particular, the study of uranium concentrations in bottom sediments may provide valuable information on uranium accumulation in sedimentation and diagenesis processes, explaining high content and considerable variations (from 1 ppm to several hundred ppm) of uranium in source rocks. In this respect, uranium is one of the most interesting elements because the data on uranium content are available from gamma logging data for wells drilled at oil fields. Following existing knowledge, the uranium of marine source rocks accumulated in bottom sediments during marine sedimentation. The sources of uranium are continental run-off and uranium dissolved in seawater. Dissolved uranium can be accumulated by marine organisms, absorbed by organic matter, and included in minerals formed during sedimentations. Uranium concentration in bottom sediments (and in source rocks) depends on several factors, including the rate of sedimentation, uranium content in the seawater, content and the source of organic matter, redox conditions, and mineral composition sediments, and others [1,2,3,4,5]. The interrelation of uranium content with the composition and genesis of source rock creates good opportunities for the characterization of oil shales. However, multiple factors affecting uranium content make interpretation difficult. In practical terms, the data on vertical variations of uranium are mainly used to delineate the oil source rock formations and cross-sections with other logging data [6].
The study of uranium variation is a valuable tool for the characterization of various geological objects and processes. For example, based on the dependence of uranium forms and concentrations in water and minerals on the system’s composition and P, T, Eh, and pH conditions, the variations of uranium concentration are successfully applied in different paleoclimatic reconstructions [7,8,9,10,11].
This study is devoted to the effect of redox conditions on uranium accumulation in marine bottom sediments. The uranium content in the sediments formed in oxidizing and sub-oxidizing settings has been studied using sediments from the Upper Pleistocene–Holocene age accumulated in the coastal area of the White Sea (Kandalaksha Gulf). The results were compared with sediment from the Black Sea, formed in the anoxic conditions of hydrogen sulfide contamination [12]. The interpretation of results was carried out using thermodynamic modeling uranium forms in a water-sediment system at different conditions.

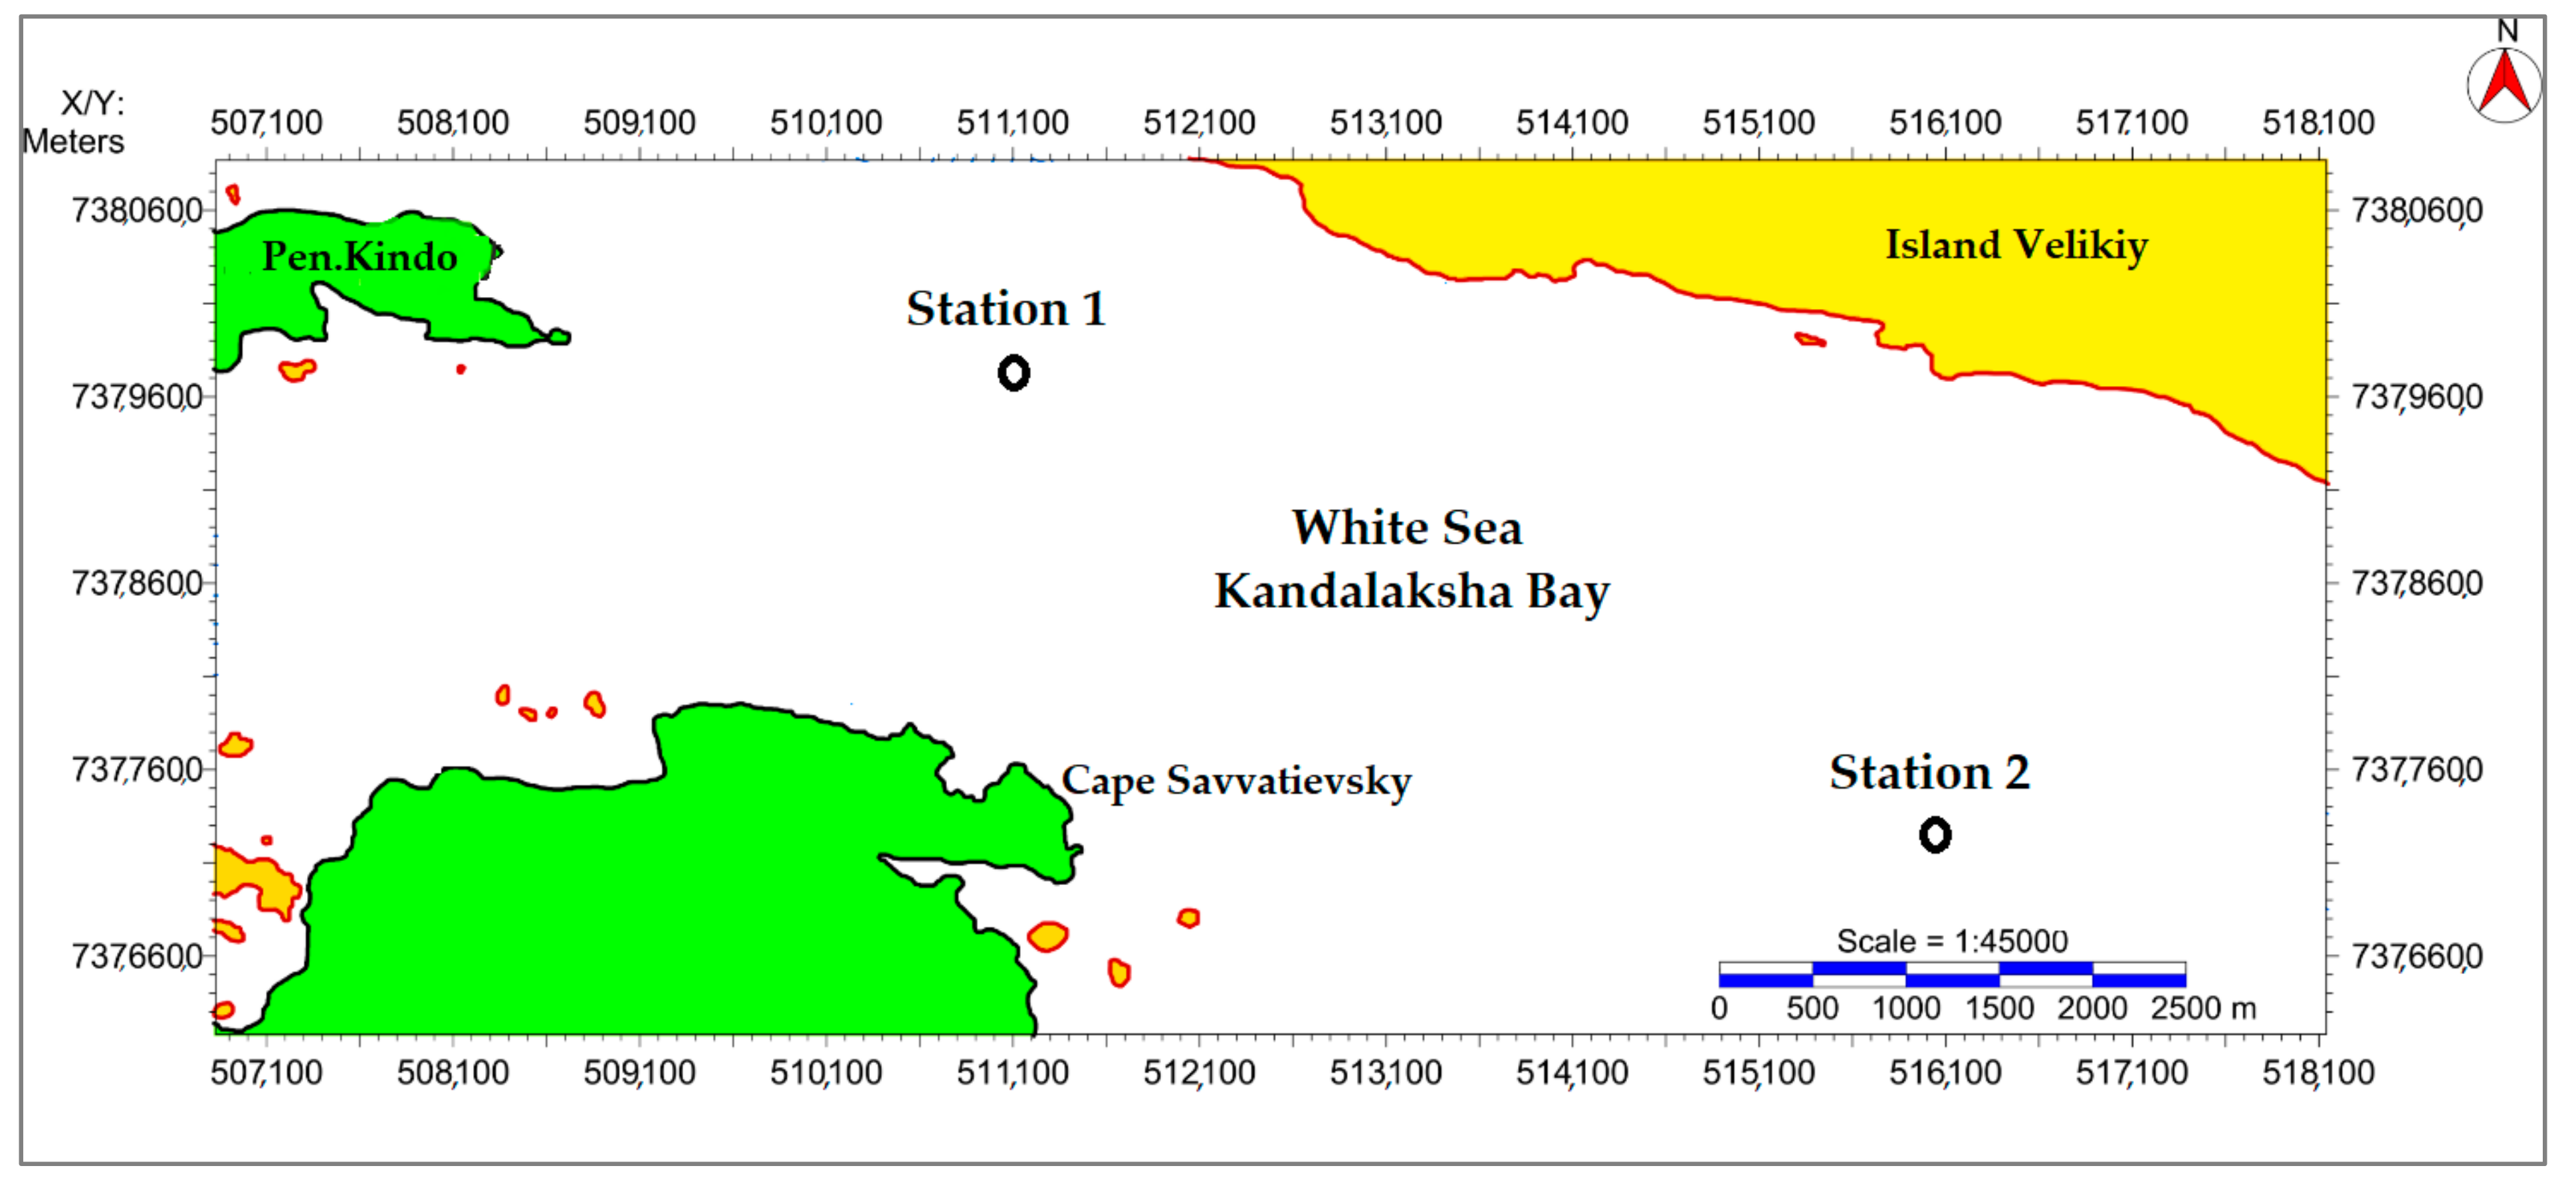
2. Regional Settings

The White Sea was formed in the Early Holocene age, less than 11 to 12 thousand years ago, on a glacier lake in a Scandinavian ice sheet degradation. The primary influence on the modern appearance formation of the bottom of the White Sea was exerted by continental glaciations, accompanied by differentiated glacio-isostatic and tectonic movements. The Quaternary deposit’s thickness varies from 3 to 150 m and averages 30 m [13]. The water composition controls a system of surface flows and powerful tidal flows that cause the mixing of fresh river water with the Barents Sea’s saline water. The main sources of organic matter in sediments, which are the primary agent of early diagenetic processes, are also organics of marine and continental genesis [14].
Experimental research was focused on the Upper Pleistocene–Holocene age sediments accumulated in oxidizing and sub-oxidizing settings in the central part of the Kandalaksha Gulf White Sea. The sampling stations (Figure 1, Table 1) were selected within the limits of different facies zones identified based on sub-bottom profiling and the same water depth (~80 m).
Station 1 was associated with gas accumulations, and had a small, oxidized layer not more than 15 cm thick. In contrast, station 2, lying outside of the gas-bearing zones, was characterized by a 40 cm thick oxidized layer. The presence of a 40 cm thick oxidized layer in one of the sediment stations allows evaluation of the effects of redox conditions on uranium behavior.

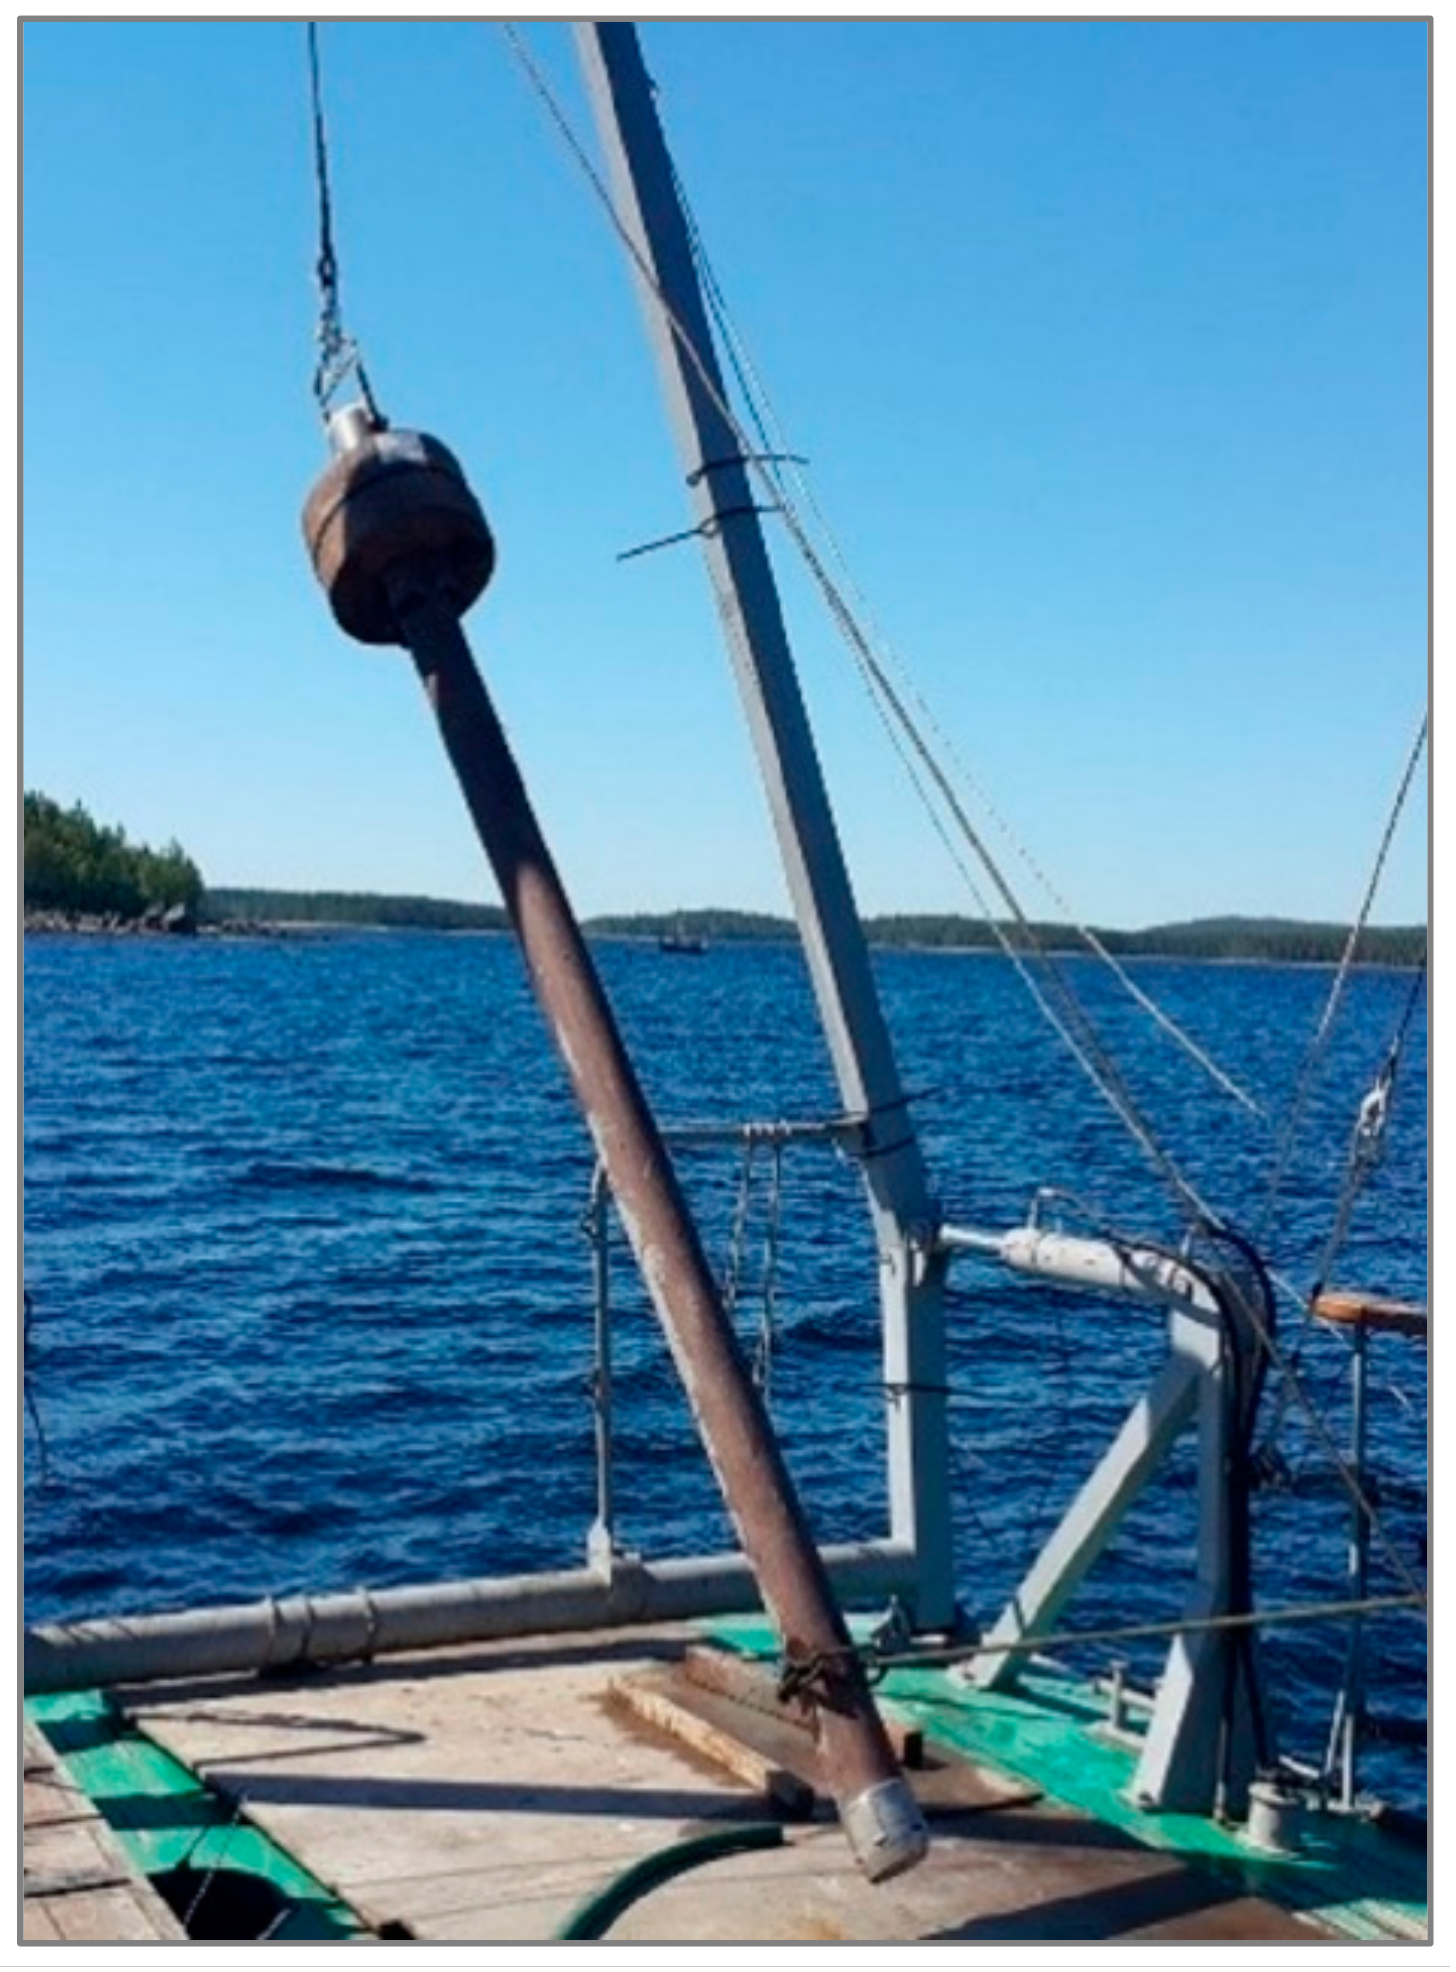
3. Materials and Methods

Cores of bottom sediments were collected at a water depth of 80 m using a 3 m long straight-flow gravitational steel pipe with an outer diameter of 127 mm, weighing 400 kg (Figure 2). A two to three-meter-long core was split lengthwise. The lithological description and sampling were performed immediately after core retrieval and temperature, pH, and Eh measurements. The pH and Eh measurements of pore water in the bottom sediments were performed by the pH testing tool (pH-150MИ). The redox potential’s measurement results were reduced to a normal hydrogen electrode potential by the formula Eh = Emeasured + Ereference electrode, where Ereference electrode is reference electrode potential, which was 212 mV [15].
Samples of sediments for station 1 were taken every 20–30 cm, and, for station 2, every 5 cm.
The bottom sediment samples under investigation were dried and crushed in laboratory conditions. After preparing the samples, the following measurements were performed.
The concentrations of uranium, thorium, vanadium, cobalt, iron, and other metals were measured using the Agilent 7500c ICP-MS spectrometer (Agilent Technologies, USA). The concentrations of uranium, thorium, vanadium, cobalt, iron, and other metals were obtained for station 2, but only the uranium concentration was measured for station 1. The chemical element concentrations were measured by the ICP-MS method for 33 samples from station 2 with a step of 5 cm and 10 samples from station 1. Before ICP-MS measurements, the sample to be analyzed was brought into a solution by autoclave digestion. The samples were placed in Teflon reaction vessels of autoclaves, and concentrated nitric acid (HNO3) and concentrated hydrochloric acid (HCl) were added. The reaction vessels were capped and sealed in analytical autoclave jackets. The autoclaves were placed in an electric heater and incubated for 1 h at 160 °C, 1 h at 180 °C, and 2 h at 200 °C. After cooling, the contents of the autoclaves were transferred into polyethylene tubes diluted with deionized water.
The mineral composition of samples was determined by the XRD method using the DRON-3M X-ray diffraction meter for station 1.
Isotopic compositions of sulfur, carbon, and nitrogen in bottom sediments were analyzed using Thermo Scientific DELTA V Plus mass spectrometer (Germany) for both stations. The instrument was equipped with a Flash HT elemental analyzer. International standards [16] used in the isotopic analyses of hydrogen, carbon, oxygen, and nitrogen are PDB for carbon, AIR for nitrogen, and CDT for sulfur. The accuracy of isotopic composition determination defined by measurements on the reference samples was ±0.2‰ for carbon, ±0.5‰ for sulfur and nitrogen. The isotope measurements were carried out on original dried and crushed samples. Before measuring the isotope composition of organic carbon, samples were additionally treated, as described below, with orthophosphoric acid to remove carbonates. For samples from station 1, the carbon dioxide released during phosphoric acid treatment was collected and measured to determine the amount and isotope composition of carbonates in sediments. The isotopic composition of nitrogen, sulfur, and carbon (in organic matter) for 4 samples of marine sediments from station 2 were conducted. The isotopic composition of nitrogen, sulfur, and carbon (in carbonate and organic matter) for 4 samples of marine sediments from station 1 were conducted.
For the measurements of oxygen, hydrogen, nitrogen, and sulfur element concentrations in the bottom sediment samples, dried samples were treated with orthophosphoric acid. The sediment weighing about 2 g was crushed in a porcelain pounder. Five mL of 85% phosphoric acid solution were added to 1 g of a crushed rock sample to remove calcite and dolomite from the rock and obtain the correct concentration of organic carbon. After twenty-four hours of treatment in acid, the solution was filtered, the samples were washed with distillated water many times, and then dried in a drying cabinet at 50 °C. The measurements of carbon, hydrogen, nitrogen, and sulfur concentrations were performed on acid-treated homogenized samples using an elemental analyzer (LECO CHN628 Series w/Sulfur Add-On Module (S628)). Two or more technical replicates of each sample were measured; the sample amount was 80 mg. The oxygen, hydrogen, nitrogen, and sulfur element concentrations were measured for 31 samples from station 2 with a step of 5 cm and 11 samples from station 1. For calibration of the instrument standard samples SSS 9113-2008 (EDTA 502-896/502-896-250), SSS 10821-2016 (Coal 502-670), SSS 10822-2016 (Coal 502-671), SSS 10823-2016 (Coal 502-672), Phenilanine LECO (502-642), LOT 1017, and BBOT 502-897 from the manufacturer of the elemental analyzer LECO were used. The analytical uncertainty of the measurements was typically smaller than 0.08% for carbon, 0.02% for nitrogen and sulfur, and 0.04% for hydrogen [17,18].

4. Results of the White Sea Bottom Sediments Investigations
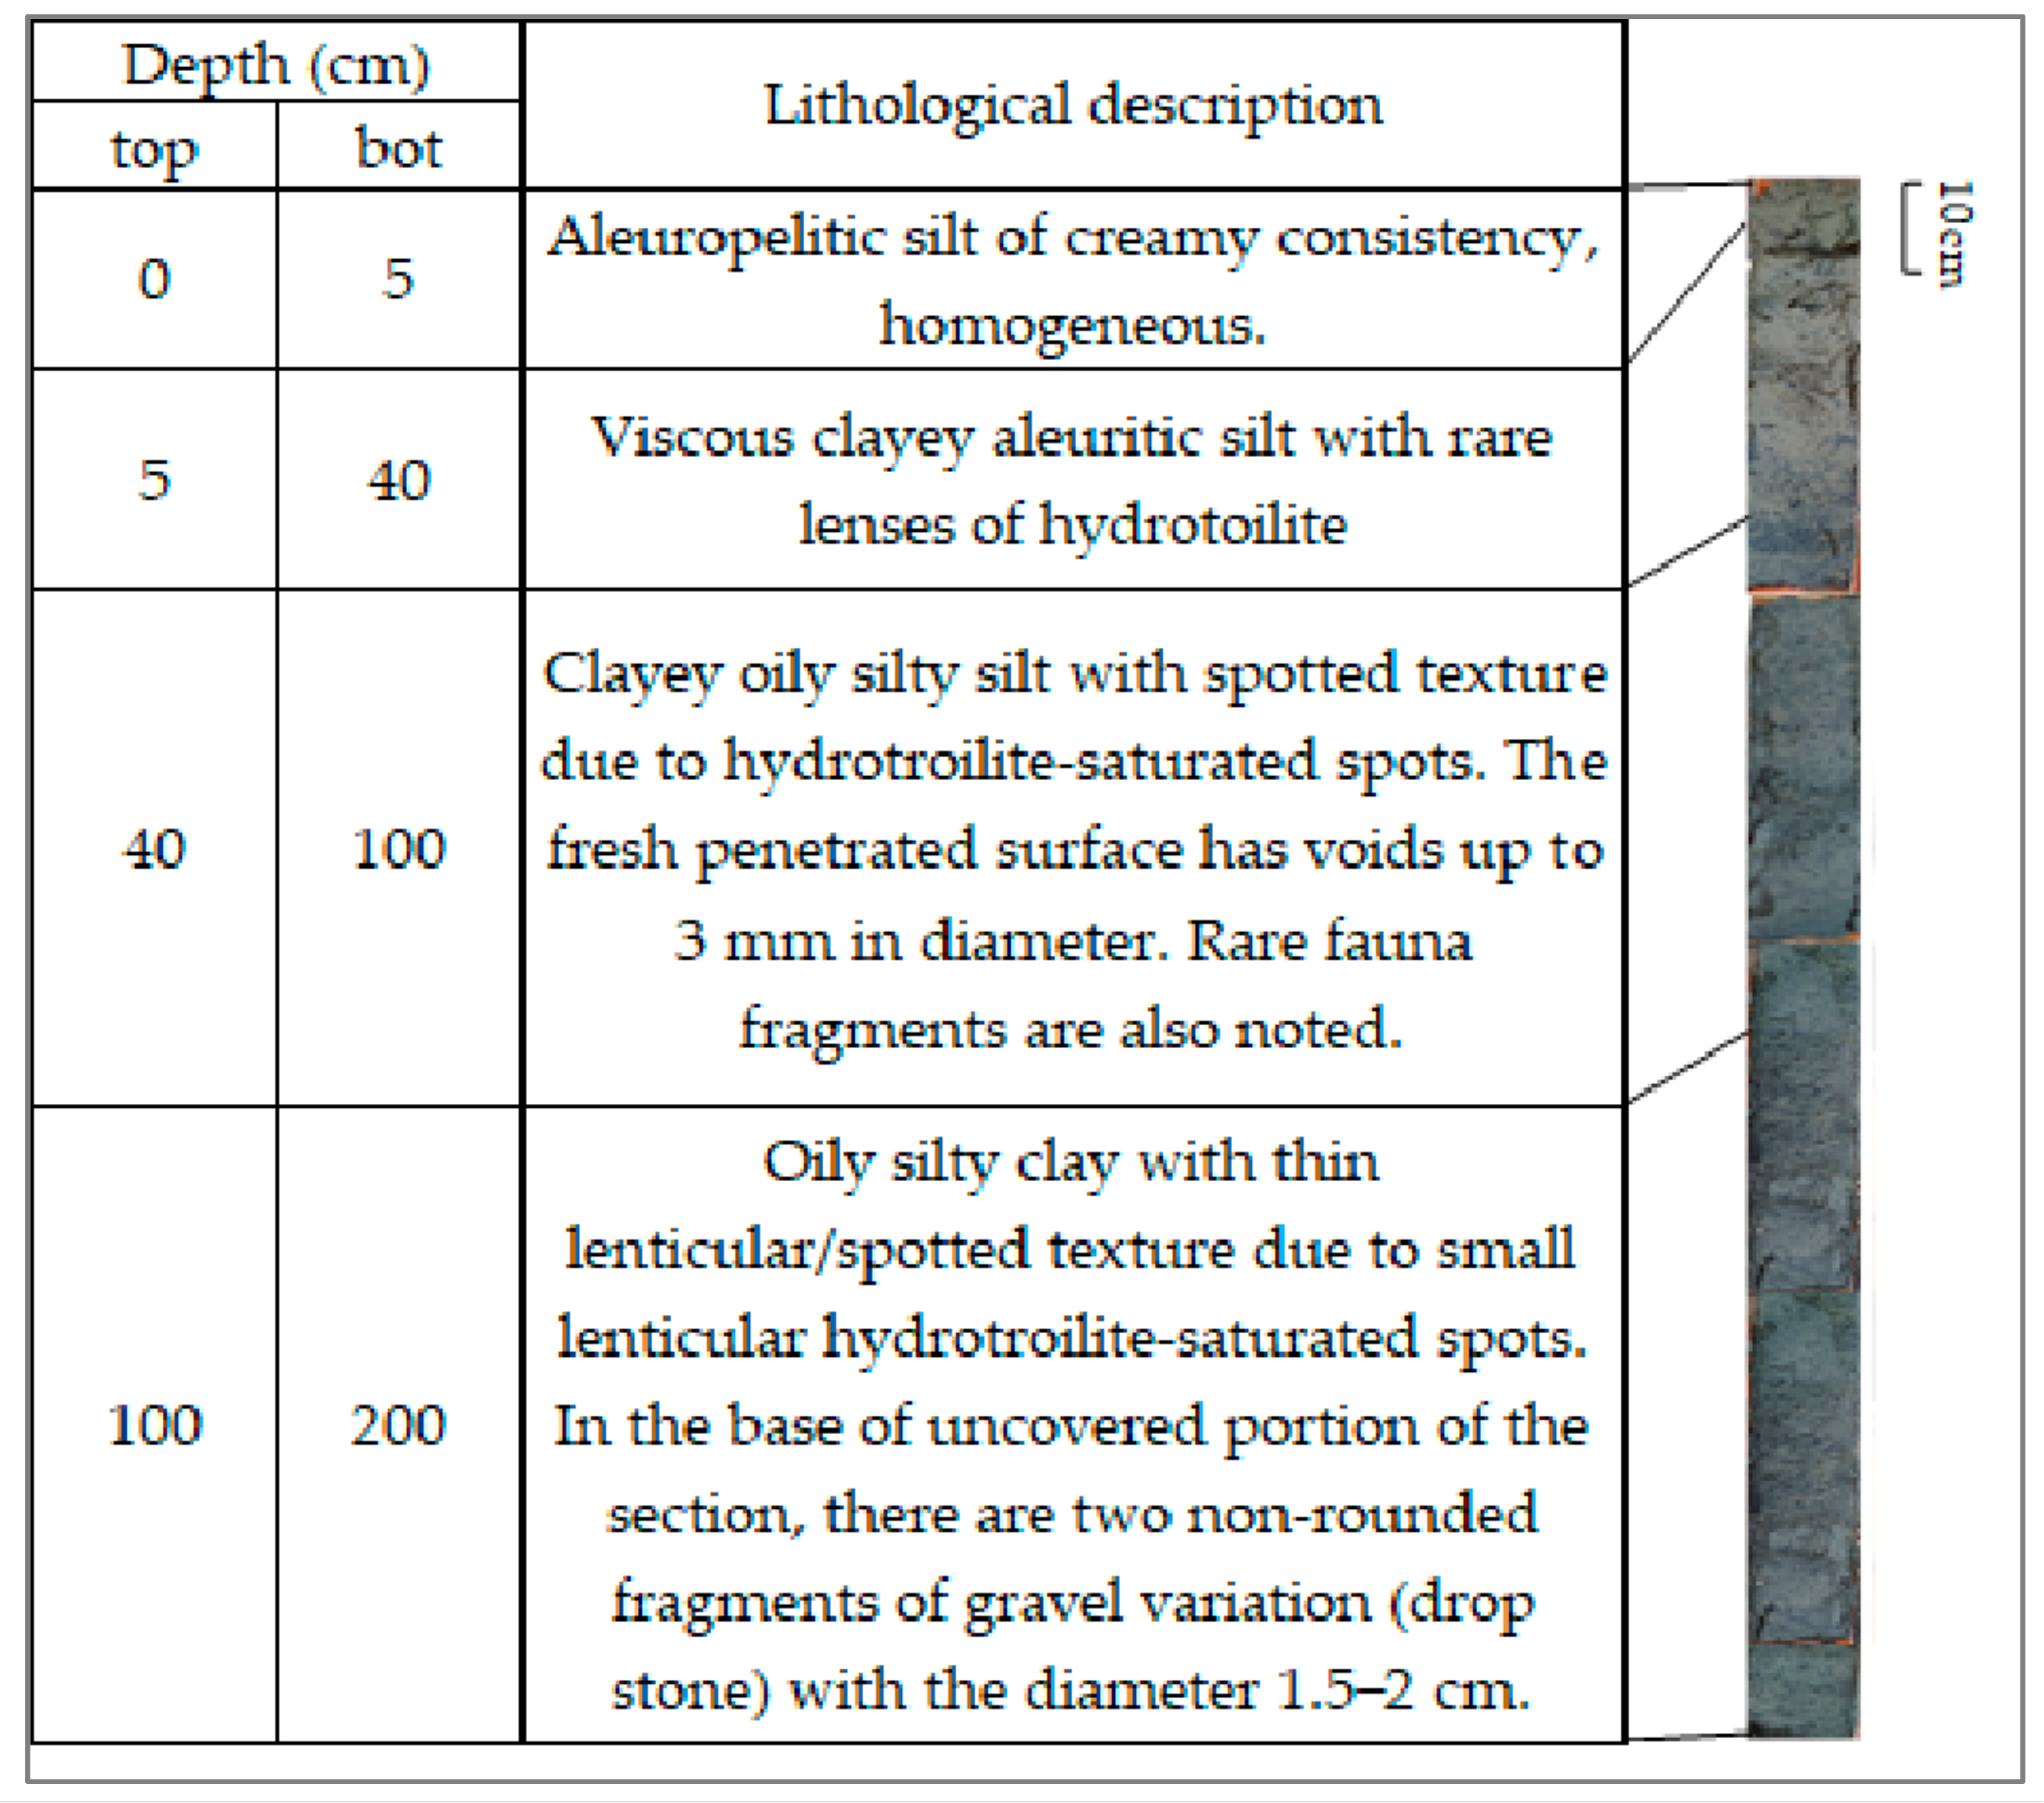
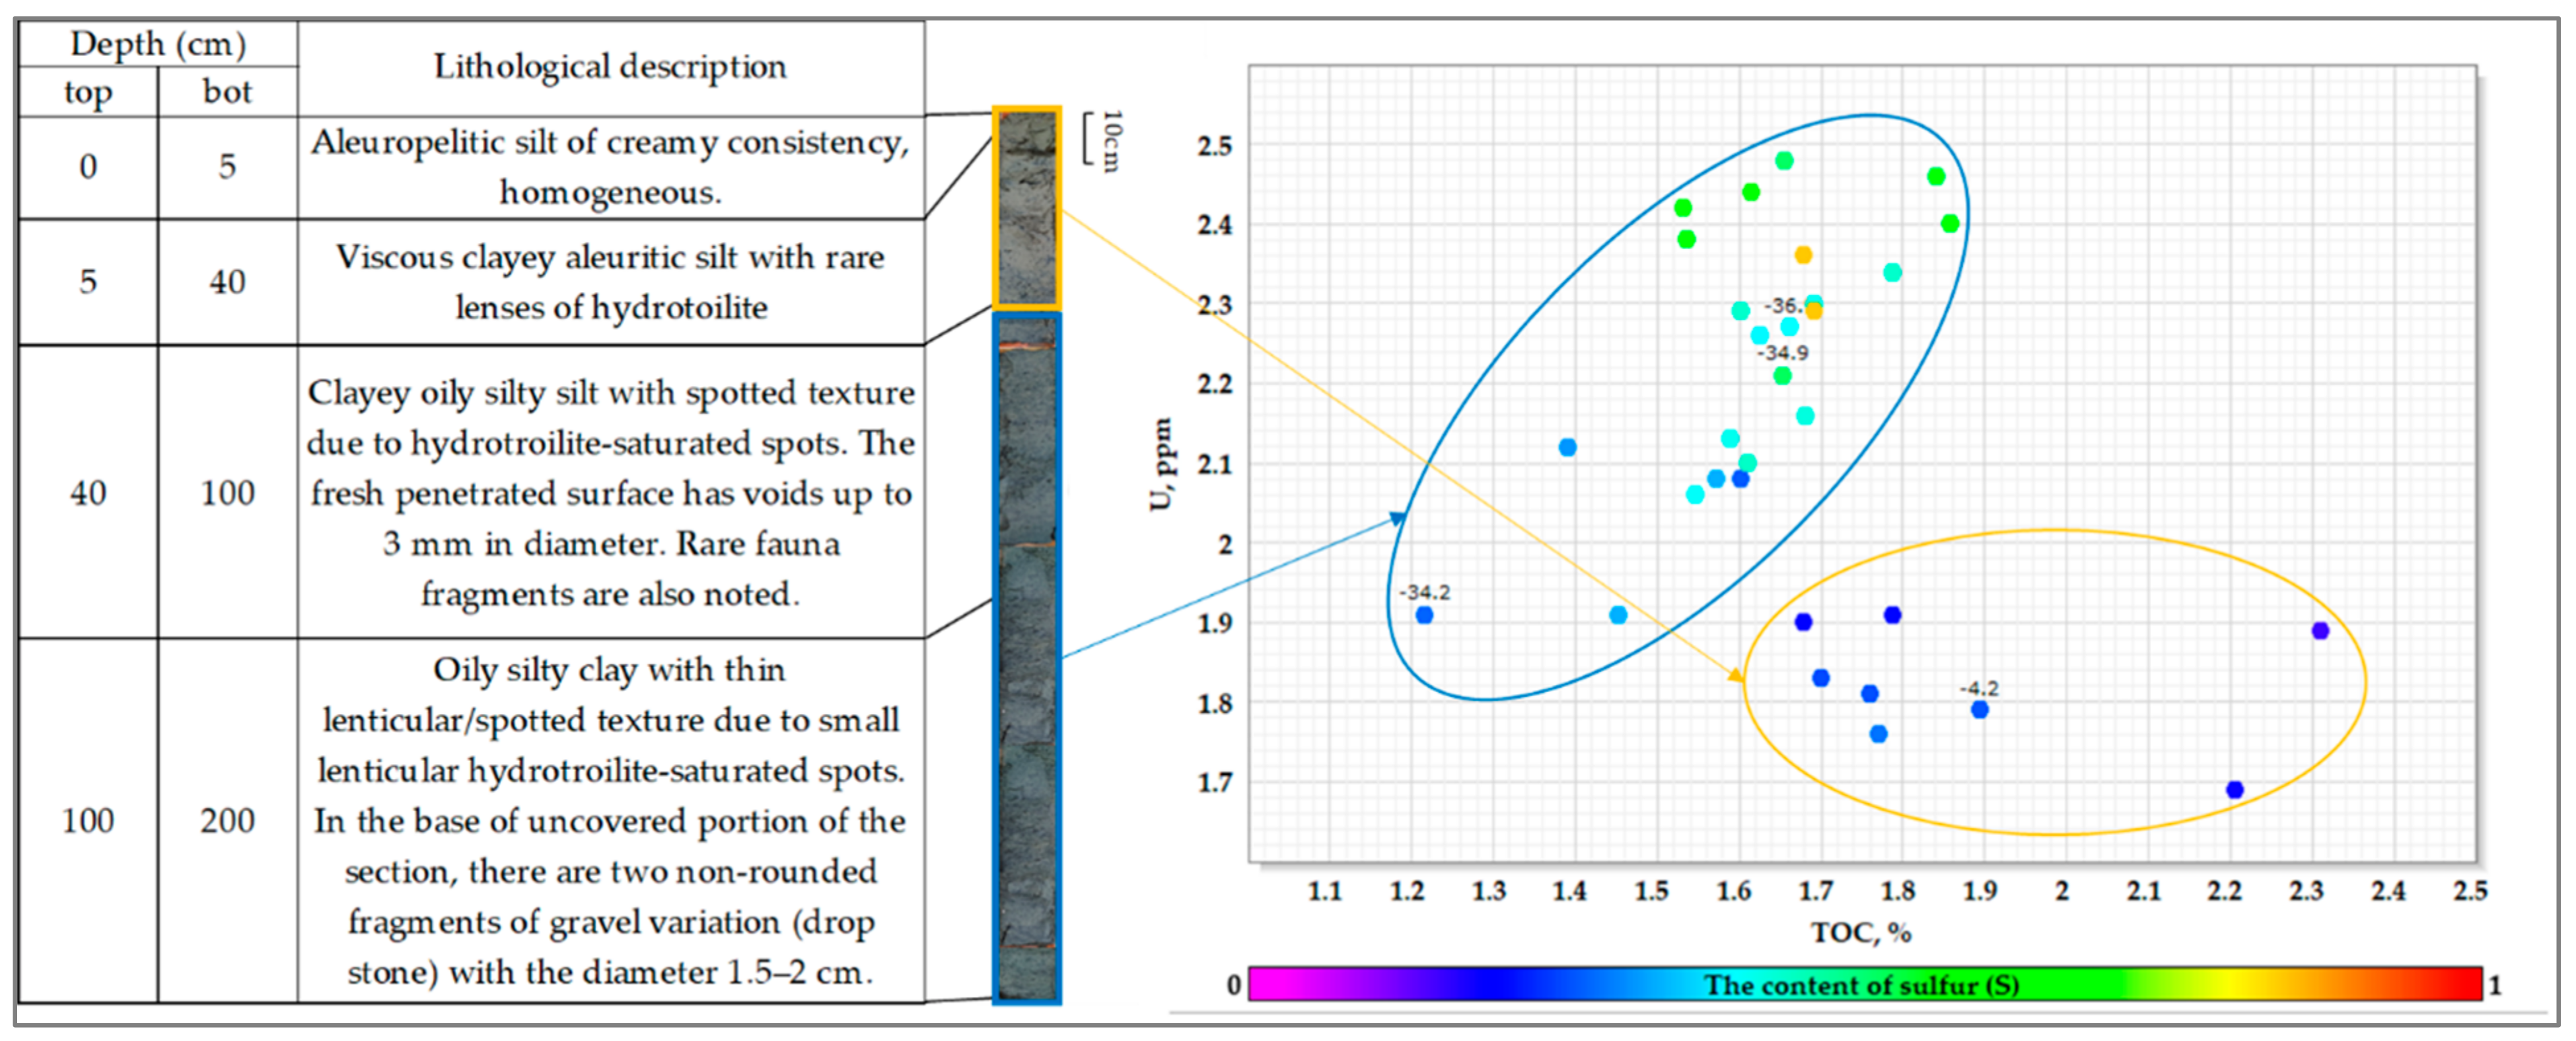
4.1. Lithology

The photographs of the sediments (2–3 m long) sampled using a straight-flow gravitational steel sampler for each station are shown in Figure 3.
The deposits comprised sorted pelite/siltstone, siltstone/pelite, and pelite sediments (Figure 4 and Figure 5). The color of the sediments in the top 0–5 cm or 0–40 cm layer varied from brown to reddish-brown. The underlying greenish-grey sediments contained adhesions and balls of hydrotroilite. Thus, the bottom sediments can be divided into two parts with different geochemical conditions, which differ in color, lithological composition, the presence of oxygen, and hydrogen sulfide.
The predominant minerals in the bottom sediments under review are quartz, albite, and illite (Table 2).

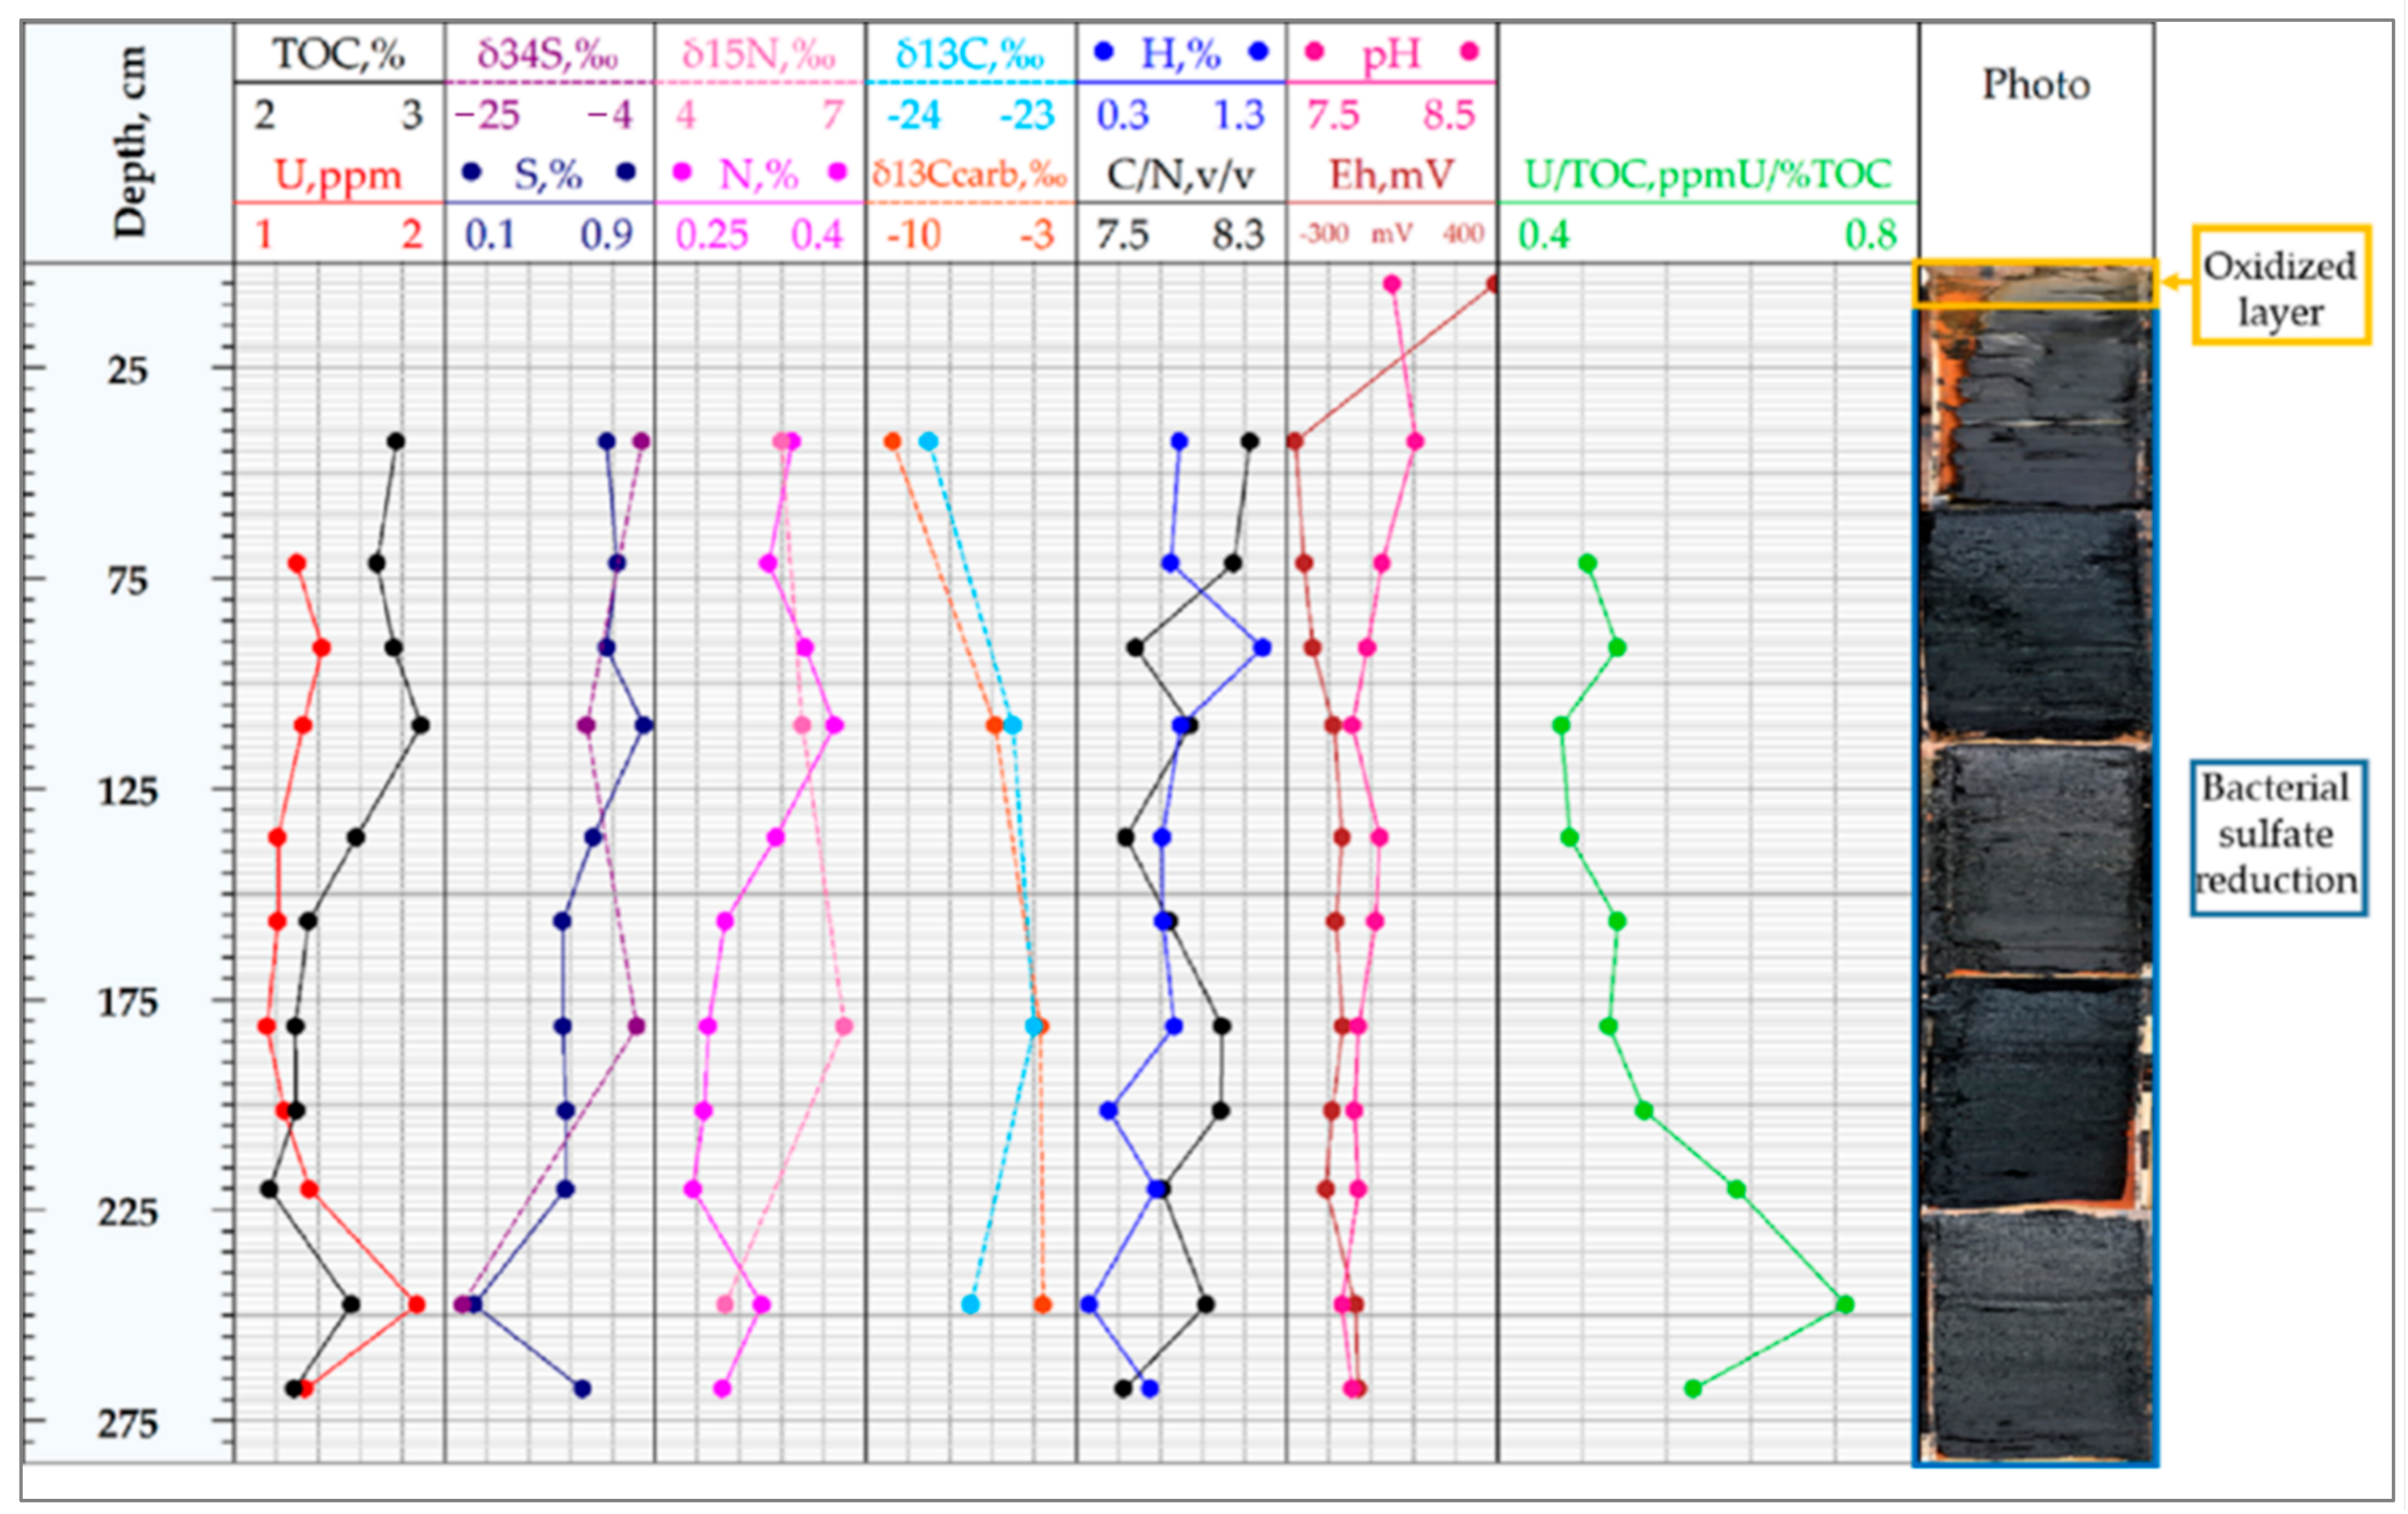
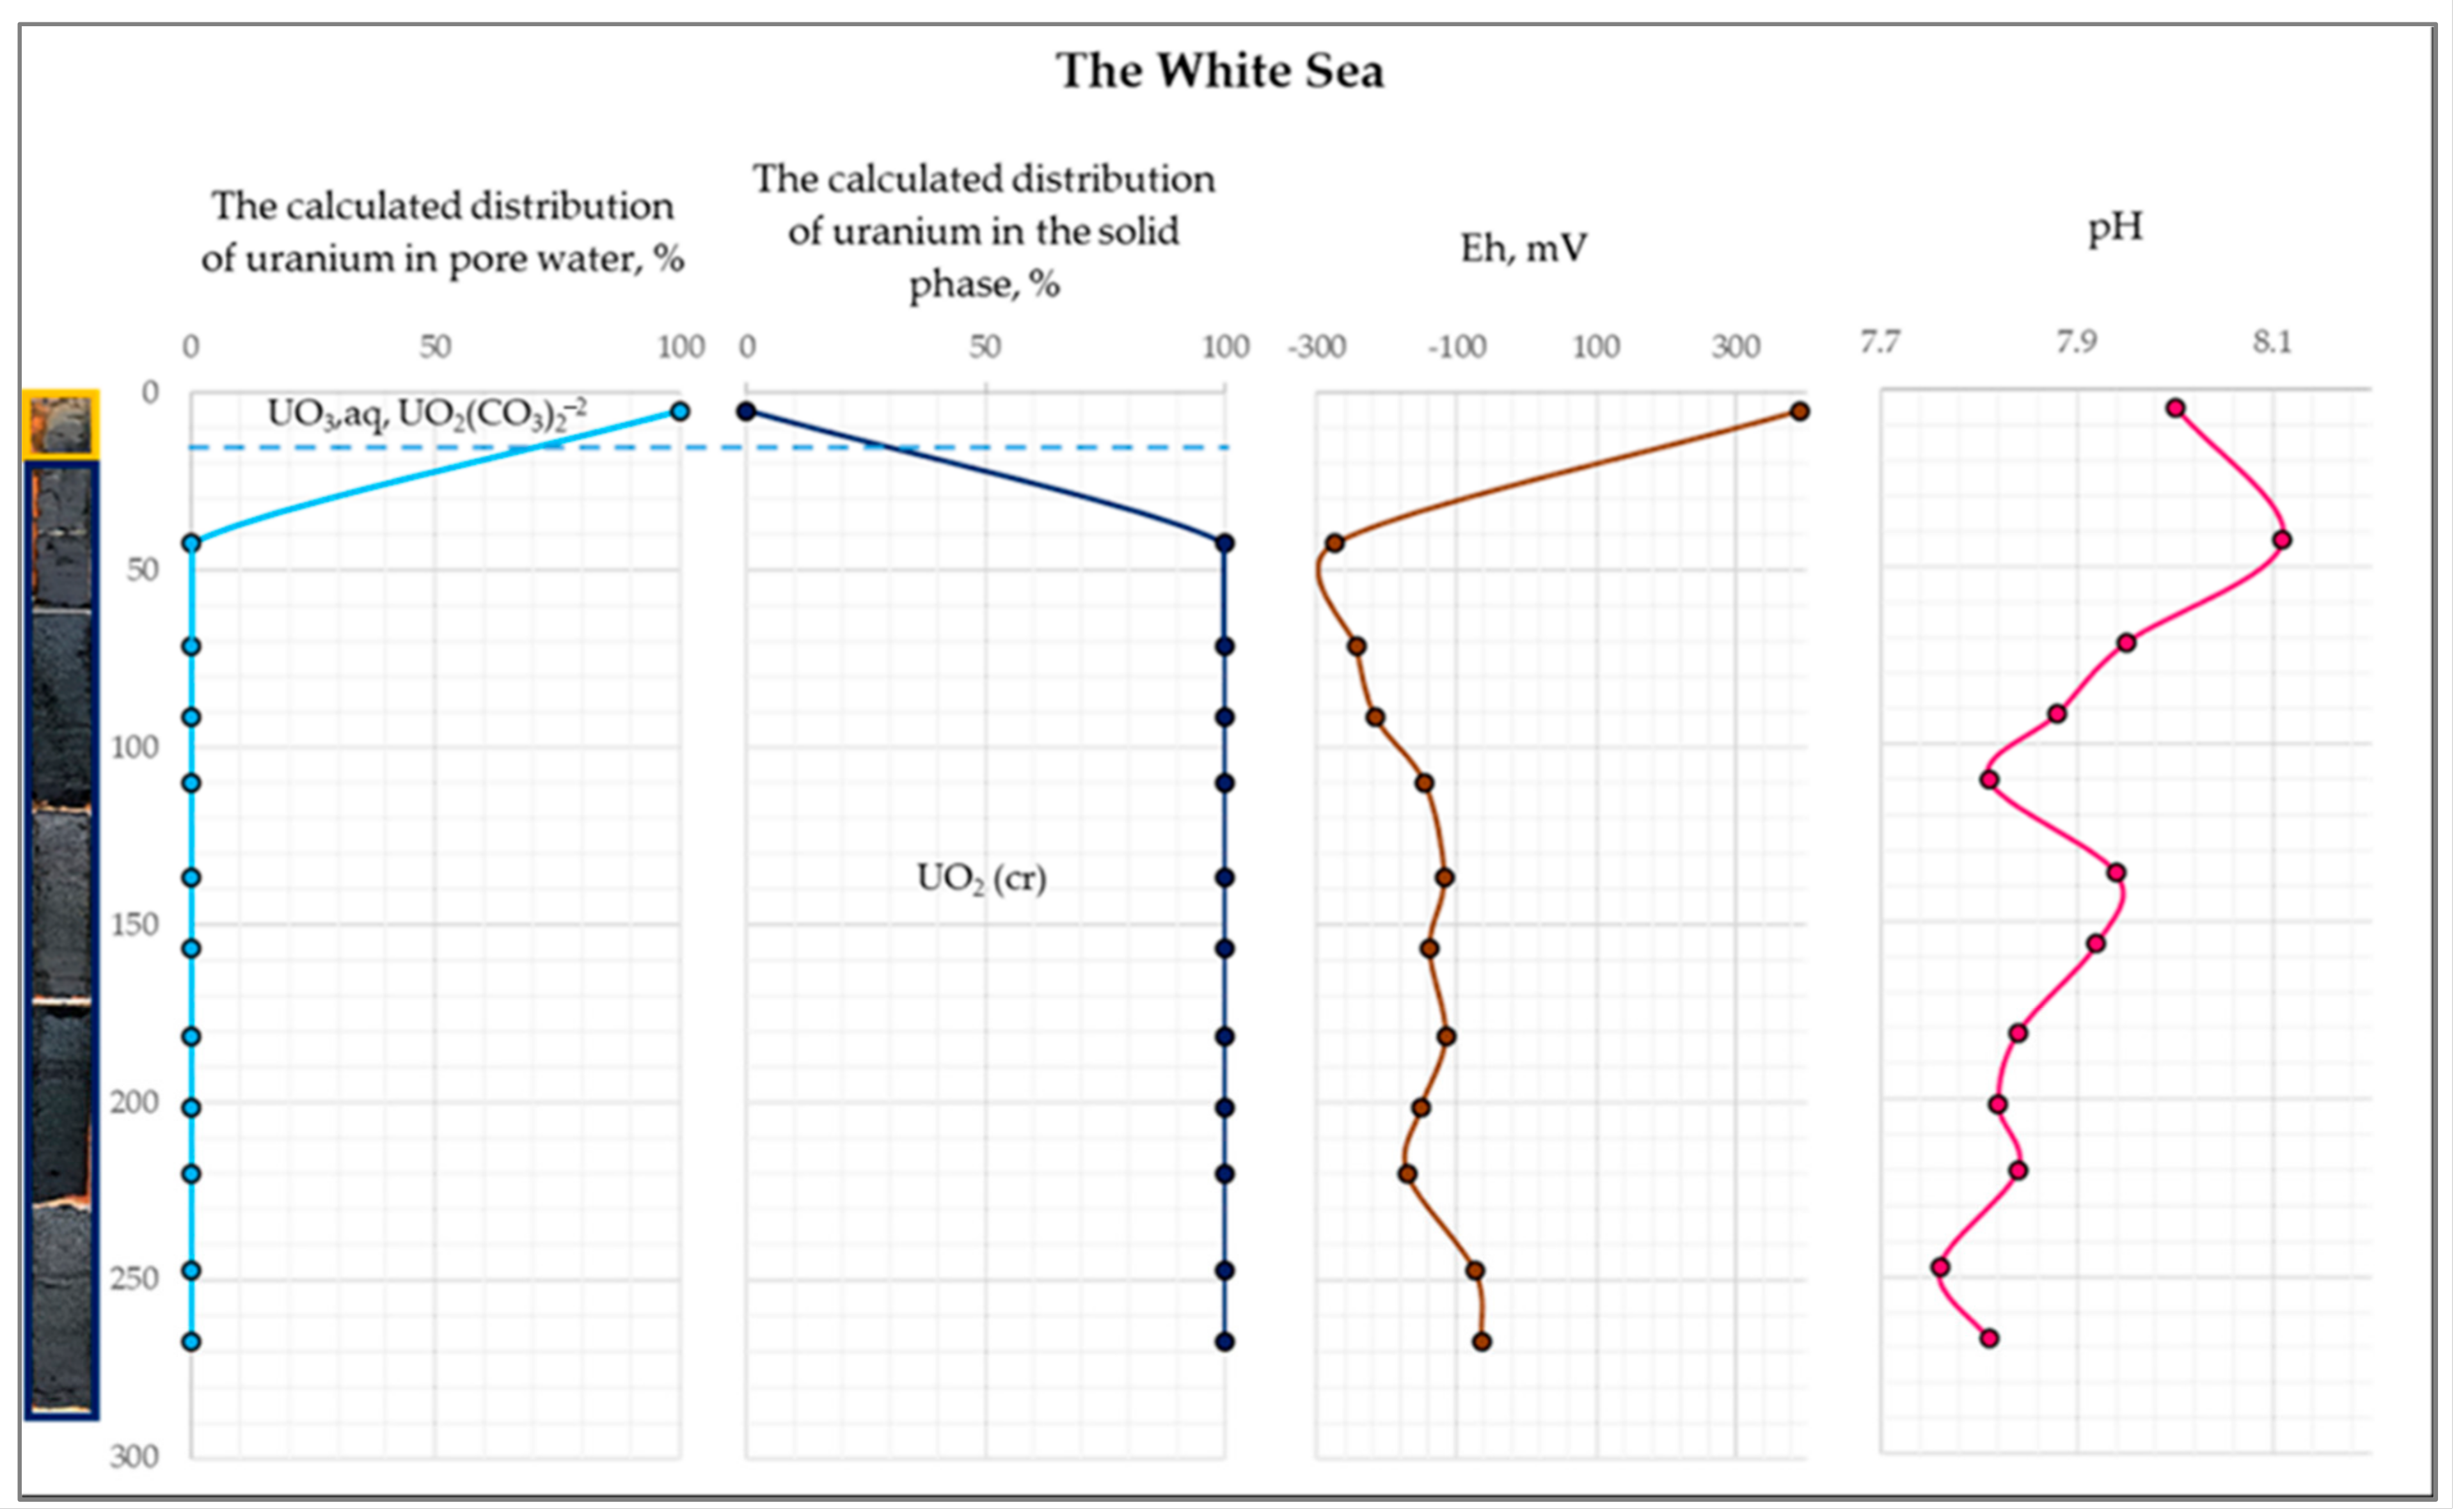
4.2. Eh, pH, and Temperature Values

Measured Eh and pH of the pore water in the bottom sediments for station 1 are shown in Table 3.
The redox potential in the upper portion of the bottom sediments was positive (+392 mV), whereas Eh at the depth below 5 cm was negative and varied from −273 to −63 mV. The pH values decreased with depth from 8 to 7.8. The temperature of the bottom sediments was positive and slightly less than 1 °C; at a depth of 5 cm the temperature was 0.9 °C, and at a depth of 267.6 cm was 0.8 °C. The obtained data correspond to published data, which shows that Eh values in the bottom sediments may vary from −324 to +523 mV [19]. According to [20], pH values in sediments fluctuate from 7.6 to 8.4; in our case, the bottom sediments’ measuring pH varied from 7.76 to 8.11.

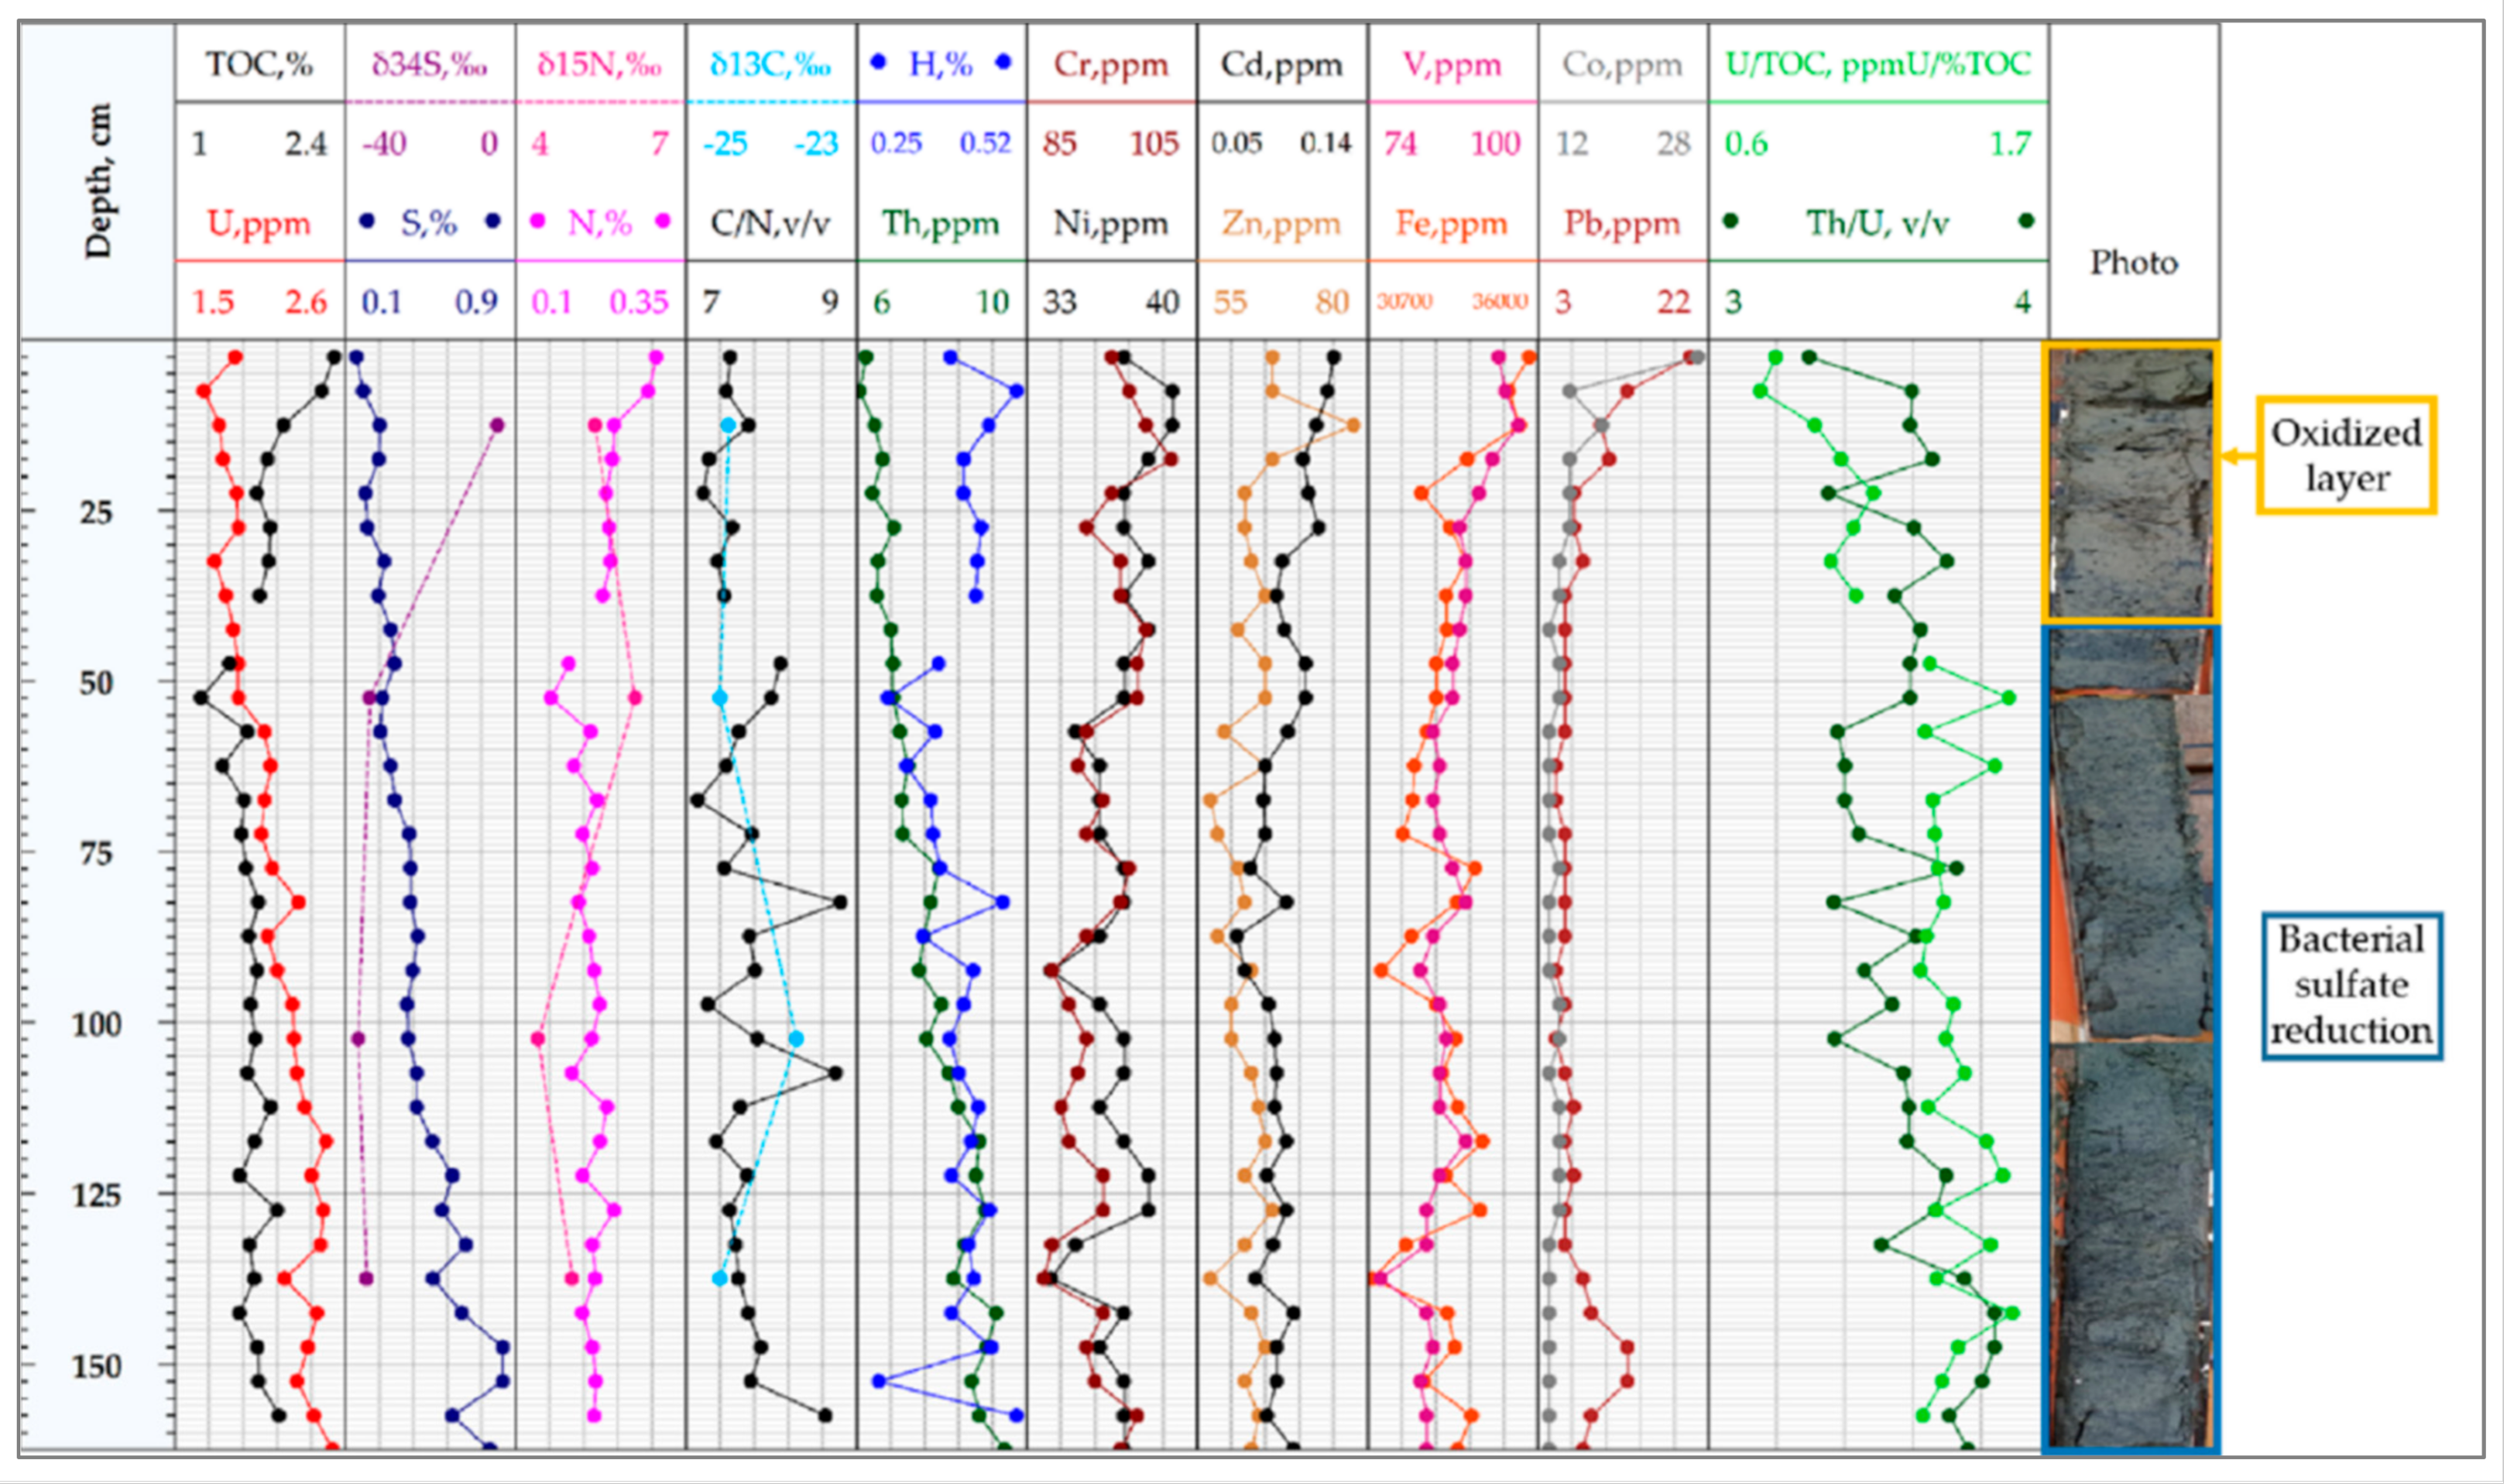
4.3. Uranium and Other Metals Concentrations

The uranium concentrations in the bottom sediments measured by ICP-MS for stations 1 and 2 are shown in Table 4 and Table 5. For station 2, the concentrations of Cd, Co, Cr, Fe, Ni, Pb, Th, U, and V in the bottom sediments were also measured and shown in Table 5.
The concentration of uranium in the bottom sediments for both studied stations did not exceed 2.6 ppm. For station 1, uranium concentrations varied from 1.16 ppm to 1.87 ppm at the depth interval 71.5 cm–267.5 cm, respectively. The difference in uranium concentration between the upper and lower parts of the sampled core was identified for station 2. In the upper part (0–50 cm), the concentration varied from 1.7 to 1.9 ppm; in the lower part, uranium concentration increased up to 2.52 ppm.
The sediments were enriched with iron (Fe) with concentrations up to 3.57%, which is explained by the presence of hydrotroilite and its high capacity for complexation with organic matter even at low concentrations compared to other metals [21]. The concentrations of Cr, V, Zn, Ni, Co, and Pb showed values in the range of 20–100 ppm, the concentrations of Cd were about 0.1 ppm. The concentrations of these metals in the upper layer were slightly higher and decreased with depth. The concentrations of Th varied from 6.2 ppm in the upper part to 9.5 ppm in the lower part of the column. The value of the Th/U ratio varied from 3.30 to 3.84 with an average value of 3.58, which corresponds to the marine sedimentation stage, according to Walter H. Fertl’s research [6]. The following sources of accumulation of these metals in the bottom sediments of the White Sea are continental run-off, seawater, and anthropogenic impact (wastewater, smoke emissions). The character of Th/U variations showed that the source of these metals was continental run-off with a low income of autogenic uranium of marine genesis. No anthropogenic impact (another potential source of U) was identified.

4.4. C, H, N, S Element Composition

The results of C, H, N, and S element composition in the bottom sediment samples of stations 1 and 2 are shown in Table 6. C, N, and H concentrations were typical for the organic matter of marine bottom sediments. Organic carbon content varied from 1.22% to 2.89%, nitrogen content from 0.15% to 0.38%, and hydrogen content from 0.29% to 1.19%; concentrations of these elements generally decreased with depth. The C/N ratio values varied from 7.14 to 8.89, which suggests a mixture of terrigenous (dominating) and planktonogenous (subordinate) organic matter in sediments from both stations [14]. C/N > 7 were characteristic for terrigenous organic matter values, whether planktonogenous organic matter was more enriched with nitrogen than with C/N < 7. The concentrations of sulfur varied from 0.15% to 0.86%. For station 2, the sulfur content increased with depth from 0.15% at the depth 2.5 cm to 0.84% at 150 cm depth.

4.5. C, N, S Isotope Composition

Bulk isotope compositions of organic carbon, carbonate carbon, sulfur, and nitrogen in the bottom sediments were measured in selected samples from different depths (Table 7).
Isotope compositions of organic carbon in sediments from both stations exhibited low variations with depth but there were analytically significant differences between stations 1 and 2. The δ13C values varied from −23.7‰ to −23.2‰ for samples from station 1 and from −24.6‰ to −23.7‰ for samples from station 2. According to a large number of data obtained for the carbon isotopic composition of suspended organic matter and bottom sediments from the White Sea [22], the difference in δ13C values between the two stations from these studies suggests a slight predominance of terrigenous organic matter from the continental run-off in station 2. The δ13C values from −9.1‰ to −4.1‰ measured for carbonates from samples of station 1 do not correspond to the majority of marine carbonates with δ13C values of about 0‰, which are more characteristic for diagenetic carbonates, formed with the participation of CO2, and generated during the transformation of the organic matter by anaerobic bacteria.
Isotope compositions of nitrogen were homogeneous in both stations with δ15N values from 4.4‰ to 6.7‰, which are in the range of the most frequently measured values in bulk marine sediments worldwide [23]. There was no significant difference in δ15N between stations 1 and 2.
Sulfur isotope composition measurements showed variations from –36.9‰ in lower layers of station 2 to −4.2‰ in the upper layers. Following [24], δ34S varied from −37 to −4‰ showing the changes in redox conditions from reducing to close oxidizing during the bacterial reduction of seawater sulfate. Under oxidizing conditions, an environment favorable for the development of anaerobic bacteria is created after the burial of the sediment and the depletion of oxygen by aerobic organisms. The concentration of hydrogen sulfide required for the precipitation of sulfides is formed in a sulfate-closed system, the presence of reduced sulfur is a limiting factor, and pyrite deposition occurs even with a significant depletion of sulfate. Therefore, pyrite under oxidizing conditions is much more enriched in 34S than pyrite formed under reducing conditions.

5. Discussion

5.1. The Results of the White Sea Sediments

The obtained results of ICP-MS, CHNS, and isotopic analysis of the bottom sediments for stations 1 and 2 are given in Figure 6 and Figure 7.
The White Sea bottom sediment study provided an opportunity to analyze uranium accumulation in the bottom sediments as a part of marine sedimentation processes in oxidizing conditions. Additionally, the sediments had a high involvement of organic and inorganic matter from continental run-off. The White Sea bottom sediment study results show that the upper part of sediments, which is in contact with the seawater, is characterized by an oxidizing environment with positive Eh = +392 mV values. This layer is visually distinguished by a brown-gray color with traces of bioturbation and is characterized by the highest organic carbon values (up to 2.5%) and the correspondently highest concentration of nitrogen and hydrogen-containing inorganic matter. The sulfur concentration in the upper interval varied from 0.15% to 0.3%, which was several times less than for the deeper layers. The measured value of sulfur isotope composition δ34S = −4.2‰ confirms the marine genesis of sulfur due to sulfate reduction in oxidizing conditions. The uranium concentration in the upper oxidized layer was lowest for the bottom sediment column and did not exceed 1.5 ppm. The genesis of uranium in the bottom sediments is close to uranium concentration in the continental run-off; however, we suggest that some uranium parts can also come with organic matter (the U/TOC ratio for the upper layer varied from 0.8 to 1.1 ppmU/%TOC).
The bottom sediments of layers at a depth of more than 50 cm were characterized by reduced conditions, with a negative Eh value of about −273 mV to −63 mV. This layer was denser and visually distinguished by a dark color due to an increase of hydrotroilite content. Hydrotroilite has been identified in the current study in black dots and patches against the greenish-grey background of sediments and described more in detail in [25]. The content of organic carbon, nitrogen, and hydrogen decreased with increasing depth. The identified decrease of organic matter content could be explained by the activity of anaerobic microorganisms, which is confirmed by the results of [26,27] that show that the oxic environment is characterized by lower organic matter preservation due to microbial activity.
Sulfur concentration increased with depth by up to 0.8%. The isotope compositions of sulfur for lower layers of station 1 varied from −23.2‰ to −5.3‰ and from −36.9‰ to −34.2‰ for station 2. The observed values show that hydrotroilite and other sulfur-containing minerals in the sediments at station 2 were formed in typically reduced conditions, whereas for station 1 these minerals were formed in more oxidizing conditions. The U/TOC ratio increased with depth, reaching a value of 1.4 ppmU/%TOC. One reason that could explain an increase in uranium concentration is the reducing conditions that facilitate uranium accumulation in sediments due to the formation of insoluble uranium-containing compounds.
The trends discussed above are illustrated in (Figure 8) in the U-TOC diagram. Ellipses select two areas corresponding to different redox conditions.
To sum up, the sedimentation process in the Kandalaksha bay of the White Sea is carried out in oxidizing conditions (oxygen in the bottom layer of water) and does not lead to considerable uranium accumulation in bottom sediments. Typical values of about 1.5 ppm correspond to uranium content in the continental run-off. An increase in uranium concentration up to 2.5 ppm was identified for the lower part of the bottom sediments, which could be explained by changing redox conditions from oxidizing to reducing. The U/TOC ratio values were about 0.8 to 1.1 ppmU/%TOC for the upper part of the sediments and reached 1.5 ppmU/%TOC for the lower part of the sediments. However, a very narrow range of the Th/U ratio shows that the source of most of the uranium was a continental run-off.

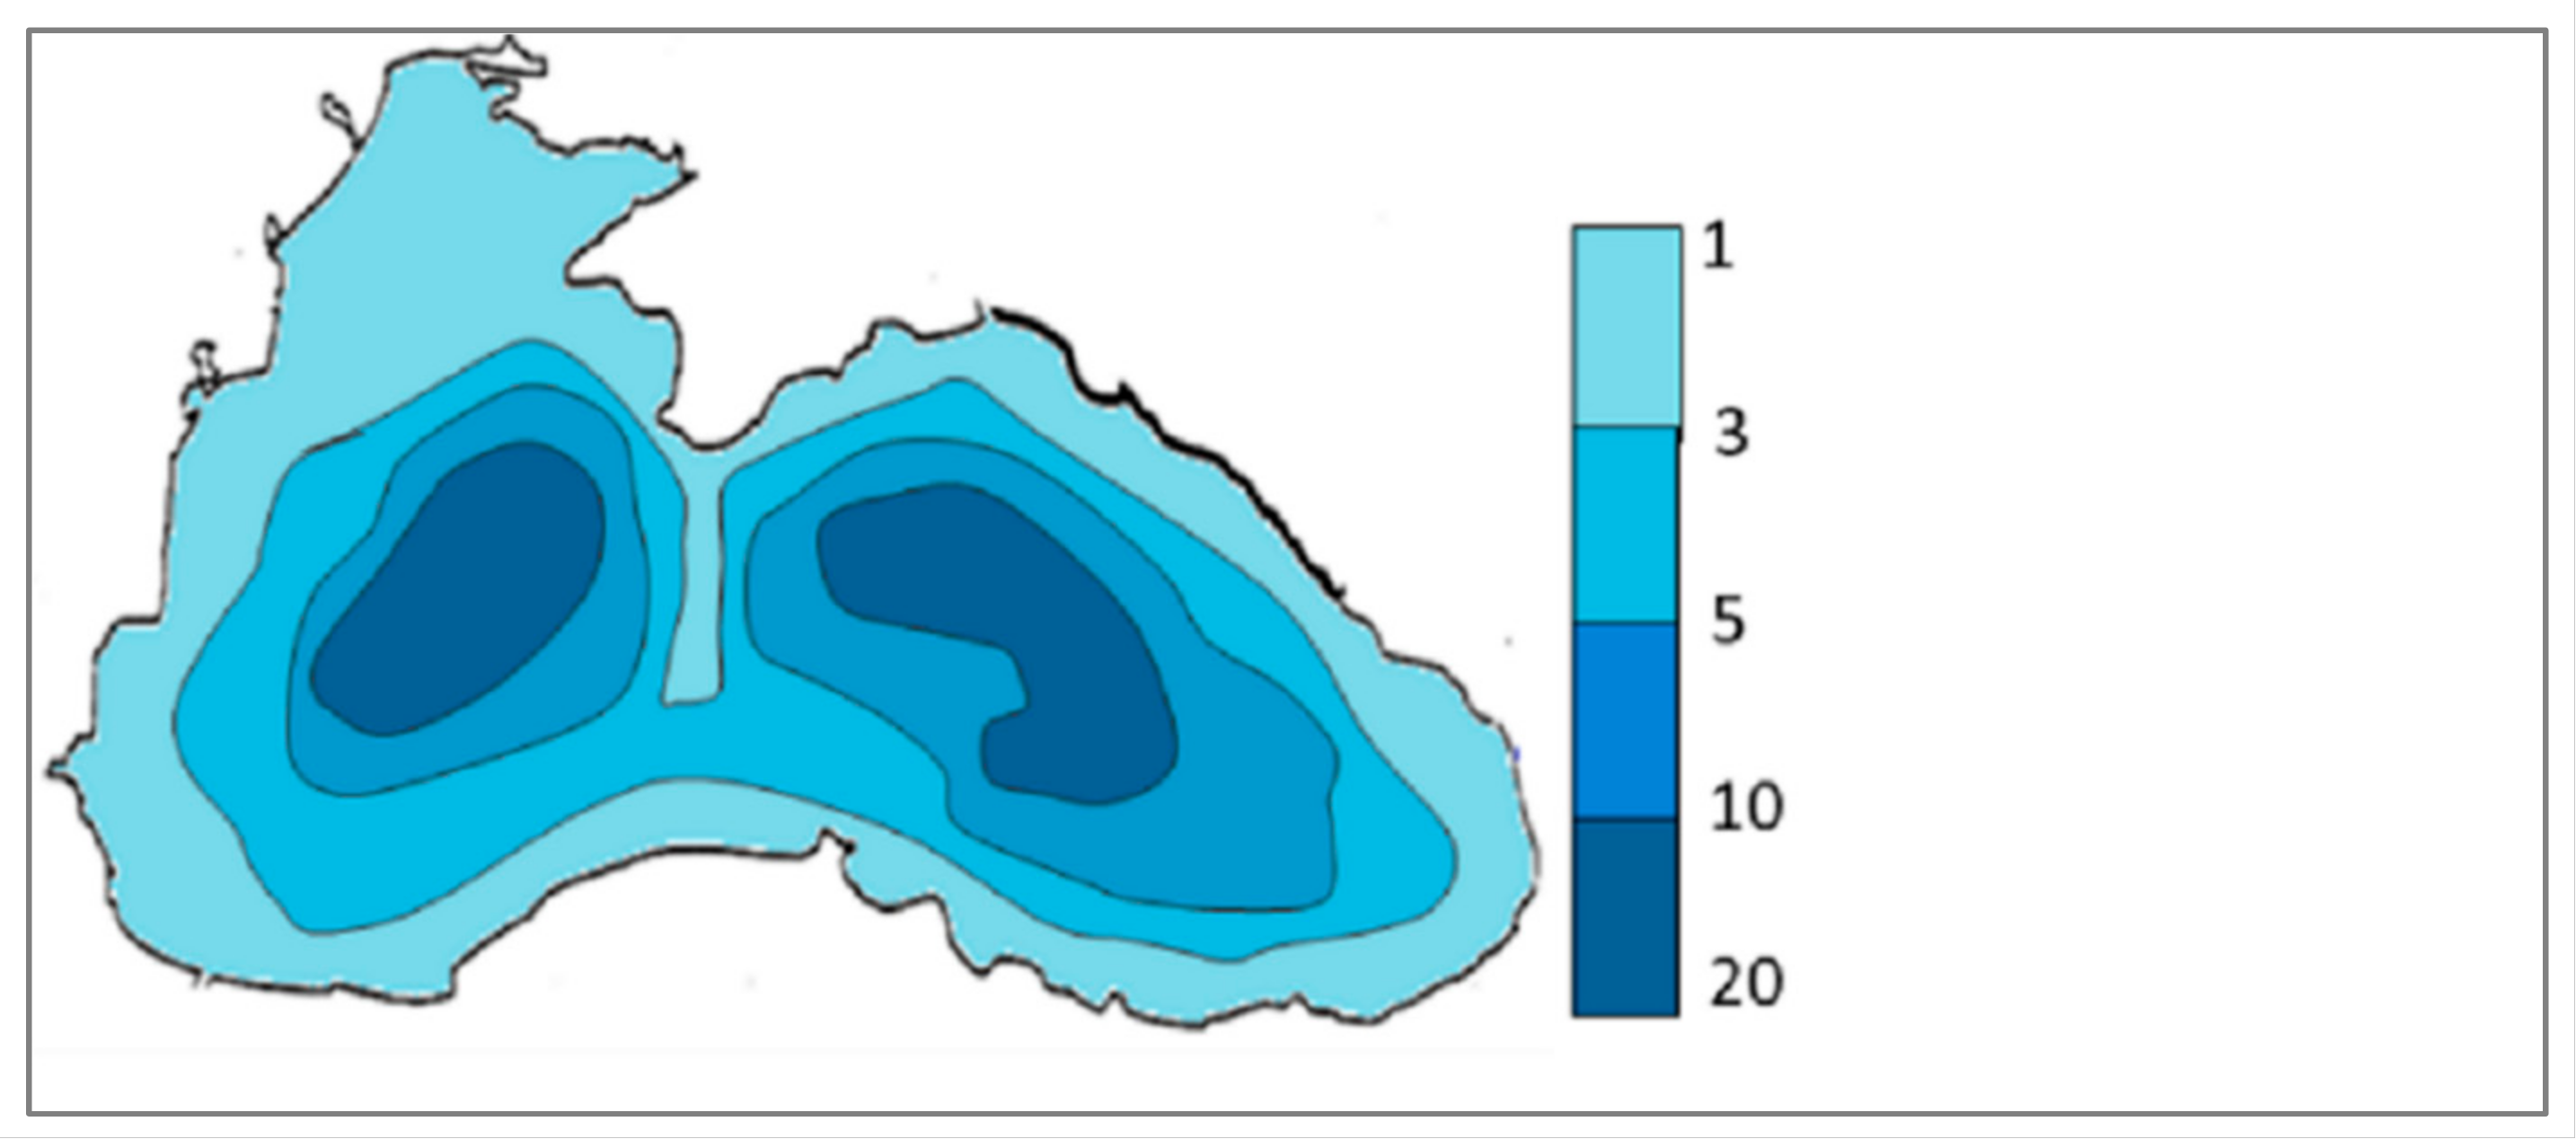
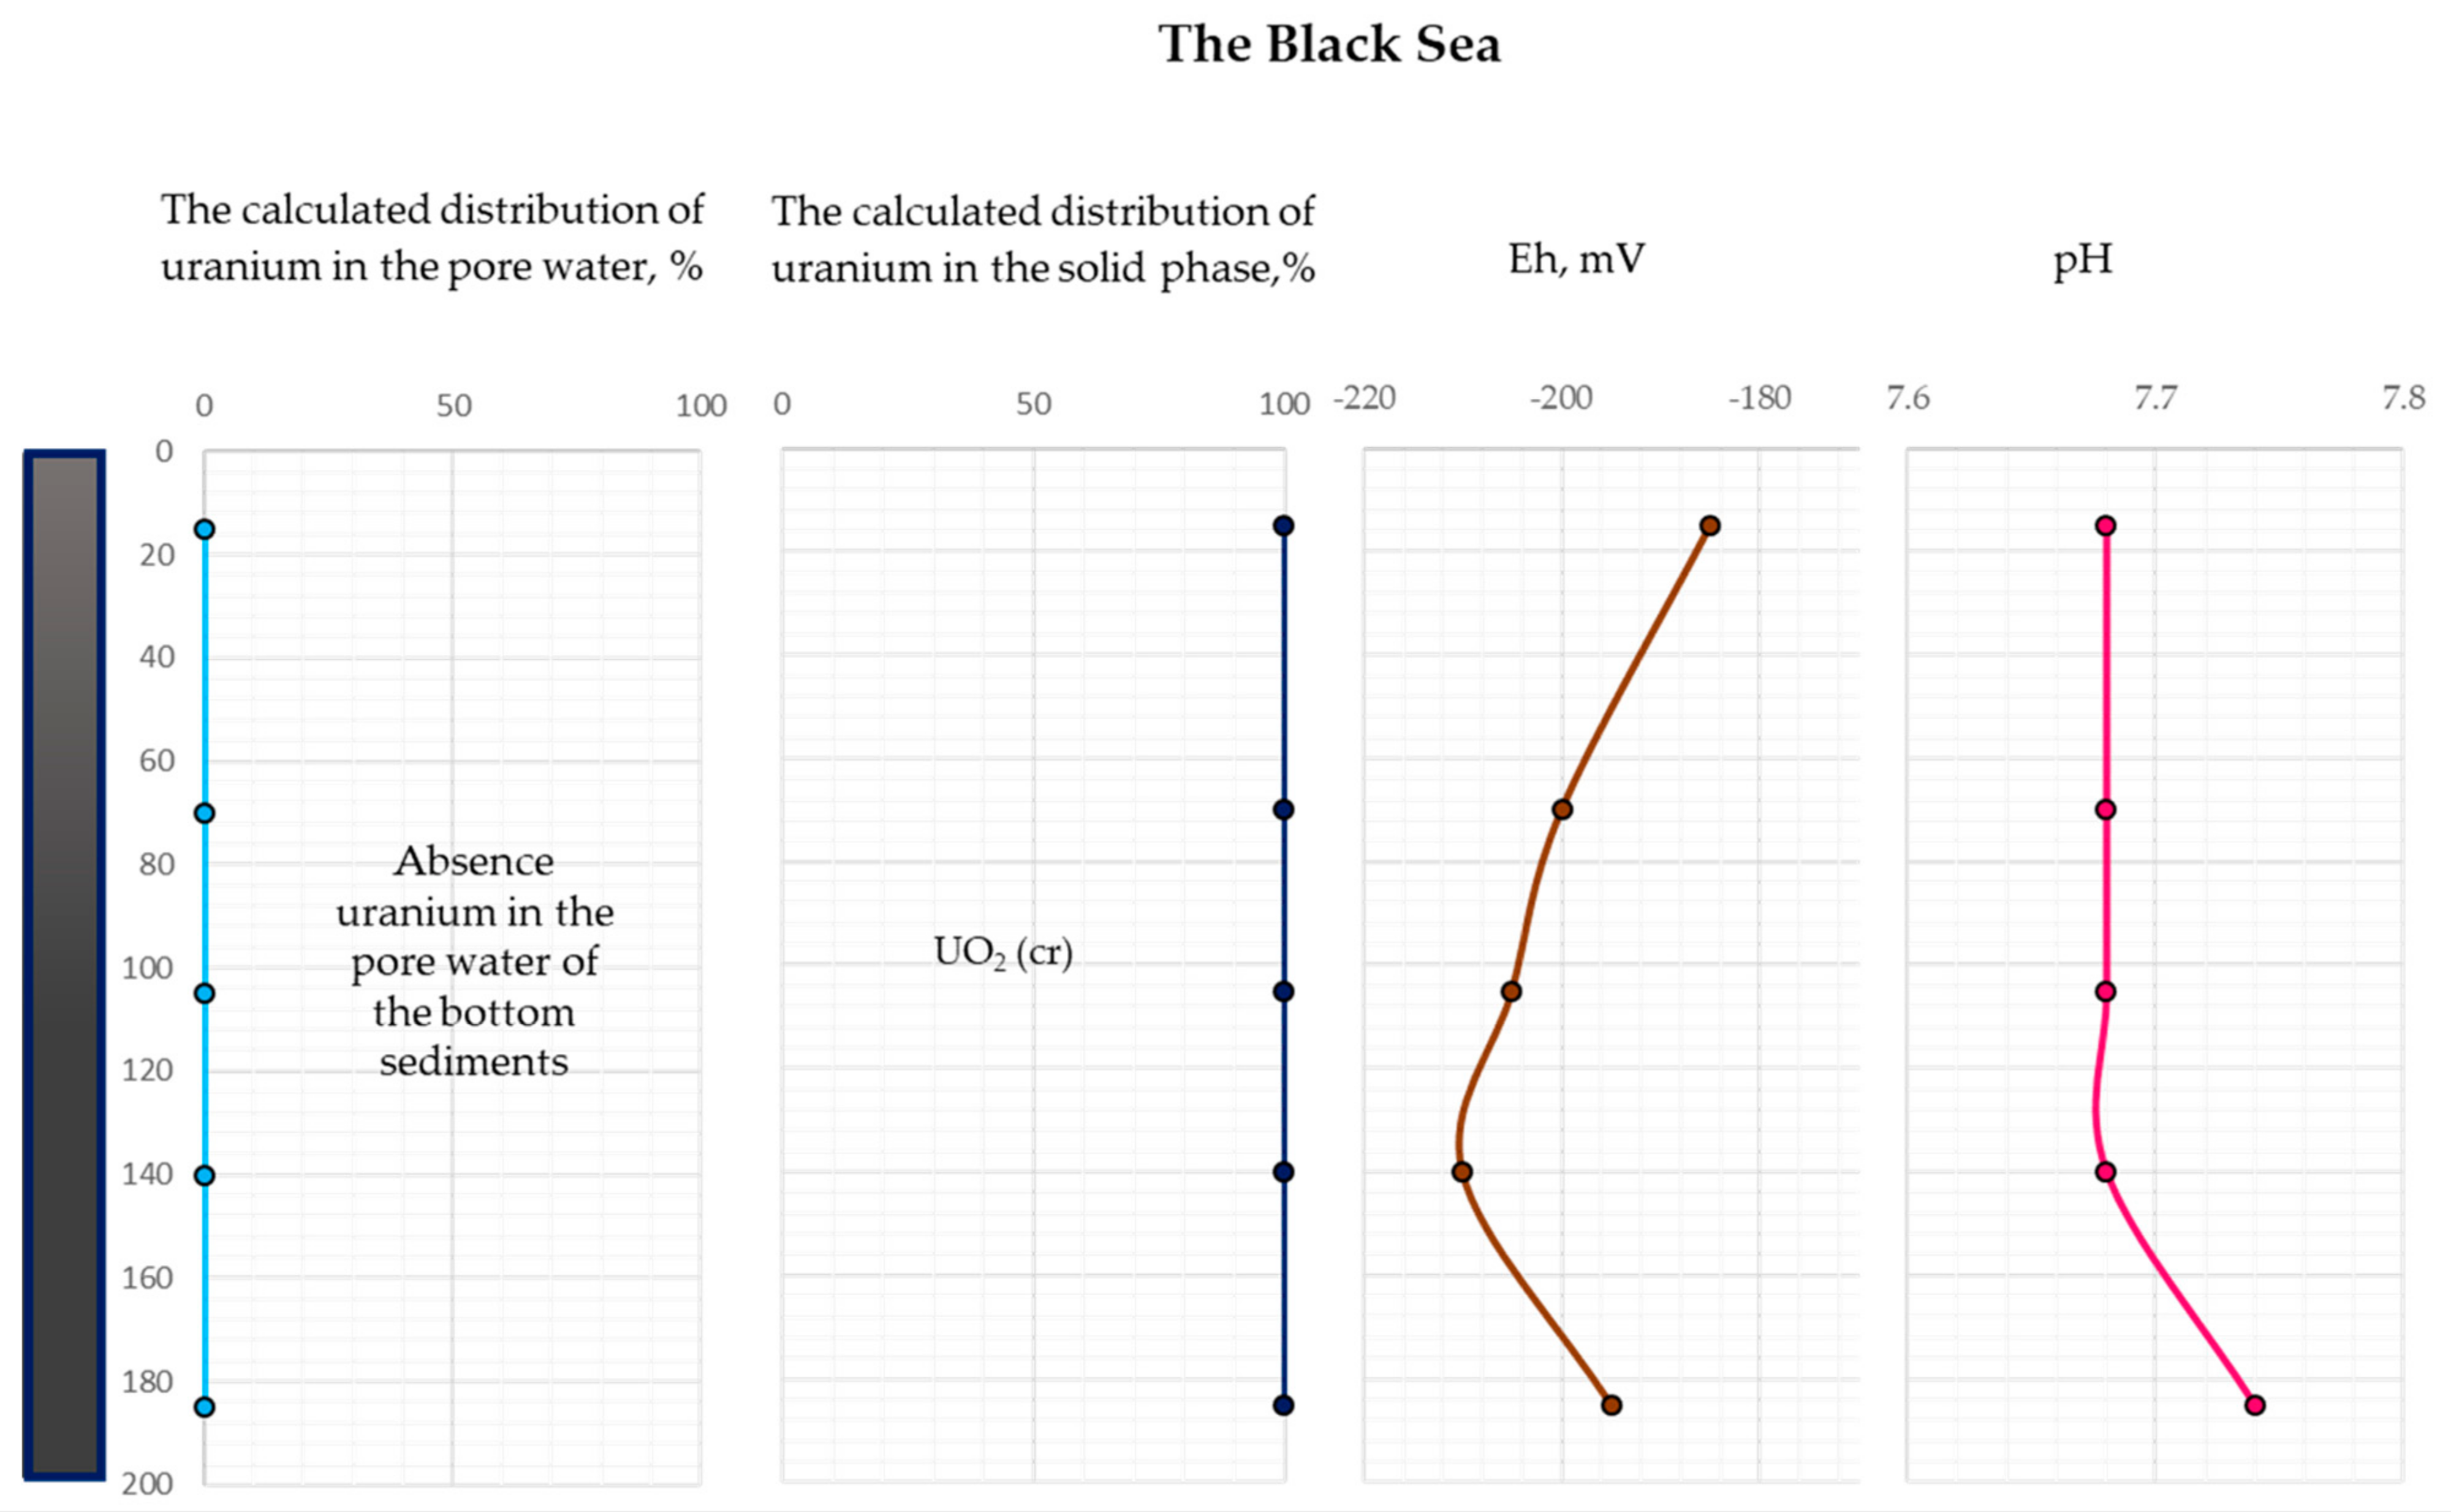
5.2. Behaviour of Uranium in Bottom Sediments under Reducing Conditions in the Example of Black Sea

In contrast with the White Sea, the sedimentation process in the Black Sea is mostly carried out in typically reducing conditions due to high hydrogen sulfide content in the water below 90–160 m. The study of Black Sea sediments is an appropriate way to analyze sedimentation processes in oxygen-free conditions [28]. Comparing the White Sea and Black Sea cases provides an opportunity to analyze the difference between uranium accumulation in oxidizing and reducing conditions.
Following [29], uranium concentration in the Black Sea’s water varies from 0.0013 ppm to 0.0051 ppm, typical for seawater and close to the White Sea’s water (0.0014–0.0018 ppm).
The bottom sediments of the Black Sea are divided into modern, ancient Black Sea, and Novoeuxinian silt (Pleistocene) [30]. Modern sediments are represented by microlaminated coccolith silt of white and grey color; the content of the hydrotroilite is 0.02–0.06%. According to [28,29,30,31], the organic substance content in modern sediments varies from 0.83% to 4.72%, uranium concentration varies from 1.7 ppm to 20 ppm (Figure 9), the average values of the U/TOC ratio vary from 1.89 to 3.62 ppmU /% TOC, and Eh values vary from −230 mV to +280 mV. The low values of the uranium concentration correspond to the shelf area and high values in deep-sea bottom sediments; additionally, the highest uranium concentration values correspond to the highest organic carbon content. Positive values of Eh = +280 mV are found on the shelf conditions only, whereas the other regions are characterized by negative values of Eh −80 to −230 mV.
Ancient Black Sea sediments (located under modern sediments) are represented by grey clayey silt and black sapropel silt, and the content of the hydrotroilite is 0.01–0.03%. Organic matter concentration is in the range of 0.22–8.95%, uranium concentration is 1.1 ppm–35 ppm, the average values of the U/TOC ratio vary from 0.96 to 2.83 ppmU/% TOC, and Eh values vary from −220 mV to −80 mV.
Novoeuxinian sediments are represented by grey and black silt containing hydrotroilite and sulfides (the content of the hydrotroilite is 0.06%). The organic carbon content is 0.97%, uranium concentrations vary from 0.3 ppm to 4 ppm, the average value of the U/TOC ratio is 2.31 ppmU/% TOC, and the average value of Eh is -198 mV.
The concentrations of Th in the Black Sea sediments reach 16.1 ppm, Th/U ratio varies from 1 to 4 [33].
The summary of the uranium compounds and concentration of physicochemical characteristics in the water and bottom sediments developed in [28,29,30,31,32,33,34,35,36] is shown in Table 8.
Thus, in the case of Black Sea sediments, the upper oxidized layer is absent, hydrogen sulfide is present not only in sediments but also in the water; only negative Eh values characterize bottom sediment–water. Organic carbon concentration is comparable with the White Sea; the uranium concentrations are much higher and achieve values up to 35 ppm. The next chapter considers the possible reasons for uranium behavior in oxidizing and reducing conditions using thermodynamic modeling methods.

5.3. Behavior of Uranium in the Aqueous Solution at Different Eh and pH Conditions: Results of Thermodynamic Modeling

In order to simulate the distribution of the uranium between bottom sediments and pore waters, and predict uranium speciation as a function of redox and pH, we calculated equilibrium phase compositions in the system «seawater–bottom sediment». Calculations were completed for multiple pairs of Eh and pH measured in the bottom sediments of the White and Black Seas. To constrain the redox conditions, the chemical system was considered open with respect to the oxygen pressure, measured pH values, and atmospheric pressure of carbon dioxide. Values of partial pressures of oxygen were calculated from the measured values of Eh and pH [37]. Calculations were completed using the Geocheq software,including the thermodynamic database [38,39] by the free energy minimization technique.
The chemical equilibria were calculated for a simplified 7-component (U, C, H, Na, Cl, O, S) system for the temperature of 273.15K, which approximates to bottom sediment conditions. Fifteen possible minerals (U2S3(cr), U3O7(beta), U4O9(beta), UO2(am), UO2(cr), UO2,25(cr), UO2.6667(cr), UO2CO3(cr), UO2SO4(cr), γUO3(cr), UO3·2H2O(cr), US(cr), US1.90(cr), US2(cr), α-UO2.3333), 46 aqueous species (H2O,aq, H2,aq, UO3,aq, UO42−UOH2+, UO2(CO3)22−, H2S,aq, Cl, CO,aq, CO2,aq, CO32−, NaCl,aq, UO2OH+, (UO2)2OH3+, HCO3−, HS, HSO3−, HSO4−, HUO2,aq, HUO2+, HUO3−, HUO4−, H+, UO+, UOH3+, NaOH,aq, NaSO4−, O2,aq, OH, SO2,aq, SO32−, SO42, UO3−, U4+, UO2SO4(aq), UO2+, Na+, UO2(CO3)34−, UO2(OH)42−, UO2,aq, UO2+, UO22+, UO2CO3(aq), UO2OH,aq, UO2(OH)3−, U3+), and 6 gaseous species (CO, CO2, H2, H2O, O2, SO2) were taken into account. Processes of uranium sorption on the organic matter were not considered in the model. The system was modeled for different values of Eh (from 273 mV to 392 mV), pH (from 7.68 to 8.11), partial pressure of oxygen from 4.28 × 10−79 to 7.45 × 10−65 bar and the initial uranium concentration in pore water of 1 × 10⁻⁵ mol/l in our calculation.
The calculated uranium speciation and the distribution of uranium between the aqueous phases and solid uranium phases (minerals) along the bottom sediment column are shown in Table 9 and Table 10 and Figure 10 and Figure 11.
It is to be noted that we did not obtain solid uranium oxides of intermediate (between VI and IV) uranium oxidation state. The only stable uranium mineral was uraninite UO2(cr).
As follows from Figure 10, at the oxidizing conditions (upper part of the bottom sediments) of the White Sea, uranium is completely retained in the aqueous phase as U+6 aqueous species (the dominant species are UO3, aq and UO2(CO3)2−2) and does not have the potential to accumulate in the sediments. In contrast, within the rest of the sediment column (reducing conditions), uranium precipitates as uraninite (UO2cr). At the reducing conditions of the Black Sea, most of the uranium is predicted to occur as U+4 in the form of uraninite (Figure 11). These results explain the different accumulations of uranium in the White Sea and the Black Sea bottom sediments. The obtained results are also consistent with [40], which shows that the amount of uranium absorbed by organic matter is much higher under reducing conditions compared to oxidizing conditions.

5.4. Comparison of Uranium Accumulation in Oxidizing and Reducing Conditions

Obtained experimental data and thermodynamic modeling results explain the difference in uranium accumulation in bottom sediments in oxic and anoxic environments in the examples of the White Sea and the Black Sea (Figure 12).
In oxidizing conditions, the seawater contains uranium (VI) in soluble forms; typical concentrations vary in the range of 0.002–0.003 ppm. In such conditions, part of the uranium is accumulated in marine organisms and absorbed in the organic matter of sediments; however, the total content of uranium in oxidizing layers of sediments does not exceed 1–1.5 ppm, including uranium contained in the inorganic matter of continental run-off and uranium accumulated in organic matter. The content of uranium in deeper layers of sediments may be slightly (up to 2.5–3 ppm) higher than in upper oxidizing layers due to the change of redox conditions from oxidizing to reducing, which results in the fixation of uranium contained in sludge water in organic and inorganic particles of the bottom sediments. This uranium behavior has been observed in the White Sea and is typical for water reservoirs characterizing oxygen in the bottom layer.
In the case of reducing conditions in the bottom layer, if thermodynamic equilibria are reached, most of the uranium in the water–bottom sediment system is accumulated in the forms of insoluble compounds in the solid phase. A considerable part of uranium could also be absorbed by organic matter, e.g., following [40], uranium sorption is increased in reducing conditions. In this case, the concentrations of uranium in bottom sediments could be at least one order of magnitude higher, depending on sedimentation conditions, including the concentration of uranium in water, redox conditions, sedimentation rate, the content of organic matter, and other factors. This behavior has been found in the Black Sea and is typical for reducing conditions in a water reservoir’s bottom layer. Following the study results, we propose that considerable variations of uranium content in marine source rocks could be explained by the variations in redox conditions at the sedimentation stage; however, other factors affecting uranium accumulation could also be taken into account.

6. Summary and Conclusions

The lithological and geochemical study of the bottom sediments at two stations in the Kandalaksha Bay of White Sea was performed. The uranium concentrations distribution and contents, and compositions of organic and inorganic components, along with the bottom sediment columns were studied. This study showed that, in the White Sea’s oxidizing conditions, the concentration of uranium in the bottom sediments varies from 1 to 1.5 ppm in the upper oxidizing part of the sediments and slightly increases up to 2.5 ppm in deeper layers characterized by reducing conditions. The U/TOC ratio varies from 0.8 ppm U/%TOC in the upper part to 1.5 ppm U/%TOC in deeper layers. The results have been compared with the behavior of uranium in the bottom sediments, accumulated in anoxic conditions of the Black Sea, where the concentration of uranium achieves 25 ppm, and the U/TOC ratio increases up to 3.6 ppm U/%TOC, while uranium content in water and composition of the bottom sediments are close to values observed for the White Sea. Considerable differences in uranium content and U/TOC ratio were analyzed using thermodynamic models of the water–sediment system for different redox conditions. It was shown that an increase in uranium accumulation in sediments in reducing conditions by comparison with oxidizing conditions could be explained by the difference in solubility of uranium in the water–bottom layers contacting with sediments and in the water saturating the upper part of sediments. However, reducing conditions observed in sediments located deeper than 0.5 m in the White Sea did not lead to an increase in the accumulation of uranium because the amount of uranium that can be precipitated from the pore water of sediments is much less by comparison with uranium content in the inorganic part of sediments that originated from continental run-off.
The obtained results revealed that the redox condition in the bottom layer of seawater during sedimentation is one of the most important factors controlling the concentration of uranium in the bottom sediments and source rocks of marine genesis. The obtained experimental data and results of thermodynamic modeling provide additional information that can help to understand the behavior of uranium during sedimentation and improve the methods of unconventional reservoir characterization using data on uranium content from gamma logging.

Author Contributions

Conceptualization, M.S.; methodology, M.S.; software, M.M. and N.K.; validation, M.S., M.M. and E.P.; formal analysis, S.K.; investigation, N.K., M.M. and Y.T.; resources, E.P.; data curation, E.P., M.M. and A.V; writing—original draft preparation, N.K., Y.T., M.S. and A.V.; writing—review and editing, M.S., A.V. and M.M.; visualization, N.K. All authors have read and agreed to the published version of the manuscript.

Funding

This work was supported by the Ministry of Science and Higher Education of the Russian Federation under agreement No. 075-10-2020-119 within the framework of the development program for a world-class Research Center.

Acknowledgments

Evgeniy Bastrakov is thanked for his advices and ideas. D. Korost and Lomonosov MSU Marine Research Center are thanked for sampling the bottom sediments.

Conflicts of Interest

The authors declare no conflict of interest.

References

  1. Swanson, V.E. Geology and Geochemistry of Uranium in Marine Black Shales: A Review; US Government Printing Office: Washington, DC, USA, 1961; pp. 1–110. [Google Scholar]
  2. Lüning, S.; Kolonic, S. Uranium spectral gamma-ray response as a proxy for organic richness in black shales: Applicability and limitations. J. Pet. Geol. 2003, 26, 153–174. [Google Scholar] [CrossRef]
  3. Zubkov, M.Y. Peculiarities of uranium distribution in bituminous deposits of the Bazhenov formation (Western Siberia). Logger 2015, 5, 3–32. [Google Scholar]
  4. Bastrakov, E.; Boreham, C.; Edwards, D.; Jarrett, A. Uranium in organic-rich shales as a tool for predicting hydrocarbon potential: Proterozoic to Cretaceous examples from Australia. In Proceedings of the 20th Australian Organic Geochemistry Conference: Origins of Oil, Old Organics and Organisms, Canberra, Australia, 3–7 December 2018. [Google Scholar]
  5. Khaustova, N. U/Corg Ratio Within Unconventional Reservoirs: Indicator of Oil Generation Processes and Criteria for Productive Intervals Determination During the Bazhenov Formation Investigation. In Proceedings of the EAGE/SPE Workshop on Shale Science, Moscow, Russia, 8–9 April 2019. [Google Scholar]
  6. Fertl, W.H. Gamma ray spectral evaluation techniques identify fractured shale reservoirs and source-rock characteristics. J. Pet. Technol. 1980, 32, 11. [Google Scholar] [CrossRef]
  7. Vosel, J.S. Geohimiya Urana v Sovremennyh Karbonatnyh Otlozheniyah Malyh Ozer (Formy Nahozhdeniya i Izotopnye Otnosheniya 234U/238U). Ph.D. Thesis, V.S. Sobolev Institute of Geology and Mineralogy Siberian Branch Russian Academy of Sciences, Novosibirsk, Russia, 24 February 2016. [Google Scholar]
  8. Mangini, A.; Jung, M.; Laukenmann, S. What do we learn from peaks of uranium and manganese in deep-sea sediments? Mar. Geol. 2001, 177, 63–78. [Google Scholar] [CrossRef]
  9. Chappaz, A.; Gobeil, C.; Tessier, A. Controls on uranium distribution in lake sediments. Geochim. Cosmochim. Acta 2010, 74, 203–214. [Google Scholar] [CrossRef]
  10. Sklyarov, E.V. Klimaticheskaya istoriya golocena Zapadnogo Pribajkal’ya v karbonatnoj osadochnoj letopisi ozera Holbo-Nur. In Doklady Akademii Nauk; Federal’noe Gosudarstvennoe Unitarnoe Predpriyatie Akademicheskij Nauchno-Izdatel’skij, Proizvodstvenno-Poligraficheskij i Knigorasprostranitel’skij Centr Nauka, Izdatel’stvo Nauka: Moscow, Russia, 2010; Volume 431, pp. 668–674. [Google Scholar]
  11. Rolison, J.M. Uranium stable isotope fractionation in the Black Sea: Modern calibration of the 238U/235U paleo-redox proxy. Geochim. Cosmochim. Acta 2017, 203, 69–88. [Google Scholar] [CrossRef]
  12. Maslov, A.V. Geohimiya sovremennyh donnyh osadkov belogo, kaspijskogo i chernogo morej: Chto eto nam, “suhoputnym” geologam, daet. In Geologiya, Geoekologiya i Resursnyj Potencial Urala i Sopredel’nyh Territorij; BashNIPIneft: Ufa, Russia, 2016; Volume 4, pp. 129–135. [Google Scholar]
  13. Demidov, I.N. Kratkie svedeniya o geologii verhnej chasti osadochnogo chekhla Belogo moray. In Sistema Belogo Morya Prirodnaya Sreda Vodosbora Belogo Moray; Izdatel’stvo Nauchnyj mir: Moscow, Russia, 2012; Volume 1, pp. 54–71. [Google Scholar]
  14. Lein, A.Y.; Lisitsyn, A.P. Processy rannego diageneza arkticheskih morej (na primere Belogo morya). In The White Sea System The Processes of Sedimentation, Geology and History; Izdatel’stvo Nauchnyj mir: Moscow, Russia, 2012; Volume 4, pp. 504–571. [Google Scholar]
  15. OOO “Izmeritel’naya tekhnika”. Available online: http://www.izmteh.ru/esr/esr-10104/ (accessed on 30 July 2021).
  16. Coplen, T.B.; Hopple, J.A.; Böhlke, J.K.; Peiser, H.S.; Rieder, S.E.; Krouse, H.R.; Rosman, K.J.R.; Ding, T.; Vocke, R.D., Jr.; Révész, K.M.; et al. Compilation of Minimum and Maximum Isotope Ratios of Selected Elements in Naturally Occurring Terrestrial Materials and Reagents. In Water-Resources Investigations Report 01-4222; Joint Research Centre: Geel, Belgium, 2002. [Google Scholar]
  17. Instrument: CHN628 Series w/Sulfur Add-On Module (S628). In Organic Application Note; Leco Corporation: Saint Joseph, MI, USA, 2014.
  18. Instrument: CHN628. In Organic Application Note; Leco Corporation: Saint Joseph, MI, USA, 2016.
  19. Gursky, Y.N. Osobennosti himicheskogo sostava ilovyh vod Belogo morya. Okeanologiya 2005, 45, 224–239. [Google Scholar]
  20. Lein, A.Y. Izuchenie morej rossijskoj Arktiki: Myslitel’nye processy. Priroda 2014, 8, 11–19. [Google Scholar]
  21. Moiseenko, T.N. Zagryaznenie poverhnostnyh vod vodosbora i osnovnye antropogenno obuslovlennye processy. In Sistema Belogo Morya Prirodnaya Sreda Vodosbora Belogo Moray; Izdatel’stvo Nauchnyj mir: Moscow, Russia, 2012; Volume 1, pp. 297–329. [Google Scholar]
  22. Lisitsyn, A.P.; Novigatsky, A.N.; Shevchenko, V.P.; Kluvitkin, A.A.; Filippov, A.S.; Kravchishina, M.D.; Politova, N.V. Dispersnye formy osadochnogo veshchestva v okeane i moryah na primere Belogo morya (rezul’taty 12-letnih issledovanij). Dokl. Earth Sci. 2014, 456, 355–359. [Google Scholar]
  23. Tesdal, J.E.; Galbraith, E.D.; Kienast, M. Nitrogen isotopes in bulk marine sediment: Linking seafloor observations with subseafloor records. Biogeosciences 2013, 10, 101–118. [Google Scholar] [CrossRef] [Green Version]
  24. Newton, R.; Bottrell, S. Stable isotopes of carbon and sulfur as indicators of environmental change: Past and present. J. Geol. Soc. 2007, 164, 691–708. [Google Scholar] [CrossRef]
  25. Rozanov, A.G.; Volkov, I.I.; Emelyanov, E.M. Redoks-sistema donnyh otlozhenij Belogo morya: Zhelezo, marganec, sera. In The White Sea System The Processes of Sedimentation, Geology and History; Izdatel’stvo Nauchnyj mir: Moscow, Russia, 2012; Volume 4, pp. 639–661. [Google Scholar]
  26. Belyaev, N.A. Organic Matter and Hydrocarbon Markers of the White Sea. Ph.D. Thesis, Shirshov Institute of Oceanology of Russian Academy of Sciences, Tomsk Polytechnic University, Moscow, Russia, 2015. [Google Scholar]
  27. Demaison, G.J.; Moore, G.T. Anoxic environments and oil source bed genesis. AApG Bull. 1980, 8, 1179–1209. [Google Scholar] [CrossRef]
  28. Rozanov, A.G.; Kokratskaya, N.M.; Gursky, Y.N. Sostav ilovyh vod i formy soedinenij sery v donnyh otlozheniyah severo-vostochnoj chasti CHernogo morya. Litol. Polezn. Iskop. 2017, 4, 291–305. [Google Scholar]
  29. Baturin, G.N. Uran v Sovremennoj Morskoj Sedimentacii; Atomizdat: Moscow, Russia, 1975. [Google Scholar]
  30. Gursky, Y.N. Metody izucheniya i processy formirovaniya himicheskogo sostava ilovyh vod otlozhenij Chernogo, Azovskogo, Kaspijskogo, Belogo i Baltijskogo morej. In Geohimiya Litogidrosfery Vnutrennih Morej; GEOS: Moscow, Russia, 2003; Volume 1. [Google Scholar]
  31. Gursky, Y.N. Zakonomernosti povedeniya mikroelementov v sisteme ilovye vody-osadki Chernogo morya. In Proceedings of the XXIII Mezhdunarodnaya Nauchnaya Konferenciya (Shkola) po Morskoj Geologii “Geologiya Morej i Okeanov”, Moscow, Russia, 18–22 November 2019. [Google Scholar]
  32. Shnyukov, E.F.; Bezborodov, A.A.; Melnik, V.I.; Mitropolsky, A.Y. Geohimicheskaya evolyuciya urana v Chernom more. Geol. Zhurn 1979, 39, 1–9. [Google Scholar]
  33. Neprochnov, Y.P. Geologicheskaya Istoriya CHernogo Morya po Rezul’tatam Glubokovodnogo Bureniya; Nauka: Moscow, Russia, 1980. [Google Scholar]
  34. Rozanov, A.G.; Gursky, Y.N. Geohimicheskie osobennosti osadkov v severo-vostochnoj chasti Chernogo morya. Okeanologiya 2016, 56, 919–934. [Google Scholar]
  35. Anderson, R.F.; Fleisher, M.Q.; LeHuray, A.P. Concentration, oxidation state, and particulate flux of uranium in the Black Sea. Geochim. Cosmochim. Acta 1989, 53, 2215–2224. [Google Scholar] [CrossRef]
  36. Barnes, C.E.; Cochran, J.K. Geochemistry of uranium in Black Sea sediments. Deep Sea Research Part A. Oceanogr. Res. Pap. 1991, 38, S1237–S1254. [Google Scholar]
  37. Garrels, R.; Christe, C.L. Solutions, Minerals, and Equilibria, 1st ed.; Harper & Row: New York, NY, USA, 1965. [Google Scholar]
  38. Wignall, P.B.; Myers, K.J. Interpreting benthic oxygen levels in mudrocks: A new approach. Geology 1988, 16, 452–455. [Google Scholar] [CrossRef]
  39. Mironenko, M.V.; Akinfiev, N.N.; Melikhova, T.Y. GEOCHEQ—The complex for thermodynamic modeling of geochemical systems. Her. DGGGMS RAS 2000, 5, 96–97. [Google Scholar]
  40. Bone, S.E.; Dynes, J.J.; Cliff, J.; Bargar, J.R. Uranium (IV) adsorption by natural organic matter in anoxic sediments. Proc. Natl. Acad. Sci. USA 2017, 114, 711–716. [Google Scholar] [CrossRef] [PubMed] [Green Version]
Figure 1. Location of the object of study. Stations 1 and 2 of sampling.
Geosciences 11 00332 g001
Figure 2. A sampling of bottom sediments by a gravitational steel pipe.
Geosciences 11 00332 g002
Figure 3. The cores of bottom sediments from stations 1 (left) and 2 (right).
Geosciences 11 00332 g003
Figure 4. Lithological description and color photos of core from Station 1.
Geosciences 11 00332 g004
Figure 5. Lithological description and color photos of core from Station 2.
Geosciences 11 00332 g005
Figure 6. The bottom sediments of station 1. The distribution of the curves: H, N, S elements, and TOC (analyzer CHN628); uranium concentration U (ICP-MS); isotopy data: δ34S, δ13C, δ13Ccarb15N; the ratios C/N, U/TOC; also pH and Eh.
Geosciences 11 00332 g006
Figure 7. The bottom sediments of station 2. The distribution of the curves: H, N, S elements and TOC (analyzer CHN628); U, Th, Co, Pb, Cr, Ni, Cd, Zn, V, Fe concentrations (ICP-MS); isotopy data: δ34S, δ13C, δ15N; the ratios C/N, U/TOC, and Th/U.
Geosciences 11 00332 g007
Figure 8. Correlation between the uranium concentration and organic matter content in the bottom sediments of the White Sea for station 2. Above the points, the sulfur isotopic composition (δ34S) is indicated. Dot color change is due to sulfur content (S).
Geosciences 11 00332 g008
Figure 9. U concentration in the modern sediments of the Black Sea (ppm). Modified after [32].
Geosciences 11 00332 g009
Figure 10. The distribution of the calculated uranium concentration in the pore water and the solid phase of the White Sea bottom sediments for station 1.
Geosciences 11 00332 g010
Figure 11. The distribution of the calculated uranium concentration in the pore water and the solid phase of the Black Sea bottom sediments (the Eh and pH data distribution from [29]).
Geosciences 11 00332 g011
Figure 12. The behavior of uranium in the different redox conditions in the water sea and the bottom sediments (the White Sea (left) and the Black Sea (right)).
Geosciences 11 00332 g012
Table 1. Coordinates of the sampling stations.
StationEastingNorthingWater Depth mColumn Length cm
1510,868.137,379,725.582.9285
2516,170.337,377,367.580.0173
Table 2. Station 2. Results of mineral composition measurements (the XRD method) of the White Sea bottom sediments.
Depth, cmQuartz
%
Albite
%
Illite
%
Kaolinite
%
Pyrite
%
Mica
%
47.55631.252.5-5.2
112.546.33711.32.21.81.3
Table 3. Station 1. Measurements of redox potential (Eh) reduced to the normal hydrogen electrode potential and pH on fresh bottom sediments.
Depth (cm)Eh (mV)pH
5+3928
42.5−2738.11
71.5−2437.95
91.5−2157.88
110.0−1457.81
136.5−1177.94
156.5−1387.92
181.5−1157.84
201.5−1507.82
220.0−1707.84
247.5−737.76
267.5−637.81
Table 4. Station 1. Results of ICP-MS measurements of bottom sediments.
Depth, cmU, ppm
171.51.3
91.51.42
1101.33
136.51.21
156.51.21
181.51.16
201.51.24
2201.36
247.51.87
267.51.34
Table 5. The concentration of uranium and other metals in the bottom sediments from station 2 (ppm).
Depth, cmUFeCrVZnNiCoPbThCd
Instrumental detection limit0.0320.3000.0240.0210.0650.0150.0160.0190.0290.013
2.51.8935,7219594663727206.230.122
7.51.6935,0789795663915136.080.119
12.51.7935,4309997783918106.430.113
17.51.8133,80110293663815116.620.106
22.51.932,372959162371576.370.109
27.51.9133,269928862371576.880.114
32.51.7633,751968963381486.510.095
37.51.8333,153968965371466.490.092
42.51.8833,165998861381366.810.096
47.51.9132,839988765371466.860.107
52.51.9132,839988765371466.860.107
57.52.0832,551928459351367.030.098
62.52.1232,152918565361357.210.086
67.52.0832,100948457361357.070.085
72.52.0631,789928558361367.090.086
77.52.1334,040978761371467.940.078
82.52.333,484968962371367.750.097
87.52.132,074928458361367.580.071
92.52.1631,134888263341357.470.075
97.52.2632,8489085603614680.088
102.52.2733,454928660371457.650.091
107.52.2933,027918563371368.180.092
112.52.3433,503898564361478.40.091
117.52.4834,274908965371468.890.097
122.52.3833,132948562381478.80.087
127.52.4634,200948366381469.020.097
132.52.4431,894888362351368.560.09
137.52.2130,840877657341388.290.081
142.52.4233,186948363371399.290.101
147.52.3633,4119284653613139.060.092
152.52.2932,4589382623713138.710.092
157.52.433,932988364371398.90.087
162.52.5233,502968363371389.480.101
Table 6. Stations 1 and 2. Results of elemental composition (CHNS) measurements of bottom sediments.
StationDepth, cmElemental Composition
N, %C, %H, %S, %C/N
142.50.352.770.790.727.91
71.50.332.680.750.768.12
91.50.362.761.190.727.67
1100.382.890.800.867.61
136.50.342.580.710.677.59
156.50.302.360.710.557.87
181.50.292.290.760.557.90
201.50.292.300.460.567.93
2200.282.170.680.567.75
247.50.332.560.360.217.76
267.50.302.290.650.637.63
22.50.312.310.400.157.45
7.50.302.210.500.187.37
12.50.251.900.460.267.60
17.50.241.760.420.267.33
22.50.231.680.420.207.30
27.50.241.790.450.217.46
32.50.241.770.440.297.38
37.50.231.700.440.267.39
47.50.181.450.380.338.06
52.50.151.220.300.288.13
57.50.211.600.380.277.62
62.50.191.390.330.327.32
67.50.221.570.370.337.14
72.50.201.550.370.407.75
77.50.211.590.380.417.57
82.50.191.690.480.418.89
87.50.211.610.360.447.67
92.50.221.680.440.427.64
97.50.221.630.420.397.41
102.50.211.660.400.407.90
107.50.181.600.410.448.89
112.50.231.790.440.447.78
117.50.231.660.430.517.22
122.50.201.540.400.617.70
127.50.251.840.460.567.36
132.50.211.620.430.677.71
137.50.221.650.440.517.50
142.50.201.530.400.657.65
147.50.211.680.460.848.00
152.50.221.690.290.847.68
157.50.221.860.500.618.45
Table 7. Stations 1 and 2. Results of isotopic composition measurements of bottom sediments.
StationDepth, cmδ15N Air,δ13C PDBδ13C PDBδ34S CDT,
org., ‰carb.,‰
142.55.8−23.7−9.1−5.3
1106.1−23.3−5.7−10.8
181.56.7−23.2−4.2−5.8
247.55.0−23.5−4.1−23.2
212.55.4−24.5 −4.2
52.56.1−24.6 −34.2
102.54.4−23.7 −36.9
137.55.0−24.6 −34.9
Table 8. The physicochemical characteristics (pH, Eh, and H2S), compounds, and uranium concentration in the Black Sea water and bottom sediments. Modified after [32].
Depth, mpHEh, mVH2S, mg/LCompounds and Concentration of Uranium
Seawater 0–2007.85–7.95−140...−1600.08–0.83UO2(CO3)22−, UO2(CO3)34-, Uconcentration in seawater = 0.00093–0.00324 ppm
200–1500 7.74–7.8−176…−1942.39–10.18[UO2(CO3)3]4−, Uconcentration in seawater = 0.00095–0.00261 ppm
41500–20007.64–7.73−200…−20310.40–11.66[UO2(CO3)3]4−, U(OH)4, UO2cr, the concentration of uranium in water decreases U concentration in seawater = 0.00029–0.00299 ppm
Sediments Modern6.4–8.5−80...−2300–121.24U(OH)4, UO2cr, Uconcentration = 1.7–20 ppm
Ancient6.2–8.2−80...−22050–60 Maximum uranium concentration in sapropel, Uconcentration = 1.1–35 ppm
1Novoeuxinian6.2–8.0−1980Minimum uranium concentration, Uconcentration = 0.3–4 ppm
Table 9. The calculated uranium concentration in the pore water and the solid phase of the White Sea bottom sediments for station 1.
Depth, cmpHEh, mVpO2The Calculated Concentration of Uranium in Pore Water, mol/LThe Proportion of the Total Uranium Contained by Pore Water, %The Calculated Concentration of Uranium in the Solid Phase UO2 (cr), mol/LThe Proportion of the Total Uranium Contained by the Solid Phase, %The Total Amount of Uranium, mol/L
583921.23 × 10−301.00 × 10−51.00 × 10+2001.00 × 10−5
42.58.11−2734.28 × 10−793.99 × 10−103.99 × 10−31.00 × 10−51.00 × 1021.00 × 10−5
71.57.95−2431.57 × 10−773.99 × 10−103.99 × 10−31.00 × 10−51.00 × 1021.00 × 10−5
91.57.88−2159.46 × 10−763.97 × 10−103.97 × 10−31.00 × 10−51.00 × 1021.00 × 10−5
1107.81−1456.97 × 10−713.97 × 10−103.97 × 10−31.00 × 10−51.00 × 1021.00 × 10−5
136.57.94−1172.64 × 10−683.97 × 10−103.97 × 10−31.00 × 10−51.00 × 1021.00 × 10−5
156.57.92−1386.28 × 10−703.97 × 10−103.97 × 10−31.00 × 10−51.00 × 1021.00 × 10−5
181.57.84−1151.48 × 10−683.97 × 10−103.97 × 10−31.00 × 10−51.00 × 1021.00 × 10−5
201.57.82−1503.28 × 10−713.97 × 10−103.97 × 10−31.00 × 10−51.00 × 1021.00 × 10−5
2207.84−1701.33 × 10−723.97 × 10−103.97 × 10−31.00 × 10−51.00 × 1021.00 × 10−5
247.57.76−738.65 × 10−663.97 × 10−103.97 × 10−31.00 × 10−51.00 × 1021.00 × 10−5
267.57.81−637.45 × 10−653.98 × 10−103.98 × 10−31.00 × 10−51.00 × 1021.00 × 10−5
Table 10. The calculated uranium concentration in the pore water and the solid phase of the Black Sea bottom sediments (the Eh and pH data distribution from [29]).
Depth, cmpHEh, mVpO2The Calculated Concentration of Uranium in Pore Water, mol/LThe Proportion of Uranium in the Pore Water, %The Calculated Concentration of Uranium in the Solid Phase UO2 (cr), mol/LThe Proportion of Uranium in the Solid Phase, %The Total Amount of Uranium, mol/L
157.68−1852.41 × 10−743.97 × 10−103.97 × 10−31.00 × 10−51.00 × 1021.00 × 10−5
707.68−2001.90 × 10−753.97 × 10−103.97 × 10−31.00 × 10−51.00 × 1021.00 × 10−5
1057.68−2058.15 × 10−763.97 × 10−103.97 × 10−31.00 × 10−51.00 × 1021.00 × 10−5
1407.68−2103.50 × 10−763.97 × 10−103.97 × 10−31.00 × 10−51.00 × 1021.00 × 10−5
1857.74−1957.70 × 10−753.97 × 10−103.97 × 10−31.00 × 10−51.00 × 1021.00 × 10−5
Publisher’s Note: MDPI stays neutral with regard to jurisdictional claims in published maps and institutional affiliations.

