
Upper Jurassic–Lower Cretaceous Source Rocks in the North of Western Siberia: Comprehensive Geochemical Characterization and Reconstruction of Paleo-Sedimentation Conditions

 , , ,
, , ,
Abstract
:1. Introduction
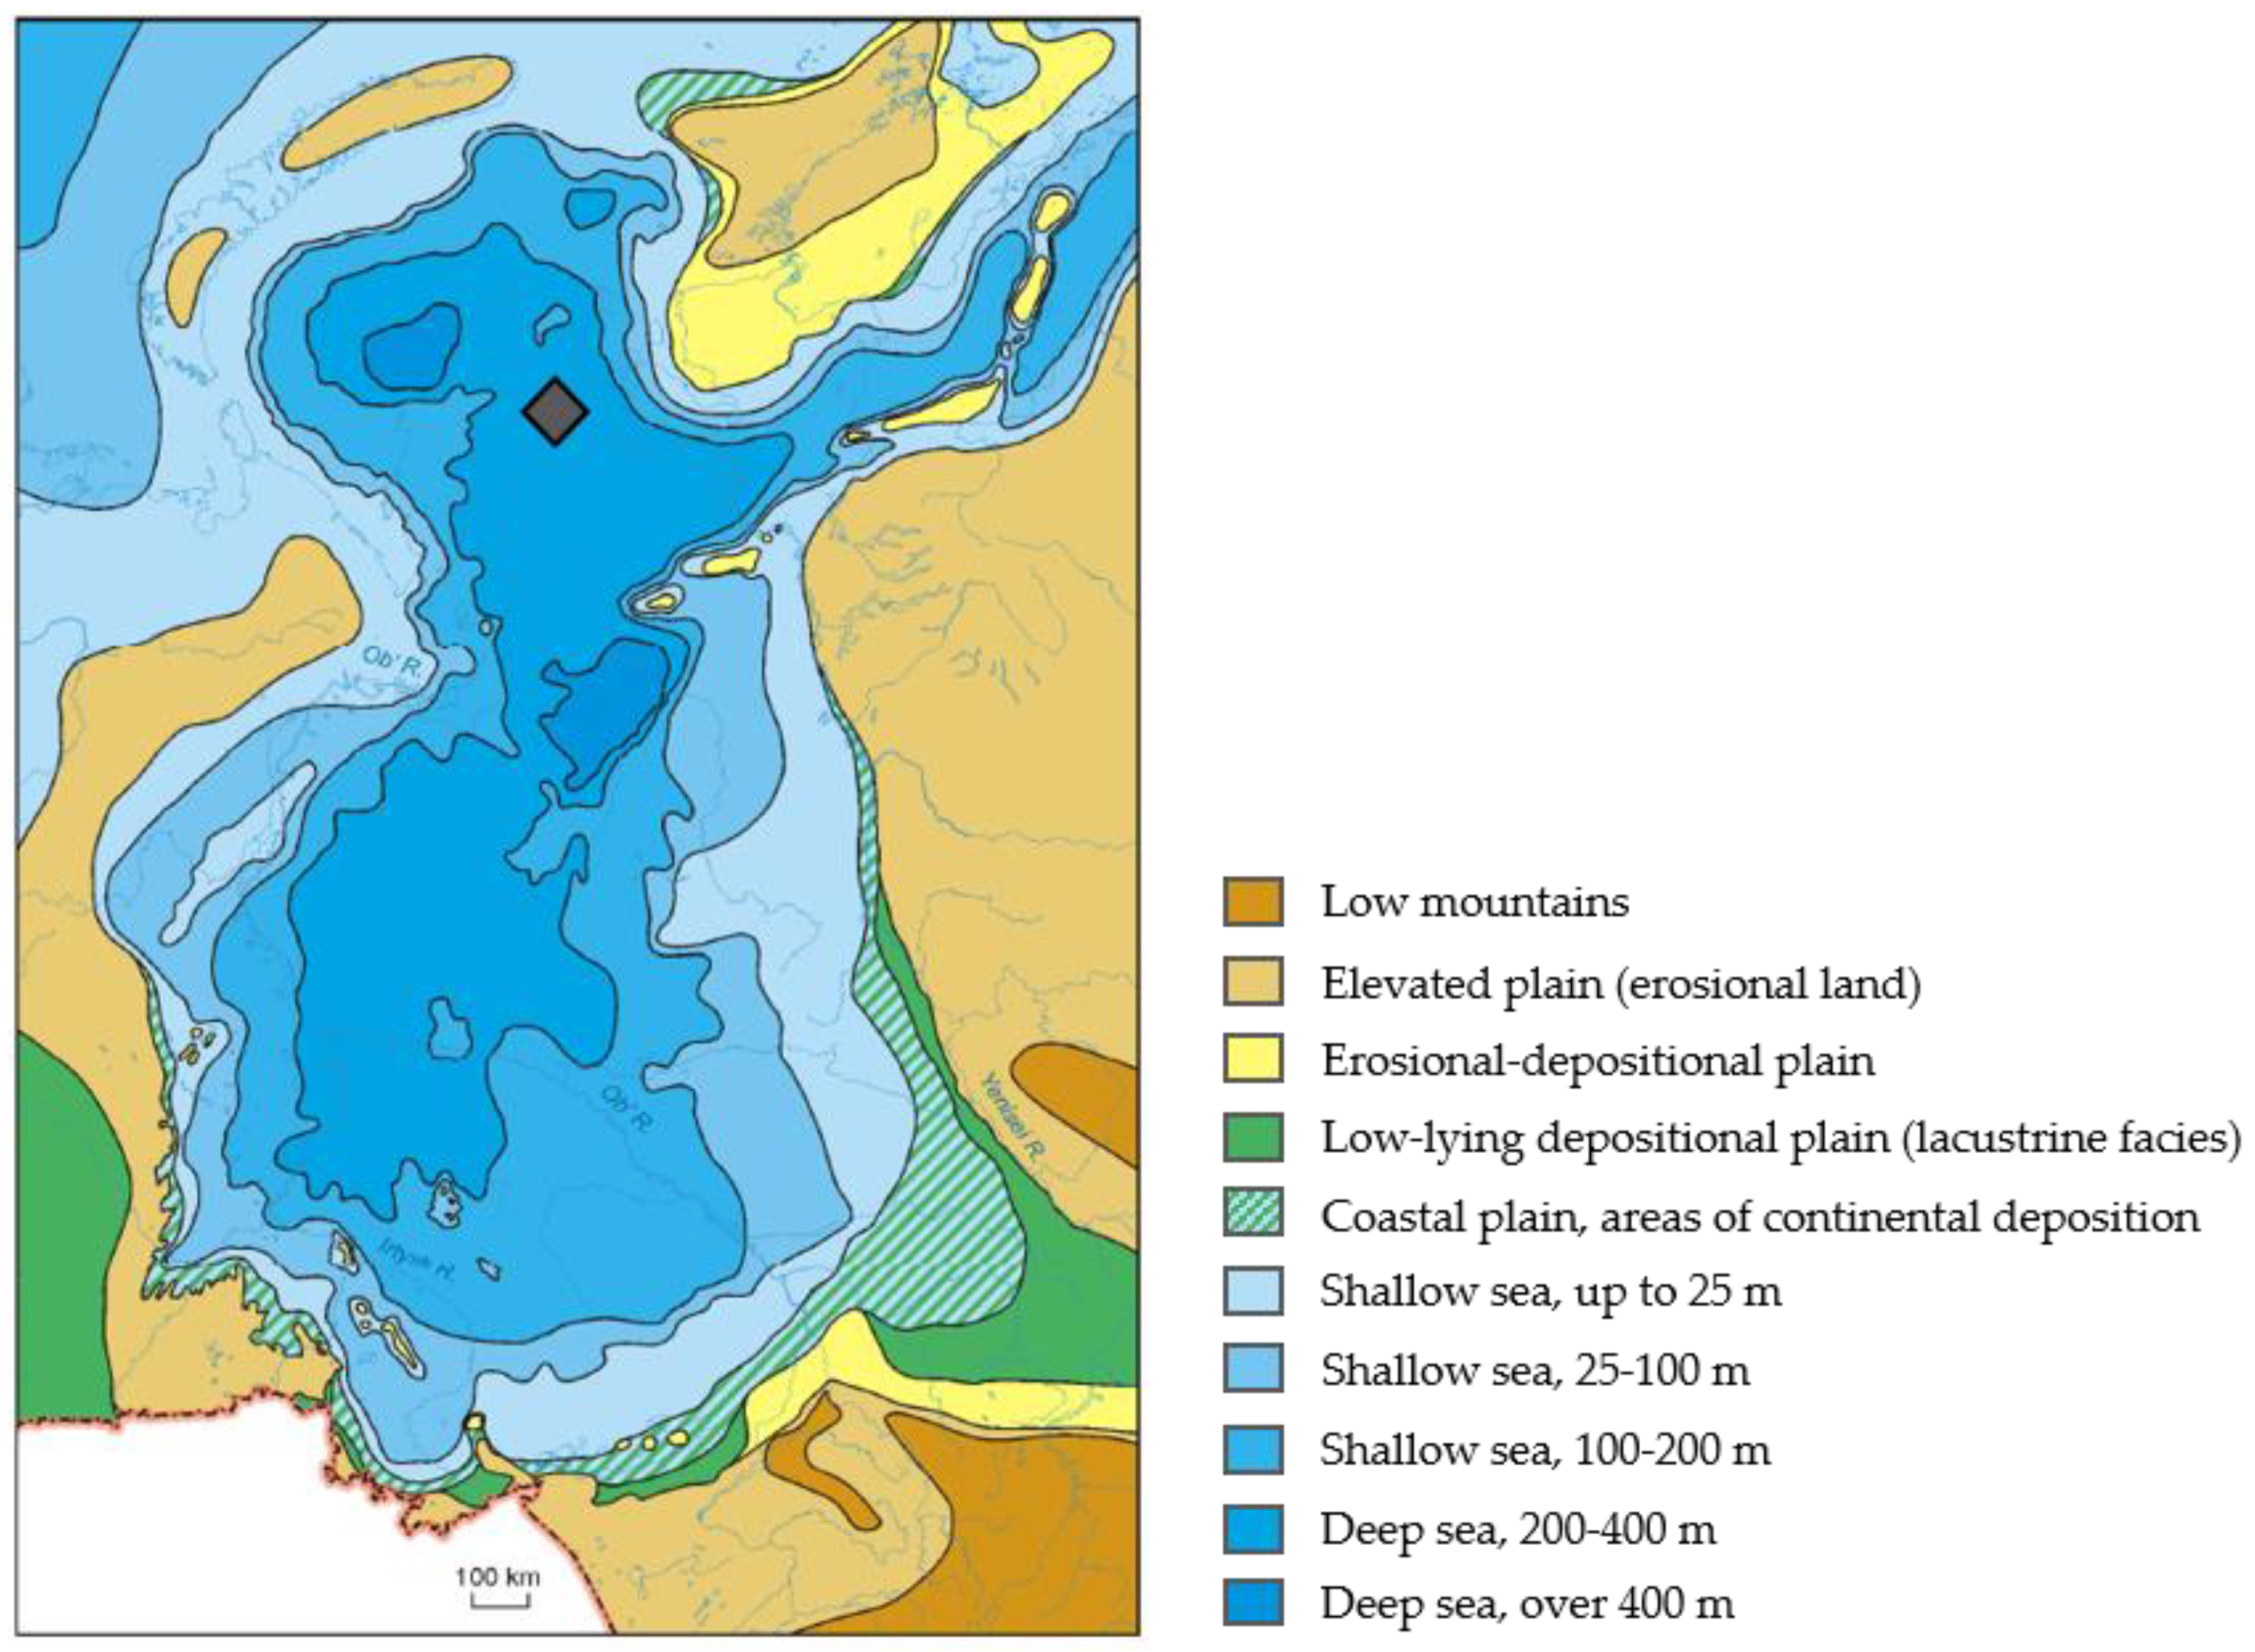
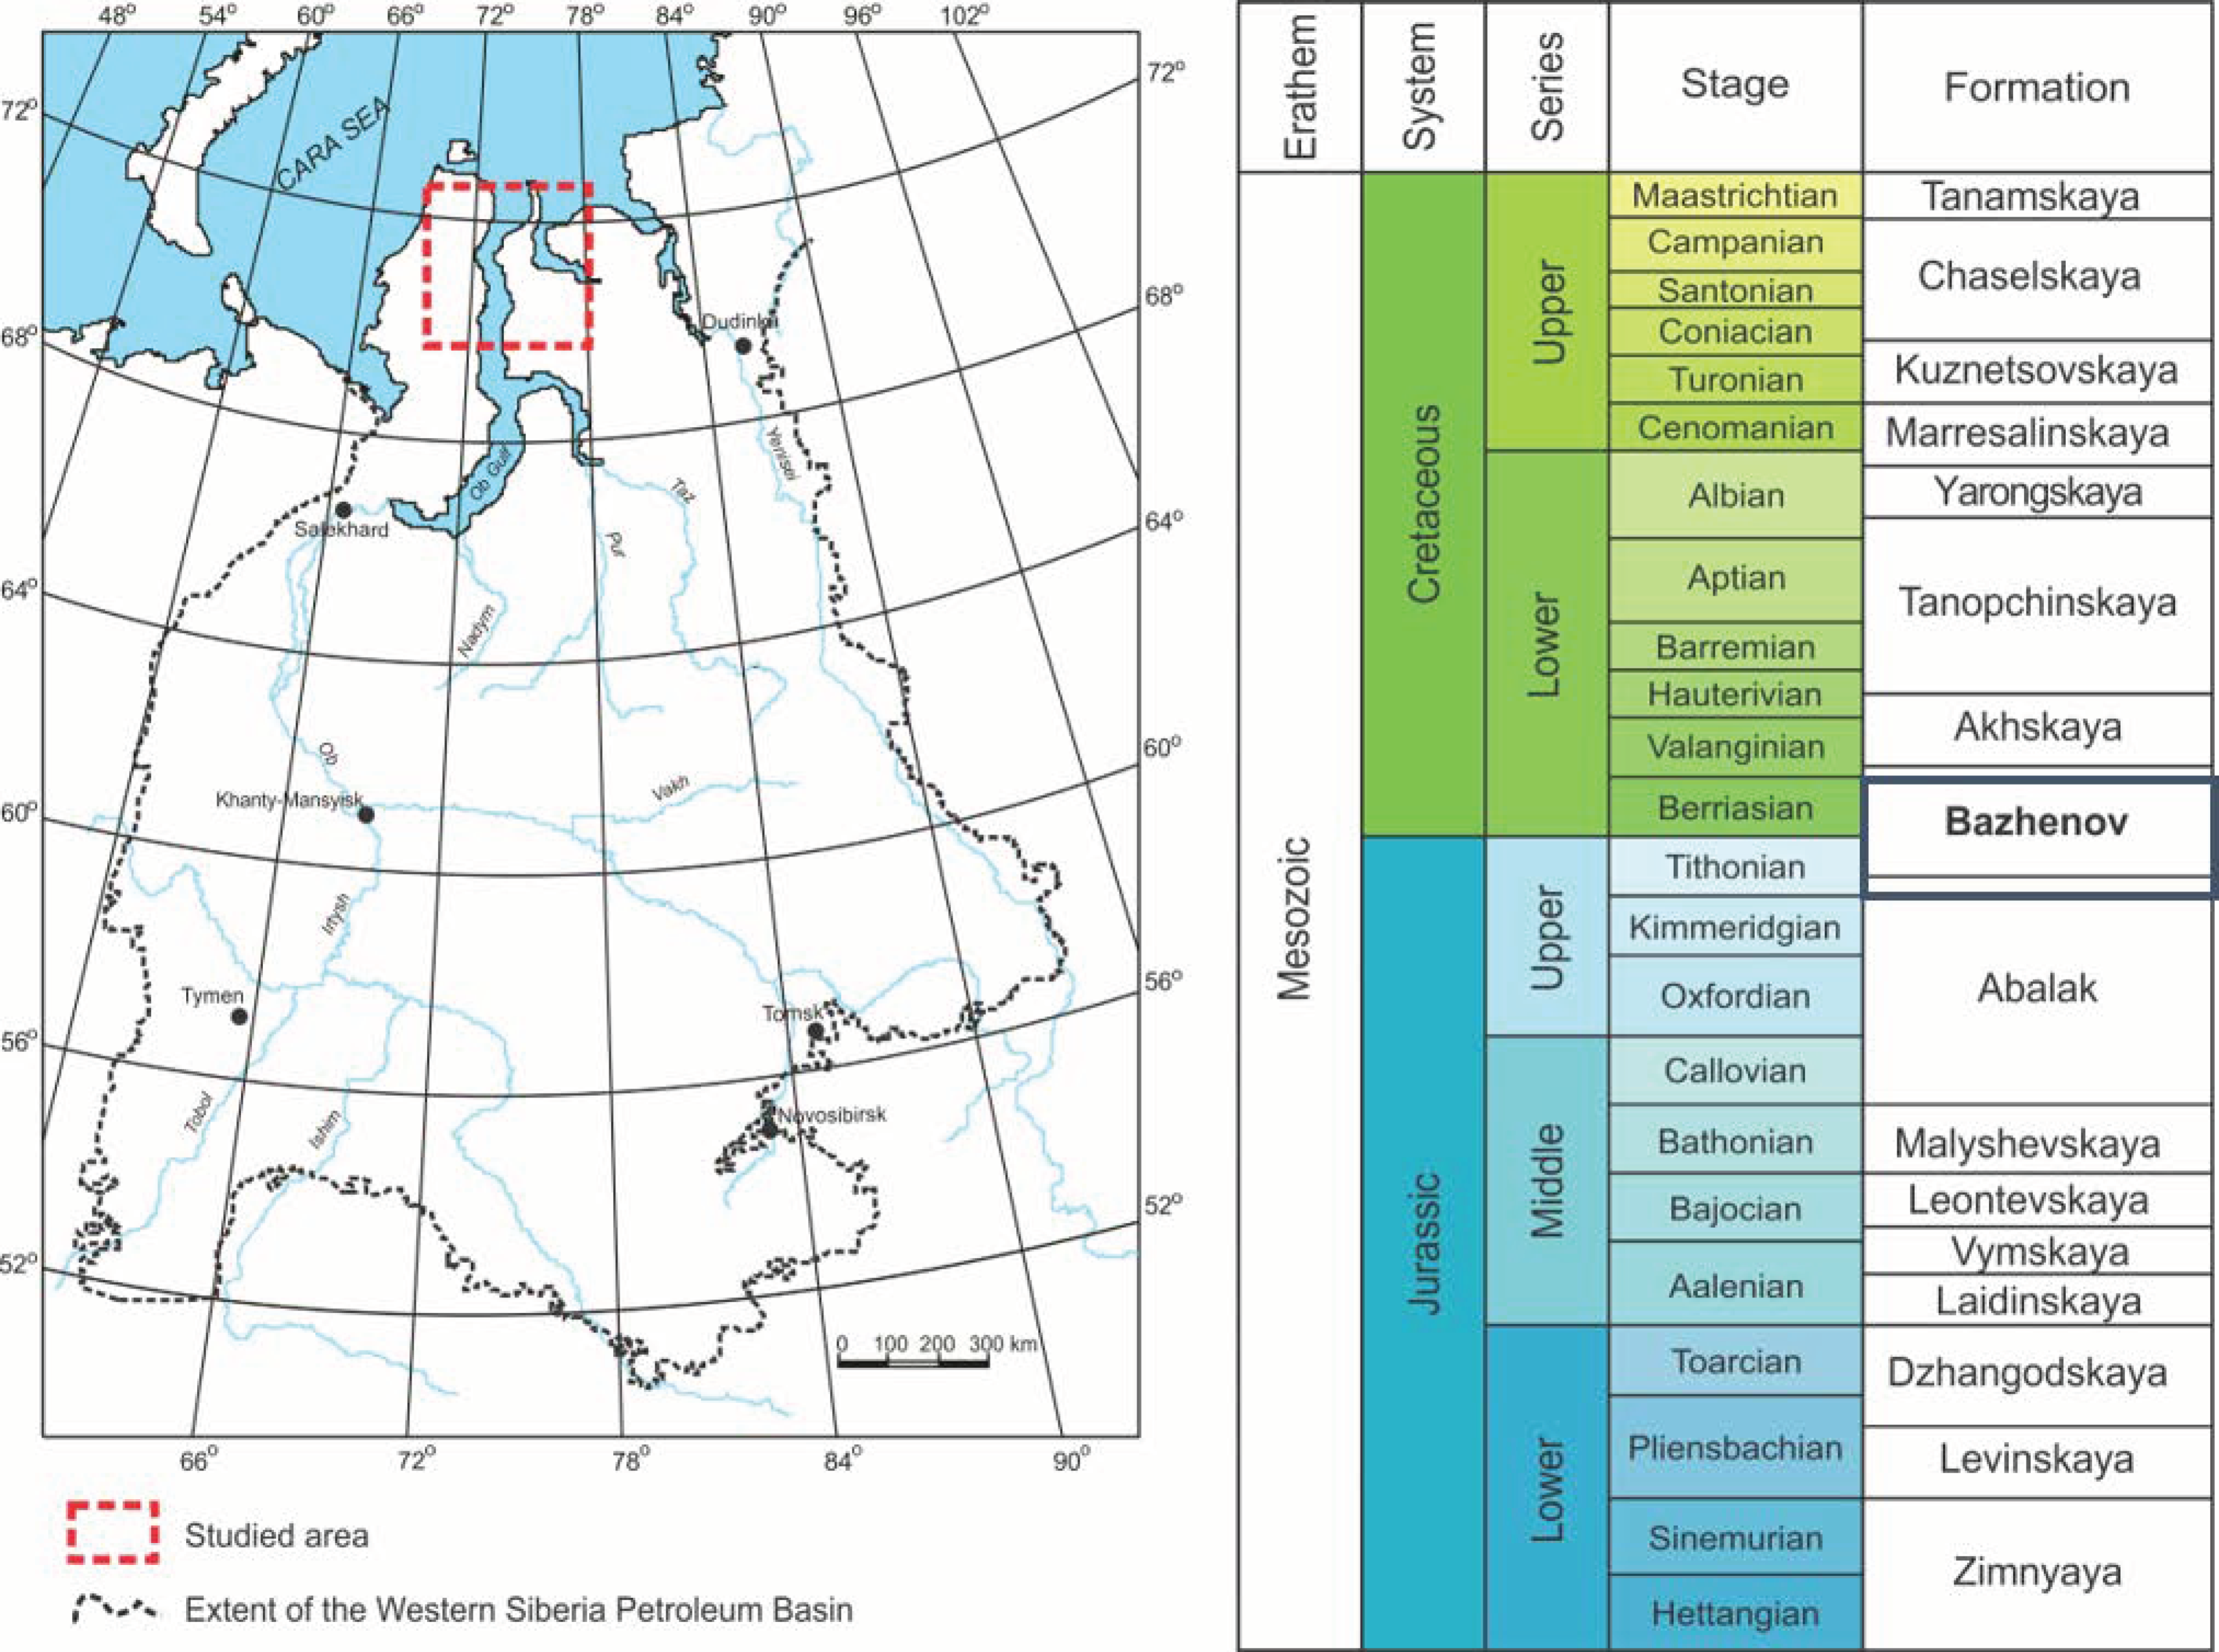
2. Geological Setting
3. Samples and Methods
4. Results and Discussion
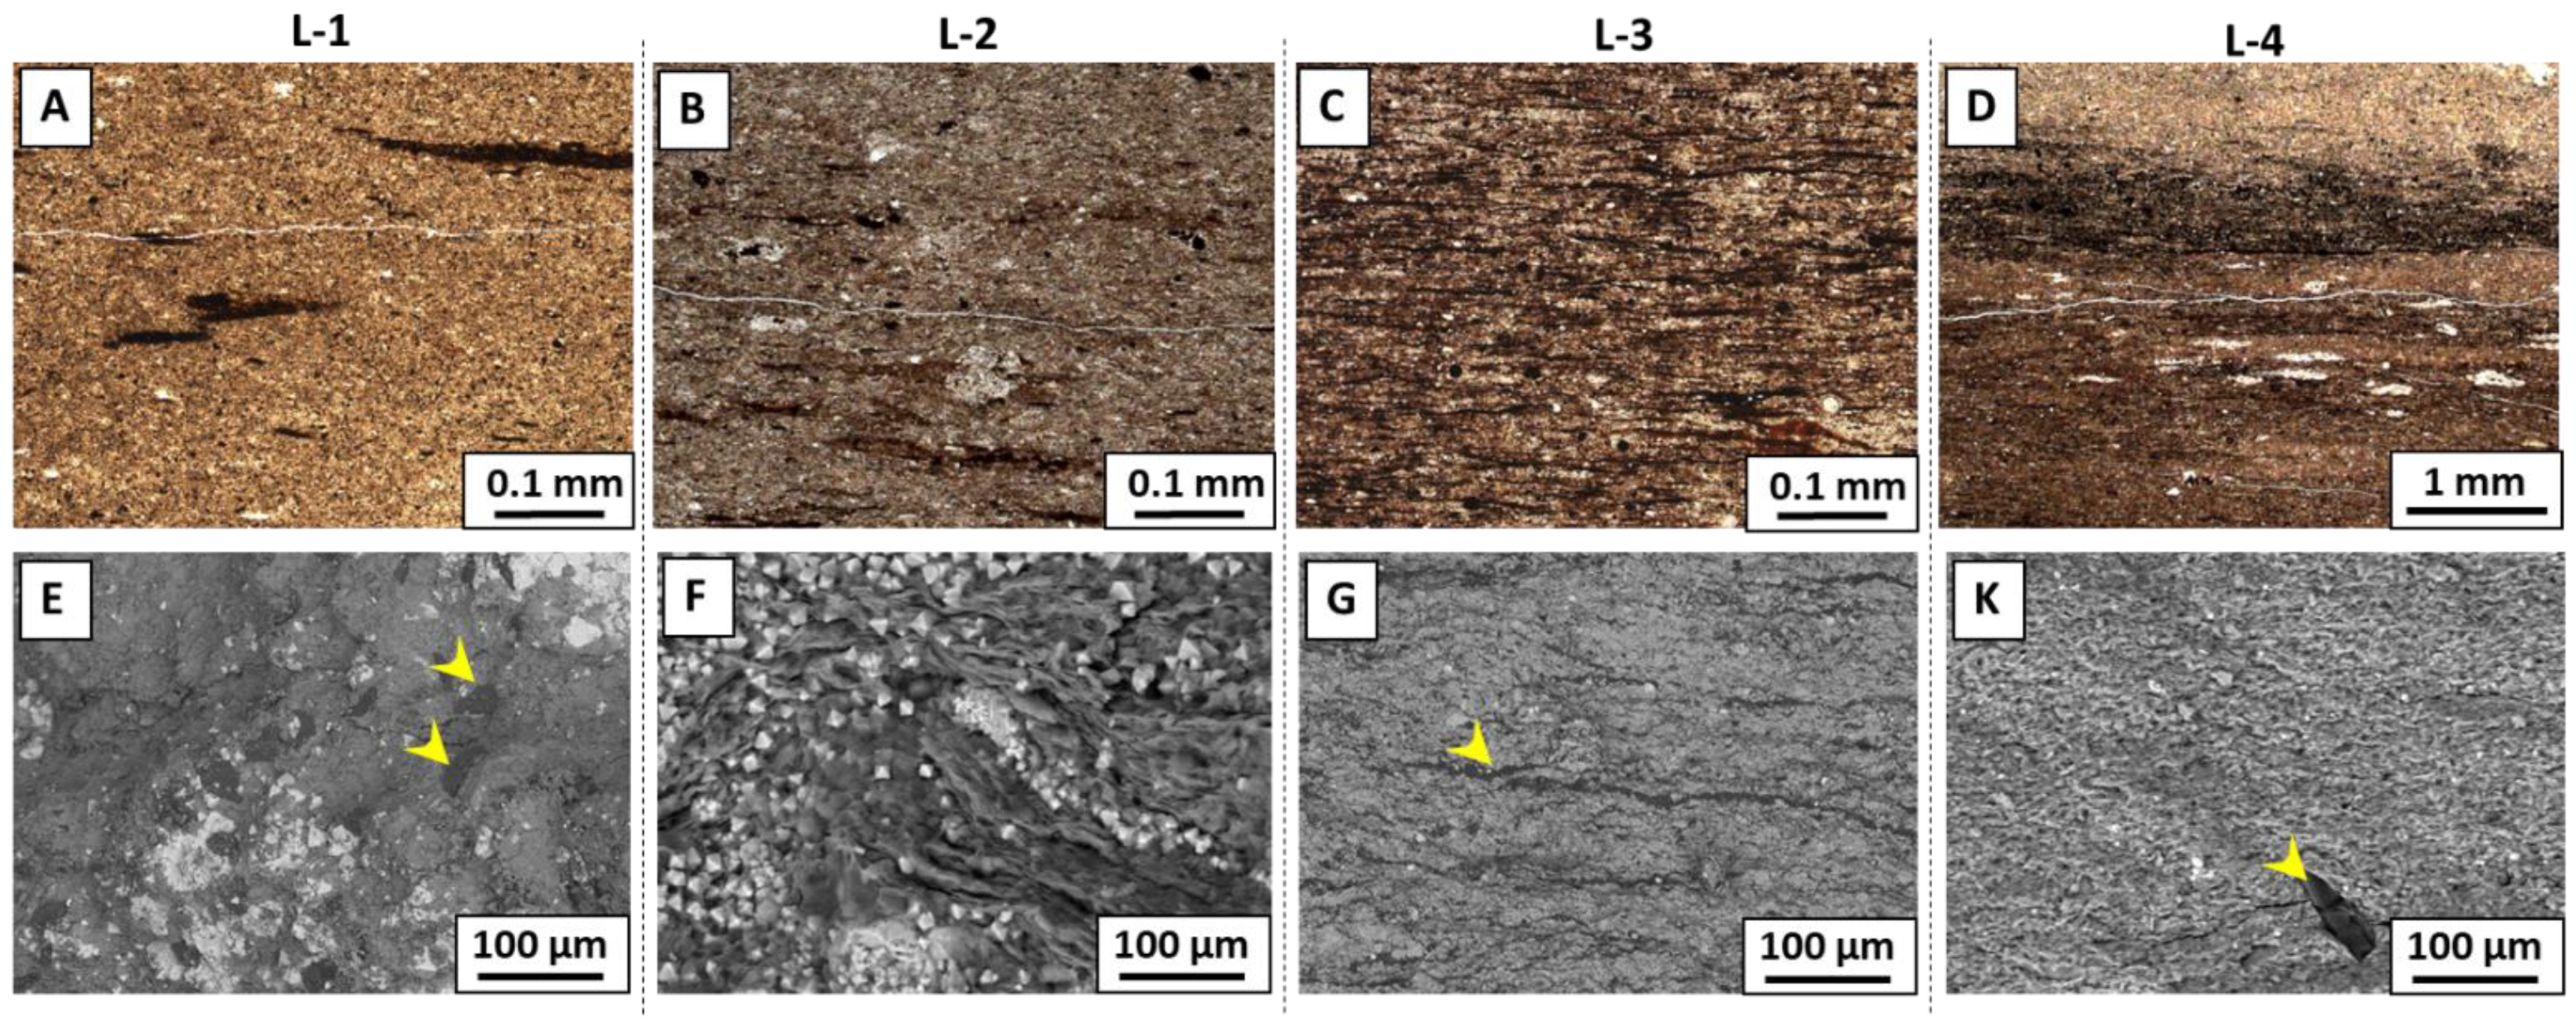
4.1. Lithological Description
- Argillaceous-siliceous massive mudstone with bioturbation (L-1): The rocks are bioturbated, and often pyritized. The average TOC content according to pyrolysis data is 2–3 wt.%.
- Argillaceous-siliceous indistinctly laminated mudstone (L-2): Rocks without pronounced lamination at the micro- and macroscopic levels. The average TOC content is 4–5 wt.%.
- Argillaceous-siliceous organic-rich mudstone with planar microscale lamination (L-3): A distinctive feature is a pronounced thin lamination, detected only by microscope and coming from the layer-by-layer distribution of organic matter, clay minerals, and siliceous components. The average TOC content is 7–8 wt.%.
- Argillaceous-siliceous mudstone with thin interlayering of organic-rich and organic-poor laminas and rare bioturbation (L-4): The rocks are characterized by rhythmic formationtal lamination due to the presence of dark gray (enriched in organic matter) and light gray layers, as well as bioturbation. The average TOC content is 2 wt.%.
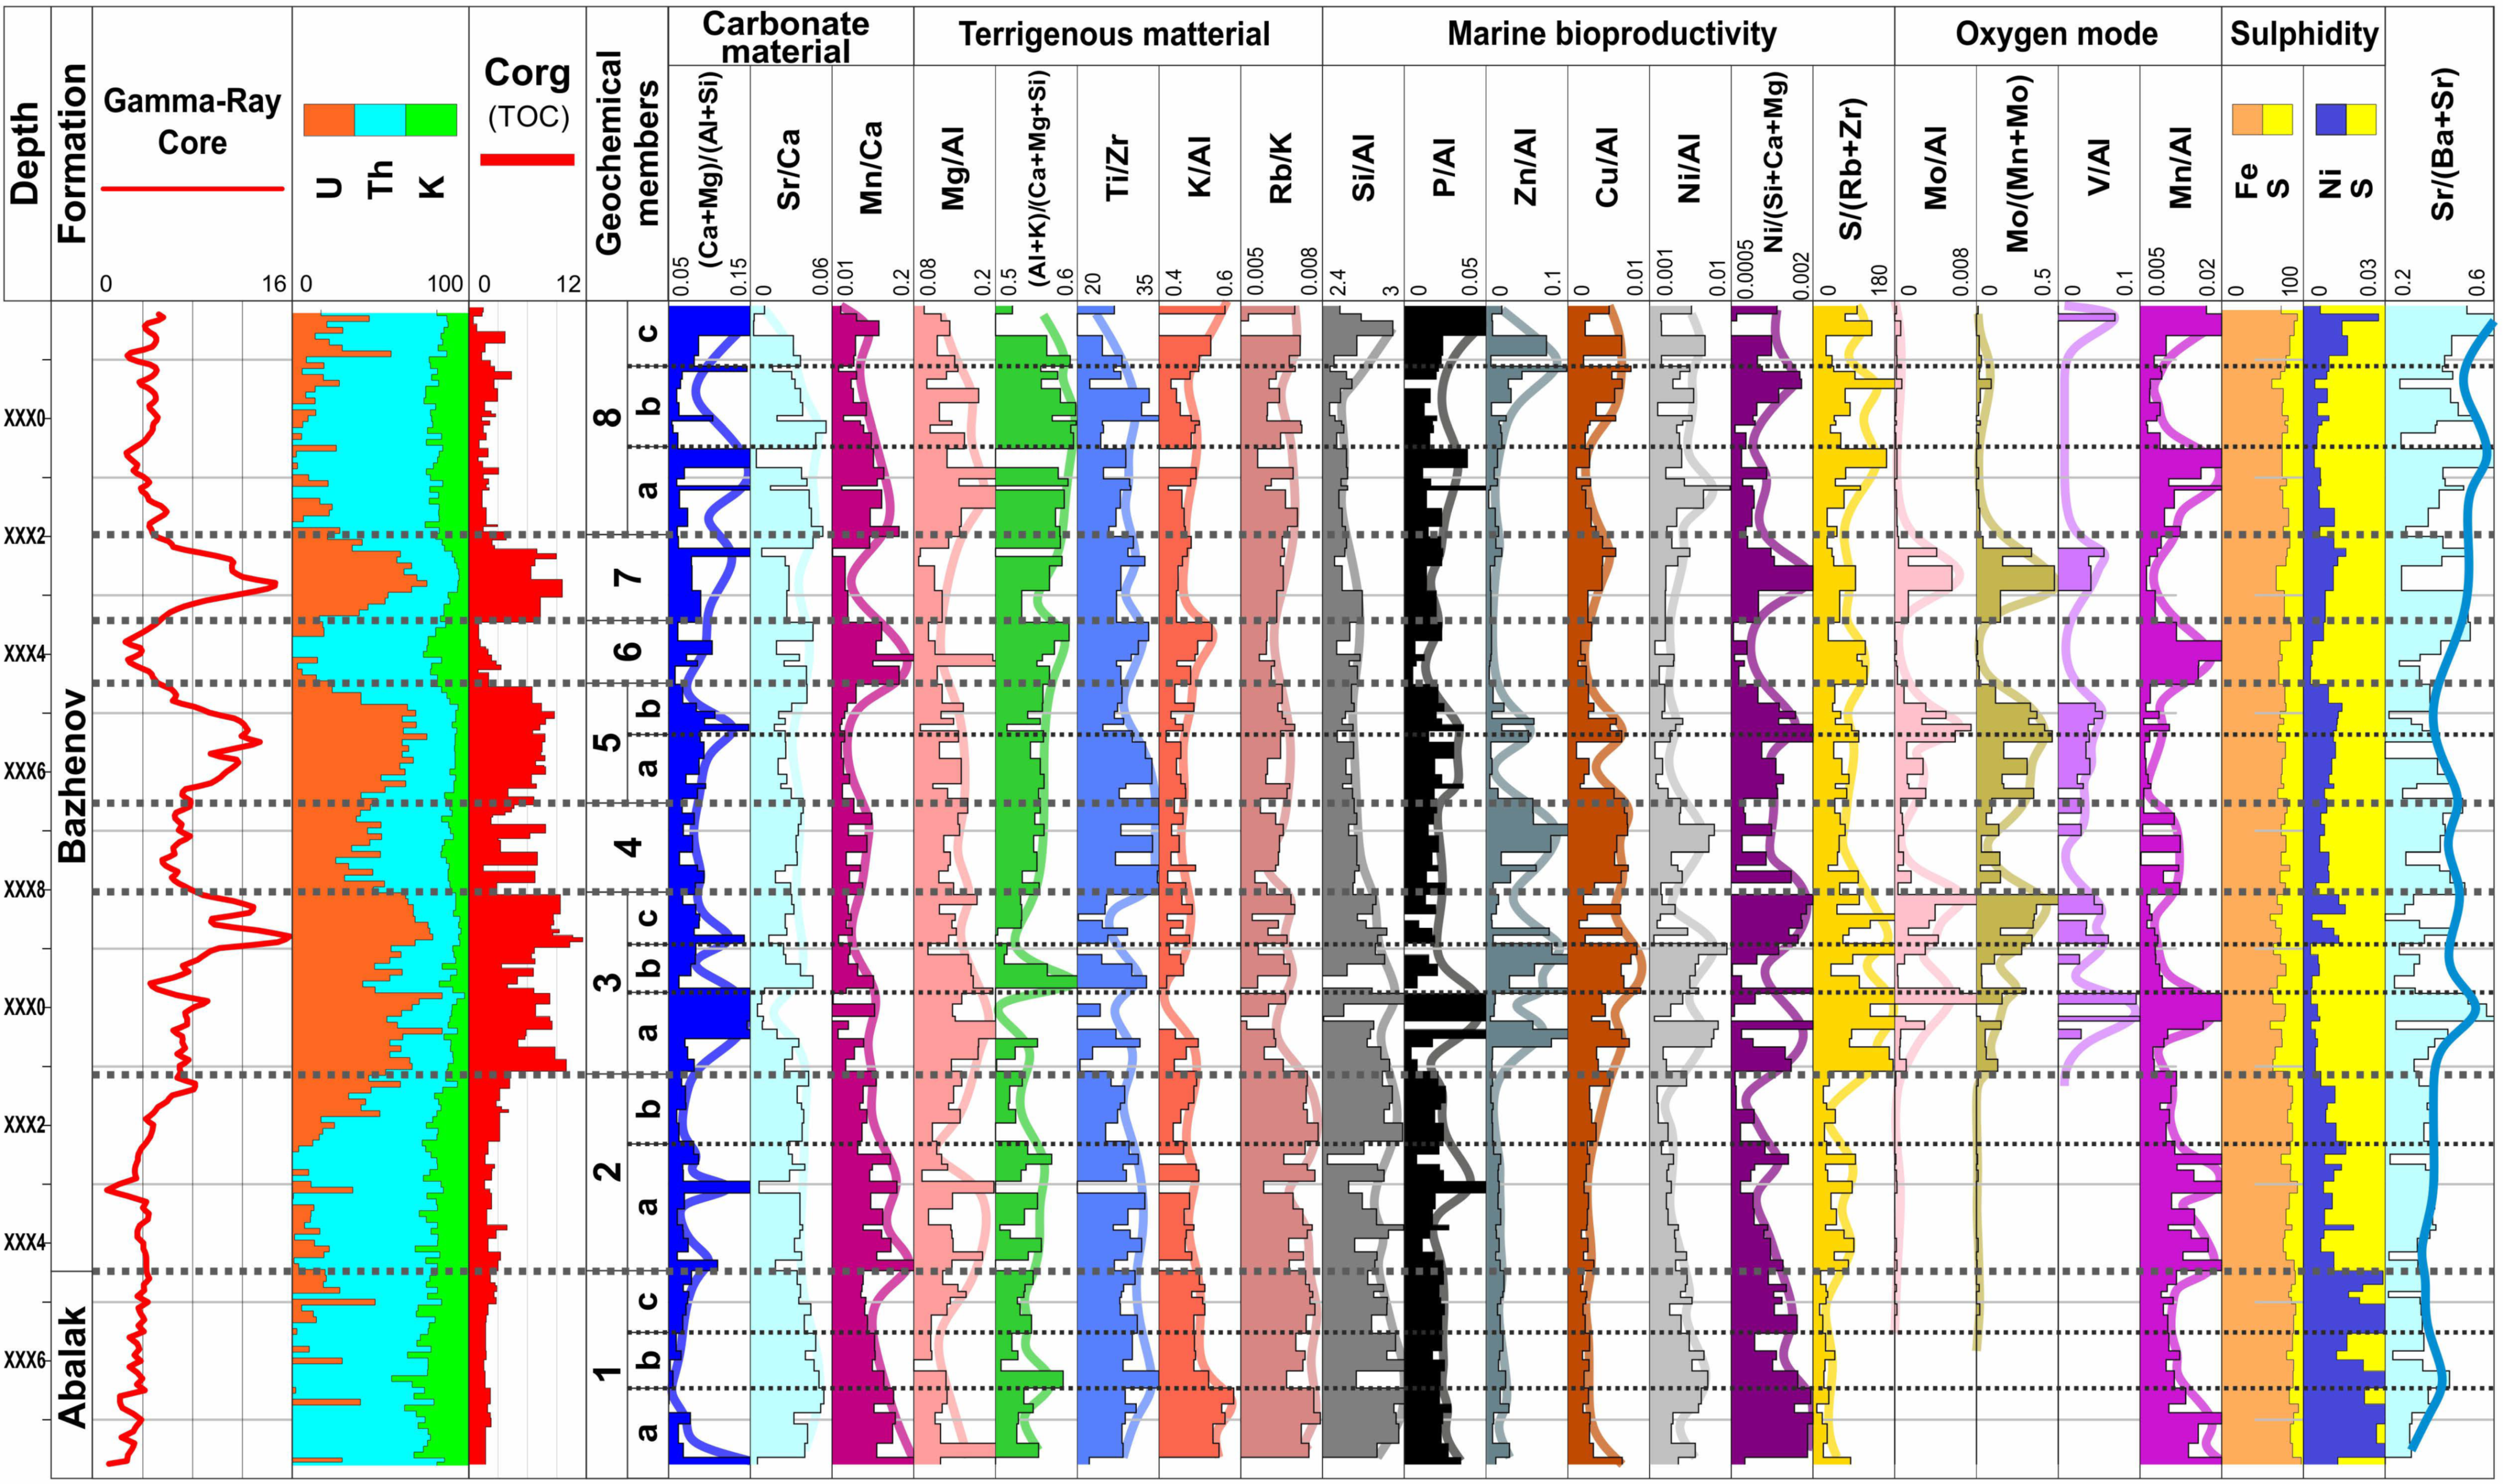
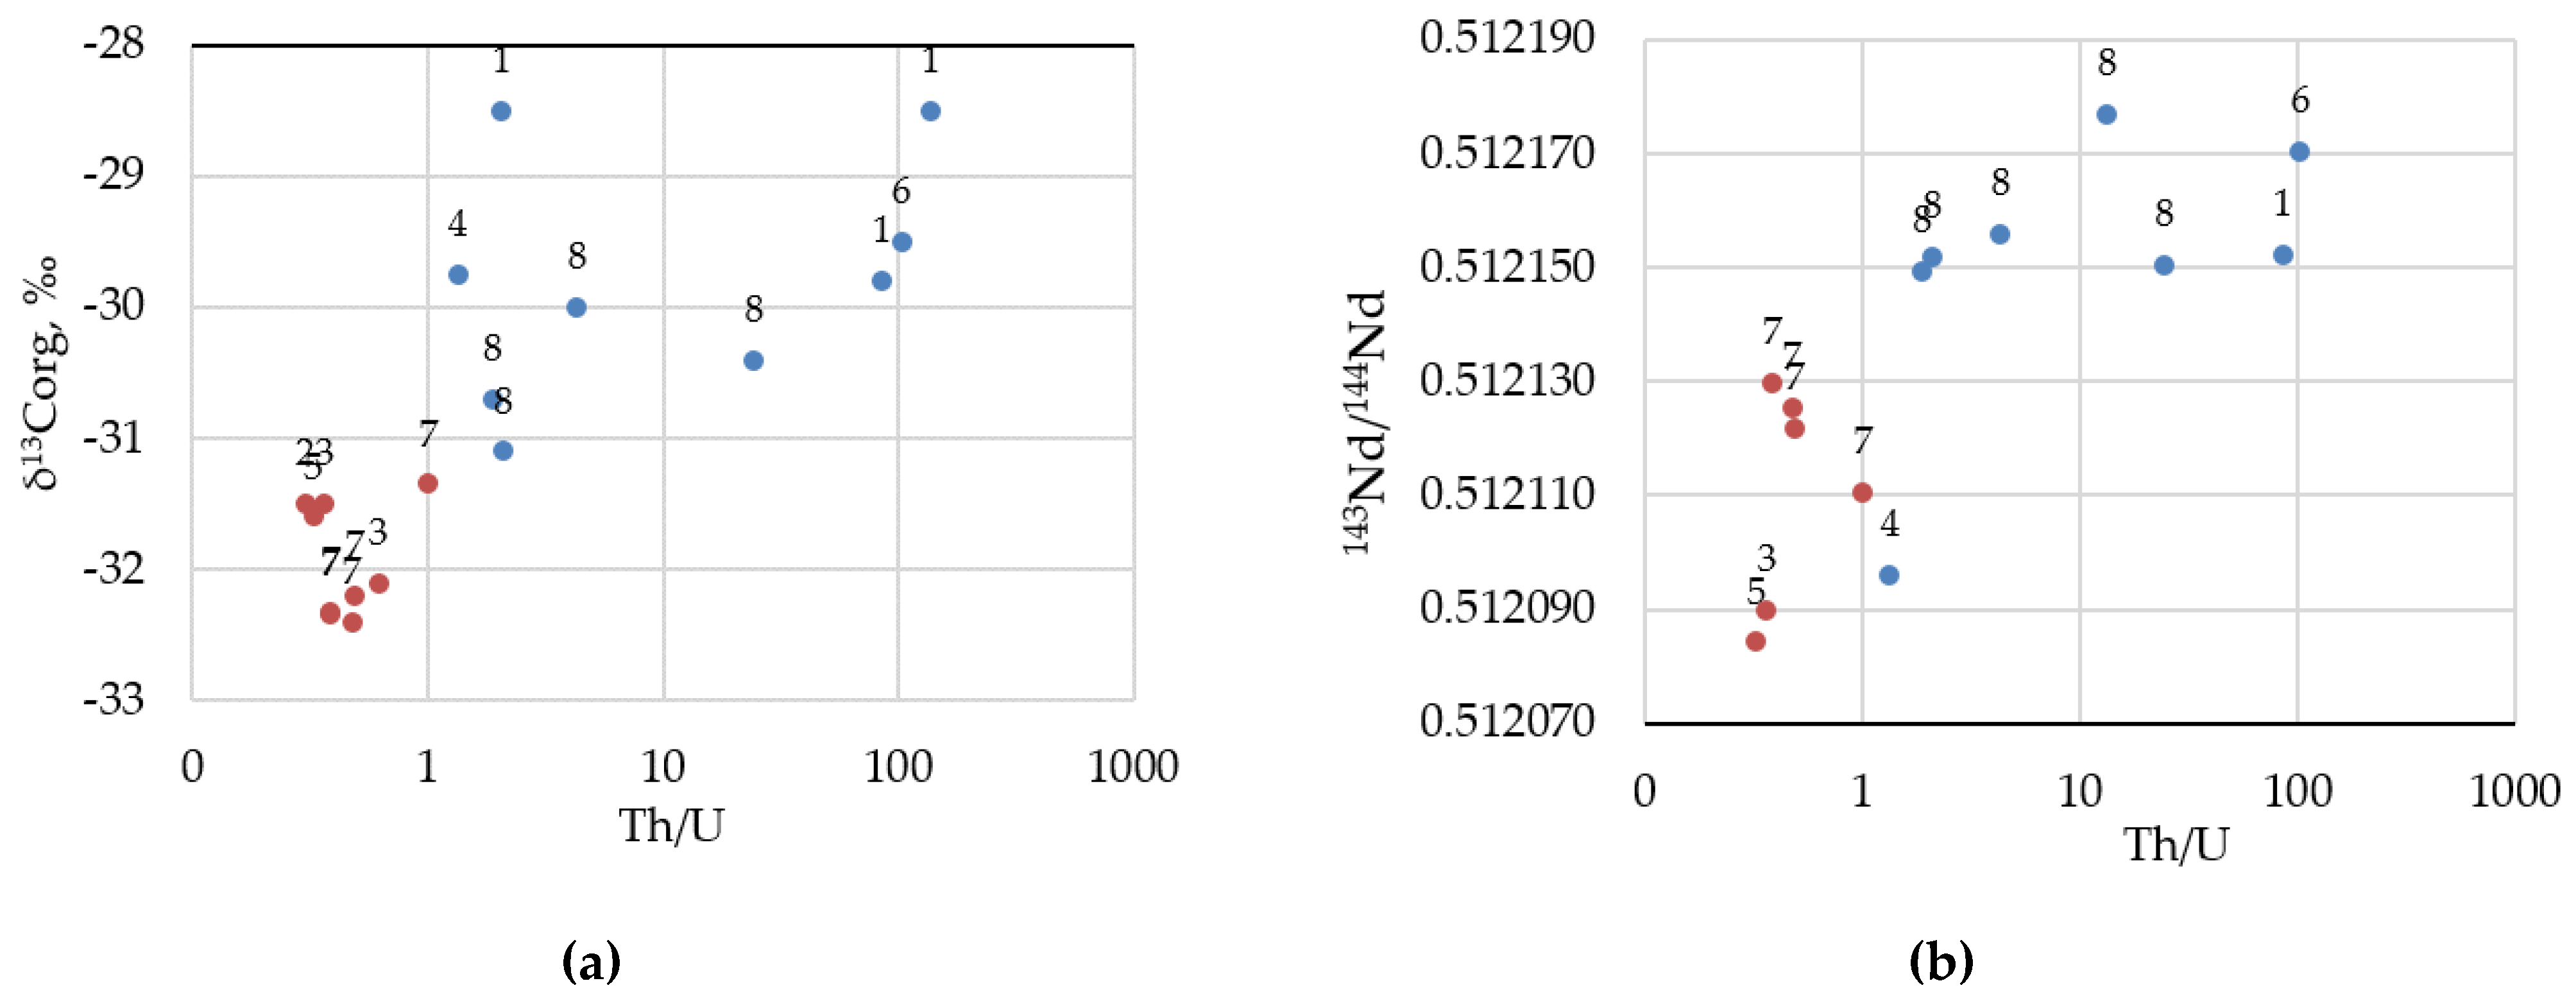
4.2. Major and Trace Element Composition, Sm and Nd Isotopes
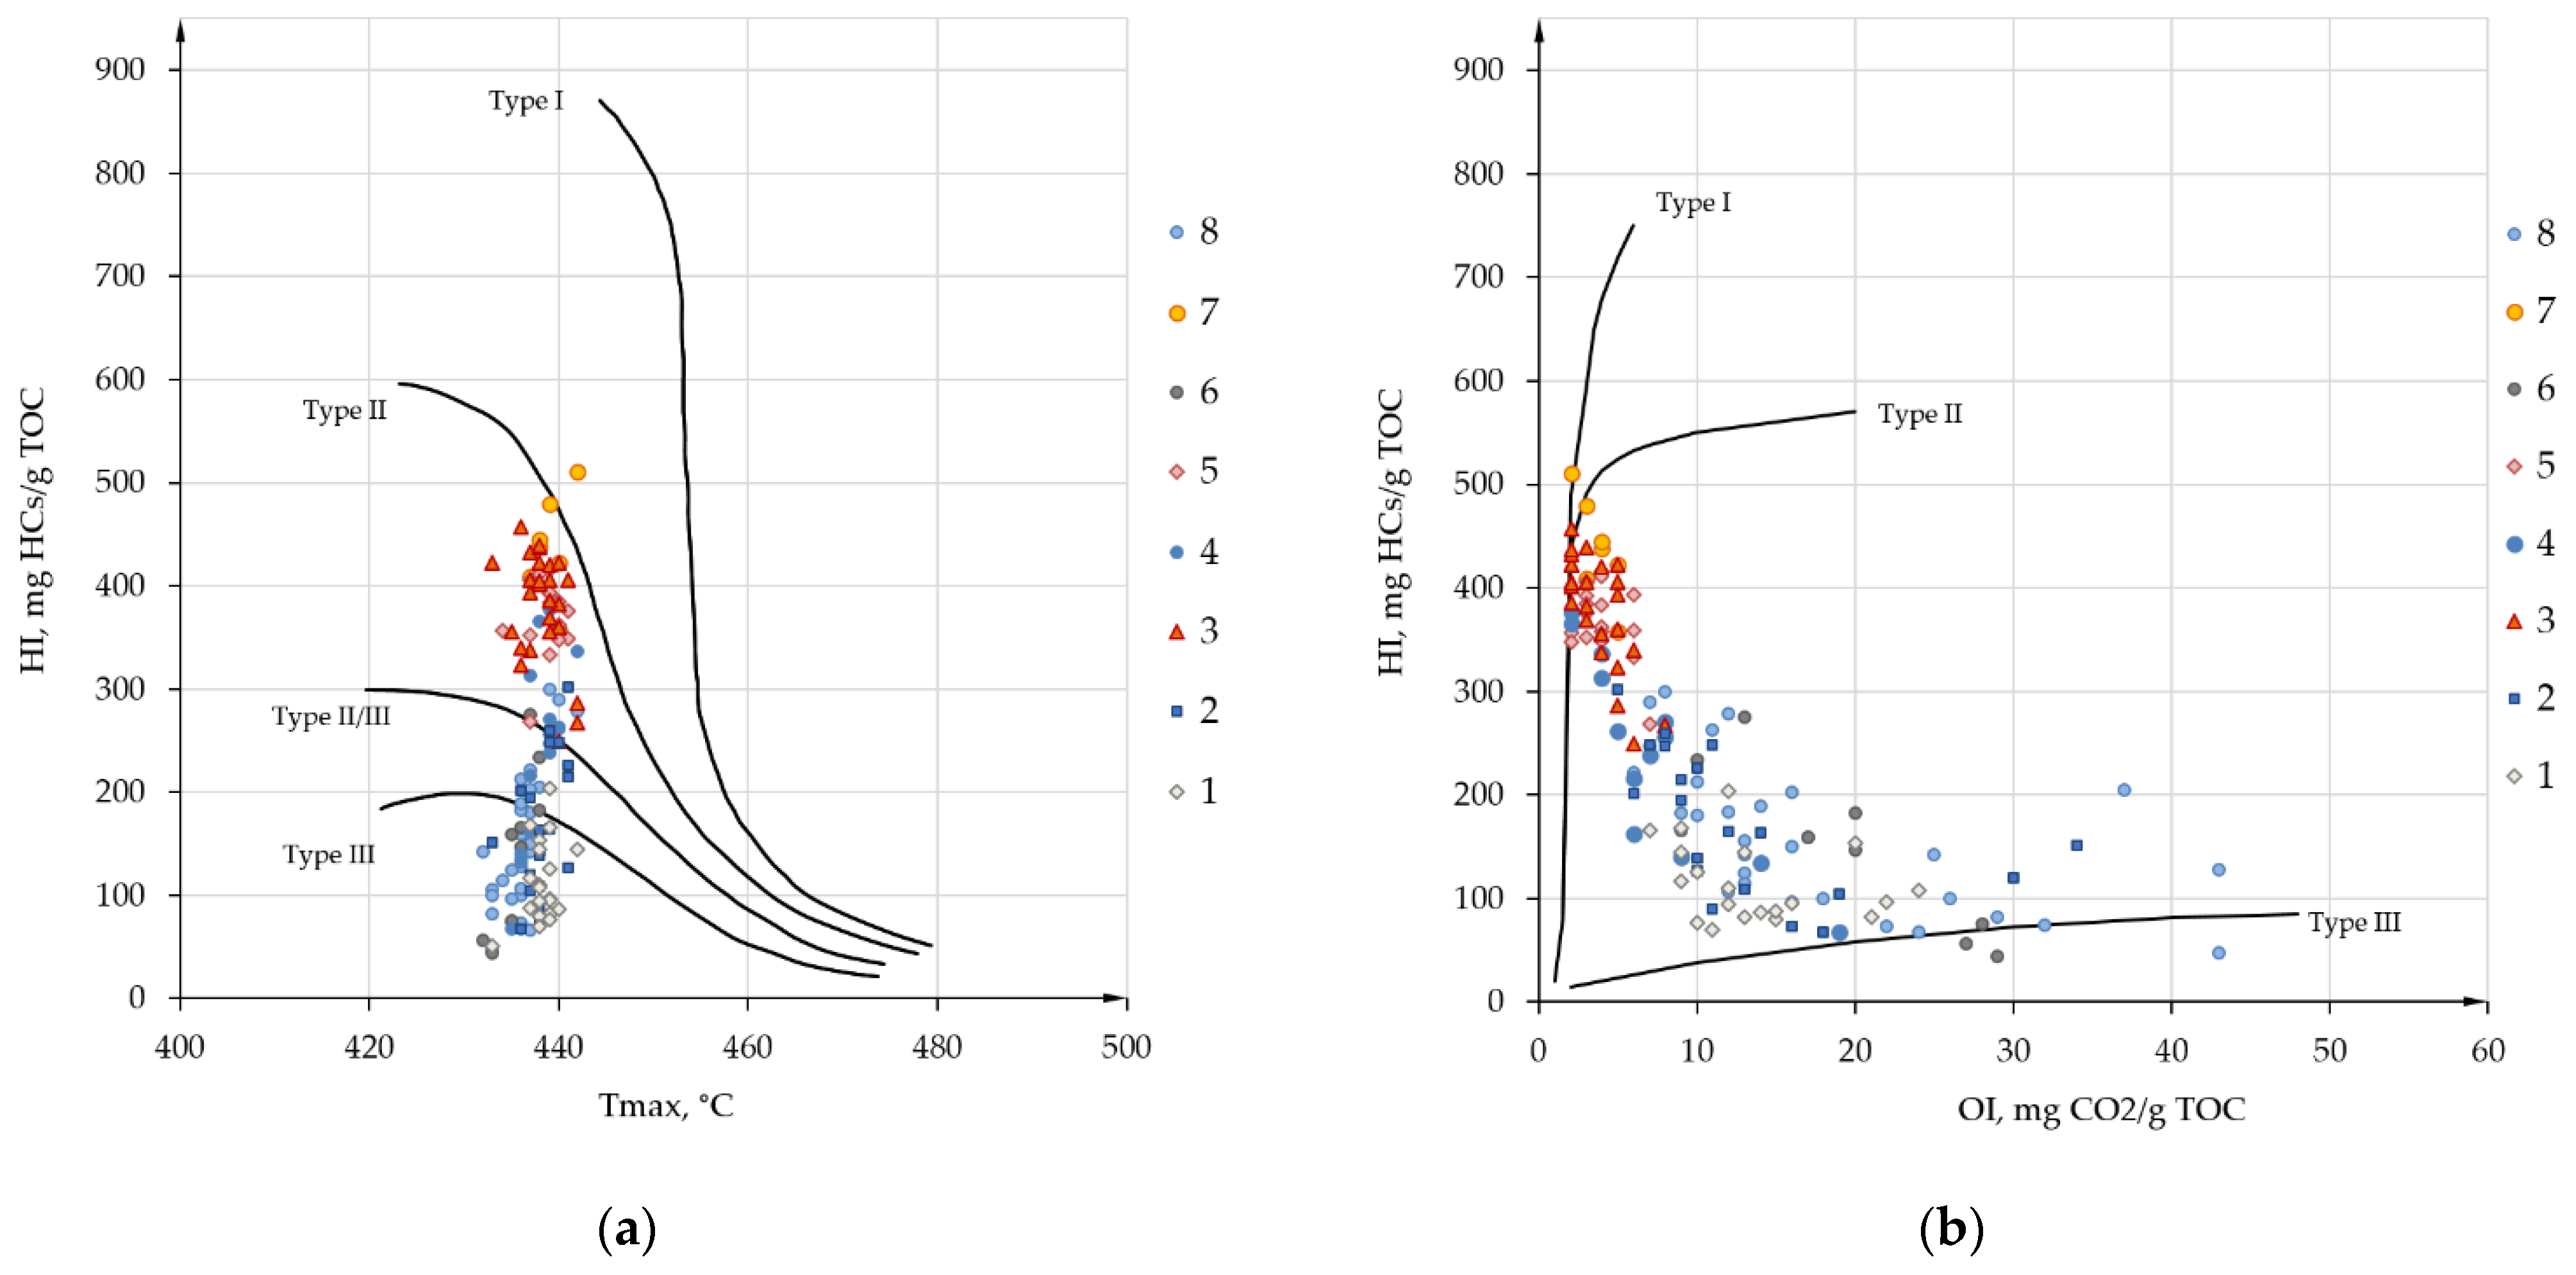
4.3. Source Rock Characterization
4.4. Kerogen Thermal Decomposition Kinetics and Products
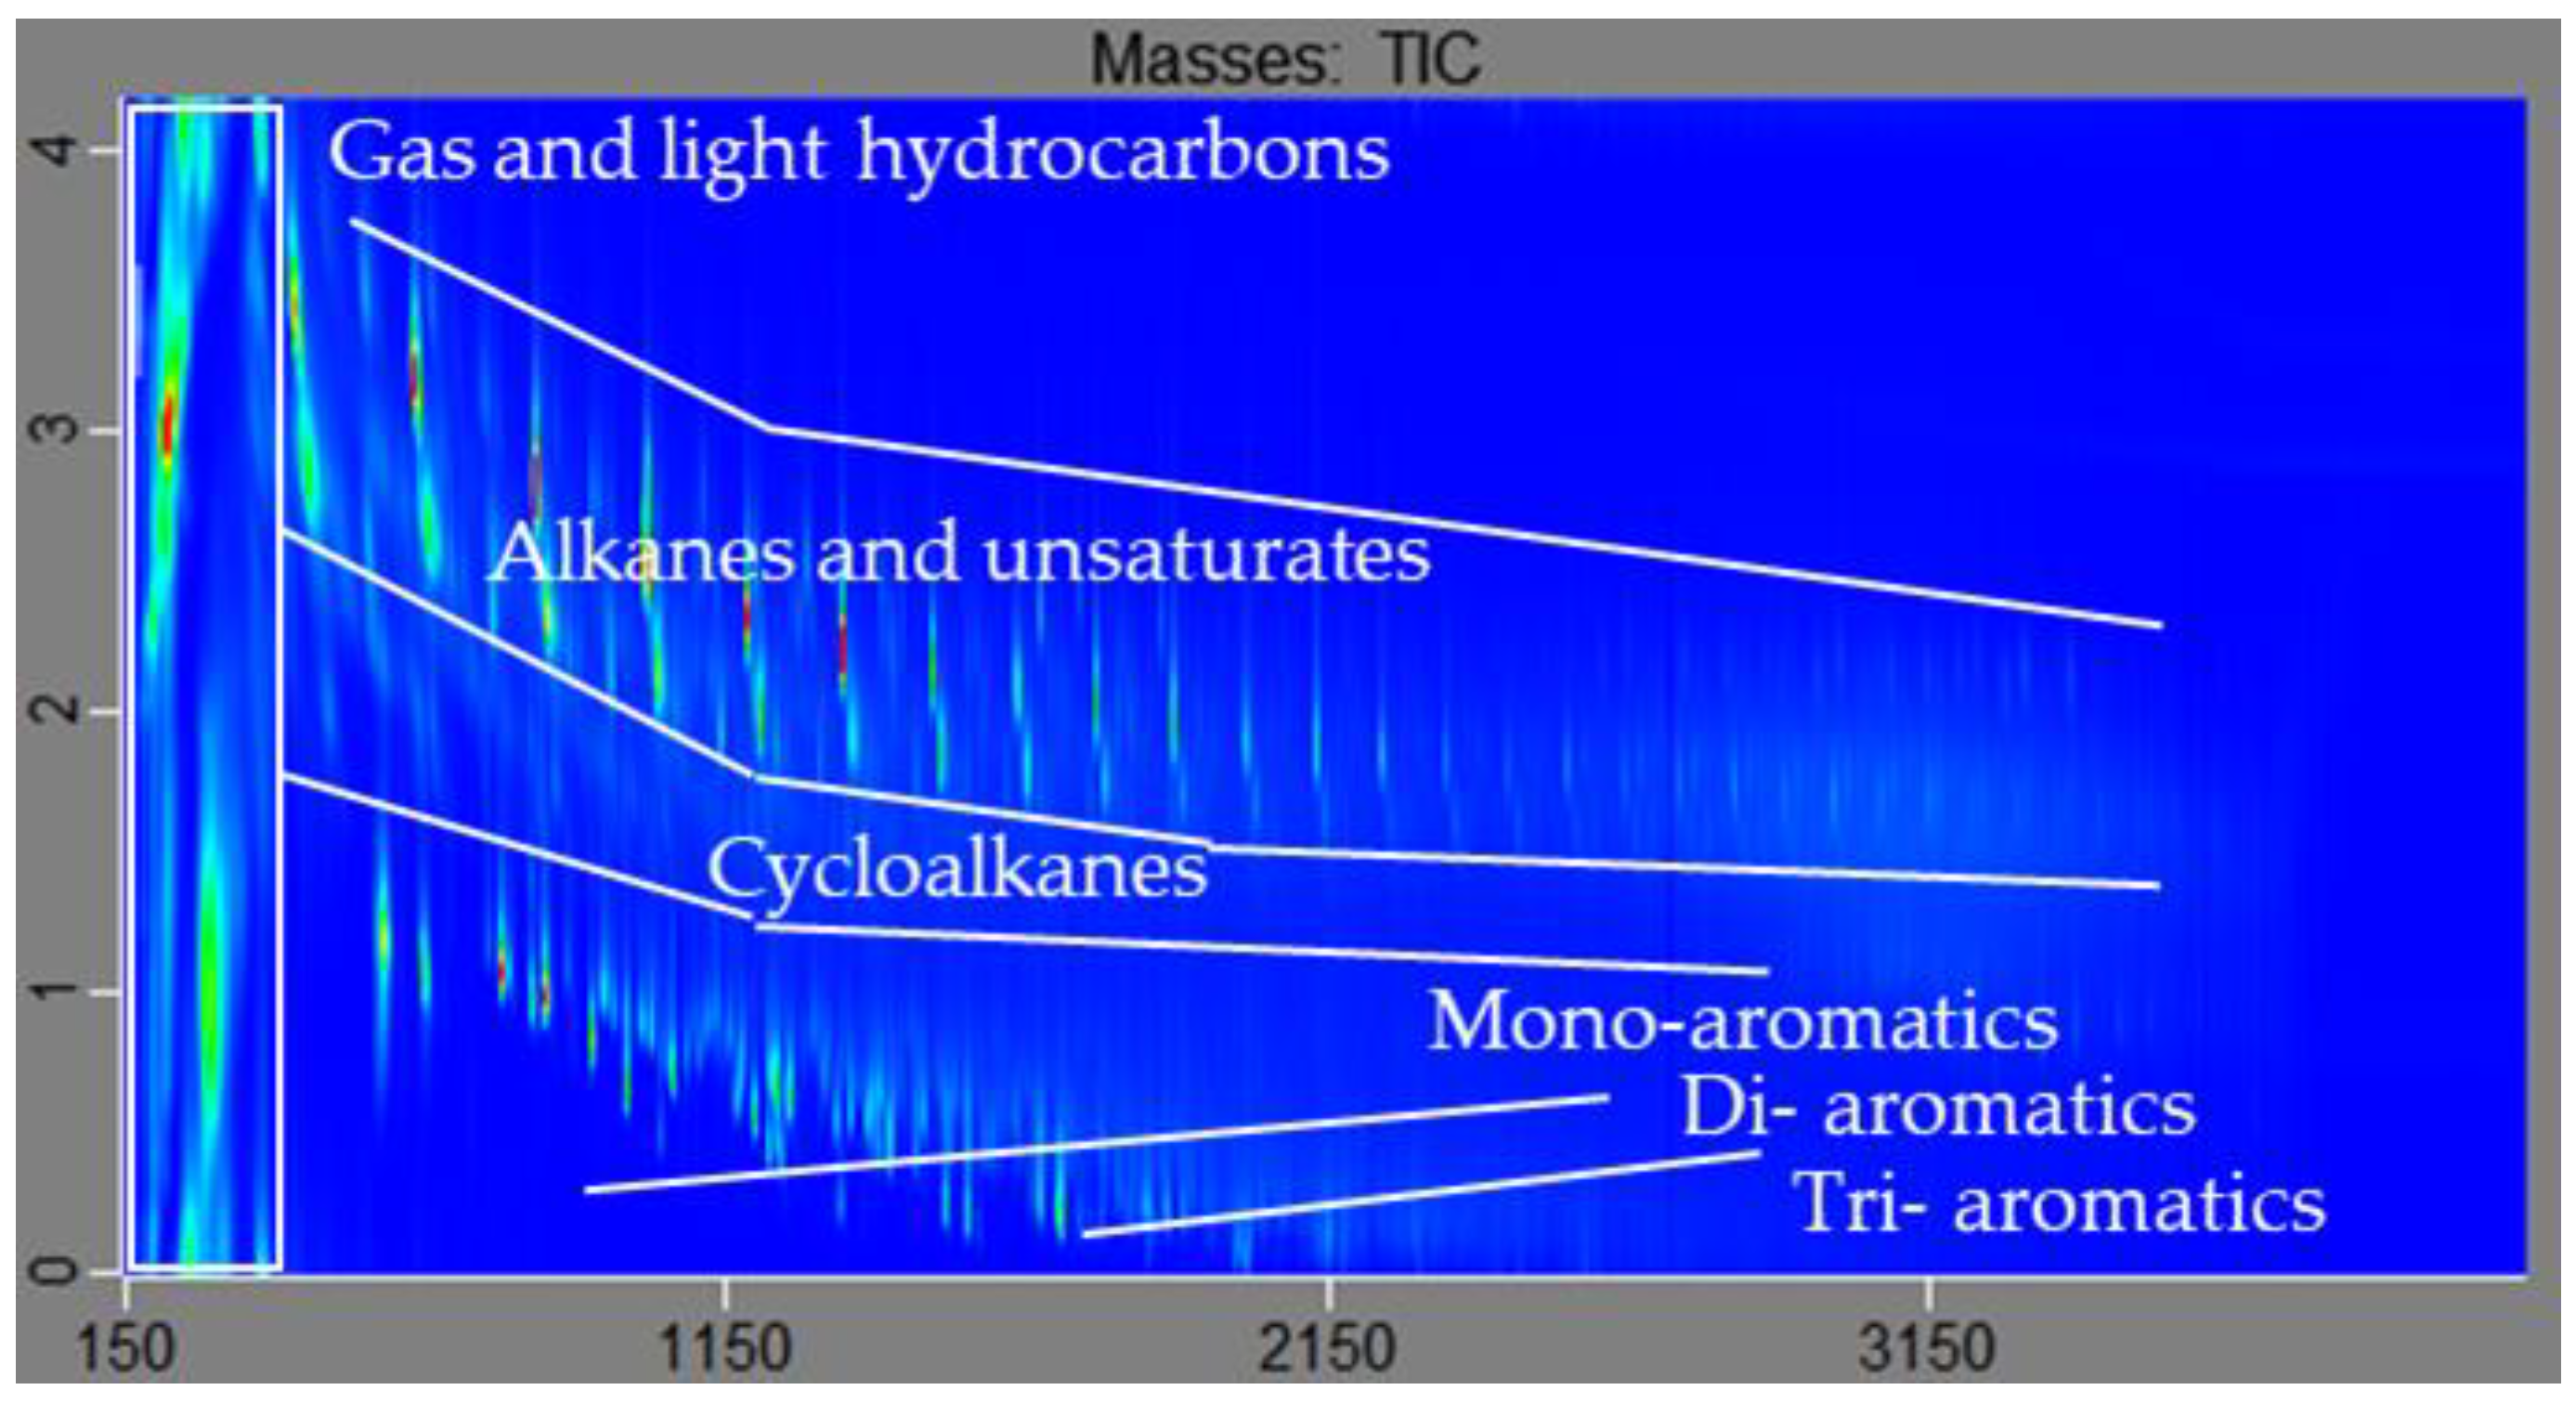
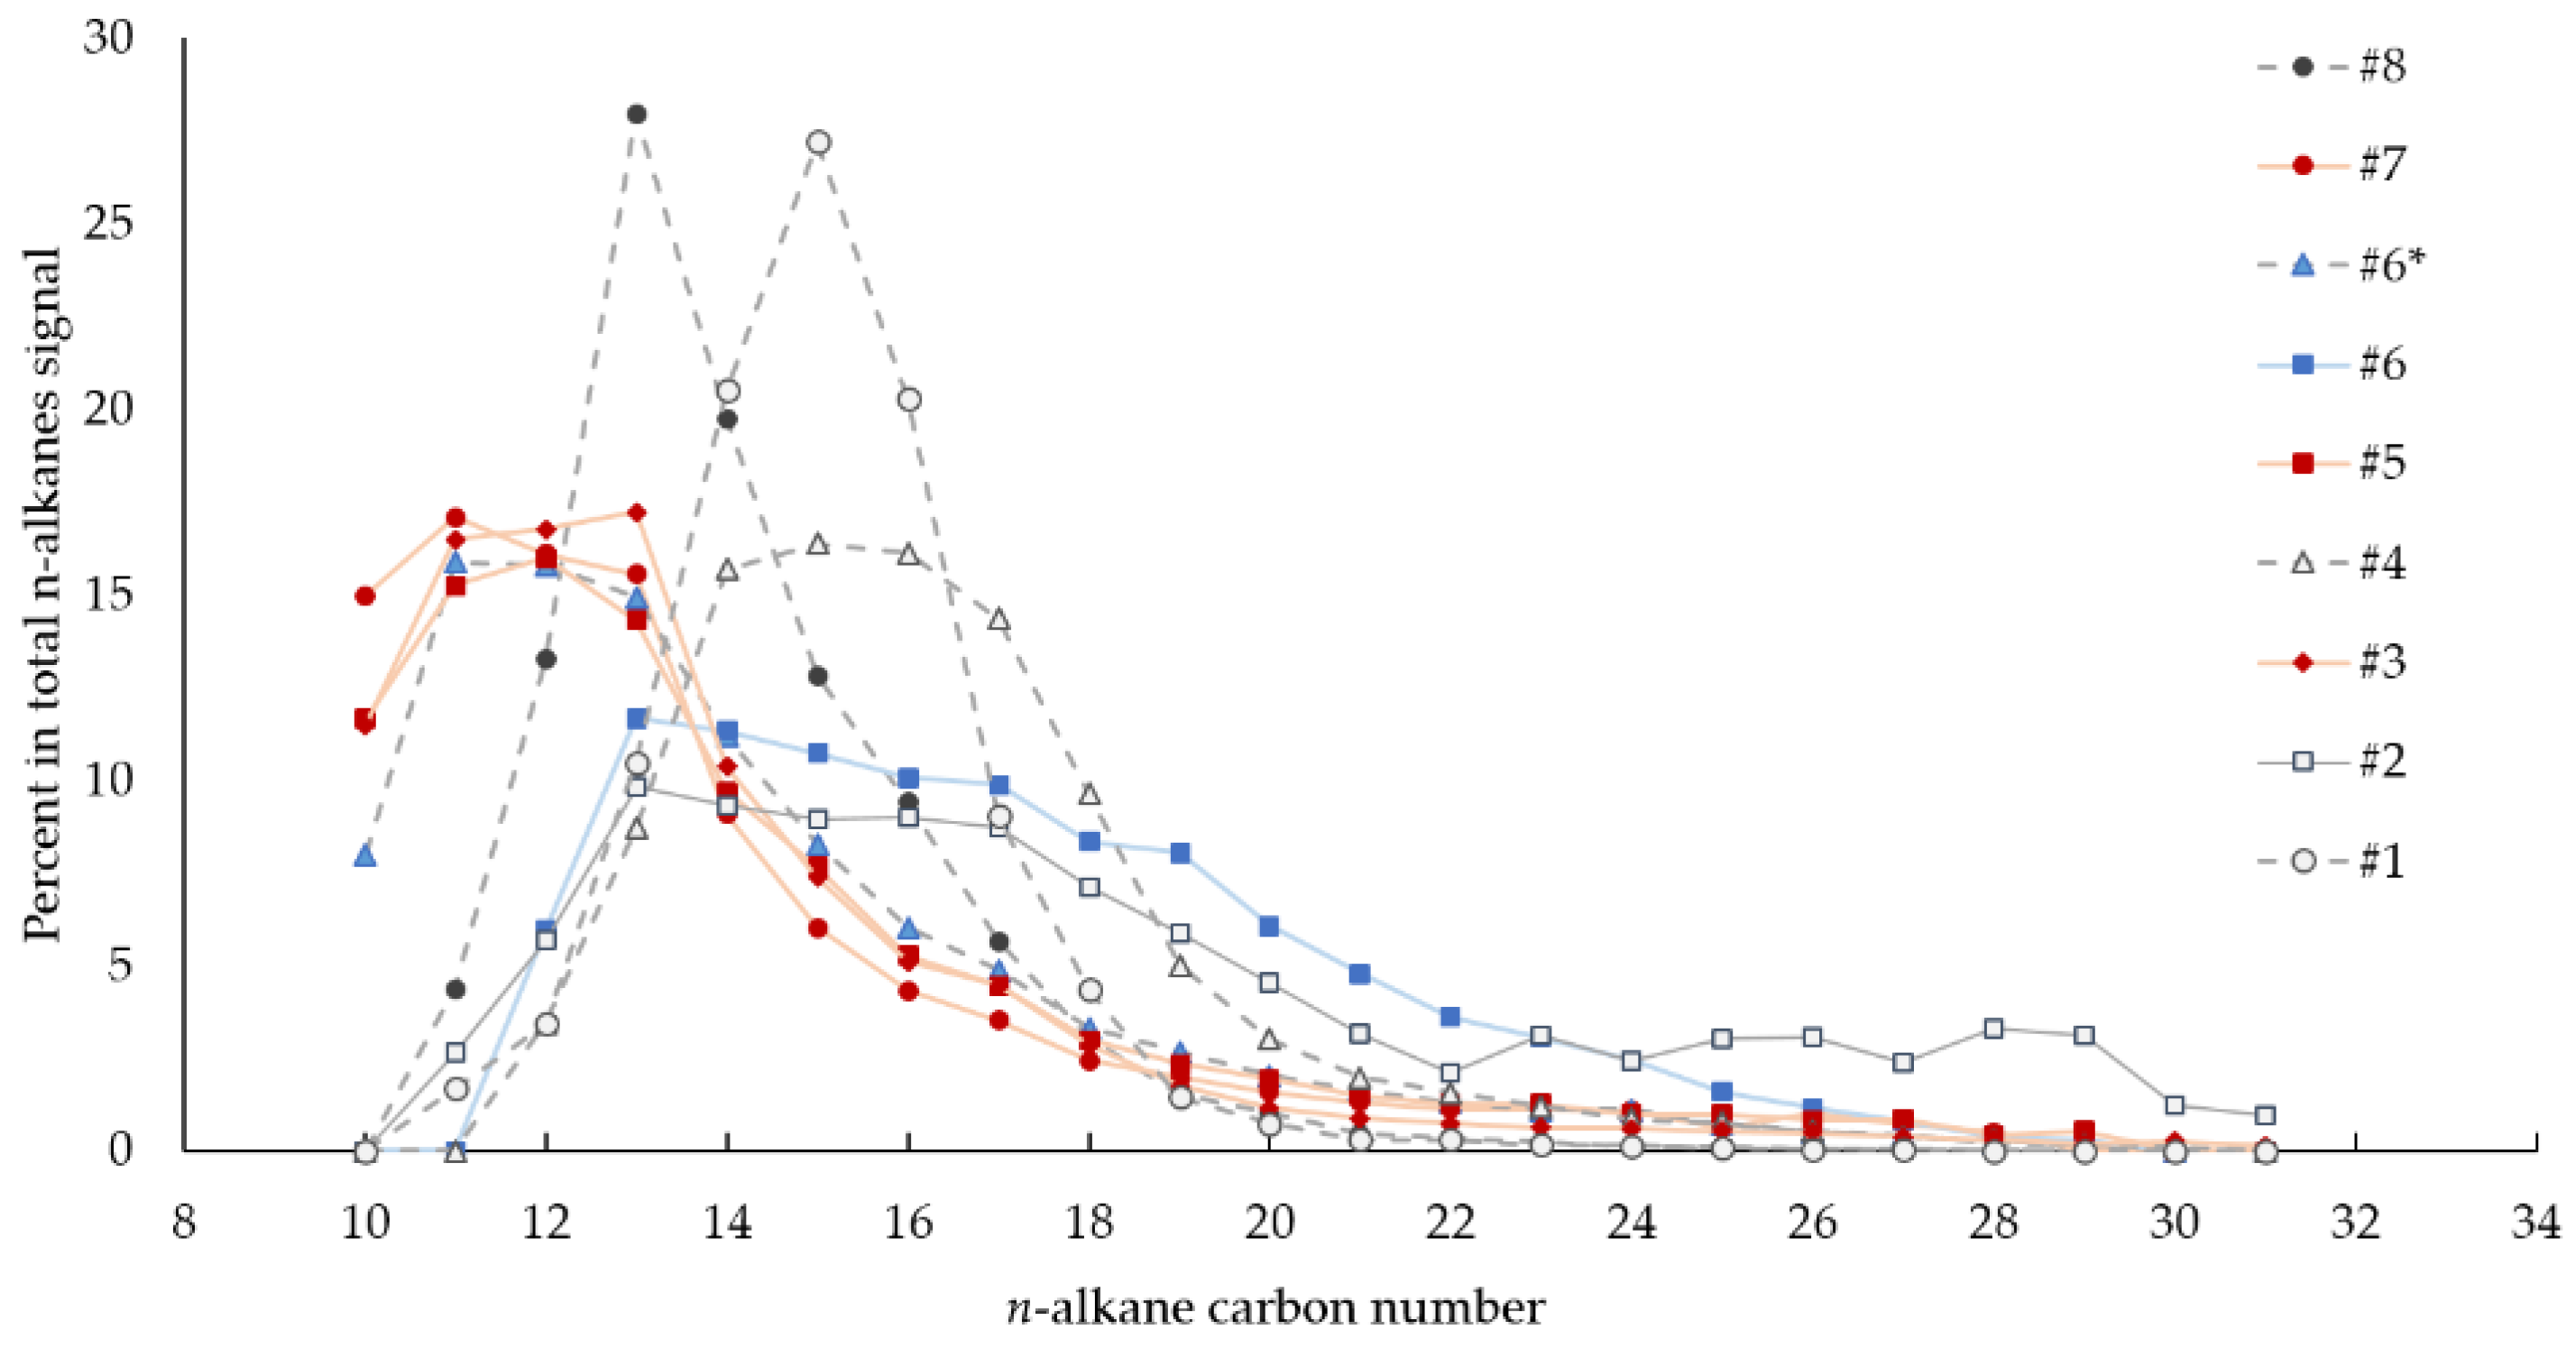
4.5. Thermal Extraction and Biomarker Analysis
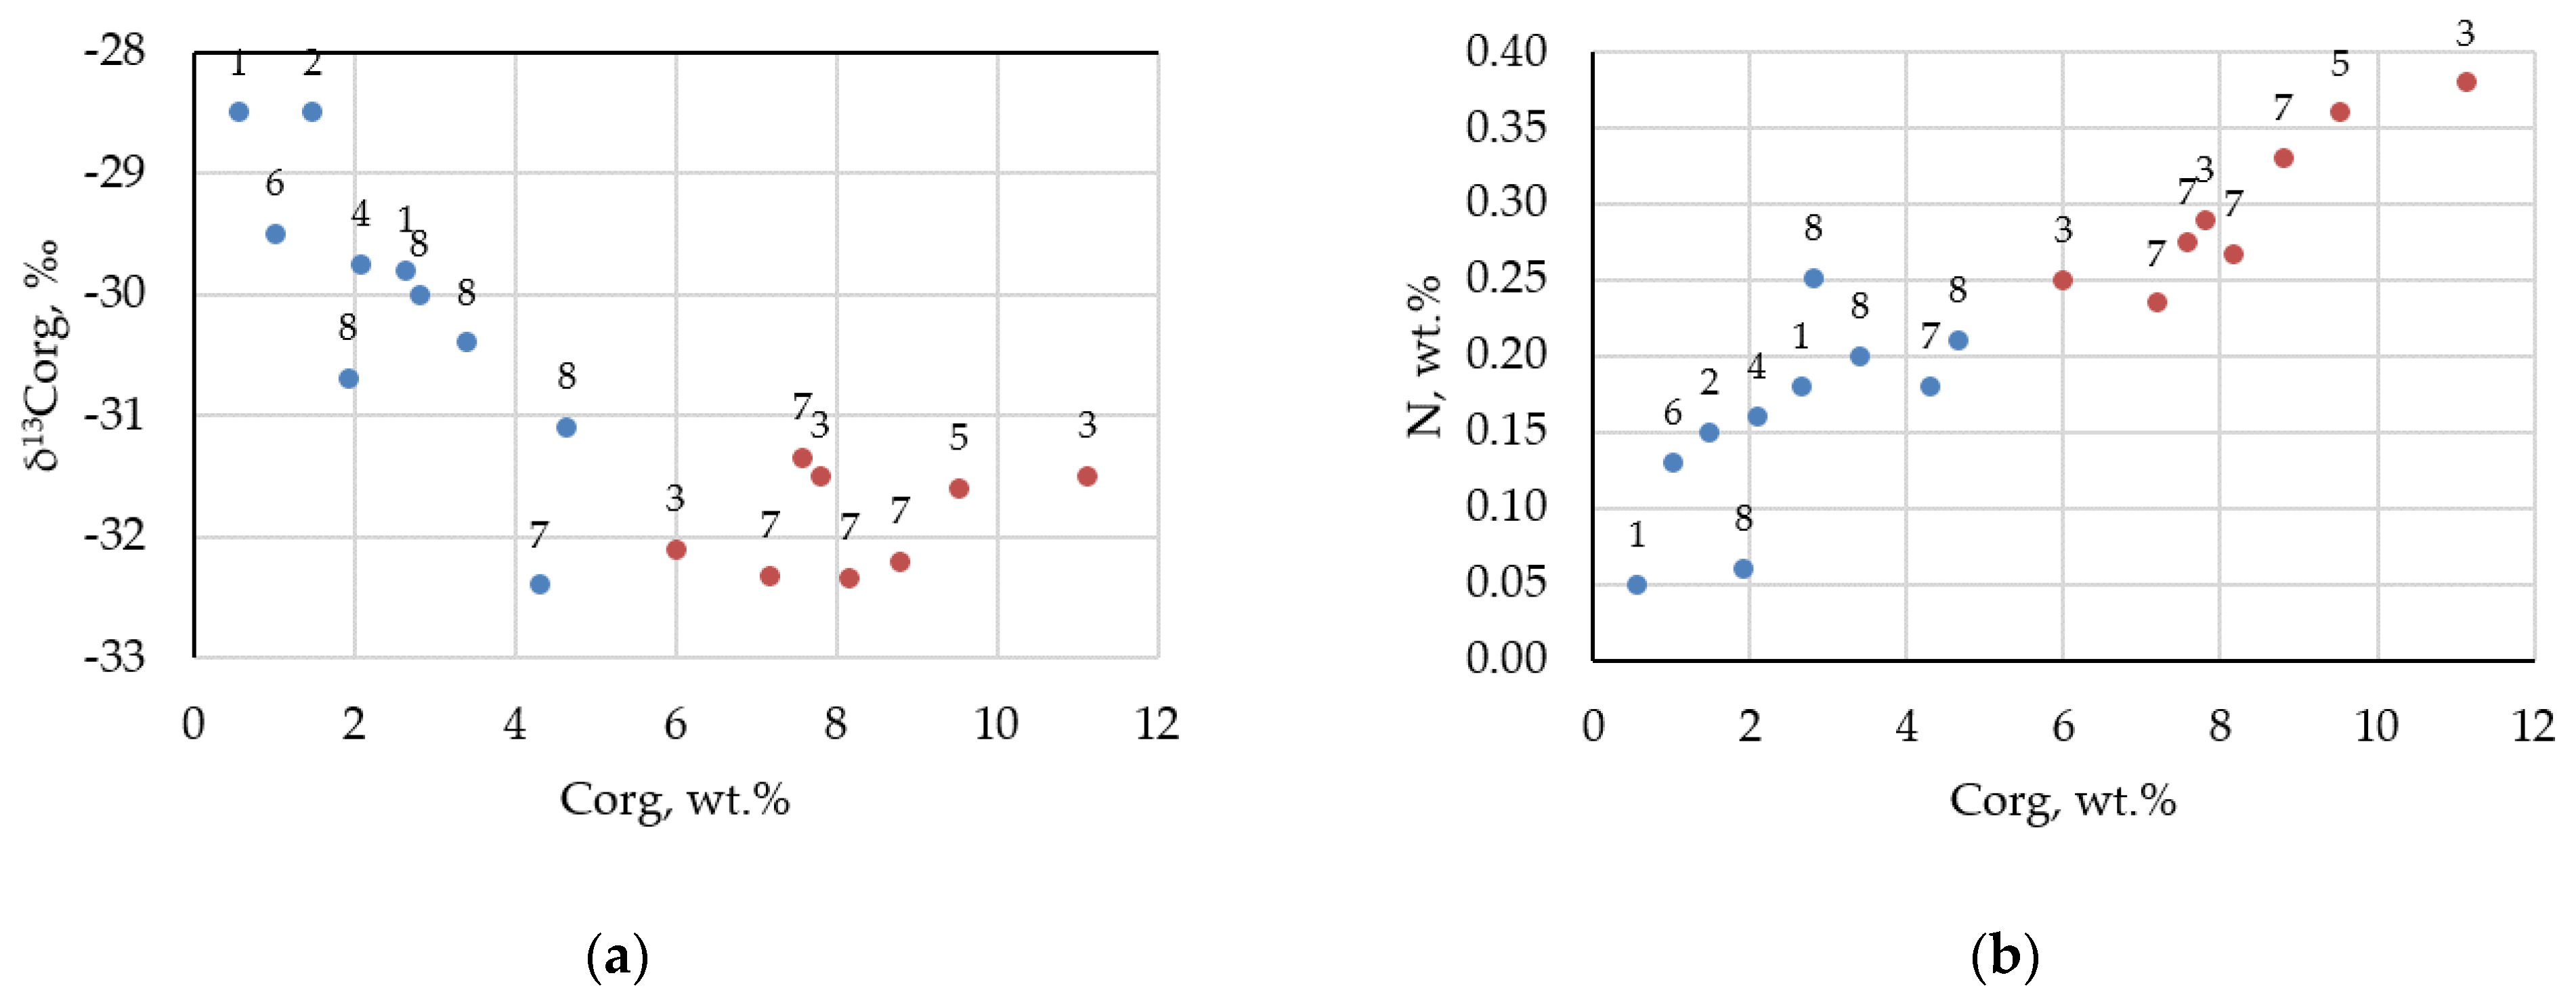
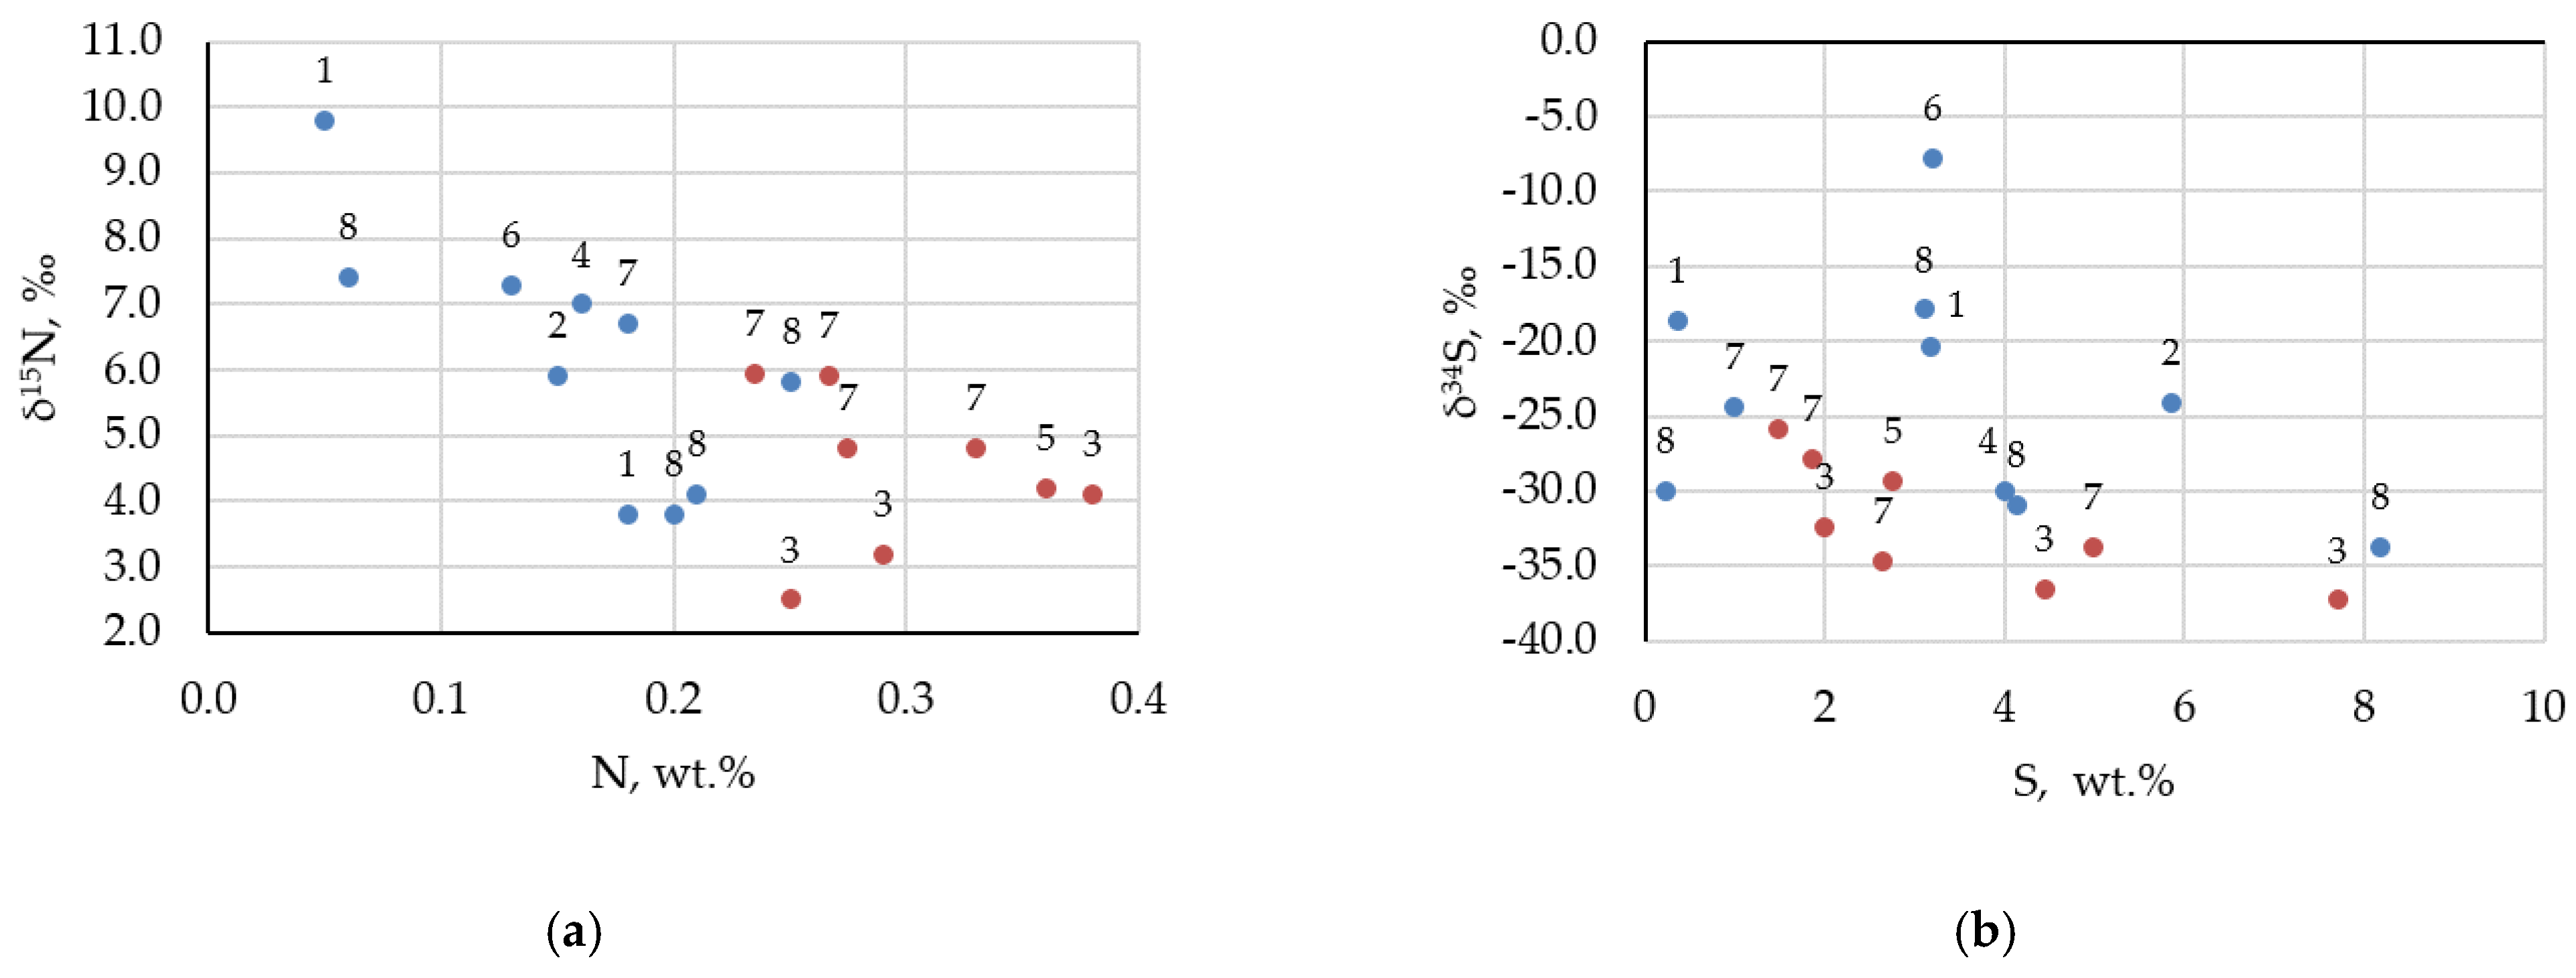
4.6. Elemental and Isotope Composition of Carbon, Nitrogen, and Sulfur
4.7. Integration of the Geochemical Data and Reconstruction of Sedimentation Conditions
5. Conclusions
Author Contributions
Funding
Institutional Review Board Statement
Informed Consent Statement
Data Availability Statement
Conflicts of Interest
Appendix A

| Element, wt.% | Mg | Al | Si | P | S | K | Ca | Ti |
|---|---|---|---|---|---|---|---|---|
| Bazhenov Formation | ||||||||
| Min | 0.31 | 1.50 | 3.61 | 0.00 | 0.94 | 0.35 | 0.75 | 0.00 |
| Max | 1.55 | 9.22 | 24.88 | 8.79 | 15.11 | 4.70 | 35.37 | 0.96 |
| Average | 1.10 | 7.96 | 21.12 | 0.32 | 3.96 | 3.70 | 3.22 | 0.74 |
| Median | 1.11 | 8.42 | 22.41 | 0.16 | 3.23 | 3.99 | 1.25 | 0.82 |
| Abalak Formation | ||||||||
| Min | 0.69 | 4.61 | 10.60 | 0.14 | 0.58 | 1.26 | 0.76 | 0.13 |
| Max | 1.34 | 8.93 | 25.07 | 0.25 | 2.79 | 4.65 | 4.46 | 1.01 |
| Average | 1.06 | 8.16 | 23.22 | 0.19 | 1.55 | 4.12 | 1.26 | 0.84 |
| Median | 1.06 | 8.33 | 23.89 | 0.19 | 1.51 | 4.28 | 1.03 | 0.87 |
| Element, ppm | V | Ni | Cu | Zn | Rb | Sr | Zr | Mo | Ba |
|---|---|---|---|---|---|---|---|---|---|
| Bazhenov Formation | |||||||||
| Min | 0 | 80 | 40 | 90 | 10 | 190 | 50 | 0 | 280 |
| Max | 4850 | 680 | 630 | 12460 | 330 | 3400 | 360 | 1250 | 2250 |
| Average | 890 | 280 | 290 | 2060 | 240 | 470 | 260 | 100 | 820 |
| Median | 0 | 250 | 240 | 1010 | 260 | 410 | 280 | 20 | 750 |
| Abalak Formation | |||||||||
| Min | 0 | 120 | 40 | 460 | 60 | 230 | 60 | 0 | 640 |
| Max | 0 | 550 | 250 | 2350 | 360 | 470 | 330 | 20 | 1530 |
| Average | 0 | 390 | 160 | 1530 | 300 | 420 | 280 | 0 | 1000 |
| Median | 0 | 380 | 160 | 1550 | 320 | 420 | 300 | 0 | 920 |
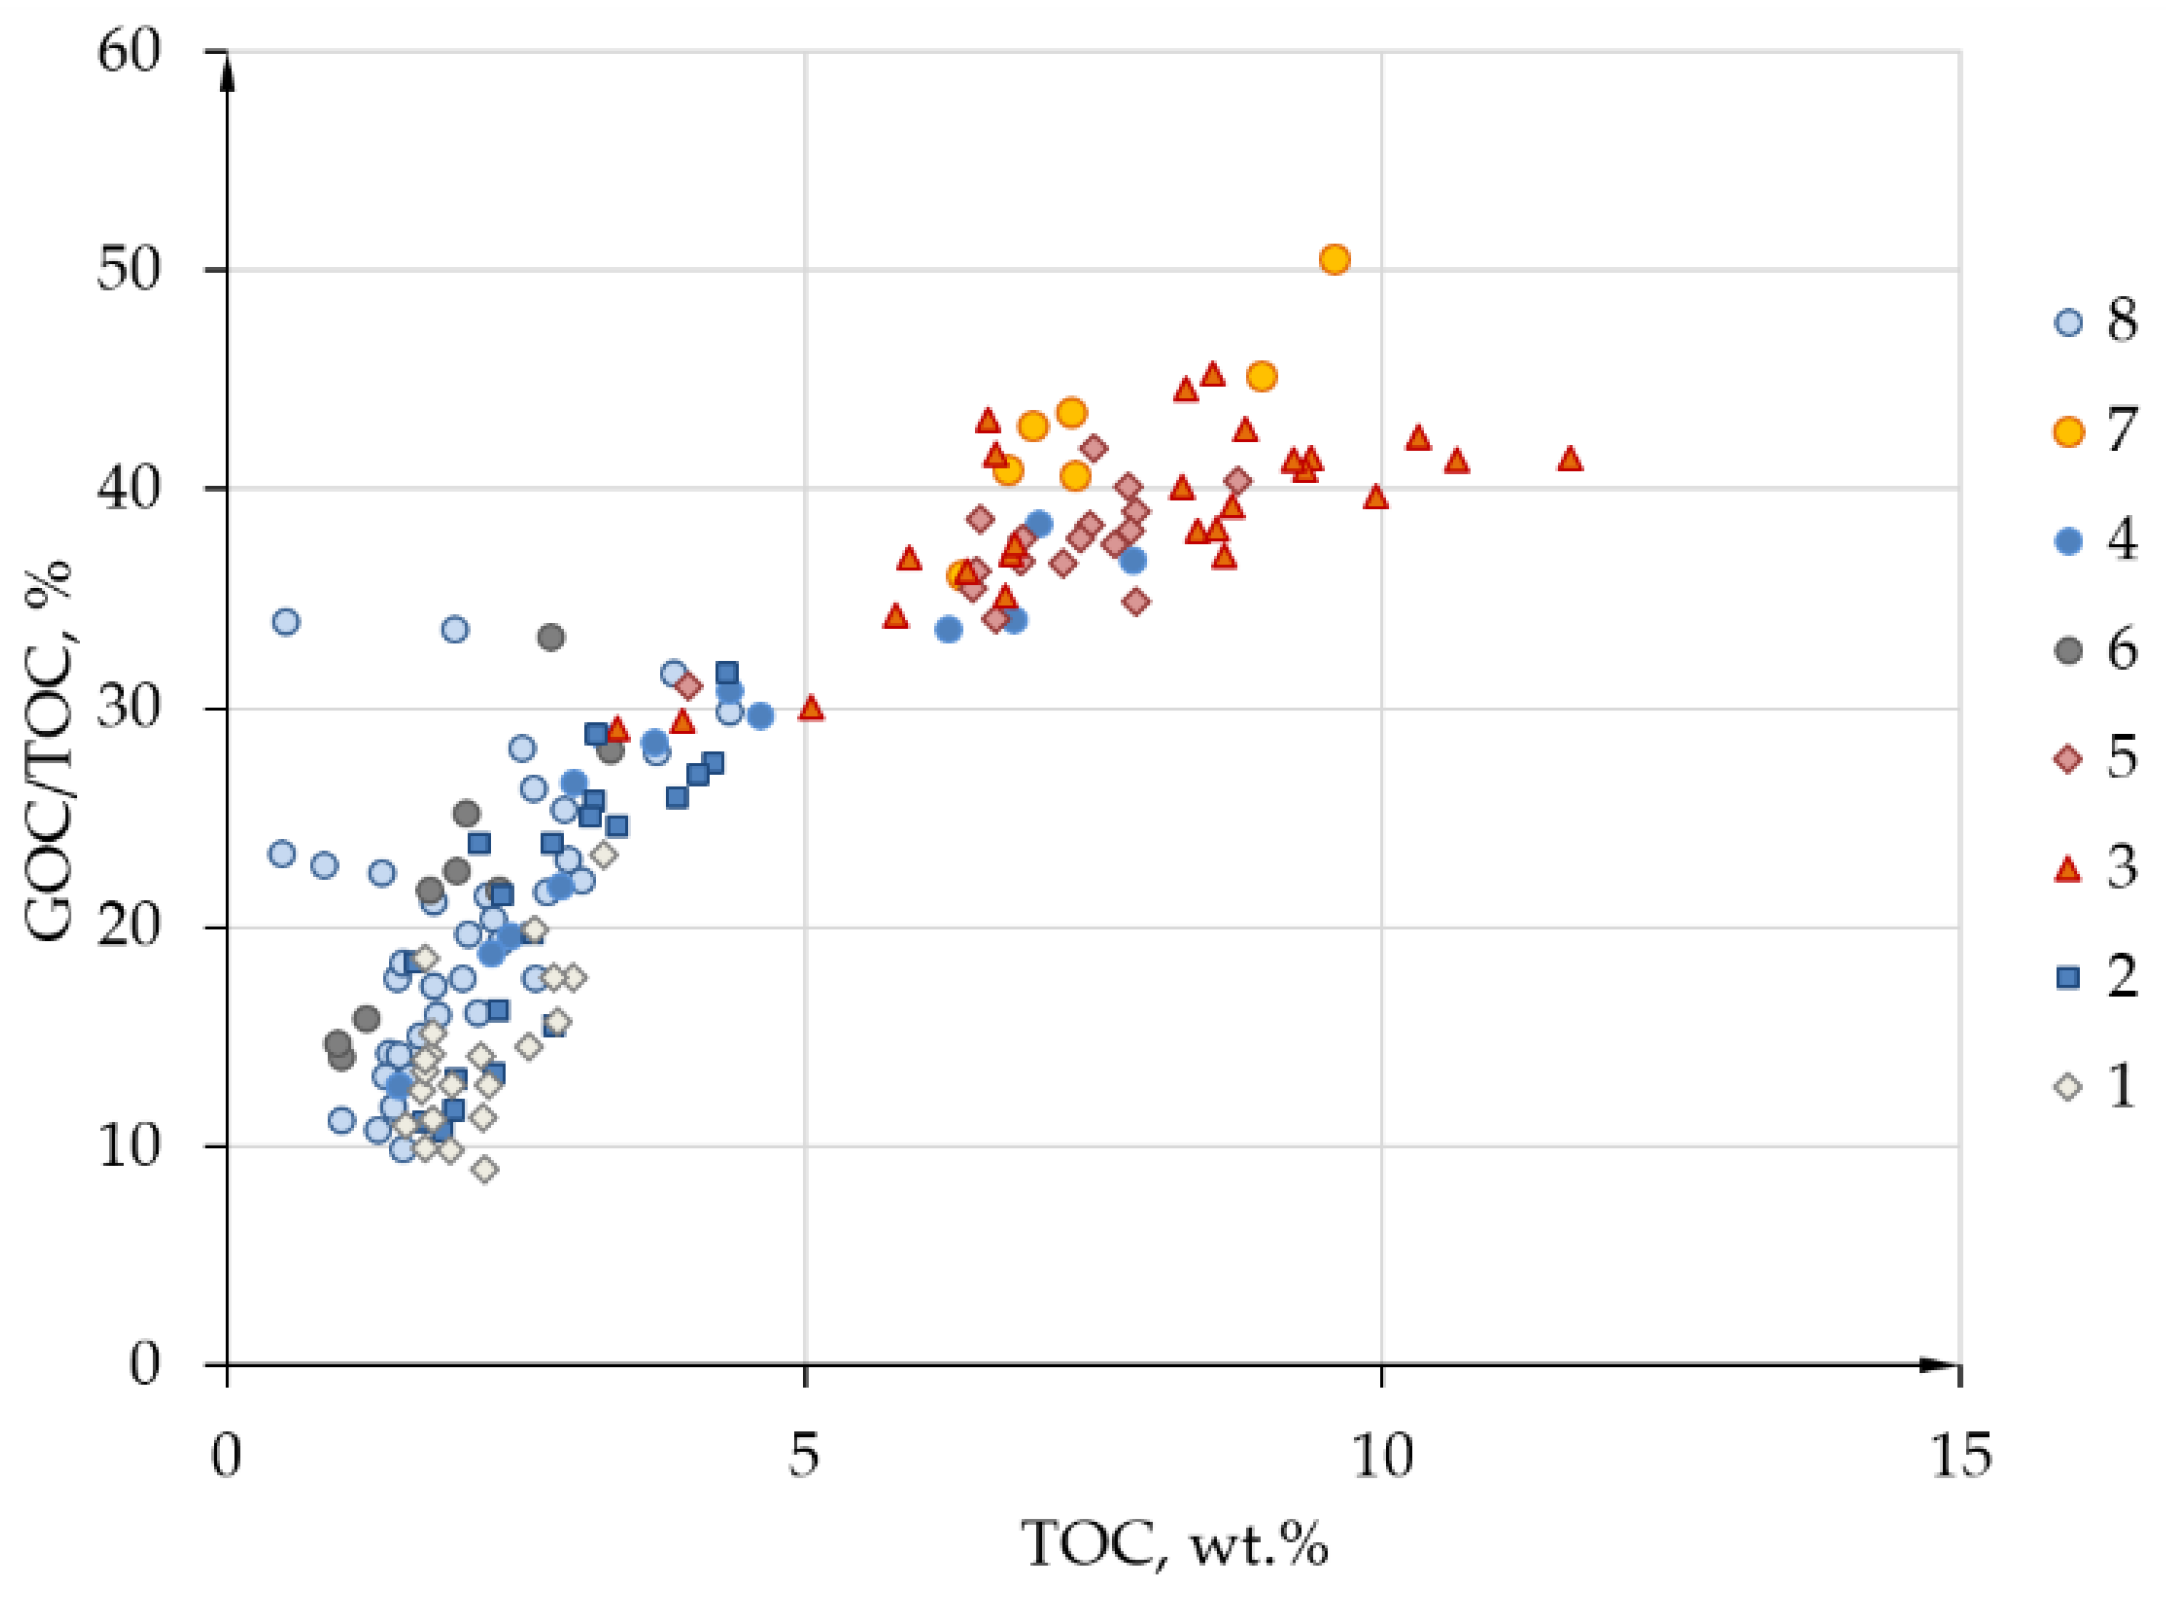
| Member # | Number of Samples Averaged | S0 + S1 | S2 | TOC | Tmax | HI | OI | PI | CC | GOC/ TOC |
|---|---|---|---|---|---|---|---|---|---|---|
| mg HCs/g Rock | mg HCs/g Rock | wt.% | °C |
mg HC/ g TOC |
mg CO2/ g TOC | wt.% | % | |||
| 8 | 36 | 0.95 | 3.55 | 2.00 | 436 | 157 | 26 | 0.21 | 0.36 | 20 |
| 7 | 8 | 4.47 | 33.76 | 7.60 | 439 | 437 | 4 | 0.09 | 0.22 | 34 |
| 6 | 9 | 1.46 | 3.42 | 1.93 | 436 | 149 | 19 | 0.34 | 0.19 | 22 |
| 5 | 17 | 4.42 | 26.53 | 7.13 | 439 | 368 | 4 | 0.12 | 0.17 | 37 |
| 4 | 13 | 2.92 | 12.12 | 4.30 | 438 | 241 | 7 | 0.22 | 0.17 | 27 |
| 3 | 26 | 4.99 | 30.55 | 7.79 | 438 | 380 | 4 | 0.11 | 0.22 | 39 |
| 2 | 20 | 1.43 | 5.36 | 2.80 | 438 | 173 | 13 | 0.20 | 0.43 | 21 |
| 1 | 21 | 0.58 | 2.58 | 2.16 | 438 | 112 | 14 | 0.17 | 0.39 | 14 |
| Member # | Corg, wt.% | Ccarb, wt.% | N, wt.% | S, wt.% | δ13Corg, ‰ | δ34S, ‰ | δ15N, ‰ | δ13Ccarb, ‰ | δ18Ocarb, ‰ |
|---|---|---|---|---|---|---|---|---|---|
| 8 | 1.92 | 9.93 | 0.06 | 0.23 | −30.7 | −30 | 7.4 | −26 | −0.3 |
| 4.65 | 0.09 | 0.21 | 8.18 | −31.1 | −33.7 | 4.1 | −12.9 | −9.6 | |
| 3.40 | 0.19 | 0.2 | 4.13 | −30.4 | −30.9 | 3.8 | −1.5 | −5.4 | |
| 2.81 | 0.09 | 0.25 | 3.10 | −30 | −17.9 | 5.8 | −12 | −11.3 | |
| 7 | 4.30 | 5.10 | 0.18 | 1.00 | −32.4 | −24.4 | 6.7 | −5.5 | −7.5 |
| 8.80 | 0.42 | 0.33 | 4.98 | −32.2 | −33.7 | 4.8 | −11.8 | −10.1 | |
| 7.18 | 0.83 | 0.23 | 1.48 | −32.3 | −25.8 | 6.0 | −0.4 | −5.9 | |
| 8.17 | 0.27 | 0.27 | 1.86 | −32.3 | −27.9 | 5.9 | −13.8 | −14.6 | |
| 7.58 | 0.02 | 0.28 | 2.65 | −31.4 | −34.7 | 4.8 | −13.9 | −13.8 | |
| 6 | 1.01 | 0.19 | 0.13 | 3.20 | −29.5 | −7.8 | 7.3 | −14.1 | −12.1 |
| 5 | 9.53 | 0.32 | 0.36 | 2.76 | −31.6 | −29.3 | 4.2 | −10.5 | −8.4 |
| 4 | 2.08 | 0.22 | 0.16 | 4.00 | −29.8 | −30.0 | 7.0 | −16.6 | −13.6 |
| 3 | 7.80 | 0.06 | 0.29 | 2.00 | −31.5 | −32.4 | 3.2 | −15.5 | −12.1 |
| 6.00 | 0.46 | 0.25 | 4.44 | −32.1 | −36.6 | 2.5 | −15.6 | −13.1 | |
| 11.13 | 0.27 | 0.38 | 7.70 | −31.5 | −37.3 | 4.1 | −15.1 | −12.6 | |
| 2 | 1.48 | 0.36 | 0.15 | 5.85 | −28.5 | −24.1 | 5.9 | −15.9 | −10.7 |
| 1 | 2.65 | 0.28 | 0.18 | 3.19 | −29.8 | −20.4 | 3.8 | −15.3 | −12.2 |
| 0.56 | 8.06 | 0.05 | 0.36 | −28.5 | −18.6 | 9.8 | −10.8 | −1.2 |


References
- Braduchan, Y.V.; Gurari, F.G.; Zakharov, V.A. Bazhenovskij Gorizont Zapadnoj Sibiri (Stratigrafija, Ekosistema, Neftenosnost) (The Bazhenov Horizon of the Western Siberia (Stratigraphy, Ecosystem, Oil Content); Vyshemiskij, V.S., Ed.; Nauka: Novosibirsk, Russia, 1986. [Google Scholar]
- Kontorovich, A.E.; Bogorodskaya, L.I.; Borisova, L.S.; Burshtein, L.M.; Ismagilov, Z.R.; Efimova, O.S.; Kostyreva, E.A.; Lemina, N.M.; Ryzhkova, S.V.; Sozinov, S.A.; et al. Geochemistry and catagenetic transformation of kerogen from the bazhenov horizon. Geoshemistry 2019, 64, 585–593. [Google Scholar] [CrossRef]
- Kontorovich, A.E.; Kontorovich, V.A.; Ryzhkova, S.V.; Shurygin, B.N.; Vakulenko, L.G.; Gaideburova, E.A.; Danilova, V.P.; Kazanenkov, V.A.; Kim, N.S.; Kostyreva, E.A.; et al. Jurassic paleogeography of the West Siberian sedimentary basin. Russ. Geol. Geophys. 2013, 54, 747–779. [Google Scholar] [CrossRef]
- Zanin, Y.N.; Zamirailova, A.G.; Eder, V.G. Some aspects of the Bazhenov Formation genesis in the Central parts of the West-Siberian sedimentary Basin. Lithosphera 2005, 4, 118–135. [Google Scholar]
- Ulmishek, G.F. Petroleum Geology and Resources of the West. Siberian Basin, Russia, 1st ed.; US Geological Survey: Reston, VA, USA, 2003.
- Zubkov, M.Y. The reservoir potential of the Bazhenov Formation: Regional prediction. Russ. Geol. Geophys. 2017, 58, 410–415. [Google Scholar] [CrossRef]
- Goncharov, I.V.; Samoilenko, V.V.; Oblasov, N.V.; Fadeeva, S.V.; Veklich, M.A.; Kashapov, R.S.; Trushkov, P.V.; Bahtina, E.S. Types of organic matter and catagenesis of the Bazhenov formation and its same-aged analogues. Oil Ind. 2016, 10, 20–25. [Google Scholar]
- Zanin, Y.N.; Zamirailova, A.G.; Eder, V.G. Uranium, thorium, and potassium in black shales of the Bazhenov Formation of the West Siberian marine basin. Lithol. Miner. Resour. 2016, 51, 74–85. [Google Scholar] [CrossRef]
- Kostyreva, E.A.; Sotnich, I.S. Geochemistry of organic matter of the Bazhenov Formation in the north of the Khantei anteclise. Russ. Geol. Geophys. 2017, 58, 434–442. [Google Scholar] [CrossRef]
- Goncharov, I.V.; Samoilenko, V.V.; van Graas, G.W.; Trushkov, P.V.; Oblasov, N.V.; Fadeeva, S.V.; Veklich, M.A.; Kashapov, R.S.; Sidorov, D.A. Petroleum generation and migration in the southern Tyumen region, Western Siberia Basin, Russia. Org. Geochem. 2021, 152, 104178. [Google Scholar] [CrossRef]
- Toropova, T.N.; Kontorovich, V.A. Structural history and petroleum potential of the Central part of the Gydan Peninsula (Northeast of Western Siberia). Neftegazov. Geol. Teor. Pract. 2019, 14, 1–25. [Google Scholar] [CrossRef] [Green Version]
- Deshin, A.A.; Safronov, P.I.; Burshtein, L.M. Reconstruction of hydrocarbon generation and accumulation on the Gydan Peninsula and adjacent offshore areas using basin modeling approach. IOP Conf. Ser. Earth Environ. Sci. 2018, 193. [Google Scholar] [CrossRef] [Green Version]
- Ryzhkova, S.V.; Burshtein, L.M.; Ershov, S.V.; Kazanenkov, V.A.; Kontorovich, A.E.; Kontorovich, V.A.; Nekhaev, A.Y.; Nikitenko, B.L.; Fomin, M.A.; Shurygin, B.N.; et al. The Bazhenov Horizon of West Siberia: Structure, Correlation, and Thickness. Russ. Geol. Geophys. 2018, 59, 1053–1074. [Google Scholar] [CrossRef]
- Afanasenkov, A.P.; Petrov, A.L.; Grayzer, E.M. Geochemical description and oil & gas generation potential of Mesozoic formations within the Gydan and Yenisei-Khatanga oil and gas bearing regions. Oil Gas Geol. 2018, 109–127. [Google Scholar] [CrossRef]
- Skorobogatov, V.A.; Stroganov, L.V. Gydan Region: Geological Structure, Hydrocarbon Resources, Future; NEDRA: Moscow, Russia, 2006; ISBN 5836502625. [Google Scholar]
- Fjellanger, E.; Kontorovich, A.E.; Barboza, S.A.; Burshtein, L.M.; Hardy, M.J.; Livshits, V.R. Charging the giant gas fields of the NW Siberia basin. Pet. Geol. Conf. Proc. 2010, 7, 659–668. [Google Scholar] [CrossRef]
- Kontorovich, A.E.; Burshtein, L.M.; Malyshev, N.A.; Safronov, P.I.; Gus’kov, S.A.; Ershov, S.V.; Kazanenkov, V.A.; Kim, N.S.; Kontorovich, V.A.; Kostyreva, E.A.; et al. Historical-geological modeling of hydrocarbon generation in the Mesozoic-Cenozoic sedimentary basin of the Kara Sea (basin modeling). Russ. Geol. Geophys. 2013, 54, 917–957. [Google Scholar] [CrossRef]
- Kontorovich, A.E.; Burshtein, L.M.; Nikitenko, B.L.; Ryzhkova, S.V.; Borisov, E.V.; Ershov, S.V.; Kostyreva, E.A.; Konotorovich, V.A.; Nekhaev, A.Y.; Ponomareva, E.V.; et al. Volgian–early berriasian marginal filter in the West Siberian marine basin and its influence on sediment distribution. Russ. Geol. Geophys. 2017, 58, 410–415. [Google Scholar] [CrossRef]
- Polyakova, I.D.; Bogoyavlenskii, V.I. The Bazhenovo formation as a source of economic oils and rich gases in the Tithonian-Neocomian section of the South Kara Region. Dokl. Earth Sci. 2011, 440, 1270–1275. [Google Scholar] [CrossRef]
- Katz, B.J.; Robison, C.R.; Chakhmakhchev, A. Aspects of hydrocarbon charge of the petroleum system of the Yamal Peninsula, West Siberia basin. Int. J. Coal Geol. 2003, 54, 155–164. [Google Scholar] [CrossRef]
- Samoilenko, V.V.; Shadrina, E.S.; Goncharov, I.V.; Oblasov, N.V.; Veklich, M.A.; Zherdeva, A.V. The Origin of Hydrocarbon Fluids and Features of the Formation of Oil and Gas Fields in the Gydan Peninsula. In Proceedings of the 29th International Meeting on Organic Geochemistry, European Association of Geoscientists & Engineers, Gothenburg, Sweden, 1–6 September 2019; Volume 2019, pp. 1–2. [Google Scholar]
- Chakhmakhchev, A.; Sampei, Y.; Suzuki, N. Geochemical characteristics of oils and source rocks in the Yamal peninsula, West Siberia, Russia. Org. Geochem. 1994, 22, 311–322. [Google Scholar] [CrossRef]
- Panchenko, I.V.; Nemova, V.D.; Smirnova, M.E.; Ilyina, M.V.; Baraboshkin, E.Y.; Ilyin, V.S. Stratification and detailed correlation of Bazhenov Horizon in the central part of the Wetern Siberia according to lithological and paleontological core analysis and well logging. Oil Gas Geol. 2016, 6, 22–34. [Google Scholar]
- Kontorovich, A.E.; Yan, P.A.; Zamirailova, A.G.; Kostyreva, E.A.; Eder, V.G. Classification of rocks of the Bazhenov Formation. Russ. Geol. Geophys. 2016, 57, 1606–1612. [Google Scholar] [CrossRef]
- Zakharov, V.A. Formation conditions of the Volgian-Berrias carbon-rich Bazhenovov Formation based on paleoecology data. Evol. Biosf. Bioraznoobrazija 2006, 5, 552–568. [Google Scholar]
- Zubkov, M.Y. Rocks of the Bazhenovo and Abalak formations, Central Krasnoleninsk arch, Western Siberia: Composition, structure, and formation conditions. Lithol. Miner. Resour. 2001, 36, 33–42. [Google Scholar] [CrossRef]
- Bychkov, A.Y.; Kalmykov, G.A.; Bugaev, I.A.; Balushkina, N.S.; Kalmykov, A.G. The geochemical patterns of rocks of the Bazhenov and Abalak formations (Western Siberia). Moscow Univ. Geol. Bull. 2017, 72, 87–94. [Google Scholar] [CrossRef]
- Skvortsov, M.B.; Nemova, V.D.; Panchenko, I.V.; Kirsanov, A.M. Criteria of oil bearing capacity of the Bazhenov formations. Oil Gas Geol. 2018, 1, 109–114. [Google Scholar]
- Practical Steps for Studying Mudstones in Thin Sections. In Mudstone Primer: Lithofacies Variations, Diagnostic Criteria, and Sedimentologic–Stratigraphic Implications at Lamina to Bedset Scale; Lazar, O.R.; Bohacs, K.M.; Schieber, J.; Macquaker, J.H.S.; Demko, T.M. (Eds.) SEPM Society for Sedimentary Geology: Tulsa, OK, USA, 2015; Volume 12, ISBN 9781565763395. [Google Scholar]
- Panchenko, I.; Kulikov, P.; Garipov, R. Practical application of chemostratigraphy and lithochemistry methods in the study of oil bearing black shale. In Proceedings of the EAGE/SPE Workshop on Shale Science 2021, Moscow, Russia, 5–6 April 2021; pp. 1–5. [Google Scholar] [CrossRef]
- Espitalie, J.; Laporte, J.L.; Madec, M.; Marquis, F.; Leplat, P.; Paulet, J.; Boutefeu, A. Methode rapide de caracterisation des roches meres, de leur potential Per., petrolier et de leur degre d’evolution. Rev. Inst. Fr. Pét. 1977, 32, 23–42. [Google Scholar] [CrossRef]
- Espitalié, J.; Deroo, G.; Marquis, F. La pyrolyse Rock Eval et ses applications. Rev. Inst. Fr. Pét. 1985, 40, 755–784. [Google Scholar] [CrossRef]
- Umamaheswaran, R.; Prasad, G.V.R.; Rudra, A.; Dutta, S. Biomarker signatures in triassic coprolites. Palaios 2019, 34, 458–467. [Google Scholar] [CrossRef]
- Li, S.; Cao, J.; Hu, S.; Zhang, D.; Fan, R. Analysis of terpanes in biodegraded oils from China using comprehensive two-dimensional gas chromatography with time-of-flight mass spectrometry. Fuel 2014, 133, 153–162. [Google Scholar] [CrossRef]
- Li, S.; Cao, J.; Hu, S. Analyzing hydrocarbon fractions in crude oils by two-dimensional gas chromatography/time-of-flight mass spectrometry under reversed-phase column system. Fuel 2015, 158, 191–199. [Google Scholar] [CrossRef]
- Lazar, O.R.; Bohacs, K.M.; Macquaker, J.H.S.; Schieber, J.; Demko, T.M. Capturing key attributes of fine-grained sedimentary rocks in outcrops, cores, and thin sections: Nomenclature and description guidelines. J. Sediment. Res. 2015, 85, 230–246. [Google Scholar] [CrossRef] [Green Version]
- Mukhametdinova, A.; Karamov, T.; Bogdanovich, N.; Borisenko, S.; Rudakovskaya, S.; Cheremisin, A. Wettability of organic-rich source rocks: Case study on Bazhenov Formation (Abalak-Bazhenov group). Adv. Geosci. 2020, 54, 195–204. [Google Scholar] [CrossRef]
- Yudovich, Y.E.; Ketris, M.P. Geokhimiya Chernykh Slantsev (Geochemistry of Black Shales); Nauka: Leningrad, Russia, 1988. [Google Scholar]
- Yudovich, Y.E.; Ketris, M.P. Osnovy Litokhimii (Fundamentals of Lithochemistry); Nauka: St.Petersburg, Russia, 2000. [Google Scholar]
- Barash, I.G.; Bulanov, V.A.; Gladkochub, D.P.; Donskaya, T.V.; Ivanov, A.V.; Letnikova, E.F.; Mironov, A.G.; Sizykh, A.I.; Sklyarov, E.V. Interpretatsiya Geokhimicheskikh Dannykh/Uchebnoe Posobie; Sklyarov, B.V., Ed.; Intermetinzhiniring: Moscow, Russia, 2001. [Google Scholar]
- Maslov, A.V. Osadochnye Porody: Metody Izucheniya i Interpretatsii Poluchennykh Dannykh. Uchebnoe Posobie (Sedimentary Rocks: Methods for the Interpretation of Obtained Data. A Manual); UGGU: Yekaterinburg, Russia, 2005. [Google Scholar]
- Ratcliffe, K.T.; Woods, J.; Rice, C. Determining well-bore pathways during multilateral drilling campaigns in shale resource plays: An example using chemostratigraphy from hte Horn River Formation, British Columbia, Canada. In Proceedings of the Eastern Australia Basins Symposium IV, Brisbane, QLD, Australia, 10–14 September 2012; pp. 143–148. [Google Scholar]
- Algeo, T.J.; Li, C. Redox classification and calibration of redox thresholds in sedimentary systems. Geochim. Cosmochim. Acta 2020, 287, 8–26. [Google Scholar] [CrossRef]
- Ruebsam, W.; Dickson, A.J.; Hoyer, E.-M.; Schwark, L. Multiproxy reconstruction of oceanographic conditions in the southern epeiric Kupferschiefer Sea (Late Permian) based on redox-sensitive trace elements, molybdenum isotopes and biomarkers. Gondwana Res. 2017, 44, 205–218. [Google Scholar] [CrossRef] [Green Version]
- Andersson, P.; Guo, L.; Semiletov, I.; Gustafsson, O.; Ingri, J.; Dudarev, O.; White, D. Nd and Sr isotopes in Siberian Arctic estuarine sediments: Implications for sediment provenance (5475). In Proceedings of the EGS-AGU-EUG Joint Assembly, Nice, France, 6–11 April 2003. [Google Scholar]
- Asadulin, E.E.; Miroshnikov, A.Y.; Velichkin, V.I. Geochemical signature of bottom sediments in the mixing zones of Ob and Yenisei waters with Kara Sea water. Geochem. Int. 2013, 51, 1005–1018. [Google Scholar] [CrossRef]
- Bjoroy, M.; Hall, K.; Hall, P.B. Detailed hydrocarbon analyser for well site and laboratory use. Mar. Pet. Geol. 1992, 9, 648–665. [Google Scholar] [CrossRef]
- Hall, P.B.; Stoddart, D.; Bjorøy, M.; Larter, S.R.; Brasher, J.E. Detection of petroleum heterogeneity in Eldfisk and satellite fields using thermal extraction, pyrolysis-GC, GC-MS and isotope techniques. Org. Geochem. 1994, 22, 383–402. [Google Scholar] [CrossRef]
- Peters, K.E.; Kontorovich, A.E.; Moldowan, J.M.; Andrusevich, V.E.; Huizinga, B.J.; Demison, G.J.; Stasova, O.F. Geochemistry of selected oils and rocks from the central portion of the West Siberian Basin, Russia. Am. Assoc. Pet. Geol. Bull. 1993, 77, 863–887. [Google Scholar] [CrossRef]
- Liu, Z.; Moldowan, J.M.; Nemchenko-Rovenskaya, A.; Peters, K.E. Oil families and mixed oil of the North-Central West Siberian basin, Russia. Am. Assoc. Pet. Geol. Bull. 2016, 100, 319–343. [Google Scholar] [CrossRef]
- Peters, K.E.; Walters, C.C.; Moldowan, J.M. The Biomarker Guide: Volume 2, Biomarkers and Isotopes in Petroleum Exploration and Earth History; Cambridge University Press: Cambridge, UK, 2005. [Google Scholar]
- Kontorovich, A.E.; Kostyreva, E.A.; Melenevskij, V.N.; Moskvin, V.I.; Fomin, A.N. Geochemical criteria of oil and gas prospects for Mezozoic deposits of the South-Eatern Siberia. Geol. Neft. Gaza 2009, 1, 4–12. [Google Scholar]
- Newton, R. Water Column Redox Proxies. School of Earth and Environment. Available online: http://www.lifeandplanet.net/uploads/8/6/7/2/8672988/newton_-_water_column_redox_edited.pdf (accessed on 5 May 2021).
- Sim, M.S.; Bosak, T.; Ono, S. Large Sulfur isotope fractionation does not require disproportionation. Science 2011, 333, 74–77. [Google Scholar] [CrossRef]
- Yurchenko, A.; Voropaev, A.; Kozlova, E.; Morozov, N.; Spasennykh, M. Application of the data on δ13C and δ18O of carbonates for the study of unconventional reservoirs on the example of the Bazhenov source rocks, Western Siberia, Russia. Geosciences 2021, 11, 264. [Google Scholar] [CrossRef]
- Yurchenko, A.Y. Genesis of calcite in carbonates within sedimentary basins according to carbon and oxygen stable isotopes distribution. Moscow Univ. Geol. Bull. 2014, 107–110. [Google Scholar] [CrossRef]
- Yurchenko, A.Y.; Balushkina, N.S.; Kalmykov, G.A.; Shardanova, T.A.; Bychkov, A.Y.; Prokof’ev, V.Y. Genesis of vein calcite in carbonate rocks at top of Abalak and Georgiev formations in Central West Siberia. Oil Ind. 2015, 4, 22–26. [Google Scholar]
- Lewan, M.D. Factors controlling the proportionality of vanadium to nickel in crude oils. Geochim. Cosmochim. Acta 1984, 48, 2231–2238. [Google Scholar] [CrossRef]
- Jones, B.; Manning, D.A.C. Comparison of geochemical indices used for the interpretation of palaeoredox conditions in ancient mudstones. Chem. Geol. 1994, 111, 111–129. [Google Scholar] [CrossRef]
- Tribovillard, N.; Algeo, T.J.; Lyons, T.; Riboulleau, A. Trace metals as paleoredox and paleoproductivity proxies: An update. Chem. Geol. 2006, 232, 12–32. [Google Scholar] [CrossRef]
- Algeo, T.J.; Rowe, H. Paleoceanographic applications of trace-metal concentration data. Chem. Geol. 2012, 324–325, 6–18. [Google Scholar] [CrossRef]
- Algeo, T.J.; Liu, J. A re-assessment of elemental proxies for paleoredox analysis. Chem. Geol. 2020, 540, 119549. [Google Scholar] [CrossRef]
- Bennett, W.W.; Canfield, D.E. Redox-sensitive trace metals as paleoredox proxies: A review and analysis of data from modern sediments. Earth-Sci. Rev. 2020, 204, 103175. [Google Scholar] [CrossRef]
- Shemin, G.; Deev, E.; Vernikovsky, V.A.; Drachev, S.S.; Moskvin, V.; Vakulenko, L.; Pervukhina, N.; Sapyanik, V. Jurassic paleogeography and sedimentation in the northern West Siberia and South Kara Sea, Russian Arctic and Subarctic. Mar. Pet. Geol. 2019, 104, 286–312. [Google Scholar] [CrossRef]


| Member | TOC, wt.% | U, ppm | Lithotype | Sedimentation Type | Sedimentation Conditions |
|---|---|---|---|---|---|
| #8 | 0.47–4.35 1 2.00 2 | 0–17.33 2.7 | L-4 | Terrigenous with periodical mixed terrigenous and biogenic | Enhanced terrigenous influx with increased bioproductivity events |
| #7 | 6.35–9.57 7.60 | 8.8–39.8 23.4 | L-3 | Mixed terrigenous and biogenic | Predominantly anoxic conditions, sea level transgression |
| #6 | 0.95–3.31 1.93 | 0.0–3.7 1.8 | L-4 | Terrigenous | Hydrodynamic activation of bottom waters, the presence of oxygen, enhanced terrigenous influx |
| #5 | 4.00–8.74 7.13 | 6.0–30.9 20.8 | L-3 | Mixed terrigenous and biogenic | Predominantly anoxic conditions, sea level transgression |
| #4 | 1.48–7.83 4.30 | 4.9–16.1 10.6 | L-2 | Mixed terrigenous and biogenic | The first episode of a new source of terrigenous influx, weak terrigenous inflow, suboxic environment |
| #3 | 5.06–11.62 7.79 | 6.0–44.1 19.6 | L-3 | Mixed terrigenous and biogenic | Predominantly euxinic conditions, sea level transgression |
| #2 | 1.63–4.33 2.80 | 0.0–10.9 2.5 | L-1 | Transitional from terrigenous to mixed terrigenous and biogenic | Start of sea level rise, transition from terrigenous to biogenic sedimentation |
| #1 | 1.55–3.26 2.16 | 0.0–8.0 1.1 | L-1 | Terrigenous | Shallow sea with the presence of oxygen and moderate terrigenous inflow |
| Member # | Sm | Nd | 147Sm/144Nd | 143Nd/144Nd | (143Nd/144Nd)i |
|---|---|---|---|---|---|
| units | ppm | ppm | |||
| 8 | 1.53 | 7.47 | 0.1242 | 0.512267 | 0.512149 |
| 8 | 6.49 | 32.54 | 0.1205 | 0.512266 | 0.512152 |
| 8 | 6.99 | 37.32 | 0.1132 | 0.512258 | 0.512150 |
| 8 | 4.37 | 24.58 | 0.1075 | 0.512279 | 0.512177 |
| 8 | 2.98 | 18.67 | 0.0967 | 0.512248 | 0.512156 |
| 7 | 6.45 | 29.84 | 0.1307 | 0.512250 | 0.512125 |
| 7 | 5.95 | 27.30 | 0.1318 | 0.512247 | 0.512122 |
| 7 | 6.15 | 28.90 | 0.1286 | 0.512252 | 0.512130 |
| 7 | 6.61 | 30.98 | 0.1289 | 0.512233 | 0.512110 |
| 6 | 3.50 | 22.74 | 0.0932 | 0.512259 | 0.512170 |
| 5 | 7.09 | 32.59 | 0.1315 | 0.512209 | 0.512084 |
| 4 | 10.81 | 53.75 | 0.1216 | 0.512212 | 0.512096 |
| 3 | 7.48 | 32.17 | 0.1405 | 0.512223 | 0.512090 |
| 1 | 5.45 | 28.00 | 0.1177 | 0.512264 | 0.512152 |
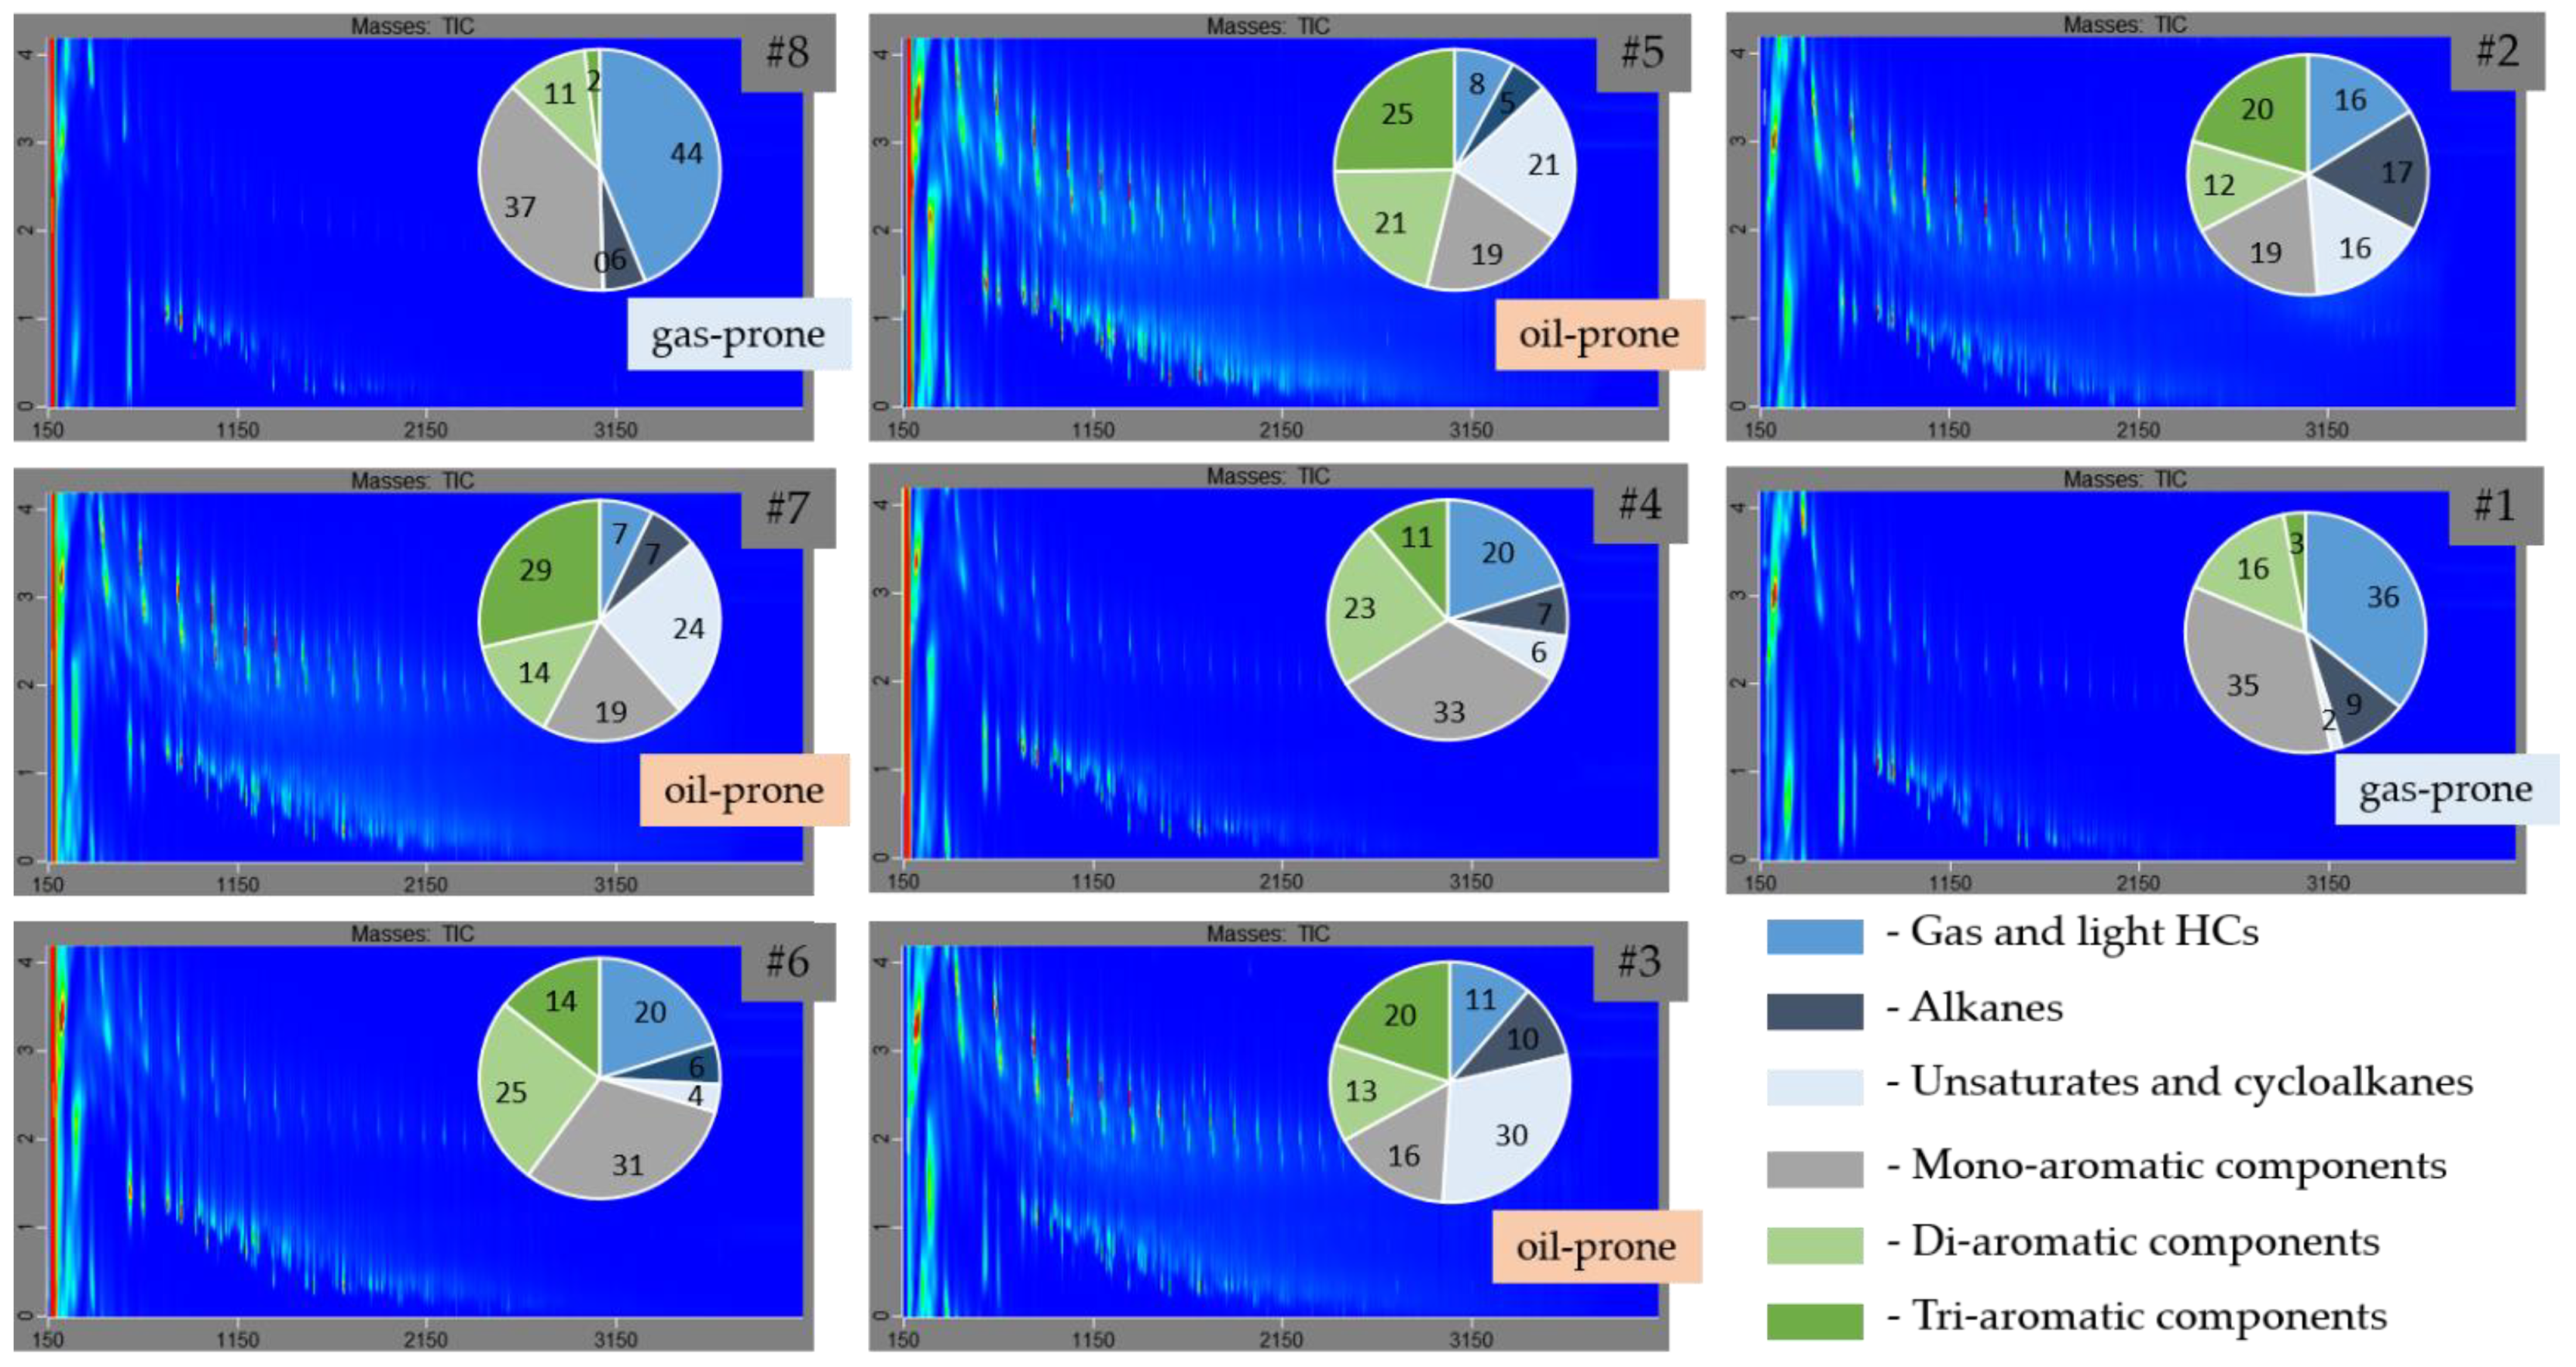
| Member # | Gas and Light HCs, % | Aliphatic Compounds, % | Aromatic Compounds, % | Aliphatic/ Aromatic Ratio | |||
|---|---|---|---|---|---|---|---|
| Alkanes | Unsaturates, Cycloalkanes | Mono-Aromatics | Di-Aromatics | Tri- Aromatics | |||
| 8 | 44 | 6 | 0 | 37 | 11 | 2 | 11/89 |
| 7 | 7 | 7 | 24 | 19 | 14 | 29 | 33/67 |
| 6 | 20 | 6 | 4 | 31 | 25 | 14 | 13/87 |
| 5 | 8 | 5 | 21 | 19 | 21 | 25 | 29/71 |
| 4 | 20 | 7 | 6 | 33 | 23 | 11 | 16/84 |
| 3 | 11 | 10 | 30 | 16 | 13 | 20 | 45/55 |
| 2 | 16 | 17 | 16 | 19 | 12 | 20 | 39/61 |
| 1 | 36 | 9 | 2 | 35 | 16 | 3 | 17/83 |
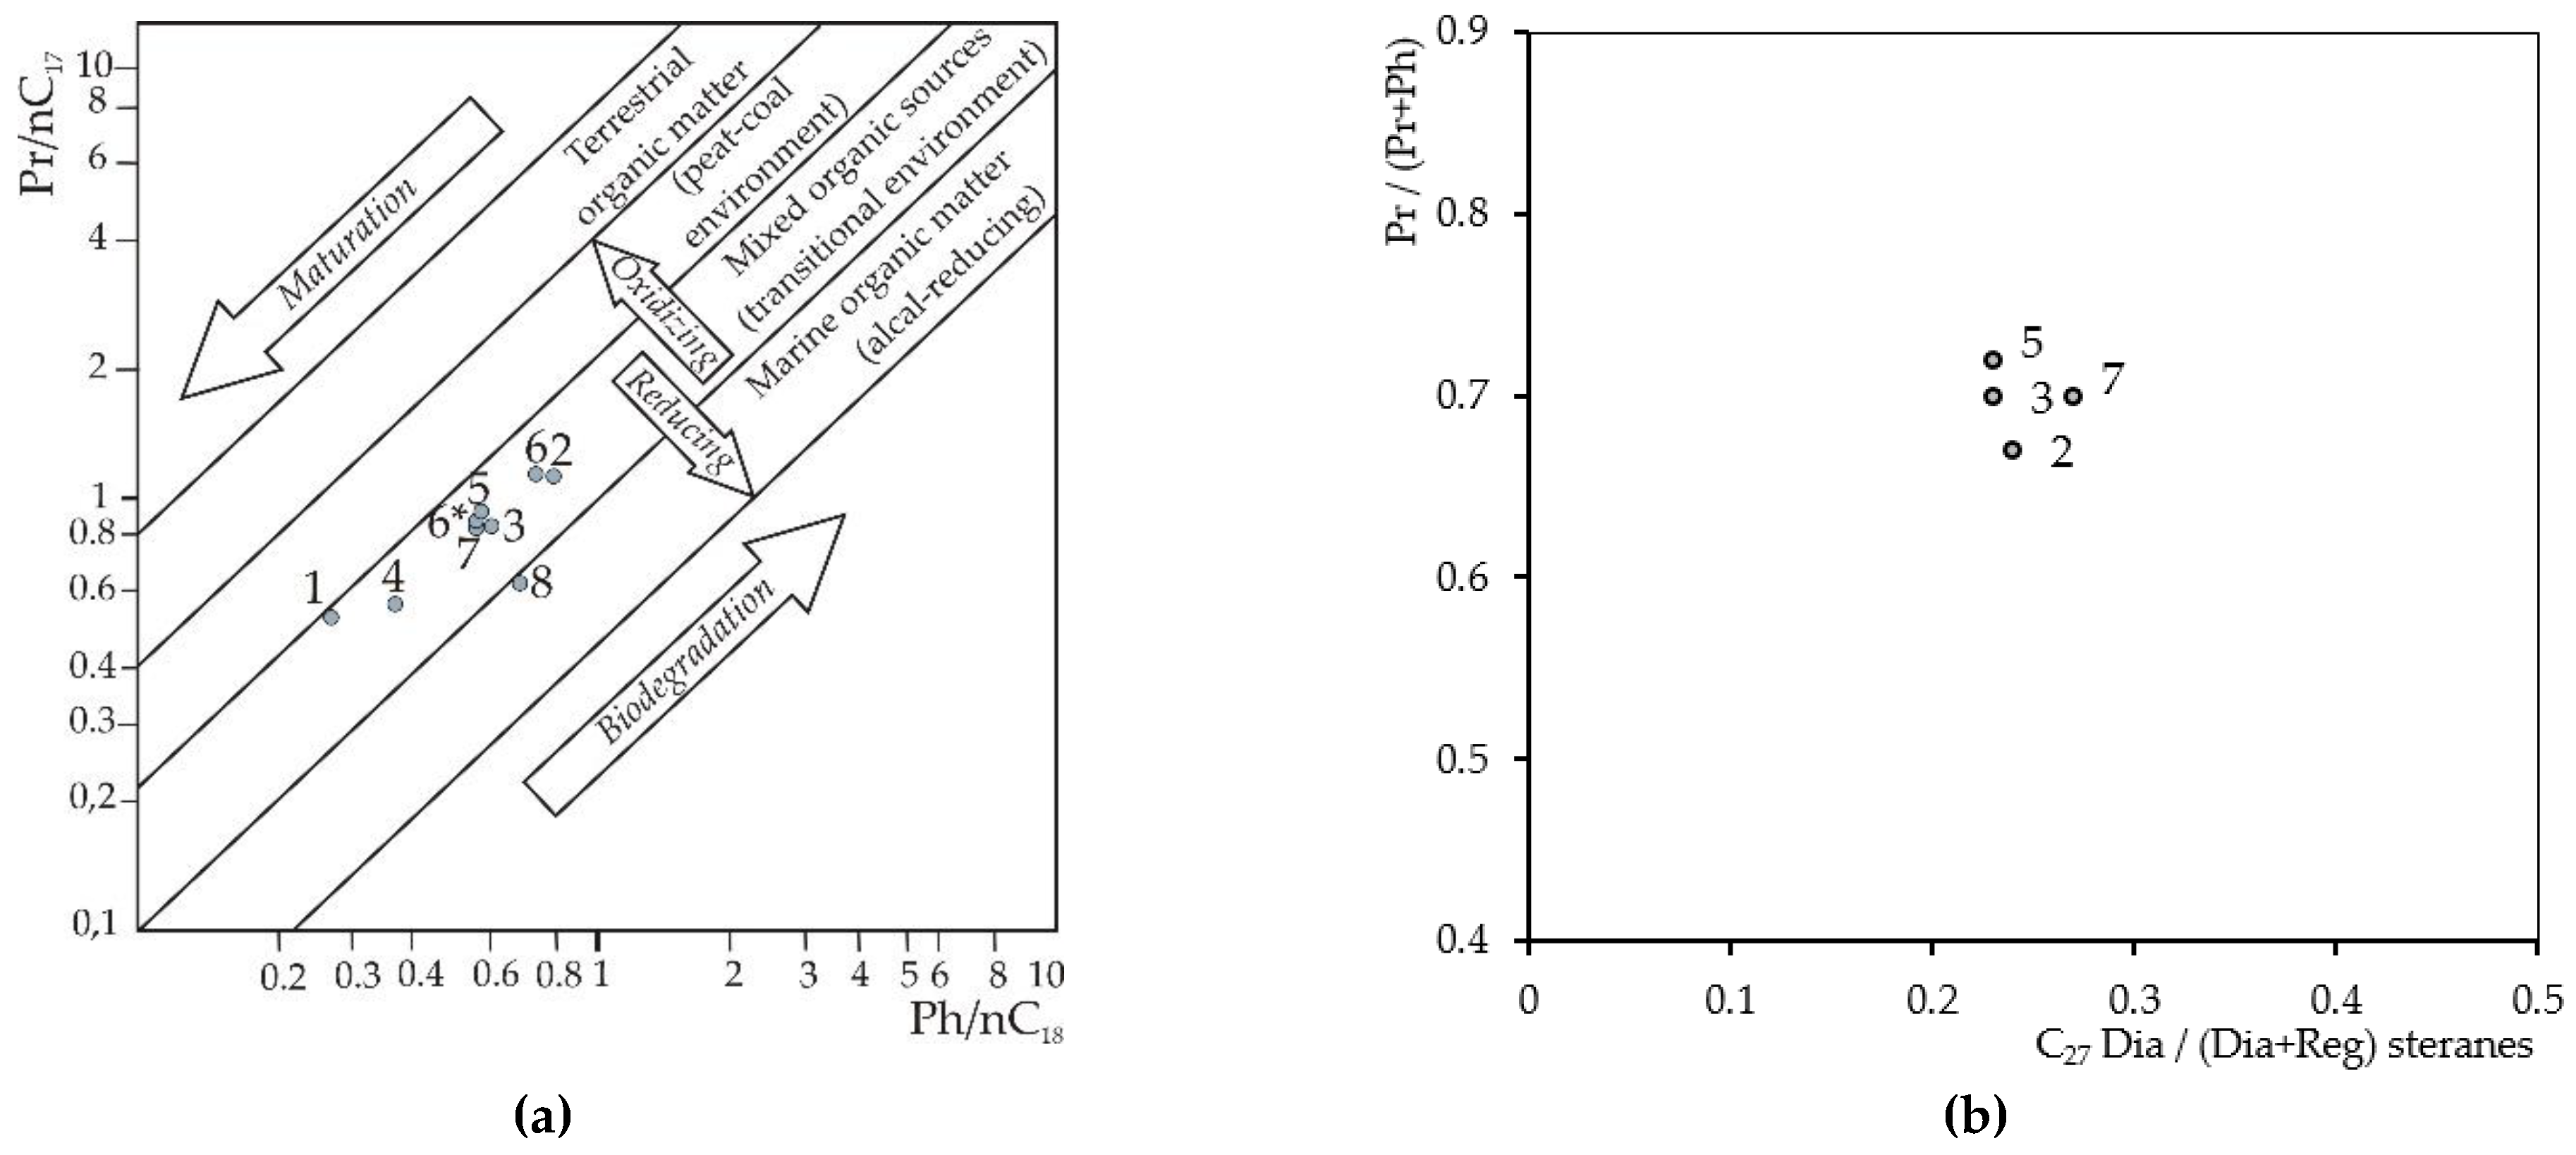
| Parameter 1 | Member # | ||||||||
|---|---|---|---|---|---|---|---|---|---|
| 1 | 2 | 3 | 4 | 5 | 6 * | 6 | 7 | 8 | |
| Pr/Ph | 4.20 | 2.07 | 2.38 | 3.03 | 2.53 | 2.39 | 1.88 | 2.34 | 1.90 |
| Pr/(Pr + Ph) | 0.81 | 0.67 | 0.70 | 0.75 | 0.72 | 0.71 | 0.65 | 0.70 | 0.65 |
| Pr/n-C17 | 0.53 | 1.13 | 0.87 | 0.57 | 0.94 | 0.88 | 1.15 | 0.87 | 0.68 |
| Ph/n-C18 | 0.26 | 0.79 | 0.58 | 0.36 | 0.55 | 0.54 | 0.73 | 0.54 | 0.67 |
| Ki | 0.44 | 0.97 | 0.76 | 0.49 | 0.78 | 0.74 | 0.96 | 0.74 | 0.67 |
| n-C27/n-C17 | 0.00 | 0.70 | 0.08 | 0.02 | 0.19 | 0.08 | 0.08 | 0.20 | 0.01 |
| MNR | 0.79 | 0.63 | 0.99 | 0.87 | 0.85 | 0.74 | 0.58 | 0.91 | 0.84 |
| 4/1-MDBT | 2.33 | 2.08 | 2.39 | 2.43 | 2.13 | 3.52 | 2.75 | 2.23 | 2.33 |
| MPI | 0.41 | 0.38 | 0.50 | 0.29 | 0.26 | 0.33 | 0.54 | 0.38 | 0.59 |
| TAS | none | 0.41 | 0.53 | 0.99 | 0.52 | n/a | n/a | 0.49 | none |
| Aliph/Arom | 9.2 | 24.5 | 7.4 | 7.3 | 13.1 | 21.8 | 7.4 | 8.4 | 7.1 |
| Dia/(Dia + Reg) C27 steranes | none | 0.24 | 0.23 | traces | 0.23 | traces | traces | 0.27 | traces |
| Regular steranes, % | |||||||||
| C27 | none | 55 | 58 | traces | 48 | traces | traces | 46 | none |
| C28 | none | 27 | 23 | traces | 30 | traces | traces | 29 | none |
| C29 | none | 19 | 19 | traces | 21 | traces | traces | 26 | none |
| Terpanes | |||||||||
| Ts/Tm | none | 0.94 | 1.51 | 0.98 | 1.51 | 3.11 | 1.95 | 1.23 | traces |
| C29/C30Hop | none | 0.53 | 0.74 | 1.16 | 0.61 | 0.96 | 1.46 | 0.61 | 1.06 |
| C31H | none | 0.69 | 0.60 | traces | 0.60 | traces | traces | 0.64 | none |
| Homohopanes distribution, % | |||||||||
| C31 | none | 49 | 46 | traces | 50 | traces | traces | 50 | traces |
| C32 | 32 | 36 | 36 | 34 | |||||
| C33 | 27 | 27 | 26 | 25 | |||||
| C34 | 18 | 20 | 19 | 18 | |||||
| C35 | 14 | 16 | 14 | 14 | |||||
Publisher’s Note: MDPI stays neutral with regard to jurisdictional claims in published maps and institutional affiliations. |
© 2021 by the authors. Licensee MDPI, Basel, Switzerland. This article is an open access article distributed under the terms and conditions of the Creative Commons Attribution (CC BY) license (https://creativecommons.org/licenses/by/4.0/).
Share and Cite
Leushina, E.; Bulatov, T.; Kozlova, E.; Panchenko, I.; Voropaev, A.; Karamov, T.; Yermakov, Y.; Bogdanovich, N.; Spasennykh, M. Upper Jurassic–Lower Cretaceous Source Rocks in the North of Western Siberia: Comprehensive Geochemical Characterization and Reconstruction of Paleo-Sedimentation Conditions. Geosciences 2021, 11, 320. https://doi.org/10.3390/geosciences11080320
Leushina E, Bulatov T, Kozlova E, Panchenko I, Voropaev A, Karamov T, Yermakov Y, Bogdanovich N, Spasennykh M. Upper Jurassic–Lower Cretaceous Source Rocks in the North of Western Siberia: Comprehensive Geochemical Characterization and Reconstruction of Paleo-Sedimentation Conditions. Geosciences. 2021; 11(8):320. https://doi.org/10.3390/geosciences11080320
Chicago/Turabian StyleLeushina, Evgeniya, Timur Bulatov, Elena Kozlova, Ivan Panchenko, Andrey Voropaev, Tagir Karamov, Yakov Yermakov, Natalia Bogdanovich, and Mikhail Spasennykh. 2021. "Upper Jurassic–Lower Cretaceous Source Rocks in the North of Western Siberia: Comprehensive Geochemical Characterization and Reconstruction of Paleo-Sedimentation Conditions" Geosciences 11, no. 8: 320. https://doi.org/10.3390/geosciences11080320
APA StyleLeushina, E., Bulatov, T., Kozlova, E., Panchenko, I., Voropaev, A., Karamov, T., Yermakov, Y., Bogdanovich, N., & Spasennykh, M. (2021). Upper Jurassic–Lower Cretaceous Source Rocks in the North of Western Siberia: Comprehensive Geochemical Characterization and Reconstruction of Paleo-Sedimentation Conditions. Geosciences, 11(8), 320. https://doi.org/10.3390/geosciences11080320