Abstract
Akrotiri Salt Lake is located 5 km west of the city of Lemesos in the southernmost part of the island of Cyprus. The evolution of the Akrotiri Salt Lake is of great scientific interest, occurring during the Holocene when eustatic and isostatic movements combined with local active tectonics and climate change developed a unique geomorphological environment. The Salt Lake today is a closed lagoon, which is depicted in Venetian maps as being connected to the sea, provides evidence of the geological setting and landscape evolution of the area. In this study, for the first time, we investigated the development of the Akrotiri Salt Lake through a series of three cores which penetrated the Holocene sediment sequence. Sedimentological and micropaleontological analyses, as well as geochronological studies were performed on the deposited sediments, identifying the complexity of the evolution of the Salt Lake and the progressive change of the area from a maritime space to an open bay and finally to a closed salt lake.
1. Introduction
Coastal lagoons and associated salt marshes are dynamic environments, which change under the impact of local, regional and global actions such as waves, tides, fluvial influence, climatological factors, coastal and subaerial erosion and sea level fluctuations [1]. Coastal lagoons are very common in Mediterranean coast-lines. They are inland waterbodies, usually developing parallel to the coast and separated from the open sea by a sandy barrier [2,3,4]. They can be permanently open or intermittently closed off [5]. Typically, one or more restricted inlets ensure their continuous or intermittent connection to the open sea. Water depth varies from a few centimeters up to a few meters [6].
The evolution of a coastal lagoon from an open to a semienclosed environment is commonly recorded in Holocene buried lagoonal successions [7,8]. The gradual development of sandy barriers favors the progressive isolation of the brackish water body [4].
Sedimentological, palaeontological, geochemical and mineralogical studies at lagoonal successions provide information regarding depositional environments, elemental fluxes, palaeoclimate, sea level fluctuation, tsunamigenic phenomena and tectonic activity [9,10,11,12,13]. Lagoonal geochemical profiles, such as relative changes and altering trends of elemental concentration, can provide information about palaeoenvironmental changes [8,14,15]. Concerning micropalaeontological analysis, ostracods and benthic foraminifera are commonly used to provide evidence on changes of the depositional environment. Ostracods are small, bivalved crustaceans inhabiting most aquatic environments and are sensitive to environmental changes [16,17]. They are extensively used in interpreting palaeoenvironmental conditions, especially in the fragile coastal marine ecosystems where sea level changes and climatic oscillations are recorded [18,19,20]. Benthic foraminifera are unicellular organisms that are abundantly present in the marine realm. These benthic organisms are widely used as tools for the reconstruction of palaeoenvironments, as they generally inhabit relatively narrow ranges of environmental conditions. They are especially suitable for monitoring rapid environmental changes because many species are opportunistic, rapidly responding to environmental change [21,22,23,24,25,26].
Palaeoenvironmental reconstructions may significantly improve our understanding of past human interactions with the environment and the impact of relative sea-level changes on the coastal environment [10,13,27,28,29]. Furthermore, paleoenvironments formed during the Late Quaternary provide significant information in estimating the response of present-day coastal areas to future sea level and climate changes [30,31,32].
The purpose of this study was the palaeogeographic reconstruction of the Akrotiri Salt Lake through a multiproxy approach which includes sedimentological, micropalaeontological, geochemical and mineralogical analyses of the retrieved sediment cores. This is the first time that such a combined study has taken place in this significant area and aims to provide valuable data regarding the development of such types of coastal environments in the context of relative sea level change, neotectonic movements, geomorphological evolution and climatological change since the beginning of the Holocene in the eastern Mediterranean.
2. Study Area
The Akrotiri peninsula is located 5 km west of Lemesos city and is the southernmost part of the island of Cyprus (Figure 1). It consists of Quaternary sediments which have been unconformably deposited on Miocene chalks and marls of the Pachna formation [33]. The Quaternary sediments are composed of fluvial, marine, deltaic, aeolian and lagoonal deposits [34] (Figure 2). In the central part of the peninsula the Akrotiri Salt Lake dominates the topography, covering an area of approximately 20 km2. Today, the maximum depth of the Salt Lake reaches 2.8 m below mean sea level during the winter period. On the western part of the peninsula an extensive tombolo has developed, which consists of deltaic and aeolian deposits. To the east of the Salt Lake, there are series of sand dunes and sandy beach bars. The northern area is covered by Quaternary alluvial fans, which were formed by the discharged material of Kouris River, the largest river in Cyprus. In the southern region of the Peninsula, uplifted marine terraces are overlapped by sandy layers of aeolian origin [34] (Figure 2).

Figure 1.
Study area of the Akrotiri Peninsula and archeological sites (green dots) and evidence of human occupation dated from the Epipaleolithic period (12,000 BP) until the present day (Satellite photography of the study area. Red dots represent the locations of the cores (Source: Esri, DigitalGlobe, GeoEye, Earthstar Geographics, CNES/Airbus DS, USDA, USGS, AeroGRID, IGN, and the GIS User Community).
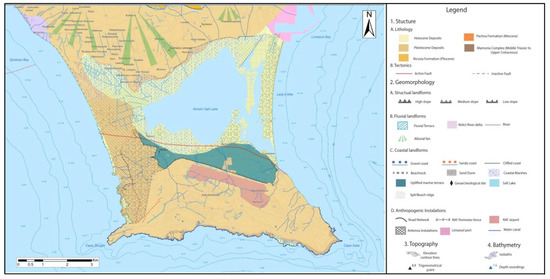
Figure 2.
Geomorphological map of the Akrotiri Peninsula [34].
The development of the peninsula started with the deposition of calcareous marls in the Episkopi grabben during the Miocene, which resulted in the Akrotiri high topography on the south in the form of an isolated island [35]. The marine strait between the Akrotiri Island and the mainland eventually closed during the Quaternary, and several geomorphic features were developed.
The Quaternary tectonic setting of the area [36] is indicating a gradual uplift of the southwest area of Akrotiri peninsula which was driven by a left lateral strike slip fault with vertical components (Figure 2).
The Akrotiri Peninsula has a plethora of archaeological sites, and evidence of human occupation is dated from the Epipaleolithic period (12,000 BP) until the present day (Figure 1). It is considered as the most important archaeological area in Cyprus. The Akrotiri Peninsula contains the earliest evidence of human colonization on Cyprus at ~12,000 BP at the Aetokremnos site, which is located at the center of the southern coast line of the study area [37,38,39,40,41]. During the Bronze Age (2500–1050 BC) there were numerous sites located along Kouris River and around the Salt Lake. The first evidence of substantial activity occurring in the area dates back to the Late Hellenistic- Early Roman Period (1st century BC–1st century AD), which appears to the southern end of the peninsula and continues through the Late Roman to Early Byzantine period (3rd century AD–4th century AD) with a number of settlements [42,43] and Dreamer’s Bay harbor [44]. Evidence of Frankish and Venetian Period (1191–1571 AD) also appears in the area, such as the Venetian canal at the east of the Salt Lake. Maps and historical documents from that period (Venetian) depict the study area and have been used for the interpretation of the paleoenvironmental evolution of the area.
3. Materials and Methods
Geomorphological mapping and a field survey of the coastal area of Akrotiri Peninsula was conducted with the use of topographic maps at a scale of 1:5000. Orthomaps acquired by the Cyprus Land and Survey Department, and Quickbird satellite images (https://portal.dls.moi.gov.cy/, accessed on 20 May 2020) were introduced and analyzed in the GIS environment. Historical maps relative to the area dated from the fifteenth century AD, and historical bibliographic literature were also taken into account for the geomorphological analysis of the study area.
For the evaluation of the palaeogeographical evolution of the studied area, three shallow cores (AKC1, AKC2 and AKC3) were retrieved from the eastern side of the Akrotiri Salt Lake. The cores were extracted using an Atlas Copco Cobra 32T vibracorer, (Stockholm, Sweden) with a 5.5 cm diameter plastic PVC tube in a metal tube housing and a titanium drilling head. The deepest core, AKC3, reached 3.4 m in depth, AKC1 2.6 m and AKC2 1.95 m. The site water depth at the time of AKC2 coring was approximately 0.7 m. The cores were sealed and transported at the laboratory of Mechanical Geology and Industrial Minerals of the Cyprus Geological Survey Department. The positions of the cores were measured with a Spectra SP80 differential GPS/GNSS system, (California, USA) receiver with vertical and horizontal accuracies of less than 2 cm.
The stratigraphic analysis of the cores was accomplished by studying sedimentary facies through visual inspection of the sediments. Detailed grain size analyses were performed on the collected core sediment samples, which included grain size analyses, hydrometric analyses and sieving analyses. For the determination of grain size, 43 samples were analyzed and classified based on Folk’s [45] nomenclature.
Downcore relative elemental composition of sediment cores were analyzed using an Olympus Vanta handheld XRF scanner equipped with the Olympus, (Tokyo, Japan) “Geochem” Suite. Analysis of the elemental composition was performed using an X-ray source with the voltage set to 8–40 kV, which enabled measurements of major and minor elements (Mg; Al; Si; P; S; K; Rb; Ca; Sr; Ti; V; Cr; Mn; Fe; Co; Ni; Cu; Zn; As; Se; Y; Zr; Nb; Mo; Ag; Cd; Sn; Sb; W; Au; Hg; Pb; Bi; Th and U) [46] (Table A1 and Table A2). The acquired XRF data were reported as elemental ratios [15,47,48,49] (Table A3). For the purposes of this study the elemental ratios of Sr/Ca and Ti/Ca were selected. Sr is an alkaline earth metal fixed by calcifying organisms at the same time as Ca. Hence Sr is a marker for biogenic origin. As Ca can be supplied from terrigenous sources (e.g., feldspars and clays) covariation of Ca and Sr suggests Ca was mainly be sourced from biogenic CaCO3. Sr/Ca is used as a proxy for aragonite, thus enhanced Sr may indicate the presence of high-Sr aragonite, which requires a shallow-water source [50]. Ti is a conservative element that generally varies directly with the coarse-grained terrigenous fraction. It is a common constituent of rocks, such as gneisses or schists, and it primarily indicates a terrigenous continental source. Moreover, Ti occurs in all minerals commonly associated with sand and silt fractions. Ti is widely used to record terrigenous sediment delivery. It commonly covaries with Fe but is arguably a better proxy for terrigenous sediment delivery than Fe, as it is redox-insensitive [51,52]. Ti/Ca records the relative variation of terrigenous input and marine carbonate [53,54]. It has been used to record changes from fluvial to marine deposits, for example, in incised-valley-fill sediments [55].
A total of 73 samples from the three cores were selected for micropalaeontological analysis, 26 samples from AKC1, 17 samples from AKC2 and 30 samples from AKC3. A fraction of 10 gr (dry weight) from each sample was treated with H2O2, wet sieved and dried. Ostracods and benthic foraminifers were collected from the fraction >125 µm. All ostracods were collected from each sample (Table A4, Table A5, Table A6, Table A7 and Table A8). When the specimen abundance was too high, aliquots were examined in order to collect at least 200 valves per sample. The identification of ostracod species was based on several publications [20,56,57,58,59,60,61]. Due to their low abundance and low diversity, the benthic foraminifers were not statistically processed. Where possible, an average of 200 foraminifer specimens were randomly picked from each fraction >0.125 mm. In the case of a very low density of specimens (usually in sandy sediments), the entire dried residue was microscopically examined (Table A9). Ecological information, especially on depth, hydrodynamism, salinity and substrates, was extracted from the abundant available literature dealing with benthic foraminifers [62,63,64,65].
Geochronological studies with AMS radiocarbon dating were applied on seven samples (mollusk shells) which were extracted from the cores by the CEntro di DAtazione e Diagnostica (CEDAD) in Lecce, Italy. Radiocarbon ages were calibrated through the online software Calib 7.10 [66] using the INTCAL13 atmospheric data set for terrestrial samples and the MARINE13 curve for marine samples [67] with a DR value of −52 ± 50 estimated for the eastern Mediterranean [68].
4. Results
All the cores were studied regarding their stratigraphy and grain size analysis, hydrometric and sieving analyses. Sedimentological statistical parameters such as mean, sorting, skewness, and kurtosis were calculated using Gradistat V.4 software and they appear in Table 1 [69].

Table 1.
Sedimentological statistics, mean, sorting, skewness, and kurtosis calculated using Gradistat V.4 software [69].
4.1. AKC1
Sediment core AKC1 was subdivided into five lithological units. On the lowermost lithological unit LU1a, homogenous whitish-grey sediments with the presence of small, rounded gravels were recognized in the interval between 260 cm and 230 cm. The sediment was predominantly constituted of high percentages of clay and fine sand sized particles (~63%). The lowermost part of core AKC1 was characterized by medium Sr/Ca and Ti/Ca ratios (Figure 3). Ostracod assemblages (Figure 4) were characterized by the abundance of Cyprideis torosa, an euryhaline species, abundant or dominant in assemblages for all the transitional environments, especially in shallow lagoons (<30 m depth) and estuaries when salinity ranges between 2–17‰ [60,70,71]. Cyprideis torosa was accompanied by the polyhaline–euhaline shallow water species Basslerites berchoni [61,72], the marine species Xestoleberis communis and Aurila woodwardia, which are mainly epiphytal, tolerating salinity fluctuations, and occur also in brackish environments [58,73,74,75], and other shallow littoral marine taxa such as Loxoconcha species (mainly with the mostly epiphytal species L. affinis; [58,75]) and Phlyctenophora sp. Benthic foraminiferal fauna was oligospecific, mainly dominated by Miliolidae (~30%) and Ammonia tepida (~25%).
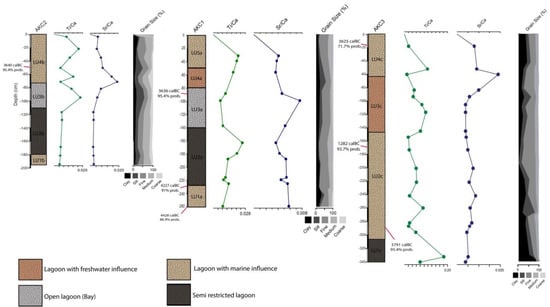
Figure 3.
XRF data, grain size analysis and palaeoenvironmental interpretation of the cores.
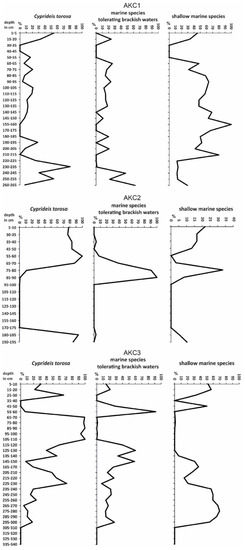
Figure 4.
Distribution of ostracod assemblages along the cores. Marine species tolerating brackish waters: B. berchoni, X. communis, A. woodwardii. Shallow marine species: species of the genera Loxoconcha, Phlyctenophora, Xestoleberis, Semicytherura, Pontocythere, Leptocythere and Urocythereis. sp.
Sediments of the overlying unit LU2a in core AKC1 (between 230 and 140 cm) appeared homogenous grey with the presence of fossil mollusk fragments and Posidonia fibers. This unit was characterized by a coarser grain size with high percentages of fine and medium sand sized particles (~79%). The acquired XRF data indicated an increase in Ti/Ca and a decrease in Sr/Ca ratios (Figure 3). Ostracod analysis (Figure 4) revealed low ostracod abundance and mixed assemblages, mainly with C. torosa, X. communis, A. woodwardii, Phlyctenophora sp., L. affinis and other shallow littoral marine taxa (e.g., [57,75]) such as species of Semicytherura, Pontocythere and Urocythereis. sp. Present in the samples were other open marine taxa (e.g., [57]) such as species of Hiltermannicythere, Carinocythereis and Cytherella. Benthic foraminiferal assemblages remained rather stable with the high presence of Miliolidae and A. tepida. At the level between 220 and 225 cm, Nubecularia lucifuga was present, indicating the existence of a sheltered bay. Seagrass (Posidonia) probably provided a substrate for attached forms.
The third lithological unit, LU3a, was recognized in the core interval between 140 and 80 cm. Sediments in this unit were gray with a slightly finer grain size. Clay, silt and fine sand sized particles predominated (~85%). Some fossil mollusk fragments, and small rounded gravels were also observed. The obtained XRF data showed decreased values of Ti/Ca ratios (lower value in this core) and a significant increase of Sr/Ca ratios (higher value in this core) (Figure 3). Micropaleontological analysis revealed much richer ostracod faunas, mainly with Loxoconcha species, C. torosa, Phlyctenophora sp. and X. communis. The abundance of Ammonia tepida is in complete agreement with the lithological data and the ostracod fauna (Figure 4), further reinforcing the impression of a restricted marine environment.
Sediments of the lithological unit LU4a in core AKC1 between 80 and 50 cm were distinguished by their grey-greenish color and coarser grain size. LU4a was characterized by higher percentages of fine and medium sand sized particles (~76%). The Ti/Ca ratio increased and Sr/Ca ratio showed a decreased trend (Figure 3). Ostracods analysis revealed the presence of freshwater taxa [71] Heterocypris salina and Limnocythere sp. at the upper part of this unit.
Sediments of the topmost unit, LU5a, in the core AKC1 between 50 and 0 cm, appeared with a brown-grey color and a slightly coarser grain size. Fine and medium sand sized particles predominated, with percentages up to 82%. The Ti/Ca and Sr/Ca ratios showed increased values (Figure 3). Ostracod and benthic foraminiferal assemblages were very poor at the upper part of the sediment core, consisting mainly of shallow marine taxa (mainly Ammonia sp., Cibicides sp. and Phlyctenophora sp. and Urocythereis sp. respectively).
4.2. AKC2
Sediment core AKC2 was subdivided into four lithological units (Figure 3). The lowermost lithological unit, LU1b, was identified at the interval between 195 cm and 180 cm. Whitish-grey sediments with the presence of small angular gravel were identified. They were predominantly constituted of fine and medium sand sized particles (~74%). The lowermost part of core AKC2 was characterized by low Sr/Ca and Ti/Ca ratios (Figure 3). Ostracod assemblages of this unit were characterized by the dominance of C. torosa (Figure 4).
Sediments of the overlying unit LU2b in core AKC2 between 180 and 110 cm, appeared grey, with the presence of angular and square gravels. This unit was characterized by a coarser grain size with high percentages of fine and medium sand sized particles (~60%) and significant percentages of coarse sand sized particles (~15%). The acquired XRF data indicated stable values of Ti/Ca and Sr/Ca ratios (Figure 3). The interval between 180 and 110 cm was barren of microfossils.
The third lithological unit, LU3b, was recognized in the core interval between 110 and 75 cm. Sediments in this unit were whitish-gray with a significantly finer grain size. Clay and silt sized particles predominated with percentages up to ~55% (Figure 3). The obtained XRF data showed a rapid increase of Ti/Ca ratios (highest value in this core) followed by a rapid decrease and a steady increase of Sr/Ca ratios. Ostracod assemblages at this interval consisted mainly of X. communis and A. woodwardii (Figure 4).
Sediments of the topmost unit LU4b in core AKC3 between 75 and 0 cm), appeared with a grey to light-gray color and with a coarser grain size. Fine and medium sand sized particles appeared with percentages up to 70%. Clay and silt sized particles also appeared with a percentage of 47% at the depth of 39–27 cm. The Ti/Ca ratios values increased between 75 and 60 cm, which was followed by a decrease of the values between 60 cm and 50 cm, then an increase of the values between 50 cm and 20 cm, followed by a steady decrease up to the surface of the core. Sr/Ca ratios increased (higher value in this core) followed by a slow decrease up to the surface of the core (Figure 3). Ostracod assemblage was characterized by the dominance of C. torosa (Figure 4). The benthic foraminifer assemblage was characterized by Peneroplis planatus and P. pertusus, together with Quinqueloculina sp. and Ammonia beccari.
4.3. AKC3
The sediment core AKC3 was subdivided into four lithological units (Figure 3). The lowermost lithological unit LU1c was identified at the interval between 340 cm and 305 cm. Reddish- dark brown sediments were identified. They were predominantly constituted of silt and clay sized particles (~77%). The lowermost part of core AKC3 was characterized by increasing Ti/Ca ratios at 332 cm and followed by a slow decrease. Sr/Ca ratios were low and stable (Figure 3). Unit LU1c was barren of microfossils.
Sediments of the unit LU2c in core AKC3 between 305 and 145 cm) appeared greyish-brown with the presence of mollusk fragments and some small angular gravels on the 294–280 cm horizon. This unit was characterized by a slightly coarser grain size with percentages of fine sand of ~35% and clay and silt sized particles of ~45%. The acquired XRF data indicated stable values in Ti/Ca and Sr/Ca ratios with the exception of the Ti/Ca ratio peak at 260 cm (Figure 3). Ostracod assemblages (Figure 4) were composed mainly of C. torosa, Phlyctenophora sp., A. woodwardii and Loxoconcha spp.
The third lithological unit, LU3c, was recognized at the core interval between 145 and 65 cm (Figure 3). Sediments in this unit were reddish-brown with slightly finer grain size. Clay and silt sized particles appeared with percentages up to ~50%, with fine sand sized particles up to 40% (Figure 3). The obtained XRF data showed an increase of Ti/Ca ratios followed by a decrease and a steady increase of Sr/Ca ratios peaking to their highest value for this core at the upper part of this lithological unit (Figure 3). The ostracod faunas were characterized by the high abundance of C. torosa, forming, especially between the interval 105–65 cm, nearly monospecific assemblages (Figure 4), while the presence of the species H. salina at level 95–100 cm indicated freshwater input.
Sediments of the topmost unit LU4c in core AKC3 between 65 and 0 cm appeared with a brownish-grey color and a slightly finer grain size (Figure 3). Fine sand sized particles appeared with percentages up to 30%. Clay and silt sized particles appeared with percentages of 54%. The Ti/Ca ratios showed an increase at 50 cm (highest values for this core) followed by a decrease. Sr/Ca ratios showed a significant decrease up to the surface of the core (Figure 3). Ostracod assemblages (Figure 4) presented similar compositions to those of unit LU2c at the lower part of AKC3.
4.4. Geochronology
In total, seven samples (mollusk shells) from all the cores were processed for AMS radiocarbon chronology (Table 2). From core AKC1, three samples were selected (LTL19232A, LTL19233A, LTL19234A) at depths of −90 cm, −230 cm and −260 cm. The ages provided from a geochronological analysis and calibrations were 3510–3110 cal BC (95.4%, 2 sigma), 4072–3727 cal BC (95.4%, 2 sigma) and 4328–4017 cal BC (95.4%, 2 sigma) for the above-mentioned depths.
Table 2.
Age determination results (at 2-sigma) of the selected samples. Age calibrated using MARINE13 curve for marine samples [67] with a DR value of −52 ± 50 estimated for the eastern Mediterranean [68].
From the core AKC2, one sample (LTL19235A) was processed with AMS radiocarbon chronology at a depth of −50 cm with age estimation of 3573–3167 cal BC (95.4%, 2 sigma).
From core AKC3, three samples were dated with AMS radiocarbon chronology (LTL19236A, LTL19237A, LTL19238A) at depths of −20 cm, −170 cm and −280 cm, which provided ages of 3482–3074 cal BC (95.4%, 2 sigma), 1341–1598 cal BC (95.4%, 2 sigma) and 3693–3379 cal BC (95.4%, 2 sigma), respectively. The age provided for sample LTL19237A from core AKC3 at a depth of −170 cm was not adopted as it appeared to be a contamination from the top layers of the core.
5. Discussion
All the measured parameters in the lithological units from core AKC1 showed distinctive patterns, based on which we were able to interpret the palaeoenvironmental conditions at this part of Akrotiri Salt Lake basin during the deposition of sediments of these units (from ~4100 cal BC).
The dominance of C. torosa at the base of AKC1, accompanied mainly by marine and mostly epiphytal species tolerant to brackish conditions, indicates a lagoonal environment with marine influence. Upwards, the prevalence of shallow marine taxa pointed to the opening of the lagoon and the formation of a coastal shallow marine environment. This was further supported by the coexistence of A. tepida and Miliolidae. The differences in the dominance of the relative abundances of this foraminiferal fauna can be explained by the variations in salinity and organic matter supply. Partly, the presence of the epiphytic N. lucifuga indicates the existence of a sheltered bay with seagrass (Posidonia) probably providing a substrate for these attached forms.
Grain size, which consisted of fine material, was indicative of a low energy environment (Figure 3). The geochemistry of core AKC1 indicated a relatively stable ratio of gradual Ti/Ca ratios, which represent input of terrestrially sourced lithogenic material from soil erosion from the catchment into the salt lake, with the exception of −160 cm and −30 cm, where there was a rapid increase of Ti/Ca ratios that can be interpreted by the higher input of lithogenic material to this area of the salt lake corresponding to climatic changes or tectonic activation of the area. The Sr/Ca ratio through the core, which can be used as a proxy of shallow marine environmental conditions, showed a stable shallow lake with continuous marine influence with the exception of level −100 cm, in which there is a rapid increase of Sr/Ca ratios most probably as a result of further shoaling of the water depth due to sea level change [14,49,76,77,78]. Lithological unit LU4a (~3000 BC), in which there was presence of freshwater ostracod taxa, indicated a strong freshwater inflow to the area.
Micropalaeontological assemblages of core AKC2 were marked by the dominance of C. torosa, reflecting a shallow lagoonal enviroment, while accompanying fauna indicated marine as well as freshwater influences. Nonetheless, the prevalence of marine epiphytal species, tolerant to salinity fluctuations between 110 cm and 75 cm, pointed to the opening of the lagoon during this interval. The existence of A. tepida, a brackish water benthic foraminifer, tolerant to hyposaline and highly schizohaline conditions [26,79], further supported the inferred paleoenvironmental conditions. Towards the top, the high dominance of Peneroplis planatus together with P. pertusus, which are species living in association with sea grass, distributed through the coastal areas, further support the existence of a shallow, marine environment. Peneroplis species together with Miliolidae are associated with salinities of 34–68‰, temperatures of 17–27 °C, and fine sand [80]. Furthermore, in this part of the core, the relative abundance of Ammonia beccari increased, indicating a rather augmented supply of organic matter (e.g., [79]).
The grain size consisted mainly of fine sand size particles showing a low energy lagoonal environment. The geochemistry of the core AKC2 was fairly stable with the exception of Ti/Ca ratios rising at −95 cm, indicating a higher input of lithogenic material to the Salt Lake, probably from climatic variation and in accordance with micropalaeontological assemblages, indicating an opening of the lagoon (before 3500 BC). A peak of the Sr/Ca ratio at −70 cm also indicated a further shoaling of the water depth of the Salt Lake, more likely due to tectonic action.
Ostracod assemblages throughout core AKC3 (Figure 4) indicated a shallow lagoonal environment with continuous marine influence. The exception of LU3c (145–65 cm), in which ostracod taxa assemblages were nearly monospecific, and C. torosa and freshwater species were scarcely present, indicated the isolation of that part of the lagoon.
The location of the core and the data from LU3c suggest that the spit at the east of the Salt Lake, which was already formed at that time period (between ~3600 and 3000 BC), increased significantly, resulting in the isolation of that part of the salt lake from the sea. The geochemical analysis of the core indicated stable rates of Ti/Ca ratios (with the exception of −206 cm, −120 cm and −55 cm), in which there was higher input of lithogenic material to this area of the Salt Lake, corresponding to climatic change or tectonic activation of the area. Sr/Ca ratios were stable along the core with the exception of level −65 cm, in which a high peak of Sr/Ca ratios was observed. The Sr/Ca peak indicated a shoaling of the water depth of the Salt Lake, which corresponds to the isolation of this part of the salt lake from the sea at that time period (~3200 BC).
The ages provided by AMS radiocarbon in correlation with the analyses of the cores showed a high sediment deposition rate to the north-east side of the Salt Lake and a lower deposition rate at the center-east side of the salt lake. This is in direct connection with the data, suggesting a development of a spit from the north-east to the south-east side of the area. We suggest that the north-east side of the lake was isolated from the sea earlier in time. The east central area was isolated from the sea much later in time and, as a result, wave action delayed the accumulation of sediments.
Historical maps, mainly from the Venetian period (1500–1600 AD), depict the Salt Lake isolated from the sea (Figure 5). The maps point out the connection between the lake and the sea by a channel to the east (Figure 1). This is also identified by historical texts which refer to an artificial channel [81]. The opening of the channel can explain the marine influence of the Salt Lake, which was observed on the top layers of the cores. The Kouris river is also depicted flowing directly to the north side of the lake, but there are no other data to suggest this.

Figure 5.
Historical maps of Cyprus. The study area is within the black square. (a) Ferrando Bertalli (1562), Isola Di Cipro. (b) Abraham Ortelius (1612) Cypri insulae nova descript. (c) Philipp Cluverius. (1682) Cyprus Ex deliniatione Ubonis Emmii. (d) Felice Brunello (1570) Isola di Cipro.
Palaeogeographic Reconstruction
With the combination of all the data retrieved from the core analysis, field investigation, remote sensing and GIS analysis, as well as historical sources, we propose the palaeogeographic evolution of the study area.
The development of the Salt Lake initially started during the Lower Holocene as an open bay from the east. The tombolo on the west was already formed by the discharged material from the Kouris river. Sand to the north-east started to accumulate, forming an early sand barrier. At approximately 6000–4000 years BP, the barrier moved further south, forming an extended spit which had, as a result, a semi open lagoon (Figure 6a). The north-east part of the lagoon was mostly protected from the sea, and a low energy environment was established. This caused, as a result, the deposition of finer material at that part of the lagoon and the freshwater influence to be more profound. At the center of the semi open lagoon, deposition was continues at low energy conditions because of the distance from the opening to the sea.
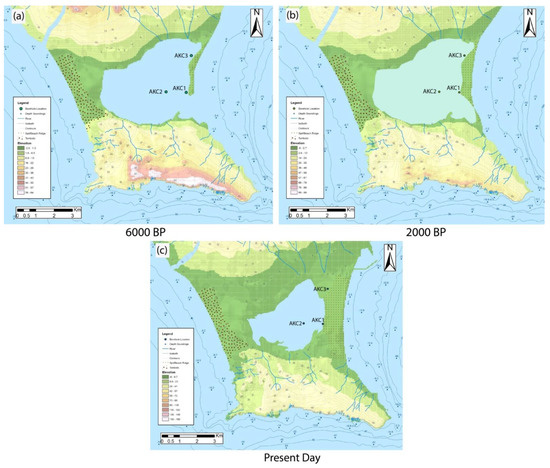
Figure 6.
Palaeogeographic reconstruction of the Akrotiri peninsula. (a) Palaeogeographic reconstruction of study area ~6000 BP. (b) Palaeogeography and paleocoastline ~2000 BP. (c) Present state of the study area.
During the period from 4000–2000 years BP, the spit extended and reached the south mainland, creating a narrow tombolo to the east that resulted in the closure of the lagoon (Figure 6b). The restriction of the lagoon from the direct influence of the sea created low energy conditions and the deposition of fine grain sediments. The freshwater influence was also more profound over the entire length of the lagoon, not only the north-east part. The narrow tombolo was developed enough to restrict the lagoon from the sea, but during high energy events the sea was able to overstep the tombolo and affect the lagoon.
During the last two millennia, the eastern tombolo extended further in length, creating a wide barrier between the closed lagoon and the sea (Figure 6c). At this stage, the anthropogenic influence was maximized in the area and the development of a channel (18 m wide) at the east (Figure 1), which connected the lagoon to the sea, established a new cycle of marine influence at the inner area of the lagoon. Because of the low topography of the eastern tombolo a direct connection of the sea with the lagoon occurred during high energy events (storms).
6. Conclusions
This study provides data on the middle and upper Holocene palaeoenvironmental development of the Akrotiri Salt Lake. The palaeoenvironmental changes were driven by sea level and climate variations and tectonic actions that occurred during the middle-upper part of the Holocene. Sediment cores AKC1, AKC2 and AKC3 revealed the depositional environments in the Salt Lake.
The Salt Lake developed in three phases, from an open bay (6000 to 4000 years BP) to a semi closed lagoon (4000 to 2000 years BP) and finally to a restricted lagoon (2000 years to the present day). During the entire time of the evolution of the Salt Lake, the influence of the sea was significant, either by direct connection, high energy events (storms) and/or anthropogenic activity.
The combined use of geochemical, sedimentological and palaeontological proxies, combined with radiocarbon dating, are valuable indicators for the interpretation of past environments in these types of geological setting and can shed light on the reconstruction of palaeogeographic evolution.
Author Contributions
Conceptualization, M.P. and N.E.; methodology, M.P., N.E., H.D. and T.T.; validation, M.P., N.E., H.D., T.T., F.S. and L.B.; investigation, M.P., N.E., F.S. and L.B.; writing—original draft preparation, M.P. and N.E.; review and editing, H.D., T.T., F.S. and L.B.; supervision, N.E. and M.P. All authors have read and agreed to the published version of the manuscript.
Funding
This research was partly funded by Honor Frost Foundation, 10 Carlton House Terrace, London SW1Y 5AH, “Small Grant Award”.
Institutional Review Board Statement
Not applicable.
Informed Consent Statement
Not applicable.
Acknowledgments
The authors would like to thank British Sovereign Bases Areas Administration (SBAA) and personnel for their support to this project. The authors would like to thank Eleana Karkani and Giannis Saitis for their contribution to the project.
Conflicts of Interest
The authors declare no conflict of interest.
Appendix A
Table A1.
Handheld XRF geochemistry of the studied cores (Mg to Fe values in ppm).
Table A1.
Handheld XRF geochemistry of the studied cores (Mg to Fe values in ppm).
| Core | Depth | Mg | Al | Si | P | S | K | Rb | Ca | Sr | Ti | V | Cr | Mn | Fe |
|---|---|---|---|---|---|---|---|---|---|---|---|---|---|---|---|
| AKC1 | 34 | 0 | 5268 | 40947 | 4592 | 503 | 797 | 3 | 116976 | 477 | 2548 | 57 | 198 | 742 | 31799 |
| AKC1 | 42 | 0 | 6291 | 50019 | 2869 | 0 | 1072 | 5 | 92045 | 348 | 1895 | 47 | 197 | 664 | 29854 |
| AKC1 | 60 | 8044 | 8753 | 56525 | 3192 | 221 | 904 | 4 | 100739 | 361 | 1756 | 62 | 229 | 685 | 29100 |
| AKC1 | 94 | 7551 | 3663 | 33386 | 2646 | 691 | 1395 | 7 | 133975 | 622 | 1440 | 43 | 313 | 511 | 17202 |
| AKC1 | 105 | 0 | 2986 | 23993 | 3679 | 534 | 532 | 4 | 179338 | 1367 | 1111 | 44 | 259 | 404 | 12870 |
| AKC1 | 145 | 7777 | 3325 | 39464 | 2532 | 230 | 510 | 3 | 142114 | 738 | 1200 | 42 | 155 | 401 | 13940 |
| AKC1 | 172 | 0 | 8868 | 55585 | 4814 | 241 | 1022 | 5 | 106482 | 389 | 2699 | 71 | 208 | 803 | 31127 |
| AKC1 | 189 | 0 | 5088 | 37798 | 2852 | 478 | 772 | 4 | 127823 | 543 | 2644 | 60 | 498 | 661 | 25659 |
| AKC1 | 198 | 0 | 5543 | 45500 | 3457 | 1734 | 561 | 4 | 125825 | 668 | 1609 | 40 | 366 | 532 | 20796 |
| AKC1 | 227 | 0 | 4663 | 39631 | 3350 | 2135 | 503 | 4 | 126617 | 685 | 1356 | 42 | 332 | 477 | 17537 |
| AKC1 | 231 | 0 | 3087 | 39551 | 1726 | 971 | 363 | 3 | 129696 | 582 | 1163 | 36 | 179 | 485 | 16248 |
| AKC1 | 237 | 0 | 3963 | 32224 | 3051 | 2354 | 727 | 5 | 131080 | 735 | 1772 | 52 | 360 | 540 | 17213 |
| AKC1 | 273 | 0 | 5288 | 45357 | 4193 | 2185 | 819 | 5 | 155471 | 903 | 1295 | 0 | 375 | 441 | 17371 |
| Depth | |||||||||||||||
| AKC2 | 3 | 14253 | 7216 | 42132 | 5906 | 1116 | 478 | 4 | 126697 | 692 | 1323 | 40 | 147 | 540 | 20886 |
| AKC2 | 17 | 0 | 4879 | 39381 | 3725 | 1310 | 523 | 3 | 129421 | 595 | 2683 | 63 | 421 | 927 | 33266 |
| AKC2 | 27 | 0 | 4209 | 36401 | 3571 | 1219 | 675 | 4 | 144540 | 1086 | 1913 | 46 | 304 | 732 | 22093 |
| AKC2 | 39 | 0 | 3665 | 28489 | 3929 | 955 | 871 | 3 | 175881 | 1544 | 923 | 44 | 130 | 586 | 12547 |
| AKC2 | 49 | 0 | 2871 | 26779 | 3997 | 530 | 1466 | 5 | 161349 | 2438 | 2602 | 55 | 1085 | 679 | 21688 |
| AKC2 | 55 | 0 | 1464 | 17630 | 4059 | 152 | 1234 | 0 | 190345 | 3608 | 1028 | 50 | 329 | 454 | 12999 |
| AKC2 | 63 | 0 | 3964 | 32872 | 1948 | 0 | 2001 | 5 | 137748 | 1044 | 2017 | 59 | 2867 | 707 | 30501 |
| AKC2 | 73 | 0 | 6971 | 41100 | 2102 | 0 | 5676 | 14 | 92218 | 456 | 2050 | 67 | 5089 | 632 | 40537 |
| AKC2 | 90 | 0 | 1964 | 18389 | 2159 | 0 | 817 | 4 | 185092 | 398 | 1174 | 56 | 2197 | 530 | 20594 |
| AKC2 | 99 | 0 | 2133 | 24822 | 2796 | 0 | 87 | 3 | 176893 | 411 | 1176 | 50 | 1212 | 537 | 21598 |
| AKC2 | 130 | 0 | 897 | 18736 | 2821 | 0 | 102 | 2 | 188481 | 392 | 1050 | 34 | 1002 | 437 | 16133 |
| AKC2 | 140 | 0 | 821 | 23206 | 3079 | 0 | 0 | 1 | 185563 | 427 | 965 | 53 | 1484 | 439 | 15681 |
| AKC2 | 150 | 0 | 1165 | 23442 | 3273 | 0 | 0 | 2 | 179240 | 461 | 820 | 36 | 865 | 452 | 17613 |
| Depth | |||||||||||||||
| AKC3 | 18 | 6508 | 5359 | 43124 | 1446 | 114 | 829 | 6 | 130757 | 1047 | 2885 | 56 | 474 | 714 | 25609 |
| AKC3 | 52 | 0 | 8527 | 65555 | 880 | 0 | 2988 | 9 | 63318 | 582 | 7505 | 109 | 2029 | 789 | 40666 |
| AKC3 | 60 | 0 | 4134 | 41211 | 1733 | 0 | 1468 | 5 | 145175 | 2775 | 2026 | 66 | 252 | 448 | 17628 |
| AKC3 | 83 | 8248 | 9071 | 83286 | 1969 | 0 | 2095 | 8 | 84035 | 850 | 4222 | 77 | 992 | 804 | 36400 |
| AKC3 | 93 | 8293 | 7858 | 59971 | 1164 | 233 | 2792 | 10 | 89246 | 517 | 4085 | 86 | 1268 | 945 | 36525 |
| AKC3 | 105 | 0 | 8005 | 80674 | 980 | 0 | 2163 | 8 | 65554 | 260 | 5884 | 80 | 1810 | 833 | 38817 |
| AKC3 | 116 | 7656 | 10431 | 66676 | 1009 | 0 | 3036 | 10 | 69698 | 273 | 7619 | 132 | 2621 | 987 | 48262 |
| AKC3 | 144 | 0 | 7810 | 68622 | 1427 | 66 | 1675 | 5 | 66747 | 263 | 5522 | 94 | 1600 | 733 | 36299 |
| AKC3 | 153 | 0 | 4628 | 51487 | 3817 | 580 | 925 | 6 | 119058 | 512 | 2361 | 54 | 468 | 608 | 19321 |
| AKC3 | 172 | 9852 | 5896 | 52601 | 8640 | 734 | 1415 | 8 | 95048 | 480 | 2441 | 51 | 531 | 605 | 23276 |
| AKC3 | 199 | 0 | 6676 | 41357 | 14205 | 620 | 2942 | 9 | 86561 | 642 | 5212 | 70 | 1845 | 931 | 32696 |
| AKC3 | 220 | 6722 | 9632 | 79711 | 2377 | 68 | 1400 | 6 | 81403 | 456 | 5086 | 90 | 2190 | 867 | 38840 |
| AKC3 | 240 | 0 | 5796 | 53375 | 1408 | 155 | 1321 | 6 | 101895 | 877 | 2687 | 70 | 707 | 664 | 26359 |
| AKC3 | 258 | 0 | 7900 | 61899 | 734 | 0 | 1440 | 6 | 80328 | 485 | 7692 | 107 | 2449 | 880 | 39474 |
| AKC3 | 280 | 0 | 4578 | 36709 | 1802 | 307 | 1217 | 5 | 138447 | 945 | 3815 | 69 | 1807 | 802 | 29418 |
| AKC3 | 285 | 7148 | 4798 | 45351 | 2367 | 161 | 380 | 4 | 122317 | 717 | 2705 | 87 | 1372 | 579 | 22136 |
| AKC3 | 294 | 0 | 7689 | 68957 | 789 | 0 | 748 | 5 | 77960 | 356 | 4570 | 82 | 963 | 706 | 32716 |
| AKC3 | 330 | 6002 | 10414 | 88774 | 308 | 60 | 2475 | 8 | 42796 | 220 | 8612 | 150 | 3061 | 808 | 45582 |
| AKC3 | 338 | 0 | 11312 | 124005 | 149 | 58 | 1342 | 7 | 31935 | 125 | 2595 | 68 | 454 | 569 | 26735 |
Table A2.
Handheld XRF geochemistry of the studied cores (Co to U values in ppm).
Table A2.
Handheld XRF geochemistry of the studied cores (Co to U values in ppm).
| Core | Depth | Co | Ni | Cu | Zn | As | Se | Y | Zr | Nb | Mo | Ag | Cd | Sn | Sb | W | Au | Hg | Pb | Bi | Th | U |
|---|---|---|---|---|---|---|---|---|---|---|---|---|---|---|---|---|---|---|---|---|---|---|
| AKC1 | 34 | 0 | 91 | 28 | 28 | 3 | 0 | 13 | 25 | 0 | 0 | 0 | 0 | 0 | 0 | 0 | 0 | 0 | 5 | 0 | 0 | 0 |
| AKC1 | 42 | 0 | 95 | 23 | 27 | 3 | 0 | 13 | 22 | 0 | 0 | 0 | 0 | 0 | 0 | 0 | 0 | 0 | 0 | 0 | 0 | 0 |
| AKC1 | 60 | 0 | 94 | 23 | 29 | 3 | 0 | 12 | 20 | 0 | 0 | 0 | 0 | 0 | 0 | 0 | 0 | 0 | 0 | 8 | 0 | 0 |
| AKC1 | 94 | 0 | 109 | 24 | 22 | 6 | 0 | 11 | 26 | 0 | 0 | 0 | 0 | 0 | 0 | 0 | 0 | 0 | 3 | 0 | 0 | 0 |
| AKC1 | 105 | 0 | 102 | 18 | 16 | 10 | 0 | 11 | 18 | 0 | 0 | 0 | 0 | 0 | 0 | 0 | 0 | 0 | 0 | 0 | 0 | 0 |
| AKC1 | 145 | 0 | 110 | 12 | 17 | 4 | 0 | 12 | 20 | 0 | 0 | 0 | 0 | 0 | 0 | 0 | 0 | 0 | 0 | 0 | 0 | 0 |
| AKC1 | 172 | 0 | 100 | 25 | 38 | 3 | 0 | 12 | 23 | 0 | 0 | 0 | 0 | 0 | 0 | 0 | 0 | 0 | 0 | 0 | 0 | 0 |
| AKC1 | 189 | 0 | 120 | 22 | 33 | 3 | 0 | 12 | 19 | 0 | 0 | 0 | 0 | 0 | 0 | 0 | 0 | 0 | 4 | 0 | 0 | 0 |
| AKC1 | 198 | 0 | 155 | 19 | 24 | 9 | 0 | 11 | 18 | 0 | 0 | 0 | 0 | 0 | 0 | 0 | 0 | 0 | 0 | 8 | 0 | 0 |
| AKC1 | 227 | 0 | 125 | 17 | 19 | 7 | 0 | 10 | 17 | 0 | 0 | 0 | 0 | 0 | 0 | 0 | 0 | 0 | 0 | 0 | 0 | 0 |
| AKC1 | 231 | 0 | 102 | 18 | 22 | 8 | 0 | 10 | 18 | 0 | 0 | 0 | 0 | 0 | 0 | 0 | 0 | 0 | 0 | 0 | 0 | 0 |
| AKC1 | 237 | 0 | 131 | 22 | 22 | 9 | 0 | 10 | 33 | 0 | 0 | 0 | 0 | 0 | 0 | 0 | 0 | 0 | 0 | 12 | 0 | 0 |
| AKC1 | 273 | 0 | 87 | 19 | 18 | 16 | 0 | 14 | 26 | 0 | 0 | 0 | 0 | 0 | 0 | 0 | 0 | 0 | 5 | 0 | 0 | 0 |
| Depth | ||||||||||||||||||||||
| AKC2 | 3 | 0 | 93 | 23 | 21 | 6 | 0 | 9 | 20 | 0 | 0 | 0 | 0 | 0 | 0 | 0 | 0 | 0 | 3 | 14 | 0 | 0 |
| AKC2 | 17 | 0 | 101 | 20 | 26 | 5 | 0 | 12 | 21 | 0 | 0 | 0 | 0 | 0 | 0 | 0 | 0 | 0 | 5 | 8 | 0 | 0 |
| AKC2 | 27 | 0 | 103 | 15 | 22 | 4 | 0 | 8 | 23 | 0 | 0 | 0 | 0 | 0 | 0 | 0 | 0 | 0 | 5 | 0 | 0 | 0 |
| AKC2 | 39 | 0 | 77 | 16 | 16 | 4 | 0 | 7 | 17 | 0 | 0 | 0 | 0 | 0 | 0 | 0 | 0 | 0 | 4 | 0 | 0 | 0 |
| AKC2 | 49 | 0 | 122 | 19 | 28 | 4 | 0 | 8 | 37 | 0 | 0 | 0 | 0 | 0 | 0 | 0 | 0 | 0 | 6 | 0 | 10 | 0 |
| AKC2 | 55 | 0 | 78 | 12 | 13 | 4 | 0 | 6 | 31 | 0 | 0 | 0 | 0 | 0 | 0 | 0 | 0 | 0 | 0 | 0 | 0 | 0 |
| AKC2 | 63 | 0 | 195 | 20 | 36 | 3 | 0 | 14 | 22 | 0 | 0 | 0 | 0 | 0 | 0 | 0 | 4 | 0 | 4 | 0 | 0 | 0 |
| AKC2 | 73 | 0 | 245 | 37 | 57 | 2 | 0 | 13 | 53 | 0 | 0 | 0 | 0 | 0 | 0 | 0 | 0 | 0 | 3 | 10 | 0 | 0 |
| AKC2 | 90 | 0 | 196 | 22 | 27 | 0 | 0 | 7 | 12 | 0 | 0 | 0 | 0 | 0 | 0 | 0 | 0 | 5 | 4 | 0 | 0 | 0 |
| AKC2 | 99 | 0 | 304 | 21 | 22 | 2 | 0 | 6 | 9 | 0 | 0 | 0 | 0 | 0 | 0 | 0 | 0 | 0 | 0 | 0 | 0 | 0 |
| AKC2 | 130 | 0 | 221 | 18 | 17 | 3 | 0 | 6 | 11 | 0 | 0 | 0 | 0 | 0 | 0 | 0 | 0 | 6 | 0 | 0 | 0 | 0 |
| AKC2 | 140 | 0 | 222 | 24 | 17 | 3 | 0 | 5 | 10 | 0 | 0 | 0 | 0 | 0 | 0 | 0 | 0 | 0 | 0 | 0 | 0 | 0 |
| AKC2 | 150 | 0 | 246 | 21 | 18 | 3 | 0 | 5 | 11 | 0 | 0 | 0 | 0 | 0 | 0 | 0 | 0 | 0 | 0 | 0 | 0 | 0 |
| Depth | ||||||||||||||||||||||
| AKC3 | 18 | 0 | 103 | 22 | 27 | 5 | 0 | 19 | 29 | 0 | 0 | 0 | 0 | 0 | 0 | 0 | 0 | 0 | 3 | 9 | 0 | 0 |
| AKC3 | 52 | 0 | 103 | 23 | 42 | 4 | 0 | 23 | 49 | 0 | 0 | 0 | 0 | 0 | 0 | 0 | 0 | 5 | 3 | 0 | 0 | 0 |
| AKC3 | 60 | 0 | 61 | 15 | 20 | 6 | 0 | 13 | 29 | 0 | 0 | 0 | 0 | 0 | 0 | 0 | 0 | 0 | 0 | 0 | 0 | 0 |
| AKC3 | 83 | 0 | 86 | 19 | 33 | 3 | 0 | 20 | 43 | 0 | 0 | 0 | 0 | 0 | 0 | 0 | 0 | 5 | 6 | 0 | 0 | 0 |
| AKC3 | 93 | 0 | 97 | 26 | 36 | 4 | 0 | 20 | 64 | 0 | 0 | 0 | 0 | 0 | 0 | 0 | 0 | 6 | 4 | 9 | 0 | 0 |
| AKC3 | 105 | 0 | 100 | 20 | 36 | 3 | 0 | 24 | 34 | 0 | 0 | 0 | 0 | 0 | 0 | 0 | 0 | 0 | 4 | 0 | 0 | 0 |
| AKC3 | 116 | 0 | 99 | 26 | 47 | 4 | 0 | 23 | 48 | 0 | 0 | 0 | 0 | 0 | 0 | 0 | 0 | 0 | 3 | 14 | 0 | 0 |
| AKC3 | 144 | 0 | 76 | 17 | 35 | 4 | 0 | 21 | 45 | 0 | 0 | 0 | 0 | 0 | 0 | 0 | 0 | 0 | 0 | 13 | 0 | 0 |
| AKC3 | 153 | 0 | 48 | 14 | 22 | 3 | 0 | 18 | 29 | 0 | 0 | 0 | 0 | 0 | 0 | 0 | 0 | 0 | 3 | 0 | 0 | 0 |
| AKC3 | 172 | 0 | 71 | 22 | 28 | 5 | 0 | 17 | 44 | 0 | 0 | 0 | 0 | 0 | 0 | 0 | 0 | 0 | 10 | 9 | 0 | 0 |
| AKC3 | 199 | 0 | 101 | 32 | 53 | 4 | 0 | 17 | 92 | 0 | 0 | 0 | 0 | 0 | 0 | 0 | 0 | 0 | 24 | 15 | 0 | 0 |
| AKC3 | 220 | 0 | 96 | 19 | 39 | 4 | 0 | 23 | 61 | 0 | 0 | 0 | 0 | 0 | 0 | 0 | 0 | 6 | 0 | 0 | 0 | 0 |
| AKC3 | 240 | 0 | 87 | 23 | 27 | 5 | 0 | 19 | 36 | 0 | 0 | 0 | 0 | 0 | 0 | 0 | 0 | 5 | 3 | 9 | 0 | 0 |
| AKC3 | 258 | 0 | 103 | 22 | 37 | 2 | 0 | 21 | 82 | 0 | 0 | 0 | 0 | 0 | 0 | 0 | 0 | 0 | 5 | 0 | 0 | 0 |
| AKC3 | 280 | 0 | 96 | 20 | 33 | 6 | 0 | 17 | 34 | 0 | 0 | 0 | 0 | 0 | 0 | 0 | 0 | 0 | 0 | 0 | 0 | 0 |
| AKC3 | 285 | 0 | 117 | 19 | 23 | 6 | 0 | 17 | 29 | 0 | 0 | 0 | 0 | 0 | 0 | 0 | 0 | 5 | 0 | 0 | 0 | 0 |
| AKC3 | 294 | 0 | 115 | 18 | 29 | 3 | 0 | 18 | 31 | 0 | 0 | 0 | 0 | 0 | 0 | 0 | 0 | 0 | 0 | 18 | 0 | 0 |
| AKC3 | 330 | 0 | 104 | 23 | 46 | 5 | 0 | 19 | 65 | 0 | 0 | 0 | 0 | 0 | 0 | 0 | 0 | 5 | 3 | 14 | 0 | 0 |
| AKC3 | 338 | 0 | 90 | 19 | 27 | 2 | 0 | 19 | 32 | 0 | 0 | 0 | 0 | 0 | 0 | 0 | 0 | 0 | 3 | 8 | 0 | 0 |
Table A3.
Handheld XRF Ti/Ca, Sr/Ca ratios.
Table A3.
Handheld XRF Ti/Ca, Sr/Ca ratios.
| Core | Depth | Ca | Ti | Sr | Ti/Ca | Sr/Ca |
|---|---|---|---|---|---|---|
| AKC1 | 34 | 116,976 | 2548 | 477 | 0.021782 | 0.004078 |
| AKC1 | 42 | 92,045 | 1895 | 348 | 0.020588 | 0.003781 |
| AKC1 | 60 | 100,739 | 1756 | 361 | 0.017431 | 0.003584 |
| AKC1 | 94 | 133,975 | 1440 | 622 | 0.010748 | 0.004643 |
| AKC1 | 105 | 179,338 | 1111 | 1367 | 0.006195 | 0.007622 |
| AKC1 | 145 | 142,114 | 1200 | 738 | 0.008444 | 0.005193 |
| AKC1 | 172 | 106,482 | 2699 | 389 | 0.025347 | 0.003653 |
| AKC1 | 189 | 127,823 | 2644 | 543 | 0.020685 | 0.004248 |
| AKC1 | 198 | 125,825 | 1609 | 668 | 0.012788 | 0.005309 |
| AKC1 | 227 | 126,617 | 1356 | 685 | 0.010709 | 0.00541 |
| AKC1 | 231 | 129,696 | 1163 | 582 | 0.008967 | 0.004487 |
| AKC1 | 237 | 131,080 | 1772 | 735 | 0.013518 | 0.005607 |
| AKC1 | 273 | 155,471 | 1295 | 903 | 0.00833 | 0.005808 |
| Core | Depth | Ca | Ti | Sr | Ti/Ca | Sr/Ca |
| AKC2 | 3 | 126,697 | 1323 | 692 | 0.010442 | 0.005462 |
| AKC2 | 17 | 129,421 | 2683 | 595 | 0.020731 | 0.004597 |
| AKC2 | 27 | 144,540 | 1913 | 1086 | 0.013235 | 0.007513 |
| AKC2 | 39 | 175,881 | 923 | 1544 | 0.005248 | 0.008779 |
| AKC2 | 49 | 161,349 | 2602 | 2438 | 0.016127 | 0.01511 |
| AKC2 | 55 | 190,345 | 1028 | 3608 | 0.005401 | 0.018955 |
| AKC2 | 63 | 137,748 | 2017 | 1044 | 0.014643 | 0.007579 |
| AKC2 | 73 | 92,218 | 2050 | 456 | 0.02223 | 0.004945 |
| AKC2 | 90 | 185,092 | 1174 | 398 | 0.006343 | 0.00215 |
| AKC2 | 99 | 176,893 | 1176 | 411 | 0.006648 | 0.002323 |
| AKC2 | 130 | 188,481 | 1050 | 392 | 0.005571 | 0.00208 |
| AKC2 | 140 | 185,563 | 965 | 427 | 0.0052 | 0.002301 |
| AKC2 | 150 | 179,240 | 820 | 461 | 0.004575 | 0.002572 |
| Core | Depth | Ca | Ti | Sr | Ti/Ca | Sr/Ca |
| AKC3 | 18 | 130,757 | 2885 | 1047 | 0.022064 | 0.008007 |
| AKC3 | 52 | 63,318 | 7505 | 582 | 0.118529 | 0.009192 |
| AKC3 | 60 | 145,175 | 2026 | 2775 | 0.013956 | 0.019115 |
| AKC3 | 83 | 84,035 | 4222 | 850 | 0.050241 | 0.010115 |
| AKC3 | 93 | 89,246 | 4085 | 517 | 0.045772 | 0.005793 |
| AKC3 | 105 | 65,554 | 5884 | 260 | 0.089758 | 0.003966 |
| AKC3 | 116 | 69,698 | 7619 | 273 | 0.109314 | 0.003917 |
| AKC3 | 144 | 66,747 | 5522 | 263 | 0.08273 | 0.00394 |
| AKC3 | 153 | 119,058 | 2361 | 512 | 0.019831 | 0.0043 |
| AKC3 | 172 | 95,048 | 2441 | 480 | 0.025682 | 0.00505 |
| AKC3 | 199 | 86,561 | 5212 | 642 | 0.060212 | 0.007417 |
| AKC3 | 220 | 81,403 | 5086 | 456 | 0.062479 | 0.005602 |
| AKC3 | 240 | 101,895 | 2687 | 877 | 0.02637 | 0.008607 |
| AKC3 | 258 | 80,328 | 7692 | 485 | 0.095757 | 0.006038 |
| AKC3 | 280 | 138,447 | 3815 | 945 | 0.027556 | 0.006826 |
| AKC3 | 285 | 122,317 | 2705 | 717 | 0.022115 | 0.005862 |
| AKC3 | 294 | 77,960 | 4570 | 356 | 0.05862 | 0.004566 |
| AKC3 | 330 | 42,796 | 8612 | 220 | 0.201234 | 0.005141 |
| AKC3 | 338 | 31,935 | 2595 | 125 | 0.081259 | 0.003914 |
Table A4.
Relative frequencies of the ostracod species in the studied samples of AKC1 (1 to 135 cm).
Table A4.
Relative frequencies of the ostracod species in the studied samples of AKC1 (1 to 135 cm).
| Depth (cm) | 1–5 | 15–20 | 30–35 | 40–45 | 50–55 | 60–65 | 70–75 | 80–85 | 90–95 | 100–105 | 110–115 | 120–125 | 130–135 |
|---|---|---|---|---|---|---|---|---|---|---|---|---|---|
| Cyprideis torosa | 54.55 | 33.33 | 0.00 | 0.00 | 16.67 | 6.52 | 20.31 | 7.41 | 4.05 | 20.70 | 19.15 | 11.22 | 12.68 |
| A. convexa | 0.00 | 0.00 | 0.00 | 0.00 | 0.00 | 4.35 | 0.00 | 0.00 | 0.00 | 1.16 | 2.48 | 0.00 | 0.00 |
| Aurilaspp. | 0.00 | 0.00 | 0.00 | 0.00 | 0.00 | 0.00 | 4.69 | 0.00 | 0.58 | 2.56 | 0.71 | 3.06 | 9.86 |
| Aurila woodwardii | 0.00 | 18.18 | 0.00 | 0.00 | 0.00 | 0.00 | 1.56 | 0.00 | 4.05 | 2.56 | 3.90 | 7.14 | 2.82 |
| Phlyctenophorasp. | 18.18 | 24.24 | 0.00 | 0.00 | 0.00 | 13.04 | 3.13 | 5.93 | 4.91 | 11.63 | 20.21 | 5.10 | 4.23 |
| Heterocypris salina | 0.00 | 0.00 | 0.00 | 0.00 | 83.33 | 8.70 | 21.88 | 2.96 | 1.45 | 0.47 | 0.71 | 1.02 | 0.00 |
| Limnocytheresp. | 0.00 | 0.00 | 0.00 | 0.00 | 0.00 | 0.00 | 1.56 | 0.00 | 0.00 | 0.00 | 0.00 | 0.00 | 0.00 |
| Xestoleberis communis | 0.00 | 6.06 | 0.00 | 0.00 | 0.00 | 19.57 | 15.63 | 10.37 | 16.18 | 7.21 | 7.80 | 6.12 | 9.86 |
| Xestoleberisspp. | 0.00 | 0.00 | 0.00 | 0.00 | 0.00 | 0.00 | 1.56 | 0.00 | 0.58 | 0.00 | 0.00 | 0.00 | 1.41 |
| Basslerites berchoni | 0.00 | 0.00 | 0.00 | 0.00 | 0.00 | 6.52 | 0.00 | 4.44 | 3.47 | 2.79 | 3.55 | 2.04 | 5.63 |
| Loxoconcha affinis | 0.00 | 9.09 | 0.00 | 0.00 | 0.00 | 17.39 | 18.75 | 28.15 | 49.13 | 37.67 | 24.47 | 25.51 | 9.86 |
| Loxoconchaspp. | 0.00 | 0.00 | 0.00 | 0.00 | 0.00 | 0.00 | 0.00 | 4.44 | 1.45 | 0.47 | 0.00 | 3.06 | 5.63 |
| Leptocytheresp. | 0.00 | 0.00 | 0.00 | 0.00 | 0.00 | 0.00 | 0.00 | 6.67 | 3.47 | 2.33 | 4.26 | 0.00 | 1.41 |
| Pontocytherespp. | 0.00 | 0.00 | 0.00 | 0.00 | 0.00 | 4.35 | 0.00 | 1.48 | 2.02 | 1.86 | 2.83 | 3.06 | 4.23 |
| Urocythereissp. | 27.27 | 0.00 | 0.00 | 0.00 | 0.00 | 8.70 | 0.00 | 5.19 | 0.87 | 1.16 | 2.48 | 4.08 | 4.23 |
| Semicytherurasp. | 0.00 | 0.00 | 0.00 | 0.00 | 0.00 | 0.00 | 0.00 | 6.67 | 0.58 | 0.47 | 0.00 | 4.08 | 7.04 |
| Hemicytherurasp. | 0.00 | 0.00 | 0.00 | 0.00 | 0.00 | 2.17 | 0.00 | 0.00 | 0.00 | 0.00 | 0.00 | 0.00 | 0.00 |
| Callistocytheresp. | 0.00 | 0.00 | 0.00 | 0.00 | 0.00 | 0.00 | 3.13 | 0.00 | 0.00 | 1.40 | 0.00 | 0.00 | 0.00 |
| Carinocythereissp. | 0.00 | 0.00 | 0.00 | 0.00 | 0.00 | 0.00 | 0.00 | 0.00 | 0.58 | 0.00 | 0.00 | 1.02 | 0.00 |
| Hiltermannicytheresp. | 0.00 | 9.09 | 0.00 | 0.00 | 0.00 | 4.35 | 0.00 | 6.67 | 2.31 | 1.16 | 2.13 | 3.06 | 4.23 |
| Quadracytheresp. | 0.00 | 0.00 | 0.00 | 0.00 | 0.00 | 0.00 | 0.00 | 0.00 | 0.58 | 0.47 | 0.35 | 0.00 | 0.00 |
| Cytherettasp. | 0.00 | 0.00 | 0.00 | 0.00 | 0.00 | 0.00 | 0.00 | 0.00 | 2.02 | 0.93 | 0.35 | 2.04 | 4.23 |
| Cytherellasp. | 0.00 | 0.00 | 0.00 | 0.00 | 0.00 | 0.00 | 0.00 | 2.22 | 0.29 | 1.16 | 0.71 | 0.00 | 4.23 |
| Eucytherurasp. | 0.00 | 0.00 | 0.00 | 0.00 | 0.00 | 0.00 | 0.00 | 0.00 | 0.00 | 0.00 | 0.00 | 0.00 | 0.00 |
| Sagmatocytheresp. | 0.00 | 0.00 | 0.00 | 0.00 | 0.00 | 0.00 | 4.69 | 5.19 | 1.45 | 1.86 | 2.48 | 12.24 | 4.23 |
| Triebelinasp. | 0.00 | 0.00 | 0.00 | 0.00 | 0.00 | 0.00 | 0.00 | 0.00 | 0.00 | 0.00 | 0.35 | 0.00 | 0.00 |
| not identified | 0.00 | 0.00 | 0.00 | 0.00 | 0.00 | 4.35 | 3.13 | 2.22 | 0.00 | 0.00 | 1.06 | 6.12 | 4.23 |
Table A5.
Relative frequencies of the ostracod species in the studied samples of AKC1 (140 to 265 cm).
Table A5.
Relative frequencies of the ostracod species in the studied samples of AKC1 (140 to 265 cm).
| Depth (cm) | 140–145 | 145–150 | 155–160 | 170–175 | 180–185 | 190–195 | 200–205 | 210–215 | 220–225 | 230–235 | 240–245 | 250–255 | 260–265 |
|---|---|---|---|---|---|---|---|---|---|---|---|---|---|
| Cyprideis torosa | 11.43 | 7.41 | 0.00 | 0.00 | 0.00 | 28.57 | 8.33 | 0.00 | 25.00 | 80.77 | 30.53 | 54.05 | 7.84 |
| A. convexa | 0.00 | 0.00 | 0.00 | 0.00 | 0.00 | 14.29 | 0.00 | 0.00 | 0.00 | 0.00 | 0.00 | 0.00 | 0.00 |
| Aurilaspp. | 8.57 | 7.41 | 0.00 | 33.33 | 10.00 | 9.52 | 8.33 | 30.00 | 0.00 | 0.00 | 0.00 | 0.00 | 0.00 |
| Aurila woodwardii | 0.00 | 0.00 | 0.00 | 0.00 | 0.00 | 0.00 | 8.33 | 0.00 | 0.00 | 0.00 | 20.00 | 16.22 | 21.57 |
| Phlyctenophorasp. | 0.00 | 37.04 | 0.00 | 0.00 | 10.00 | 0.00 | 8.33 | 10.00 | 0.00 | 0.00 | 2.11 | 0.00 | 9.80 |
| Heterocypris salina | 0.00 | 3.70 | 0.00 | 0.00 | 0.00 | 0.00 | 0.00 | 0.00 | 25.00 | 0.00 | 0.00 | 0.00 | 0.00 |
| Limnocytheresp. | 0.00 | 0.00 | 0.00 | 0.00 | 0.00 | 0.00 | 0.00 | 0.00 | 0.00 | 0.00 | 0.00 | 0.00 | 0.00 |
| Xestoleberis communis | 0.00 | 11.11 | 0.00 | 0.00 | 20.00 | 0.00 | 8.33 | 0.00 | 0.00 | 1.28 | 8.42 | 5.41 | 1.96 |
| Xestoleberisspp. | 5.71 | 0.00 | 0.00 | 0.00 | 0.00 | 9.52 | 0.00 | 0.00 | 0.00 | 0.00 | 0.00 | 0.00 | 0.00 |
| Basslerites berchoni | 0.00 | 0.00 | 0.00 | 0.00 | 0.00 | 0.00 | 4.17 | 0.00 | 0.00 | 0.00 | 18.95 | 0.00 | 39.22 |
| Loxoconcha affinis | 22.86 | 14.81 | 0.00 | 33.33 | 0.00 | 0.00 | 0.00 | 20.00 | 0.00 | 2.56 | 3.16 | 13.51 | 15.69 |
| Loxoconchaspp. | 0.00 | 0.00 | 0.00 | 0.00 | 10.00 | 0.00 | 0.00 | 0.00 | 0.00 | 0.00 | 2.11 | 0.00 | 0.00 |
| Leptocytheresp. | 0.00 | 0.00 | 0.00 | 0.00 | 0.00 | 0.00 | 4.17 | 0.00 | 0.00 | 2.56 | 1.05 | 0.00 | 0.00 |
| Pontocytherespp. | 11.43 | 0.00 | 0.00 | 0.00 | 0.00 | 0.00 | 8.33 | 10.00 | 12.50 | 6.41 | 4.21 | 0.00 | 0.00 |
| Urocythereissp. | 8.57 | 0.00 | 100.00 | 0.00 | 10.00 | 9.52 | 4.17 | 0.00 | 0.00 | 0.00 | 0.00 | 0.00 | 0.00 |
| Semicytherurasp. | 5.71 | 3.70 | 0.00 | 0.00 | 10.00 | 9.52 | 8.33 | 10.00 | 0.00 | 0.00 | 0.00 | 0.00 | 0.00 |
| Hemicytherurasp. | 0.00 | 0.00 | 0.00 | 0.00 | 0.00 | 0.00 | 0.00 | 0.00 | 0.00 | 0.00 | 1.05 | 0.00 | 0.00 |
| Callistocytheresp. | 5.71 | 0.00 | 0.00 | 0.00 | 0.00 | 0.00 | 0.00 | 0.00 | 0.00 | 2.56 | 0.00 | 0.00 | 3.92 |
| Carinocythereissp. | 2.86 | 0.00 | 0.00 | 0.00 | 0.00 | 0.00 | 0.00 | 10.00 | 0.00 | 0.00 | 0.00 | 0.00 | 0.00 |
| Hiltermannicytheresp. | 8.57 | 3.70 | 0.00 | 0.00 | 0.00 | 9.52 | 8.33 | 0.00 | 25.00 | 0.00 | 6.32 | 5.41 | 0.00 |
| Quadracytheresp. | 0.00 | 0.00 | 0.00 | 0.00 | 0.00 | 0.00 | 0.00 | 0.00 | 0.00 | 0.00 | 0.00 | 0.00 | 0.00 |
| Cytherettasp. | 0.00 | 0.00 | 0.00 | 33.33 | 30.00 | 4.76 | 0.00 | 0.00 | 0.00 | 0.00 | 0.00 | 0.00 | 0.00 |
| Cytherellasp. | 0.00 | 11.11 | 0.00 | 0.00 | 0.00 | 0.00 | 0.00 | 0.00 | 0.00 | 0.00 | 2.11 | 0.00 | 0.00 |
| Eucytherurasp. | 0.00 | 0.00 | 0.00 | 0.00 | 0.00 | 0.00 | 0.00 | 0.00 | 0.00 | 0.00 | 0.00 | 0.00 | 0.00 |
| Sagmatocytheresp. | 2.86 | 0.00 | 0.00 | 0.00 | 0.00 | 4.76 | 12.50 | 10.00 | 12.50 | 2.56 | 0.00 | 5.41 | 0.00 |
| Triebelinasp. | 2.86 | 0.00 | 0.00 | 0.00 | 0.00 | 0.00 | 0.00 | 0.00 | 0.00 | 0.00 | 0.00 | 0.00 | 0.00 |
| not identified | 2.86 | 0.00 | 0.00 | 0.00 | 0.00 | 0.00 | 8.33 | 0.00 | 0.00 | 1.28 | 0.00 | 0.00 | 0.00 |
Table A6.
Relative frequencies of the ostracod species in the studied samples of AKC2.
Table A6.
Relative frequencies of the ostracod species in the studied samples of AKC2.
| Depth (cm) | 5–10 | 30–35 | 35–40 | 45–50 | 55–60 | 65–70 | 75–80 | 85–90 | 95–100 | 105–110 | 115–120 | 125–130 | 140–145 | 155–160 | 170–175 | 180–185 | 190–195 |
|---|---|---|---|---|---|---|---|---|---|---|---|---|---|---|---|---|---|
| Cyprideis torosa | 78.13 | 76.67 | 83.33 | 83.33 | 99.71 | 87.50 | 11.11 | 0.76 | 0.00 | 0.00 | 0.00 | 0.00 | 0.00 | 0.00 | 0.00 | 93.69 | 85.29 |
| Aurila woodwardii | 0.00 | 0.00 | 0.00 | 1.67 | 0.00 | 0.00 | 27.78 | 57.25 | 100.00 | 0.00 | 0.00 | 0.00 | 0.00 | 0.00 | 0.00 | 0.00 | 2.94 |
| Phlyctenophorasp. | 9.38 | 13.33 | 16.67 | 3.33 | 0.00 | 0.00 | 0.00 | 0.00 | 0.00 | 0.00 | 0.00 | 0.00 | 0.00 | 0.00 | 0.00 | 1.80 | 4.41 |
| Heterocypris salina | 0.00 | 0.00 | 0.00 | 0.00 | 0.19 | 0.00 | 0.00 | 0.00 | 0.00 | 0.00 | 0.00 | 0.00 | 0.00 | 0.00 | 0.00 | 0.90 | 1.47 |
| Xestoleberiscommunis | 0.00 | 0.00 | 0.00 | 1.67 | 0.00 | 7.81 | 11.11 | 33.59 | 0.00 | 0.00 | 0.00 | 0.00 | 0.00 | 0.00 | 0.00 | 0.00 | 0.00 |
| Xestoleberissp. | 0.00 | 0.00 | 0.00 | 0.00 | 0.00 | 0.00 | 0.00 | 0.76 | 0.00 | 0.00 | 0.00 | 0.00 | 0.00 | 0.00 | 0.00 | 0.00 | 0.00 |
| Loxoconcha affinis | 3.13 | 0.00 | 0.00 | 8.33 | 0.00 | 0.00 | 0.00 | 0.76 | 0.00 | 0.00 | 0.00 | 0.00 | 0.00 | 0.00 | 0.00 | 0.00 | 0.00 |
| Loxoconchasp. | 0.00 | 0.00 | 0.00 | 0.00 | 0.00 | 0.00 | 0.00 | 6.11 | 0.00 | 0.00 | 0.00 | 0.00 | 0.00 | 0.00 | 0.00 | 0.00 | 0.00 |
| Urocythereissp. | 9.38 | 3.33 | 0.00 | 1.67 | 0.00 | 3.13 | 33.33 | 0.76 | 0.00 | 0.00 | 0.00 | 0.00 | 0.00 | 0.00 | 0.00 | 3.60 | 4.41 |
| Semicytherurasp. | 0.00 | 0.00 | 0.00 | 0.00 | 0.00 | 0.00 | 0.00 | 0.00 | 0.00 | 0.00 | 0.00 | 0.00 | 0.00 | 0.00 | 0.00 | 0.00 | 1.47 |
| not identified | 0.00 | 6.67 | 0.00 | 0.00 | 0.10 | 1.56 | 16.67 | 0.00 | 0.00 | 0.00 | 0.00 | 0.00 | 0.00 | 0.00 | 0.00 | 0.00 | 0.00 |
Table A7.
Relative frequencies of the ostracod species in the studied samples of AKC3 (5 to 150 cm).
Table A7.
Relative frequencies of the ostracod species in the studied samples of AKC3 (5 to 150 cm).
| Depth (cm) | 5–10 | 15–20 | 25–30 | 35–40 | 45–50 | 55–60 | 65–70 | 75–80 | 85–90 | 95–100 | 105–110 | 115–120 | 125–130 | 135–140 | 145–150 |
|---|---|---|---|---|---|---|---|---|---|---|---|---|---|---|---|
| Cyprideis torosa | 31.09 | 21.80 | 66.67 | 0.00 | 0.00 | 6.94 | 99.32 | 97.98 | 99.80 | 93.33 | 100.00 | 60.00 | 40.00 | 56.23 | 7.74 |
| A. convexa | 0.00 | 0.00 | 0.00 | 0.00 | 0.00 | 0.00 | 0.00 | 0.00 | 0.00 | 0.00 | 0.00 | 0.00 | 0.00 | 0.00 | 0.00 |
| Aurilaspp. | 0.00 | 0.00 | 0.00 | 0.00 | 7.14 | 0.00 | 0.00 | 0.00 | 0.20 | 0.00 | 0.00 | 0.00 | 0.00 | 0.00 | 0.00 |
| Aurila woodwardii | 9.62 | 6.02 | 0.00 | 0.00 | 0.00 | 90.28 | 0.00 | 0.00 | 0.00 | 0.83 | 0.00 | 40.00 | 60.00 | 31.78 | 56.77 |
| Phlyctenophorasp. | 21.79 | 23.31 | 33.33 | 0.00 | 0.00 | 0.00 | 0.68 | 0.00 | 0.00 | 0.00 | 0.00 | 0.00 | 0.00 | 0.98 | 8.39 |
| Heterocypris salina | 0.00 | 0.00 | 0.00 | 0.00 | 0.00 | 0.00 | 0.00 | 0.00 | 0.00 | 5.00 | 0.00 | 0.00 | 0.00 | 0.00 | 0.00 |
| Xestoleberiscommunis | 3.85 | 12.78 | 0.00 | 0.00 | 28.57 | 1.39 | 0.00 | 1.01 | 0.00 | 0.00 | 0.00 | 0.00 | 0.00 | 0.98 | 1.94 |
| Xestoleberisspp. | 0.64 | 0.00 | 0.00 | 0.00 | 0.00 | 0.00 | 0.00 | 0.00 | 0.00 | 0.00 | 0.00 | 0.00 | 0.00 | 0.49 | 7.74 |
| Basslerites berchoni | 0.96 | 1.88 | 0.00 | 0.00 | 0.00 | 0.00 | 0.00 | 0.00 | 0.00 | 0.00 | 0.00 | 0.00 | 0.00 | 0.00 | 0.00 |
| Loxoconcha affinis | 20.19 | 27.44 | 0.00 | 0.00 | 28.57 | 0.00 | 0.00 | 0.00 | 0.00 | 0.00 | 0.00 | 0.00 | 0.00 | 1.96 | 10.97 |
| Loxoconchasp. | 3.53 | 0.00 | 0.00 | 0.00 | 0.00 | 0.00 | 0.00 | 0.00 | 0.00 | 0.00 | 0.00 | 0.00 | 0.00 | 0.00 | 0.00 |
| Leptocytheresp. | 3.21 | 2.26 | 0.00 | 0.00 | 0.00 | 0.00 | 0.00 | 0.00 | 0.00 | 0.00 | 0.00 | 0.00 | 0.00 | 1.22 | 0.00 |
| Urocythereissp. | 0.32 | 0.00 | 0.00 | 0.00 | 14.29 | 0.00 | 0.00 | 1.01 | 0.00 | 0.00 | 0.00 | 0.00 | 0.00 | 0.49 | 3.23 |
| Pontocytherespp. | 0.00 | 0.00 | 0.00 | 0.00 | 0.00 | 0.00 | 0.00 | 0.00 | 0.00 | 0.00 | 0.00 | 0.00 | 0.00 | 0.00 | 0.00 |
| Callistocytheresp. | 0.32 | 0.00 | 0.00 | 0.00 | 0.00 | 0.00 | 0.00 | 0.00 | 0.00 | 0.00 | 0.00 | 0.00 | 0.00 | 0.00 | 0.00 |
| Hiltermannicytheresp. | 0.32 | 0.00 | 0.00 | 0.00 | 7.14 | 0.00 | 0.00 | 0.00 | 0.00 | 0.00 | 0.00 | 0.00 | 0.00 | 4.89 | 2.58 |
| Cytherettasp. | 0.32 | 0.00 | 0.00 | 0.00 | 0.00 | 0.00 | 0.00 | 0.00 | 0.00 | 0.00 | 0.00 | 0.00 | 0.00 | 0.00 | 0.00 |
| Cytherellasp. | 0.64 | 0.00 | 0.00 | 0.00 | 0.00 | 0.00 | 0.00 | 0.00 | 0.00 | 0.00 | 0.00 | 0.00 | 0.00 | 0.00 | 0.00 |
| Eucytherurasp. | 0.00 | 0.00 | 0.00 | 0.00 | 0.00 | 0.00 | 0.00 | 0.00 | 0.00 | 0.00 | 0.00 | 0.00 | 0.00 | 0.00 | 0.00 |
| Propontocyprissp. | 0.00 | 0.00 | 0.00 | 0.00 | 0.00 | 0.00 | 0.00 | 0.00 | 0.00 | 0.00 | 0.00 | 0.00 | 0.00 | 0.00 | 0.00 |
| Sagmatocytheresp. | 0.00 | 0.38 | 0.00 | 0.00 | 7.14 | 0.00 | 0.00 | 0.00 | 0.00 | 0.00 | 0.00 | 0.00 | 0.00 | 0.00 | 0.00 |
| Triebelinasp. | 0.00 | 0.00 | 0.00 | 0.00 | 0.00 | 0.00 | 0.00 | 0.00 | 0.00 | 0.00 | 0.00 | 0.00 | 0.00 | 0.00 | 0.00 |
| Semicytherurasp. | 2.24 | 3.76 | 0.00 | 0.00 | 0.00 | 0.00 | 0.00 | 0.00 | 0.00 | 0.00 | 0.00 | 0.00 | 0.00 | 0.98 | 0.65 |
| not identified | 0.96 | 0.38 | 0.00 | 0.00 | 7.14 | 1.39 | 0.00 | 0.00 | 0.00 | 0.00 | 0.00 | 0.00 | 0.00 | 0.00 | 0.00 |
Table A8.
Relative frequencies of the ostracod species in the studied samples of AKC3 (165–340 cm).
Table A8.
Relative frequencies of the ostracod species in the studied samples of AKC3 (165–340 cm).
| Depth (cm) | 165–170 | 205–210 | 215–220 | 225–230 | 235–240 | 245–250 | 255–260 | 265–270 | 275–280 | 285–290 | 295–300 | 305–310 | 315–320 | 325–330 | 335–340 |
|---|---|---|---|---|---|---|---|---|---|---|---|---|---|---|---|
| Cyprideis torosa | 19.35 | 48.39 | 55.43 | 71.55 | 19.62 | 15.25 | 24.12 | 4.76 | 11.20 | 10.20 | 18.18 | 0.00 | 0.00 | 0.00 | 0.00 |
| A. convexa | 0.00 | 0.00 | 0.00 | 0.00 | 0.00 | 0.00 | 0.00 | 0.00 | 0.00 | 4.08 | 0.00 | 0.00 | 0.00 | 0.00 | 0.00 |
| Aurilaspp. | 0.00 | 0.00 | 0.00 | 0.00 | 0.00 | 0.00 | 0.50 | 0.40 | 0.00 | 4.08 | 0.00 | 0.00 | 0.00 | 0.00 | 0.00 |
| Aurila woodwardii | 25.81 | 14.84 | 26.09 | 6.28 | 14.71 | 11.36 | 7.54 | 10.32 | 13.60 | 6.12 | 15.91 | 0.00 | 0.00 | 0.00 | 0.00 |
| Phlyctenophorasp. | 14.52 | 1.61 | 2.72 | 5.02 | 18.53 | 15.84 | 28.14 | 19.84 | 13.60 | 16.33 | 13.64 | 0.00 | 0.00 | 0.00 | 0.00 |
| Heterocypris salina | 0.00 | 0.00 | 0.00 | 0.00 | 0.00 | 0.00 | 0.00 | 0.00 | 0.00 | 0.00 | 0.00 | 0.00 | 0.00 | 0.00 | 0.00 |
| Xestoleberiscommunis | 0.00 | 1.61 | 0.54 | 1.26 | 5.72 | 9.42 | 6.53 | 5.95 | 0.00 | 8.16 | 11.36 | 0.00 | 0.00 | 0.00 | 0.00 |
| Xestoleberisspp. | 11.29 | 7.74 | 4.89 | 0.00 | 0.00 | 0.00 | 0.00 | 0.00 | 0.00 | 6.12 | 2.27 | 0.00 | 0.00 | 0.00 | 0.00 |
| Basslerites berchoni | 0.00 | 0.00 | 0.00 | 0.00 | 1.09 | 1.49 | 0.00 | 1.59 | 0.00 | 0.00 | 0.00 | 0.00 | 0.00 | 0.00 | 0.00 |
| Loxoconcha affinis | 0.00 | 14.52 | 4.89 | 12.97 | 34.06 | 36.02 | 26.13 | 36.11 | 40.00 | 16.33 | 22.73 | 0.00 | 0.00 | 0.00 | 0.00 |
| Loxoconchasp. | 0.00 | 0.00 | 0.54 | 0.00 | 0.00 | 0.75 | 2.01 | 0.00 | 1.60 | 0.00 | 4.55 | 0.00 | 0.00 | 0.00 | 0.00 |
| Leptocytheresp. | 3.23 | 2.90 | 1.09 | 2.51 | 1.91 | 5.23 | 1.01 | 7.14 | 6.40 | 6.12 | 4.55 | 0.00 | 0.00 | 0.00 | 0.00 |
| Urocythereissp. | 8.06 | 0.00 | 0.54 | 0.00 | 0.00 | 0.30 | 0.50 | 0.40 | 0.00 | 6.12 | 4.55 | 0.00 | 0.00 | 0.00 | 0.00 |
| Pontocytherespp. | 1.61 | 0.00 | 0.00 | 0.00 | 0.00 | 0.60 | 0.50 | 1.59 | 1.60 | 4.08 | 0.00 | 0.00 | 0.00 | 0.00 | 0.00 |
| Callistocytheresp. | 0.00 | 0.65 | 0.00 | 0.00 | 0.00 | 0.00 | 0.50 | 0.00 | 0.00 | 0.00 | 0.00 | 0.00 | 0.00 | 0.00 | 0.00 |
| Hiltermannicytheresp. | 4.84 | 2.26 | 1.63 | 0.00 | 0.00 | 0.00 | 0.00 | 0.00 | 0.80 | 0.00 | 0.00 | 0.00 | 0.00 | 0.00 | 0.00 |
| Cytherettasp. | 0.00 | 0.00 | 0.00 | 0.00 | 0.54 | 0.30 | 0.00 | 0.00 | 0.80 | 2.04 | 0.00 | 0.00 | 0.00 | 0.00 | 0.00 |
| Cytherellasp. | 8.06 | 4.84 | 1.09 | 0.00 | 0.27 | 0.45 | 0.50 | 0.00 | 0.00 | 0.00 | 0.00 | 0.00 | 0.00 | 0.00 | 0.00 |
| Eucytherurasp. | 0.00 | 0.00 | 0.00 | 0.00 | 0.27 | 0.00 | 0.00 | 0.00 | 0.00 | 0.00 | 0.00 | 0.00 | 0.00 | 0.00 | 0.00 |
| Propontocyprissp. | 0.00 | 0.00 | 0.00 | 0.00 | 0.00 | 0.60 | 1.01 | 7.14 | 0.00 | 0.00 | 0.00 | 0.00 | 0.00 | 0.00 | 0.00 |
| Sagmatocytheresp. | 0.00 | 0.00 | 0.00 | 0.42 | 0.54 | 0.30 | 0.00 | 0.40 | 0.00 | 6.12 | 0.00 | 0.00 | 0.00 | 0.00 | 0.00 |
| Triebelinasp. | 0.00 | 0.00 | 0.00 | 0.00 | 0.00 | 0.00 | 0.00 | 0.40 | 0.00 | 0.00 | 0.00 | 0.00 | 0.00 | 0.00 | 0.00 |
| Semicytherurasp. | 0.00 | 0.00 | 0.00 | 0.00 | 2.18 | 1.35 | 0.50 | 2.78 | 8.00 | 2.04 | 2.27 | 0.00 | 0.00 | 0.00 | 0.00 |
| not identified | 3.23 | 0.65 | 0.54 | 0.00 | 0.54 | 0.75 | 0.50 | 1.19 | 2.40 | 2.04 | 0.00 | 0.00 | 0.00 | 0.00 | 0.00 |
Table A9.
Presence-absence data of benthic foraminifera taxa recorded at the studied cores. (black dots represent the presence of data of benthic foraminifera taxa recorded at the studied cores).
Table A9.
Presence-absence data of benthic foraminifera taxa recorded at the studied cores. (black dots represent the presence of data of benthic foraminifera taxa recorded at the studied cores).
| Depth (cm) | Miliolidae | A. tepida | A. parkinsoniana | A. beccarii | Elphidium spp. | Valvulineria spp. | Cibicides spp. | N. lucifuga | P. planatus |
|---|---|---|---|---|---|---|---|---|---|
| AKC1 | |||||||||
| 1–5 | ● | ● | |||||||
| 15–20 | ● | ● | |||||||
| 30–35 | ● | ● | |||||||
| 40–45 | ● | ● | |||||||
| 50–55 | ● | ● | |||||||
| 60–65 | ● | ● | |||||||
| 70–75 | ● | ||||||||
| 80–85 | ● | ● | ● | ||||||
| 90–95 | ● | ● | ● | ● | |||||
| 100–105 | ● | ● | ● | ● | |||||
| 110–115 | ● | ● | ● | ||||||
| 120–125 | ● | ● | ● | ● | |||||
| 130–135 | ● | ||||||||
| 140–145 | ● | ● | ● | ● | ● | ● | |||
| 145–150 | |||||||||
| 155–160 | |||||||||
| 170–175 | ● | ● | ● | ● | ● | ||||
| 180–185 | ● | ||||||||
| 190–195 | ● | ||||||||
| 200–205 | ● | ● | ● | ● | ● | ● | |||
| 210–215 | ● | ||||||||
| 220–225 | ● | ● | ● | ||||||
| 230–235 | ● | ● | ● | ||||||
| 240–245 | ● | ● | ● | ||||||
| 250–255 | ● | ● | ● | ● | ● | ||||
| 260–265 | ● | ||||||||
| AKC2 | |||||||||
| 5–10 | ● | ● | ● | ||||||
| 30–35 | ● | ● | ● | ||||||
| 35–40 | ● | ● | ● | ||||||
| 45–50 | ● | ● | |||||||
| 55–60 | ● | ||||||||
| 65–70 | ● | ||||||||
| 75–80 | ● | ● | |||||||
| 85–90 | ● | ● | |||||||
| 95100 | |||||||||
| 105–110 | |||||||||
| 115–120 | |||||||||
| 125–130 | |||||||||
| 140–145 | |||||||||
| 155–160 | |||||||||
| 170–175 | |||||||||
| 180–185 | ● | ● | ● | ||||||
| 190–195 | ● | ● | |||||||
| AKC3 | |||||||||
| 5–10 | ● | ● | ● | ||||||
| 15–20 | ● | ● | |||||||
| 25–30 | ● | ● | |||||||
| 35–40 | |||||||||
| 45–50 | ● | ||||||||
| 55–60 | ● | ||||||||
| 65–70 | ● | ● | |||||||
| 75–80 | ● | ||||||||
| 85–90 | ● | ● | |||||||
| 95–100 | ● | ● | |||||||
| 105–110 | |||||||||
| 115–120 | |||||||||
| 125–130 | |||||||||
| 135–140 | |||||||||
| 145–150 | |||||||||
| 165–170 | |||||||||
| 205–210 | |||||||||
| 215–220 | |||||||||
| 225–230 | ● | ● | ● | ||||||
| 235–240 | ● | ● | |||||||
| 245–250 | ● | ● | |||||||
| 255–260 | ● | ||||||||
| 265–270 | ● | ||||||||
| 275–280 | ● | ||||||||
| 285–290 | ● | ||||||||
| 295–300 | ● | ||||||||
| 305–310 | |||||||||
| 315–320 | |||||||||
| 325–330 | |||||||||
| 335–340 |
References
- Taffs, K.H.; Saunders, K.M.; Weckström, K.; Gell, P.A.; Skilbeck, C.G. Introduction to the Application of Paleoecological Techniques in Estuaries. In Applications of Paleoenvironmental Techniques in Estuarine Studies; Springer: Dordrecht, The Netherlands, 2017; pp. 1–6. [Google Scholar]
- Kjerfve, B. Comparative Oceanography of Coastal Lagoons. In Estuarine Variability; Academic Press: Waltham, MA, USA, 1986; pp. 63–81. [Google Scholar] [CrossRef]
- Kjerfve, B.; Magill, K. Geographic and hydrodynamic characteristics of shallow coastal lagoons. Mar. Geol. 1989, 88, 187–199. [Google Scholar] [CrossRef]
- Kjerfve, B. Chapter 1 Coastal Lagoons. In Mesoscale/Synoptic Coherent Structures in Geophysical Turbulence; Elsevier: Amsterdam, The Netherlands, 1994; Volume 60, pp. 1–8. [Google Scholar] [CrossRef]
- Esteves, F.; Caliman, A.; Santangelo, J.; Guariento, R.D.; Farjalla, V.; Bozelli, R. Neotropical coastal lagoons: An appraisal of their biodiversity, functioning, threats and conservation management. Braz. J. Biol. 2008, 68, 967–981. [Google Scholar] [CrossRef] [Green Version]
- Sacchi, M.; Molisso, F.; Pacifico, A.; Vigliotti, M.; Sabbarese, C.; Ruberti, D. Late-Holocene to recent evolution of Lake Patria, South Italy: An example of a coastal lagoon within a Mediterranean delta system. Glob. Planet. Chang. 2014, 117, 9–27. [Google Scholar] [CrossRef]
- D’Orefice, M.; Bellotti, P.; Bertini, A.; Calderoni, G.; Neri, P.C.; Di Bella, L.; Fiorenza, D.; Foresi, L.M.; Louvari, M.A.; Rainone, L.; et al. Holocene Evolution of the Burano Paleo-Lagoon (Southern Tuscany, Italy). Water 2020, 12, 1007. [Google Scholar] [CrossRef] [Green Version]
- López-Belzunce, M.; Blázquez, A.; Carmona, P.; Ruiz, J. Multi proxy analysis for reconstructing the late Holocene evolution of a Mediterranean Coastal Lagoon: Environmental variables within foraminiferal assemblages. Catena 2020, 187, 104333. [Google Scholar] [CrossRef]
- Karkani, A.; Evelpidou, N.; Giaime, M.; Marriner, N.; Morhange, C.; Spada, G. Late Holocene sea-level evolution of Paros Island (Cyclades, Greece). Quat. Int. 2019, 500, 139–146. [Google Scholar] [CrossRef] [Green Version]
- Evelpidou, N.; Pavlopoulos, K.; Vouvalidis, K.; Syrides, G.; Triantaphyllou, M.; Karkani, A.; Paraschou, T. Holocene palaeogeographical reconstruction and relative sea-level changes in the southeastern part of the island of Samos (Greece). Comptes Rendus Geosci. 2019, 351, 451–460. [Google Scholar] [CrossRef]
- Vacchi, M.; Marriner, N.; Morhange, C.; Spada, G.; Fontana, A.; Rovere, A. Multiproxy assessment of Holocene relative sea-level changes in the western Mediterranean: Sea-level variability and improvements in the definition of the isostatic signal. Earth Sci. Rev. 2016, 155, 172–197. [Google Scholar] [CrossRef] [Green Version]
- Sander, L.; Hede, M.U.; Fruergaard, M.; Nielsen, L.H.; Clemmensen, L.B.; Kroon, A.; Johannessen, P.N.; Pejrup, M. Coastal lagoons and beach ridges as complementary sedimentary archives for the reconstruction of Holocene relative sea-level changes. Terra Nova 2016, 28, 43–49. [Google Scholar] [CrossRef]
- Stock, F.; Seyer, M.; Symanczyk, A.; Uncu, L.; Brückner, H. On the geoarchaeology of Limyra (SW Anatolia)—new insights into the famous Lycian city and its environs. Geoarchaeology 2020, 35, 487–502. [Google Scholar] [CrossRef] [Green Version]
- Berndt, C.; Frenzel, P.; Çiner, A.; Ertunç, G.; Yıldırım, C. Holocene marginal marine ostracod successions from the Kızılırmak River delta; Implications for depositional environments and sea-level changes at the Southern Black Sea coast. Sediment. Geol. 2019, 382, 103–121. [Google Scholar] [CrossRef]
- Katrantsiotis, C.; Kylander, M.E.; Smittenberg, R.; Yamoah, K.K.; Hättestrand, M.; Avramidis, P.; Strandberg, N.A.; Norström, E. Eastern Mediterranean hydroclimate reconstruction over the last 3600 years based on sedimentary n-alkanes, their carbon and hydrogen isotope composition and XRF data from the Gialova Lagoon, SW Greece. Quat. Sci. Rev. 2018, 194, 77–93. [Google Scholar] [CrossRef]
- Horne, D.J.; Cohen, A.; Martens, K. Taxonomy, morphology and biology of Quaternary and living ostracoda. In Large Igneous Provinces; American Geophysical Union (AGU): Washington, DC, USA, 2002; pp. 5–36. [Google Scholar]
- Cohen, A.C.; Peterson, D.E.; Maddocks, R.F. Ostracoda. In The Light & Smith Manual: Intertidal Invertebrates from Central California to Oregon; Carlton, J.T., Ed.; University of California Press: Berkeley, CA, USA, 2007; pp. 417–446. [Google Scholar]
- Pavlopoulos, K.; Karkanas, P.; Triantaphyllou, M.; Karymbalis, E.; Tsourou, T.; Palyvos, N. Paleoenvironmental Evolution of the Coastal Plain of Marathon, Greece, during the Late Holocene: Depositional Environment, Climate, and Sea Level Changes. J. Coast. Res. 2006, 222, 424–438. [Google Scholar] [CrossRef]
- Triantaphyllou, M.; Kouli, K.; Tsourou, T.; Koukousioura, O.; Pavlopoulos, K.; Dermitzakis, M. Paleoenvironmental changes since 3000 BC in the coastal marsh of Vravron (Attica, SE Greece). Quat. Int. 2010, 216, 14–22. [Google Scholar] [CrossRef]
- Tsourou, T.; Drinia, H.; Anastasakis, G. Ostracod assemblages from HoloceneMiddle Shelf Deposits of southern Evoikos Gulf (Central Aegean Sea, Greece) and their palaeoenvironmental implications. Micropaleontology 2015, 61, 85–99. [Google Scholar]
- Bernhard, J.; Reimers, C.E. Benthic foraminiferal population fluctuations related to anoxia: Santa Barbara Basin. Biogeochem. 1991, 15, 127–149. [Google Scholar] [CrossRef]
- Corliss, B.; Silva, K.A. Rapid growth of deep-sea benthic foraminifera. Geology 1993, 21, 991–994. [Google Scholar] [CrossRef]
- Gupta, B.K.S.; Turner, R.E.; Rabalais, N.N. Seasonal oxygen depletion in continental-shelf waters of Louisiana: Historical record of benthic foraminifers. Geology 1996, 24, 227–230. [Google Scholar] [CrossRef]
- Drinia, H.; Antonarakou, A.; Anastasakis, G. Late Quaternary micropalaeontological record of a semi-enclosed marine basin, North Evoikos, central Aegean Sea. Quat. Int. 2014, 345, 18–31. [Google Scholar] [CrossRef] [Green Version]
- Drinia, H.; Antonarakou, A.; Tsourou, T.; Kontakiotis, G.; Psychogiou, M.; Anastasakis, G. Foraminifera eco-biostratigraphy of the southern Evoikos outer shelf, central Aegean Sea, during MIS 5 to present. Cont. Shelf Res. 2016, 126, 36–49. [Google Scholar] [CrossRef]
- Louvari, M.A.; Drinia, H.; Kontakiotis, G.; Di Bella, L.; Antonarakou, A.; Anastasakis, G. Impact of latest-glacial to Holocene sea-level oscillations on central Aegean shelf ecosystems: A benthic foraminiferal palaeoenvironmental assessment of South Evoikos Gulf, Greece. J. Mar. Syst. 2019, 199, 103181. [Google Scholar] [CrossRef]
- Kaniewski, D.; Marriner, N.; Cheddadi, R.; Fischer, P.M.; Otto, T.; Luce, F.; Van Campo, E. Climate Change and Social Unrest: A 6000-Year Chronicle From the Eastern Mediterranean. Geophys. Res. Lett. 2020, 47, 47. [Google Scholar] [CrossRef]
- Morhange, C.; Goiran, J.-P.; Bourcier, M.; Carbonel, P.; Le Campion, J.; Rouchy, J.-M.; Yon, M. Recent Holocene paleo-environmental evolution and coastline changes of Kition, Larnaca, Cyprus, Mediterranean Sea. Mar. Geol. 2000, 170, 205–230. [Google Scholar] [CrossRef]
- Vacchi, M.; Ermolli, E.R.; Morhange, C.; Ruello, M.R.; Di Donato, V.; Di Vito, M.A.; Giampaola, D.; Carsana, V.; Liuzza, V.; Cinque, A.; et al. Millennial variability of rates of sea-level rise in the ancient harbour of Naples (Italy, western Mediterranean Sea). Quat. Res. 2019, 93, 284–298. [Google Scholar] [CrossRef]
- Lambeck, K.; Antonioli, F.; Anzidei, M.; Ferranti, L.; Leoni, G.; Scicchitano, G.; Silenzi, S. Sea level change along the Italian coast during the Holocene and projections for the future. Quat. Int. 2011, 232, 250–257. [Google Scholar] [CrossRef]
- Wahl, T.; Haigh, I.D.; Nicholls, R.J.; Arns, A.; Dangendorf, S.; Hinkel, J.; Slangen, A.B.A. Understanding extreme sea levels for broad-scale coastal impact and adaptation analysis. Nat. Commun. 2017, 8, 16075. [Google Scholar] [CrossRef]
- Antonioli, F.; Anzidei, M.; Amorosi, A.; Presti, V.L.; Mastronuzzi, G.; Deiana, G.; De Falco, G.; Fontana, A.; Fontolan, G.; Lisco, S.; et al. Sea-level rise and potential drowning of the Italian coastal plains: Flooding risk scenarios for 2100. Quat. Sci. Rev. 2017, 158, 29–43. [Google Scholar] [CrossRef] [Green Version]
- Bear, L.; Morel, S. The Geology and Mineral Resources of the Agros-Akrotiri Area; Geological Survey Department: Lefkosia, Cyprus, 1960.
- Polidorou, M.; Saitis, G.; Evelpidou, N. Beachrock development as an indicator of paleogeographic evolution, the case of Akrotiri Peninsula, Cyprus. Zeitschrift für Geomorphologie 2021, 63, 3–17. [Google Scholar] [CrossRef]
- Eaton, S.; Robertson, A. The Miocene Pakhna Formation, southern Cyprus and its relationship to the Neogene tectonic evolution of the Eastern Mediterranean. Sediment. Geol. 1993, 86, 273–296. [Google Scholar] [CrossRef]
- Soulas, J.P. Active Tectonics Studies in Cyprus for Seismic Risk Mitigation: The Greater Limassol Area; Cyprus Geological Survey: Nicosia, Cyprus, 1999.
- Simmons, A.H. Humans, island colonization and Pleistocene extinctions in the Mediterranean: The view from Akrotiri Aetokremnos, Cyprus. Antiquity 1991, 65, 857–869. [Google Scholar] [CrossRef]
- Mandel, R.D.; Simmons, A.H. Geoarchaeology of the AkrotiriAetokremnos rockshelter, Southern Cyprus. Geoarchaeology 1997, 12, 567–605. [Google Scholar] [CrossRef]
- Wigand, P.; Simmons, A.H. The Dating of Akortiri Aetokremnos. In Perspectives on the Archaeology of Pipes, Tobacco and Other Smoke Plants in the Ancient Americas; Springer: Boston, MA, USA, 2002; pp. 193–215. [Google Scholar] [CrossRef]
- Ammerman, A.J.; Noller, J.S. New light on Aetokremnos. World Archaeol. 2005, 37, 533–543. [Google Scholar] [CrossRef]
- Simmons, A.; Mandel, R. Not such a new light: A response to Ammerman and Noller. World Archaeol. 2007, 39, 475–482. [Google Scholar] [CrossRef]
- James, S. Excavations of Roman/Early Byzantine Structures at Dreamers Bay, Akrotiri. Bull. Counc. Br. Res. Levant 2017, 12, 44–47. [Google Scholar] [CrossRef]
- James, S.; Score, V. Akrotiri-Dreamer’s Bay (Nissarouin) Excavation & Survey. In Spring 2018 Interim Report; Honor Frost Foundation: London, UK, 2018. [Google Scholar]
- Blue, L. Ancient Akrotiri Project, Dreamer’s Bay Underwater Survey. In Interim Report 2018; Honor Frost Foundation: London, UK, 2018. [Google Scholar]
- Folk, R.L. The Distinction between Grain Size and Mineral Composition in Sedimentary-Rock Nomenclature. J. Geol. 1954, 62, 344–359. [Google Scholar] [CrossRef]
- Rothwell, R.G.; Croudace, I.W. Micro-XRF Studies of Sediment Cores: A Perspective on Capability and Application in the Environmental Sciences. In Applications of Paleoenvironmental Techniques in Estuarine Studies; Springer: Dordrecht, The Netherlands, 2015; pp. 1–21. [Google Scholar] [CrossRef]
- Haenssler, E.; Unkel, I.; Dörfler, W.; Nadeau, M.-J. Driving mechanisms of Holocene lagoon development and barrier accretion in Northern Elis, Peloponnese, inferred from the sedimentary record of the Kotychi Lagoon. E G Quat. Sci. J. 2014, 63, 60–77. [Google Scholar] [CrossRef]
- Emmanouilidis, A.; Katrantsiotis, C.; Norström, E.; Risberg, J.; Kylander, M.; Sheik, T.A.; Iliopoulos, G.; Avramidis, P. Middle to late Holocene palaeoenvironmental study of Gialova Lagoon, SW Peloponnese, Greece. Quat. Int. 2018, 476, 46–62. [Google Scholar] [CrossRef]
- Brunović, D.; Miko, S.; Hasan, O.; Papatheodorou, G.; Ilijanić, N.; Miserocchi, S.; Correggiari, A.; Geraga, M. Late Pleistocene and Holocene paleoenvironmental reconstruction of a drowned karst isolation basin (Lošinj Channel, NE Adriatic Sea). Palaeogeogr. Palaeoclim. Palaeoecol. 2020, 544, 109587. [Google Scholar] [CrossRef]
- Rothwell, R.G.; Hoogakker, B.; Thomson, J.; Croudace, I.; Frenz, M. Turbidite emplacement on the southern Balearic Abyssal Plain (western Mediterranean Sea) during Marine Isotope Stages 1–3: An application of ITRAX XRF scanning of sediment cores to lithostratigraphic analysis. Geol. Soc. Spec. Publ. 2006, 267, 79–98. [Google Scholar] [CrossRef]
- Yarincik, K.M.; Murray, R.W.; Peterson, L.C. Climatically sensitive eolian and hemipelagic deposition in the Cariaco Basin, Venezuela, over the past 578,000 years: Results from Al/Ti and K/Al. Paleoceanography 2000, 15, 210–228. [Google Scholar] [CrossRef]
- Calvert, S.; Pedersen, T. Chapter Fourteen Elemental Proxies for Palaeoclimatic and Palaeoceanographic Variability in Marine Sediments: Interpretation and Application. In Earth and Life Processes Discovered from Subseafloor Environments—A Decade of Science Achieved by the Integrated Ocean Drilling Program (IODP); Elsevier: Amsterdam, The Netherlands, 2007; pp. 567–644. [Google Scholar] [CrossRef]
- Bahr, A.; Lamy, F.; Arz, H.W.; Major, C.; Kwiecien, O.; Wefer, G. Abrupt changes of temperature and water chemistry in the late Pleistocene and early Holocene Black Sea. Geochem. Geophys. Geosyst. 2008, 9. [Google Scholar] [CrossRef] [Green Version]
- Van Hoang, L.; Clift, P.D.; Schwab, A.M.; Huuse, M.; Nguyen, D.A.; Zhen, S. Large-scale erosional response of SE Asia to monsoon evolution reconstructed from sedimentary records of the Song Hong-Yinggehai and Qiongdongnan basins, South China Sea. Geol. Soc. Spec. Publ. 2010, 342, 219–244. [Google Scholar] [CrossRef]
- Tjallingii, R.; Stattegger, K.; Wetzel, A.; Van Phach, P. Infilling and flooding of the Mekong River incised valley during deglacial sea-level rise. Quat. Sci. Rev. 2010, 29, 1432–1444. [Google Scholar] [CrossRef]
- Barbeito-Gonzalez, P.J. Die Ostracoden des Küstenbereiches von Naxos (Griechenland) und ihre Lebensbereiche. Mitt. Aus. Dem. Hambg. Zool. Mus. Und Inst. 1971, 67, 255–326. [Google Scholar]
- Bonaduce, G.; Ciampo, G.; Masoli, M. Distribution of Ostracods in the Adriatic Sea. Pubbl. Staz. Zool. Napoli 1975, 40, 1–304. [Google Scholar]
- Athersuch, J. The ecology and distribution of the littoral ostracods of Cyprus. J. Nat. Hist. 1979, 13, 135–160. [Google Scholar] [CrossRef]
- Stambolidis, E. Subrezente Ostracoden aus dem Evros-Delta (Griechenland) Einschliesslich der Entwicklung des Schlosses Gewisser Arten. Ph.D. Thesis, Acta Universitatis Upsaliensis, Uppsala, Sweden, 1984. [Google Scholar]
- Athersuch, J.; Horne, D.J.; Whittaker, J.E. Marine and brackish water ostracods (superfamilies Cypridacea and Cytheracea). Synopses of the British Fauna (New Series); Ghent University Library: Ghent, Belgium, 1989; Volume 43, p. 343. [Google Scholar]
- Barbieri, G.; Vaiani, S.C. Benthic foraminifera or Ostracoda? Comparing the accuracy of palaeoenvironmental indicators from a Pleistocene lagoon of the Romagna coastal plain (Italy). J. Micropalaeontol. 2018, 37, 203–230. [Google Scholar] [CrossRef]
- Cimerman, F.; Langer, M.R. Mediterranean Foraminifera. Acad. Sci. Artium Slov. Ljubl. 1991, 30, 1–11. [Google Scholar]
- Jorissen, F.J. Benthic Foraminiferal Microhabitats below the Sediment-Water Interface; Springer Science and Business Media LLC: Larkspur, CA, USA, 1999; pp. 161–179. [Google Scholar] [CrossRef]
- Sgarrella, F.; DI Donato, V.; Sprovieri, R. Benthic foraminiferal assemblage turnover during intensification of the Northern Hemisphere glaciation in the Piacenzian Punta Piccola section (Southern Italy). Palaeogeogr. Palaeoclim. Palaeoecol. 2012, 333–334, 59–74. [Google Scholar] [CrossRef]
- Moissette, P.; Koskeridou, E.; Drinia, H.; Cornée, J.-J. Facies associations in warm-temperate siliciclastic deposits: Insights from early Pleistocene eastern Mediterranean (Rhodes, Greece). Geol. Mag. 2016, 153, 61–83. [Google Scholar] [CrossRef]
- Stuiver, M.; Reimer, P.; Sept, R.R.-W. CALIB Radiocarbon Calibration. Available online: http://calib.org/calib/ (accessed on 20 April 2021).
- Reimer, P.J.; Bard, E.; Bayliss, A.; Beck, J.W.; Blackwell, P.G.; Ramsey, C.B.; Buck, C.; Cheng, H.; Edwards, R.L.; Friedrich, M.; et al. IntCal13 and Marine13 Radiocarbon Age Calibration Curves 0–50,000 Years cal BP. Radiocarbon 2013, 55, 1869–1887. [Google Scholar] [CrossRef] [Green Version]
- Reimer, P.J.; McCormac, F.G. Marine Radiocarbon Reservoir Corrections for the Mediterranean and Aegean Seas. Radiocarbon 2002, 44, 159–166. [Google Scholar] [CrossRef] [Green Version]
- Blott, S.J.; Pye, K. Gradistat: A grain size distribution and statistics package for the analysis of unconsolidated sediments. Earth Surf. Process. Landf. 2001, 26, 1237–1248. [Google Scholar] [CrossRef]
- Van Morkhoven, F.P.C.M. Post-Palaeozoic Ostracoda: Their Morphology, Taxonomy and Economic Use; Elsevier: Amsterdam, The Netherlands, 1962; Volume 1. [Google Scholar]
- Meisch, C. Freshwater Ostracoda of Western and Central Europe. In Süßwasserfauna von Mitteleuropa; Schwoerbel, J., Zwick, P., Eds.; Spektrum Akademischer Verlag: Berlin/Heidelberg, Germany, 2000; p. 522. [Google Scholar]
- Salel, T.; Bruneton, H.; Lefèvre, D. Ostracods and environmental variability in lagoons and deltas along the north-western Mediterranean coast (Gulf of Lions, France and Ebro delta, Spain). Revue Micropaléontologie 2016, 59, 425–444. [Google Scholar] [CrossRef]
- Carboni, M.G.; Bergamin, L.; Di Bella, L.; Iamundo, F.; Pugliese, N. Palaeoecological evidences from foraminifers and ostracods on Late Quaternary sea-level changes in the Ombrone river plain (central Tyrrhenian coast, Italy). Geobios 2002, 35, 40–50. [Google Scholar] [CrossRef]
- Cabral, M.; Freitas, M.; Andrade, C.; Cruces, A. Coastal evolution and Holocene ostracods in Melides lagoon (SW Portugal). Mar. Micropaleontol. 2006, 60, 181–204. [Google Scholar] [CrossRef]
- Tsourou, T. Composition and Distribution of Recent Marine Ostracod Assemblages in the Bottom Sediments of Central Aegean Sea (SE Andros Island, Greece). Int. Rev. Hydrobiol. 2012, 97, 276–300. [Google Scholar] [CrossRef]
- Leroy, S.; Kazancı, N.; Ileri, Ö.; Kibar, M.; Emre, Ö.; McGee, E.; Griffiths, H. Abrupt environmental changes within a late Holocene lacustrine sequence south of the Marmara Sea (Lake Manyas, N-W Turkey): Possible links with seismic events. Mar. Geol. 2002, 190, 531–552. [Google Scholar] [CrossRef]
- Croudace, I.; Rindby, A.; Rothwell, R.G. ITRAX: Description and evaluation of a new multi-function X-ray core scanner. Geol. Soc. Spec. Publ. 2006, 267, 51–63. [Google Scholar] [CrossRef] [Green Version]
- Goudeau, M.L.; Grauel, A.-L.; Tessarolo, C.; Leider, A.; Chen, L.; Bernasconi, S.; Versteegh, G.J.; Zonneveld, K.A.; Boer, W.; Alonso-Hernandez, C.; et al. The Glacial–Interglacial transition and Holocene environmental changes in sediments from the Gulf of Taranto, central Mediterranean. Mar. Geol. 2014, 348, 88–102. [Google Scholar] [CrossRef]
- Jorissen, F. Benthic foraminifera from the Adriatic Sea: Principles of phenotypic variation. Ph.D. Thesis, Utrecht University, Utrecht, The Netherlands, 1988. [Google Scholar]
- Murray, J.W. Ecology and Applications of Benthic Foraminifera. In Ecology and Applications of Benthic Foraminifera; Cambridge University Press: Cambridge, UK, 2006. [Google Scholar]
- Bustron, F. Chronique de L’île de Chypre; Ministre de l’Instruction Publique et des Beaux Arts: Paris, France, 1886. [Google Scholar]
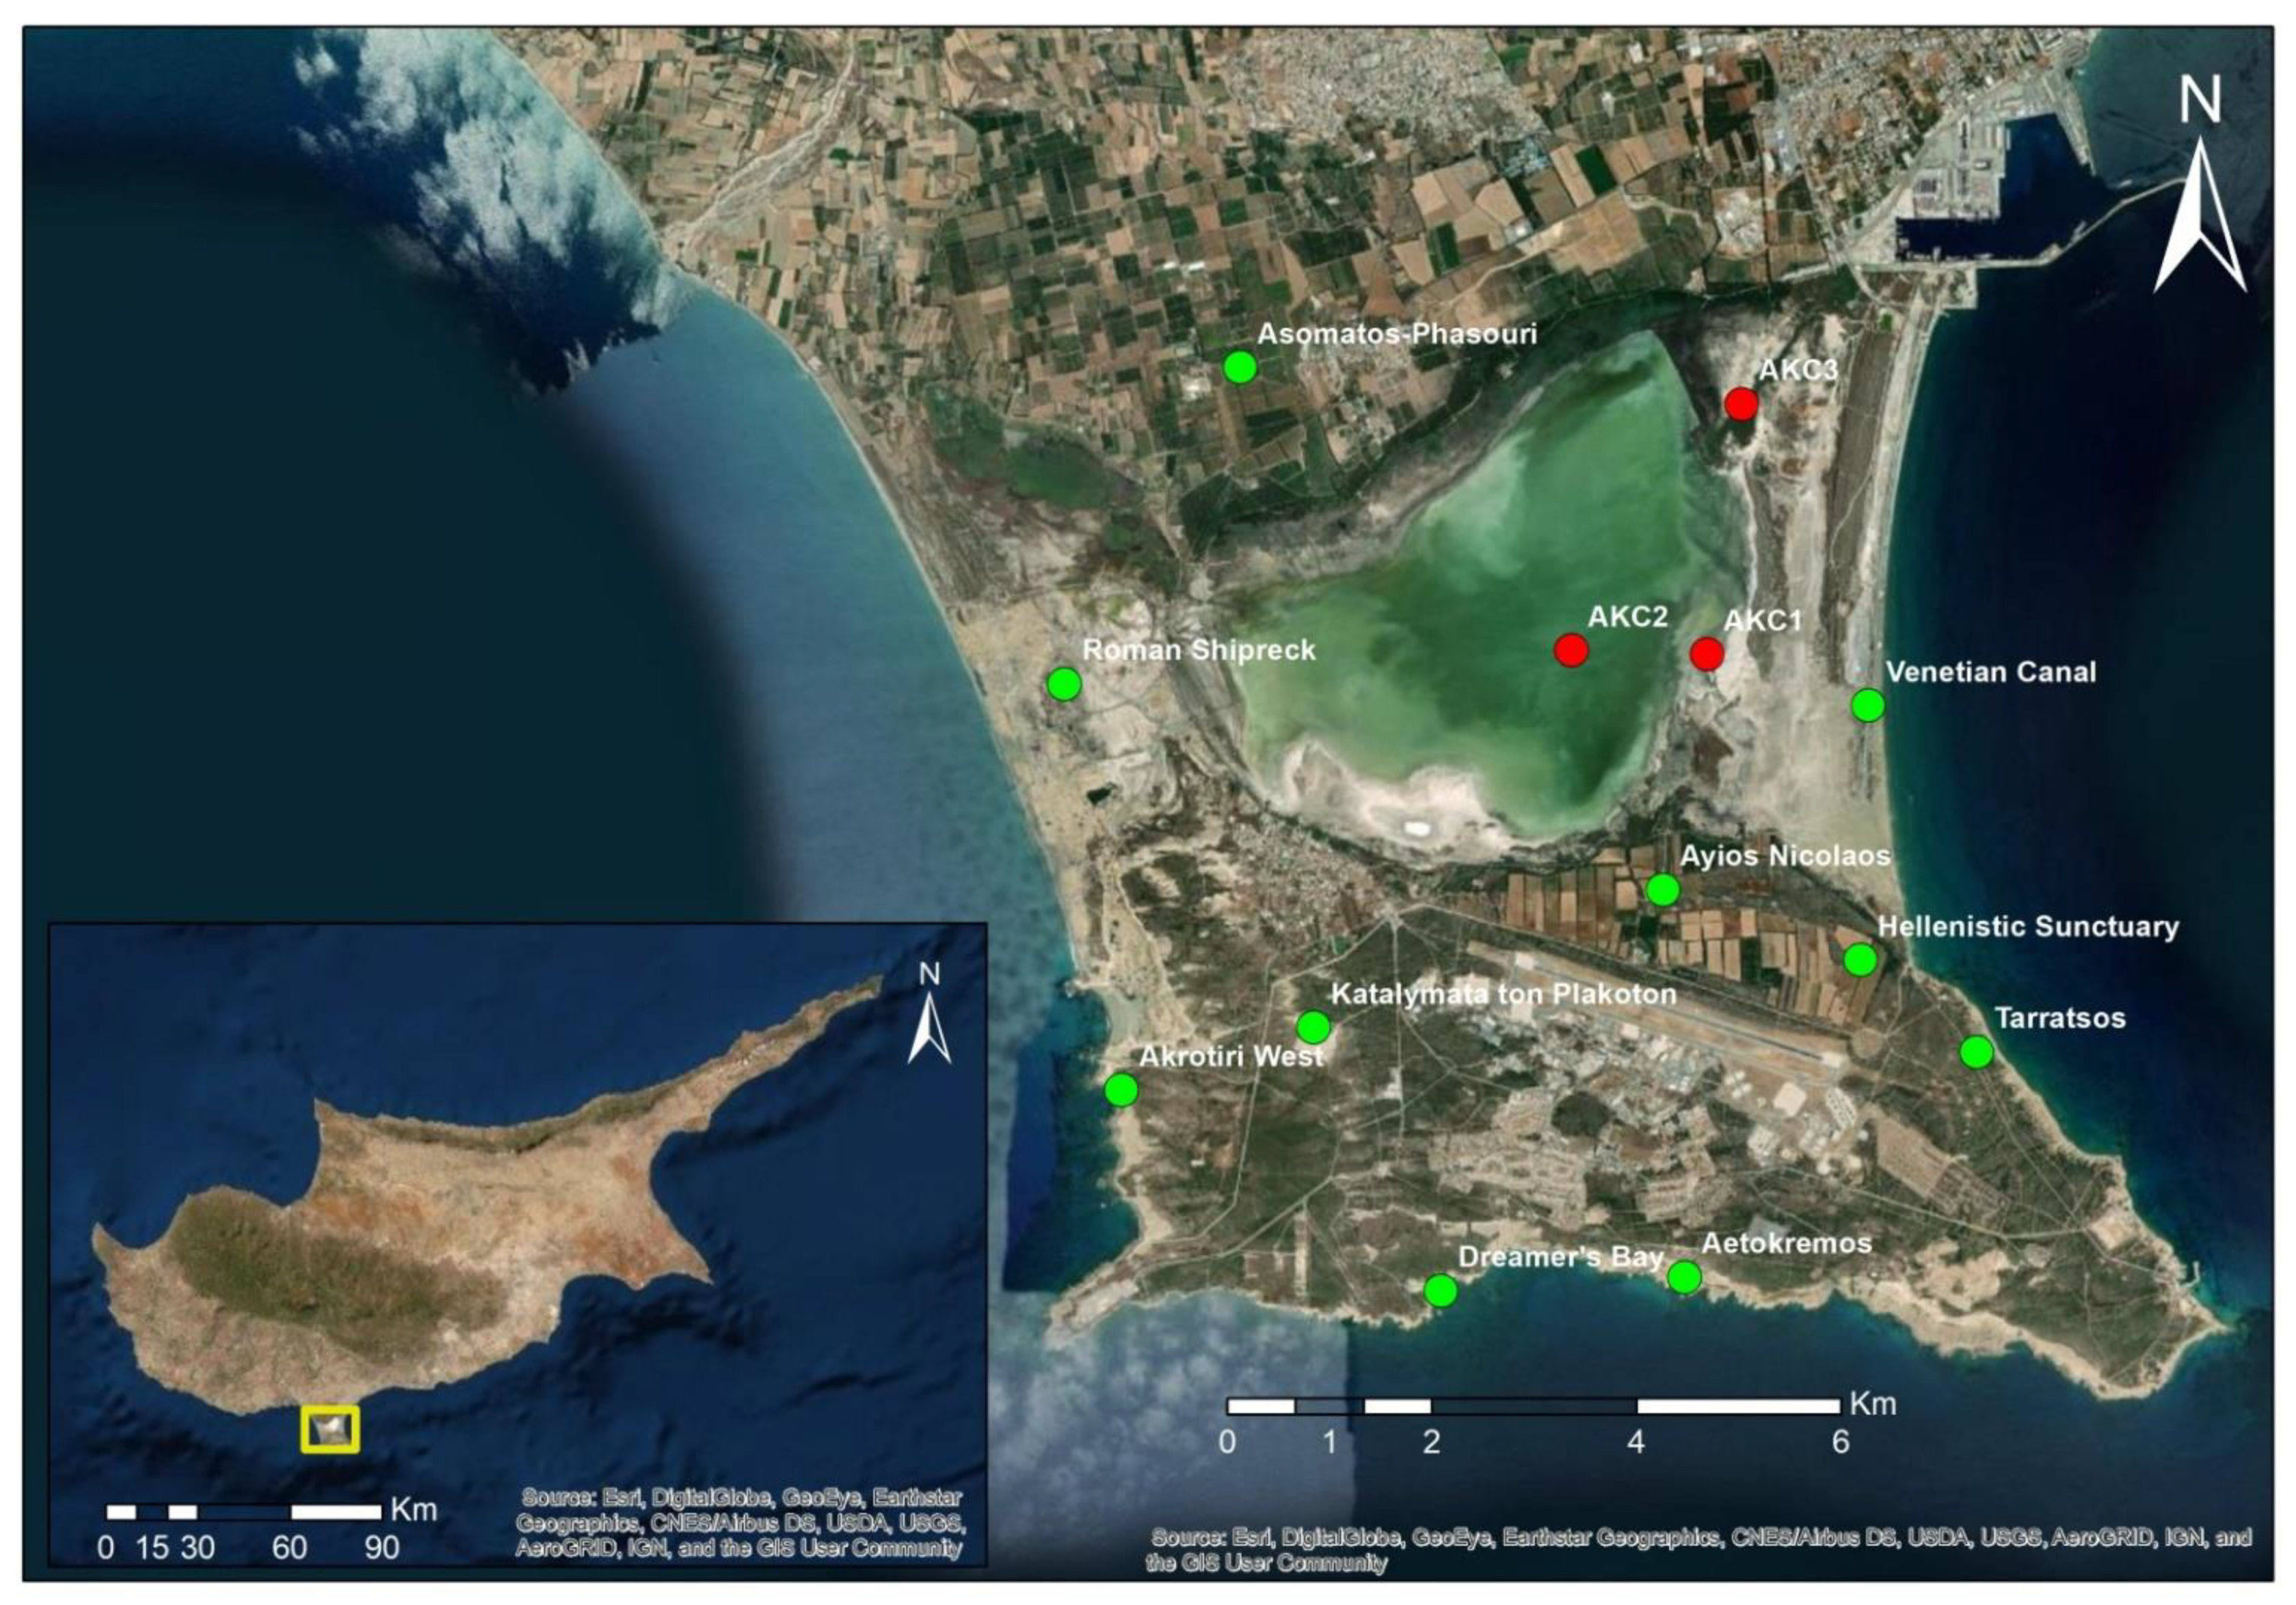
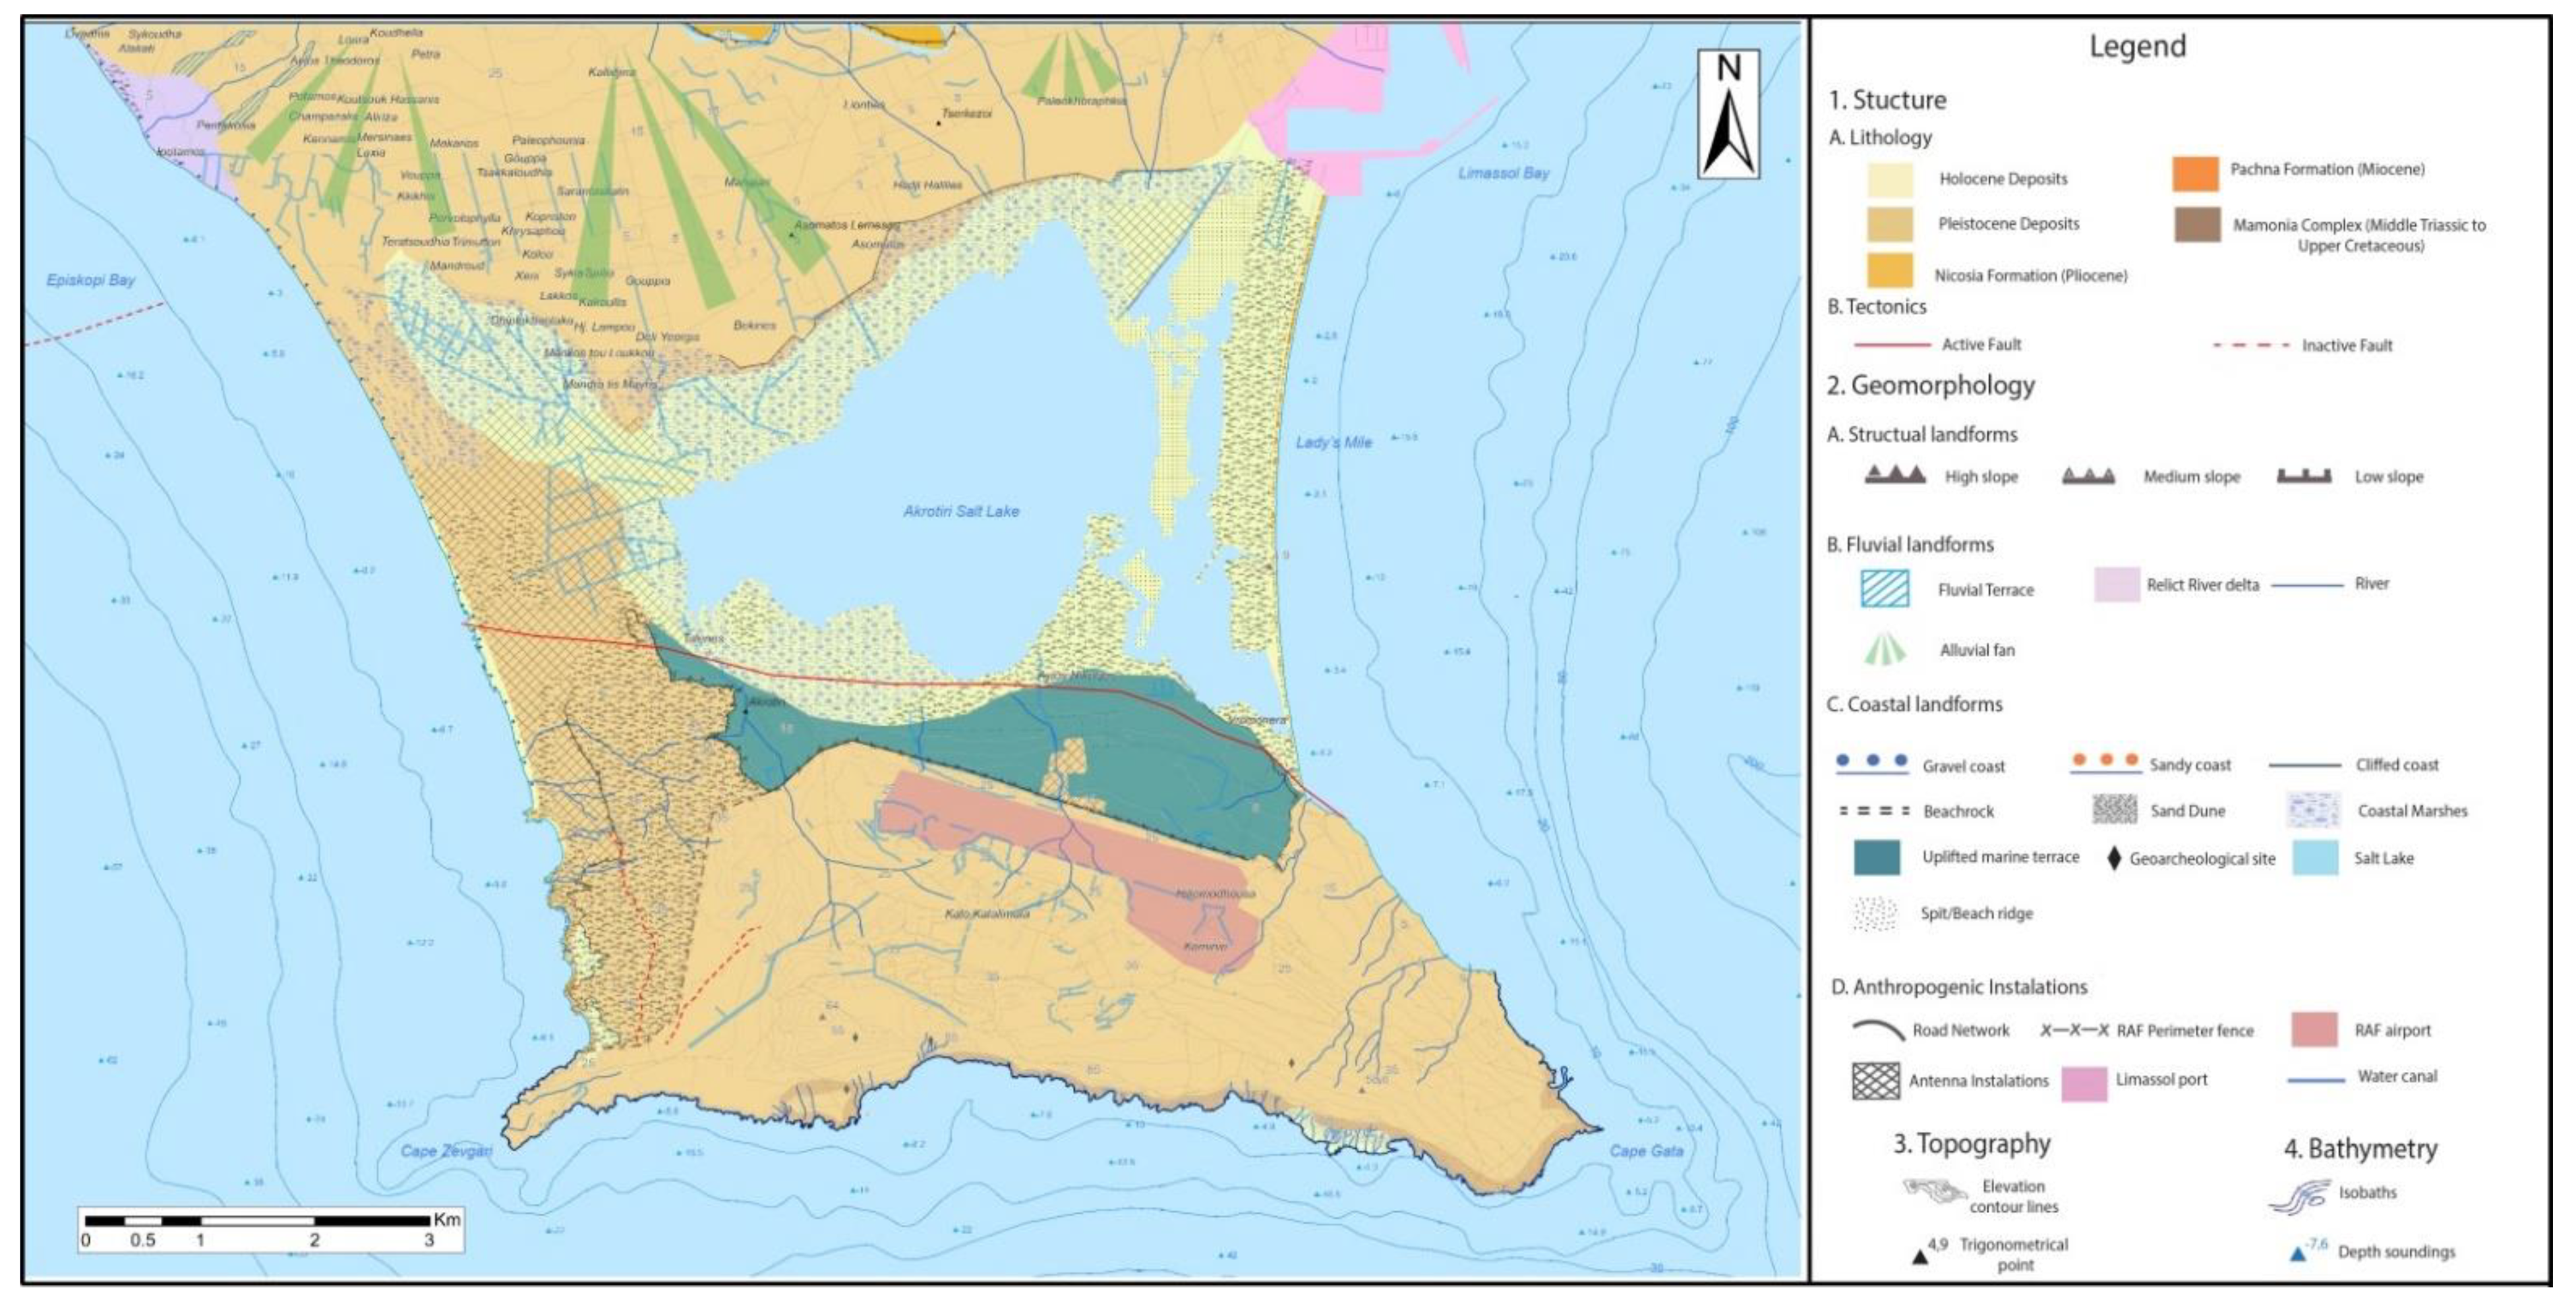

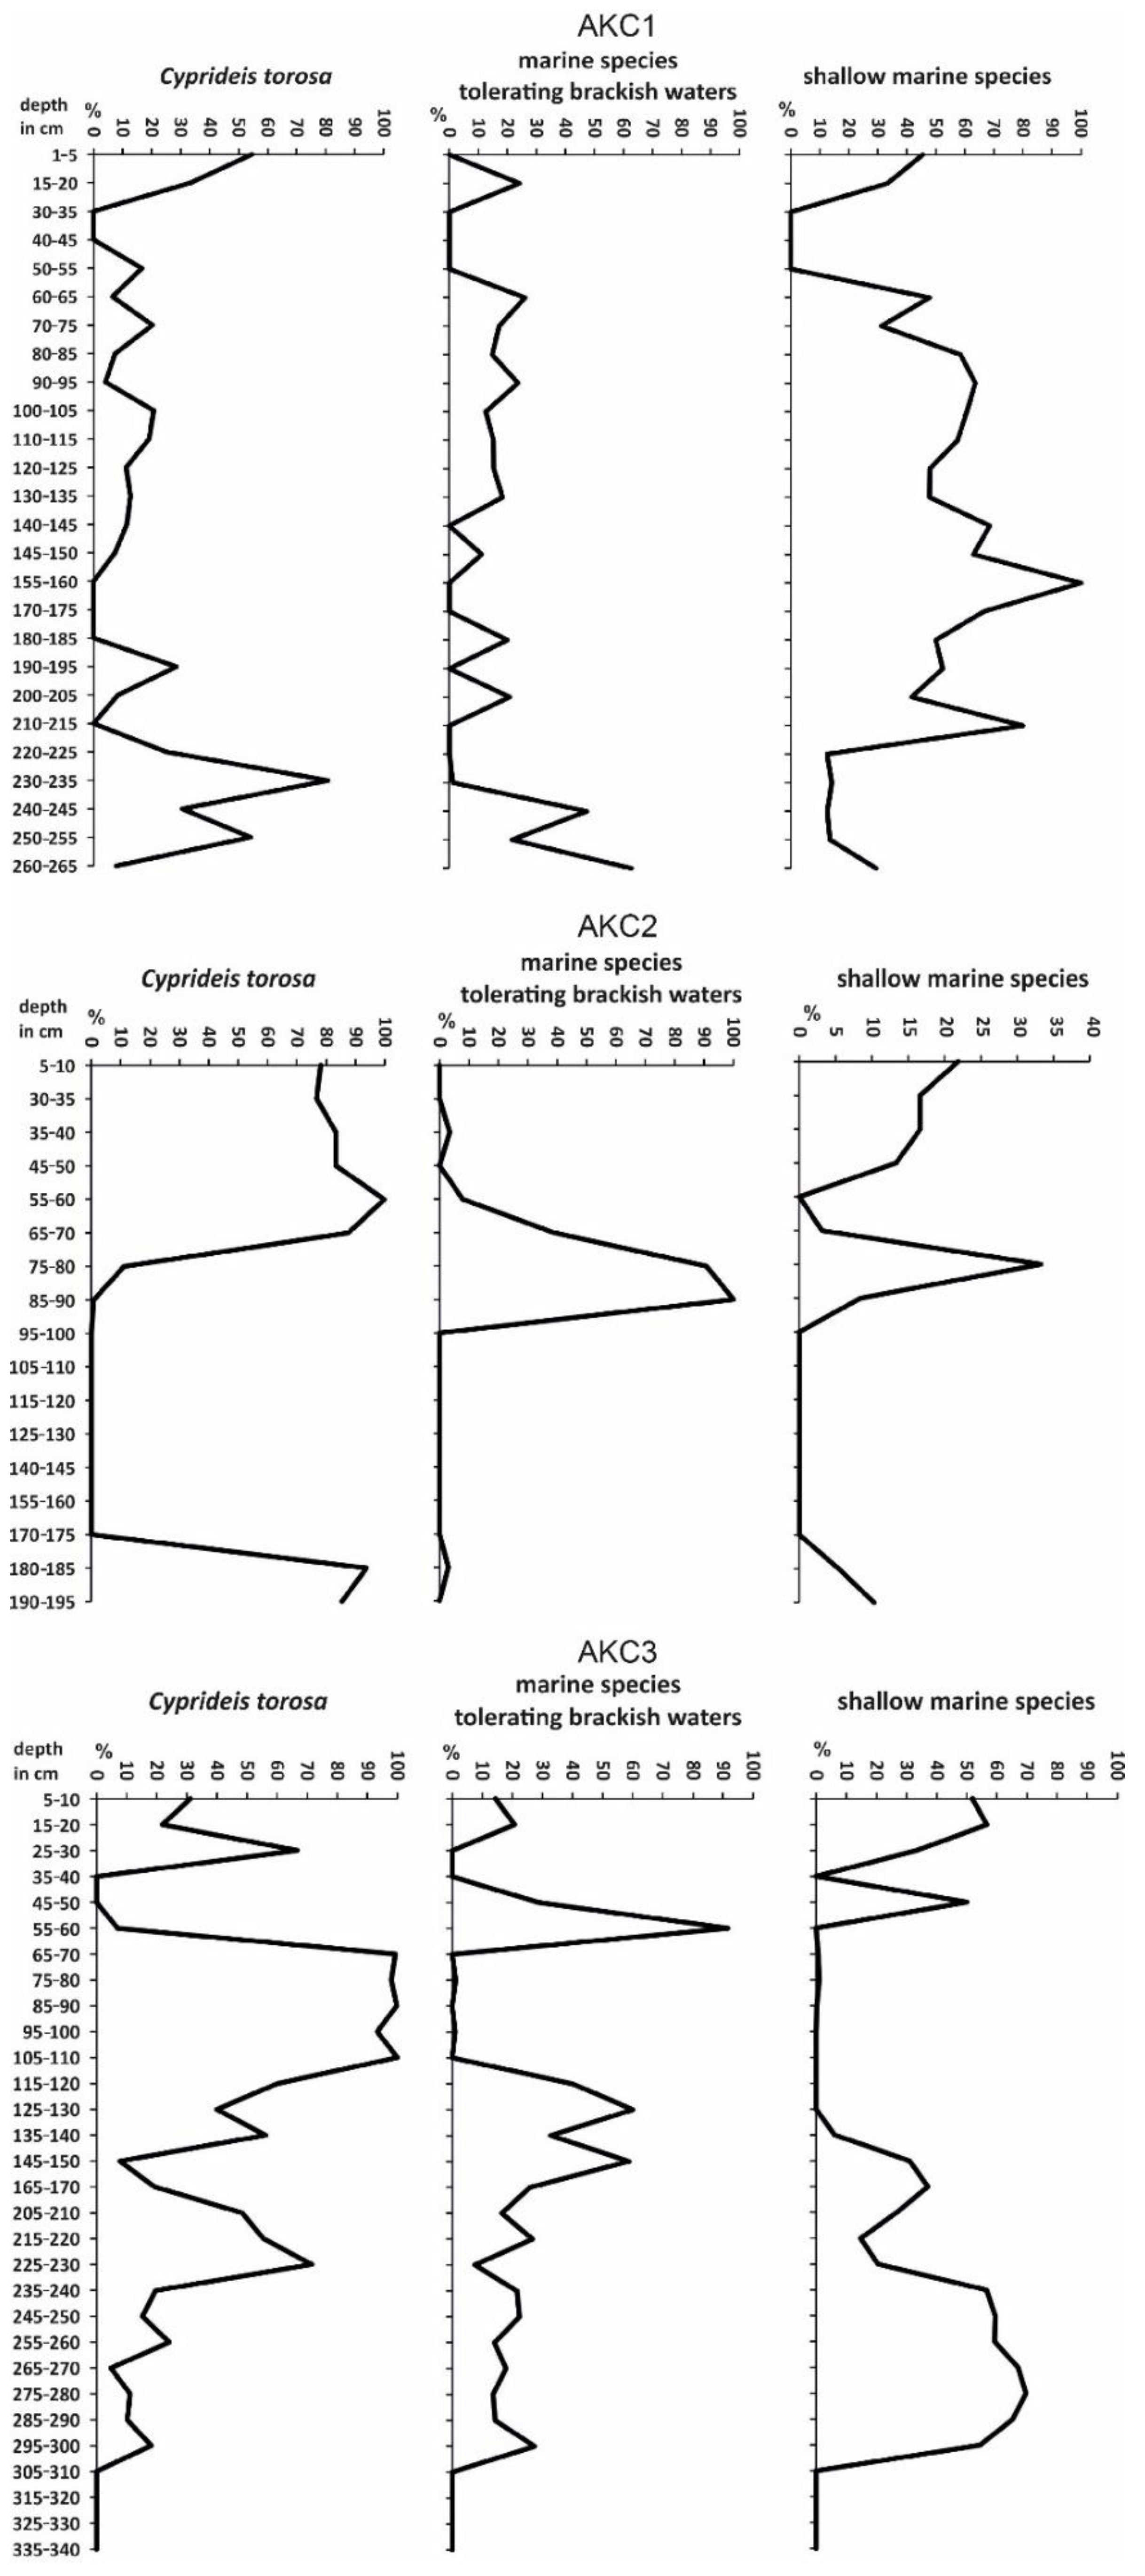
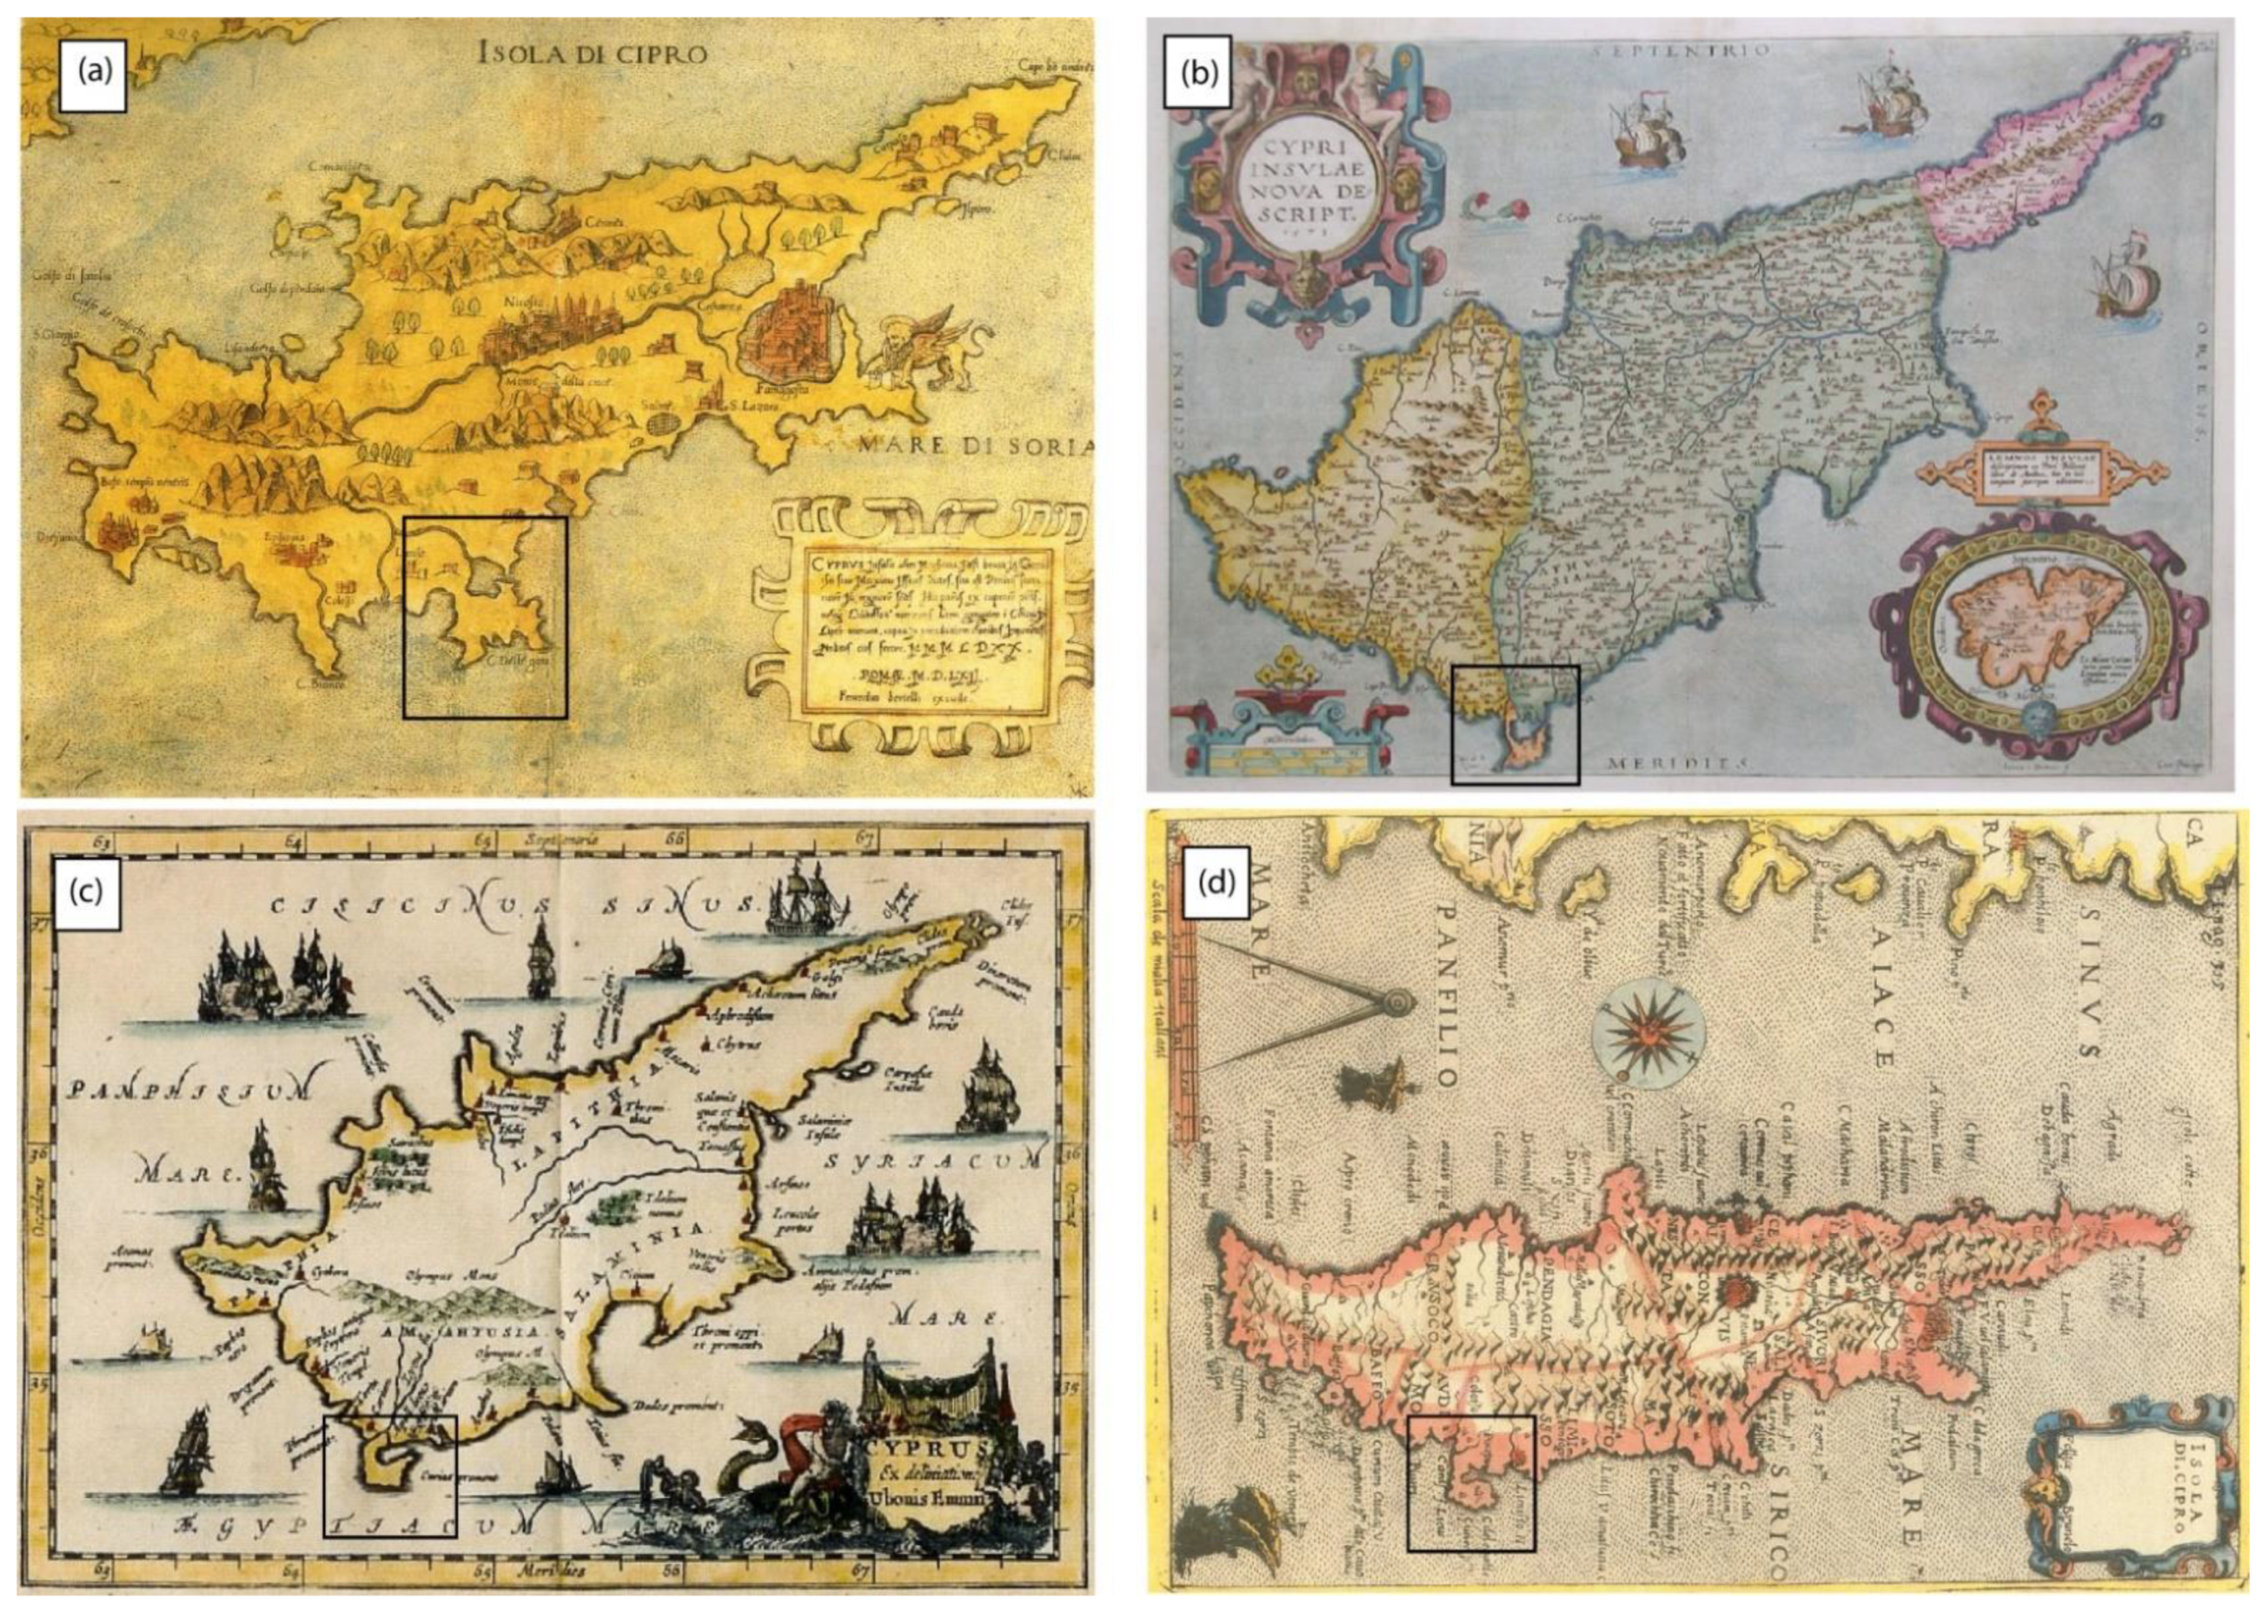

Publisher’s Note: MDPI stays neutral with regard to jurisdictional claims in published maps and institutional affiliations. |
© 2021 by the authors. Licensee MDPI, Basel, Switzerland. This article is an open access article distributed under the terms and conditions of the Creative Commons Attribution (CC BY) license (https://creativecommons.org/licenses/by/4.0/).