
Scaling in a Geothermal Heat Exchanger at Soultz-Sous-Forêts (Upper Rhine Graben, France): A XRD and SEM-EDS Characterization of Sulfide Precipitates

 ,
,  ,
, 


Abstract
:1. Introduction
2. Technical Context
2.1. Scaling Phenomenon in Geothermal Power Plants Worldwide
2.2. Scaling Phenomeon at Soultz Geothermal Power Plant
2.3. The Tested Small Heat Exchanger (SHEx; Soultz)
3. Material and Methods
3.1. Scales
3.2. Preparation of Samples
3.3. X-ray Diffraction
3.4. Scanning Electron Microscopy Coupled with Energy Dispersive Spectrometry (SEM-EDS)
4. Results
4.1. X-ray Diffraction (XRD)
4.2. Scanning Electron Microscopy coupled with Energy Dispersive Spectrometry (SEM-EDS)
4.2.1. Structure of the Scales

| Sampling Points | Alloy | Temperature (°C) | Structure of scales | Analyses | Whole Thickness of Scales (µm) | Thickness of Smooth Zone (µm) | Dendrite | Needle | Coral | Cube | Fibro-Radiated |
|---|---|---|---|---|---|---|---|---|---|---|---|
| Industrial | 1.4410 | 65–75 | Powder | SEM | x | ||||||
| Entrance | 1.4307 | 65 | Powder | XRD, SEM | x | ||||||
| Exit | 1.4307 | 40 | Powder | XRD | |||||||
| Wwb 1 (top) | 1.4307 | 65 | Powder | XRD, SEM | x | x | x | x | |||
| Wwb 2 (Middle) | 1.4307 | 55 | Powder | SEM | x | ||||||
| Wwb 3 (Bottom) | 1.4307 | 40 | Powder | XRD, SEM | x | x | |||||
| Flange A (East) | 1.4307 | 60 | Continuous | SEM | - | 15 | x | x | x | ||
| Flange B (East) | 1.4307 | 50 | Continuous | SEM | 30 | 12 | x | x | x | ||
| Flange C (East) | 1.4307 | 50 | Continuous | SEM | 110 | 15 | |||||
| Tube | 1.4539 | 60 | Continuous | SEM | x | x | x (co) | ||||
| Tube | 1.4547 | 60 | Continuous | SEM | x | ||||||
| Tube (FS) | 1.4462 | 60 | Continuous | SEM | - | ||||||
| Tube (MS) | 1.4462 | 60 | Continuous | SEM | - | ||||||
| Tube (Total) | 1.4462 | 60 | Continuous | SEM | 22 | 5 | x? | ||||
| Tube | 1.4410 | 60 | Continuous | SEM | 50 | 10 | x | ||||
| Tube | 2.4858 | 60 | Continuous | SEM | x | ||||||
| Tube | 3.7035 | 60 | Continuous | SEM | 15 | 6 | - | ||||
| Tube | 1.4539 | 50 | Continuous | SEM | x | x | x | ||||
| Tube | 1.4547 | 50 | Continuous | SEM | 270 | - | x | x | |||
| Tube (FS) | 1.4462 | 50 | Continuous | SEM | - | ||||||
| Tube (MS) | 1.4462 | 50 | Continuous | SEM | - | ||||||
| Tube (Total) | 1.4462 | 50 | Continuous | SEM | x? | ||||||
| Tube | 1.4410 | 50 | Continuous | SEM | 80 | 10 | x | x | |||
| Tube | 2.4858 | 50 | Continuous | SEM | 50 | 30 | x | x | x | ||
| Tube | 3.7035 | 50 | Continuous | SEM | x | ||||||
| Tube | 1.4539 | 40 | Continuous | SEM | 200 | 10 | x | ||||
| Tube | 1.4547 | 40 | Continuous | SEM | 270 | 25 | x | ||||
| Tube (FS) | 1.4462 | 40 | Continuous | SEM | |||||||
| Tube (MS) | 1.4462 | 40 | Continuous | SEM | |||||||
| Tube (Total) | 1.4462 | 40 | Continuous | SEM | x | x | x (oct) | x | |||
| Tube | 1.4410 | 40 | Continuous | SEM | 220 | 10 | x | ||||
| Tube | 2.4858 | 40 | Continuous | SEM | 60 | 30 | x | x | |||
| Tube | 3.7035 | 40 | Continuous | SEM |
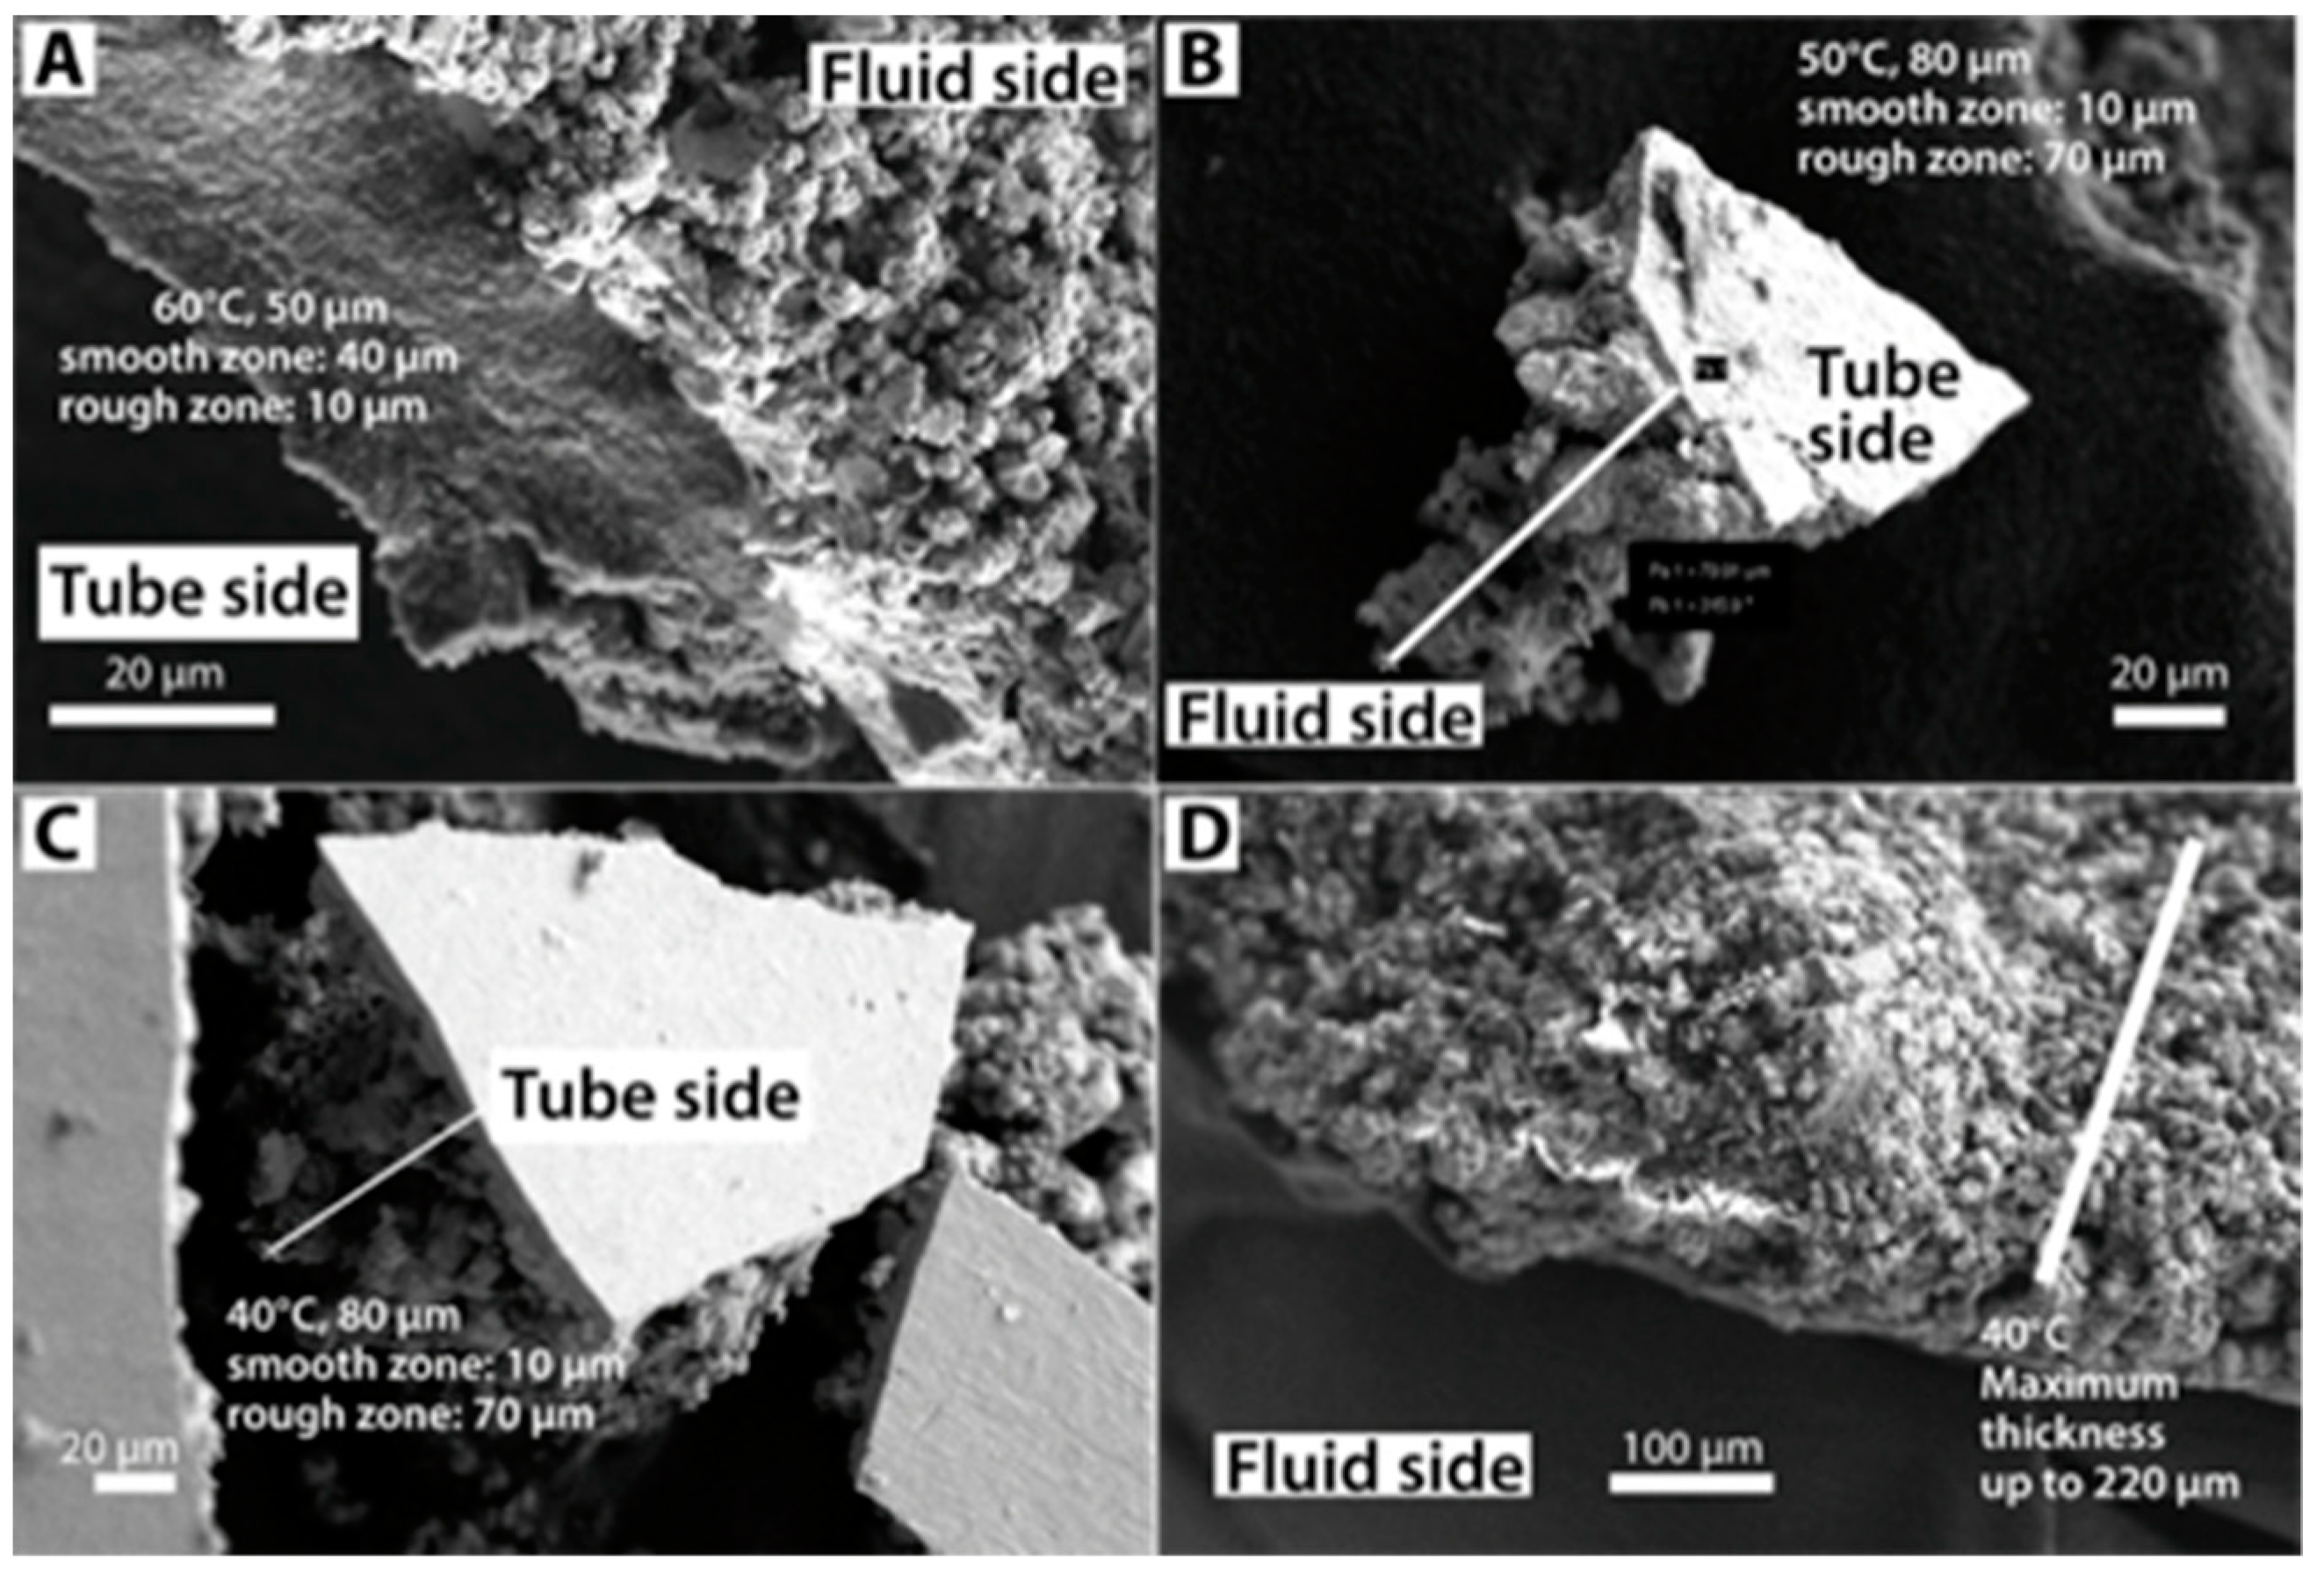
4.2.2. Thickness of the Scales
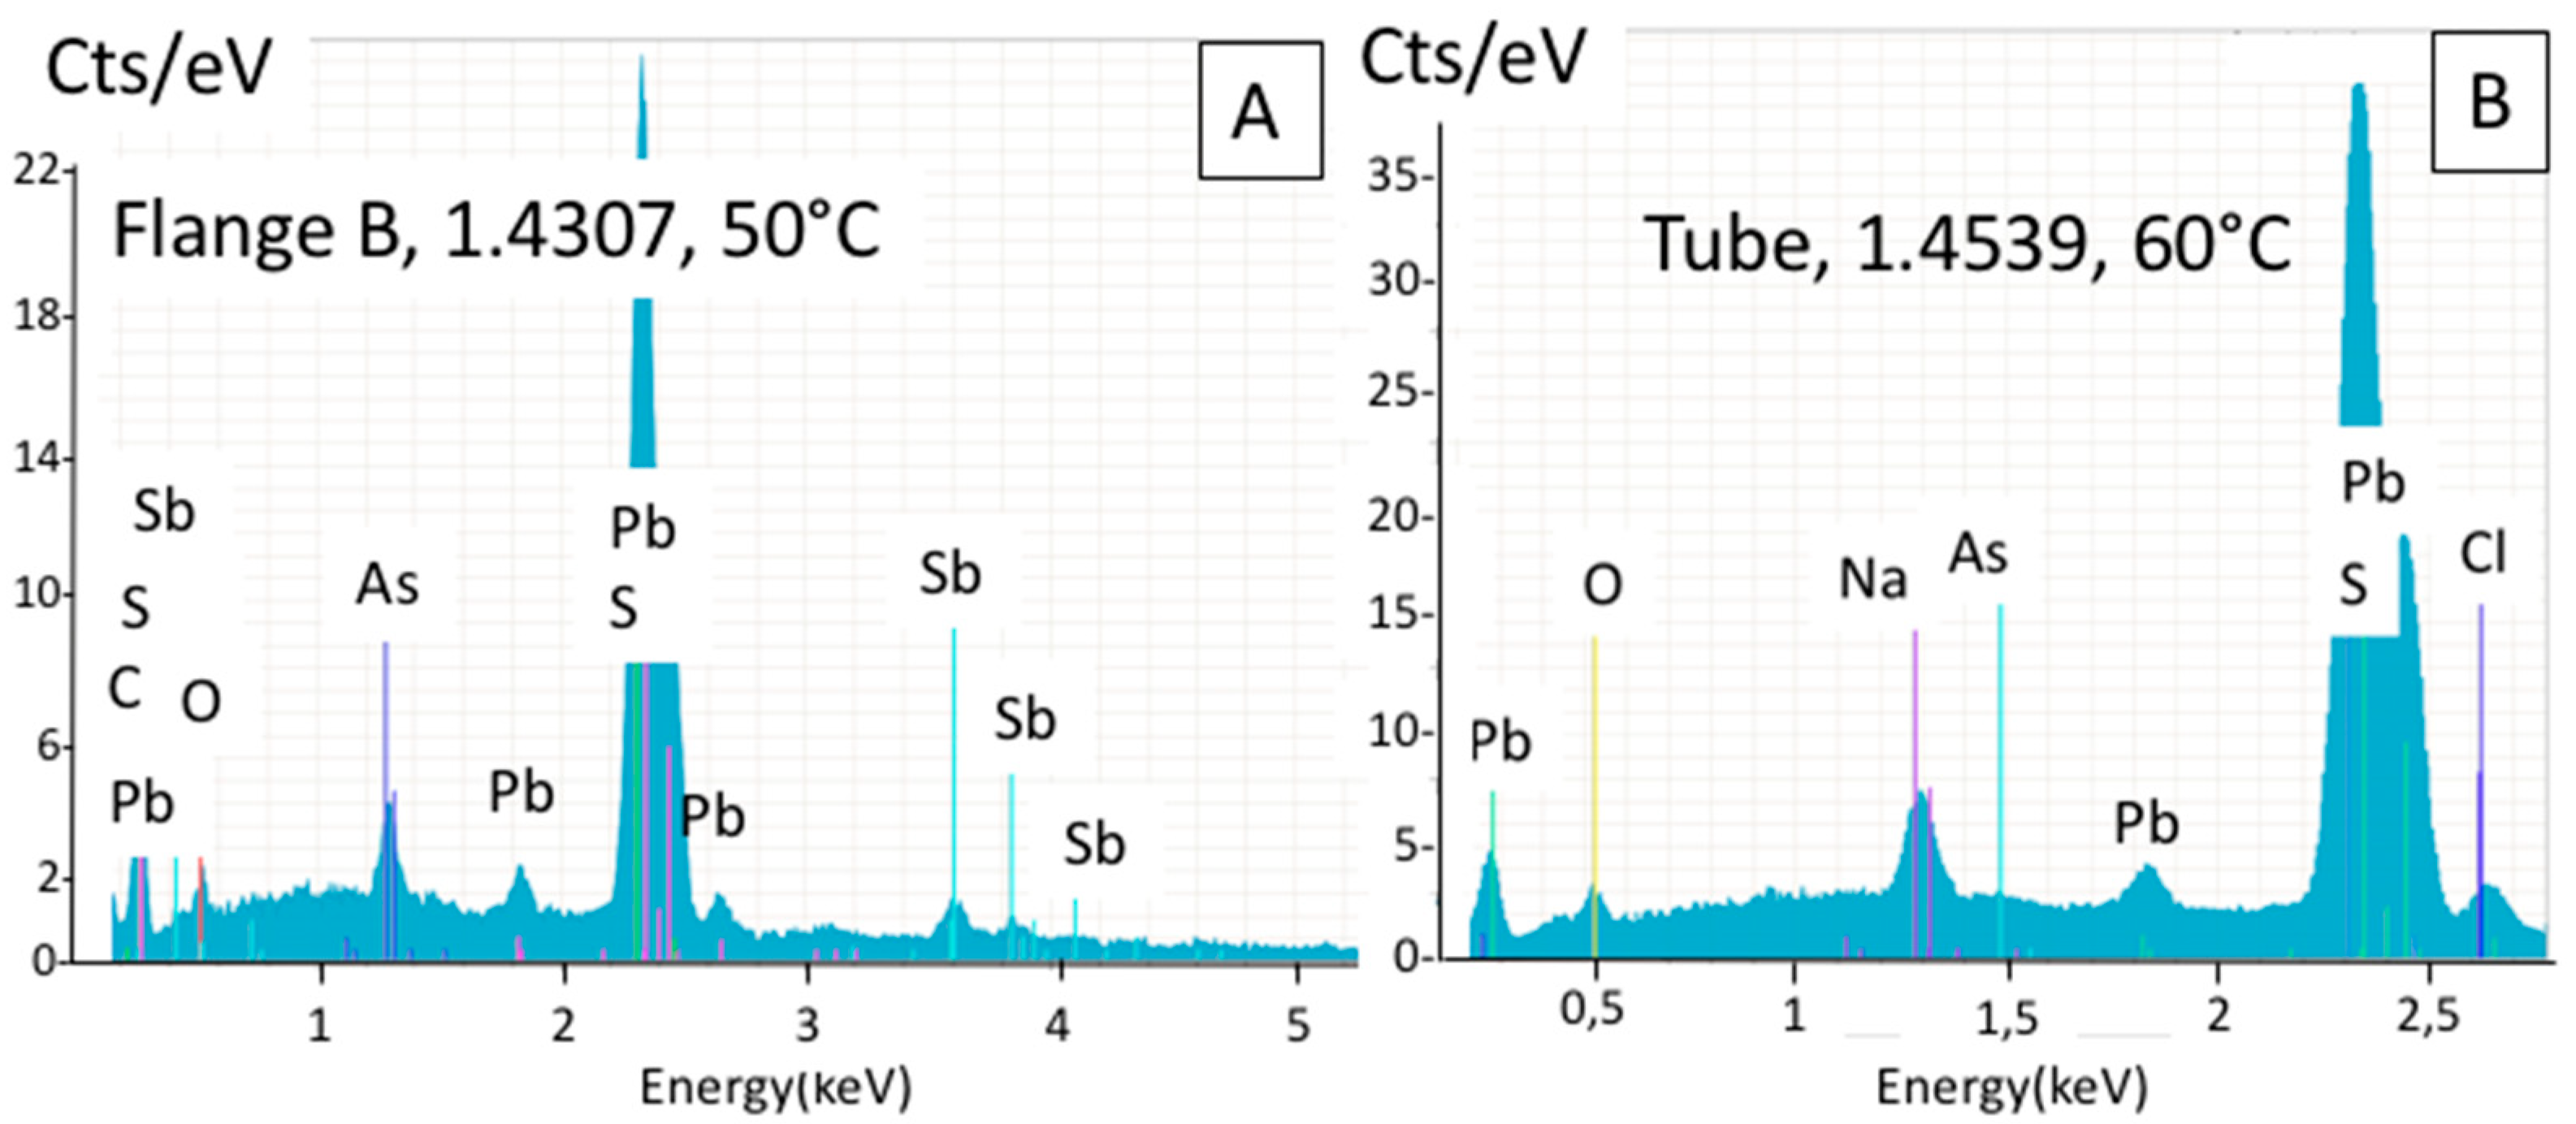
4.2.3. SEM-EDS Chemistry of the Samples
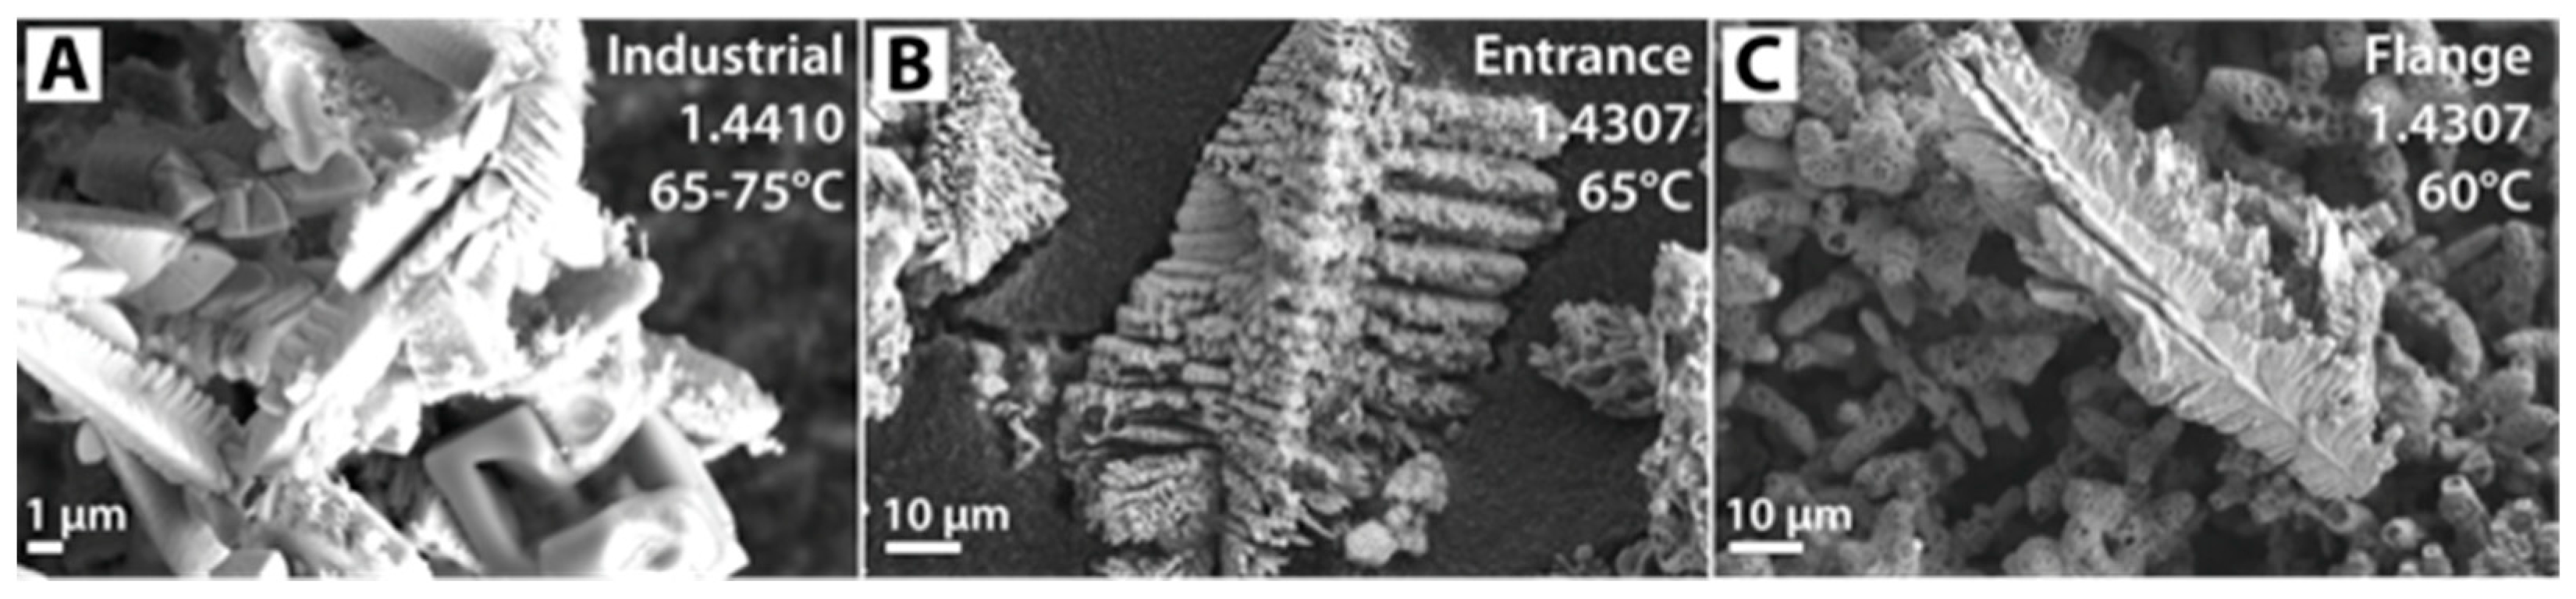
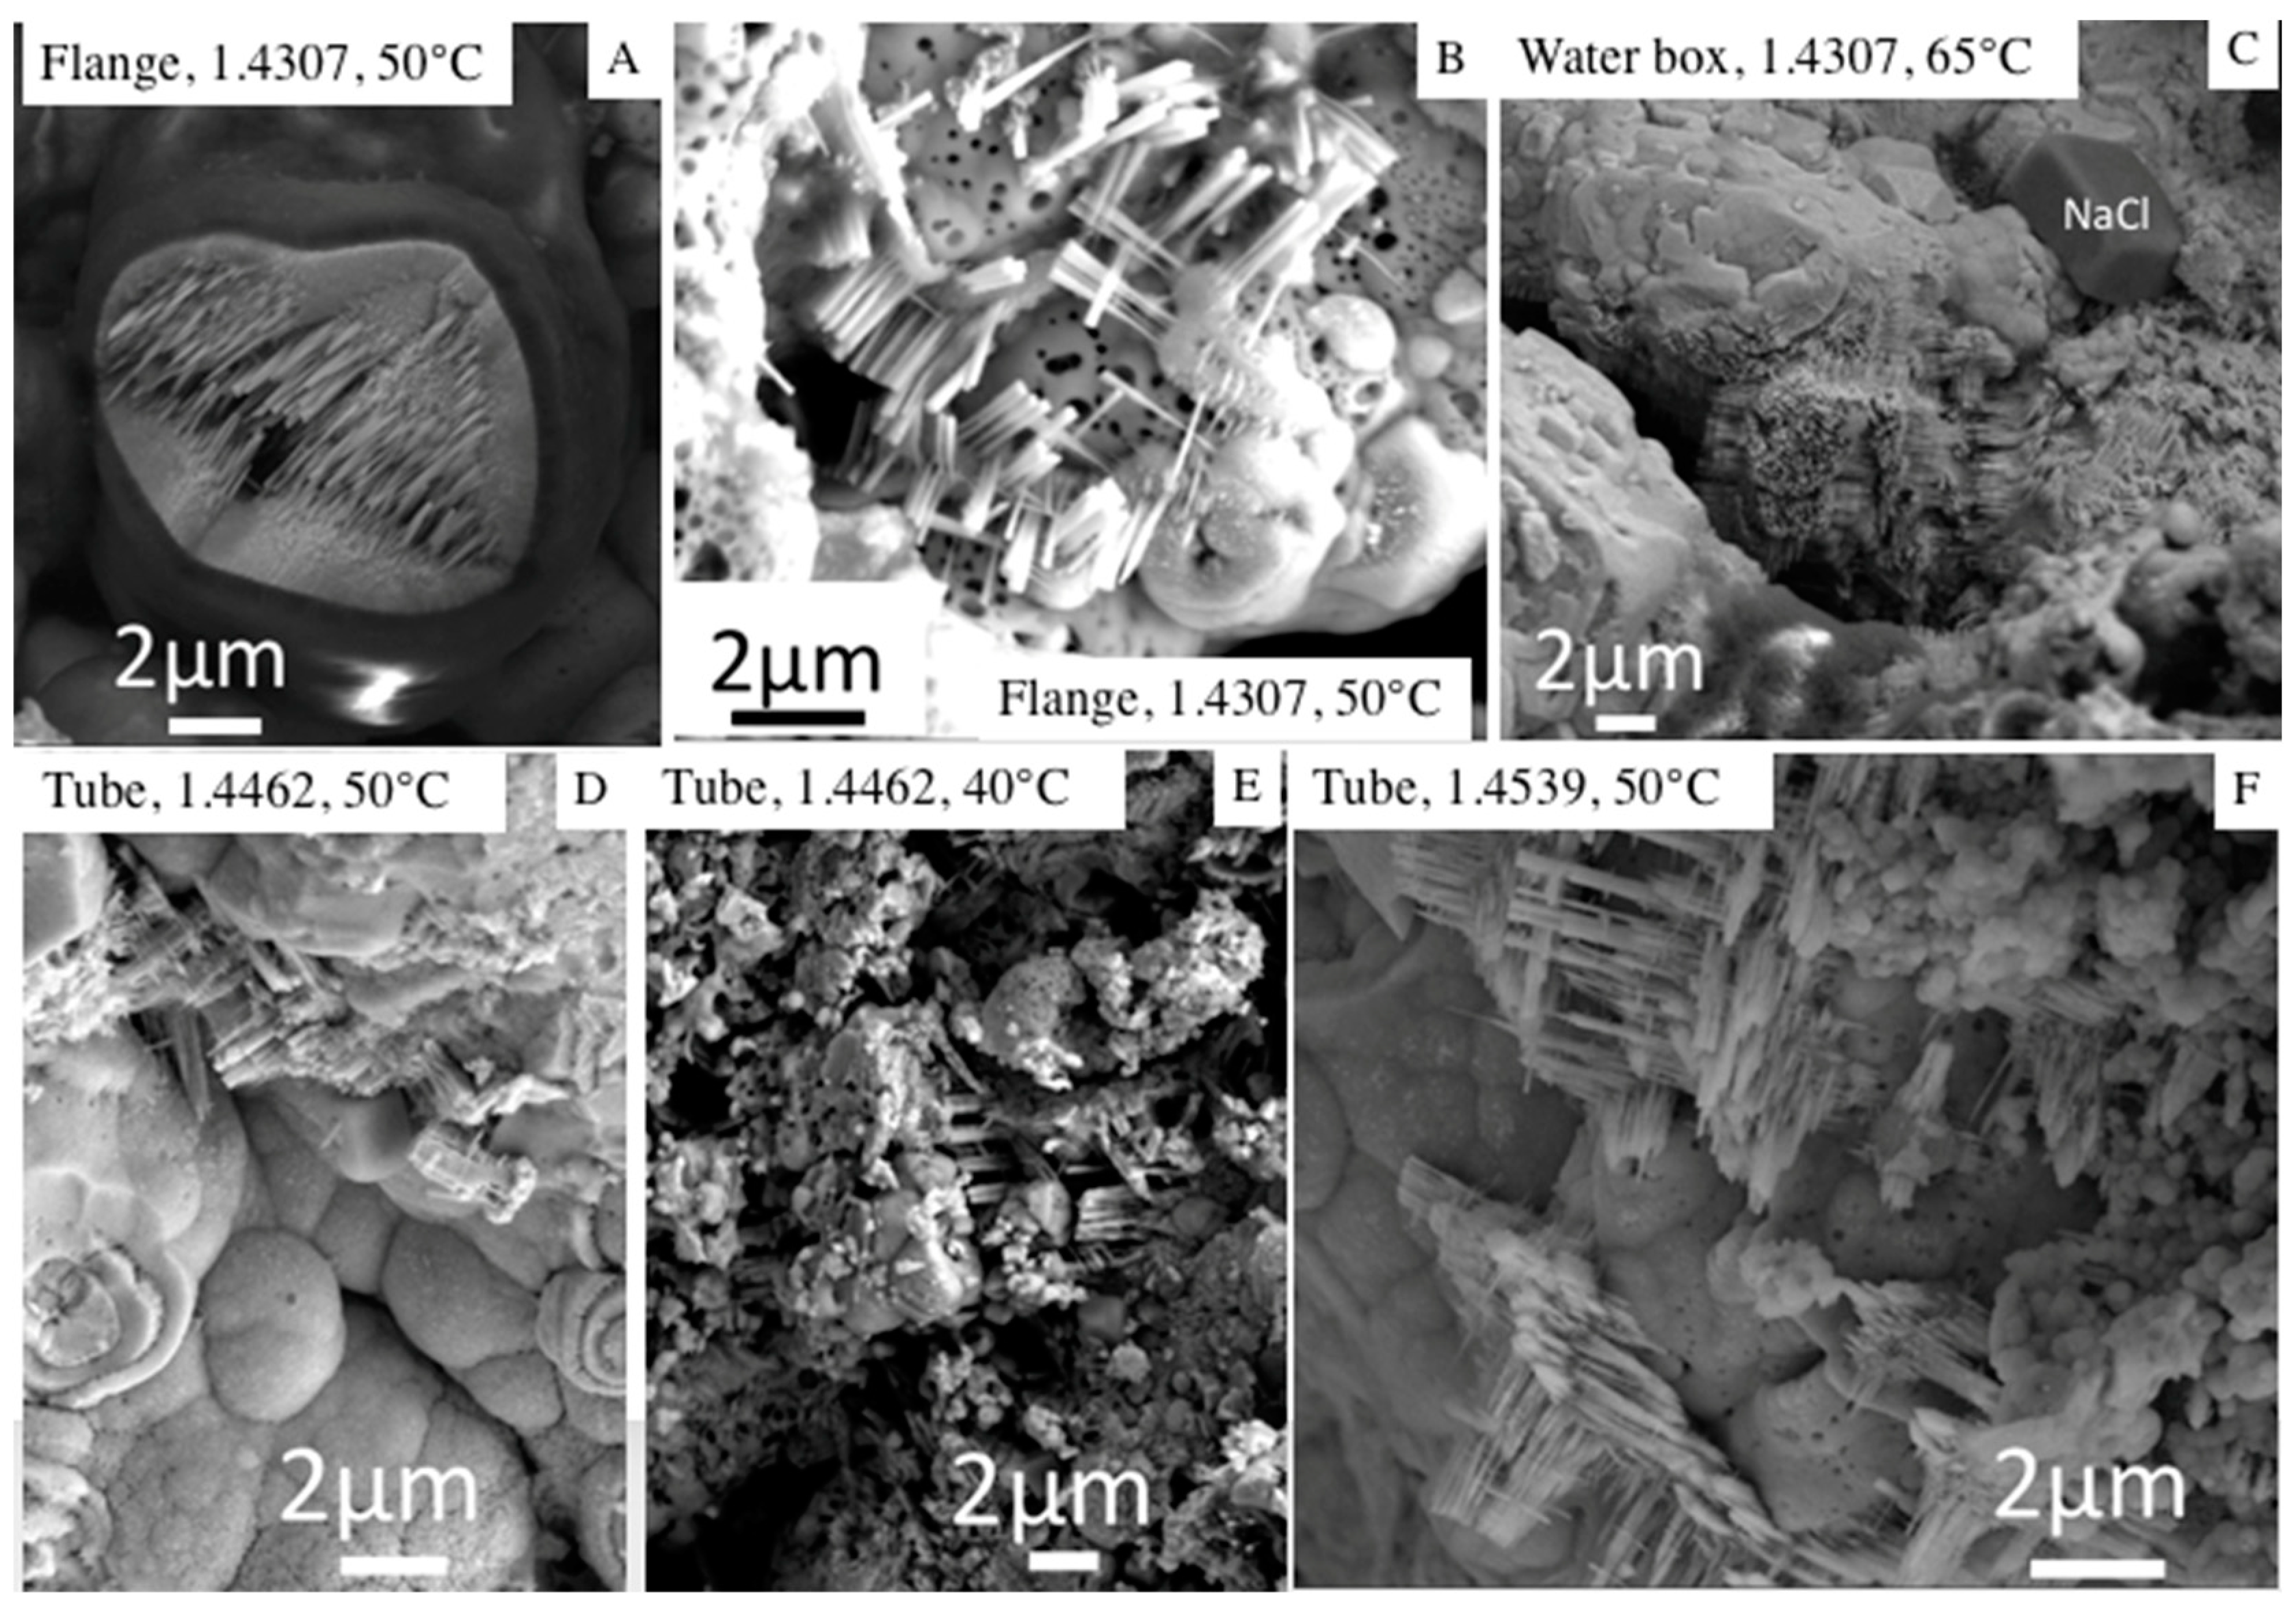
4.2.4. Shapes of Galena Crystals
- 1.
- Dendrites
- 2.
- Needles
- 3.
- Coral Shapes
- 4.
- Cube and Cubic-Derived Shapes
- 5.
- Fibro-Radiated Botryoidal Shape
5. Discussion
5.1. Structure and Chemistry of Scales
| Structure | Location | Flow |
|---|---|---|
| Powder | Industrial Entrance Exit | Turbulent |
| Water boxes | ||
| Layers | Tubes Flange | Laminar Perpendicular |
5.2. Thickness of Scales
5.3. Conditions of Scale Formation
6. Conclusions and Outlook
Author Contributions
Funding
Acknowledgments
Conflicts of Interest
References
- Assad, M.E.H.; Bani-Hani, E.; Khalil, M. Performance of Geothermal Power Plants (Single, Dual, and Binary) to Compensate for LHC-CERN Power Consumption: Comparative Study. Geotherm. Energy 2017, 5, 17. [Google Scholar] [CrossRef]
- Spinthaki, A.; Kamaratou, M.; Skordalou, G.; Petratos, G.; Tramaux, A.; David, G.; Demadis, K.D. A Universal Scale Inhibitor: A Dual Inhibition/Dispersion Performance Evaluation under Difficult Brine Stresses. Geothermics 2021, 89, 101972. [Google Scholar] [CrossRef]
- van der Zwaan, B.; Dalla Longa, F. Integrated Assessment Projections for Global Geothermal Energy Use. Geothermics 2019, 82, 203–211. [Google Scholar] [CrossRef]
- Shannon, D.W. Economic Impact of Corrosion and Scaling Problems in Geothermal Energy Systems. Master’s Thesis, Battelle Pacific Northwest Labs, Richland, WA, USA, 1975. [Google Scholar]
- Tardiff, G.E. Using Salton Sea Geothermal Brines for Electrical Power: A Review of Progress in Chemistry and Materials Technology, 1976 Status. In Proceedings of the Twelfth Intersociety Energy Conversion Engineering Conference, Washington, DC, USA, 28 August–2 September 1977. [Google Scholar]
- Criaud, A.; Fouillac, C. Sulfide Scaling in Low Enthalpy Geothermal Environments: A Survey. Geothermics 1989, 18, 73–81. [Google Scholar] [CrossRef]
- Scheiber, J.; Nitschke, F.; Seibt, A.; Genter, A. Geochemical and Mineralogical Monitoring of the Geothermal Power Plant in Soultz-Sous-Forêts (France). In Proceedings of the 37th Workshop on Geothermal Reservoir Engineering, Stanford, CA, USA, 30 January–1 February 2012; pp. 1033–1042. [Google Scholar]
- Ngothai, Y.; Yanagisawa, N.; Pring, A.; Rose, P.; O’Neill, B.; Brugger, J. Mineral Scaling in Geothermal Fields: A Review. In Proceedings of the 2010 Australian Geothermal Energy Conference, Adelaide, Autralia, 17–19 November 2010; pp. 405–409. [Google Scholar]
- Skinner, B.J.; White, D.E.; Rose, H.J.; Mays, R.E. Sulfides Associated with the Salton Sea Geothermal Brine. Econ. Geol. 1967, 62, 316–330. [Google Scholar] [CrossRef]
- Sanjuan, B.; Millot, R.; Innocent, C.; Dezayes, C.; Scheiber, J.; Brach, M. Major Geochemical Characteristics of Geothermal Brines from the Upper Rhine Graben Granitic Basement with Constraints on Temperature and Circulation. Chem. Geol. 2016, 428, 27–47. [Google Scholar] [CrossRef]
- Baticci, F.; Genter, A.; Huttenloch, P.; Zorn, R. Corrosion and Scaling Detection in the Soultz EGS Power Plant, Upper Rhine Graben, France. In Proceedings of the World Geothermal Congress, WGC2010, Bali, Indonesia, 25–30 April 2010. [Google Scholar]
- Haas-Nüesch, R.; Heberling, F.; Schild, D.; Rothe, J.; Dardenne, K.; Jähnichen, S.; Eiche, E.; Marquardt, C.; Metz, V.; Schäfer, T. Mineralogical Characterization of Scalings Formed in Geothermal Sites in the Upper Rhine Graben before and after the Application of Sulfate Inhibitors. Geothermics 2018, 71, 264–273. [Google Scholar] [CrossRef]
- Mouchot, J.; Genter, A.; Cuenot, N.; Scheiber, J.; Seibel, O.; Bosia, C.; Ravier, G. First Year of Operation from EGS Geothermal Plants in Alsace, France: Scaling Issues. In Proceedings of the 43rd Workshop on Geothermal Reservoir Engeneering, Stanford, CA, USA, 12–14 February 2018. [Google Scholar]
- Dalmais, E.; Genter, A.; Trullenque, G.; Leoutre, E.; Leiss, B.; Wagner, B.; Mintsa, A.C.; Bär, K.; Rajsl, I. MEET Project: Toward the Spreading of EGS across Europe. In Proceedings of the European Geothermal Congress, Den Haag, The Netherlands, 11–14 June 2019. [Google Scholar]
- Trullenque, G.; Genter, A.; Leiss, B.; Wagner, B.; Bouchet, R.; Léoutre, E.; Malnar, B.; Bär, K.; Rajšl, I. Upscaling of EGS in Different Geological Conditions: A European Perspective. In Proceedings of the 43rd Workshop on Geothermal Reservoir Engineering, Stanford, CA, USA, 12–14 February 2018. [Google Scholar]
- Ravier, G.; Seibel, O.; Pratiwi, A.S.; Mouchot, J.; Genter, A.; Ragnarsdóttir, K.R.; Sengelen, X. Towards an Optimized Operation of the EGS Soultz-Sous-Forêts Power Plant (Upper Rhine Graben, France). In Proceedings of the European Geothermal Congress, Den Haag, The Netherlands, 11–14 June 2019. [Google Scholar]
- Ledésert, B.A.; Hébert, R.L. How Can Deep Geothermal Projects Provide Information on the Temperature Distribution in the Upper Rhine Graben? The Example of the Soultz-Sous-Forêts-Enhanced Geothermal System. Geosciences 2020, 10, 459. [Google Scholar] [CrossRef]
- Cuenot, N.; Charléty, J.; Dorbath, L.; Haessler, H. Faulting Mechanisms and Stress Regime at the European HDR Site of Soultz-Sous-Forêts, France. Geothermics 2006, 35, 561–575. [Google Scholar] [CrossRef]
- Gunnarsson, I.; Arnórsson, S. Impact of Silica Scaling on the Efficiency of Heat Extraction from High-Temperature Geothermal Fluids. Geothermics 2005, 34, 320–329. [Google Scholar] [CrossRef]
- Haklıdır, F.S.T.; Balaban, T.Ö. A Review of Mineral Precipitation and Effective Scale Inhibition Methods at Geothermal Power Plants in West Anatolia (Turkey). Geothermics 2019, 80, 103–118. [Google Scholar] [CrossRef]
- Hardardóttir, V.; Ármannsson, H.; Þórhallsson, S. Characterization of Sulfide-Rich Scales in Brine at Reykjanes. In Proceedings of the World Geothermal Congress 2005, Antalya, Turkey, 24–29 April 2005. [Google Scholar]
- Jamero, J.; Zarrouk, S.J.; Mroczek, E. Mineral Scaling in Two-Phase Geothermal Pipelines: Two Case Studies. Geothermics 2018, 72, 1–14. [Google Scholar] [CrossRef]
- Köhl, B.; Grundy, J.; Baumann, T. Rippled Scales in a Geothermal Facility in the Bavarian Molasse Basin: A Key to Understand the Calcite Scaling Process. Geotherm. Energy 2020, 8, 1–27. [Google Scholar] [CrossRef]
- Kristmannsdóttir, H. Types of Scaling Occurring by Geothermal Utilization in Iceland. Geothermics 1989, 18, 183–190. [Google Scholar] [CrossRef]
- Mundhenk, N. Corrosion and Scaling in Utilization of Geothermal Energy in the Upper Rhine Graben. Ph.D. Thesis, Karlsruher Instituts für Technologie (KIT), Karlsruhe, Germany, 2013. [Google Scholar] [CrossRef]
- Nitschke, F.; Scheiber, J.; Kramar, U.; Neumann, T. Formation of Alternating Layered Ba-Sr-Sulfate and Pb-Sulfide Scaling in the Geothermal Plant of Soultz-Sous-Forêts. Neues Jahrb. Für Mineral. Abh. J. Mineral. Geochem. 2014, 191, 145–156. [Google Scholar] [CrossRef]
- Raymond, J.; Williams-Jones, A.E.; Clark, J.R. Mineralization Associated with Scale and Altered Rock and Pipe Fragments from the Berlin Geothermal Field, El Salvador; Implications for Metal Transport in Natural Systems. J. Volcanol. Geotherm. Res. 2005, 145, 81–96. [Google Scholar] [CrossRef]
- Reyes, A.G.; Trompetter, W.J.; Britten, K.; Searle, J. Mineral Deposits in the Rotokawa Geothermal Pipelines, New Zealand. J. Volcanol. Geotherm. Res. 2003, 119, 215–239. [Google Scholar] [CrossRef]
- Genter, A.; Cuenot, N.; Melchert, B.; Moeckes, W.; Ravier, G.; Sanjuan, B.; Sanjuan, R.; Scheiber, J.; Schill, E.; Schmittbuhl, J. Main achievements from the multi-well EGS Soultz project during geothermal exploitation from 2010 and 2012. In Proceedings of the European Geothermal Congress, Pisa, Italy, 3–7 June 2013. [Google Scholar]
- Scheiber, J.; Seibt, A.; Birner, J.; Genter, A.; Cuenot, N.; Moeckes, W. Scale Inhibition at the Soultz-Sous-Forêts (France) EGS Site: Laboratory and on-Site Studies. In Proceedings of the World Geothermal Congress 2015, Melbourne, Australia, 16–24 April 2015. [Google Scholar]
- Sanjuan, B.; Millot, R.; Dezayes, C.; Brach, M. Main Characteristics of the Deep Geothermal Brine (5 Km) at Soultz-Sous-Forêts (France) Determined Using Geochemical and Tracer Test Data. Comptes Rendus Geosci. 2010, 342, 546–559. [Google Scholar] [CrossRef]
- Cuenot, N.; Goerke, X.; Guery, B.; Bruzac, S.; Sontot, O.; Meneust, P.; Maquet, J.; Vidal, J. Evolution of the Natural Radioactivity within the Soultz Geothermal Installation. In Proceedings of the Soultz Geothermal Conference 2011, Soultz-Sous-Forêts, France, 5–6 October 2011; Volume 5, p. 19. [Google Scholar]
- Mouchot, J.; Scheiber, J.; Florencio, J.; Seibt, A.; Jähnichen, S. Scale and Corrosion Control Program, Example of Two Geothermal Plants in Operation in the Upper Rhine Graben. In Proceedings of the European Geothermal Congress 2019, Den Haag, The Netherlands, 11–14 June 2019. [Google Scholar]
- He, S.; Oddo, J.E.; Tomson, M.B. The Inhibition of Gypsum and Barite Nucleation in NaCl Brines at Temperatures from 25 to 90 °C. Appl. Geochem. 1994, 9, 561–567. [Google Scholar] [CrossRef]
- Karlsdottir, S.N.; Ragnarsdottir, K.R.; Thorbjornsson, I.O.; Einarsson, A. Corrosion Testing in Superheated Geothermal Steam in Iceland. Geothermics 2015, 53, 281–290. [Google Scholar] [CrossRef]
- Karlsdottir, S.N.; Thorbjornsson, I.O.; Ragnarsdottir, K.R.; Einarsson, A. Corrosion Testing of Heat Exchanger Tubes in Steam from the IDDP-1 Exploratory Geothermal Well in Krafla, Iceland. In Proceedings of the CORROSION 2014, San Antonio, TX, USA, 9–13 March 2014. [Google Scholar]
- Ravier, G.; Huttenloch, P.; Scheiber, J.; Perrot, V.; Sioly, J.L. Design, Manufacturing and Commissioning of the ECOGI’s Heat Exchangers at Rittershoffen (France): A Case Study. In Proceedings of the European Geothermal Conference, Strasbourg, France, 19–24 September 2016. [Google Scholar]
- Apopei, A.I.; Damian, G.; Buzgar, N.; Buzatu, A. Mineralogy and Geochemistry of Pb–Sb/As-Sulfosalts from Coranda-Hondol Ore Deposit (Romania)—Conditions of Telluride Deposition. Ore Geol. Rev. 2016, 72, 857–873. [Google Scholar] [CrossRef]
- Martínez-Abad, I.; Cepedal, A.; Arias, D.; Fuertes-Fuente, M. The Au–As (Ag–Pb–Zn–Cu–Sb) Vein-Disseminated Deposit of Arcos (Lugo, NW Spain): Mineral Paragenesis, Hydrothermal Alteration and Implications in Invisible Gold Deposition. J. Geochem. Explor. 2015, 151, 1–16. [Google Scholar] [CrossRef]
- Pitcairn, I.K.; Olivo, G.R.; Teagle, D.A.; Craw, D. Sulfide Evolution during Prograde Metamorphism of the Otago and Alpine Schists, New Zealand. Can. Mineral. 2010, 48, 1267–1295. [Google Scholar] [CrossRef]
- Medunić, G.; Bucković, D.; Crnić, A.P.; Bituh, T.; Srček, V.G.; Radošević, K.; Bajramovic, M.; Zgorelec, Z. Sulfur, Metal (Loid) s, Radioactivity, and Cytotoxicity in Abandoned Karstic Raša Coal-Mine Discharges (the North Adriatic Sea). Rud. Geološko Naft. Zb. 2020, 35. [Google Scholar] [CrossRef]
- Majzlan, J.; Drahota, P.; Filippi, M. Parageneses and Crystal Chemistry of Arsenic Minerals. Rev. Mineral. Geochem. 2014, 79, 17–184. [Google Scholar] [CrossRef]
- Karakaya, N.; Karakaya, M.C. Toxic Element Contamination in Waters from the Massive Sulfide Deposits and Wastes around Giresun, Turkey. Turk. J. Earth Sci. 2014, 23, 113–128. [Google Scholar] [CrossRef]
- Song, C.; Jiang, L.; Zhang, Y.; Pang, L.; Wang, D. Shape Controllable Growth of PbS Polyhedral Crystals. Cryst. Res. Technol. 2012, 47, 1008–1013. [Google Scholar] [CrossRef]
- Ding, B.; Shi, M.; Chen, F.; Zhou, R.; Deng, M.; Wang, M.; Chen, H. Shape-Controlled Syntheses of PbS Submicro-/Nano-Crystals via Hydrothermal Method. J. Cryst. Growth 2009, 311, 1533–1538. [Google Scholar] [CrossRef]
- Ni, Y.; Wei, X.; Hong, J.; Ma, X. Hydrothermal Preparation of PbS Crystals and Shape Evolution. Mater. Res. Bull. 2007, 42, 17–26. [Google Scholar] [CrossRef]
- Radosavljević-Mihajlović, A.S.; Stojanović, J.N.; Radosavljević, S.A.; Pačevski, A.M.; Vuković, N.S.; Tošović, R.D. Mineralogy and Genetic Features of the Cu-As-Ni-Sb-Pb Mineralization from the Mlakva Polymetallic Deposit (Serbia)—New Occurrence of (Ni-Sb)-Bearing Cu-Arsenides. Ore Geol. Rev. 2017, 80, 1245–1258. [Google Scholar] [CrossRef]
- Adamczyk, Z.; Nowińska, K.; Melaniuk-Wolny, E.; Szewczenko, J. Variation of the Content of Accompanying Elements in Galena in Pyrometallurgical Process of Zinc and Lead Production. Acta Montan. Slovaca 2013, 18, 158–163. [Google Scholar]
- Hagni, R.D. Platy Galena from the Viburnum Trend, Southeast Missouri: Character, Mine Distribution, Paragenetic Position, Trace Element Content, Nature of Twinning, and Conditions of Formation. Minerals 2018, 8, 93. [Google Scholar] [CrossRef] [Green Version]
- Singh, K.; McLachlan, A.A.; Marangoni, D.G. Effect of Morphology and Concentration on Capping Ability of Surfactant in Shape Controlled Synthesis of PbS Nano-and Micro-Crystals. Colloids Surf. A Physicochem. Eng. Asp. 2009, 345, 82–87. [Google Scholar] [CrossRef]
- Zhu, J.; Duan, W.; Sheng, Y. Uniform PbS Hopper (Skeletal) Crystals Grown by a Solution Approach. J. Cryst. Growth 2009, 311, 355–357. [Google Scholar] [CrossRef]
- Wang, D.; Yu, D.; Shao, M.; Liu, X.; Yu, W.; Qian, Y. Dendritic Growth of PbS Crystals with Different Morphologies. J. Cryst. Growth 2003, 257, 384–389. [Google Scholar] [CrossRef]
- Obaid, A.S.; Mahdi, M.A.; Hassan, Z. Nanocoral PbS Thin Film Growth by Solid-Vapor Deposition. Optoelectron. Adv. Mater. Rapid Commun. 2012, 6, 422–426. [Google Scholar]
- Hartman, P.; Perdok, W.G. IUCr On the Relations between Structure and Morphology of Crystals. Available online: https://scripts.iucr.org/cgi-bin/paper?a01327 (accessed on 11 December 2020).
- Pandey, G.; Shrivastav, S.; Sharma, H.K. Role of Solution PH and SDS on Shape Evolution of PbS Hexagonal Disk and Star/Flower Shaped Nanocrystals in Aqueous Media. Phys. E Low Dimens. Syst. Nanostruct. 2014, 56, 386–392. [Google Scholar] [CrossRef]
- Esmaeili, E.; Sabet, M.; Salavati-Niasari, M.; Saberyan, K. Synthesis and Characterization of Lead Sulfide Nanostructures with Different Morphologies via Simple Hydrothermal Method. High. Temp. Mater. Process. 2016, 35, 559–566. [Google Scholar] [CrossRef] [Green Version]
- Patel, A.A.; Wu, F.; Zhang, J.Z.; Torres-Martinez, C.L.; Mehra, R.K.; Yang, Y.; Risbud, S.H. Synthesis, Optical Spectroscopy and Ultrafast Electron Dynamics of PbS Nanoparticles with Different Surface Capping. J. Phys. Chem. B 2000, 104, 11598–11605. [Google Scholar] [CrossRef]


| Na (g/L) | K (g/L) | Ca (g/L) | Mg (mg/L) | Cl (g/L) | SO4 (mg/L) | SiO2 (mg/L) | As (mg/L) | Sb (µg/L) in [10] | Pb (µg/L) | |
|---|---|---|---|---|---|---|---|---|---|---|
| Min-max values [13] | 21–28.2 | 2.38–3.38 | 3.46–7.30 | 75–411 | 32.6–61 | 150–255 | 63–409 | 0.6–11 | ng | 181–782 |
| MRCC [13] except for Sb | 27.5 | 3.25 | 6.90 | 125 | 59 | 159 | 427 | 6 | 57.4 | 300 |
| 1 | 2 | 3 | |
|---|---|---|---|
| Tube 3.7035 60 °C | Tube 2.4855 60 °C | Tube 2.4855 40 °C | |
| Elements | Content (wt.%) | Content (wt.%) | Content (wt.%) |
| S | 11.75 | 16.28 | 15.00 |
| As | 3.89 | 8.57 | 3.70 |
| Sb | 11.46 | 25.08 | 17.82 |
| Pb | 72.90 | 50.07 | 63.48 |
| Total | 100 | 100 | 100 |
| Sharp Peaks | Location of Peaks | Preferential Growth |
|---|---|---|
| Well-crystallized [52] | Face-centered cubic structure, Fm3 m space group [50] | Strong intensity of (200) reflection peak [50,51], thus, preferential growth in the <100> direction |
| Based on JCPDS, 5-592 [51] or ASTM file card No. 030660020 [53] |
| Location | Elements | Phases | Shapes |
|---|---|---|---|
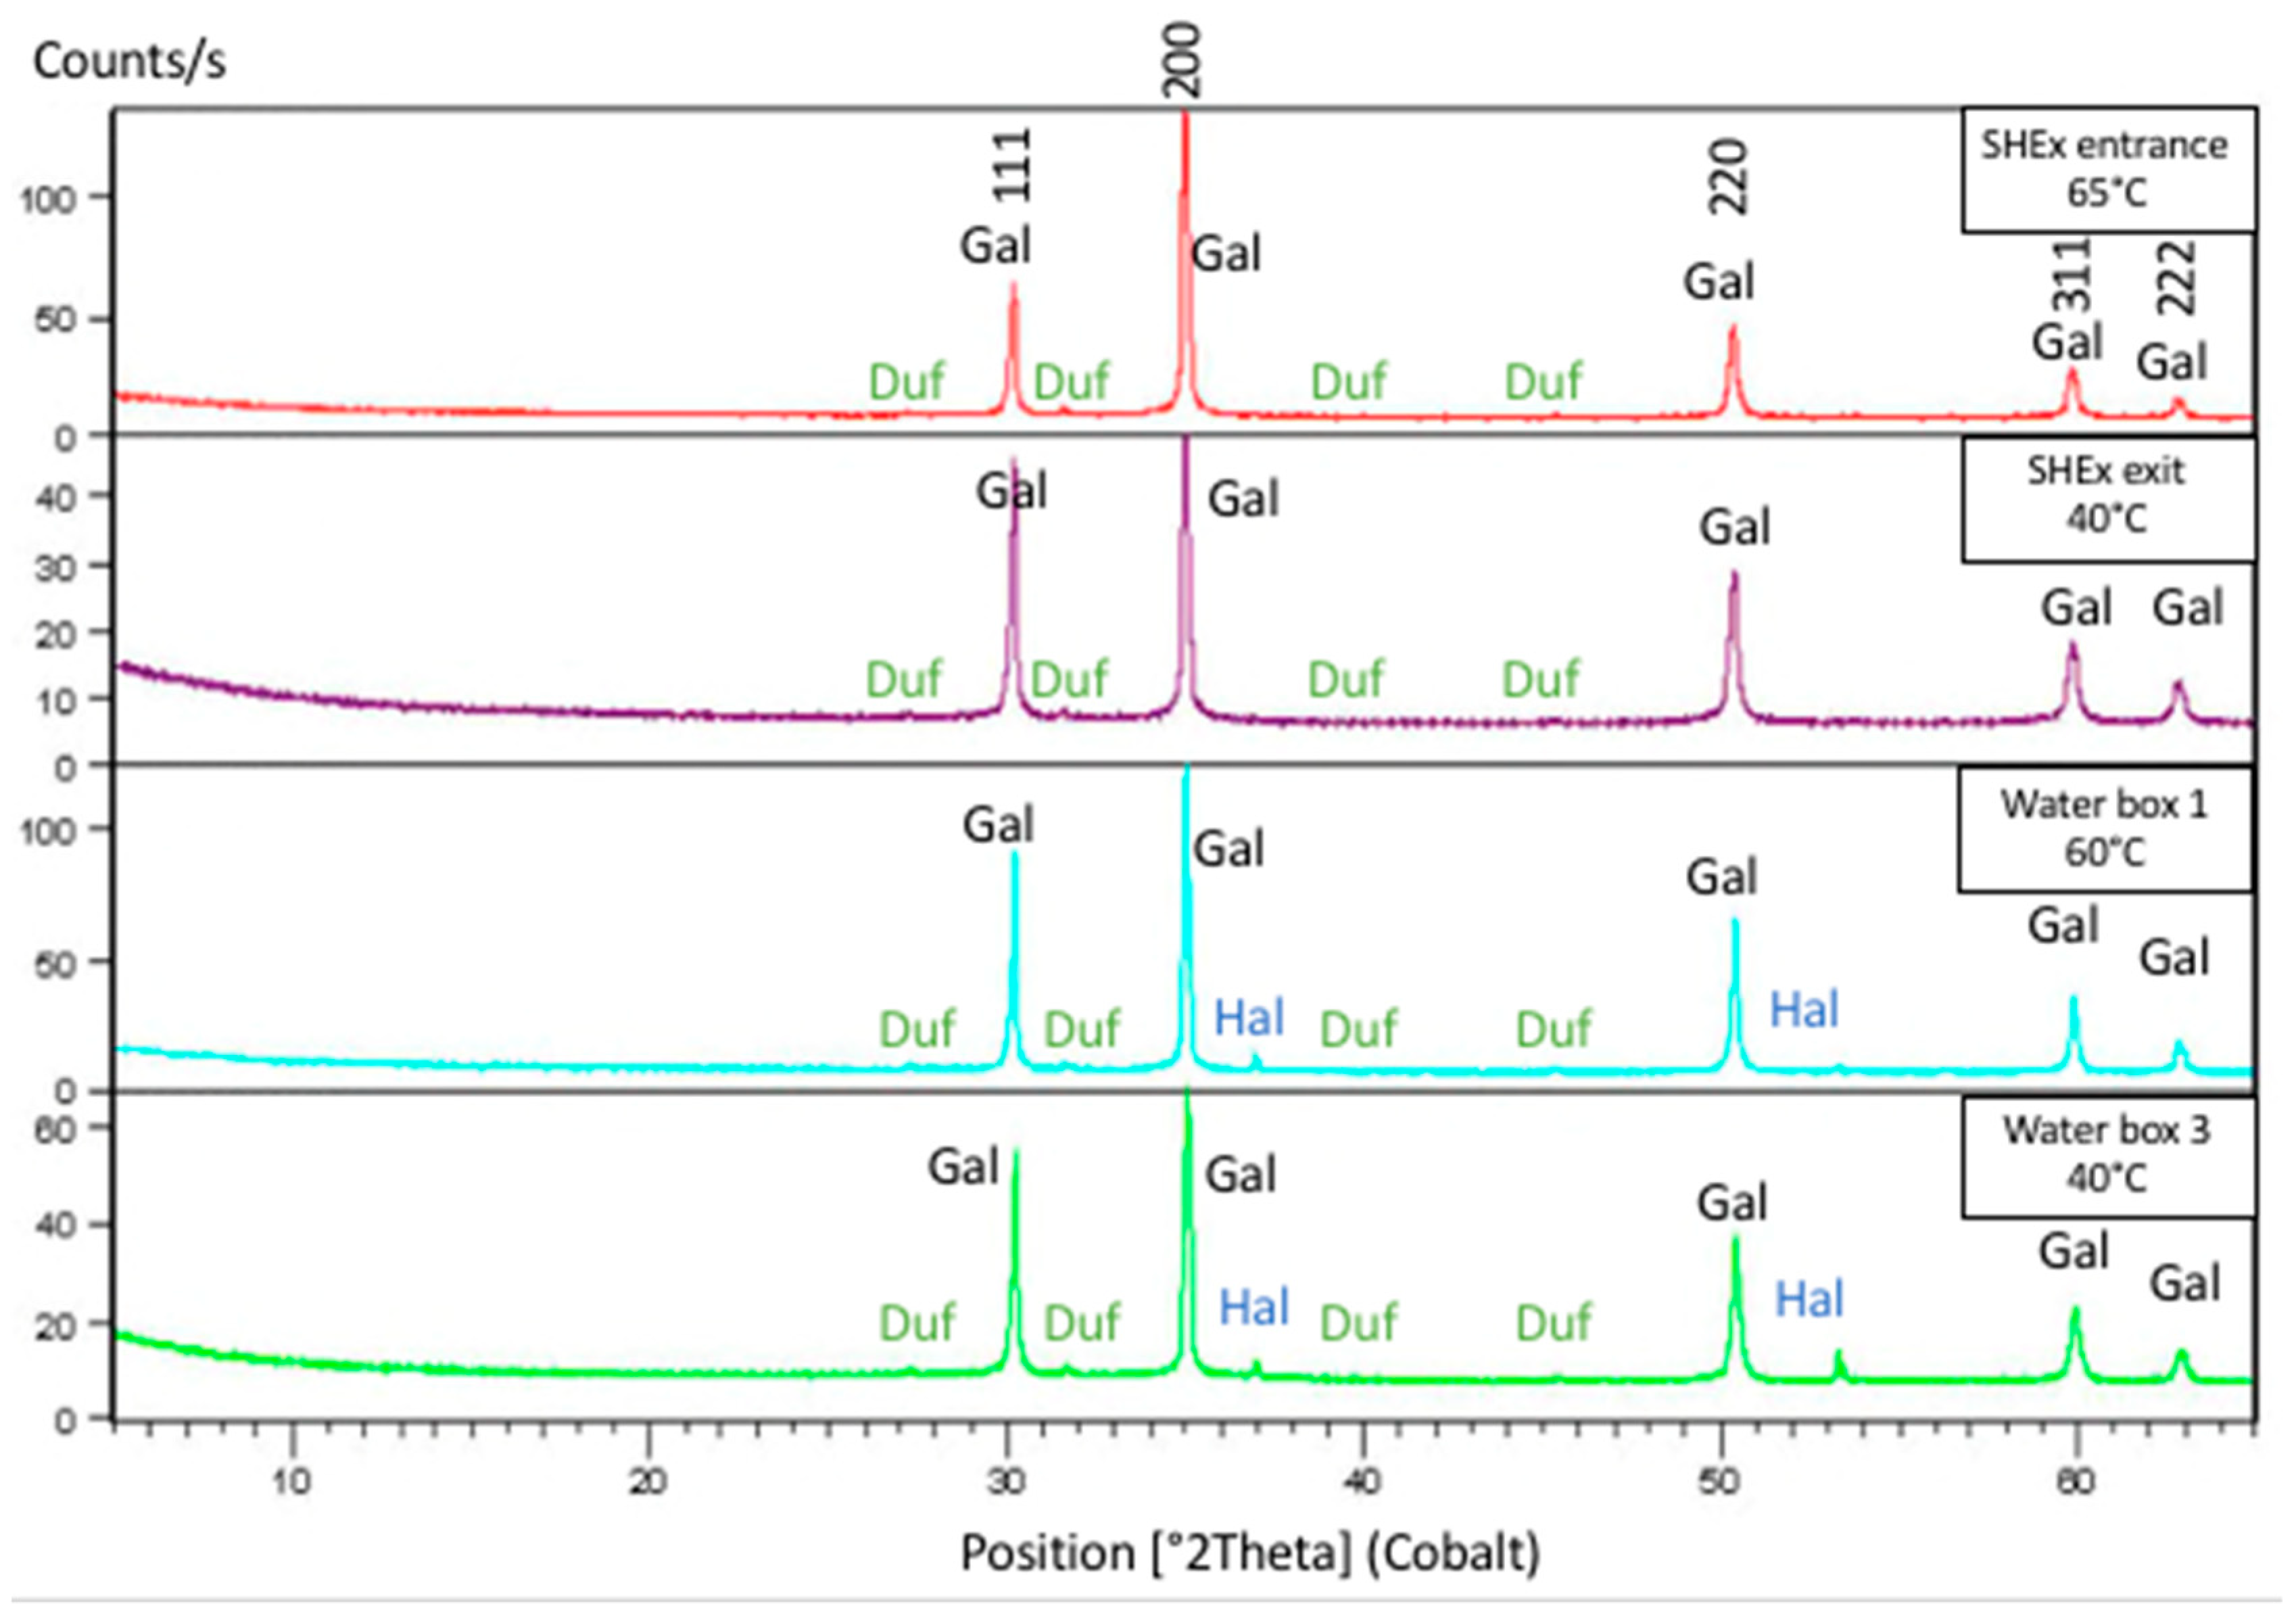
| All samples | Pb, As, Sb, S | Galena As, Sb sulfosalts (e.g., dufrénoysite, Figure 7) | Various (Table 2) Undetermined |
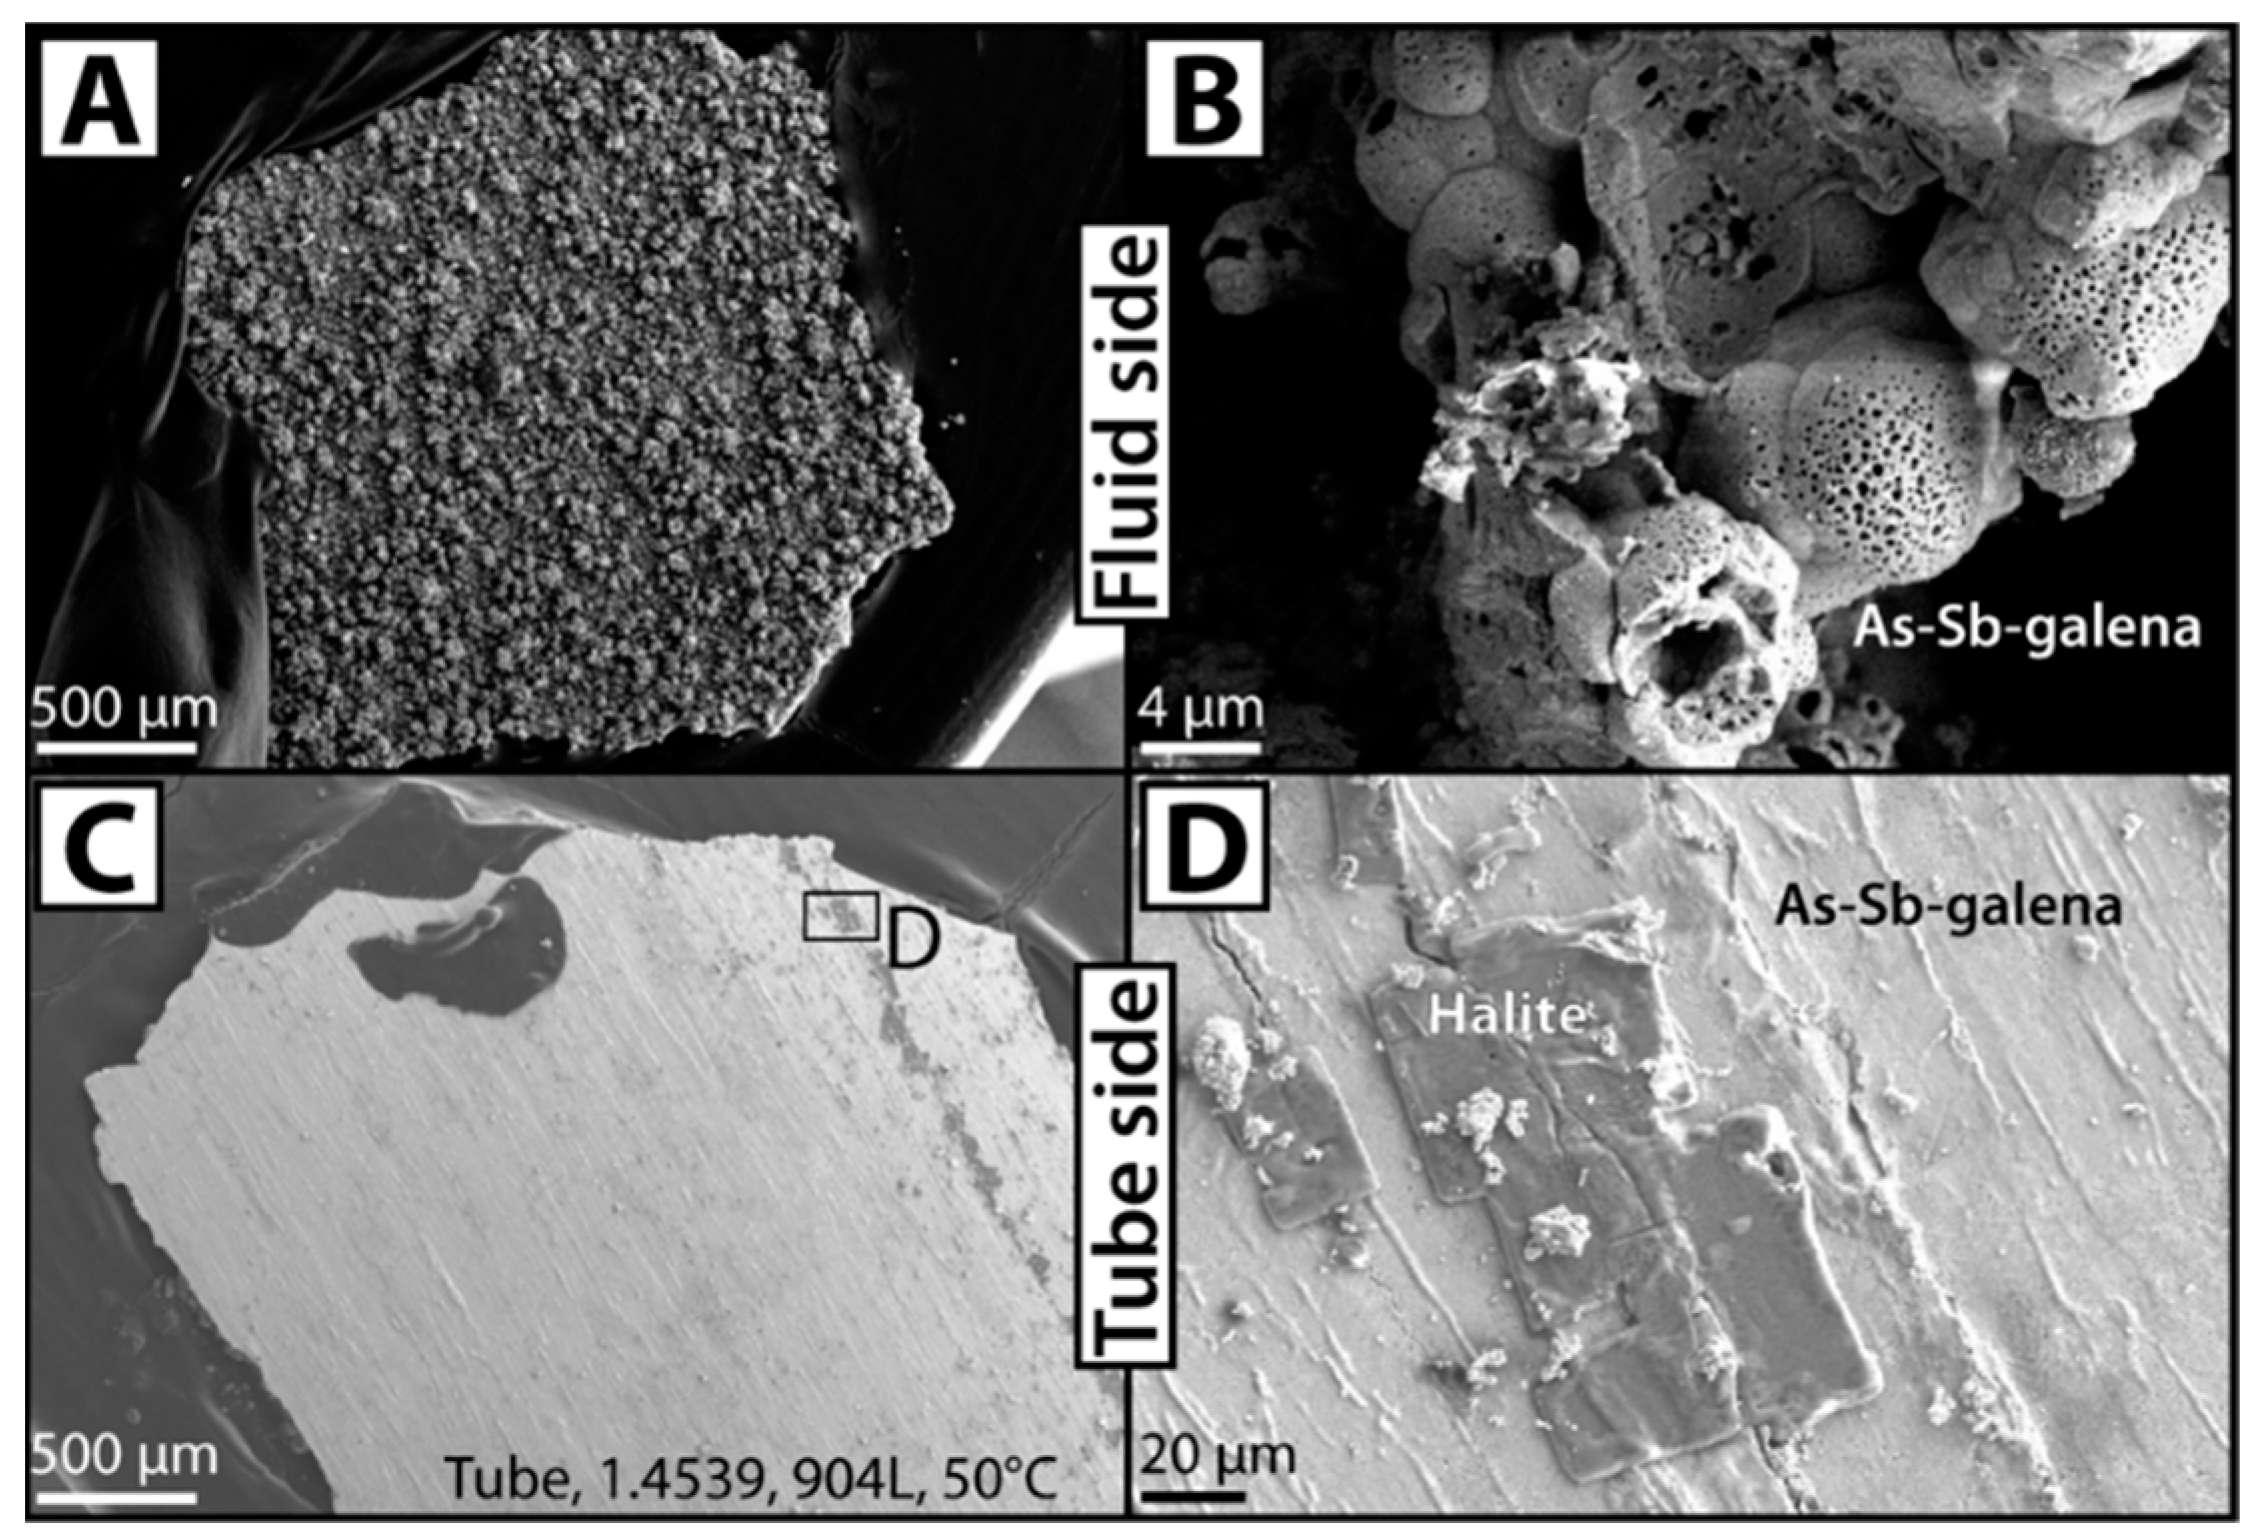
| All samples | Na, Cl | Halite | Cubes (Figure 8, Figure 11 and Figure 14) |
| Order of Layer Formation | Layer Structure | Location | Influence of Metal |
|---|---|---|---|
| 1st | Smooth (Figure 8D, Figure 9A and Figure 10) | Contact with metal | Strong |
| 2nd | Smooth to rough (Figure 9 and Figure 10) | Contact with 1st layer | Low to none |
| 3rd | Smooth to rough | Contact with 2nd layer | Low to none |
| 4th and more | Rough (Figure 8A,B and Figure 10) | Contact with previous layer | None |
| Crystal Shape | Abundance among Location Samples | Temperature (°C) | Flow | |
|---|---|---|---|---|
| Dendrite | + | Industrial, Entrance(flange) | 75–65 | Turbulent |
| Needle | ++ | Water box, flange, tubes | 65–40 | Turbulent, laminar |
| Coral | +++ | Water box, flange, tubes | 65–40 | Turbulent, laminar |
| Cube | + | Water box, flange, tubes | 65–40 | Turbulent, laminar |
| Fibro-radiated | ++ | Water box, flange, tubes | 65–40 | Turbulent, laminar |
Publisher’s Note: MDPI stays neutral with regard to jurisdictional claims in published maps and institutional affiliations. |
© 2021 by the authors. Licensee MDPI, Basel, Switzerland. This article is an open access article distributed under the terms and conditions of the Creative Commons Attribution (CC BY) license (https://creativecommons.org/licenses/by/4.0/).
Share and Cite
Ledésert, B.A.; Hébert, R.L.; Mouchot, J.; Bosia, C.; Ravier, G.; Seibel, O.; Dalmais, É.; Ledésert, M.; Trullenque, G.; Sengelen, X.; et al. Scaling in a Geothermal Heat Exchanger at Soultz-Sous-Forêts (Upper Rhine Graben, France): A XRD and SEM-EDS Characterization of Sulfide Precipitates. Geosciences 2021, 11, 271. https://doi.org/10.3390/geosciences11070271
Ledésert BA, Hébert RL, Mouchot J, Bosia C, Ravier G, Seibel O, Dalmais É, Ledésert M, Trullenque G, Sengelen X, et al. Scaling in a Geothermal Heat Exchanger at Soultz-Sous-Forêts (Upper Rhine Graben, France): A XRD and SEM-EDS Characterization of Sulfide Precipitates. Geosciences. 2021; 11(7):271. https://doi.org/10.3390/geosciences11070271
Chicago/Turabian StyleLedésert, Béatrice A., Ronan L. Hébert, Justine Mouchot, Clio Bosia, Guillaume Ravier, Olivier Seibel, Éléonore Dalmais, Mariannick Ledésert, Ghislain Trullenque, Xavier Sengelen, and et al. 2021. "Scaling in a Geothermal Heat Exchanger at Soultz-Sous-Forêts (Upper Rhine Graben, France): A XRD and SEM-EDS Characterization of Sulfide Precipitates" Geosciences 11, no. 7: 271. https://doi.org/10.3390/geosciences11070271
APA StyleLedésert, B. A., Hébert, R. L., Mouchot, J., Bosia, C., Ravier, G., Seibel, O., Dalmais, É., Ledésert, M., Trullenque, G., Sengelen, X., & Genter, A. (2021). Scaling in a Geothermal Heat Exchanger at Soultz-Sous-Forêts (Upper Rhine Graben, France): A XRD and SEM-EDS Characterization of Sulfide Precipitates. Geosciences, 11(7), 271. https://doi.org/10.3390/geosciences11070271