Article

Unique Path Method of the Pinch-Out Profile Based on Unified Stratigraphic Sequence

1
School of Civil Engineering, Sun Yat-Sen University, Guangzhou 510006, China
2
Guangdong Engineering Research Centre for Major Infrastructure Safety, Guangzhou 510275, China
*
Author to whom correspondence should be addressed.
Geosciences 2021, 11(6), 251; https://doi.org/10.3390/geosciences11060251
Submission received: 12 March 2021 / Revised: 6 June 2021 / Accepted: 7 June 2021 / Published: 10 June 2021

Abstract

:
Pinch-outs refers to the gradual thinning of the thickness of the sedimentary layer laterally until there is no deposition and are a major topic of modern research on the automated drawing of geological profiles. The rapid development of smart geological systems imposed an urgent need for high-speed, accurate methods to plot pinch-outs. However, because of their complexity, excessive number of branch paths, low rendering speed, and poor reliability in the case of large-scale data, the existing pinch-out drawing methods are inadequate and cannot satisfy the modeling needs of large-scale geological projects. To resolve these problems, based on unified stratigraphic sequences, this paper proposes a unique path method for drawing pinch-out profiles by converting the principle of plotting of pinch-outs into controlling the appearance of stratigraphic boundaries, and a high-speed and reliable method for drawing pinch-out in digital profiles is also proposed. The proposed method is successfully applied to drawing geological profiles for an urban geological project in East China, and greatly reduces the complexity of the method without reducing the drawing accuracy. Compared with those of other methods, the speed and reliability are significantly improved. Therefore, the unique path method for drawing pinch-out profiles based on a unified stratigraphic sequence proposed in the writers’ previous paper effectively avoids the excessive branch paths, slow speed, and insufficient reliability of the existing methods and provides effective and reliable support for the rapid drawing of profiles in smart geological systems.

1. Introduction

Pinch-out geometries, which define the geometry whereby a geological body ends laterally, closing and disappearing against another surface in geology, are common geological structures [1,2,3] that may cause the stress in the crust to become concentrated [4]. Moreover, overlapping stratigraphic pinch-outs may lead to the deformation and destruction of stratigraphic units [5], provide pivotal information on the paleotectonic setting, anatomy, and tectono-sedimentary evolution of sedimentary basins [6,7,8,9,10,11,12,13], and indicate the presence of oil and gas reservoirs [14,15]. Many scholars’ research on pinch-out relied primarily on the drawing of geological maps [16,17,18,19], which are the starting point for analyzing geological structures, calculating reservoir reserves, and determining drilling strategies [20,21]. Accurately mapping pinch-out can improve the efficiency and reliability of such research, and consequently, the accuracy of pinch outs mapping became the standard for evaluating the geological profile drawn by the program, thus producing practical consequences, such as those for the oil and gas industry [22]. In the oil and gas storage area, faults often appear together with pinch-out, and the combination of the two is more helpful to the investigation and exploration of oil and gas reservoirs [23].
Research on the mapping of pinch-outs on digital geological profiles focuses mainly on methods involving pinch-out line structures method, including the finite inference method, the average pinch-out angle method, and the infinite inference method [24]; however, the only information expressed by these techniques is the location of the pinch-out point, which is directly correlated with the thickness of the rock layer. In the finite inference method, a point between two adjacent boreholes is designated by the user as the pinch-out point, usually taken as 1/4, 1/3, 1/2, etc., of the distance from one hole. The average pinch-out angle method employs the average pinch-out angle and average formation thickness to determine the pinch-out profile with a complicated calculation process. The infinite inference method extrapolates a straight line to determine the pinch-out point outside of existing boreholes; for this purpose, the layer thicknesses in two adjacent boreholes are generally used to determine the pinch-out point. On the basis of the above technique, considering the diversity and complexity of geological phenomena, a comprehensive pinch-out mapping method was developed, including drawing sections with smooth curves [25], drawing sections that comprehensively consider topological relationships [26], drawing sections using fit guides [27], addressing the intersections of geological structures by a probability method [28,29], predicting strata and redrawing profiles with a machine learning method [30], and ultimately realizing the automatic mapping of pinch-outs by a program [27]. However, these synthetic methods encounter many difficulties in rendering pinch-out geometries [28]. It is difficult to establish the position of a pinch-out directly from the data [25], as discontinuities, stratigraphic gaps, pinch-out, lenticulars bodies, and other geological discontinuities may affect the rendering of pinch-outs [29], resulting in a low rendering efficiency and poor reliability [31]; 3D geological model research will also face such problems [32,33]. In the abovementioned research on drawing geological profiles, pinch-outs needs to be positioned by calculating control points and projection points; unfortunately, this approach produces an excessive number of branch paths, the corresponding method is complex, the profile drawing speed is slow, and the stability and reliability are too poor to meet practical demands. To solve these problems, based on the unified stratigraphic sequence method, a method of unifying different drilling sequences into the same sequence was developed, and this paper proposes a unique path method for drawing pinch-out profiles by converting pinch-out profiles into controlling the appearance of stratigraphic boundaries; this approach resolves the abovementioned problems, namely the excessive number branch paths and low speed and reliability of existing methods. The validity and reliability of the proposed method were tested by drawing geological profiles for a project in a city in East China, and it was proved that this method has great advantages regarding simplicity and speed compared with that of traditional methods.

2. Content and Method of Research

2.1. Theory of the Unique Path Method of Pinch-Out Profile Based on a Unified Stratigraphic Sequence

For a discontinuous stratum, its upper and lower boundaries will disappear abruptly on a geological map where pinch-outs formed; accordingly, the study of pinch-out could be transformed into an investigation of stratigraphic boundaries. Through a unified stratigraphic sequence, the method proposed in this paper explores the explicit and implicit boundaries (boundaries to draw and boundaries not to draw) of each stratum in each borehole and ultimately outputs a unified map of five discontinuous stratigraphic distributions instead of computing the pinch out location directly. In the proposed method, the processing of stratigraphic pinch-outs is transformed into controlling the explicit and implicit boundaries between each two pairs of adjacent boreholes. Pinch-out formed because of the disappearance of stratigraphic boundaries, so the pinch-out area can be drawn indirectly by controlling the appearance of each boundary line based on a unified stratigraphic sequence method when drawing geological section. In this respect, this method avoids the comparison of an excessive number of branch paths and the calculation of the location of pinch out points, so it is named unique path method. The principle of this method is depicted in Figure 1.
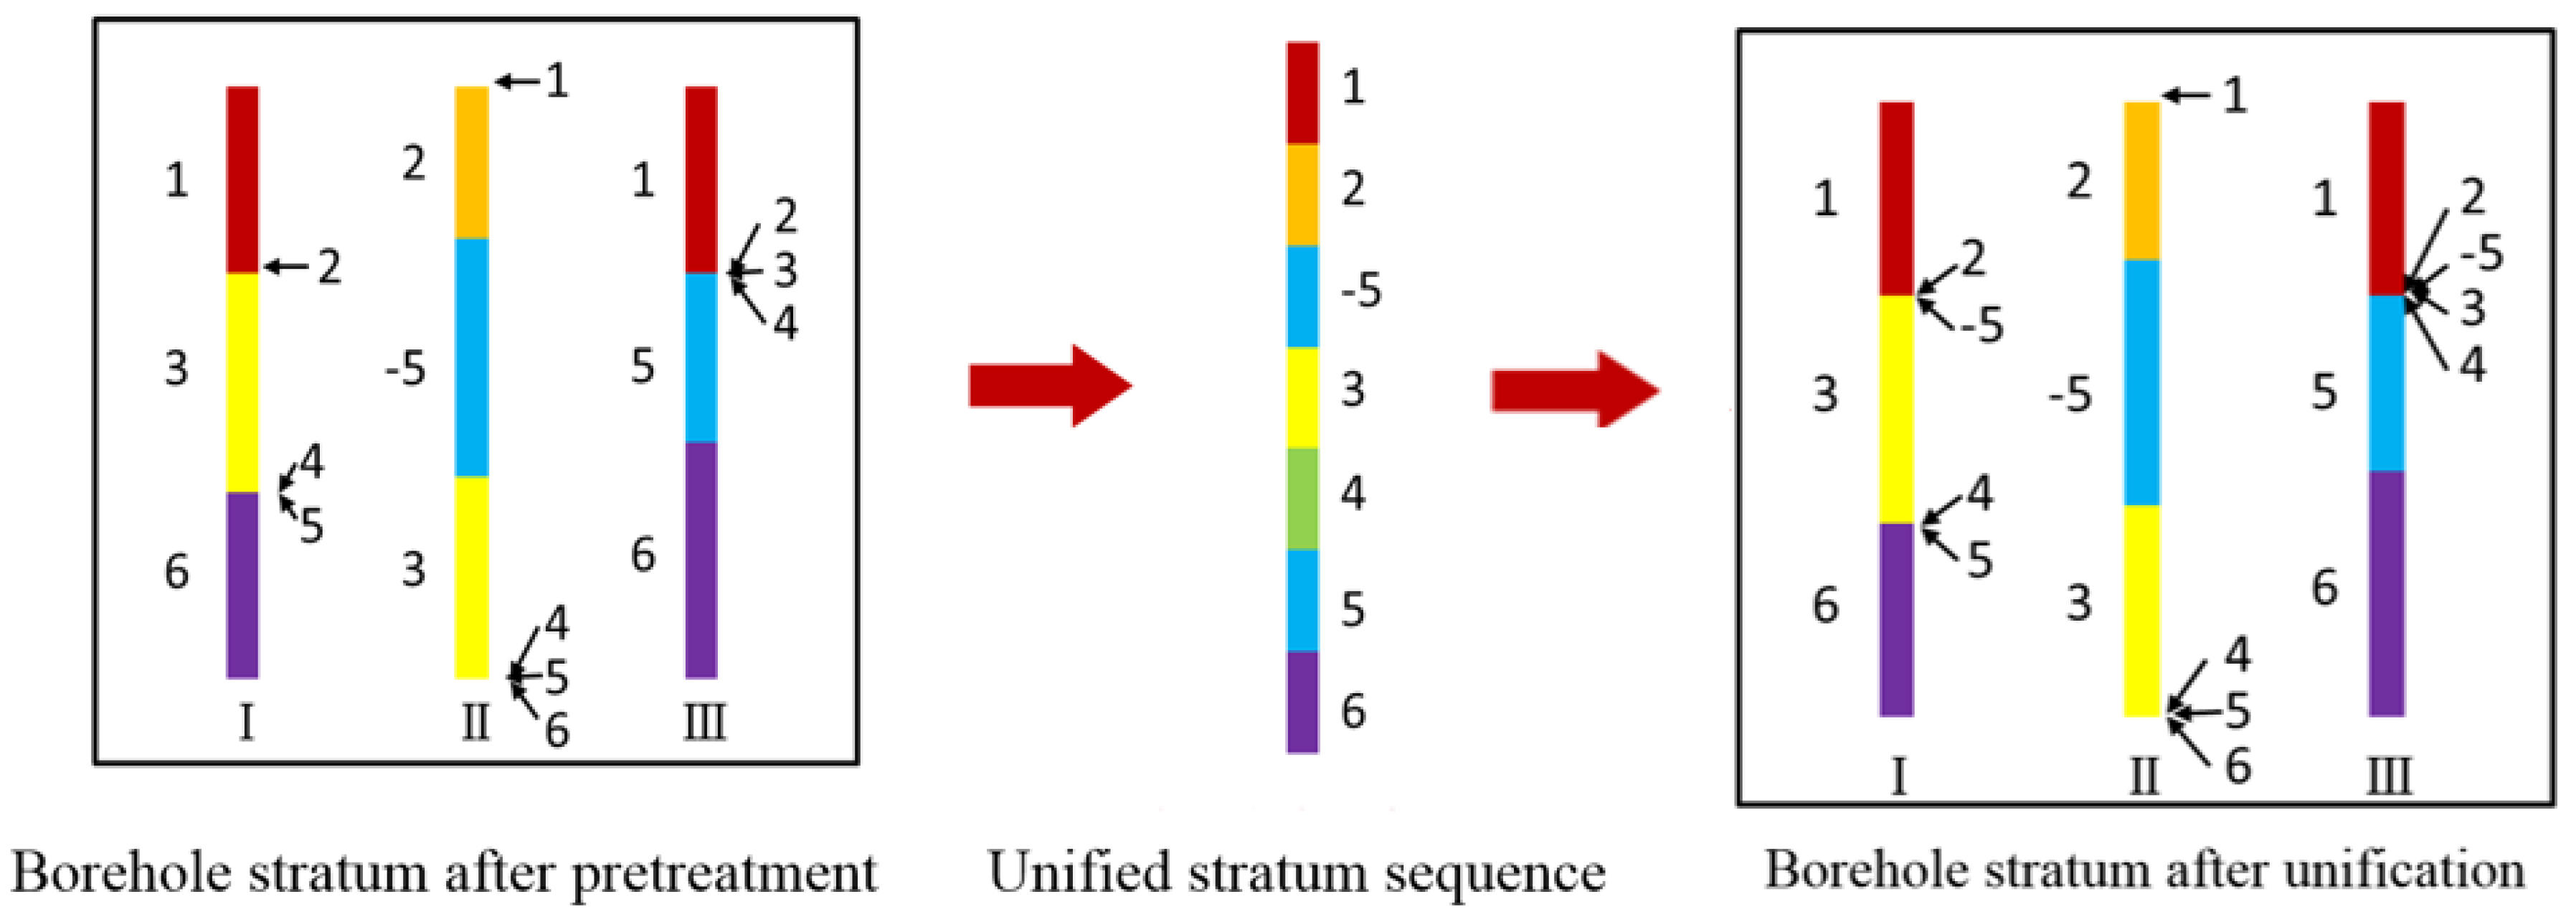
The principle of establishing the unified stratigraphic sequence is to insert some infinitely thin strata on the basis of the original sequence of each borehole; in this way, the unified stratigraphic sequence can include all the strata contained in the borehole, and the unified processing scheme can be convenient. Then, the unified sequence is used to add infinitely thin strata to each borehole; therefore, the layer sequence of each borehole is consistent with the unified stratigraphic sequence, as shown in Figure 2.
A two-dimensional (nonmatrix) array of the same lithology is obtained from the layer sequences of all boreholes. Each row contains different repeated layer numbers and records the different positions of all the layer numbers in the unified stratigraphic sequence. The layer elevation information (including the top and bottom boundary elevations) of all boreholes is unified into a two-dimensional layer elevation matrix, and each row corresponds to the unified stratigraphic sequence with an extra group. Local and global two-dimensional boundary marker matrix with a default value of 1 is created corresponding to the layer depth matrix and is used to control whether the layer boundaries between two adjacent boreholes are drawn. As shown in Figure 3, the stratum represented by the yellow background should not exist between the two boreholes on the right of Figure 3a as explicit boundaries, which means the same lithological strata above and below the yellow formation converge to form a single stratum, and thus, the yellow stratum would be drawn to pinch-out between the two boreholes on the left side. The explicit boundaries between the two boreholes on the right disappear and become the implicit boundaries that won’t be drawn. The explicit and implicit of upper and lower adjacent strata boundary can be identified by program automatically, and that means the pinch-outs can be identified as the same.
After comparing all the strata in each lithological array, values of 0 or 1 are assigned to the local two-dimensional boundary marker matrix according to whether each pair of strata are adjacent; then, all local matrices are assigned to the global matrix to ascertain the existence of all stratigraphic boundaries. After marking the existence of the boundary lines, the existing strata boundaries are drawn layer by layer, and the layers between those boundaries are filled. Finally, all the pinch-out phenomena are drawn with high accuracy.

2.2. Unique Path Method of Pinch-Out Profile Based on a Unified Stratigraphic Sequence

Pinch-out is caused by the sudden thinning and disappearance of a stratum, forming a discontinuity. This discontinuity corresponds to the disappearance of the boundary line on the profile. Therefore, the core idea of the proposed method is to treat the exploration of pinch-out into a search for the existence of boundary lines.
The number of strata in the data is transformed, and the strata are numbered from 0 according to different periods: the older the stratum is, the larger the corresponding number. The outliers and zeros in the borehole data are treated by processing data from nearby boreholes; in other words, the properties of strata are exactly as the same as those of the nearest formation.
All the borehole sequences to be drawn are processed into the unified stratigraphic sequence S as a standard sequence of geological profiles. The formula is shown in Equation (1), which exemplifies the process of unifying the stratigraphic sequence of three boreholes. Each column represents a drilling sequence in any block of Equation (1). Assuming the letters a, b, c, d, e, and f denote the sequence units arranged from younger to older, therefore in the middle borehole of leftmost part of Equation (1) e is determined as an inverted stratum, and a negative marker -e is used to represent this formation in the right of the equation; the right borehole of leftmost part of Equation (1) e is determined as a normal stratum. According to the rule shown in Figure 2, unified stratigraphic sequence S in the rightmost of the Equation (1) emerges. Then stratigraphic boundary matrix E would be constructed based on unified stratigraphic sequence S in the rightmost of the Equation (1) and exist stratigraphic elevation data. In fact, for each borehole, the stratigraphic sequence did not change at all even if some zero thickness strata were added.
{ a b a c e e f c f } { a a a b b b e c c c d d d e e e f f f } { a b e c d e f }
By default, all boundary lines exist. Since layers of the same nature may be distributed at different elevations, it is necessary to compare the elevations of all layer boundaries with that of the same layer number to determine whether the boundaries truly exist. If not, the default data will be modified. There must be a boundary between different layers, so only the boundary of the same layer number is discussed. Suppose that matrix H(m, n) contains the boundary elevations of the strata with the same layer number (representing n boreholes arranged sequentially by the top and bottom elevations, and there are m boundaries) which comes from E. Matrix B(m−3, n) is matrix H(m, n) with the first and last two rows removed. Matrix C(m−3, n) is H(m, n) with the first two rows and the last row removed. Therefore, Equations (2) and (3) are obtained. If the layer boundary difference is 0, the boundary is marked as 0, suggesting that no such boundary exists; otherwise, the boundary is marked as 1.
A 1 = s ( B C )
s ( a ) = { 1 , a = 0 0 , a 0
A1 is the local two-dimensional boundary marker matrix of the same kind of strata and indicates whether the boundaries exist; a represents each element in the matrix.
After obtaining the local two-dimensional boundary marker matrix, each local two-dimensional boundary marker matrix is used to assign and change the overall two-dimensional boundary marker matrix A. The method of converting local boundary markers into overall boundary markers is shown in Equation (4)
A i , j = A i i , j j 1 , i i = 0 , 1 m 4 , j j = 0 , 1 n 1
and i, j is the global location in A corresponding to local location of ii, jj in A1. For the transformation between location i, j, and location ii, jj is matrix T.
Finally, the boundary of each layer is drawn. After many experiments, cubic Bezier curves are deemed the most reasonable choice for the layer boundaries to describe the stratigraphic boundary accurately. The drawing of each Bezier curve is performed according to Equation (5):
f ( x ) = P 0 ( 1 t ) 3 + 3 P 1 t ( 1 t ) 2 + 3 P 2 t 2 ( 1 t ) + P 3 t 3 , t [ 0 , 1 ]
and the other methods of curve fitting are also tried, such as quadratic Bezier curve as show in Equation (6) and Lagrange interpolation method as show in Equation (7).
f ( x ) = P 0 ( 1 t ) 2 + 2 P 1 t ( 1 t ) + P 3 t 2 , t [ 0 , 1 ]
f n ( x ) = y i ( x x 2 ) ( x x 3 ) ( x x n ) ( x x n + 1 ) ( x 1 x 2 ) ( x 1 x 3 ) ( x 1 x n ) ( x 1 x n + 1 )
The starting and end points of each curve are the bottom or top of the same lithological layer between adjacent boreholes. For example, the starting point coordinates are (x1, y1), and the end point coordinates are (x2, y2). Then, the coordinates of control point 1 are ((x1 + x2)/2, y1), and the coordinates of control point 2 are ((x1 + x2)/2, y2). After the boundaries are drawn, the layer is filled according to the layer number.

2.3. Procedure of the Unique Path Method for Pinch-Out Profiles Based on a Unified Stratigraphic Sequence

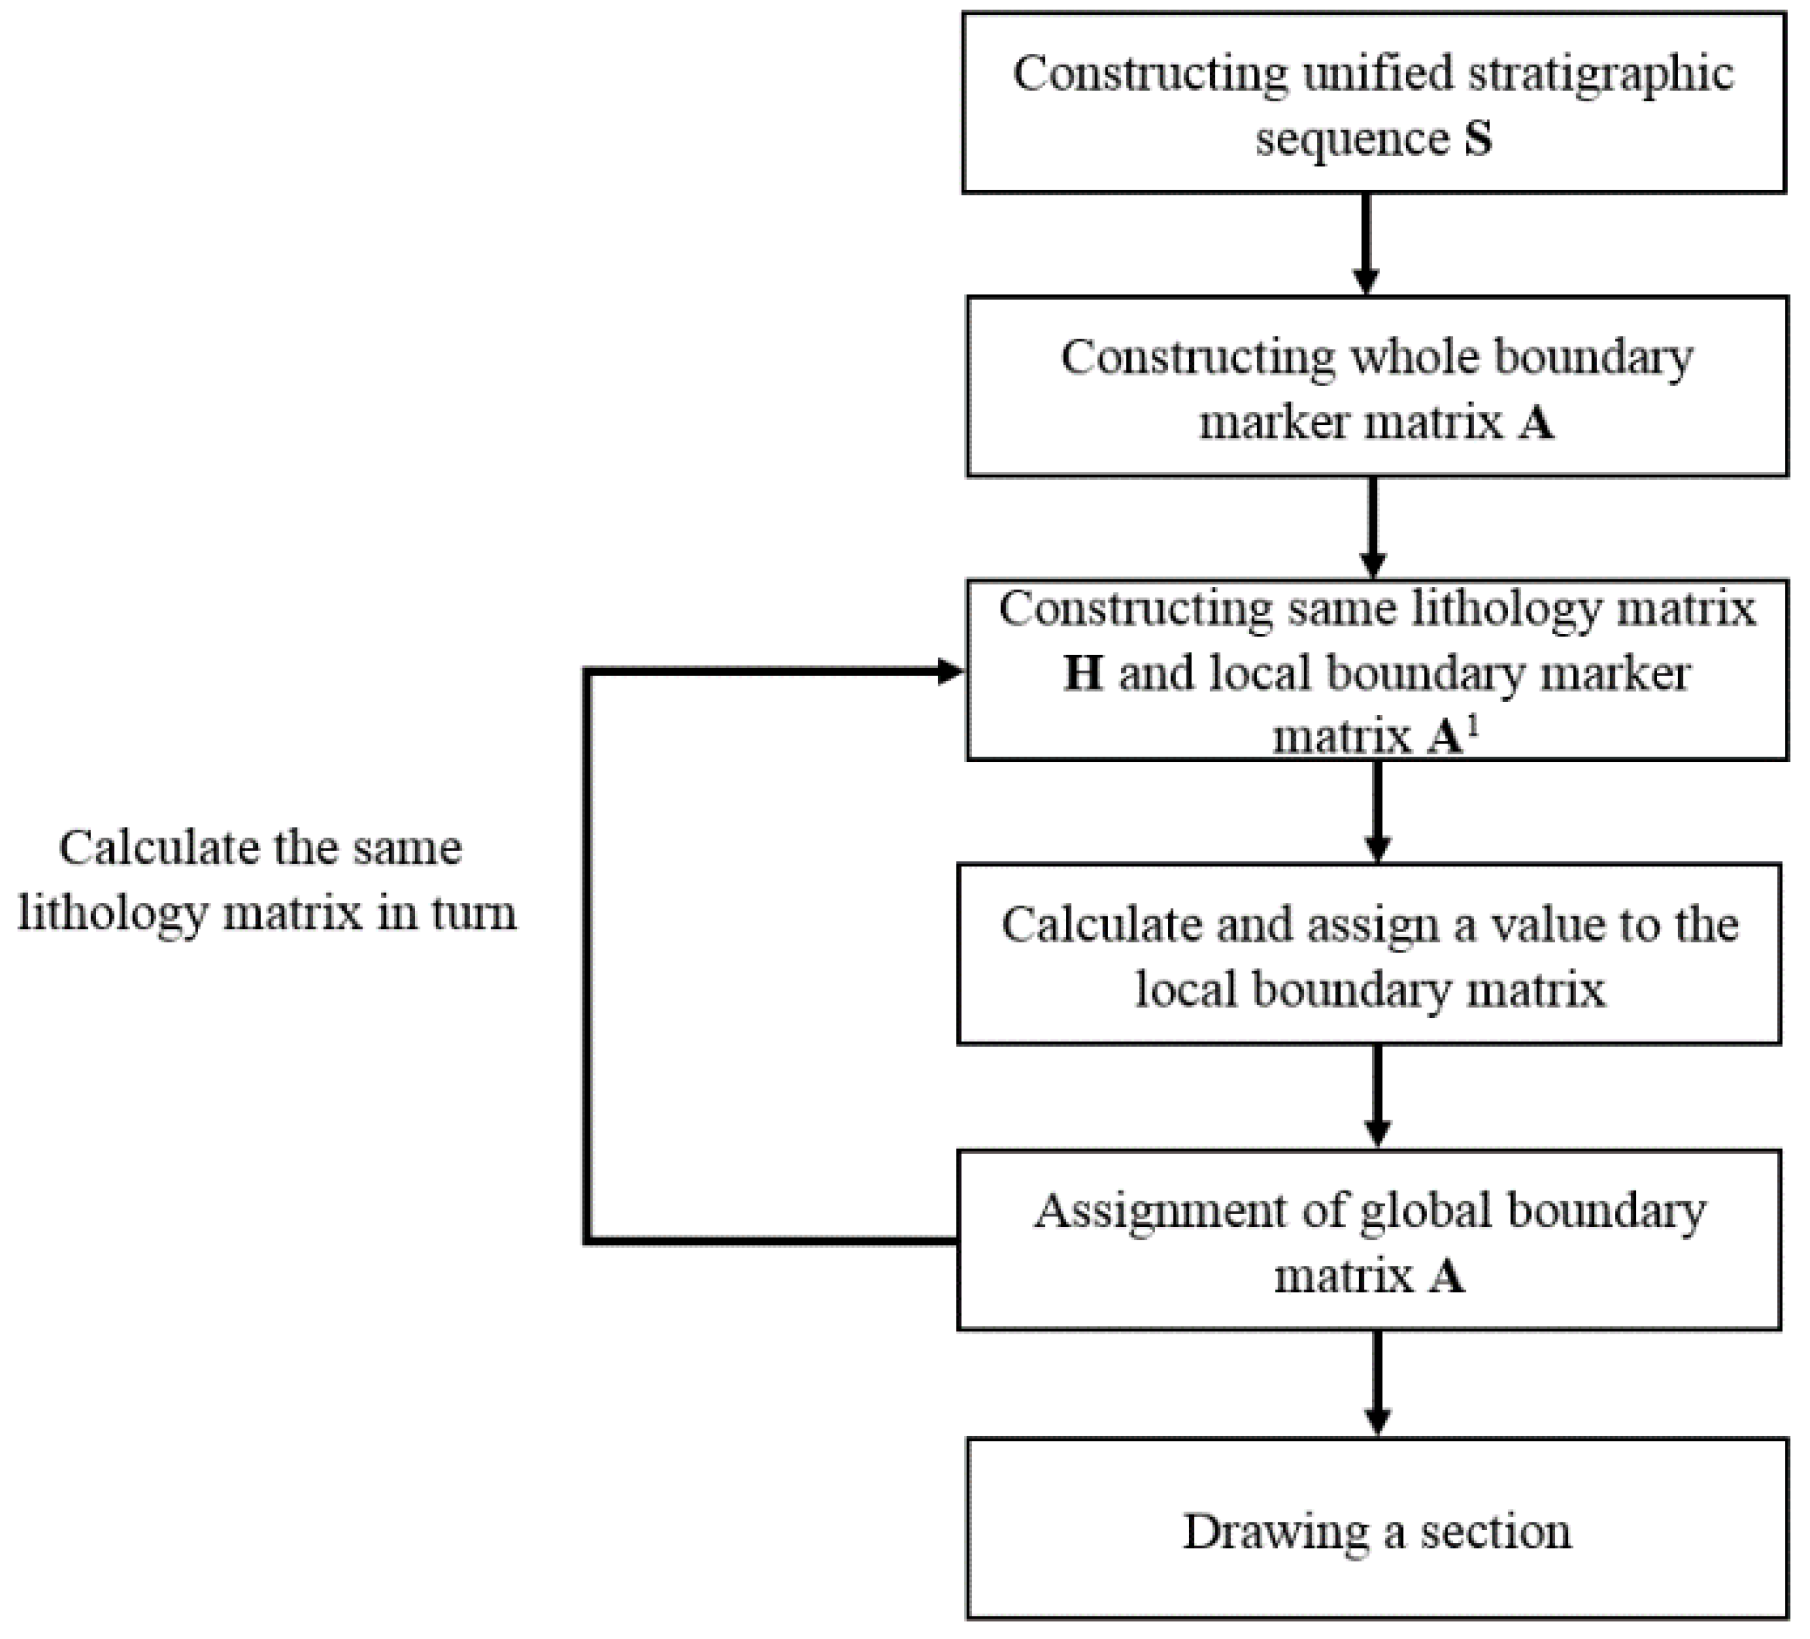
The proposed method processes all the boreholes to obtain the unified stratigraphic sequence once the drilling data are obtained and then adjusts the drilling data according to the unified stratigraphic sequence. Finally, a complete digital profile containing pinch-out geometries is output after drawing each boundary line judged by the program. Before initiating the processing step, however, it is necessary to account for possible missing data and to rectify formatting errors in the input data to obtain the correct data. It is also necessary to integrate the stratigraphic data and elevation data from all boreholes and stratigraphic maps to fill the layers from different boreholes. The stratigraphic data and elevation data integrated from different boreholes and the stratigraphic maps to be filled also need to be prepared, as shown in Figure 4.
  • Convert the data into a specific format and account for missing data and errors within the data;
  • Integrate the drilling data with depth data and stratigraphic data;
  • Integrate the sequences from all boreholes to establish a unified stratum sequence S according to Equation (1);
  • Set the default values of marker matrix A for establishing whether the overall stratum boundary exists to 1;
  • Establish two-dimensional homogenous lithologic boundaries matrix H by turn according to the unified stratigraphic sequence S and E;
  • Generate boundary matrix H(m, n) for each row in matrix E, and then generate upper boundary matrix B(m−3, n) and lower boundary matrix C(m−3, n) from boundary matrix H(m, n). Perform stratum boundary contact detection to obtain multiple local boundary marker matrixes A1;
  • Assign and correct the values within overall boundary marker matrix A based on all local boundary marker matrix A1 by repeating steps 5–6;
  • According to the matrix A and E, the Bessel curve representing each boundary of strata can be drawn and the strata between the curves can be filled with different customized basic patterns using the common library (canvas library in JavaScript).
After assigning all local boundary markers to the overall boundary marker matrix, the program starts drawing the existing stratigraphic boundaries layer by layer from top to bottom, fills in the corresponding stratigraphic map, and then draws other elements such as the coordinates, scale, and legend. This paper uses the unique path method based on a unified stratigraphic sequence and a vector-based drawing mode to draw the corresponding vectors within geological profiles.

3. Application to a Case and Discussion of Results

3.1. Geographical and Geological Overview

Since the Cenozoic, the study area belongs to two structural units, Jinhu Dongtai depression and Yangzhou Nantong uplift. It belongs to a series of horst-and-graben structures formed in the background of regional extension since Cenozoic and is inherited from Mesozoic sedimentary structural basin as shown is Figure 5; the age information is shown in Table 1. The depressions and uplifts in the area can be further subdivided and arranged in NE direction by a series of secondary depressions and uplifts. The borehole data originate from a city in East China with an area of 1496 km2 located on the north bank of the Yangtze River in the Yangtze River Delta, which includes the Yangtze River floodplain and the Lixiahe Plain [34]. More than 700 borehole data points are available, and their distribution is provided in Figure 5. The study area is located along the Yangtze River at the convergence of five distributary channels into the river, which flows into the sea. Most of the territory is occupied by the flood plain, and water accounts for up to 22.15% of the total area. Preliminary analysis of the data reveals that in addition to filled soil, the Holocene deposits comprise siltstone, silt, clay, silty clay, and muddy silty clay. All the strata information is shown in Table 2. In Table 2, age represents the age of the formation of stratum, layer number represents the number of the stratum type, and sub layer represents the further subdivision of similar types. The stratum name is a popular name for the stratum type, the burial depth is the statistics of different stratum depths, the stratum thickness is also the statistics of different stratum thickness, and the distribution is the statistics of the distribution of different strata in the area. The borehole data structure is shown in Table 3.

3.2. Drawing of Pinch-Out Profiles Using the Unique Path Method on a Unified Stratigraphic Sequence

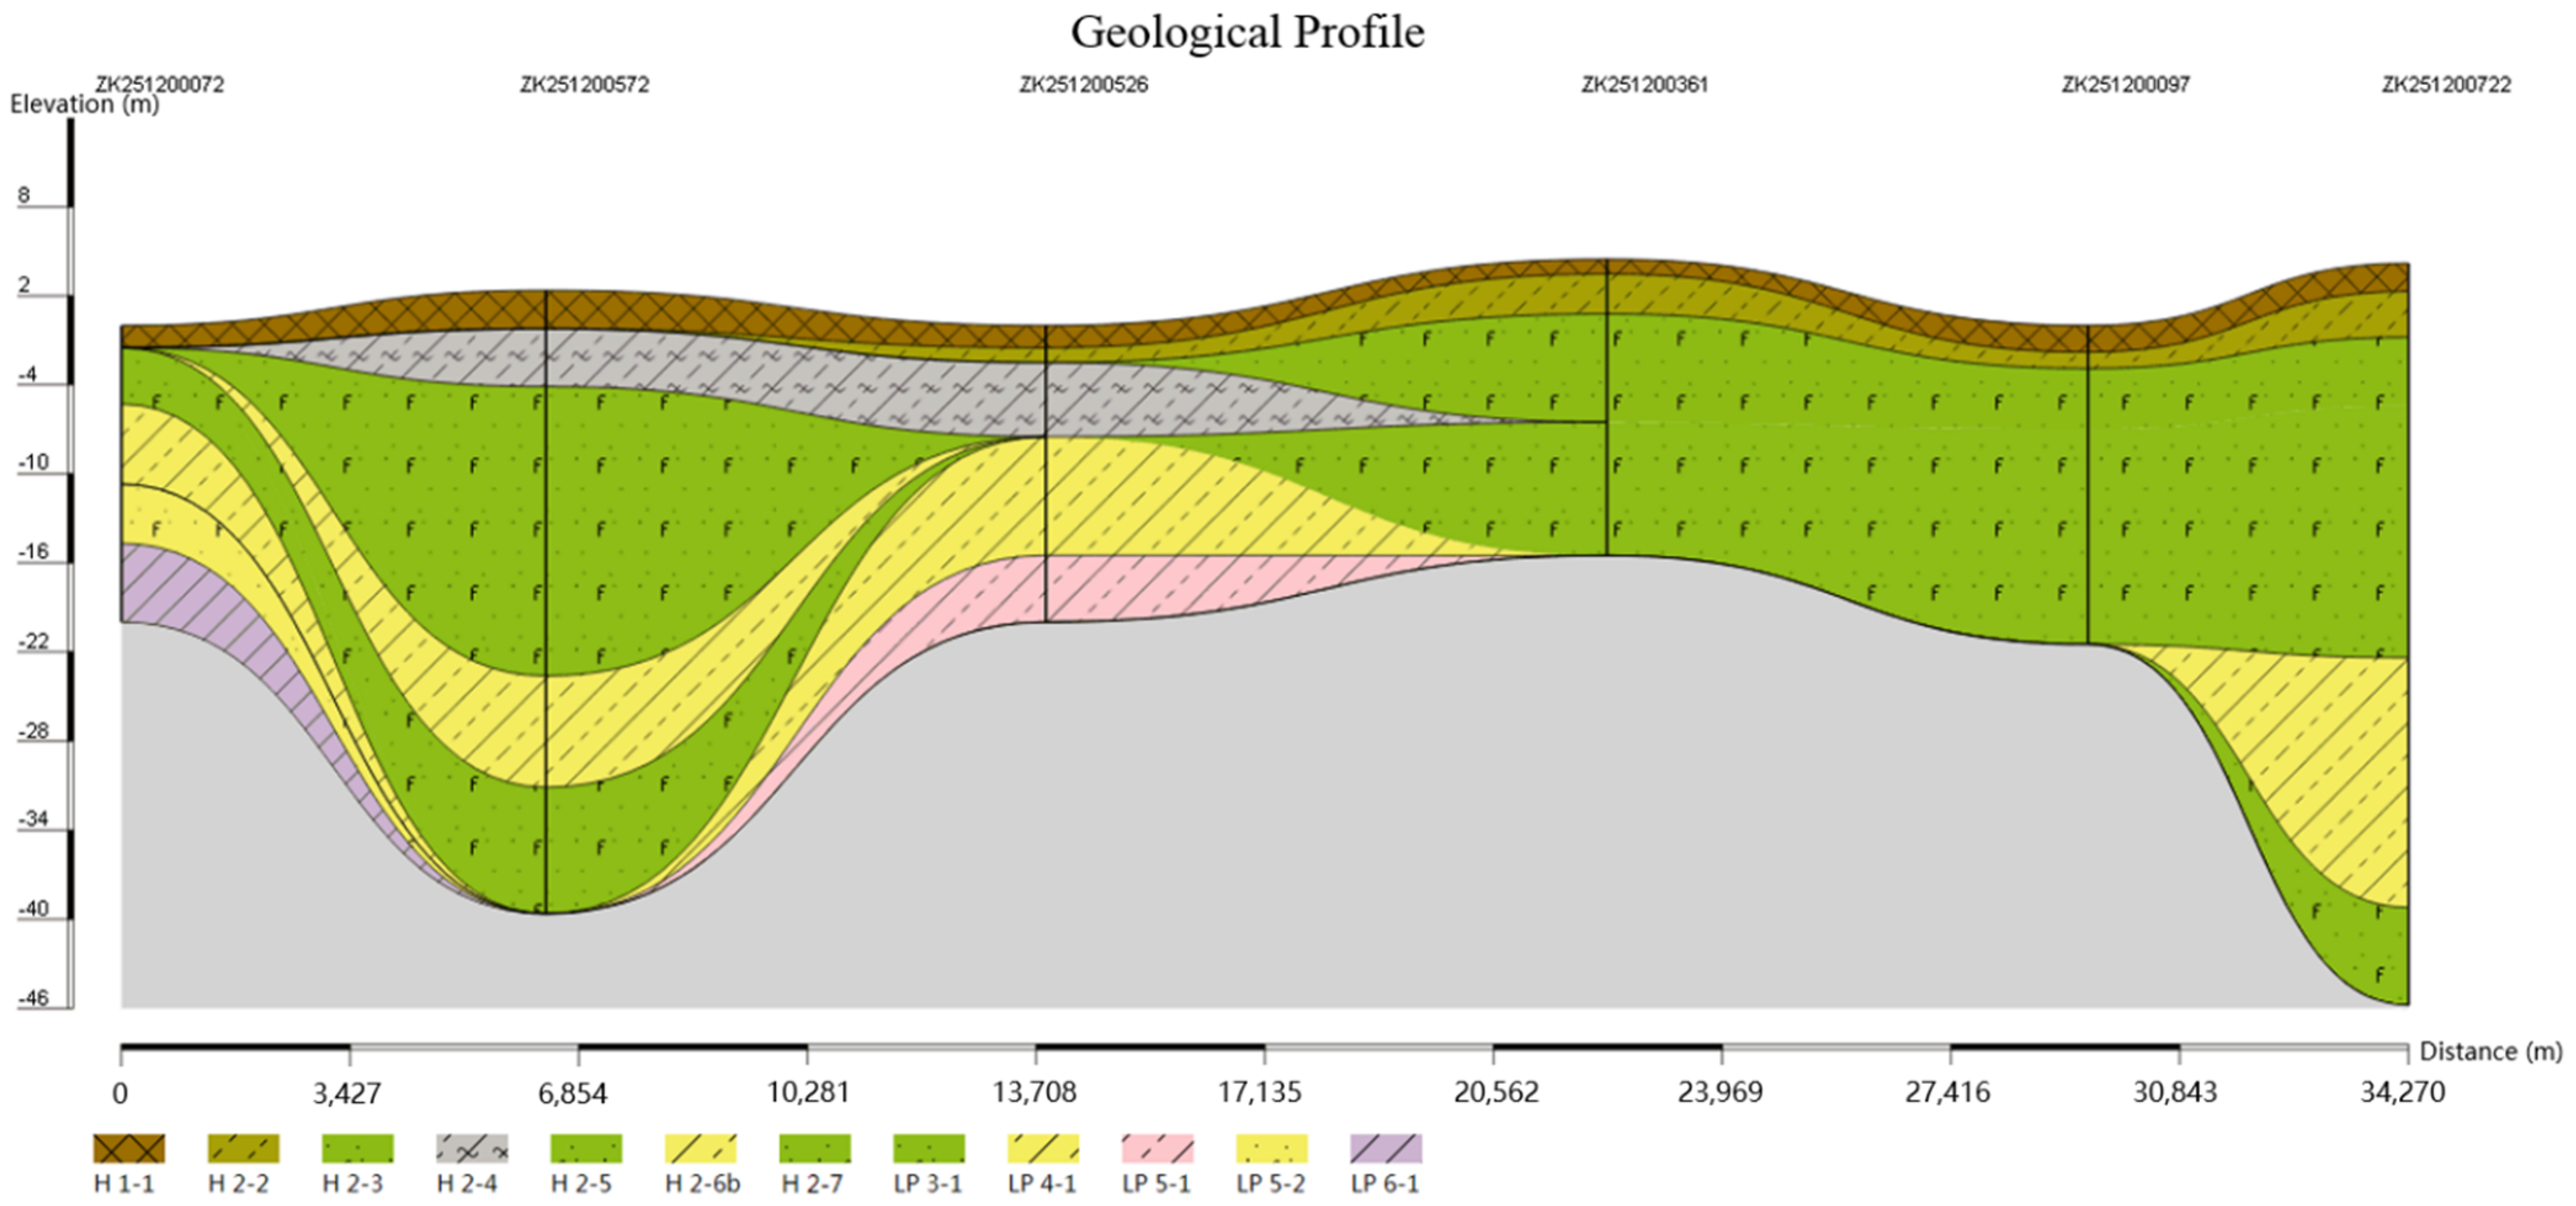
This article uses borehole data from the study area to draw the main geological profiles of the NE-SW (as illustrated in Figure 6a), E-W (as illustrated in Figure 7), and N-S (as illustrated in Figure 12) oriented to further elaborate the distribution and characteristics of geological pinch-out in the region (the hardware consisted of 4 1.70 GHz CPUs with 8 GB of memory and the language for programming is JavaScript (ECMAScript 2015) due to the needs of the project). By connecting 7 boreholes along a single line oriented approximately 30 degrees northeast-southwest in Figure 6a, a geological profile was drawn as shown in Figure 6b. The soil types in the area closer to the Yangtze River gradually become more unitary from the left to the right and the green silty sand stratum appears sharp extinction in the middle of the profile, and most of the strata disappear in the lower right position where the pinch-outs occur.
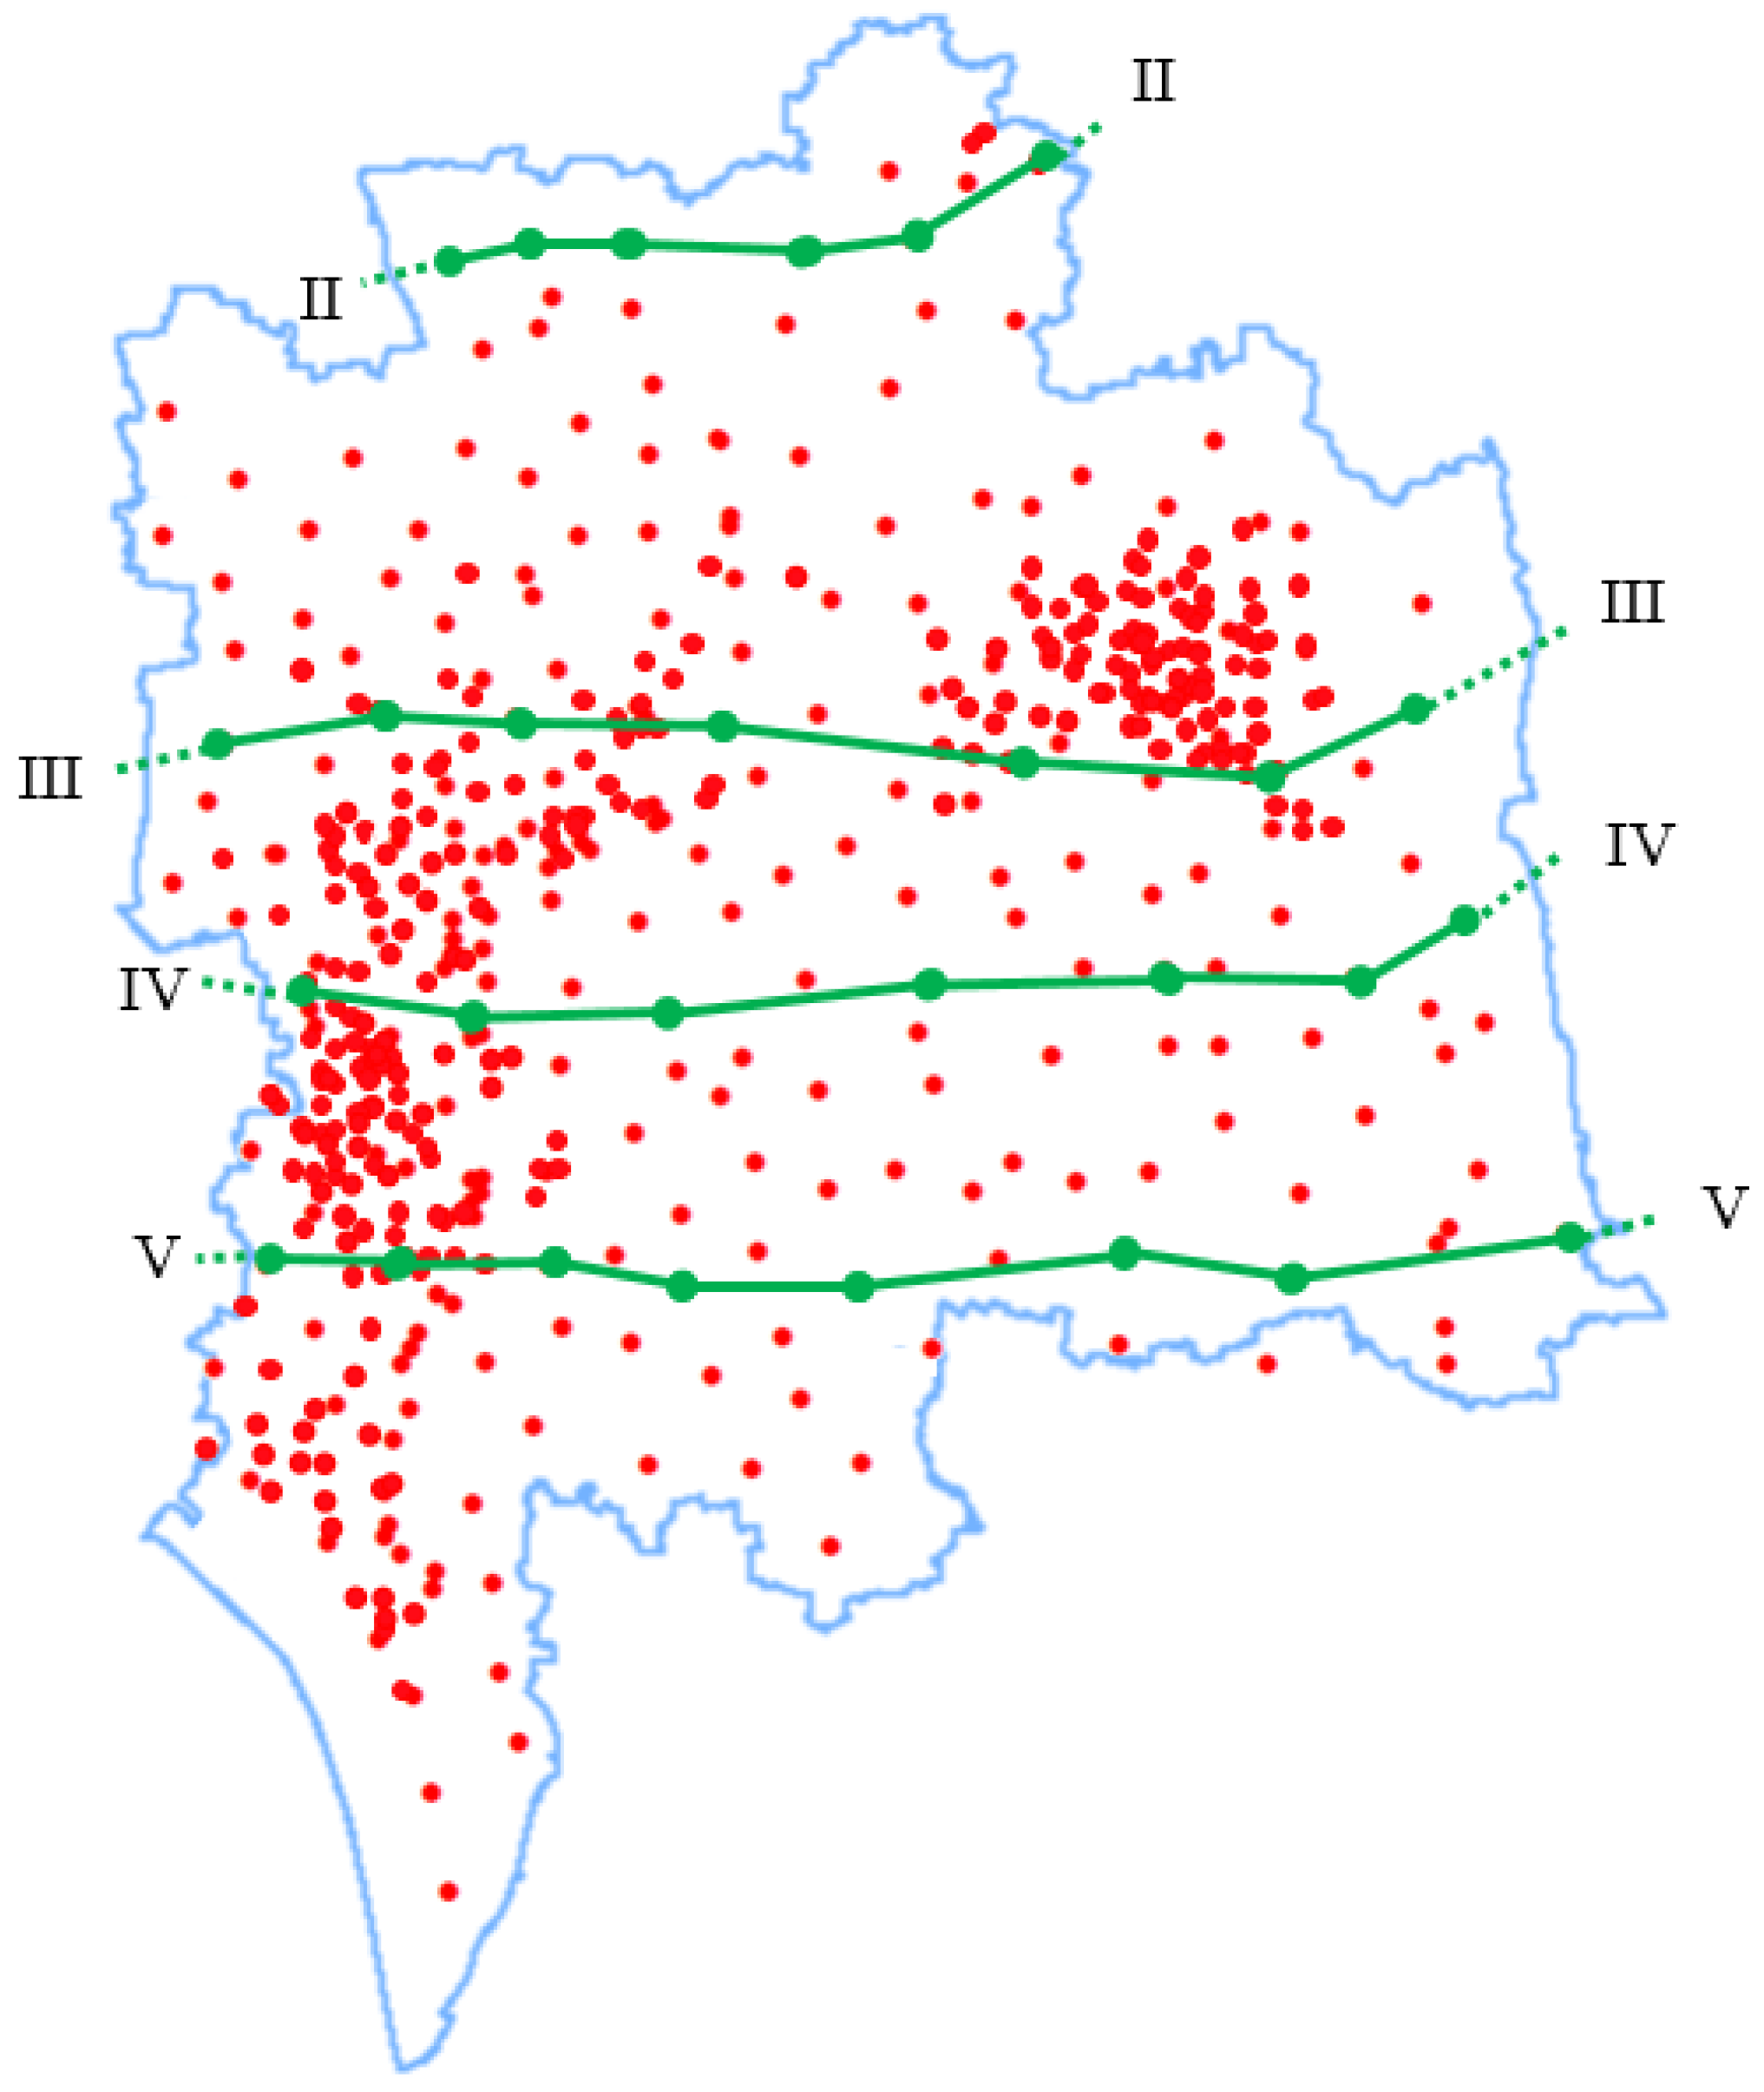
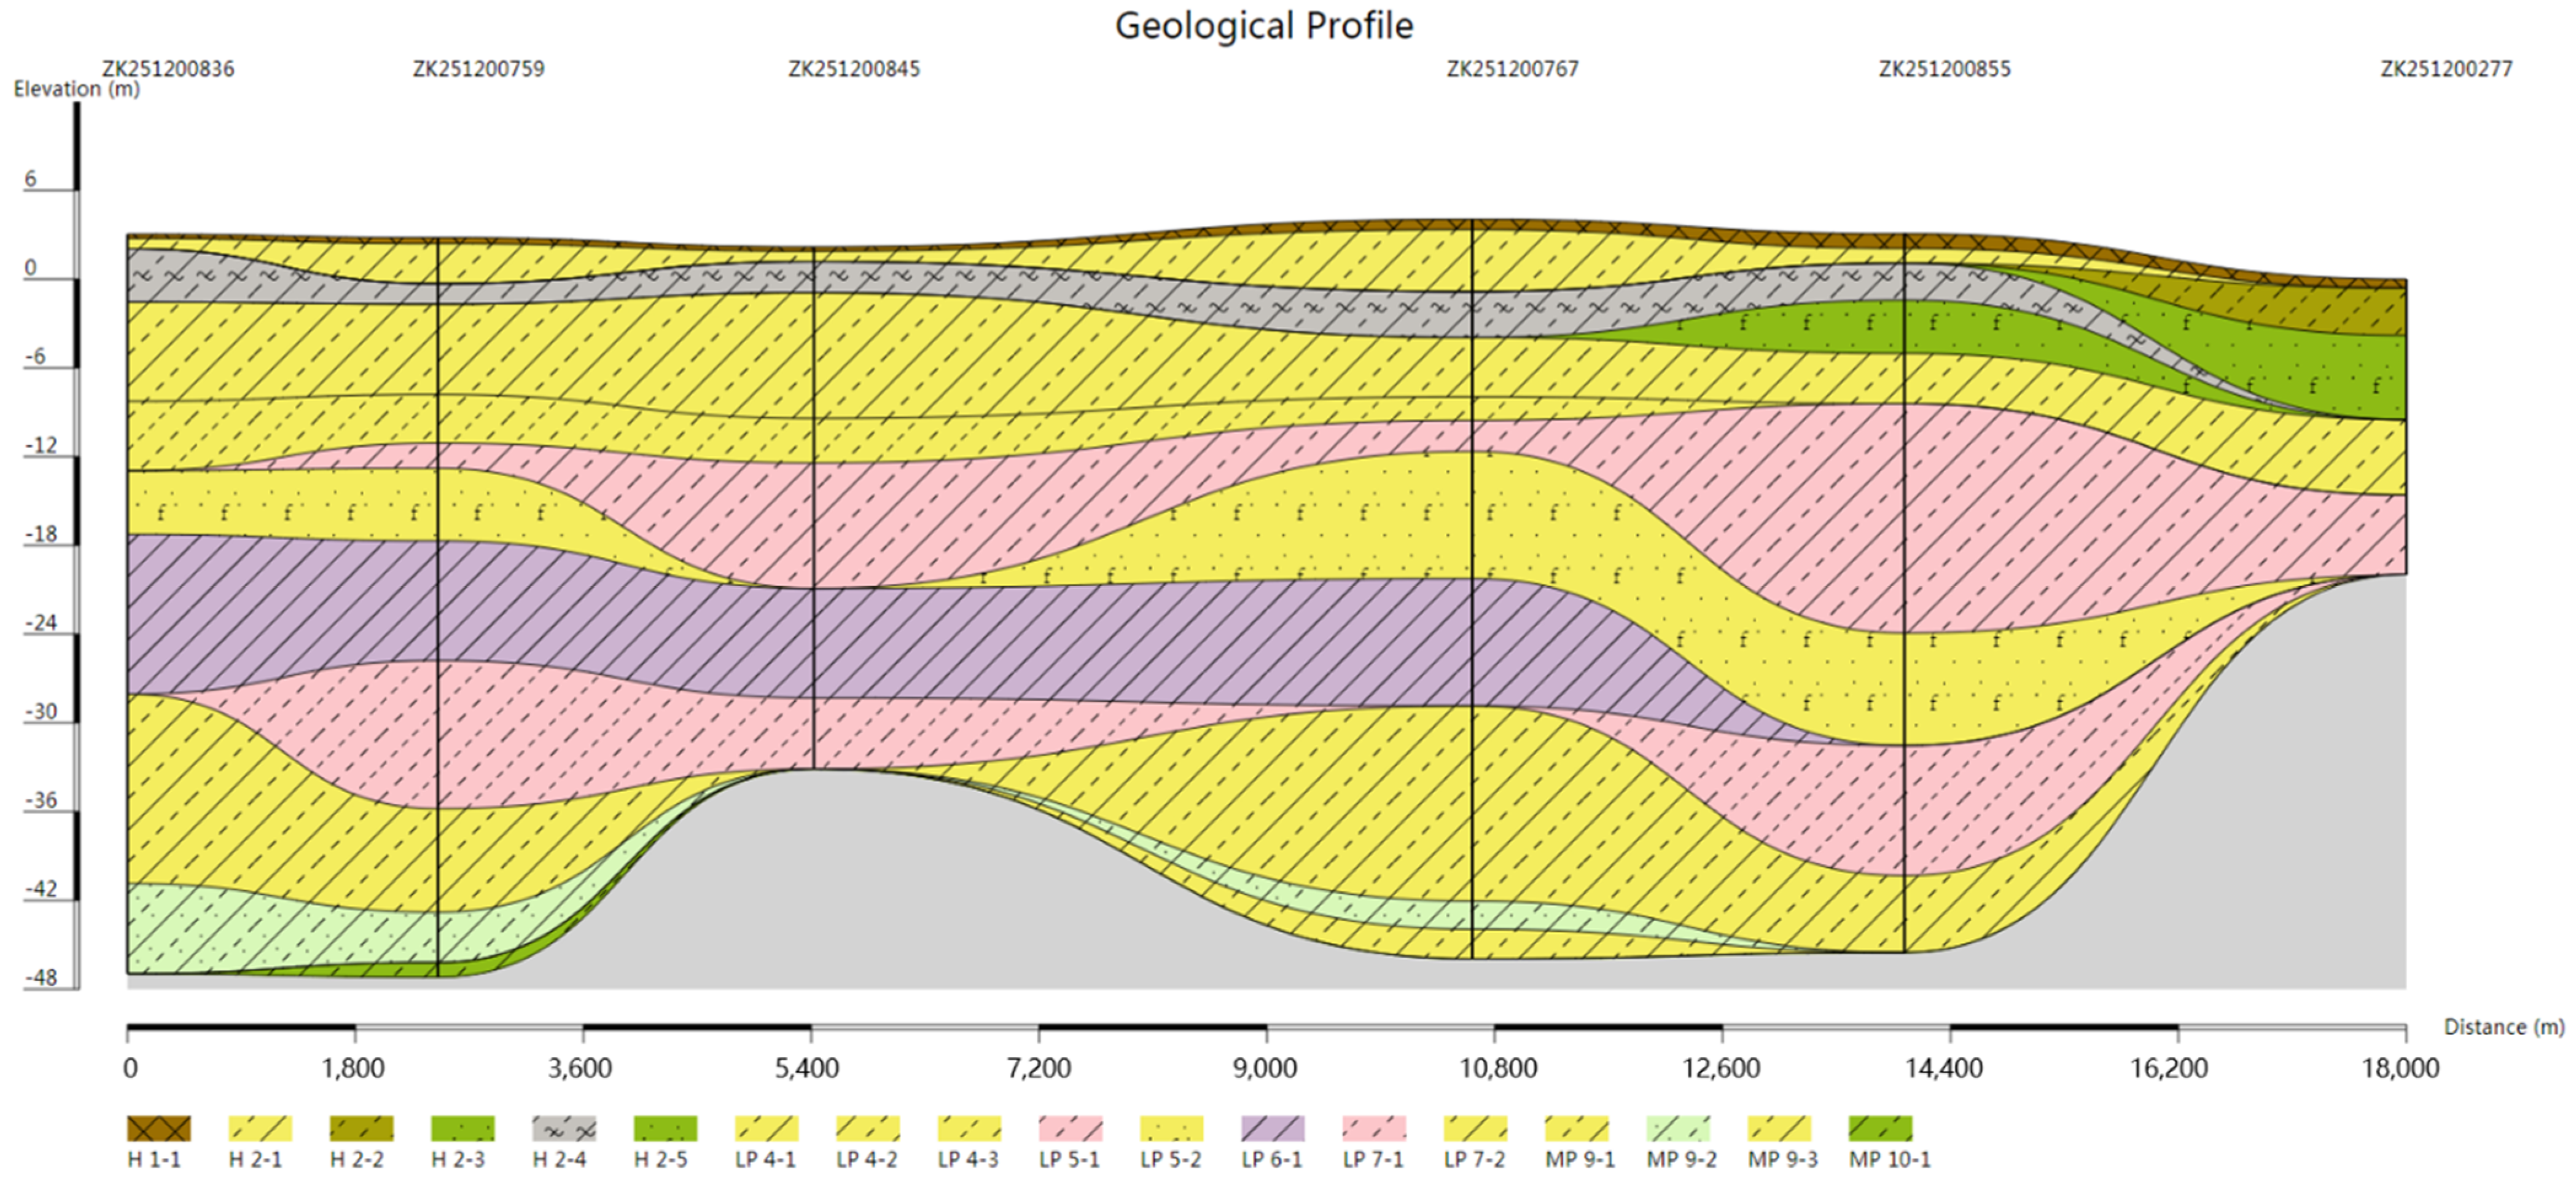
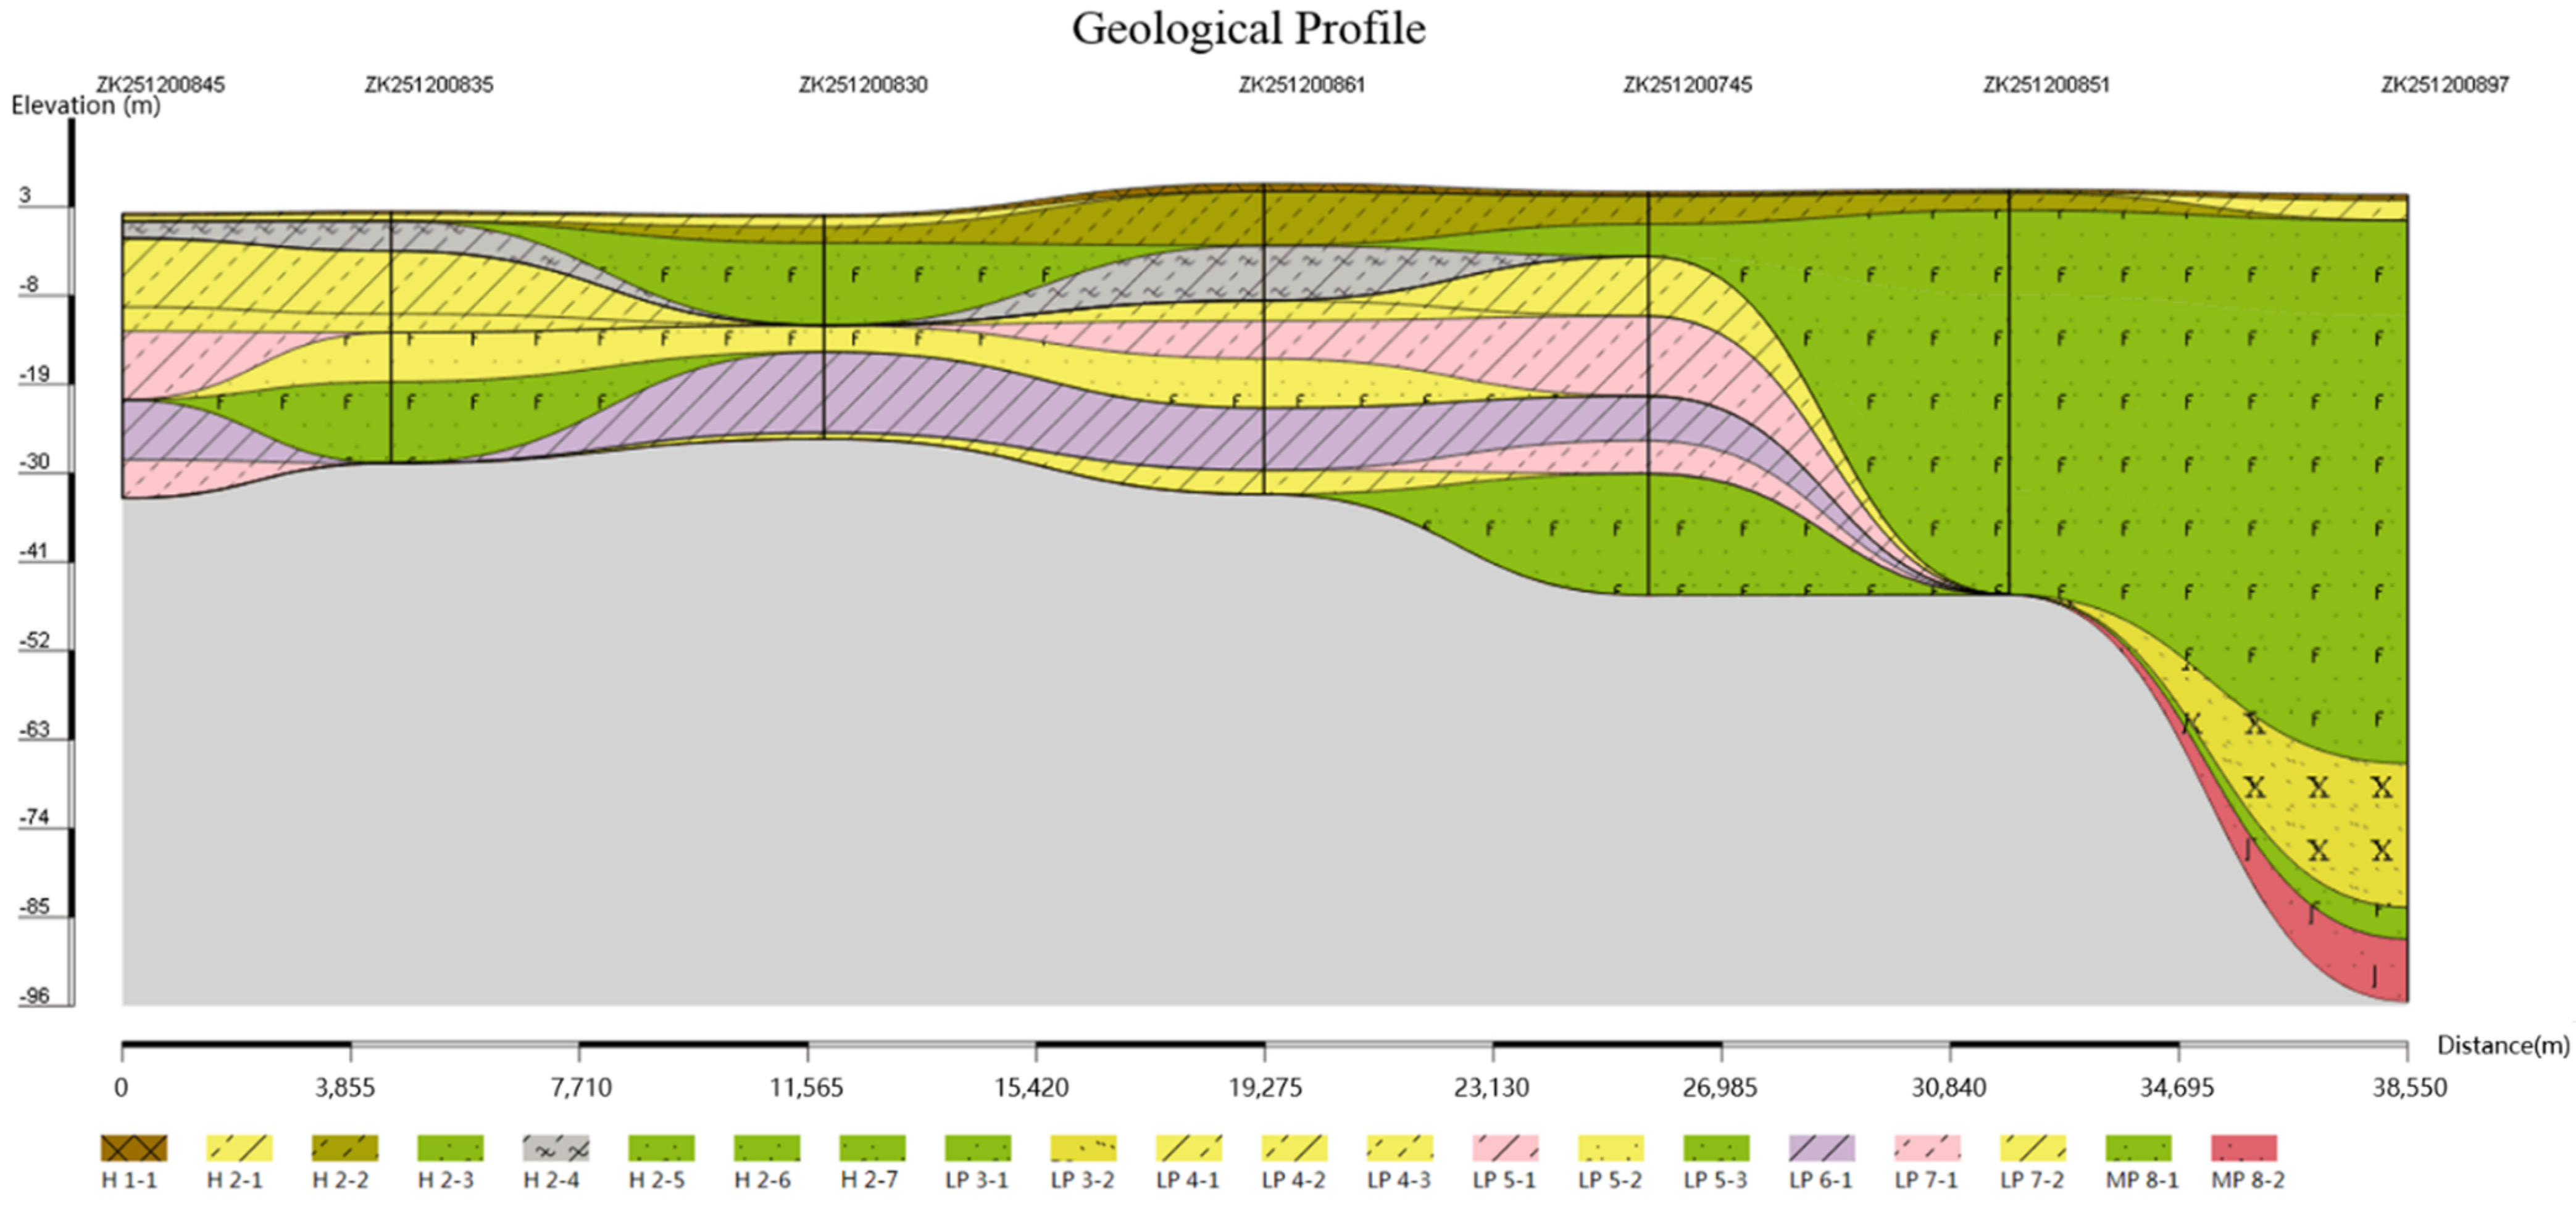
According to the east-west oriented geological profiles shown in Figure 7 (profile II to profile V, Figure 8, Figure 9, Figure 10 and Figure 11), from north to south the types of strata in Figure 8, Figure 9, Figure 10, Figure 11 and Figure 12 are decreasing, and the sand layer is growing thicker and thicker while its proportion is increasing; therefore, other strata are disappearing slowly.
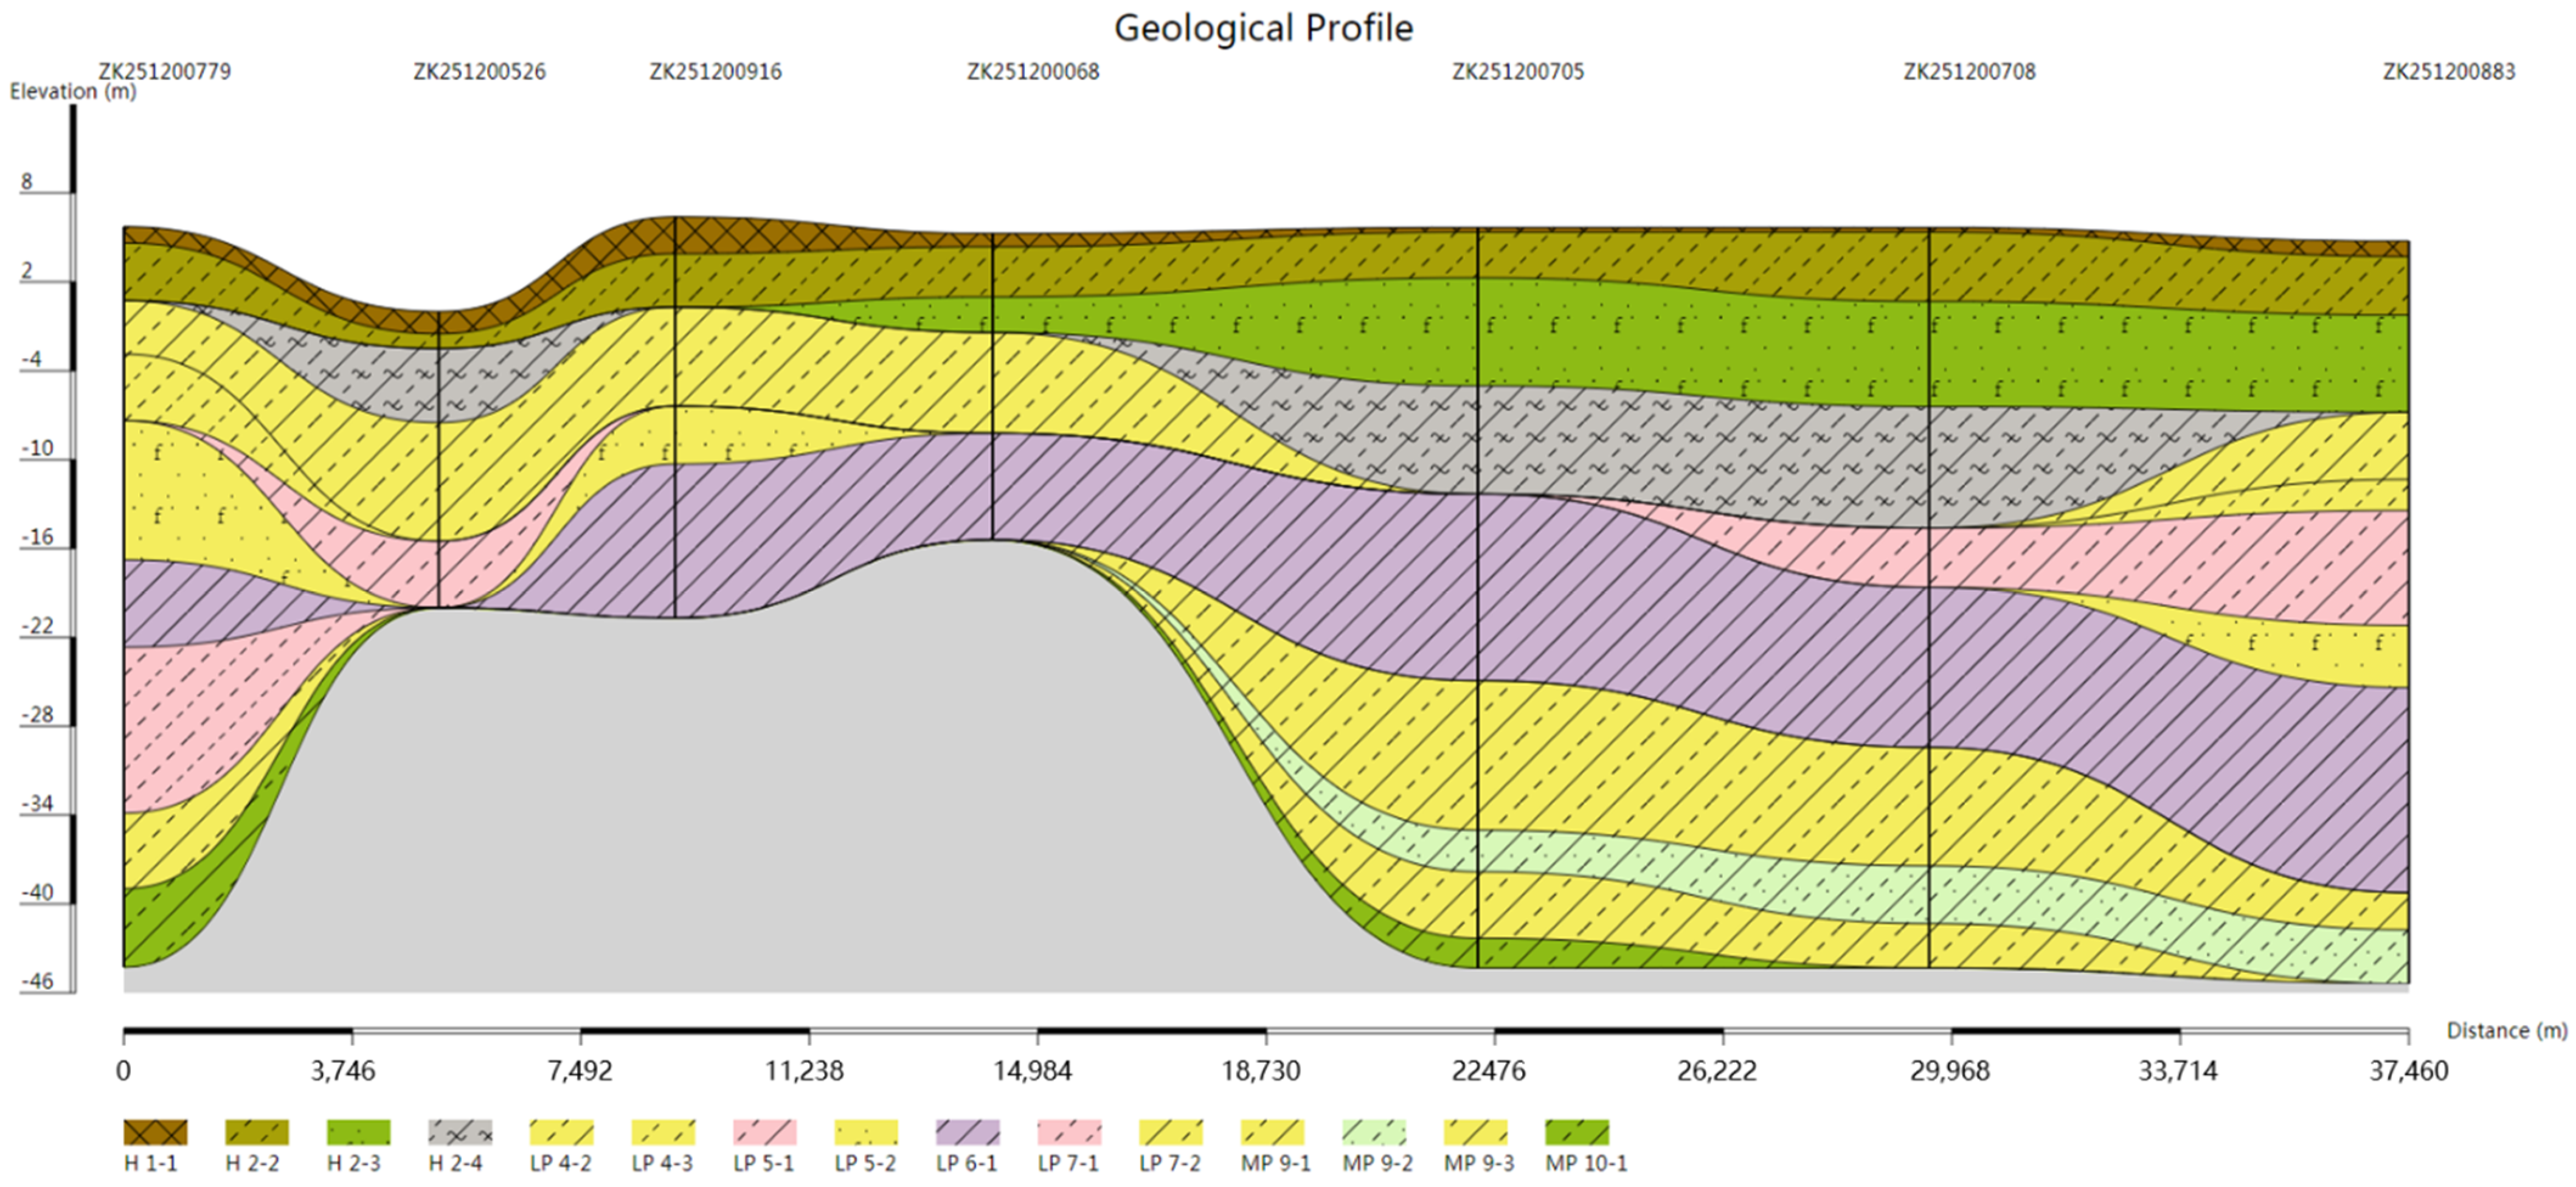
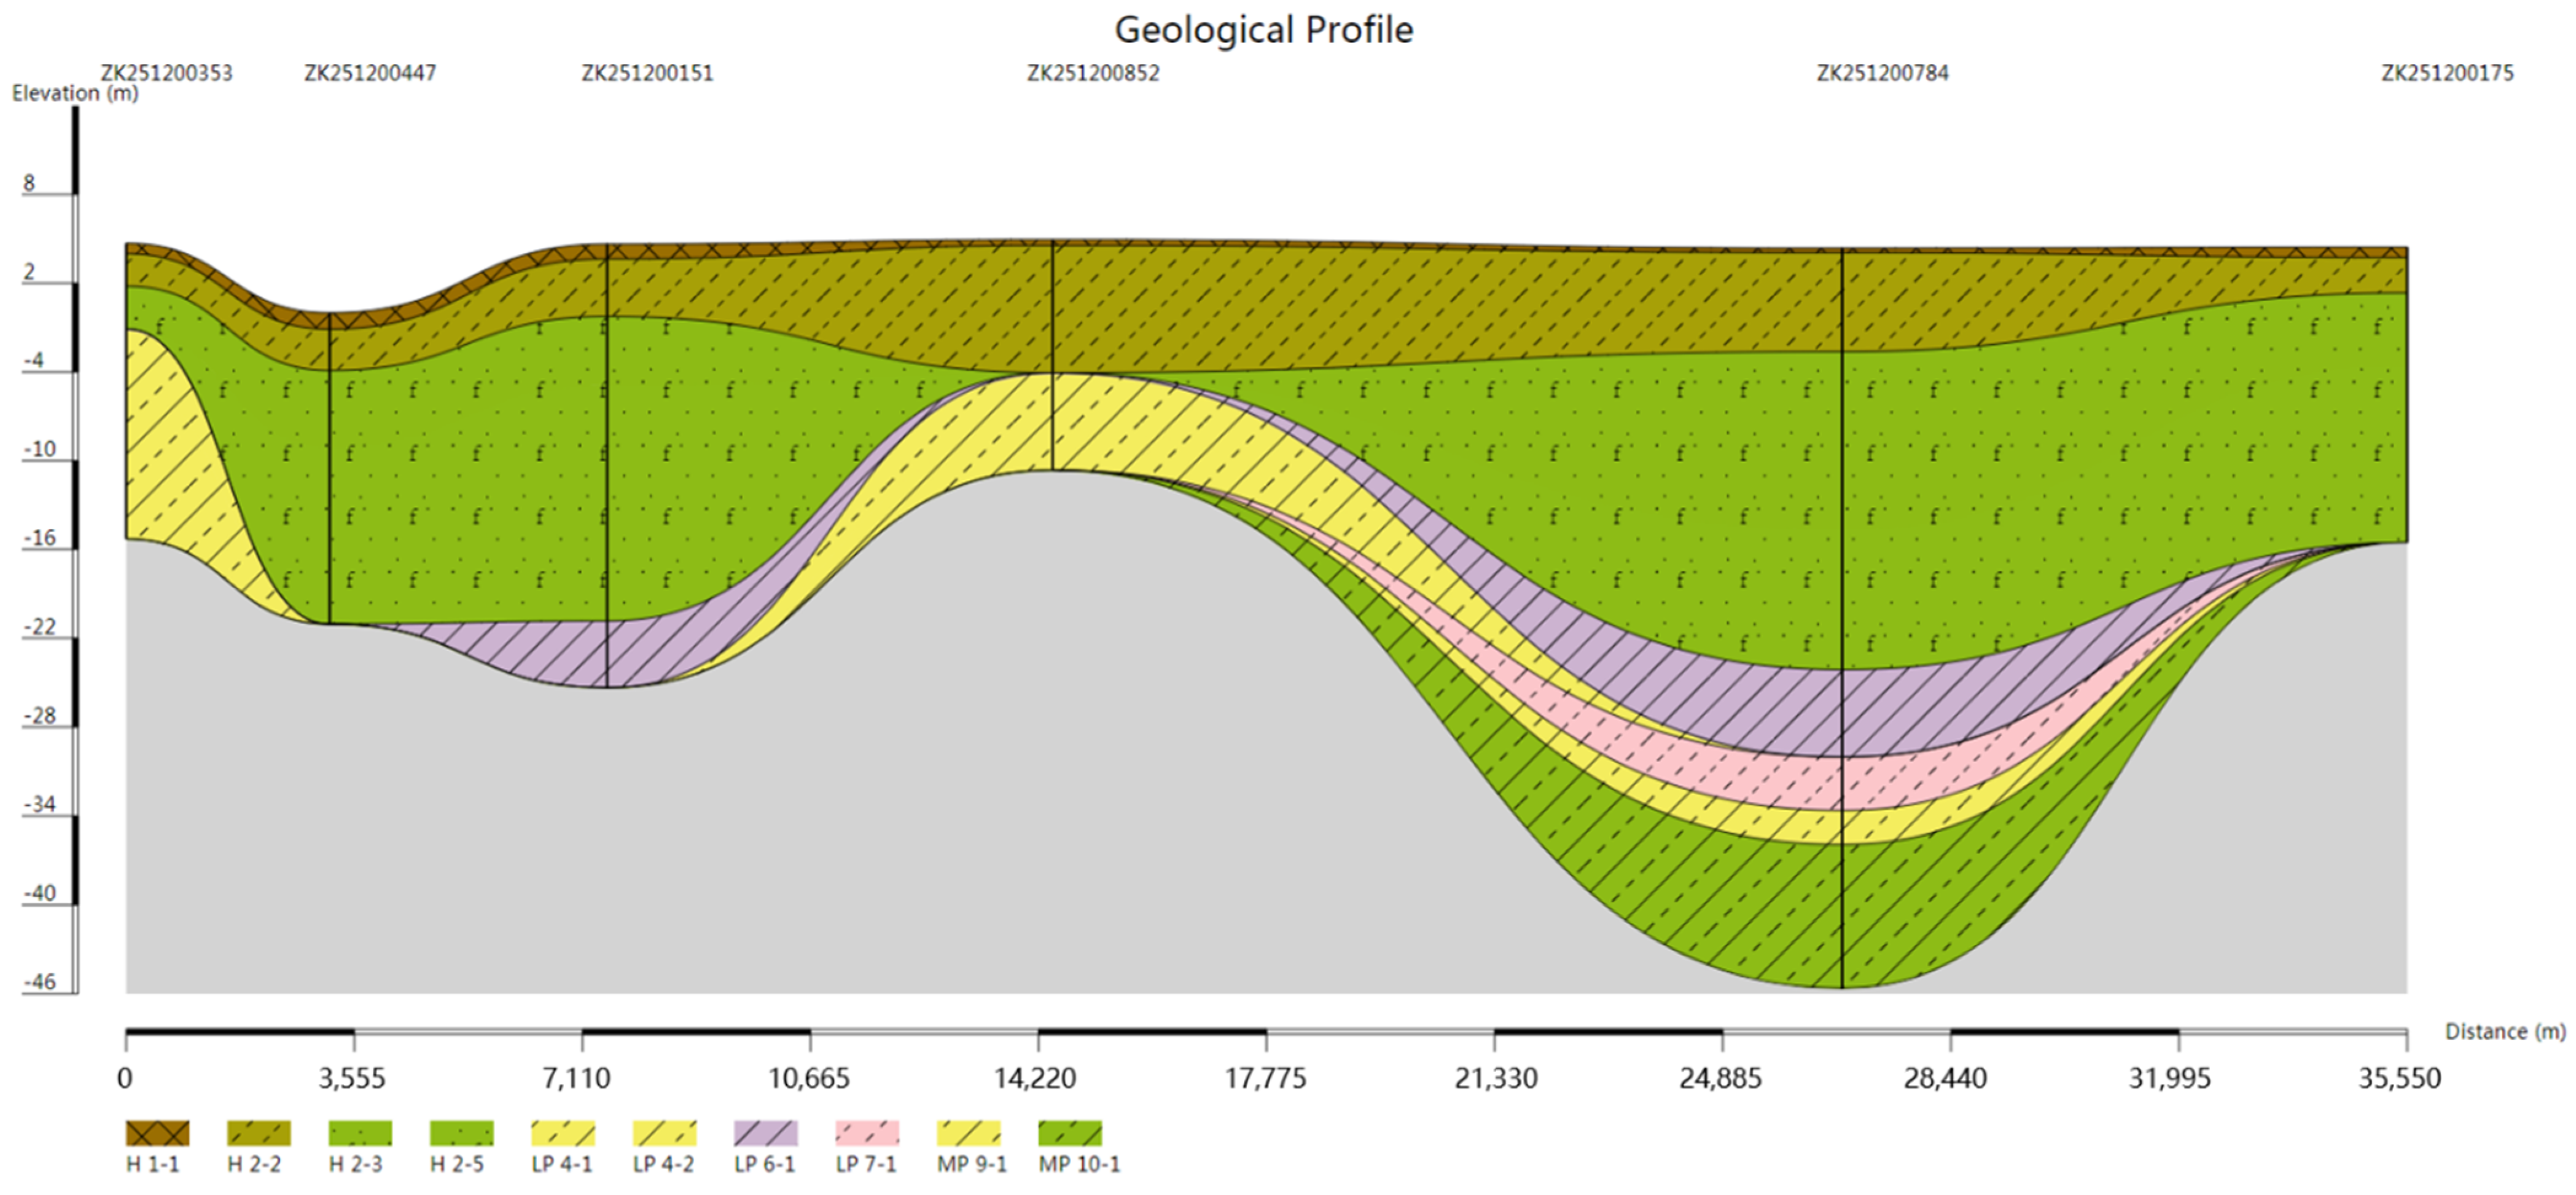
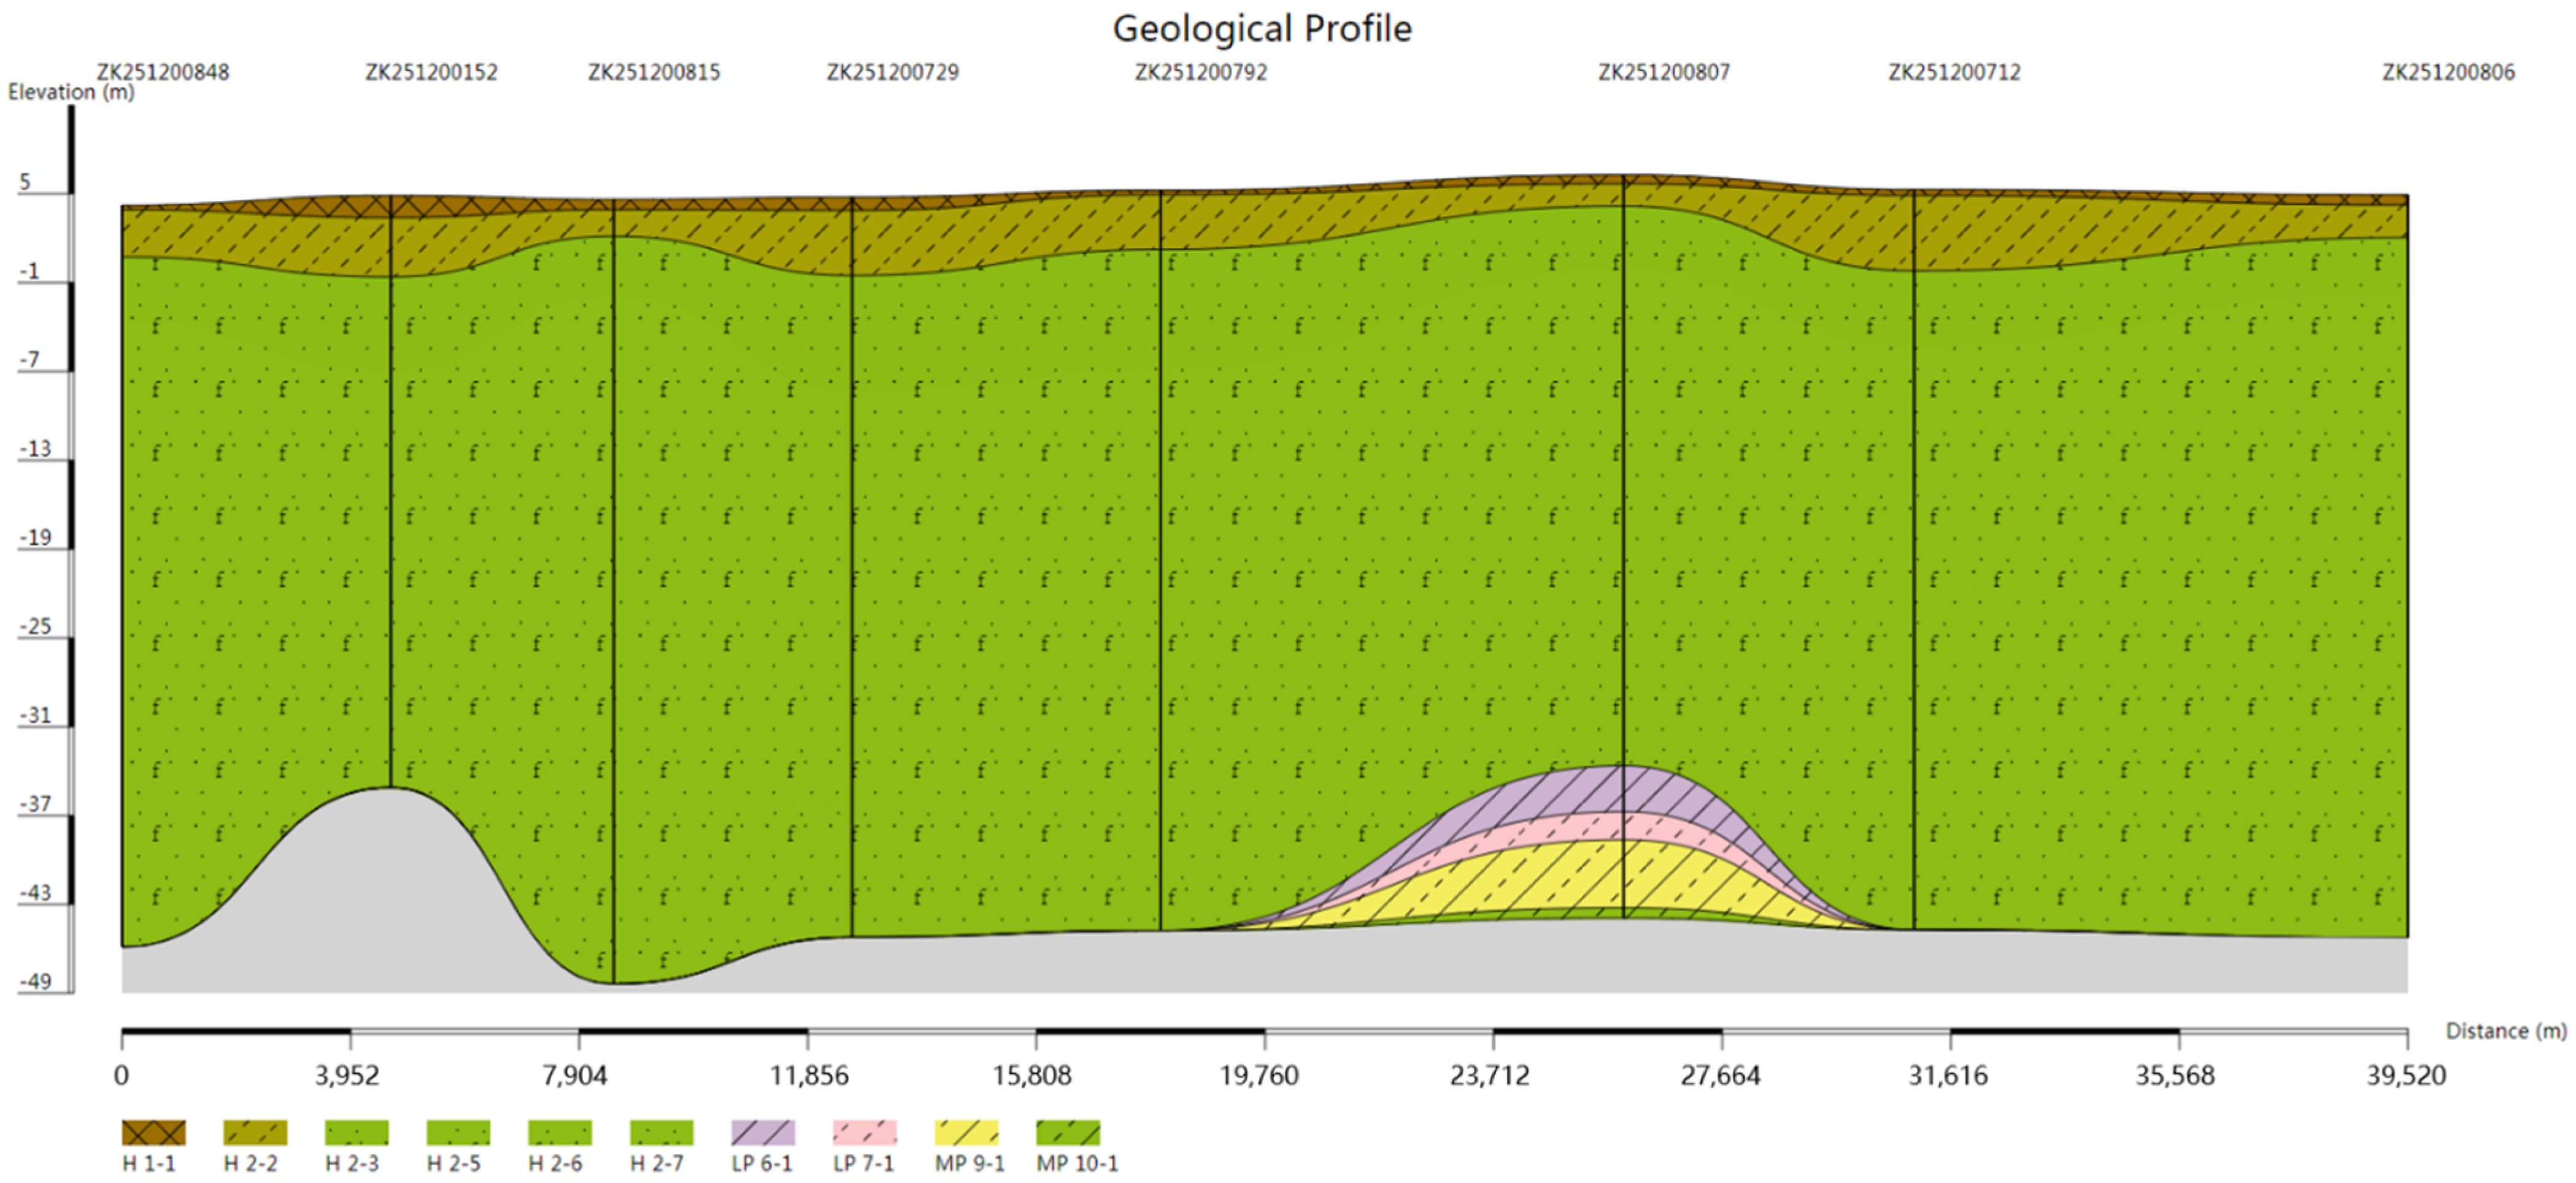
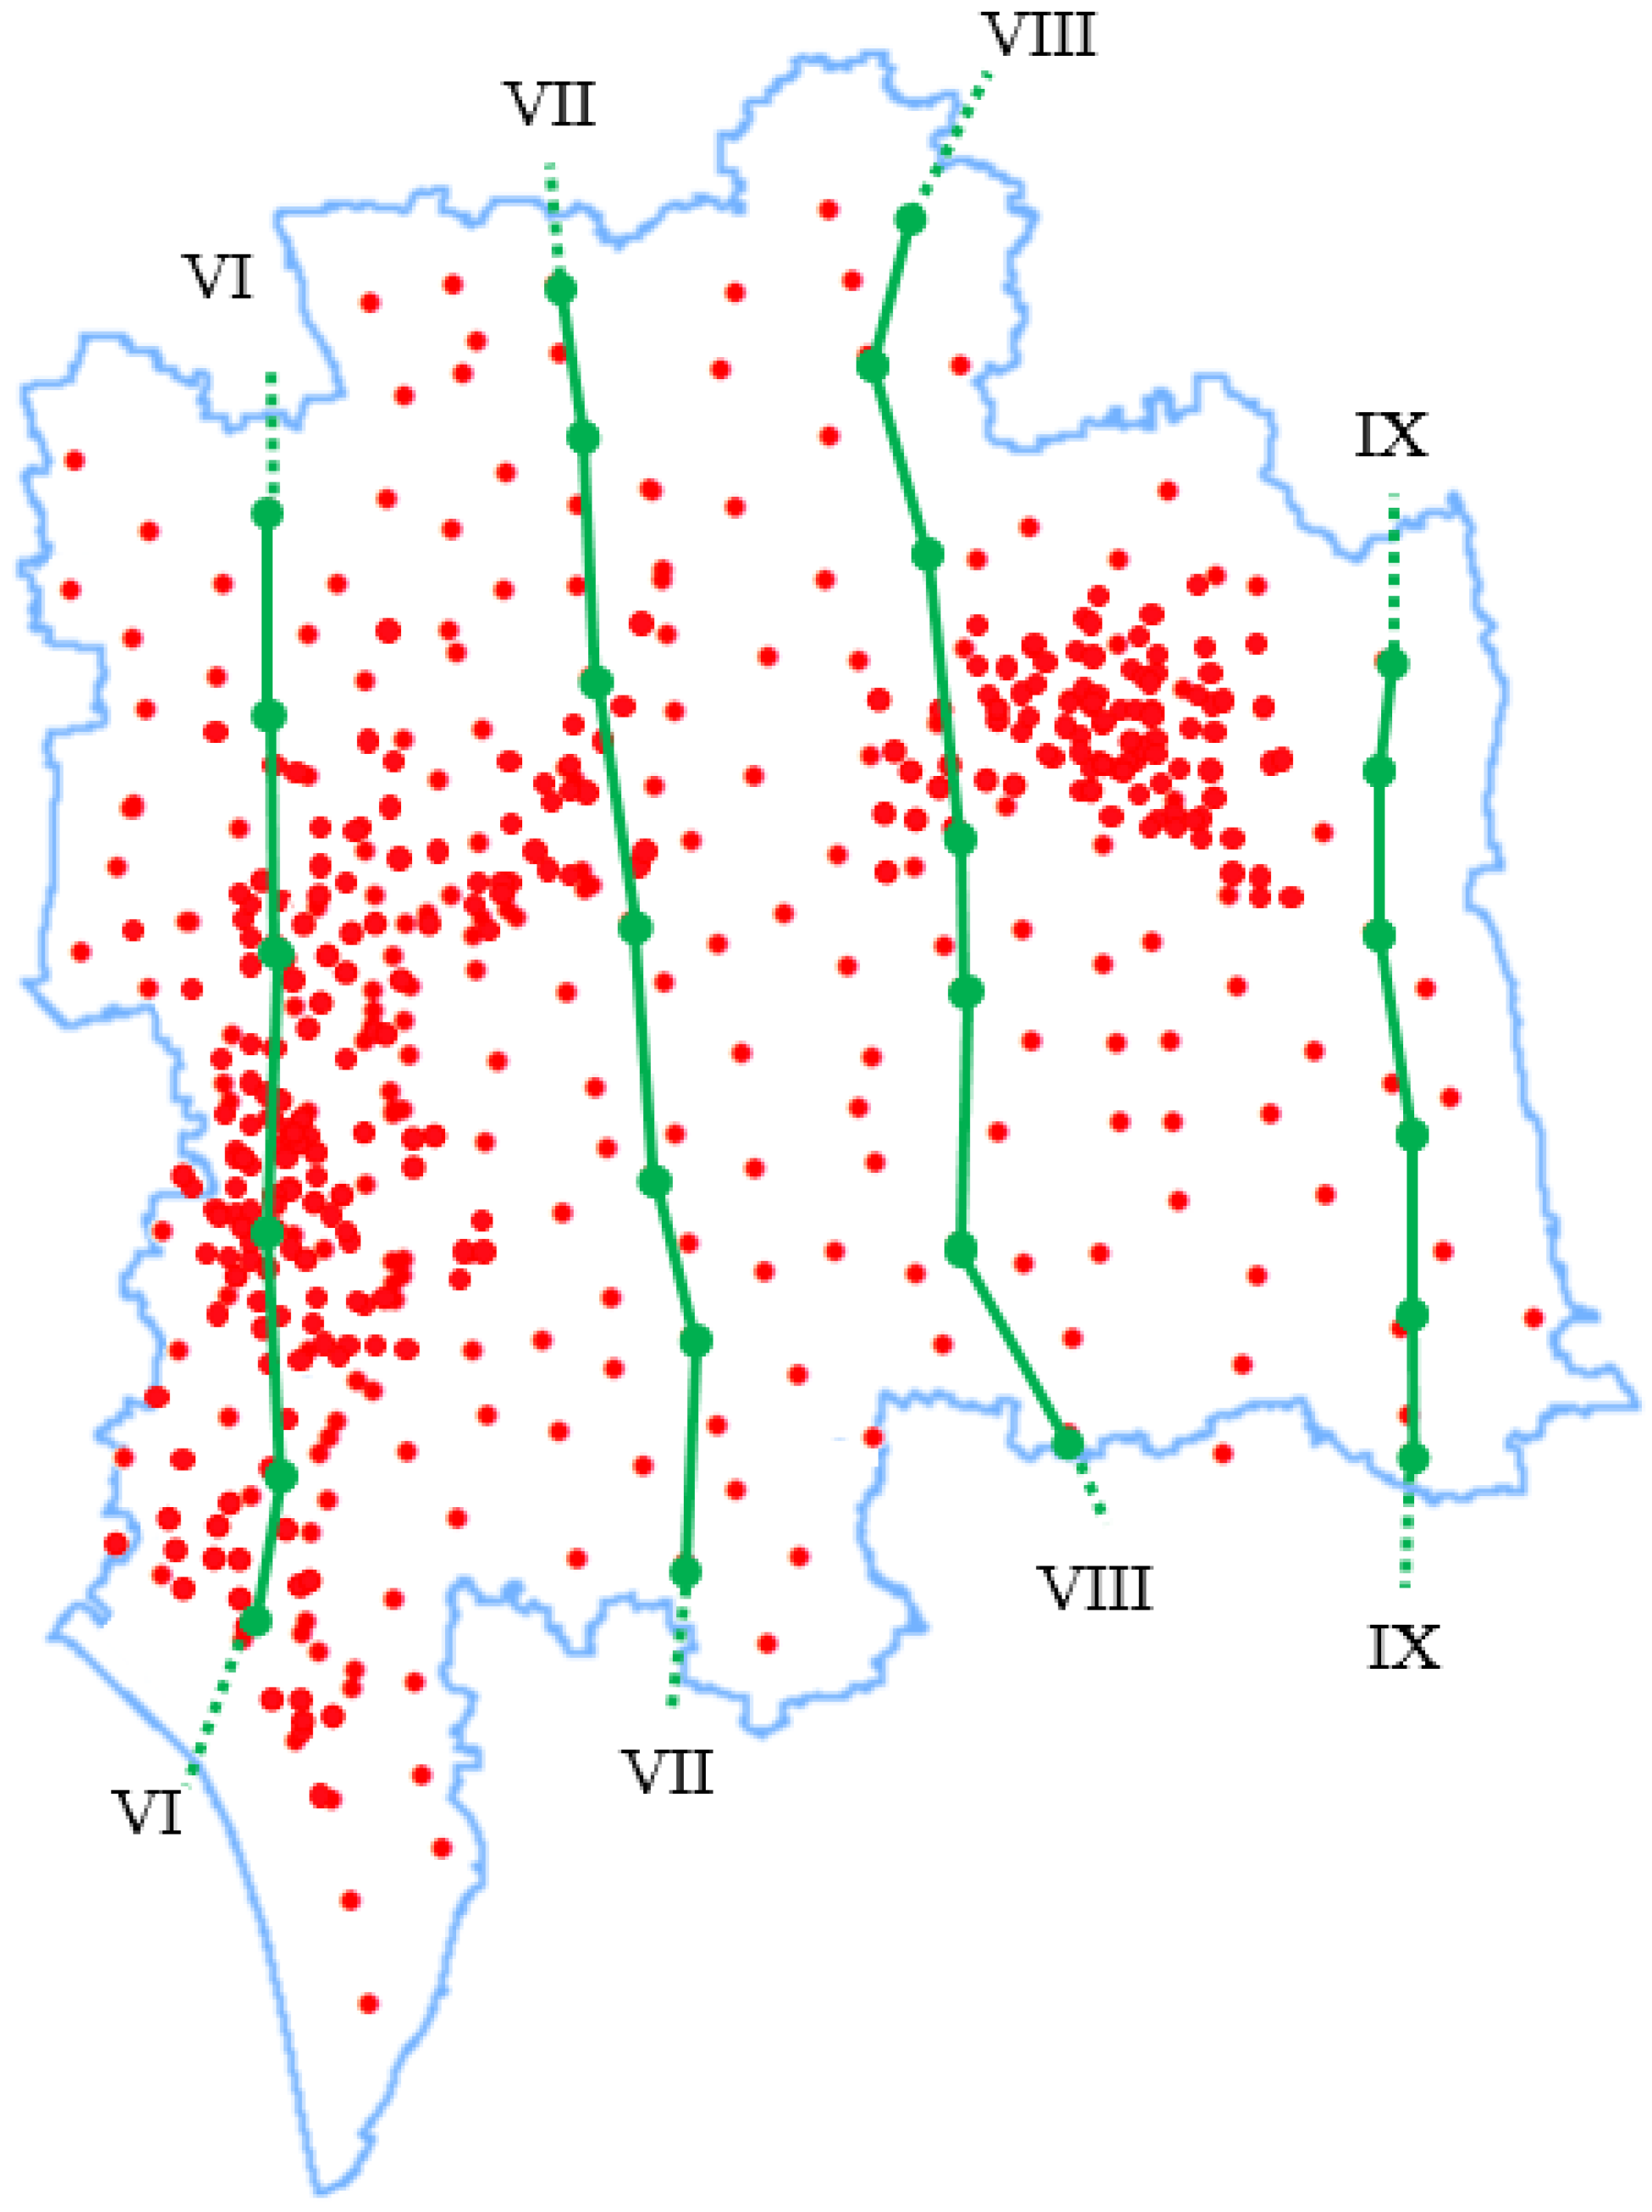
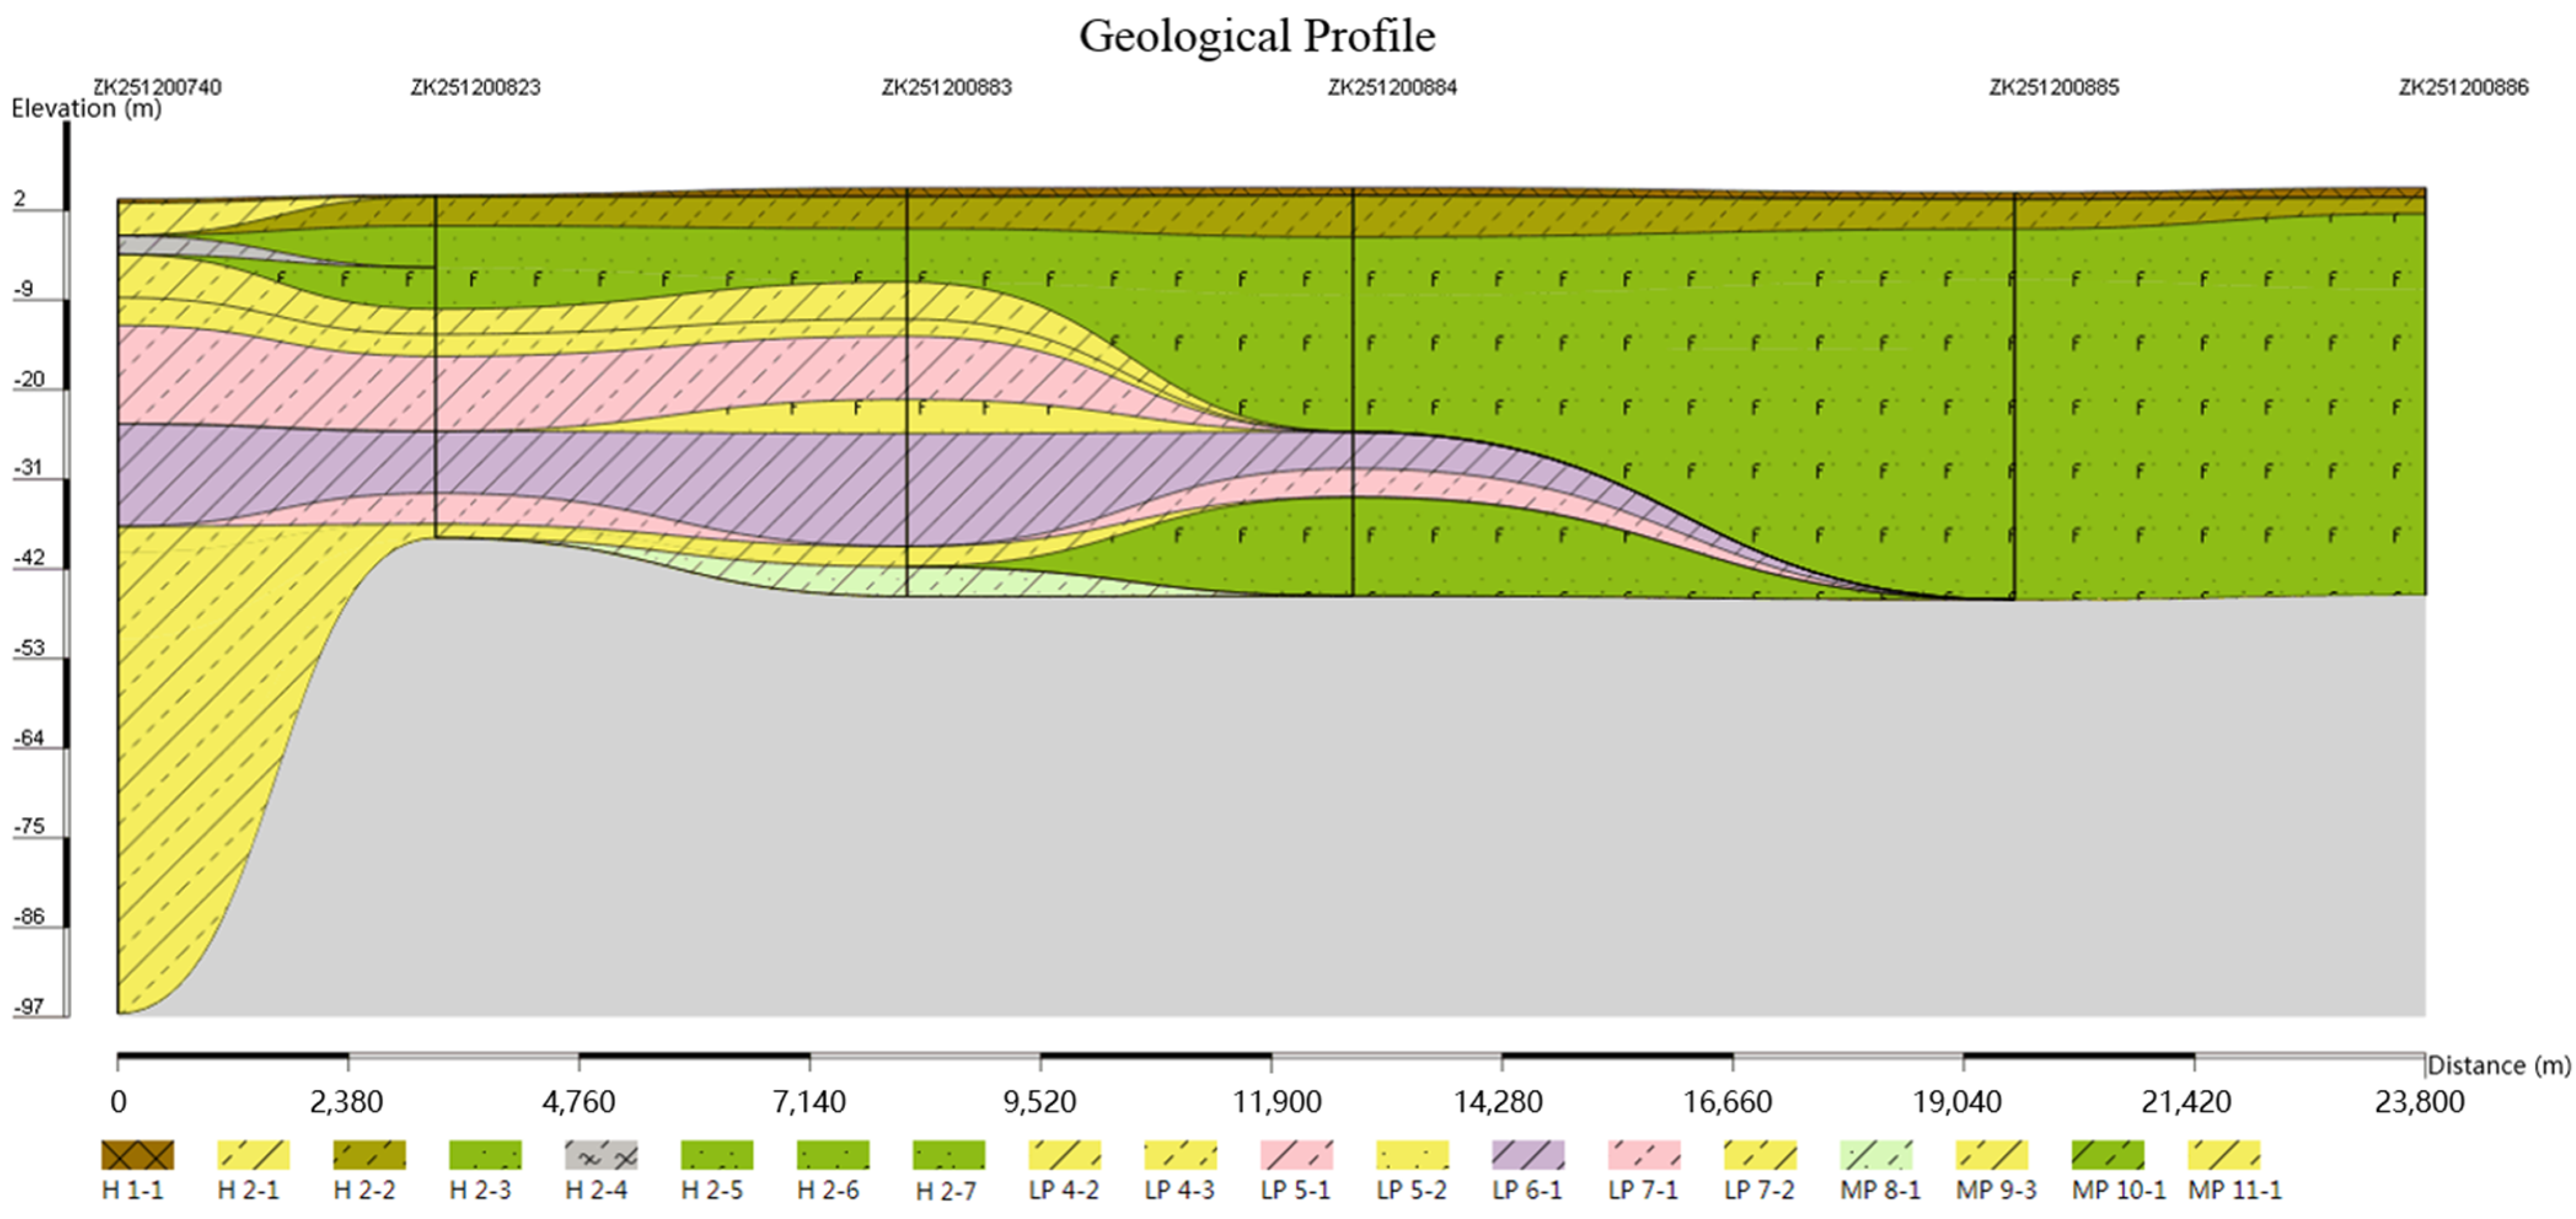
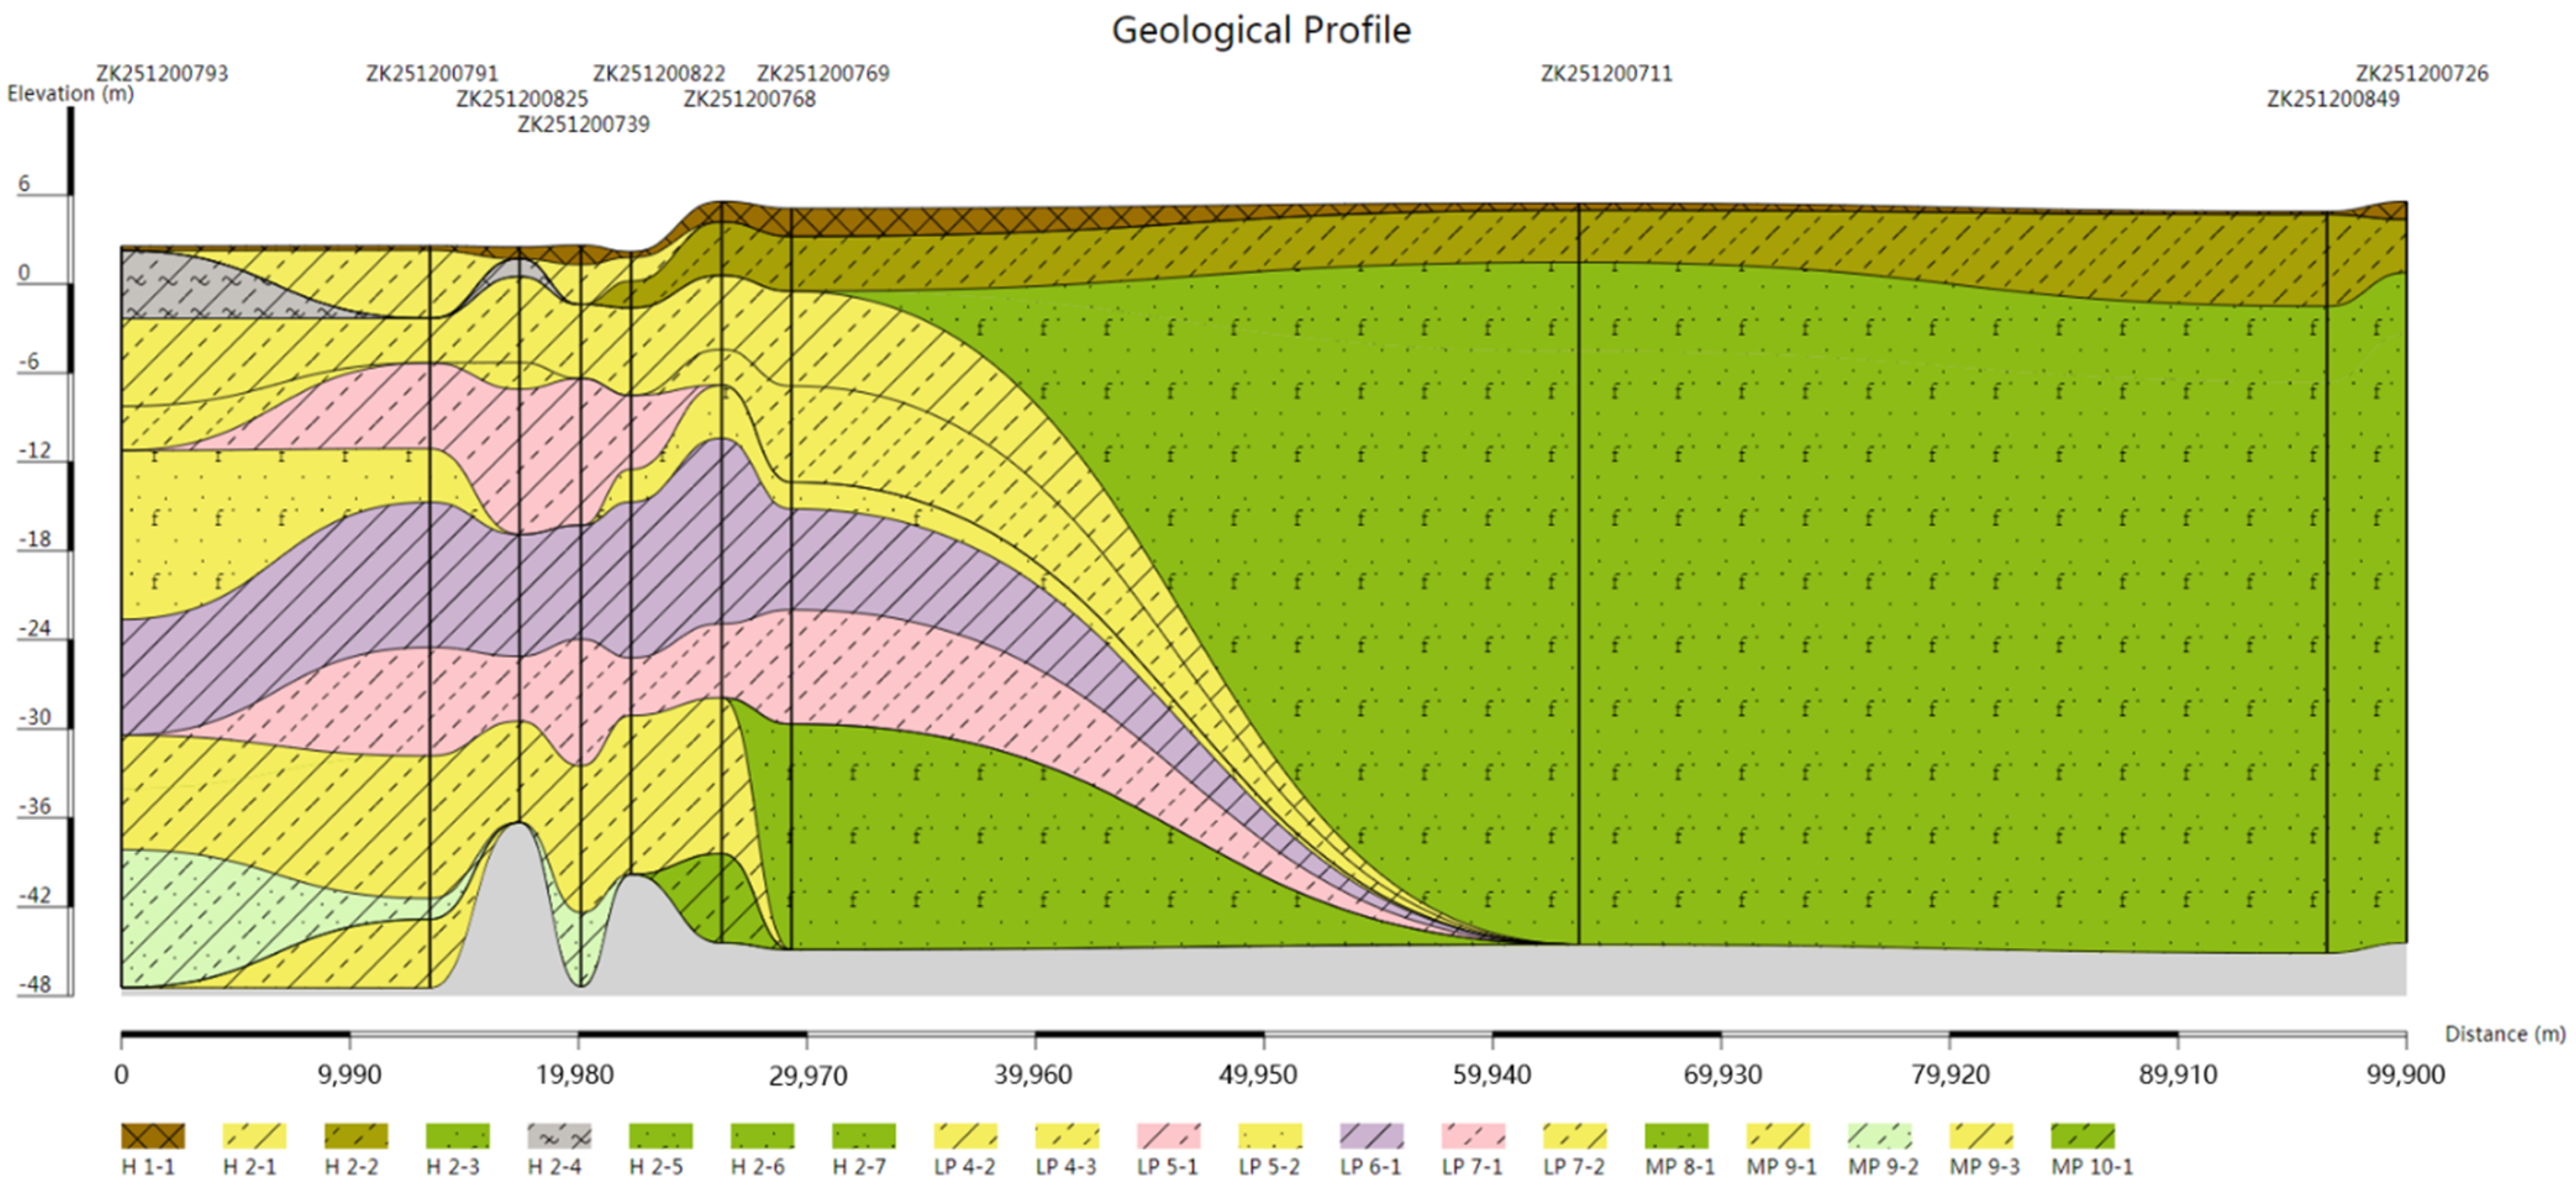
According to the north-south oriented geological profiles shown in Figure 12 (profile VI to profile IX, Figure 13), from west to east in Figure 13, Figure 14, Figure 15 and Figure 16 the proportion of silty sand first decreases and then increases, and its pinch-out line moves southward and then northward. On the basis of Figure 8, the pinch-out line of the silt stratum in this area is roughly U-shaped (with the convex side facing south).
A typical profile map of the Lixiahe Plain–Yangtze River Delta floodplain is selected for observation. Figure 17 also presents a north-south geological profile. From left to right, corresponding to the map from north to south, the lithological units gradually taper out, whereas the silt unit is greatly expanding.
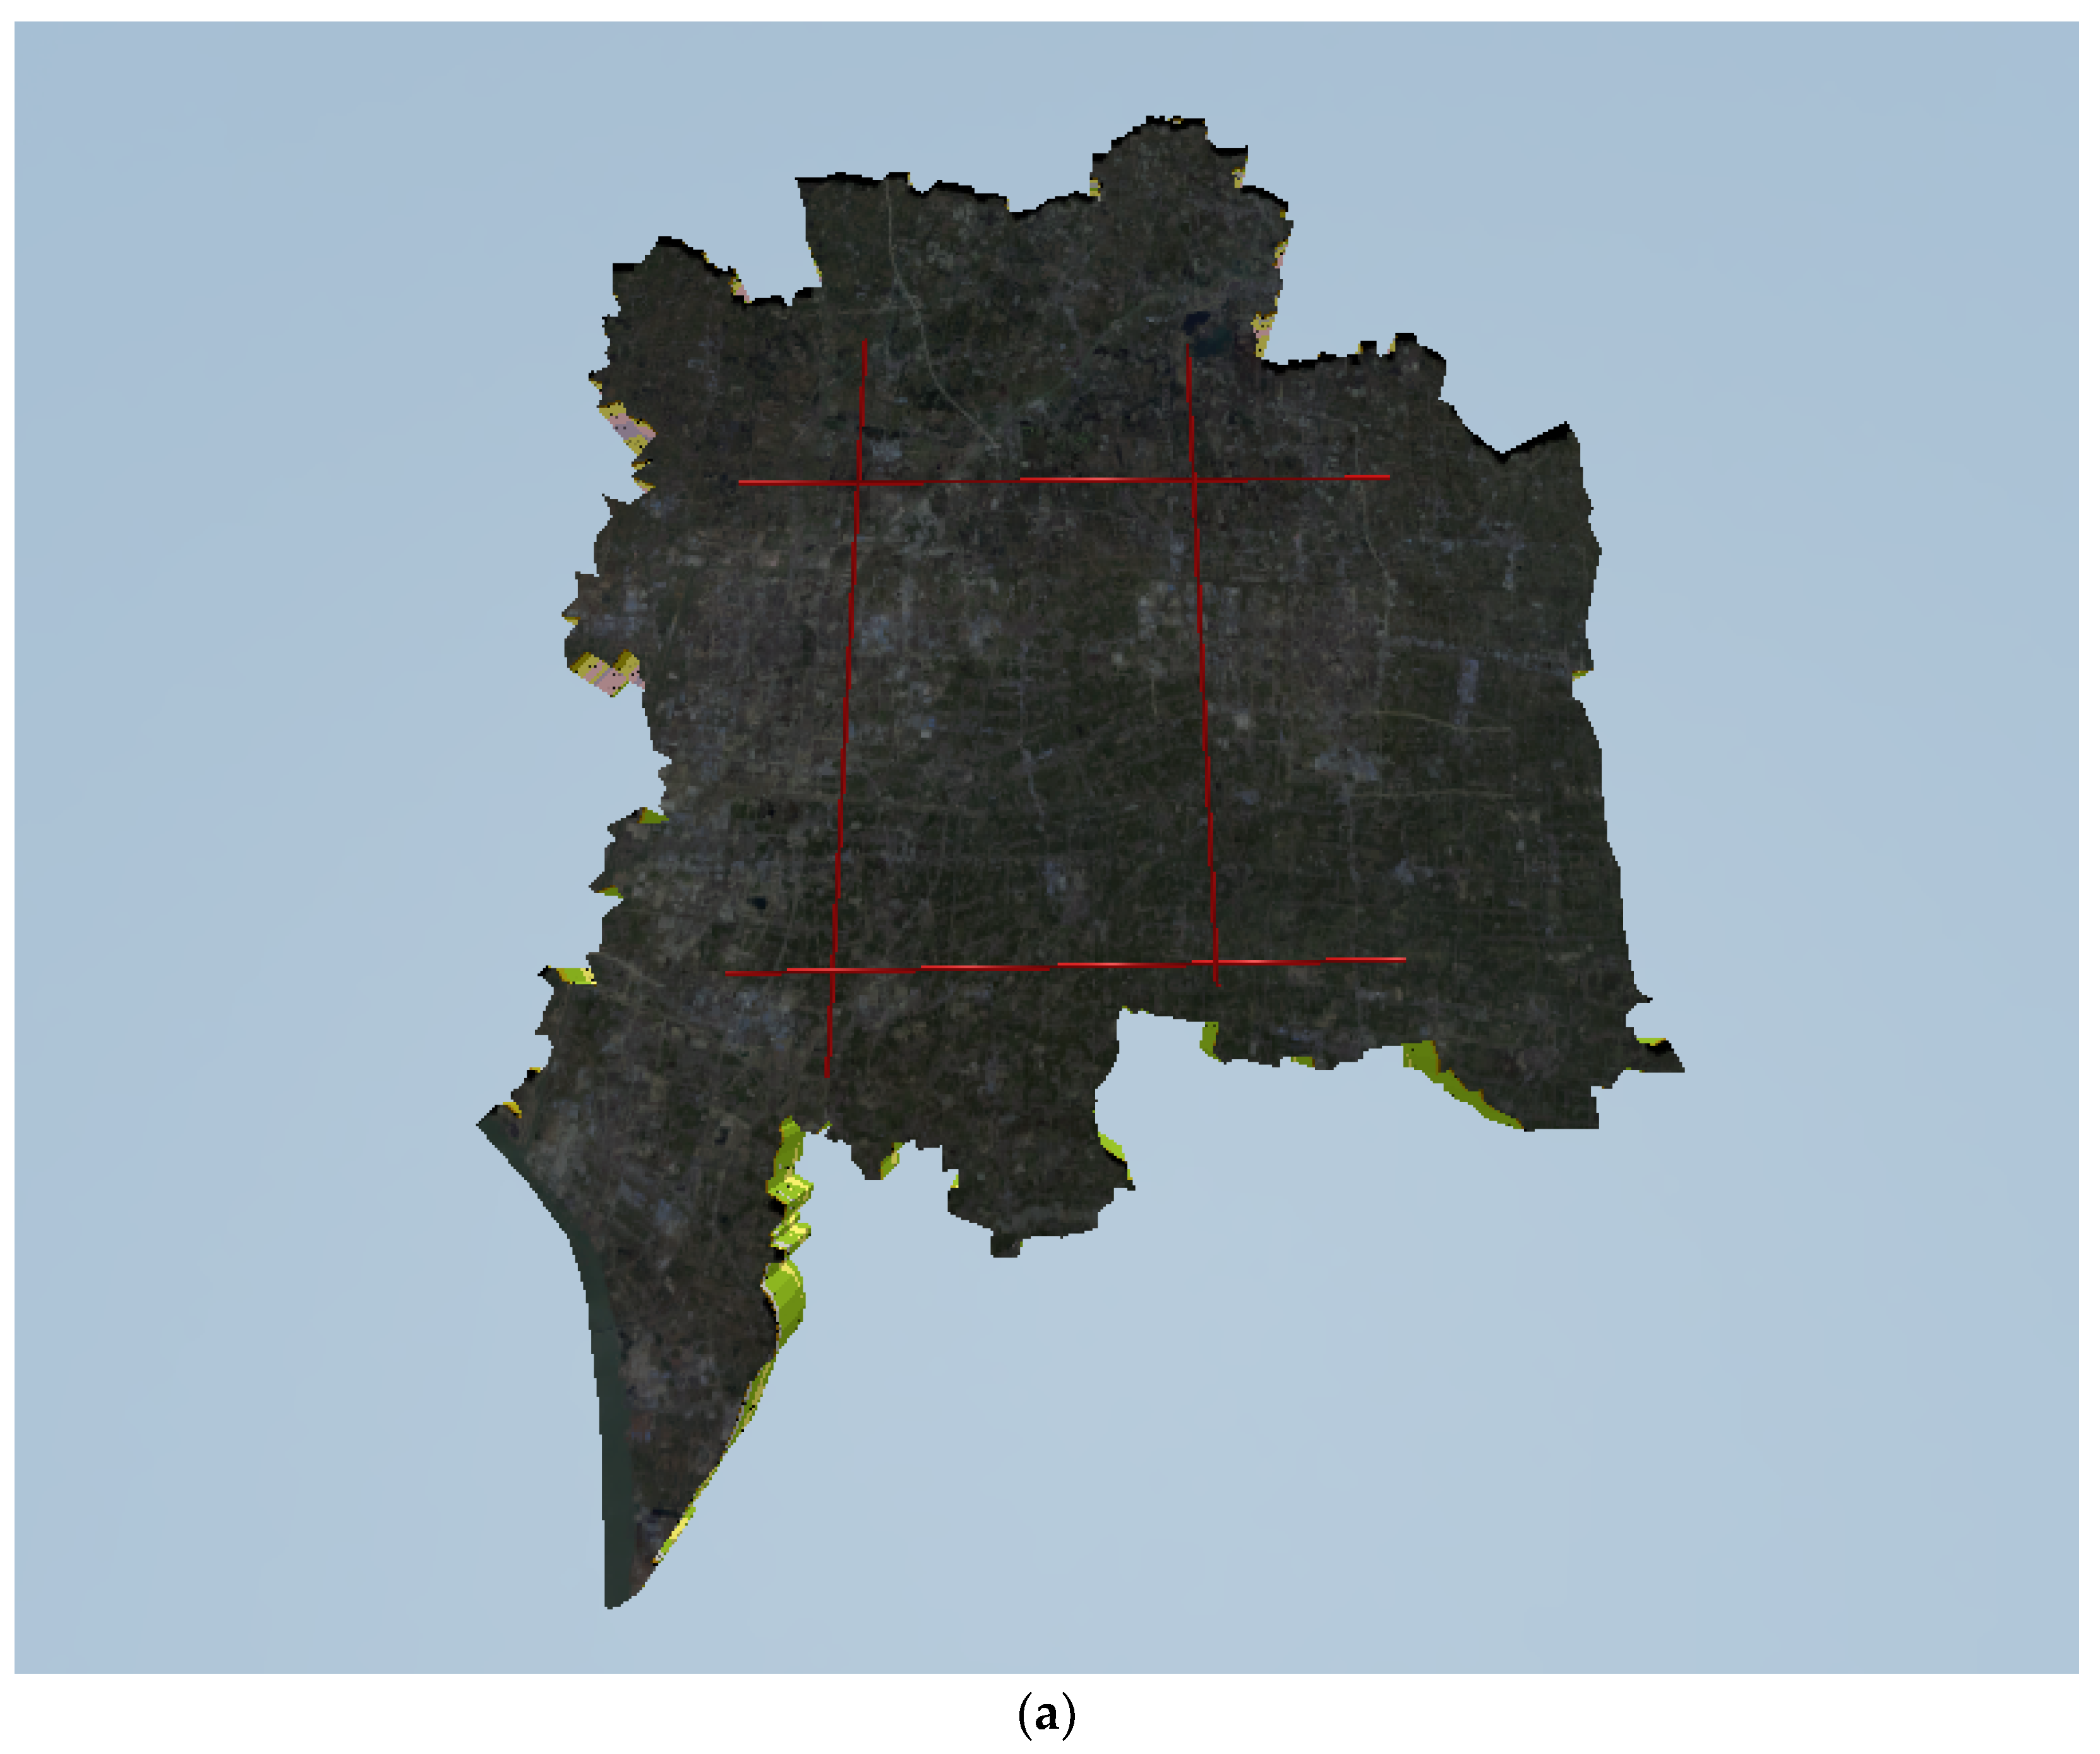
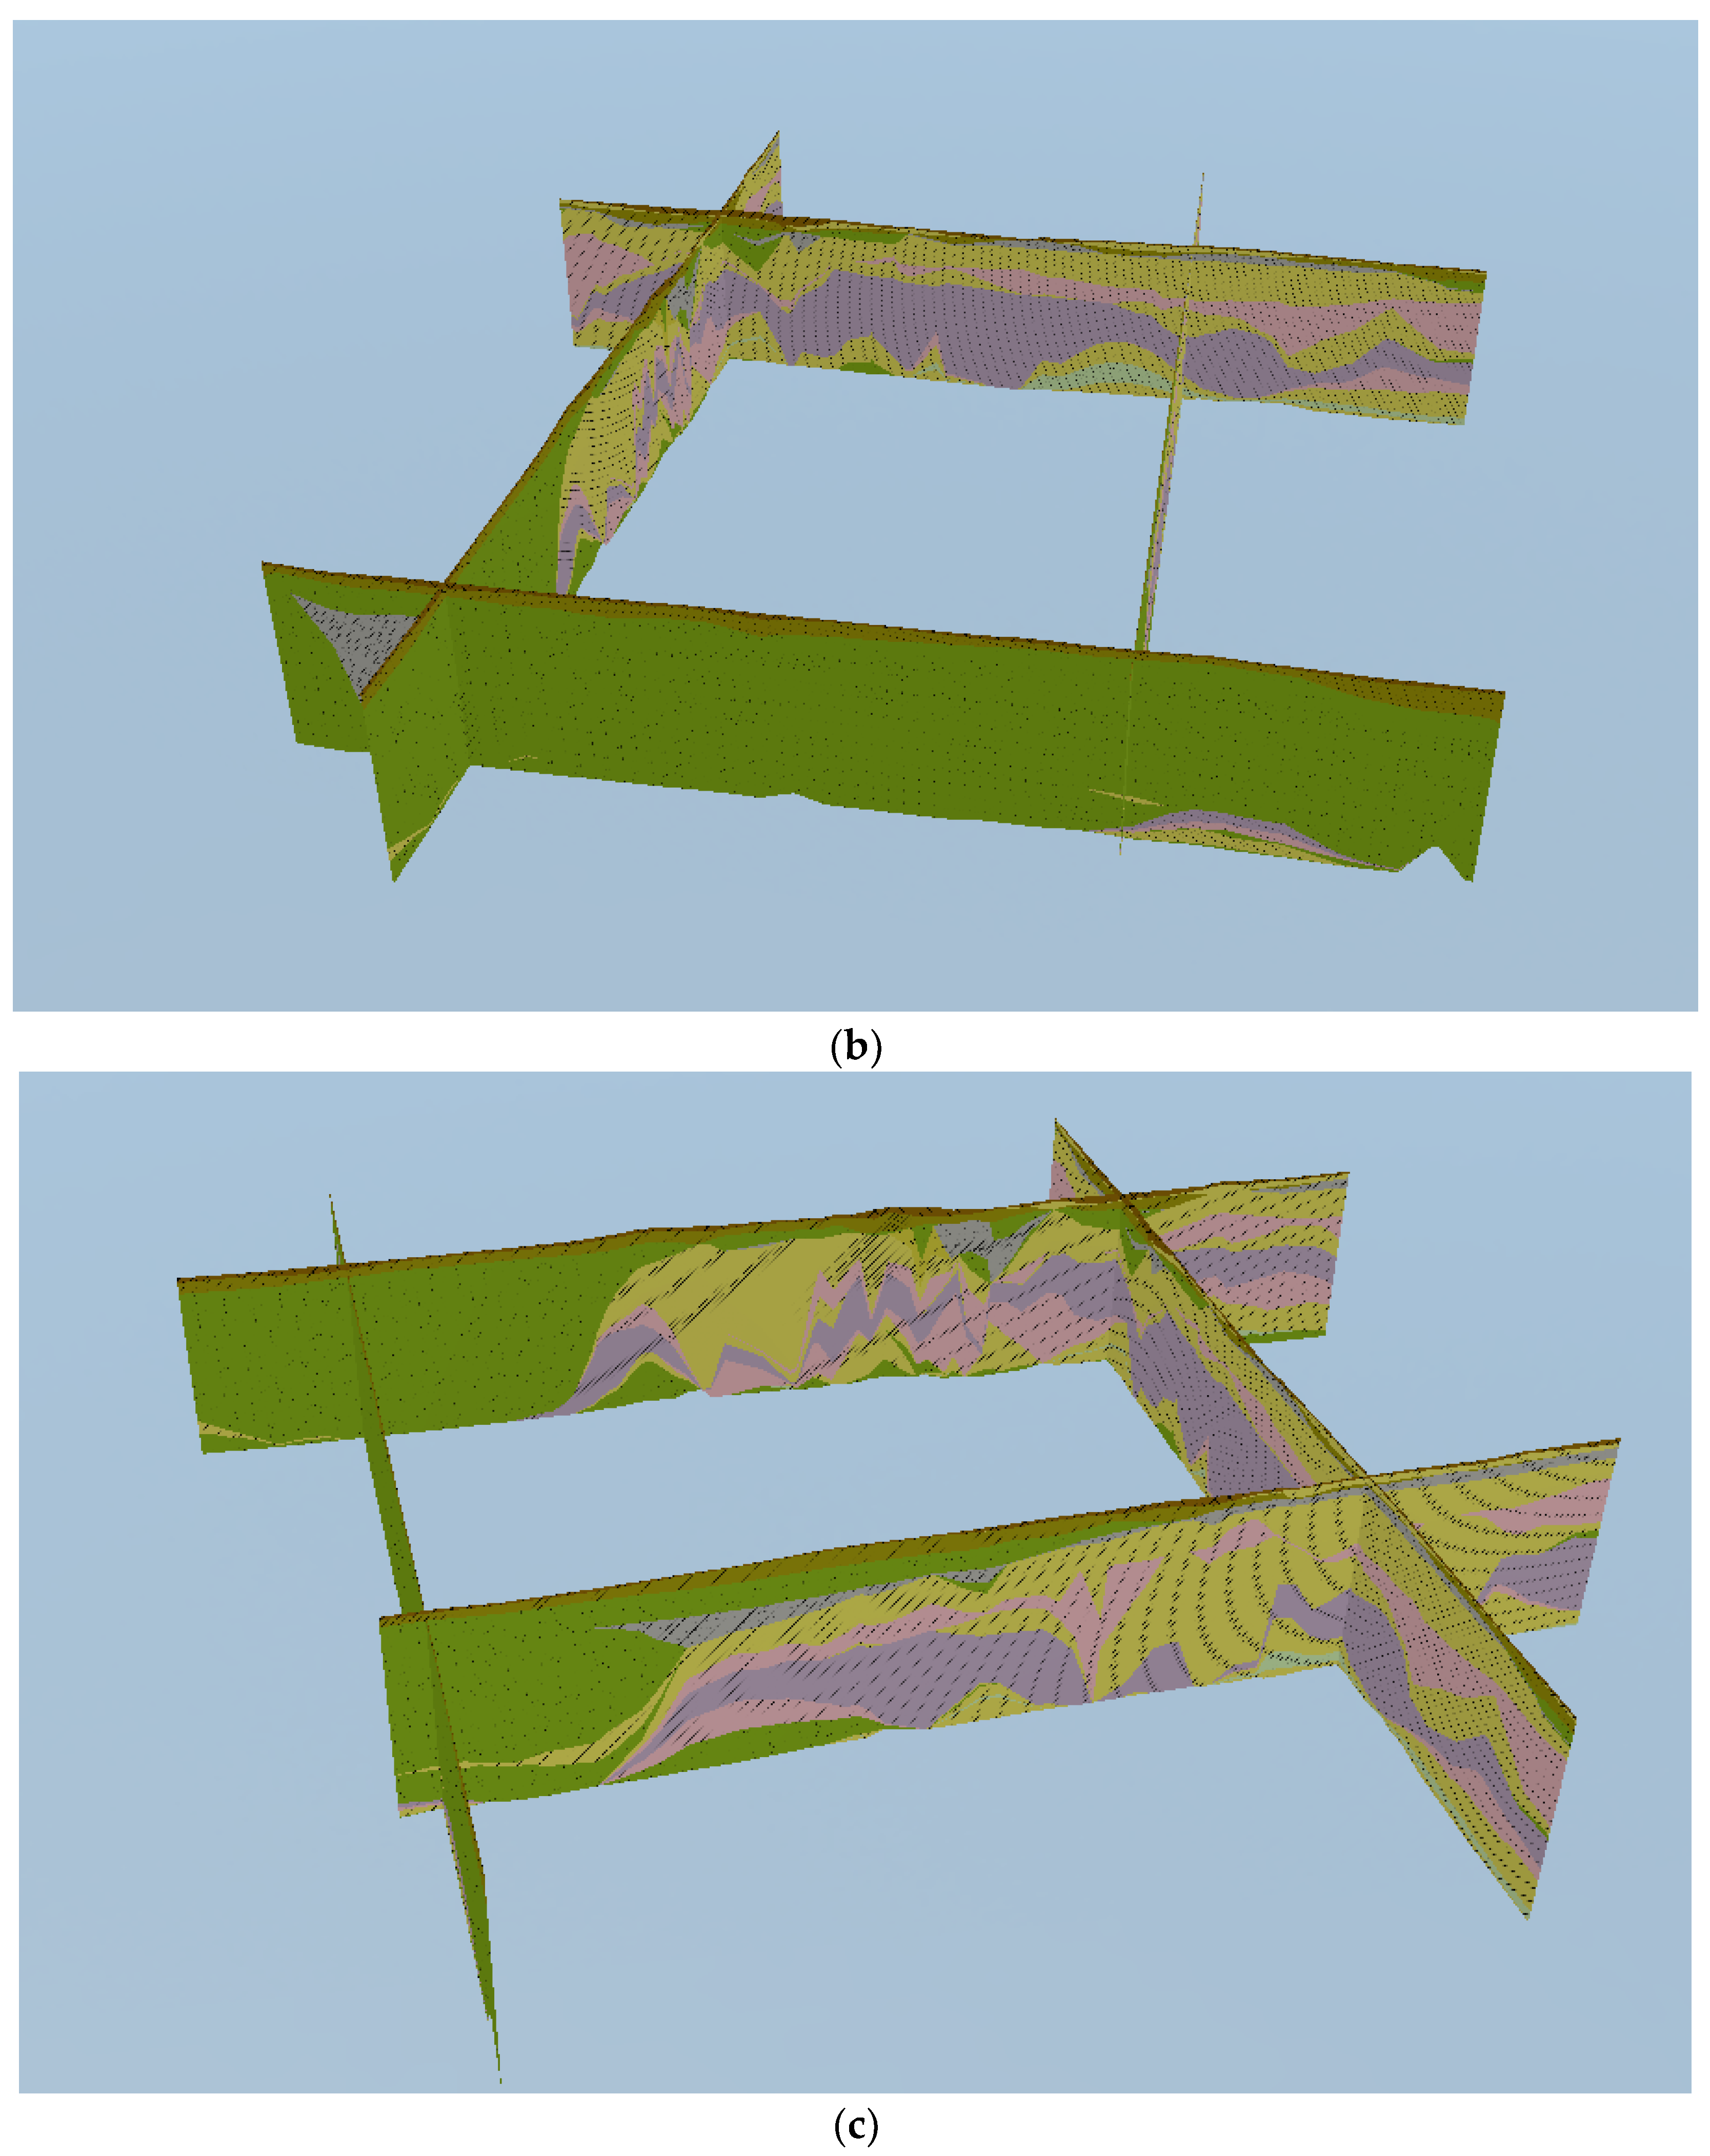
In the Figure 18b,c, four geological transects are generated from the 3D geological model of this area. Compared to that of previous geological profiles (Figure 8 through Figure 11 and Figure 13 through Figure 16), the pinch-outs and the stratum distribution is very similar to the 3D geological model, while the 3D transects’ lines are not exactly the same with the geological profile lines. This means that the unique path method is successful to some extent.

3.3. Comparison and Analysis

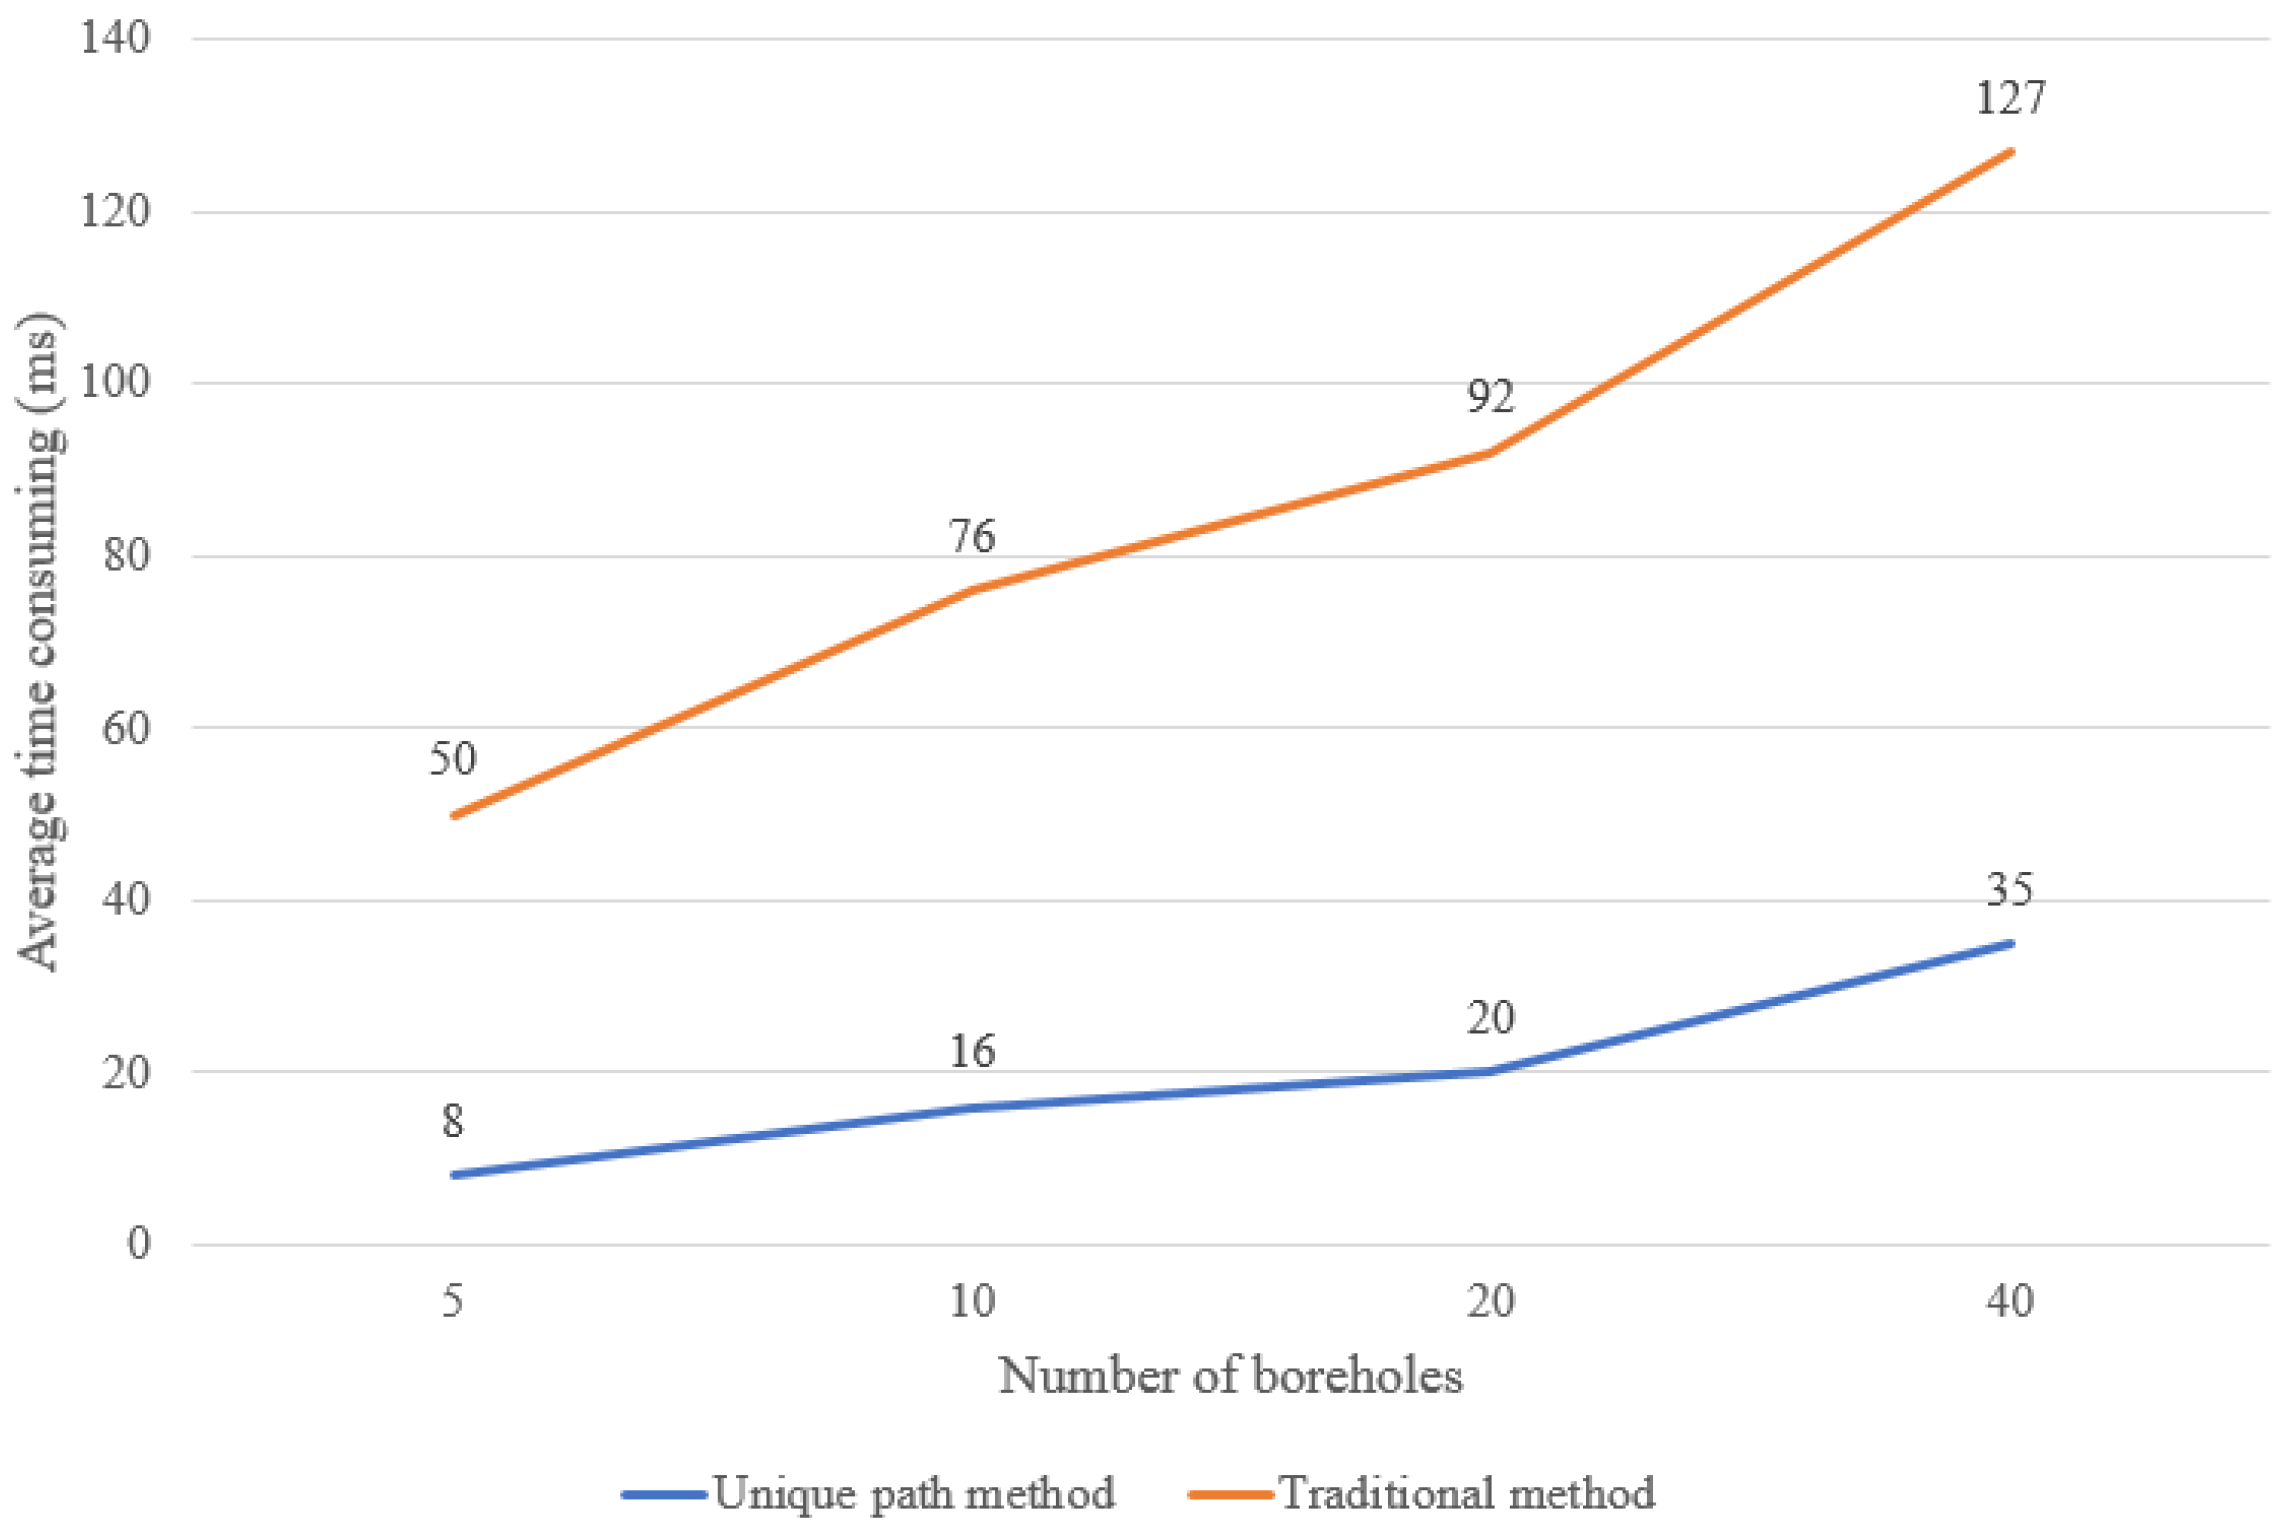
The processing speed of the proposed method is compared with that of existing methods, as shown in Table 4 and Figure 19, revealing that the overall speed of the proposed method is greatly improved. Since a geological section does not contain too many boreholes, a large enough number 40 is select as the maximum number of drilled holes.
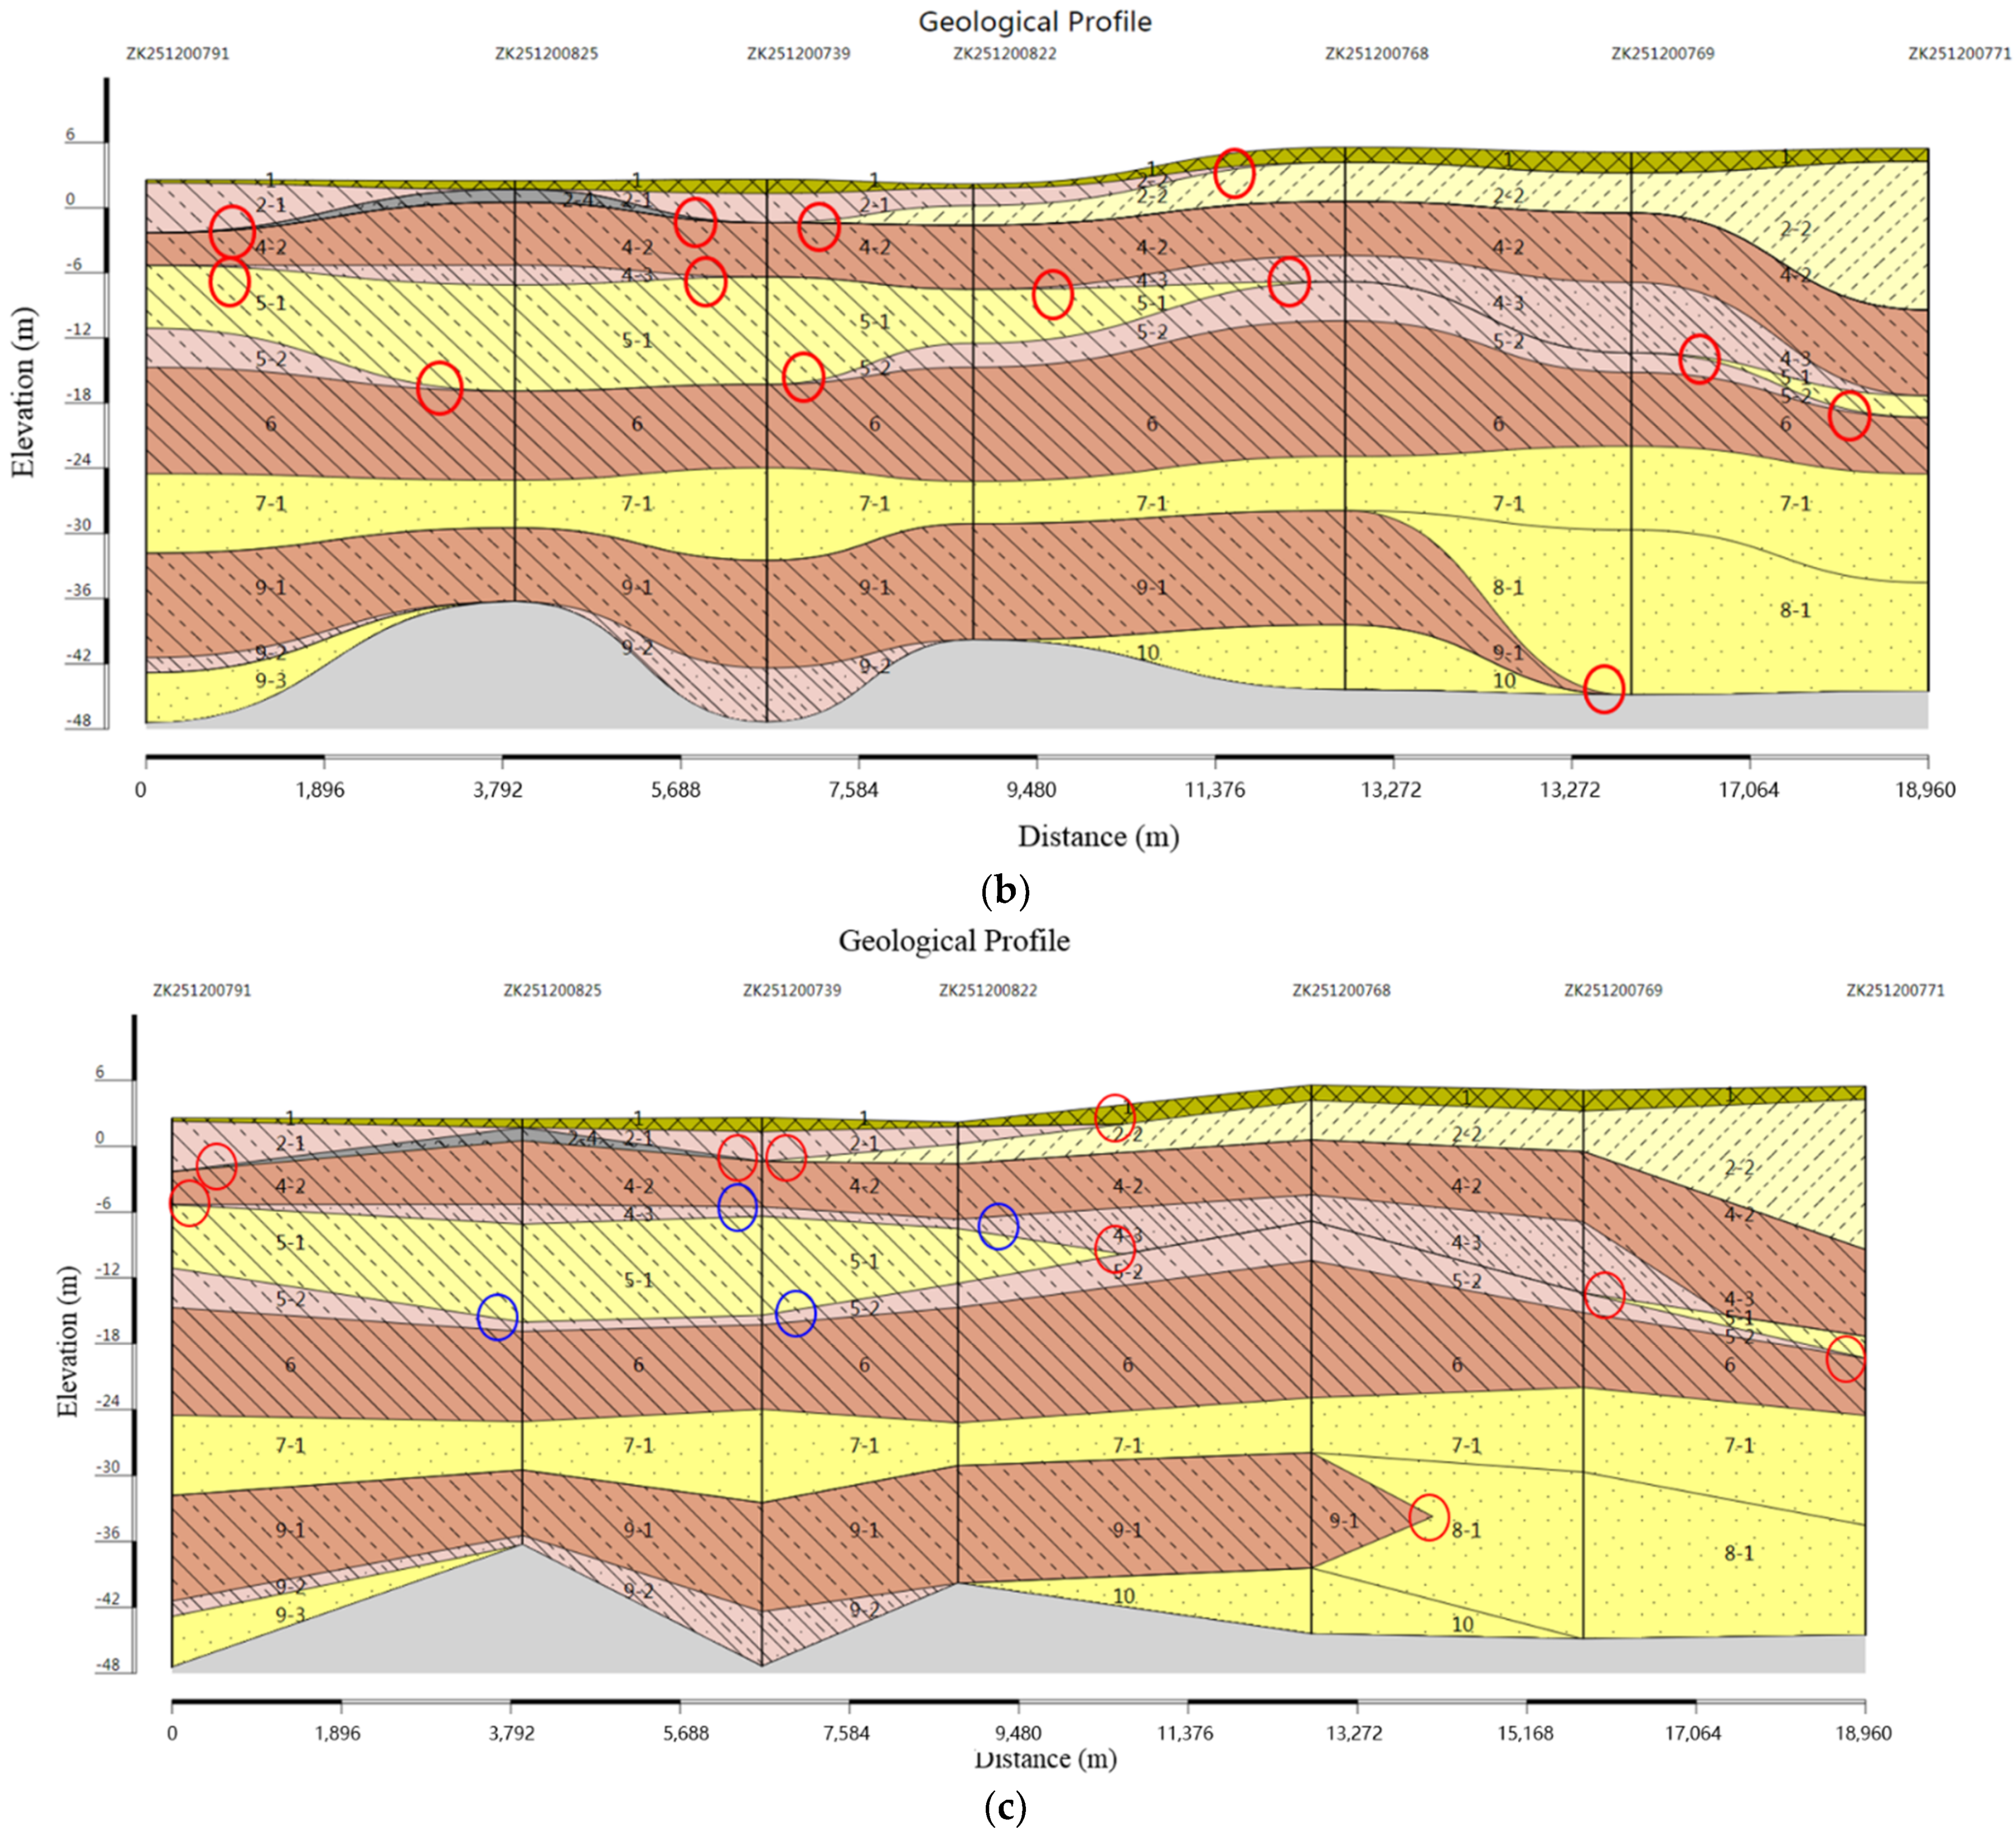
By the borehole data through the abovementioned procedures, a corresponding geological profile, with pinch-out geometries, can be drawn. In this paper, the geological profile from ZK251200791 to ZK251200771 shown in Figure 20 is adapted (the fill characteristics of some strata are changed for convenience) and compared with that of the geological profiles, which is availability, drawn with hand by empirical experts (as illustrated in Figure 20a) and traditional methods in the teaching book (as illustrated in Figure 20b) while all getting the same drilling data. The geological profile drawn by the unique path method in Figure 20c is very similar to that of Figure 20a drawn on the basis of experience, and pinch-out phenomena are accurately plotted at the locations of pinch-outs to be investigated. The pinch-out locations to be investigated are marked with red circles in the figures, whereas blue circles indicate pinch-out locations that are incorrectly plotted. In contrast, the unique path method based on a unified stratigraphic sequence plots pinch-outs with higher accuracy than the traditional methods.
The equation used to calculate the degree of strata matching on the basis of borehole data is
D = C T
where D is degree of stratum matching, C is number of profile lines correctly divided, and T is total number of profile lines. In this paper, degree D can be seen as the accuracy of measuring the performance of different methods.
Taking Figure 20a as the control group, the degree of stratum matching among the control boreholes in Figure 20c reaches 100%, and the degree of stratum matching between boreholes reaches 98.39%. The profile drawn based on the unified stratigraphic sequence method and the profile drawn by professionals based on experience have a high degree of matching with regard to the formation lithologies, pinch-out lines, and boundary depths, indicating that the unified stratigraphic sequence method exhibits good accuracy and reliability. Comparatively speaking, in the geological profile shown in Figure 20b drawn by the traditional method, although the degree of matching among the control boreholes in the control group can reach 100%, between boreholes the degree of stratum matching reaches only 85.71%. Therefore, compared with that of the traditional method, the unique path method based on a unified stratigraphic sequence has higher accuracy.
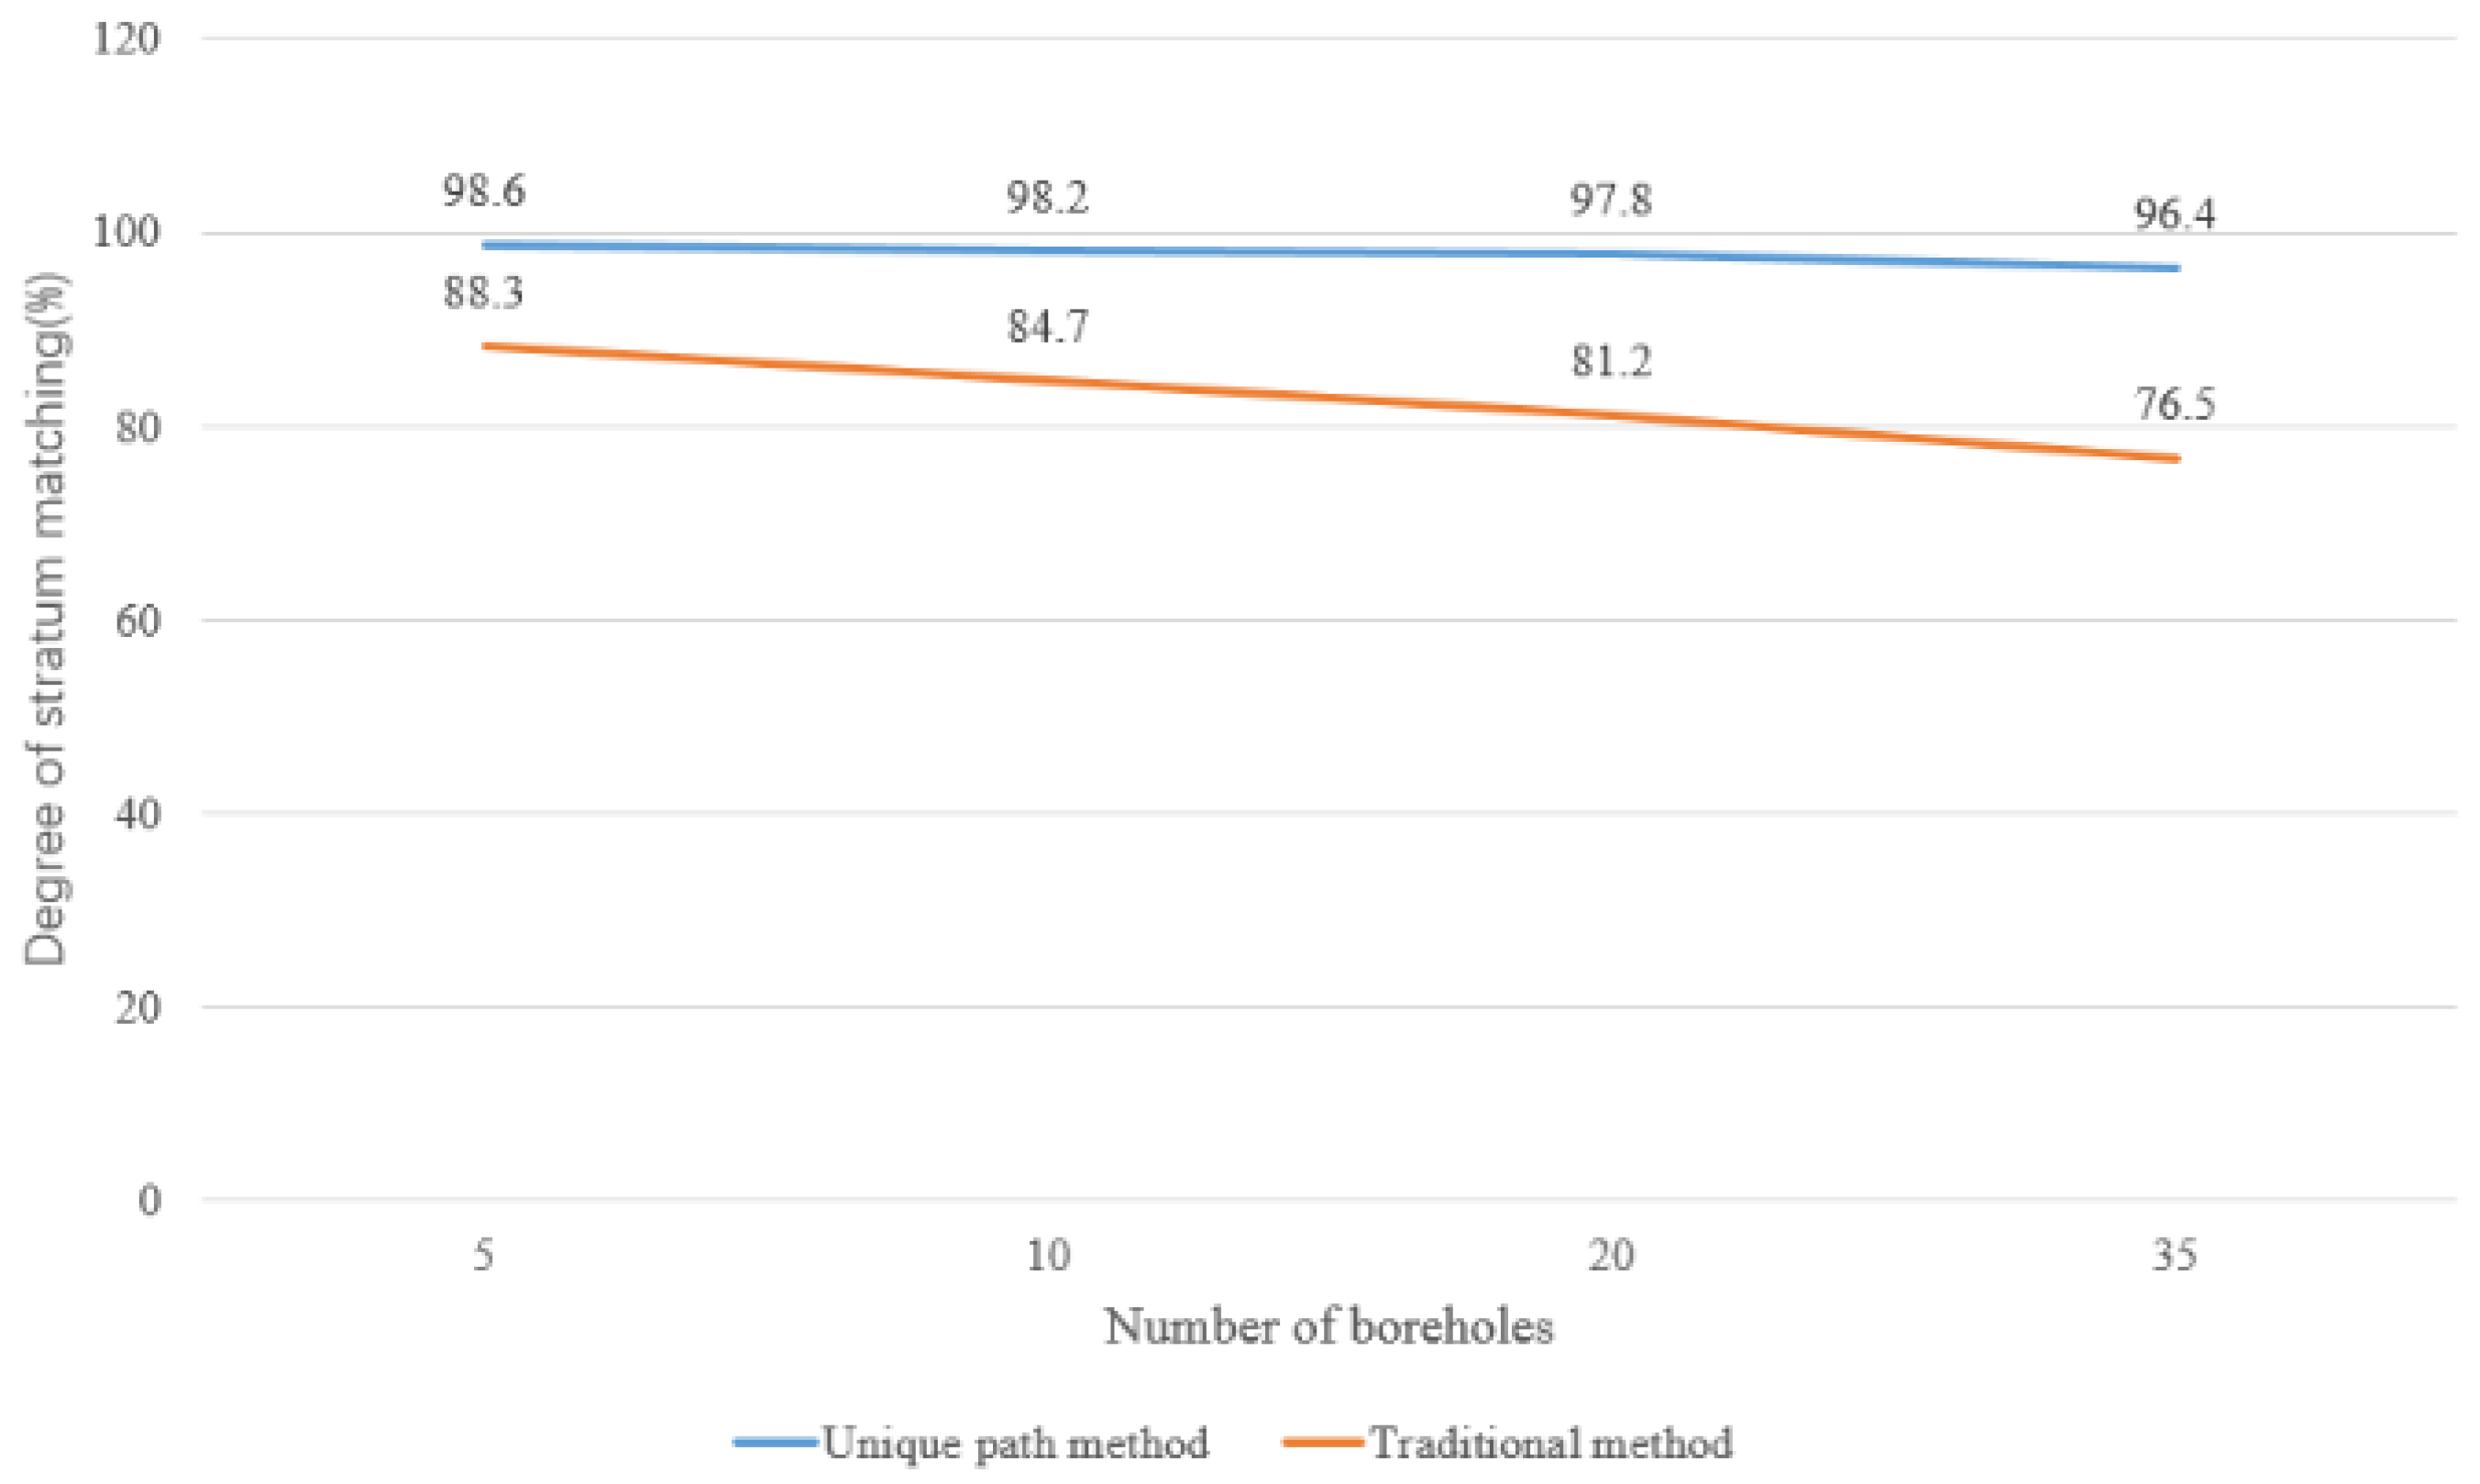
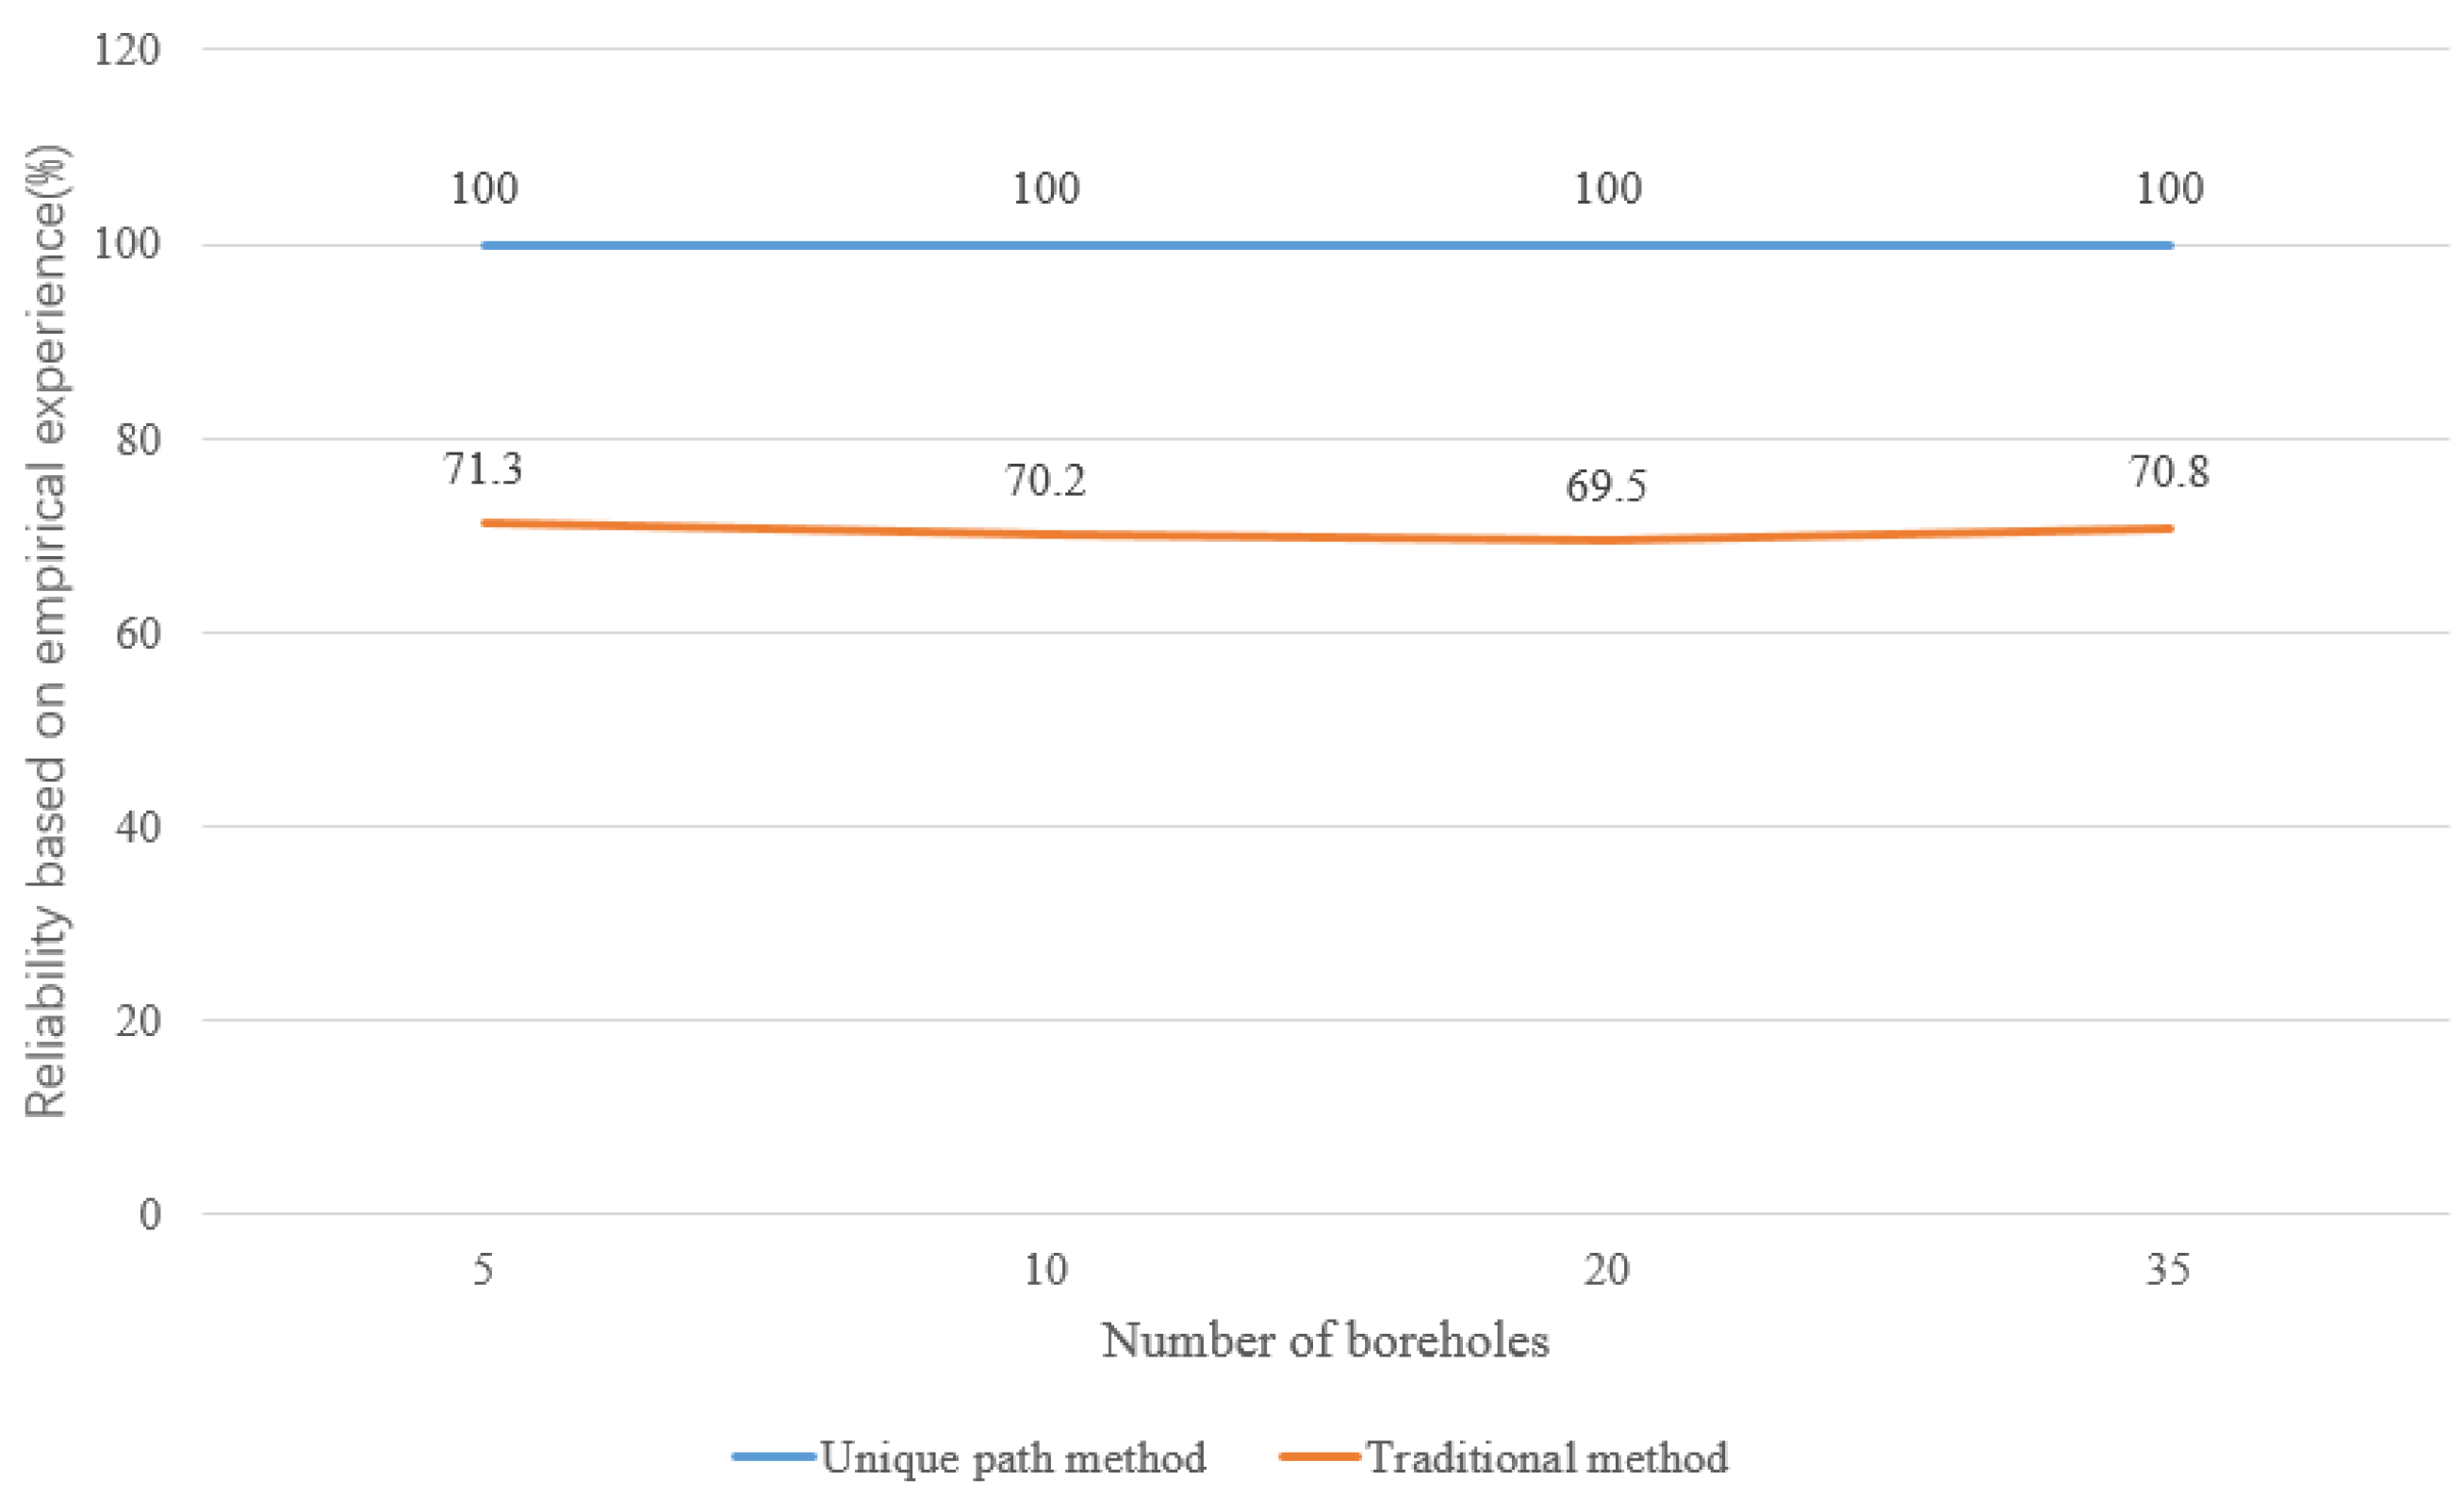
As shown in Table 5, a comparison between the unique path method and the traditional method in drawing geological profiles with pinch-out reveals that the degree of stratum matching of the latter is low, and the matching degree of the former with regard to the stratum lithology is high. The traditional method produces straight-line formation boundaries, making it difficult to simulate real formation boundaries. However, the cubic Bessel curve selected by the unique path method is more in accordance with the profiles plotted according to experience. Moreover, the pinch-out points of the traditional method are relatively fixed because the middle position between boreholes is selected, while the unique path method draws the pinch-out location with higher accuracy for the choice of control points as show under the Equation (5). The reliability based on empirical experience means the percentage of draw success for pinch-outs. In this respect, the unique path method is more reliable than the traditional method. Furthermore, the traditional method needs to calculate more projection points and control points, as well as branch paths, making it slower than the unique path method, which requires fewer data, and thus, it is computationally faster. In addition, the traditional method considers each pinch-out separately, and as a result, it is not highly adaptable; in contrast, the unique path method considers all pinch-outs under a unified framework, making it more flexible than the traditional approach. As shown in Figure 21 and Figure 22, the unique path method performs better than traditional method while dealing different numbers of boreholes.
The results indicate that the method proposed in this paper effectively simplifies the complexity of drawing pinch-out in geological profile and guarantees a higher degree of match. The speed of the method proposed in this paper was also improved compared with that of the methods proposed previously by other researchers [35]. Especially when processing large amounts of borehole data, the high-speed method proposed in this paper has better applicability. Experiments confirm that the pinch-out processing method used in this article is reliable. Using the proposed method to draw geological profiles will enable people to not only quickly explore the geological conditions of an area, but also clearly understand the occurrence of geological pinch-outs. The method proposed in this paper realizes the unified drawing of four discontinuous geological profiles, and thus, has strong utility and application value.

4. Conclusions

  • Traditional geological profile drawing methods are complex because of too many branches and little consideration of pinch-outs. Aiming at this problem, this paper proposes a unique path method based on a unified stratigraphic sequence to draw pinch-out profiles based on the principle that pinch-out manifest in cartography as explicit or implicit boundaries. This method can accurately draw the cusp if the data pattern meets the requirements of pinch-out in the method no matter what depositional environment is. The influence of other depositional conditions on the sequence was considered in the unified stratigraphic sequence method. This method avoids the problem in which the traditional method produces an excessive number of branch paths, reduces the complexity of drawing pinch-out in geological profiles, and achieves high-speed and accurate rendering, which can meet the requirements of modern geological profile drawing standards;
  • The method was successfully applied to an example in the interaction between marine and continental deposition. A comparison of the results with the profiles drawn by experts and traditional methods demonstrates that the unique path method can accurately draw pinch-outs. The unique path method based on a unified stratigraphic sequence greatly improves the rendering speed without reducing the accuracy. Using this method proposed in this paper, a geological map containing pinch-outs was drawn for an engineering project, and the geological situation of the area was discussed according to geological profiles of the area, thereby showing that the unique path method is highly reliable in the actual operation process;
  • The method is shown to be relatively reliable, as it uses a relatively simple way to plot pinch-out in four discontinuous distributions, and the technique can be extended to the drawing of inverted strata. This method achieves high-speed rendering without reducing the accuracy, and thus, can better meet the requirements of modern geological profile drawing standards than existing methods. This method has the potential to be applied to urban geological and oil and gas drilling platforms due to its good performance in large and complex geological area, but it needs to be evaluated whether it can really adapt to different geological environments.

Author Contributions

Conceptualization, Z.L. and C.Z.; methodology, Z.L.; software, X.W.; validation, Z.L., J.L. and W.M.; formal analysis, C.Z.; investigation, Z.L.; resources, Z.L.; data curation, X.W.; writing—original draft preparation, Z.L. and X.W.; writing—review and editing, C.Z.; visualization, X.W.; supervision, C.Z.; project administration, Z.L.; funding acquisition, Z.L. and C.Z. All authors have read and agreed to the published version of the manuscript.

Funding

This research was funded by National Key Research and Development Program of China, grant number 2017YFC1501203, 2017YFC1501201; the National Natural Science Foundation of China (NSFC), grant number 41530638, 41977230; Key Project of Applied Science & Technology Research and Development of Guangdong Province, China, grant number 2016B010124007; Science and Technology Youth Top-Notch Talent Project of Guangdong Special Support Program, grant number 2015TQ01Z344 and Guangzhou Science and Technology Project, grant number 201803030005.

Data Availability Statement

Not applicable.

Conflicts of Interest

The authors declare no conflict of interest.

References

  1. Seidler, L.; Steel, R. Pinch-out style and position of tidally influenced strata in a regressive–transgressive wave-dominated deltaic sandbody, Twentymile Sandstone, Mesaverde Group, NW Colorado. Sedimentology 2001, 48, 399–414. [Google Scholar] [CrossRef]
  2. Graciansky, P.C.D. Sequence stratigraphy on the Northwest European margin. Mar. Petrol. Geol. 1996, 13, 974. [Google Scholar] [CrossRef]
  3. Al-Rahim, A.M. Locating of promising stratigraphic traps of pinch-out type in Iraq—New sense. Arab. J. Geosci. 2013, 6, 1381–1393. [Google Scholar] [CrossRef]
  4. Gardner, R.L.; Piazolo, S.; Daczko, N.R. Pinch and swell structures: Evidence for strain localisation by brittle—Viscous behaviour in the middle crust. Solid Earth 2015, 6, 1045–1061. [Google Scholar] [CrossRef] [Green Version]
  5. Santolaria, P.; Vendeville, B.C.; Graveleau, F.; Soto, R.; Casas-Sainz, A. Double evaporitic décollements: Influence of pinch-out overlapping in experimental thrust wedges. J. Struct. Geol. 2015, 76, 35–51. [Google Scholar] [CrossRef]
  6. Basilone, L. Mesozoic tectono-sedimentary evolution of the Trapanese South-ern Tethyan margin (NW Sicily) integrating facies and stratigraphic analysis with sub-sidence history. Ital. J. Geosci. 2020, 139, 54–75. [Google Scholar] [CrossRef]
  7. Basilone, L.; Lena, G.; Gasparo-Morticelli, M. Synsedimentary-tectonic, soft-sediment deformation and volcanism in the rifted Tethyan margin from the Upper Triassic–Middle Jurassic deep-water carbonates in Central Sicily. Sediment. Geol. 2014, 308, 63–79. [Google Scholar] [CrossRef]
  8. Carminati, E.; Santantonio, M. Control of differential compaction on the geometry of sediments onlapping paleoescarpments: Insights from field geology (Central Apennines, Italy) and numerical modeling. Geology 2005, 33, 353–356. [Google Scholar] [CrossRef]
  9. Cipriani, A.; Zuccari, C.; Innamorati, G.; Marino, M.C.; Petti, F.M. Mass-transport deposits from the Toarcian of the Umbria-Marche-Sabina Basin (Central Italy). Ital. J. Geosci. 2020, 139, 9–29. [Google Scholar] [CrossRef]
  10. Cipriani, A.; Bottini, C. Early Cretaceous tectonic rejuvenation of an Early Jurassic margin in the Central Apennines: The “Mt. Cosce Breccia”. Sediment. Geol. 2019, 387, 57–74. [Google Scholar] [CrossRef]
  11. Cipriani, A.; Bottini, C. Unconformities, neptunian dykes and mass-transport deposits as an evidence for Early Cretaceous syn-sedimentary tectonics: New insights from the Central Apennines. Ital. J. Geosci. 2019, 138, 333–354. [Google Scholar] [CrossRef]
  12. Cipriani, A.; Fabbi, S.; Lathuilière, B.; Santantonio, M. A reef coral in the con-densed Maiolica facies on the Mt. Nerone pelagic carbonate platform (Marche Apennines): The enigma of ancient pelagic deposits. Sediment. Geol. 2019, 385, 45–60. [Google Scholar] [CrossRef]
  13. Santantonio, M. Facies associations and evolution of pelagic carbonate plat-form/basin systems: Examples from the Italian Jurassic. Sedimentology 1993, 40, 1039–1067. [Google Scholar] [CrossRef]
  14. Assis, C.A.M.; Ceia, M.A.R.; Misságia, R.M.; Lupinacci, W.M. Mapping fluid distribution in a pinch-out reservoir model: A physical modeling study. J. Appl. Geophys. 2014, 109, 313–322. [Google Scholar] [CrossRef]
  15. Tao, S.; Yuan, X.; Hou, L.; Zhang, G.; Gao, C. Formation and distribution of large lithologic-stratigraphic oil & gas fields (provinces). J. Nat. Gas Geosci. 2018, 3, 51–65. [Google Scholar]
  16. Gilles, L.; Serge, B.; Hugues, F. Seaward pinching out and internal stratigraphy of the Gironde incised valley on the shelf (Bay of Biscay). Mar. Geol. 2001, 175, 183–197. [Google Scholar]
  17. Olsen, T.R.; Steel, R.J. Shoreface Pinch-Out Style on the Front of the Brent delta in the Easterly Tampen Spur Area; Norwegian Petroleum Society Special Publications: Stavanger, Norway, 1995; Volume 5, pp. 273–289. [Google Scholar]
  18. Peters, M.; Berger, A.; Herwegh, M.; Regenauer-Lieb, K. Strain localization in ductile rocks: A comparison of natural and simulated pinch-and-swell structures. Tectonophysics 2016, 680, 140–154. [Google Scholar] [CrossRef]
  19. Cipriani, A.; Caratelli, M.; Santantonio, M. Geological mapping reveals the role of Early Jurassic palaeogeography in the distribution of shallow water-derived calci-turbidites: New insights from the Central and Northern Apennines. Basin Res. 2020, 32, 1485–1509. [Google Scholar] [CrossRef]
  20. Chen, J.H.; Zhou, Z.Y.; Chen, G.; Gu, D.S. Automatic formation method of prospecting line profile map based on drill hole database. J. Cent. South Univ. Technol. (Nat. Sci.) 2005, 3, 486–490. [Google Scholar]
  21. Stawikowski, W. Structural Geology, 2nd ed.; Geologos: Poznan, Poland, 2017; p. 23. [Google Scholar]
  22. Levoy, M. Display of surfaces from volume data. IEEE Comput. Graph. 1988, 8, 29–37. [Google Scholar] [CrossRef] [Green Version]
  23. Jia, R.; Liu, B.; Fu, X.; Gong, L.; Liu, Z. Transformation Mechanism of a Fault and Its Associated Microstructures in Low-Porosity Rocks: A Case Study of the Tanan Depression in the Hailar-Tamtsag Basin. J. Mar. Sci. Eng. 2019, 7, 286. [Google Scholar] [CrossRef] [Green Version]
  24. Zhu, X.G. Geometry of Ore Body; China University of Mining and Technology Press: Xuzhou, China, 1987. [Google Scholar]
  25. Kimberley, M.M. Cross Sections and Volume Measurement of Stratigraphic Units. Microcomput. Appl. Geol. 1990, 161–169. [Google Scholar] [CrossRef]
  26. Wu, L. Topological relations embodied in a generalized tri-prism (GTP) model for a 3D geoscience modeling system. Comput. Geosci. 2004, 30, 405–418. [Google Scholar] [CrossRef]
  27. Ichoku, C.; Chorowicz, J.; Parrot, J.F. Computerized construction of geological cross sections from digital maps. Comput. Geosci. 1994, 20, 1321–1327. [Google Scholar] [CrossRef]
  28. Zhou, C.Y.; Du, Z.C.; Ouyang, J.W.; Zhang, Z.L.; Liu, Z. A 3D geological model and cutting algorithm based on a vertically projected triangulated network. Comput. Geosci. 2020, 143, 104562. [Google Scholar] [CrossRef]
  29. Mallet, J.L. {GOCAD}: A Computer-Aided Design Program for Geological Applications; Springer: Berlin, Germany, 1992. [Google Scholar]
  30. Zhou, C.Y.; Ouyang, J.W.; Ming, W.H.; Zhang, G.; Liu, Z. A Stratigraphic Prediction Method Based on Machine Learning. Appl. Sci. 2019, 9, 3553. [Google Scholar] [CrossRef] [Green Version]
  31. Xu, T.; Li, F.; Wu, Z.; Wu, C.; Gao, E.; Zhou, B.; Zhang, Z.; Xu, G. A successive three-point perturbation method for fast ray tracing in complex 2D and 3D geological models. Tectonophysics 2014, 627, 72–81. [Google Scholar] [CrossRef]
  32. Salvo, C.D.; Mancini, M.; Cavinato, G.P.; Moscatelli, M.; Simionato, M.; Stigliano, F.; Rea, R.; Rodi, A. A 3D Geological Model as a Base for the Development of a Conceptual Groundwater Scheme in the Area of the Colosseum (Rome, Italy). Geosciences 2020, 10, 266. [Google Scholar] [CrossRef]
  33. Liu, Z.; Zhang, Z.L.; Zhou, C.Y.; Ming, W.H.; Du, Z.C. An Adaptive Inverse-Distance Weighting Interpolation Method Considering Spatial Differentiation in 3D Geological Modeling. Geosciences 2021, 11, 51. [Google Scholar] [CrossRef]
  34. Chen, H.Q. Decision thinking for the northern demarcation line of Yangtzi River Delta. J. Zhejiang North Univ. (Nat. Sci.) 2004, 27, 76–79. [Google Scholar]
  35. Yang, L. The research and implementation on automaticmapping system of geological plane/section map. Cent. South Univ. 2013, 80. [Google Scholar] [CrossRef]
Figure 1. Principle of proposed unique path method based on a unified stratigraphic sequence.
Geosciences 11 00251 g001
Figure 2. Schematic diagram of unified stratigraphic sequence method.
Geosciences 11 00251 g002
Figure 3. Examples of explicit and implicit boundaries for same lithological stratum. (a) Explicit boundaries; (b) implicit boundaries.
Geosciences 11 00251 g003
Figure 4. Steps for drawing a pinch-out profile based on a unified stratigraphic sequence.
Geosciences 11 00251 g004
Figure 5. Stratigraphic distribution map and structural zoning map and distribution map of boreholes in study area.
Geosciences 11 00251 g005
Figure 6. Geological profile I and its location. (a) Borehole locations and line connecting boreholes; (b) Geological profile I corresponding to drilling line I in (a) by unique path method (legend text corresponds to Table 2).
Geosciences 11 00251 g006
Figure 7. Borehole locations and lines connecting boreholes along east-west oriented geological profiles.
Geosciences 11 00251 g007
Figure 8. Geological profile II corresponding to drilling line II in Figure 7 by unique path method.
Geosciences 11 00251 g008
Figure 9. Geological profile III corresponding to drilling line III in Figure 7 by unique path method.
Geosciences 11 00251 g009
Figure 10. Geological profile IV corresponding to drilling line IV in Figure 7 by unique path method.
Geosciences 11 00251 g010
Figure 11. Geological profile V corresponding to drilling line V in Figure 7 by unique path method.
Geosciences 11 00251 g011
Figure 12. Borehole locations and lines connecting boreholes along south–north geological profiles.
Geosciences 11 00251 g012
Figure 13. Geological profile VI corresponding to drilling line VI in Figure 12 by unique path method.
Geosciences 11 00251 g013
Figure 14. Geological profile VII corresponding to drilling line VII in Figure 12 by unique path method.
Geosciences 11 00251 g014
Figure 15. Geological profile VIII corresponding to drilling line VIII in Figure 12 by unique path method.
Geosciences 11 00251 g015
Figure 16. Geological profile IX corresponding to drilling line IX in Figure 12 by unique path method.
Geosciences 11 00251 g016
Figure 17. Typical geological profile of Lihe Plain and Yangtze River Delta floodplain by unique path method.
Geosciences 11 00251 g017
Figure 18. Grid map of geological transect and its location. (a) Location of four transect; (b) four geological transects north facing observation, (c) four geological transects west facing observation.
Geosciences 11 00251 g018aGeosciences 11 00251 g018b
Figure 19. Comparison of computation time between the two methods with different numbers of boreholes.
Geosciences 11 00251 g019
Figure 20. Comparison of engineering geological profiles drawn by different methods. (a) Engineering geological profile drawn by the empirical experts; (b) engineering geological profile drawn by traditional method, (c) engineering geological profile drawn by unique path method.
Geosciences 11 00251 g020aGeosciences 11 00251 g020b
Figure 21. Comparison of degree of stratum matching between two methods with different numbers of boreholes (lack of uniform evaluation criteria).
Geosciences 11 00251 g021
Figure 22. Comparison of reliability based on empirical experience between two methods with different numbers of boreholes.
Geosciences 11 00251 g022
Table 1. Detailed stratigraphic information.
FormationGroupPeriodSeriesAge from Now (Ma)
Sanduo formationCenozoicLower TertiaryEocene series38.0–50.5
Funing formationCenozoicLower TertiaryPaleocene54.9–65.0
Taizhou formationMesozoicCretaceousUpper65.0–83.0
Pukou formationMesozoicCretaceousUpper83.0–97.5
Longwangshan formationMesozoicJurassicUpper125.3–136.0
Table 2. Detailed stratigraphic information for the area.
AgeLayer NumberSublayerLayer NameBuried Depth (Average Value) (m)Layer Thickness (Average Value) (m)Distribution
Holocene11-1earth filling0.20–4.10 (0.80)universal distribution
22-1silty clay0.20–4.10 (0.66)0.40–4.60 (1.75)northern region
2-2silt0.40–4.90 (0.93)0.80–13.70 (3.74)whole area
2-3siltstone0.80–11.0 (4.25)1.60–13.10 (6.18)whole area
2-4muddy silty clay0.30–15.40 (3.75)0.9–22.8 (4.43)local region
2-5siltstone3.4–19.00 (9.94)0.9–21.1 (13.46)Yangtze River floodplain
2-6siltstone17.40–29.40 (24.14)6.30–22.80 (14.90)Yangtze River floodplain
2-6bsilty clay13.50–37.40 (24.98)4.40–25.00 (13.63)Yangtze River floodplain
2-7siltstone30.80–46.10 (40.09)4.00–19.20 (10.40)Yangtze River floodplain
Late Pleistocene33-1siltstone
(fine sand)
33.10–56.90 (48.44)3.10–18.09 (13.01)Yangtze River floodplain
3-2fine sand
(medium and coarse sand)
59.19–70.33 (65.74)13.24–29.90 (20.49)Yangtze River floodplain
44-1silty clay2.40–14.50 (5.53)1.00–4.23 (2.21)Lixiahe Plain
4-2silty clay2.50–22.30 (7.02)1.30–9.00 (5.40)Lixiahe Plain
4-3silty clay mixed with silt4.00–26.50 (11.40)0.80–6.90 (2.99)Lixiahe Plain
55-1silt, siltstone7.40–28.30 (14.40)0.90–21.45 (8.16)Lixiahe Plain
5-2silty clay10.50–28.60 (15.82)1.40–14.60 (5.95)Lixiahe Plain
5-3siltstone21.10–30.00 (26.32)2.20–13.60 (8.46)Lixiahe Plain
66-1cay, silty clay14.20–39.90 (23.18)1.70–16.80 (8.61)Lixiahe Plain
77-1silt, siltstone23.60–43.00 (31.25)0.20–14.05 (5.62)Lixiahe Plain
7-2silty clay27.00–44.00 (33.22)0.80–10.30 (4.36)Lixiahe Plain
Middle Pleistocene88-1siltstone, fine sand30.40–93.07 (44.91)4.75–29.00 (12.16)Yangtze River floodplain
8-2gravel sand (gravel layer)40.10–97.70 (68.50)2.30–33.00 (14.56)Yangtze River floodplain
99-1silty clay31.30–44.90 (37.10)1.50–13.60 (6.57)Lixiahe Plain
9-2silty clay with silt37.40–50.40 (42.91)0.90–9.70 (4.29)Lixiahe Plain
9-3silty clay40.00–50.80 (45.19)1.22–16.20 (5.34)Lixiahe Plain
1010-1siltstone40.30–61.31 (48.55)0.60–9.89 (3.72)Lixiahe Plain
1111-1silty clay49.20–62.99 (56.19)1.51–14.70 (6.66)Lixiahe Plain
11-2siltstone59.70–66.30 (62.40)1.23–6.26 (3.42)Lixiahe Plain
11-3silty clay, clay54.20–71.00 (64.45)2.85–13.84 (7.76)Lixiahe Plain
11-4silty clay with silt76.606.80Lixiahe Plain
1212-1siltstone, (fine, medium) sand64.37–78.20 (71.31)1.53–33.77 (12.54)Lixiahe Plain
1313-1silty clay67.40–79.83 (73.61)2.50–8.10 (5.63)Lixiahe Plain
13-2clay, silty clay75.50–86.13 (80.82)13.87–20.50 (17.19)Lixiahe Plain
Early Pleistocene1414-1siltstone79.02–83.40 (81.21)6.60–18.12 (17.36)whole area
14-2silty clay, clay72.50–97.14 (82.34)2.86–23.60 (11.17)whole area
14-3siltstone, fine sand86.27–98.20 (91.49)1.80–13.73 (8.18)whole area
14-4silty clay982.0whole area
Table 3. Borehole data structure.
Borehole IDLongitudeLatitudeLayer NumberTop ElevationBottom Elevation
12-13.056.45
23-26.4513.2
31-138
41-138
Table 4. Comparison between the computation times of the proposed method and that of other pinch-out methods.
Number of boreholes5102040
Average time of the unique path method (ms)8162035
Average time of the traditional method (ms)507692127
Table 5. Comparison between unique path method and traditional method.
Unique Path MethodTraditional Method
Degree of stratum matching between boreholes98.39%85.71%
Reliability based on empirical experience100%69.23%
Average computation time per 100 boreholes/ms127570
Adaptive types of stratigraphic distributions53
Unique path method is suitable for five kinds of stratigraphic distributions: continuously distributed strata, lenticular bodies, pinch-outs, and continuous and discontinuous lacuna; in contrast, the traditional method is suitable only for continuously distributed strata, pinch-outs, and continuous lacuna. Reliability based on empirical experience means the percentage of draw success for pinch-outs based on profile drawn by empirical expert.
Publisher’s Note: MDPI stays neutral with regard to jurisdictional claims in published maps and institutional affiliations.