Article

Toward Workable and Cost-Efficient Monitoring of Unstable Rock Compartments with Ambient Noise

1
Association pour le Développement des Recherches sur les Glissements de Terrain (ADRGT), 2 Rue de la Condamine, 38610 Gières, France
2
Centre National de la Recherche Scientifique (CNRS), Institut des Sciences de la Terre (ISterre), Université Grenoble Alpes, 38000 Grenoble, France
*
Author to whom correspondence should be addressed.
Geosciences 2021, 11(6), 242; https://doi.org/10.3390/geosciences11060242
Submission received: 19 April 2021 / Revised: 25 May 2021 / Accepted: 31 May 2021 / Published: 4 June 2021
(This article belongs to the Special Issue Landslide Monitoring and Mapping)

Abstract

:
Ambient Vibration-Based Structural Health Monitoring (AVB–SHM) studies on prone-to-fall rock compartments have recently succeeded in detecting both pre-failure damaging processes and reinforcement provided by bolting. The current AVB–SHM instrumentation layout is yet generally an overkill, creating cost and power issues and sometimes requiring advanced signal processing techniques. In this article, we paved the way toward an innovative edge-computing approach tested on ambient vibration records made during the bolting of a ~760 m3 limestone rock column (Vercors, France). First, we established some guidelines for prone-to-fall rock column AVB–SHM by comparing several basic, computing-efficient, seismic parameters (i.e., Fast Fourier Transform, Horizontal to Vertical and Horizontal to Horizontal Spectral Ratios). All three parameters performed well in revealing the unstable compartment’s fundamental resonance frequency. HHSR appeared as the most consistent spectral estimator, succeeding in revealing both the fundamental and higher modes. Only the fundamental mode should be trustfully monitored with HVSR since higher peaks may be artifacts. Then, the first application of a novelty detection algorithm on an unstable rock column AVB–SHM case study showed the following: the feasibility of automatic removing the adverse thermomechanical fluctuations in column’s dynamic parameters based on machine learning, as well as the systematic detection of clear, permanent change in column’s dynamic behavior after grout injection and hardening around the bolts (i1 and i2). This implementation represents a significant workload reduction, compared to physical-based algorithms or numerical twin modeling, and shows better robustness with regard to instrumentation gaps. We believe that edge-computing monitoring systems combining basic seismic signal processing techniques and automatic detection algorithms could help facilitate AVB–SHM of remote natural structures such as prone-to-fall rock compartments.

1. Introduction

The monitoring of anthropic devices and structures is a key action to keep structures in operation, mitigate aging and failure risk and optimize maintenance campaigns [1,2]. The monitoring strategy is defined through a risk assessment survey that describes possible aging or failure causes and respective consequences [3]. Monitoring systems offer a wide range of technical options and associated costs: they may consist of, e.g., periodic human visual inspections, periodic or continuous measurement of a physical parameter with probes, and remote sensing surveys [4].
Vibration-based Structural Health Monitoring (VB–SHM) represents a monitoring technique relying on the modal analysis of structures, i.e., focusing on their dynamic parameters [4,5,6]. The dynamic characteristics of a system consist of its natural frequencies, damping factors, and mode shapes [7,8]. The modal model of a structure can be derived from experimental modal analysis, which consists of measuring the free vibration or the frequency response function (FRF) of a structure [7,9,10]. VB–SHM presents the advantage of in-depth probing and integrative approach made accessible with only a few sensors located at the surface. The literature shows a broad scope application case studies covering machine health diagnosis [11,12,13,14], transportation vehicles [15], aircrafts [1,6], aerospace [16], cultural heritage buildings [17,18,19] and large civil engineering structures [3,15,20] such as buildings [21,22,23,24,25] and bridges [10,26,27]. Recent developments in sensors such as fiber optics and MEMS [5,28,29], wireless connectivity [30,31], and reduction in instrumentation costs [32] tend to provide a large amount of data. This points out the need for automatic SHM processing such as machine learning routines [3,33,34]. Application of VB–SHM generally requires obtaining the baseline of modal parameters, i.e., when a structure is in perfect dynamic health, and detect changes of behavior that could be related to damage [2,7,35]. The modal data must firstly be normalized to remove adverse operational and environmental fluctuations [3,36,37,38]. Most VB–SHM studies only monitor the natural frequencies fn because this parameter is easily measured and appears to be the most sensitive to damage [39,40,41]. Indeed, the complete determination of modal shapes faces practical issues since multiple sensors operating synchronously on various points of the structures are required. Many methods are available to process SHM vibration records [8,9]. Ambient-noise-based methods that require only a little computing resource appear promising for the monitoring of remote sites, where data transmission and power consumption are major issues [42,43].
Passive VB–SHM studies based on ambient noise were recently applied to natural structures such as rock arches [44,45,46], towers [47,48], or unstable rock slopes and rock compartments [48,49,50,51,52,53,54,55,56,57,58]. The latter are generally studied and monitored for risk mitigation purposes and require robust and low-cost surveillance systems. Due to challenging access conditions and instrumentation environment, seismic sensors are usually set only on top of the studied structure. Many different seismic processing tools have been used to detect and monitor amplification peaks from passive records. Single Channel Spectral Analysis (SCSA), Site-to-Reference Spectral Ratios (SRSR), Horizontal to Vertical Spectral Ratio (HVSR), or Single-Channel Polarization Analysis (SCPA) have been frequently used in lightweight experiments using one or few sensors, which requires only limited computing resources (Table 1). SCPA has proven very useful for prospection surveys since it yields all three strike, dip, and frequency information. We yet discarded it from this study because it requires more computing power and yields slightly lower frequency resolution than conventional SCSA approaches [57]. For similar reasons, Frequency Domain Decomposition requires multiple sensors and more computing power appears not well suited for in situ monitoring purposes. However, it revealed useful and accurate for prospection surveys [47,59]. The frequency band of interest for local slope response ranges between about 1 Hz up to a few tens of Hz, notably depending on the volume and geometry of the unstable mass [48,55,60].
Whatever the processing technique, a clear amplification of ambient vibrations at specific frequencies was systematically reported on unstable rock compartments. SRSR computed using FFT spectra show peak amplitudes ranging between about 4 to more than 70 (ratio without units, [54,55,57]). Empirical and theoretical correlations have been established between seismic amplification and rock mass destructuration intensity [50,55]. The amplification is mainly due to slope fractures and impedance contrast between layers, larger-scale topographic effects being negligible [61]. Amplification peaks are interpreted as unstable rock compartment’s natural frequencies resulting from wave trapping in low seismic impedance layers [62], normal mode vibration of fractured rock slopes [52,53], and/or free-standing vibration of rock compartments [47]. For SRSR and HVSR, a numerical study suggested that both amplitude and peak frequencies contain valuable information on rock compartment stability [50]. Unfortunately, SR amplitudes revealed sensitivity to external solicitation such as wind speed, with variations of factor 3 or 4 reported [50]. The efficiency and robustness of these parameters still have to be tested on long-term field monitoring surveys.
To our knowledge, a single ambient vibration study of prone-to-fall rock compartments has been conducted until failure. A clear decrease in first natural frequency f0 (−30%) was reported before the rockfall and attributed to a progressive loss in rock compartment stiffness [64], confirmed by numerical simulations [50] and extensometer time-series [64]. This underlines the potential of VB–SHM to detect progressive, in-depth action of destabilizing factors prior to rockfall. Unfortunately, this unique field study has never been reproduced due to practical difficulties. Since the time of failure is unknown, challenging and costly experiments in remote, hostile, and hardly accessible environments are indeed necessary [48,77,78,79]. In addition, natural frequencies fn may wander significantly due to environmental conditions with complex pattern [44,48,57,62]. Air temperature fluctuations induce changes in fn generally between 5 and 30%, depending on the site and monitoring duration [44,48,49,50,57,62,78]. Hundreds of % rise in fn due to icing in rock compartment rear fracture were yet reported by [49] and [62]. These environmentally driven fluctuations may hide irreversible decreases in natural requencies prior to rockfall [44,48,49]. They must be removed to obtain an unbiased monitoring parameter [21,26,79]. A lightweight, flexible approach consists in determining the relationship between environmental parameters (input) and the rock column’s dynamic parameters (output) via several models [80,81].
A recent study provided significant progress toward practical monitoring rock compartment stability with VB–SHM [78]. The authors used passive seismic measurements (SCSA, see Table 1) to investigate the effect of rock bolting on an ~760 m3 unstable limestone column. They clearly observed irreversible changes in natural frequencies fn (up to +17%) provoked by the column bolting. This suggests that reinforcement works provided significant additional stiffness to the prone-to-fall compartment. This bolting case study can be considered the reciprocal of rockfall study in [64] and represents its first full-scale validation. The authors also successfully applied an autoregressive model with exogenous input (ARX) to remove the environmentally driven fluctuations in fn. The observed increases in fn were found consistent with successive bolting phases. However, the calibration of the ARX model revealed difficulty in practice. It requires the tuning of many coefficients and requires continuous measurements spanning at least over the characteristic period of thermal effects [26,82]. Such continuous seismic measurements and data teletransmission yet require significant power (typically a few watts when active), which is hardly sustainable in remote sites. In addition, ARX models do not perform well on data series with gaps.
To overcome these limitations, this study aims at investigating the feasibility of monitoring unstable rock compartments with lightweight, power-efficient, edge-computing solutions. This objective is addressed through testing an innovative approach on the controlled bolting dataset described in [78]. More specifically, we first process ambient seismic records with simple signal processing techniques requiring only a few computing resources in order to compare their robustness and performance to identify the unstable compartment spectral peaks. We select the most relevant parameters. Finally, we tested the feasibility of detecting the mechanical changes related to bolting using automatic machine learning routines. The selected Elliptic Envelope novelty detection algorithm performs well also on discontinuous data time series and remains easy to parametrize.

2. Site Description

The studied site is located in the sedimentary Vercors Massif in southeastern France (Figure 1a). The massif is mainly composed of limestones and marls dating from the secondary era (Mesozoic). Limestone formations create a plateau-like shape bounded by subvertical cliffs, while marls tend to produce steep to moderate slopes. The major cliffs and peaks are made up of massive Urgonian limestone dating from Early Cretaceous (−110 > −114 Ma, formation (4) in Figure 1a). The Vercors plateau is cut by two main rivers flowing westwards: the Bourne and the Vernaison. These rivers dramatically cut the limestone and marls series, forming steep slopes and cliffs reaching several hundreds of meters. These river cuts are also used to provide road accesses to the center of the massif, these roads being exposed to significant rockfall hazards. In the Bourne valley, an unstable ~760 m3 prone-to-fall rock compartment was reported to threaten the road (see Figure 1b). The rock column is made up of massive Urgonian limestone (formation (4) in Figure 1a) forming a ~5 m thick, ~10 m wide, and ~15 m high column. It lies about 130 m over the road. A preliminary geological, geophysical, and geotechnical study with visual investigations, drill cores, and ground-penetrating radar profiles showed that the column is separated from the stable rock mass by an open, 10 m deep fracture. Another subvertical fracture set splits the prone-to-fall column into two compartments (A and B, Figure 1b). The column was reinforced in spring 2016, with four successive work phases conducted from top to bottom (see a to d bolt rows in Figure 1b). Each work phase consisted of borehole drilling (shown as light orange rectangles in Figure 3 and follwing figures), followed by steel rebar installation and concrete grout injection stages (red rectangles labeled i). Bolts were grouted in two main phases: top row (a bolts, Figure 1b) and second row (b bolts), which were grouted together during i1 phase (21 April 2016). Lower rows (c and d bolts, except d4) were grouted during i2 phase (02 May 2016), except bolt d4 (i3, 18 May 2016). More details on the prone-to-fall compartment and reinforcement works are given in [80].

3. Data Acquisition and Processing

The seismic monitoring system consisted of three components (3C) sensor set on the column’s top (BOECA, compartment A) and one 3C reference sensor on the nearby stable rock cliff (BOREF; Figure 1b). We used Lennartz LE3D-5s sensors (eigenfrequency of 0.2 Hz; Lennartz Electronic, Tubingen, Germany) connected to a Nanometrics Centaur data logger with 200 Hz sampling in continuous mode (Nanometrics, Kanata, ON, Canada). The monitoring period with continuous data spreads from 28 March 2016 to 27 May 2016. Data were stored in an SDS archive and processed with the Python obspy package [84]. This package provides Python tools for processing seismological data with reading routines, clients to access data centers, and seismological signal processing routines [85]. The maximum and standard deviation of Particle Velocity time series (maxPV and stdPV, respectively) were stored for each 1 h slice record. The goal is to derive an easy-to-compute monitoring parameter, similar to volcanoes early warning systems used in [86,87] approach. Spectral content analysis SCSA was also performed using either multitaper Fast Fourier Transform (FFT) and Welch’s Power Spectral Densities (PSD) algorithms (Table 1) computed on 1 h record slices. Spectral averaging using multitaper algorithms is required because of the stochastic nature of ambient vibrations [63,66]. The PSD corresponds to squared FFT amplitude. PSD scales directly with the energy of vibration and is frequently used for seismological station characterization with ambient noise [66,88,89] and instrument specification [90]. Working with FFT spectra, which scale with signal amplitude, remains popular in ambient noise surveys due to historical reasons. In the rest of this article, we use only multitaper FFTs, notably for Spectral Ratio computation. Horizontal to Vertical and Horizontal to Horizontal Spectral Ratios (HVSR and HHSR, respectively) were computed following the guidelines presented in [50,73]. The east channel oriented along the slope direction and perpendicular to the rear fracture was selected as the horizontal component (Figure 1b). All spectra were smoothed using Konno–Ohmachi filter with b = 90 [91], which is commonly used as a good trade-off between robustness and spectral peak resolution. Air temperature records were acquired simultaneously on-site using a Testo 174T data logger with 10 min sampling interval.

4. Parameter Robustness and Ability to Derive Unstable Column’s Dynamic Parameters

In this first step, we compare several parameters derived from ambient vibration records in terms of robustness and stability over time. We also explore their ability to clearly point out the natural resonance frequencies of the unstable rock compartment.

4.1. Particle Velocity Monitoring (PV)

We investigated time series of ambient vibration Particle Velocity (PV) to seek a pertinent but very easy-to-compute monitoring parameter. Absolute maximum (maxPV) and standard deviation (stdPV) were computed on 1 h long seismic records and analyzed throughout the reinforcement works. PV ratios between the unstable rock compartment and stable massif were also calculated (stdPVratio). More details are given in Appendix B.
All three maxPV, stdPV, and—to a lesser extent—stdPVratio seismic parameters revealed highly unstable over time and could not be used in practice. Strong PV variations were reported. They are partly caused by changes in environmental conditions (air temperature, wind speed, weather conditions, river discharge). Daily and weekly variations appear related to variations in anthropogenic noise [92]. (i.e., alternance of working and nonworking periods such as nights and weekends, transport activity). Some PV peaks were also related to borehole drilling works on-site (red background, Figure A2 in Appendix B). In conclusion, Particle Velocity Monitoring appears mostly dependent on fluctuations in natural and anthropogenic seismic source amplitude rather than correlated with rock compartment resonance effects. This suggests that seismic noise Particle Velocity time series cannot be directly exploited for monitoring natural structures such as unstable rock compartments.

4.2. Spectrum Monitoring

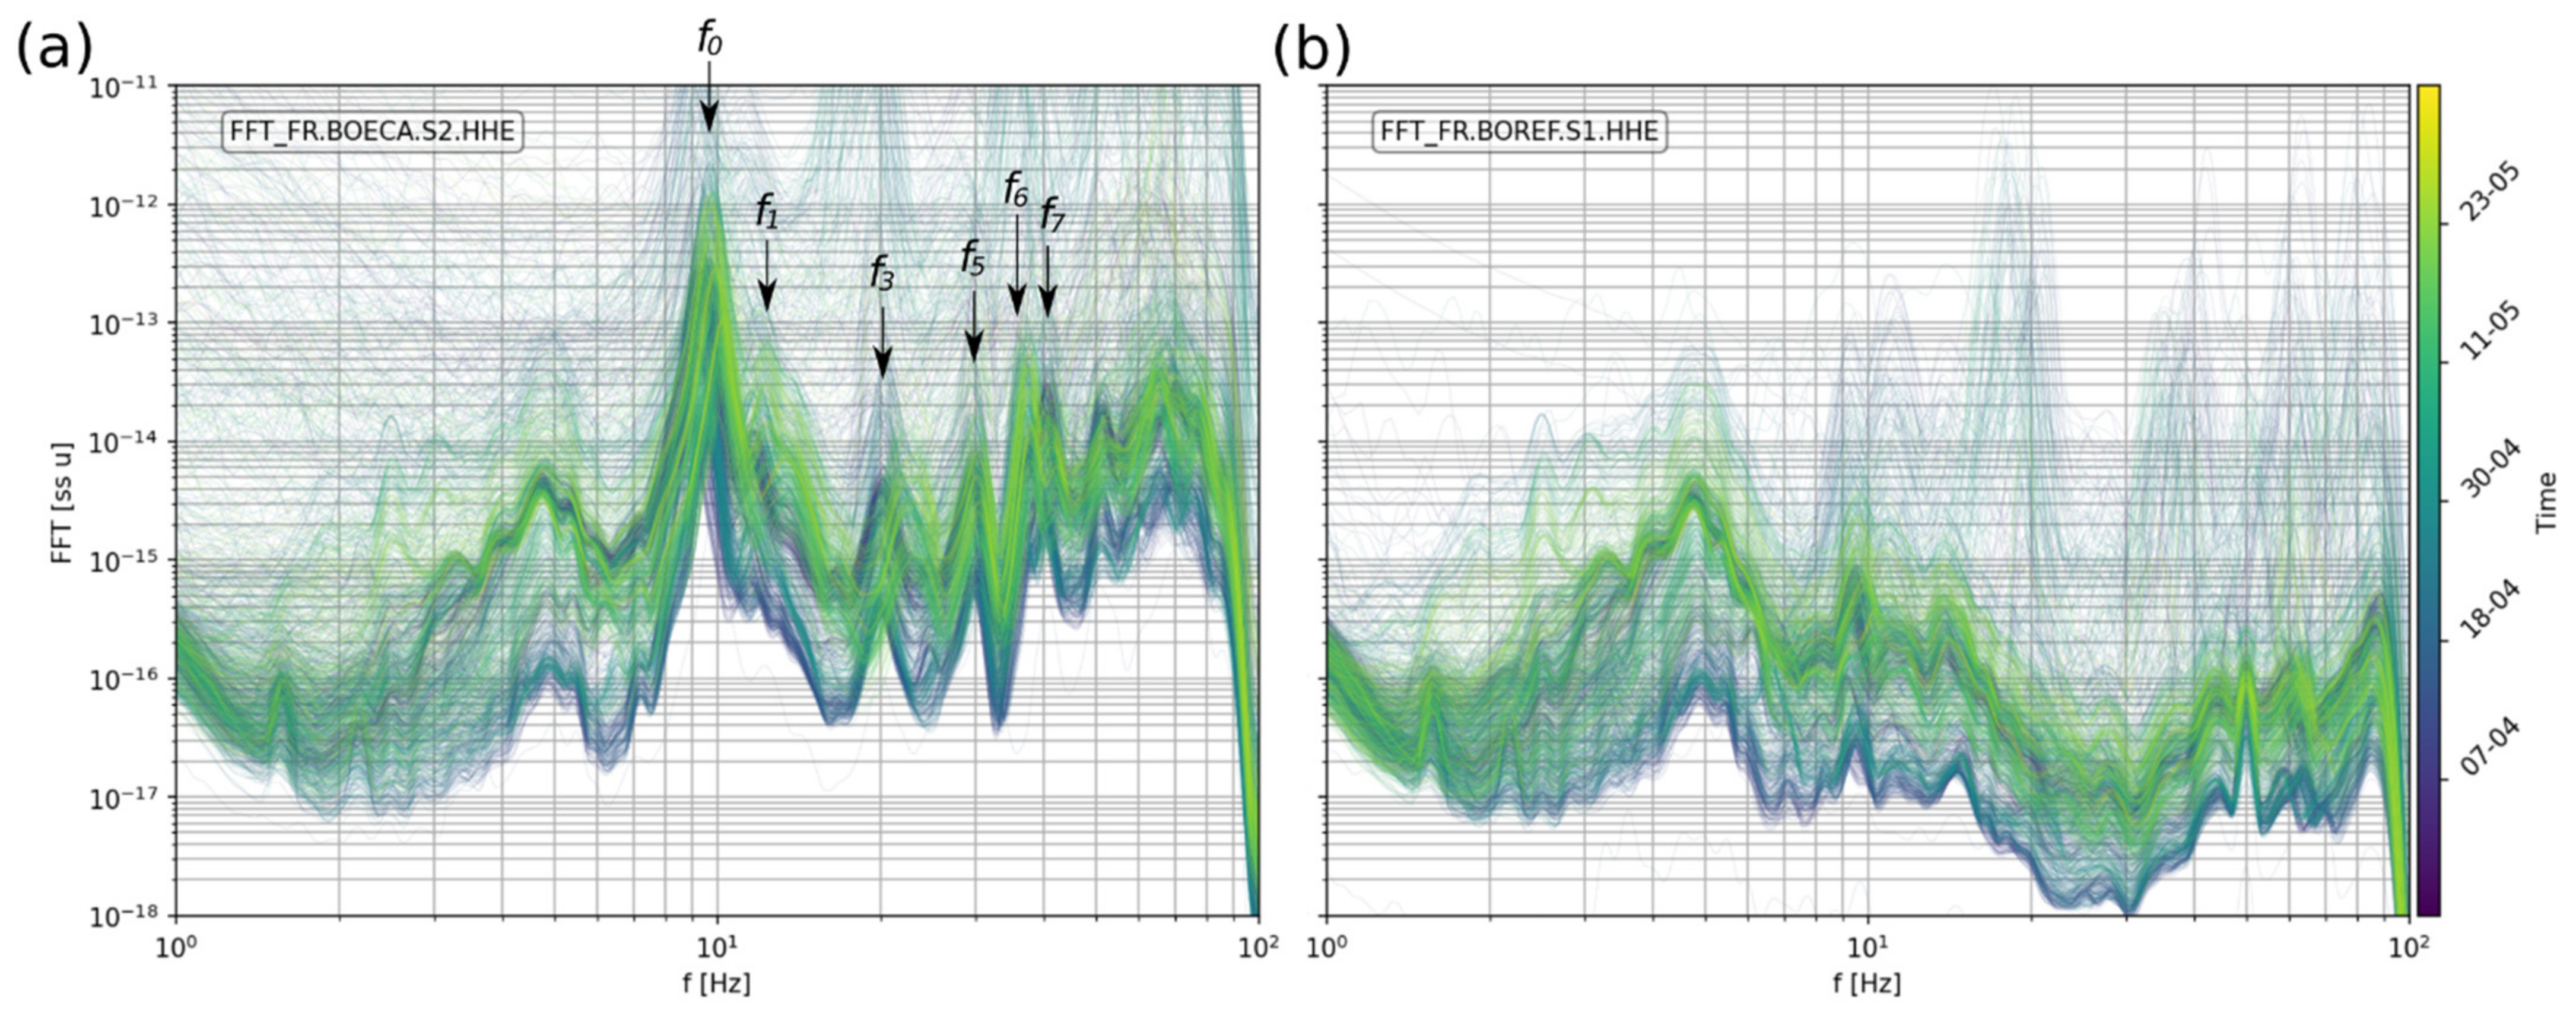
Following the Single-Channel Spectral Analysis method described in Table 1, Fast Fourier Transform spectra were computed along every channel on the unstable column (BOECA) and on the stable rock mass (BOREF). We focus on the horizontal east component, which is perpendicular to the rear open fracture, in the direction of the steepest slope, where most seismic energy is expected [50,53,55,59,78]. Figure 2 shows the FFT for both BOECA (a) and BOREF (b) sensors, each curve representing the 1 h averaged spectrum. The color scale shows the time over the monitoring period and varies from blue (28 March 2016) to yellow (27 May 2016). For frequencies greater than a few Hz, spectra amplitude appears lower on the stable massif rather than on the unstable column. Local resonance of the unstable rock column is visible around 10 Hz, followed by smaller peaks at higher amplitudes (Figure 2a). Peak frequencies are labeled successively from the lower to the upper peak, with the same number used in [78]. These peaks correspond to the column’s natural frequencies with significant motion in the east–west direction and lying in the excitation bandwidth [80]. In particular, f2 and f4 spotted in the thorough analysis of [78] are hardly spotted on the east channel because they vibrate mostly along the north–south direction. As a consequence, they are not shown in Figure 2a. The first natural frequency f0 is visible on the BOREF reference station, yet with low amplitude (Figure 2b). This could still help monitoring unstable areas with nearby sensors on the stable massif to reduce human exposure and loss of instruments [47,48].
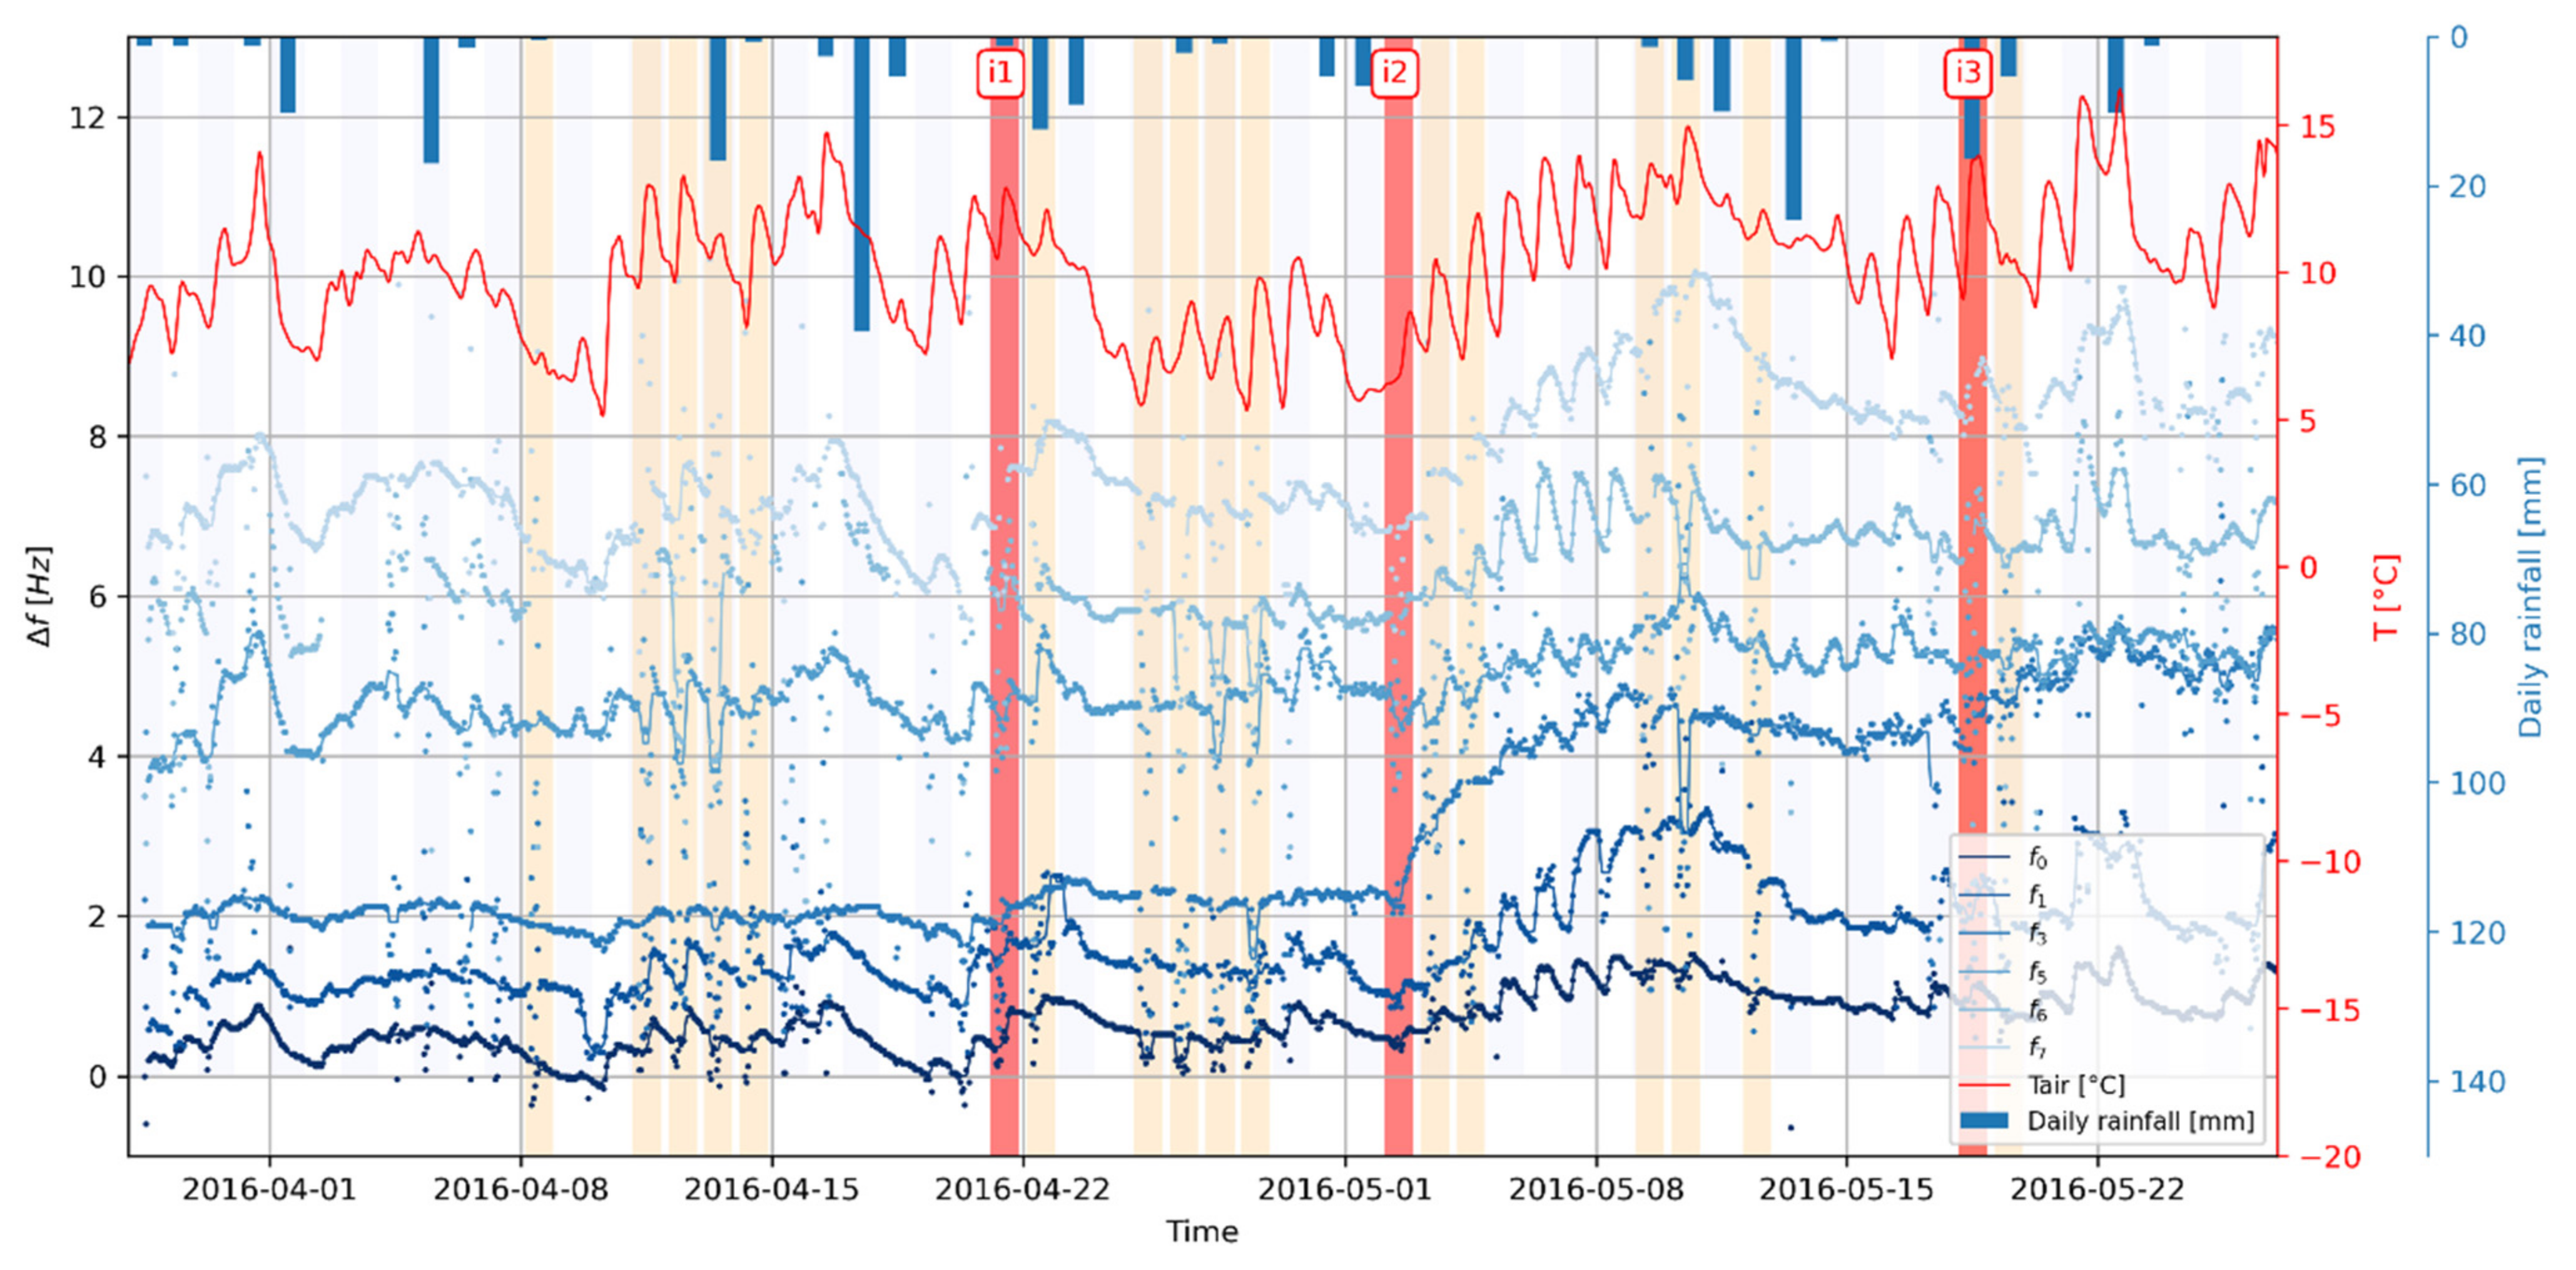
Figure 3 shows the monitoring of natural frequencies f0, f1, f3, f5, f6, and f7 variations over time (blue dotted curves, from dark blue to light blue). The air temperature recorded on-site is shown by the red curve, and daily rainfall is shown with blue bars (top axis). Reinforcement work stages are shown in the background: drilling days (light orange) and grout injection (i1, i2, i3 in red). Each natural frequency time-series (blue dotted curves) has been shifted along the frequency axis by an arbitrary amount to facilitate comparison and is now labeled Δf (in Hz). The curves show some spikes mostly related to drilling days (red background, Figure 3). All frequencies show clear fluctuations of about ±1 Hz with the air temperature measured on-site. f3 shows the greatest variation during the monitoring period, as shown in [78]. Natural frequencies and temperature are correlated for such short timescales (a few days to a few weeks), which means an increase in temperature causes a rise in fn. Such a positive correlation for short timescales is observed for most sites sensitive to thermomechanical forcing with semiopen fractures and rock bridges [48,49]. The changes in natural frequencies related to the bolting works are studied later in Section 6, after the thermomechanical fluctuation removal process. We note that frequency changes are generally greater with increasing mode, suggesting that higher modes may be more sensitive to changes.
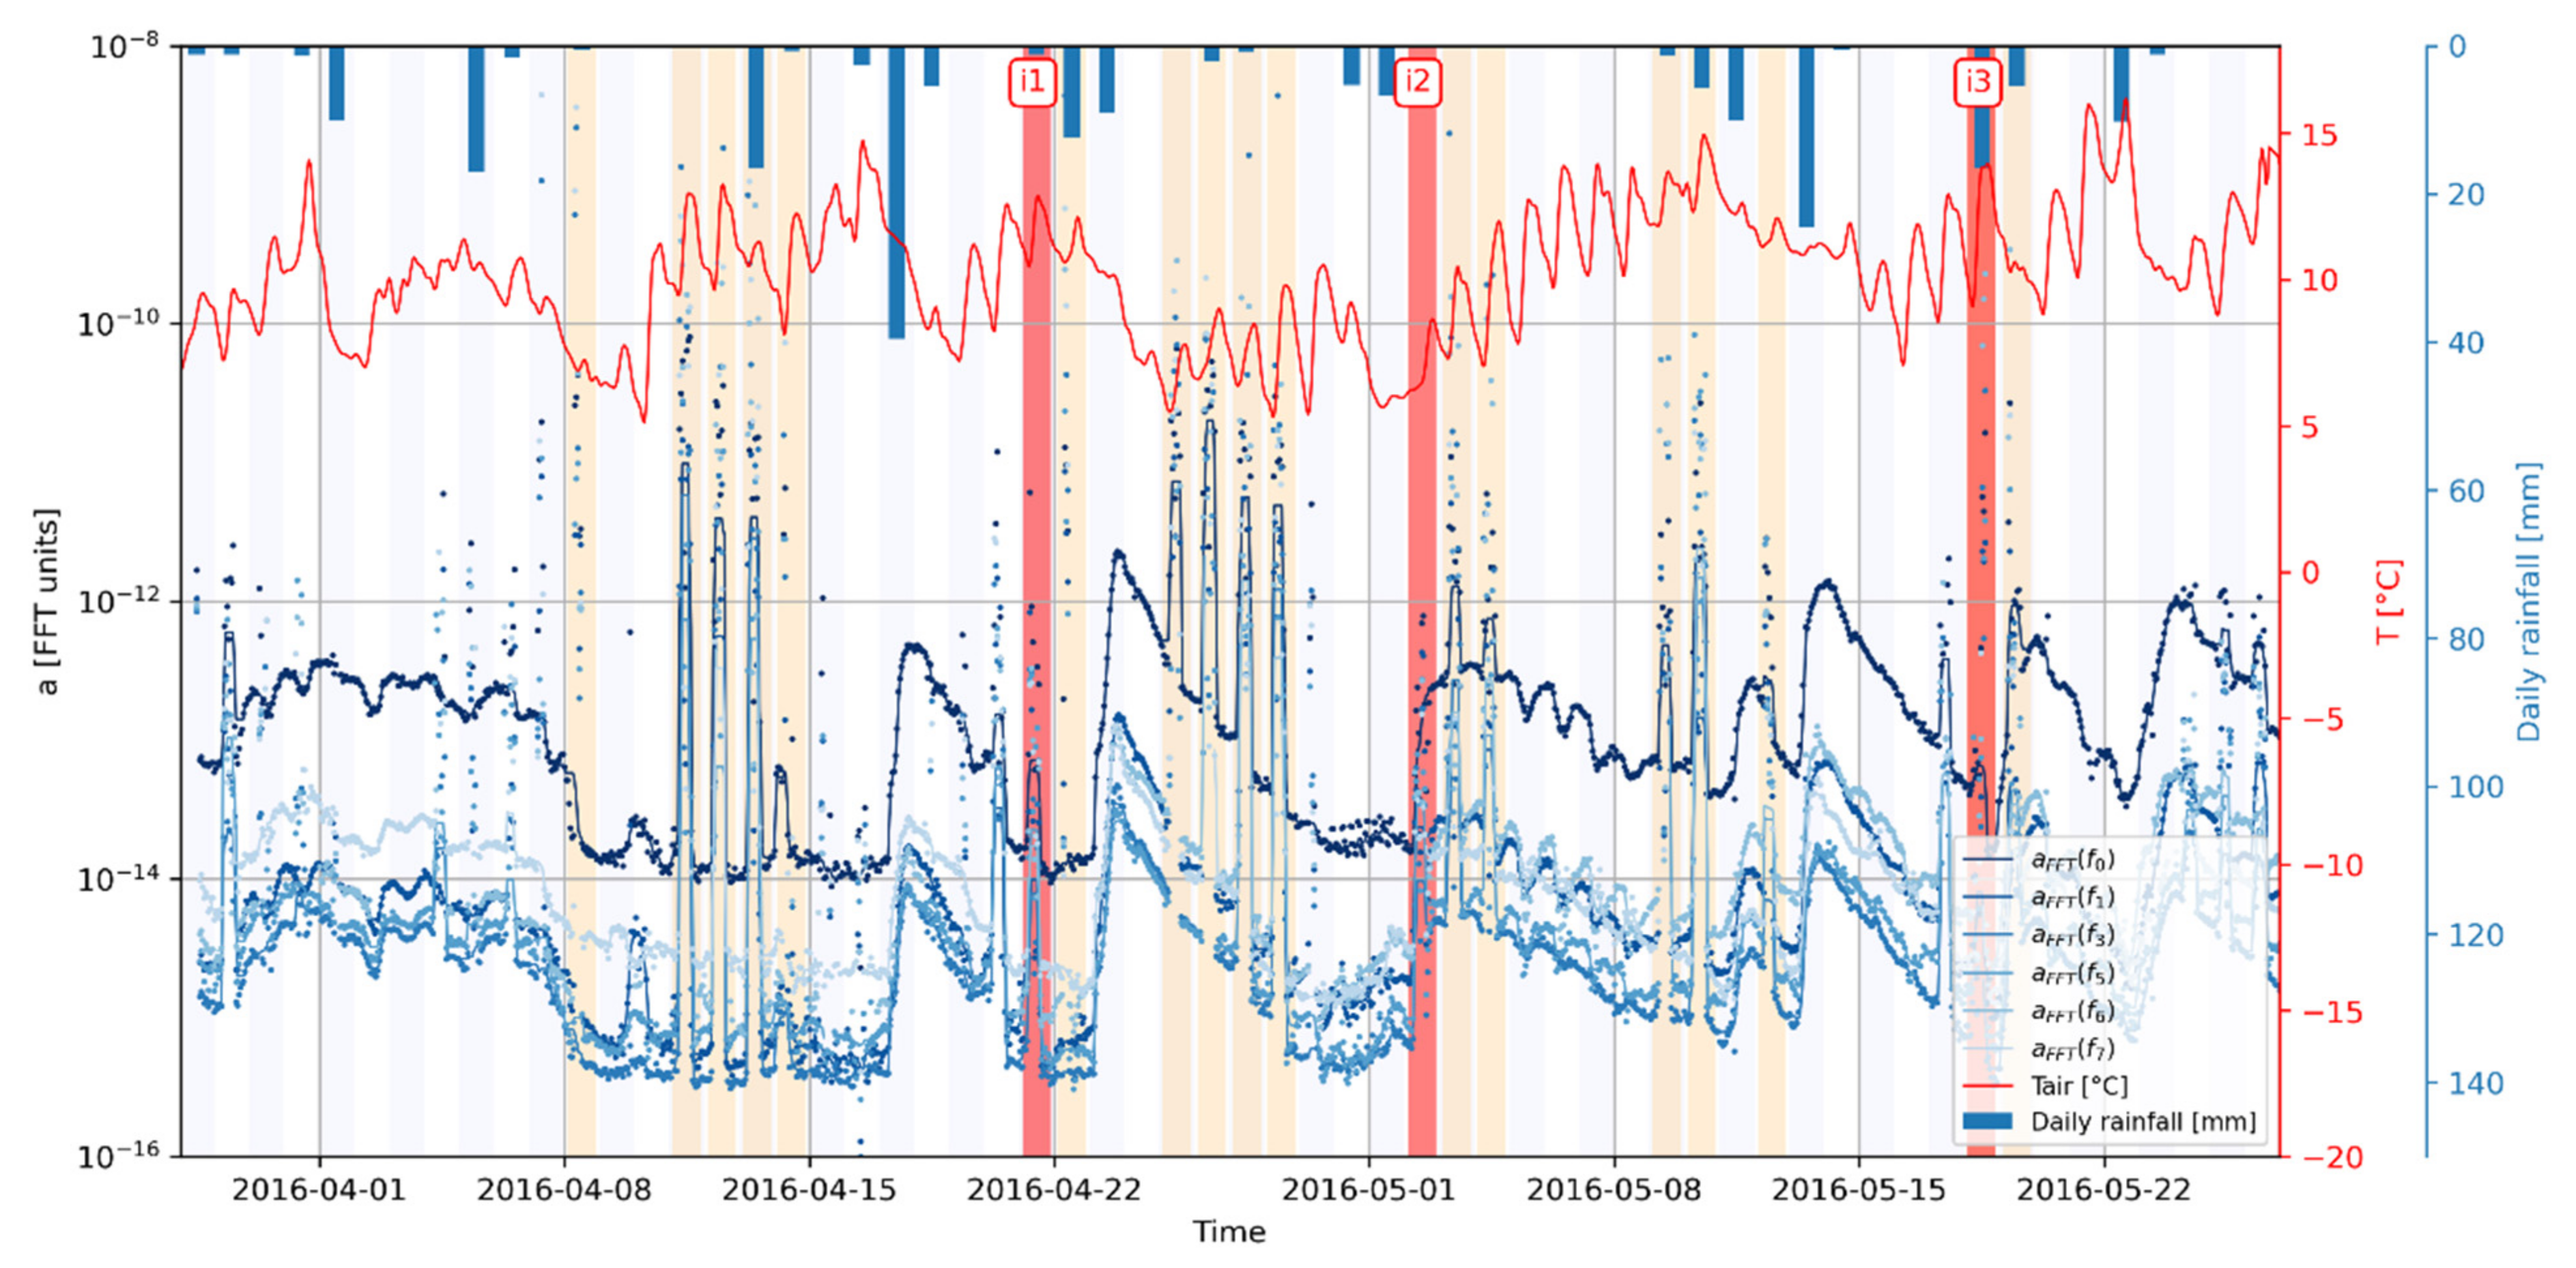
We also computed the spectral amplitude of natural frequencies f0, f1, f3, f5, f6, and f7 with time, labeled aFFT(fn). Results are shown in Figure A1 in the (Appendix A). Peak amplitudes vary greatly (generally over 2–3 orders of magnitude) with time, the main peaks occurring again during borehole drilling works on-site. The variation in peak amplitude is very similar to PV monitoring (see Appendix B), i.e., FFT amplitude is mainly controlled by source effects (environmental conditions such as nearby river discharge) rather than site response. The use of FFT amplitude appears unsuitable for monitoring purposes.

4.3. Horizontal-to-Vertical Spectral Ratio (HVSR) Monitoring

HVSR results for both unstable (BOECA and stable (BOREF) sensors are shown in Figure 4. Each curve representing the 1 h averaged HVSR. The color scale shows the time over the monitoring period and varies from blue (28 March 2016) to yellow (27 May 2016). Both sensors offer very stable HVSR over time, with a significant reduction in fluctuations, compared to spectrum monitoring (see Section 4.2 and [93]). The spectral ratio allows reducing the effect of source and path terms (e.g., ambient wavefield directivity and variability) and enhancing the site response [58]. The stable rock mass (BOREF, Figure 4b) shows a relatively flat HVSR curve ranging between 1 and 3 for most of the [1–100 Hz] frequency band. On the contrary, HVSR on the rock column (BOECA, Figure 4a) shows a clear peak (p0) with amplitude reaching about 30–50 and corresponding to natural frequency f0. Smaller peaks are observed at higher frequencies, only p1 and p5 corresponding to the column’s natural frequencies. Other HVSR peaks do not systematically coincide with resonance frequencies: it notably fails to evidence f2, f3, f4 and to differentiate f6 from f7 [78]. This lack of evidence could be due to the peculiar wavefield on unstable slopes with peaks and troughs affecting the vertical channel on unstable compartments [55,57] and also due to the probable coupling of vertical vibrations with horizontal ones for the considered modes. The sensor’s location on the unstable compartment may also play a role in recorded HVSR shape, especially for flexural and rotational motions.
This suggests that HVSR should be used only with great care because it does not systematically reflect the structure dynamics and might be affected by slope and sensor location effects. HVSR yet reduces spectral fluctuations and could hence be used to monitor the fundamental, normal-to-fracture mode of unstable rock compartments.
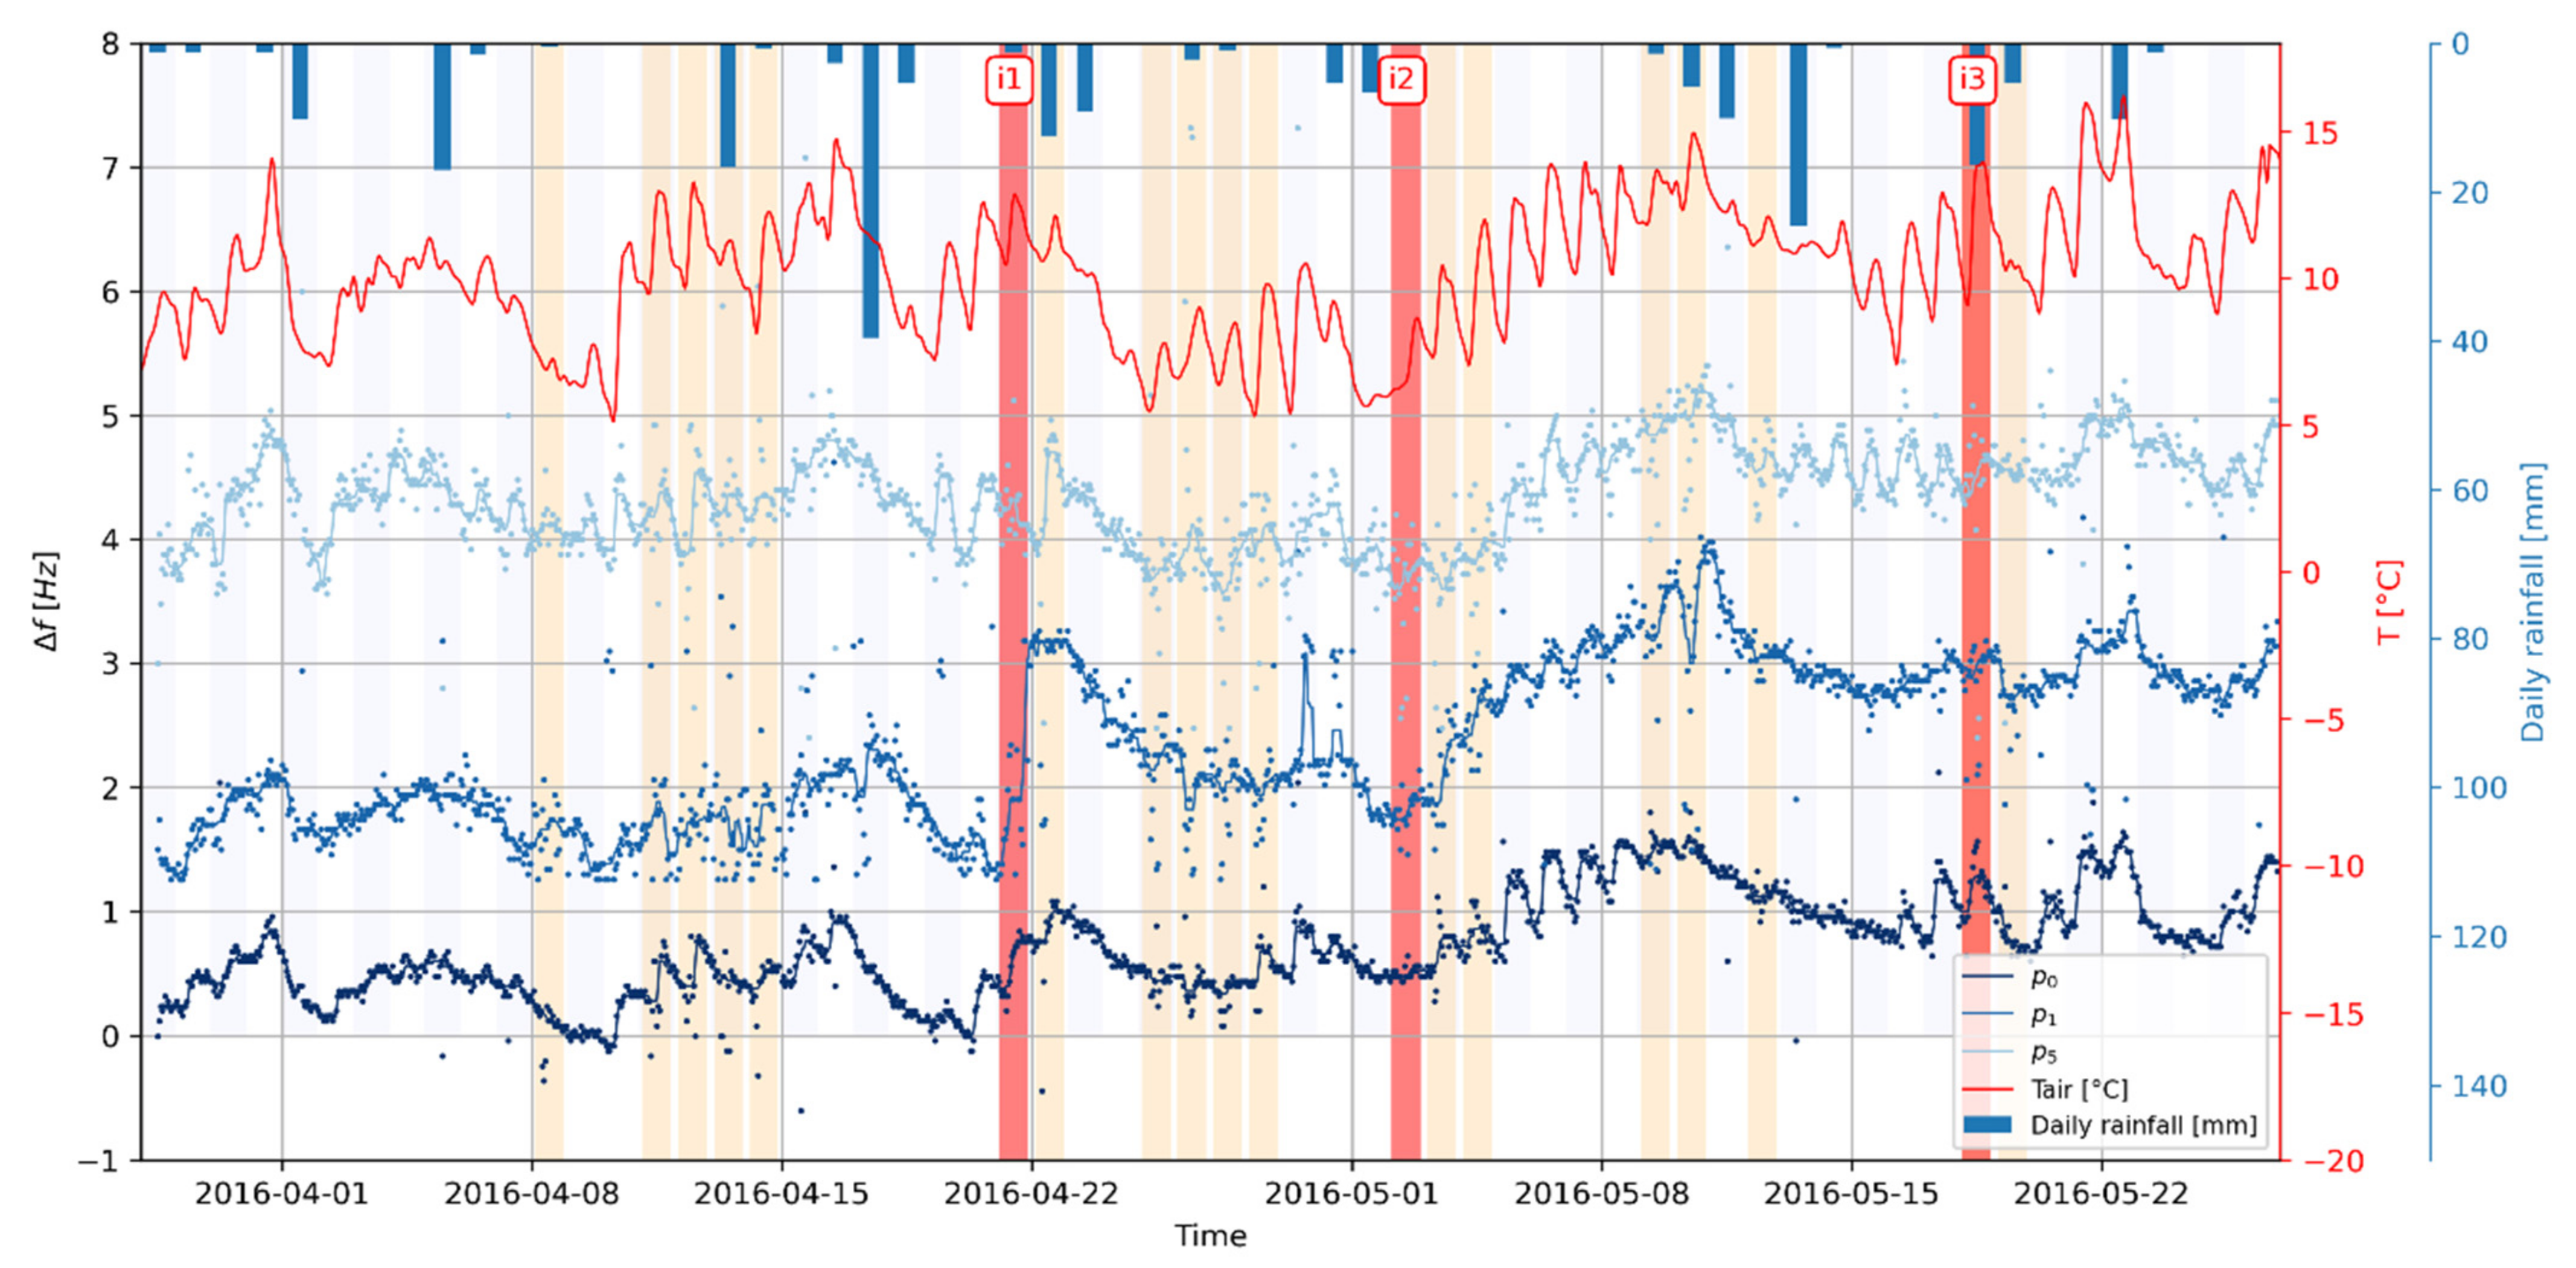
The monitoring of variations in spectral peak frequencies p0, p1, and p5 is shown in Figure 5 (blue dotted curves, from dark blue to light blue). The air temperature recorded on-site is shown by the red curve, and daily rainfall is shown with blue bars (top axis). Reinforcement work stages are shown in the background: drilling days (light orange) and grout injection (i1, i2, i3 in red). Frequencies have been demeaned for the sake of comparison and labeled Δf. During the monitoring period, all HVSR peak frequencies roughly follow the air temperature curve, according to results from spectral analysis and thermomechanical forcing. Boreholes drilling days make HVSR peak peaking noisier, to a lesser extent than FFT monitoring (see Figure 3). No clear and unambiguous pattern can be attributed to the bolting works at this stage.
Monitoring of the HVSR peak amplitude for p0, p1, and p5 is shown in Figure 6 (blue dotted curves, from dark blue to light blue). The air temperature recorded on-site is shown by the red curve and daily rainfall is shown with blue bars (top axis). Reinforcement work stages are shown in the background: drilling days (light orange) and grout injection (i1, i2, i3 in red). HVSR peak amplitudes show dependence on air temperature and are also affected by borehole drilling activity (light orange background). HVSR peak amplitudes behave differently during the monitoring period: p3 amplitude tends to remain stable, while p1 shows a slight increase in amplitude. p2 shows a decrease in amplitude after the second grout injection and hardening (i2 Figure 6) but returns to its original level afterward (about 6). In contrast, p0 shows a clear and permanent ~37.5% decrease in amplitude, falling from about 40 down to 25 (Figure 6). This agrees well with [50] numerical and experimental study for column-like structures, suggesting using HVSR amplitude at the fundamental bending mode aHVSR(p0) for monitoring purposes. The amplitude of HVSR upper peaks revealed more complexity and their practical use proved doubtful. A detailed study conducted in Section 5 will address this point.

4.4. Horizontal-to-Horizontal Spectral Ratio (HHSR) Monitoring

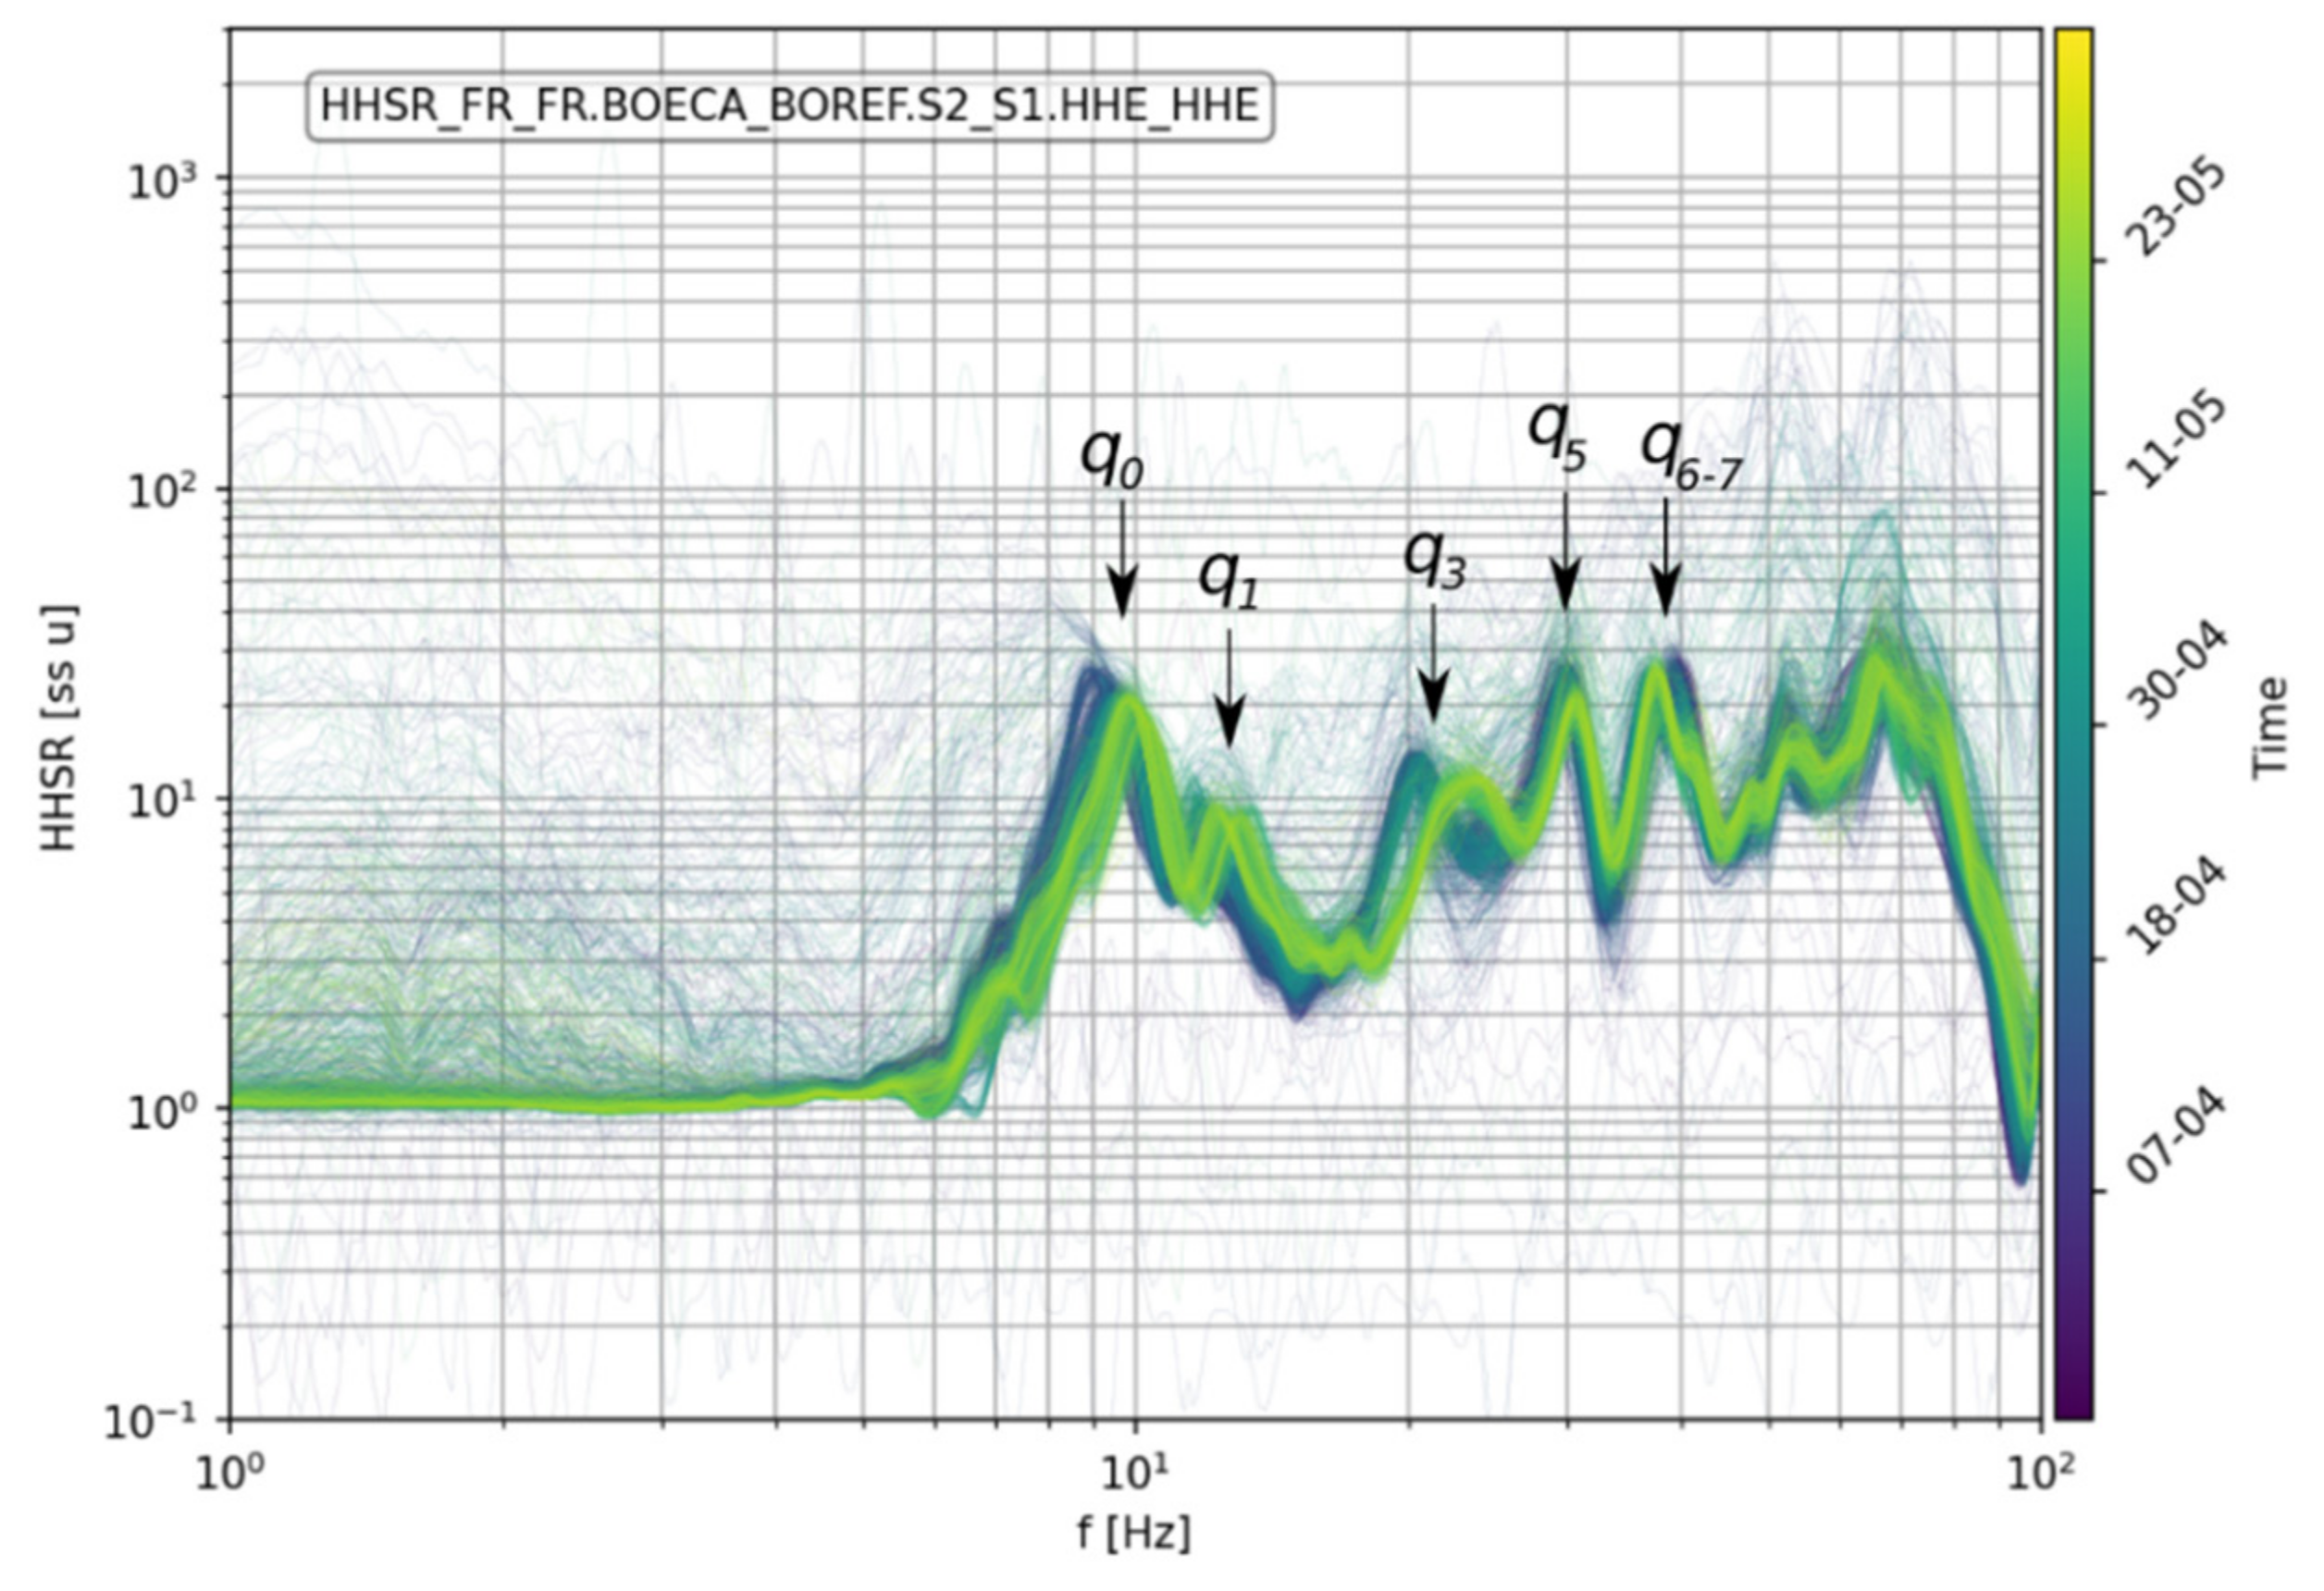
Horizontal-to-Horizontal Spectral Ratio curves for the east component between the unstable column and nearby stable massif are shown in Figure 7. Each curve representing the 1 h averaged HHSR. The color scale shows the time over the monitoring period and varies from blue (28 March 2016) to yellow (27 May 2016). Similar to HVSR, HHSR shows very clear and repeatable results. The use of spectral ratio indeed suppresses most ambient noise variability and directivity issues.
Five clear peaks (labeled q0q6–7 according to natural frequencies) appear in the 1–50 Hz frequency range. The highest peak q0 corresponds to fundamental normal-to-fracture resonance mode (f0). Higher peaks q1q6–7 are obvious and systematically match corresponding natural frequencies f1f6–7 visible along the east channel. All peak frequencies q0q5 tend to increase with time. The only exception is peak q6–7, which is unclear since it gathers f6 and f7 natural frequencies and splits during the monitoring period time.
HHSR performs better than HVSR in evidencing the column’s dynamic properties as it focuses along the east direction and does not take into account motion in other horizontal directions and vertical motion. These results suggest that HHSR is well suited for application on unstable slopes where rock compartment resonance occurs along the slope direction, perpendicularly to rear tensile fractures. It requires only one horizontal sensor on the unstable rock and another on the adjacent massif, which lowers the costs, compared to HVSR 3C surveys.
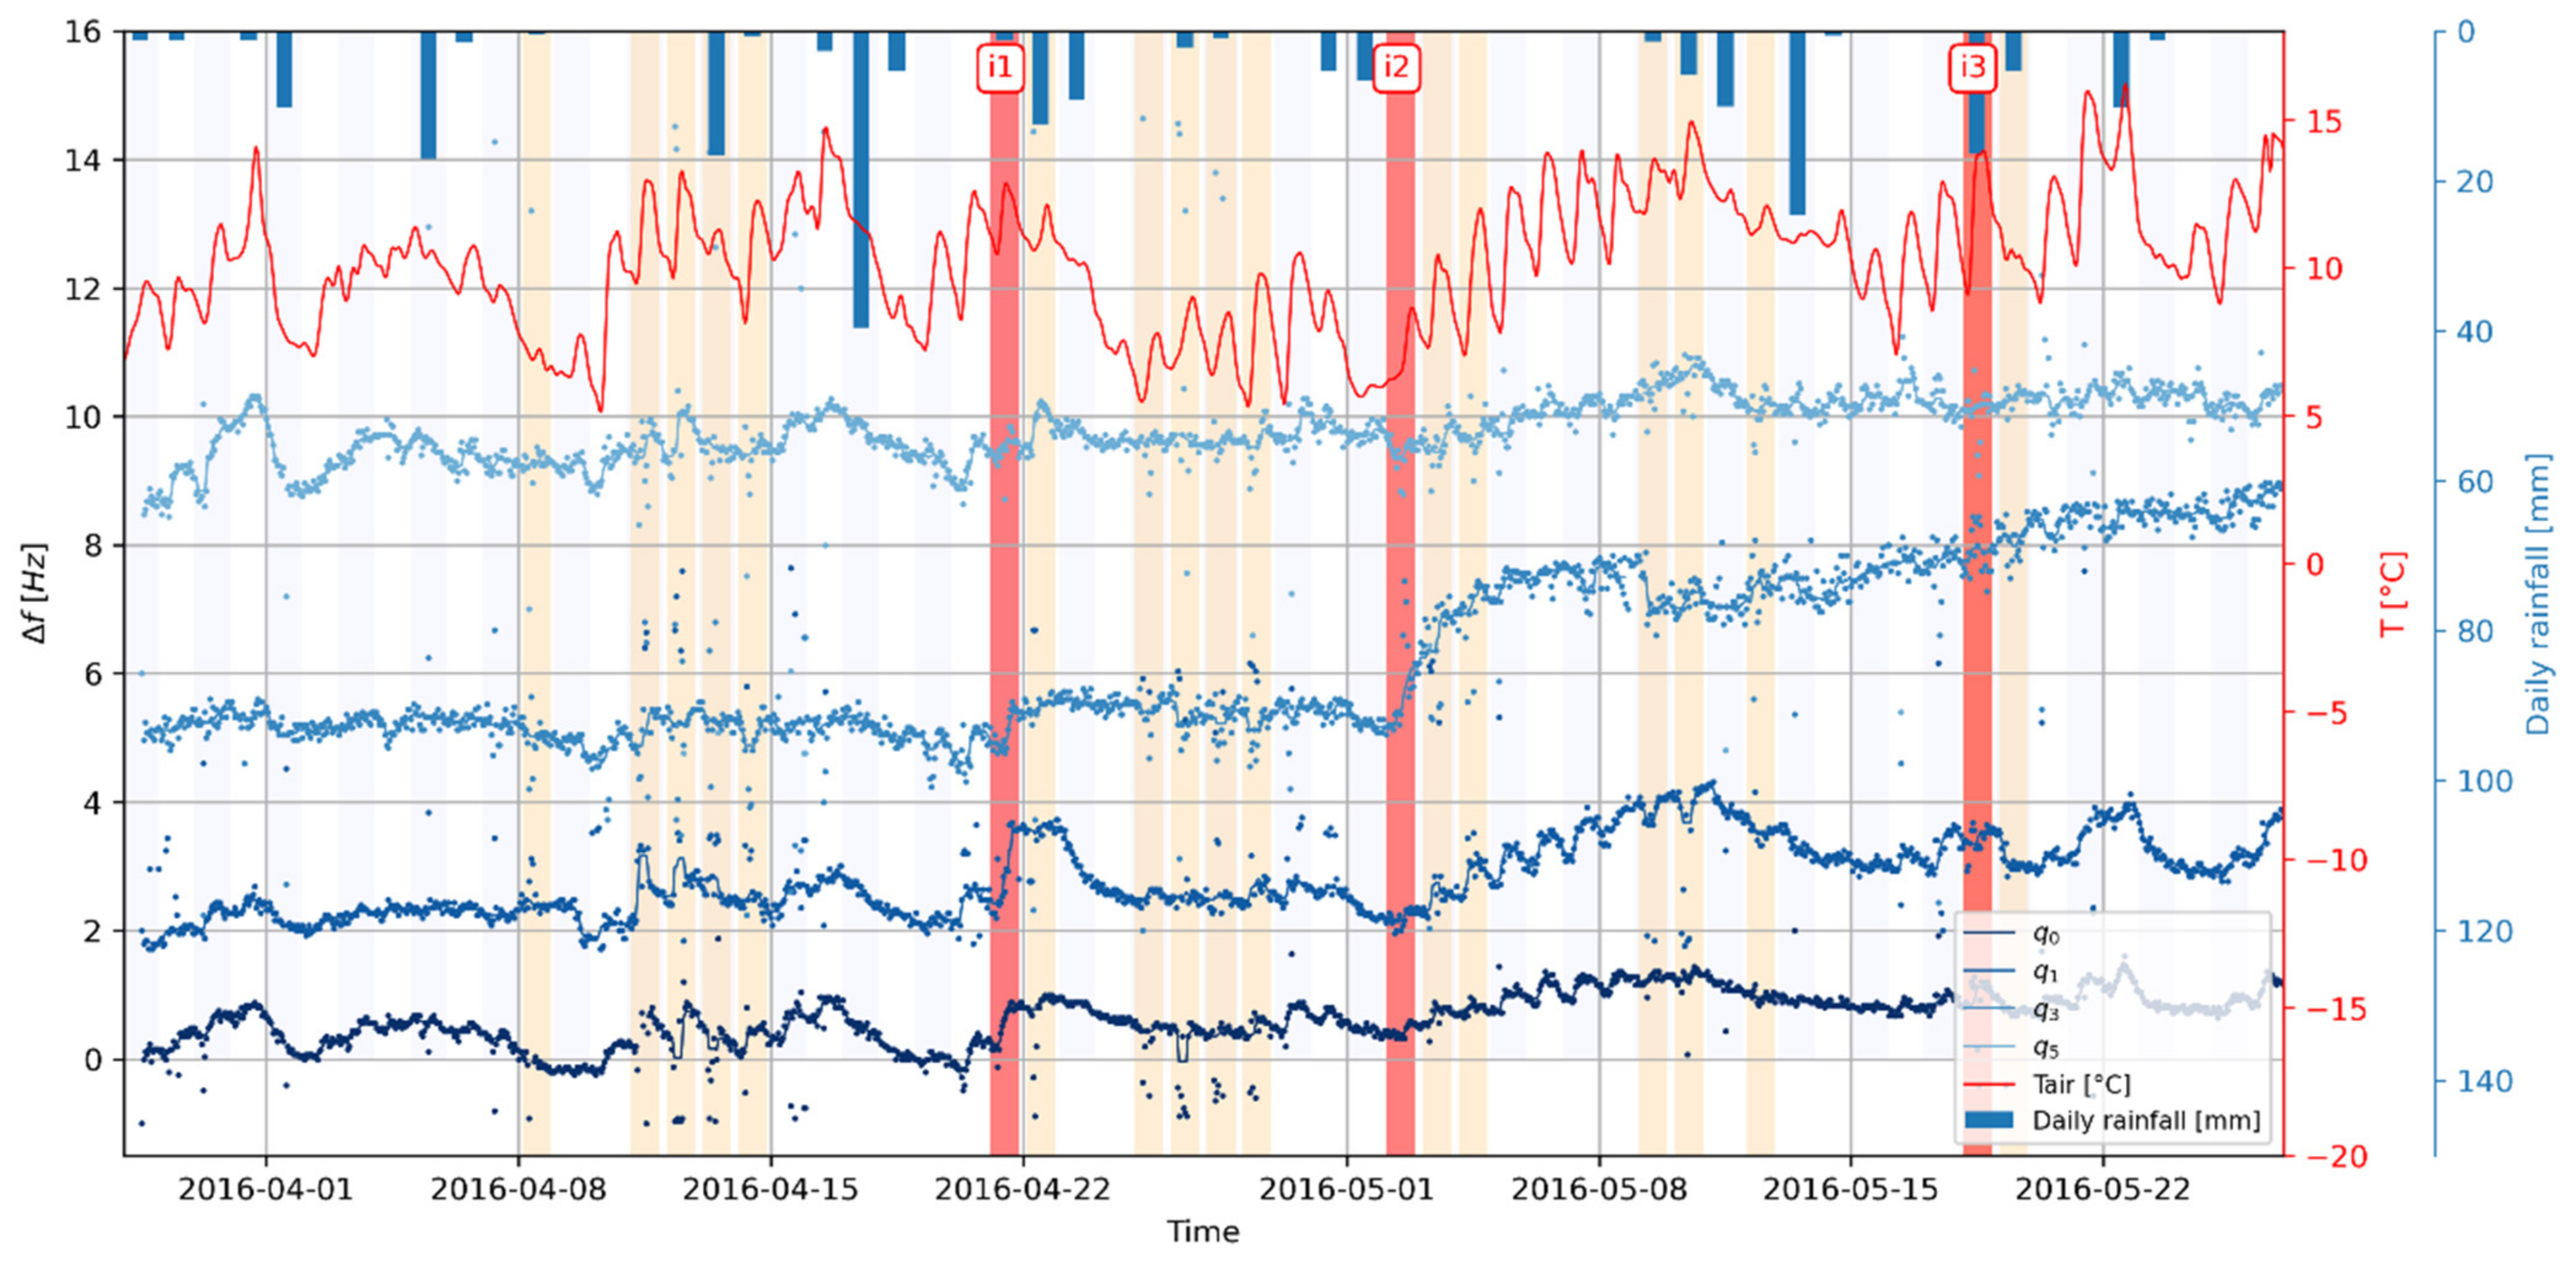
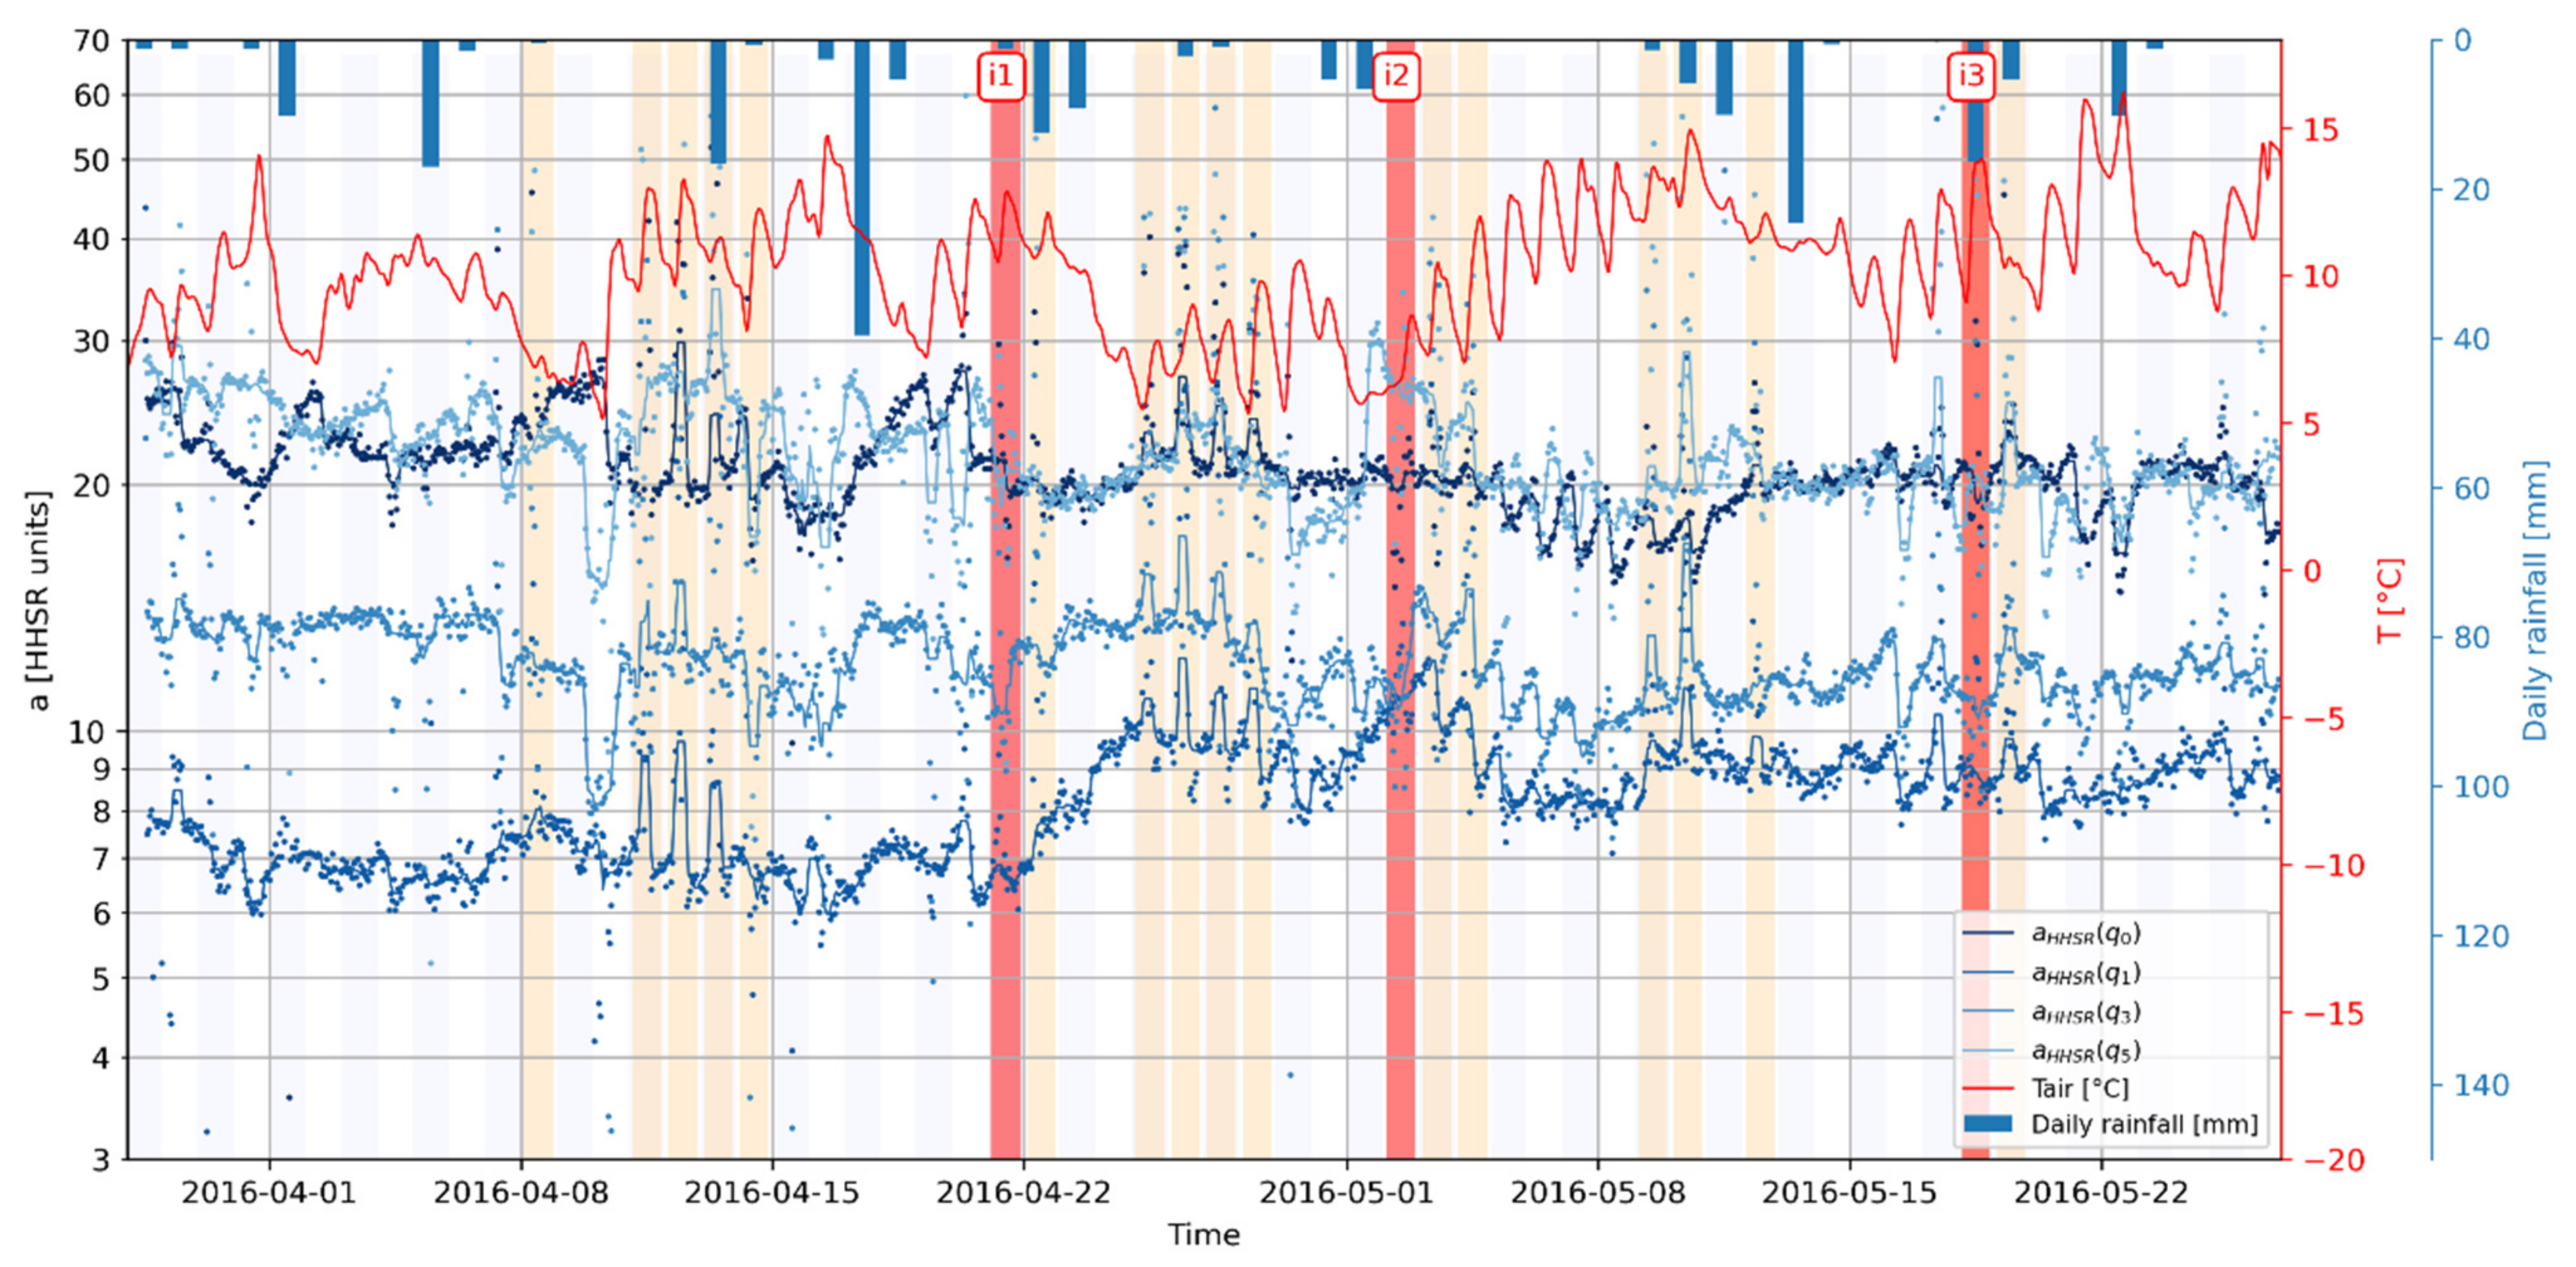
Variations in HHSR peak frequencies monitoring over time are shown in Figure 8 for peaks q0, q1, q3, and q5 (blue dotted curves, from dark blue to light blue). The air temperature recorded on-site is shown by the red curve and daily rainfall is shown with blue bars (top axis). Reinforcement work stages are shown in the background: drilling days (light orange) and grout injection (i1, i2, i3 in red). All peaks show a very consistent pattern related to thermomechanical control and peaks generated by borehole drillings (light orange background). No clear changes related to bolting are visible in the time series at this stage. Similar observations are made for HHSR amplitude monitoring (blue dotted curves, Figure 9). aHHSR shows sharp peaks related to drilling works (light orange background). aHHSR also shows fluctuations related to thermomechanical forcing, the HHSR amplitude being negatively correlated with air temperature. Amplitude for peak q1 shows a slight increase over the monitoring period, while q0, q3, and q5 tend to decrease. As observed for HVSR (see Section 4.3), the HHSR peak amplitude for upper modes should not be interpreted following the results of [50] since upper modes do not correspond to bending motion perpendicular to rear fracture along the east direction. Further investigations about HHSR amplitude are conducted in Section 5.

5. Sensitivity of Seismic Spectra Parameters to Bolting

In this second step, we explore the sensibility of the above-presented ambient vibration parameters to detect mechanical changes provide by the reinforcement bolting works. The bolts (i.e., the steel rebar and surrounding cement grout) provided an additional contact stiffness between the unstable column and the massif [80]. This represents the reciprocal process of progressive mass decoupling before rockfall. We hence expect an increase in natural frequencies and a decrease in mode amplitudes, as suggested by [50,64,78].
However, change detection for prone-to-fall rock compartments remains a very challenging task because environmental perturbations may match or even exceed the target signal [44,50,57,62]. In the following process, days with drilling works were removed from the dataset due to the very strong anthropic vibrations generated.
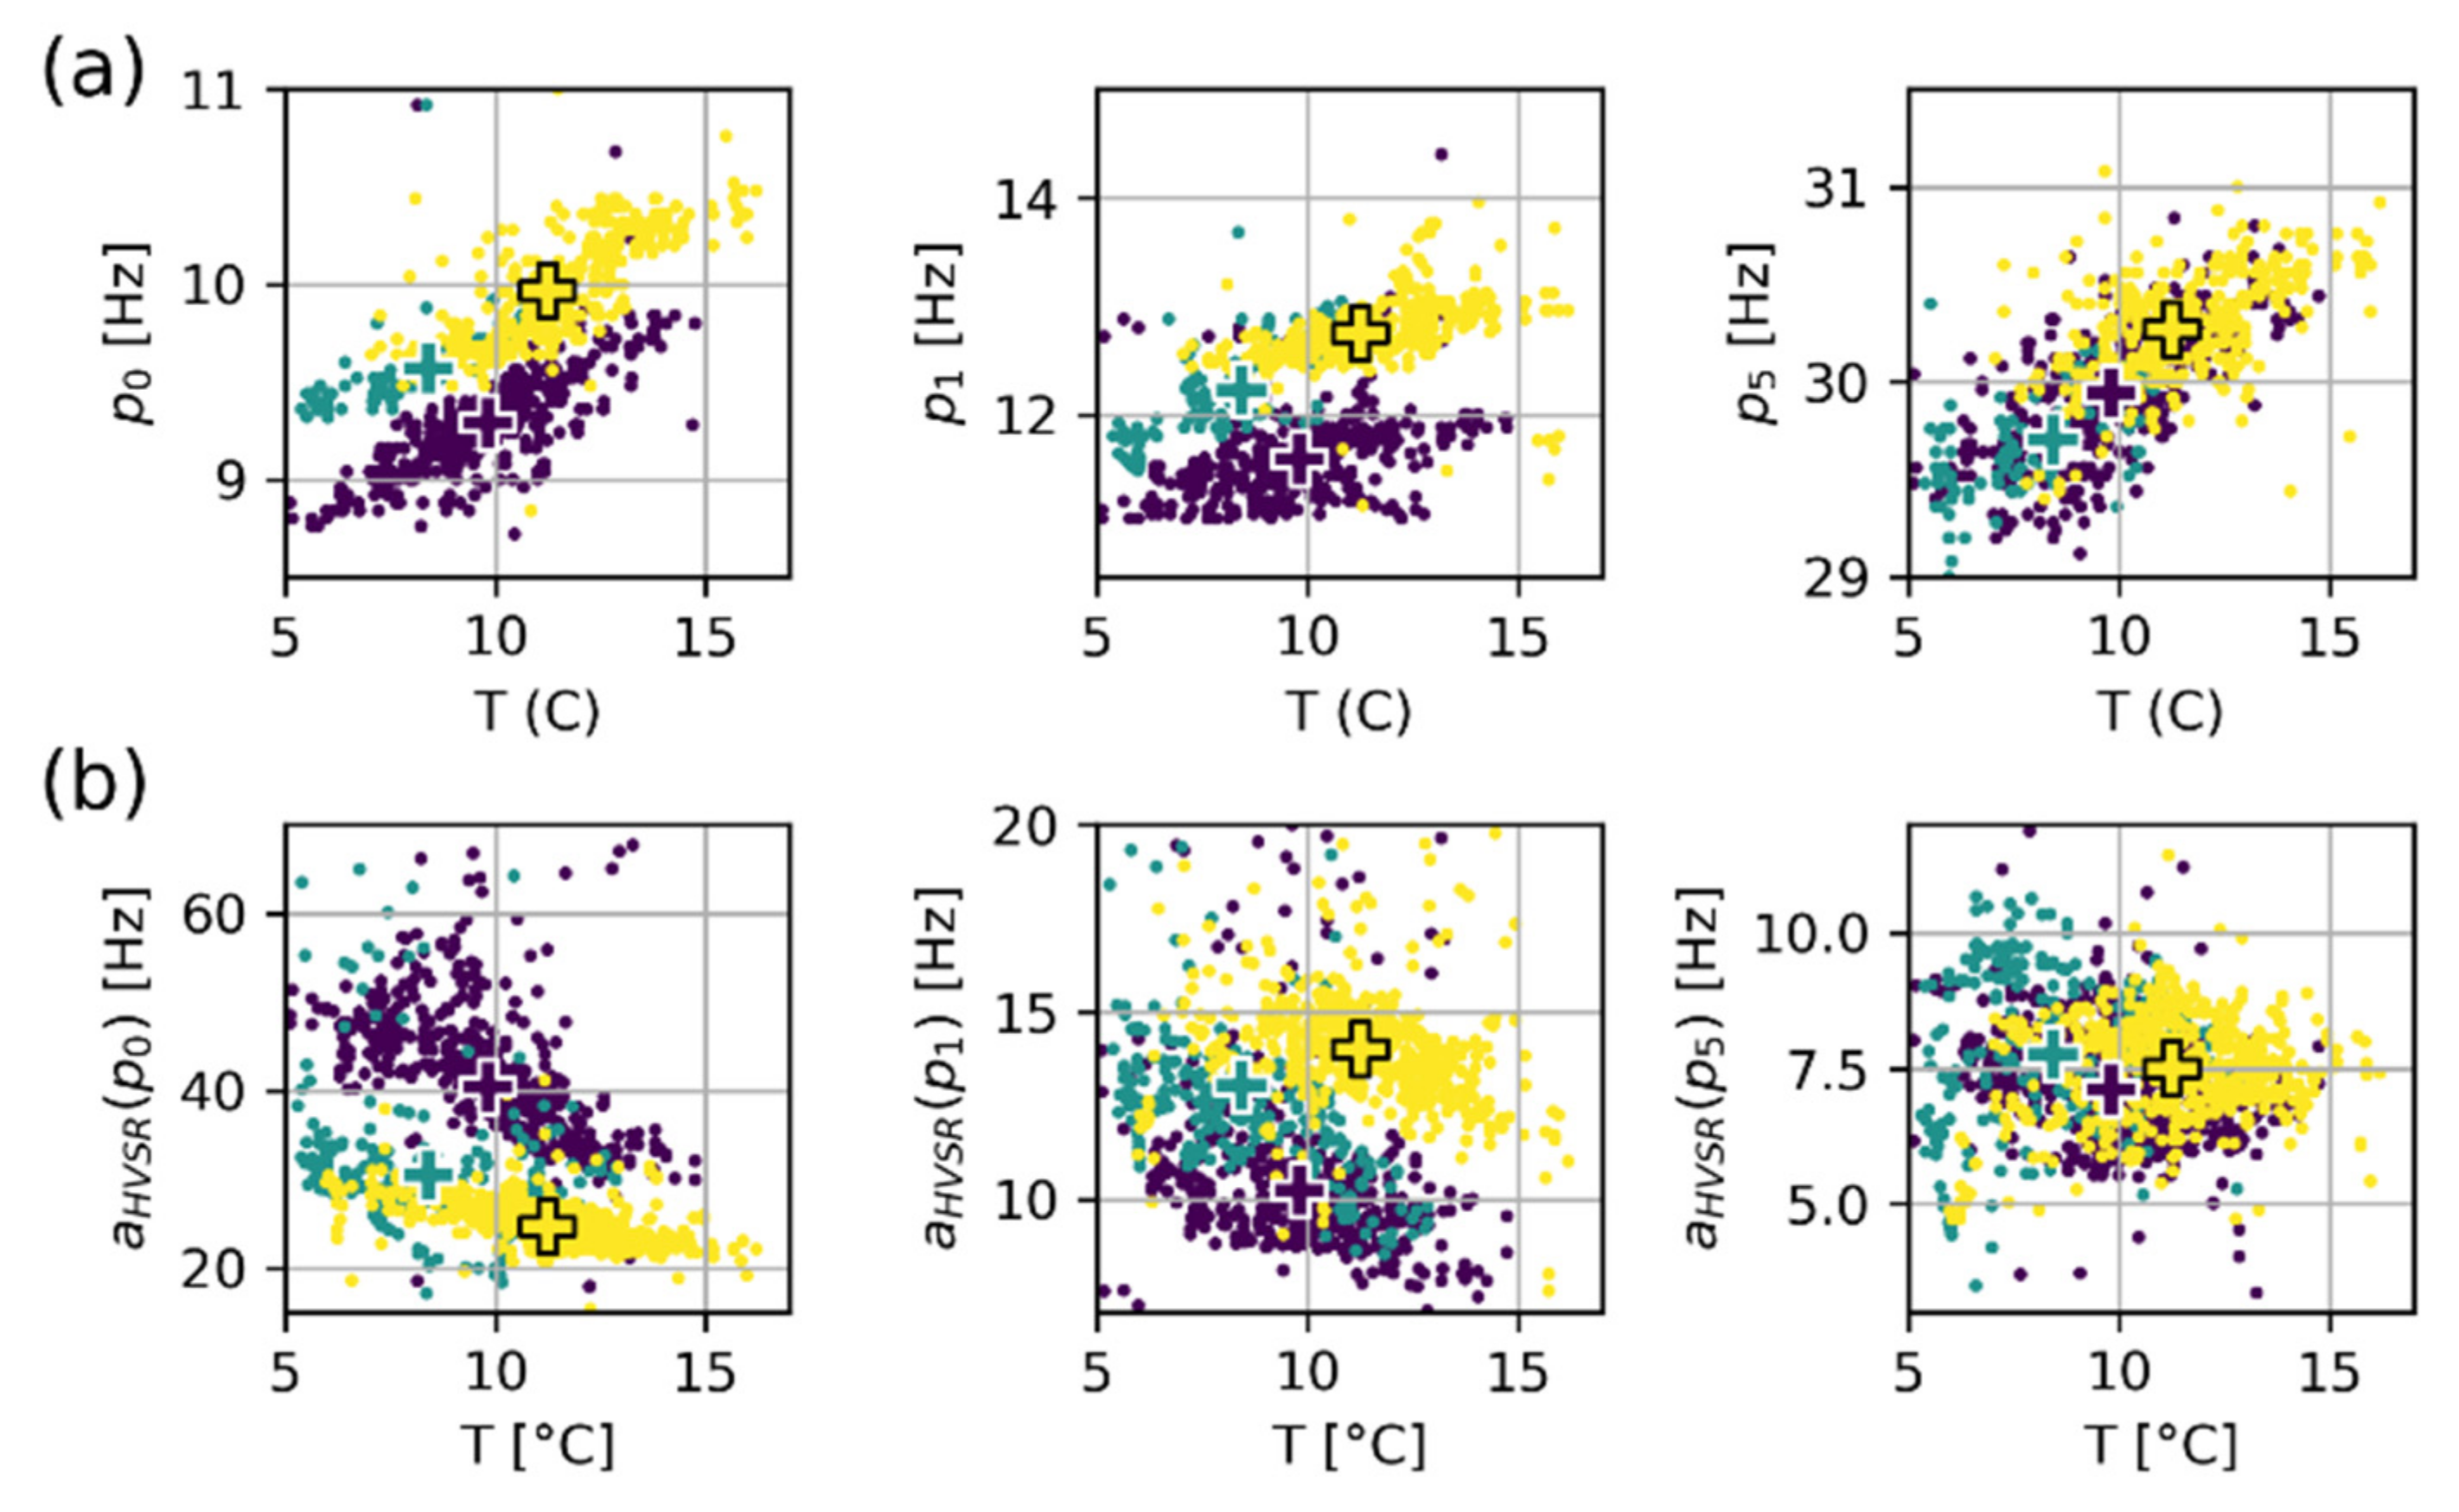
Temperature-frequency and temperature-amplitude distributions for FFT peaks are shown in Figure 10a,b, respectively. Blue dots represent data before grout injection i1, green dots between i1 and i2, and yellow dots after grouting i2. Colored crosses show the centroid of dots for each phase. Frequencies show a positive correlation with air temperature related to thermomechanical effects. Peak amplitudes show a slight decrease with temperature, but its amplitude remains small, compared to amplitude variations related to drilling activity (generally 3–4 orders of magnitude, Figure A1.
All temperature–frequency distributions shown in Figure 10a exhibit a clear shift from the initial stage (blue dots, period before grout injection i1), the phase between i1 and i2 (green dots), and after i2 (yellow dots). Peak frequency increases reach +7.5% and +13% for f0 and f3 peaks, respectively (Table 2).
Although amplitude evolution drawn in Figure 10b is less clear, we observe a significant amplitude increase with bolting works for all peaks except f7 (see details in Table 3). The amplitude of peaks f0 and f3 shows an increase of +91% and +41.2%, respectively (Table 3).
This rise in FFT amplitude on the unstable compartment is counterintuitive since the additional stiffness provided by the reinforcement works should reduce the column’s motion. This observation confirms that FFT amplitude is source-controlled rather than resonance-driven, as visible in large FFT amplitude variations pointed out on the stable massif (Figure 2b). This underlines the need for using spectral ratios for monitoring purposes, as shown previously in the temporal domain for particle velocity.
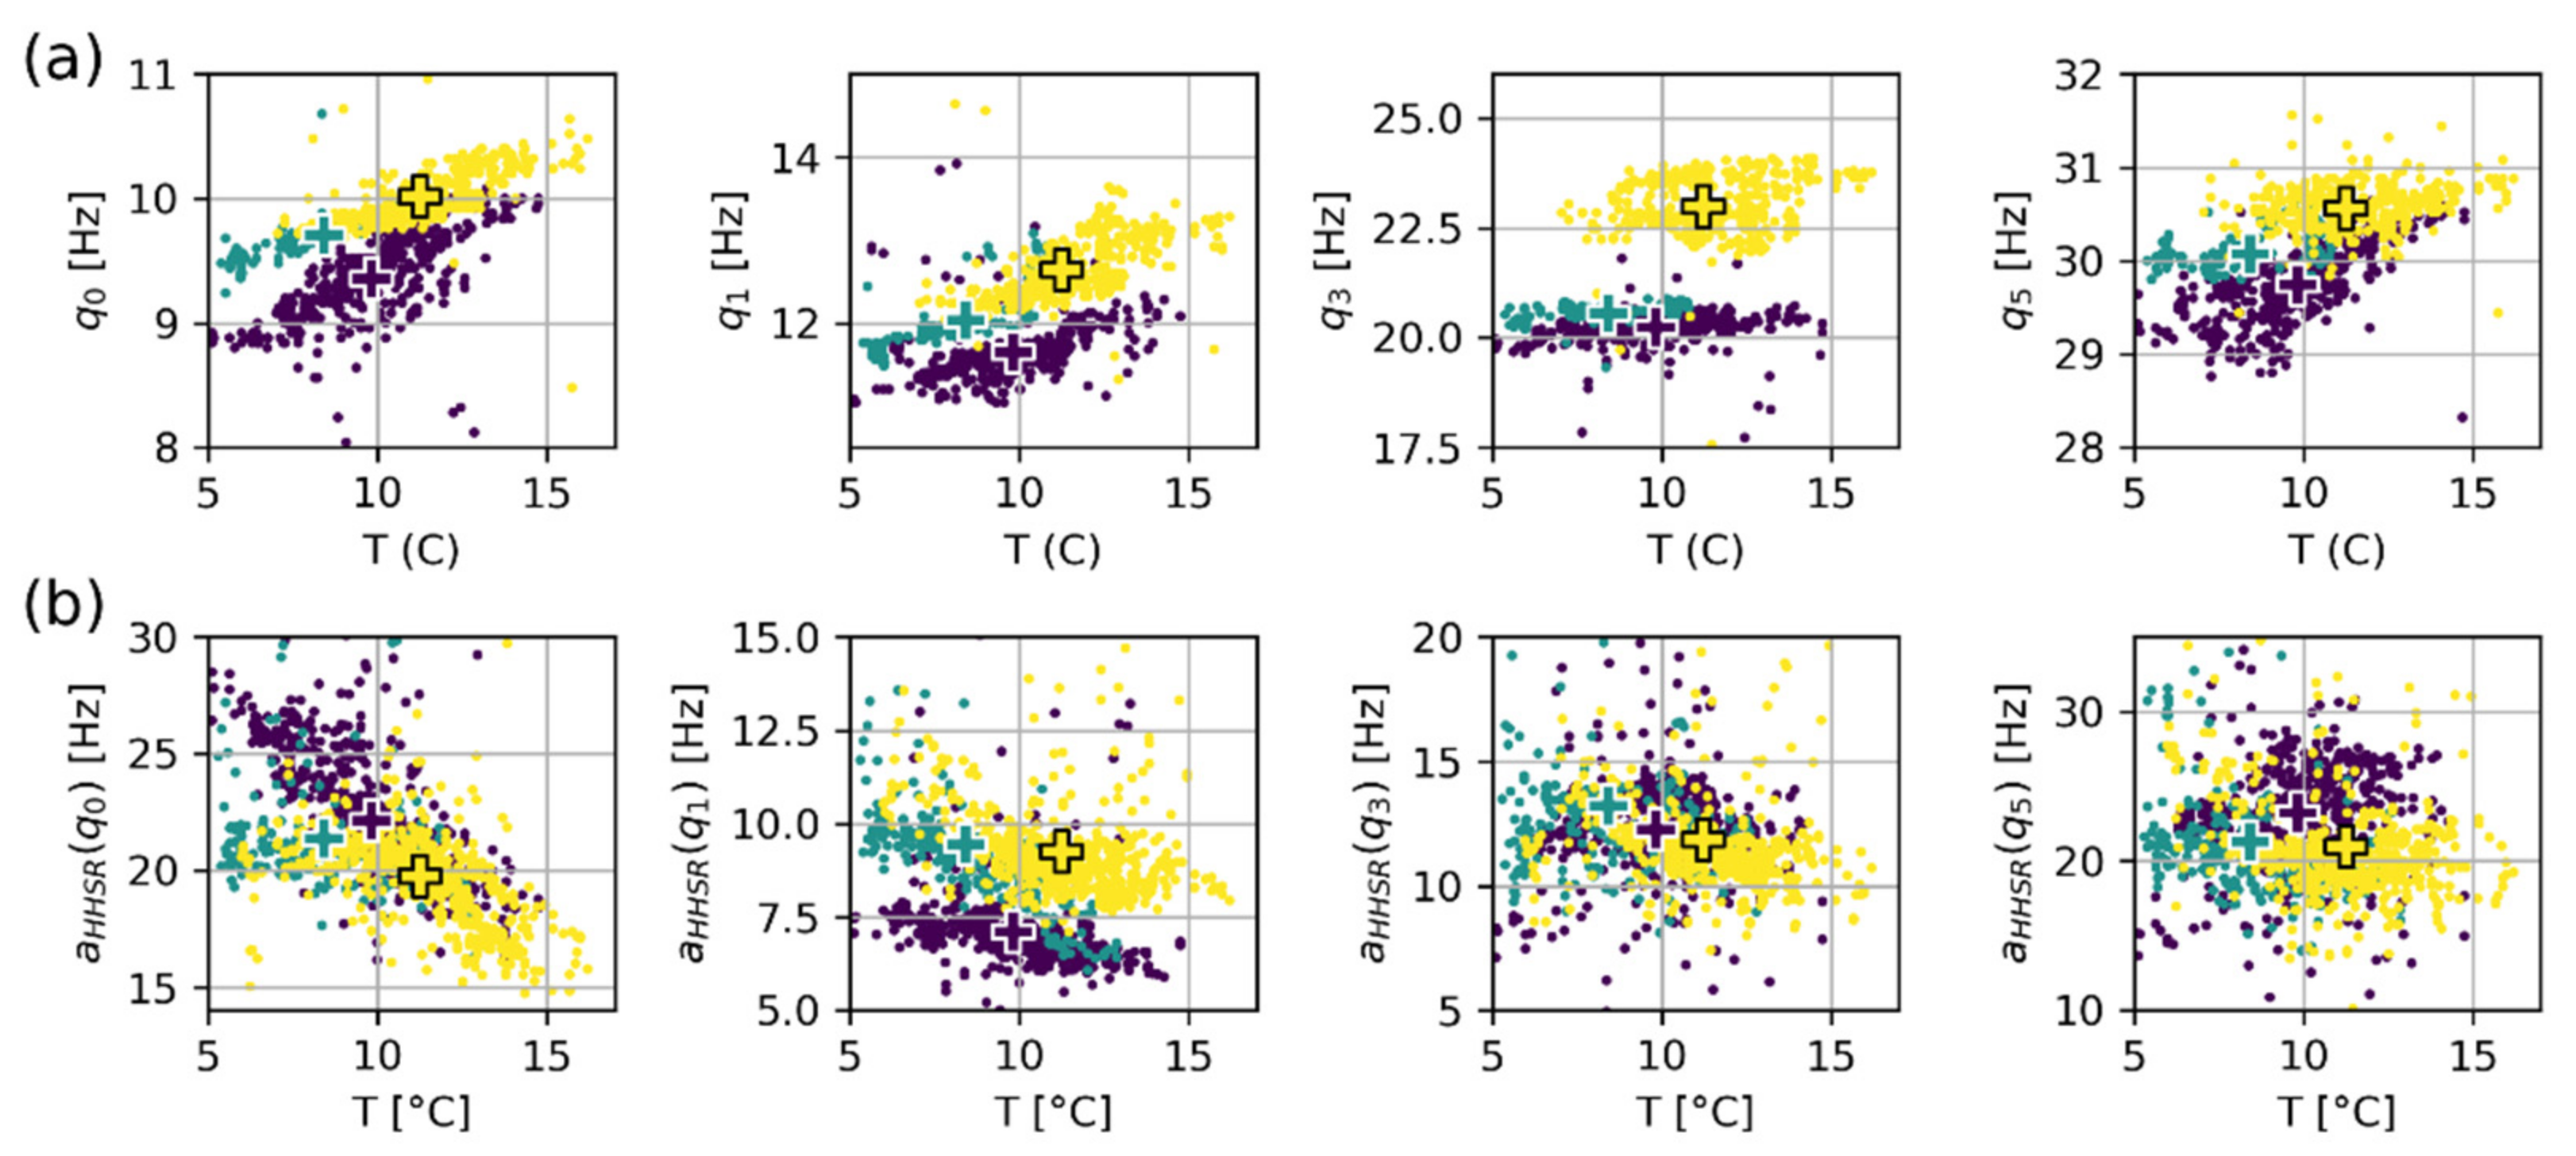
The same plots for HVSR and HHSR peaks are given in Figure 11 and Figure 12, respectively. As for FFT, a positive correlation between peak frequency and temperature is spotted. HVSR and HHSR peak frequencies tend to rise with the bolting, while peak amplitudes decrease. Table 2 show the relative changes in FFT, HVSR, and HHSR peak frequencies throughout the monitoring period. All three FFT, HVSR, and HHSR yield peak frequency increases in very good agreement. The fundamental mode (p0q0) and modes 1 (p1q1) and 3 (p3q3) show the largest frequency increases, with mean shifts of +7.0%, +9.1%, and +13.5%, respectively). These increases are of the same order of magnitude as found with the ARX model in a previous study, i.e., +8% for f0 and +17% for f3. The slight differences come mainly from the definition of the last phase, taken after i2 in this paper, compared to the last day of monitoring in [80].
Peak amplitude changes over the studied period are shown in Table 3. Assuming that the reinforcement works provide additional stiffness to the contact between the unstable column and the massif, [50] suggested that a reduction in HVSR and HHSR amplitude is expected for bending-like, perpendicular to rear fracture, fundamental mode amplitude. This is supported by our results showing a consistent reduction of −39% for aHVSR(p0) and −10.9% for aHHSR(q0) (see Table 3). In contrast, the upper modes show various magnitudes and signs, ranging between −39% and +171%. These upper modes indeed do not correspond to bending modes along with H (east) channel, and the bolting plays both with the stiffness and mass involved for each mode.

6. Novelty Detection Algorithms

Novelty detection algorithms generally consist of unsupervised or semisupervised learning problems, depending on the technique used and the nature of the training dataset [94,95,96]. Such methods have been applied to many data types, including time series [97,98,99]. For these data, one application consists of change point detection. In this case, the dataset is a single and often long sequence of events with temporal order [95]. Anomalies consist of a sudden change of behavior, compared to the training period. Applications are found in sensor reading processing, e.g., hydrological recording series [97]. In our prone-to-fall VB–SHM case study, environmental parameters and rock column’s dynamic parameters can be considered as related time series. The normal behavior then consists of the air temperature data forcing and corresponding rock column’s dynamic response measured before the bolting, i.e., before the i1 phase (21 April 2016). Considering the elliptical shape of (1) natural frequency vs. temperature (e.g., Figure 11a and Figure 12a) and (2) resonance amplitude vs. temperature (e.g., Figure 11b and Figure 12b) relationships, we selected the Elliptic Envelope (EE) novelty detection algorithm. This algorithm also advantageously requires only a few computing resources, which makes it suitable for edge-computing approaches [100]. We used the routine implemented in the Scikit-learn Python package [101,102]. This algorithm first computes the minimum covariance determinant on the training dataset, hence fitting an ellipse to the training data. The contamination parameter expresses the fraction of outliers lying in the training data and must be chosen adequately [94]. It must be defined during the training stage, making the outlier detection more or less sensitive. Classic values lie in the range of 0–5% but may vary significantly depending on the training data quality. During the novelty detection stage, every point lying into the ellipse is considered an inlier, while lying outside points are declared outliers. EE algorithm can be applied for multivariate analyses, i.e., for multidimensional dataset processing [103,104]. It assumes that data have a Gaussian-like distribution along every axis.
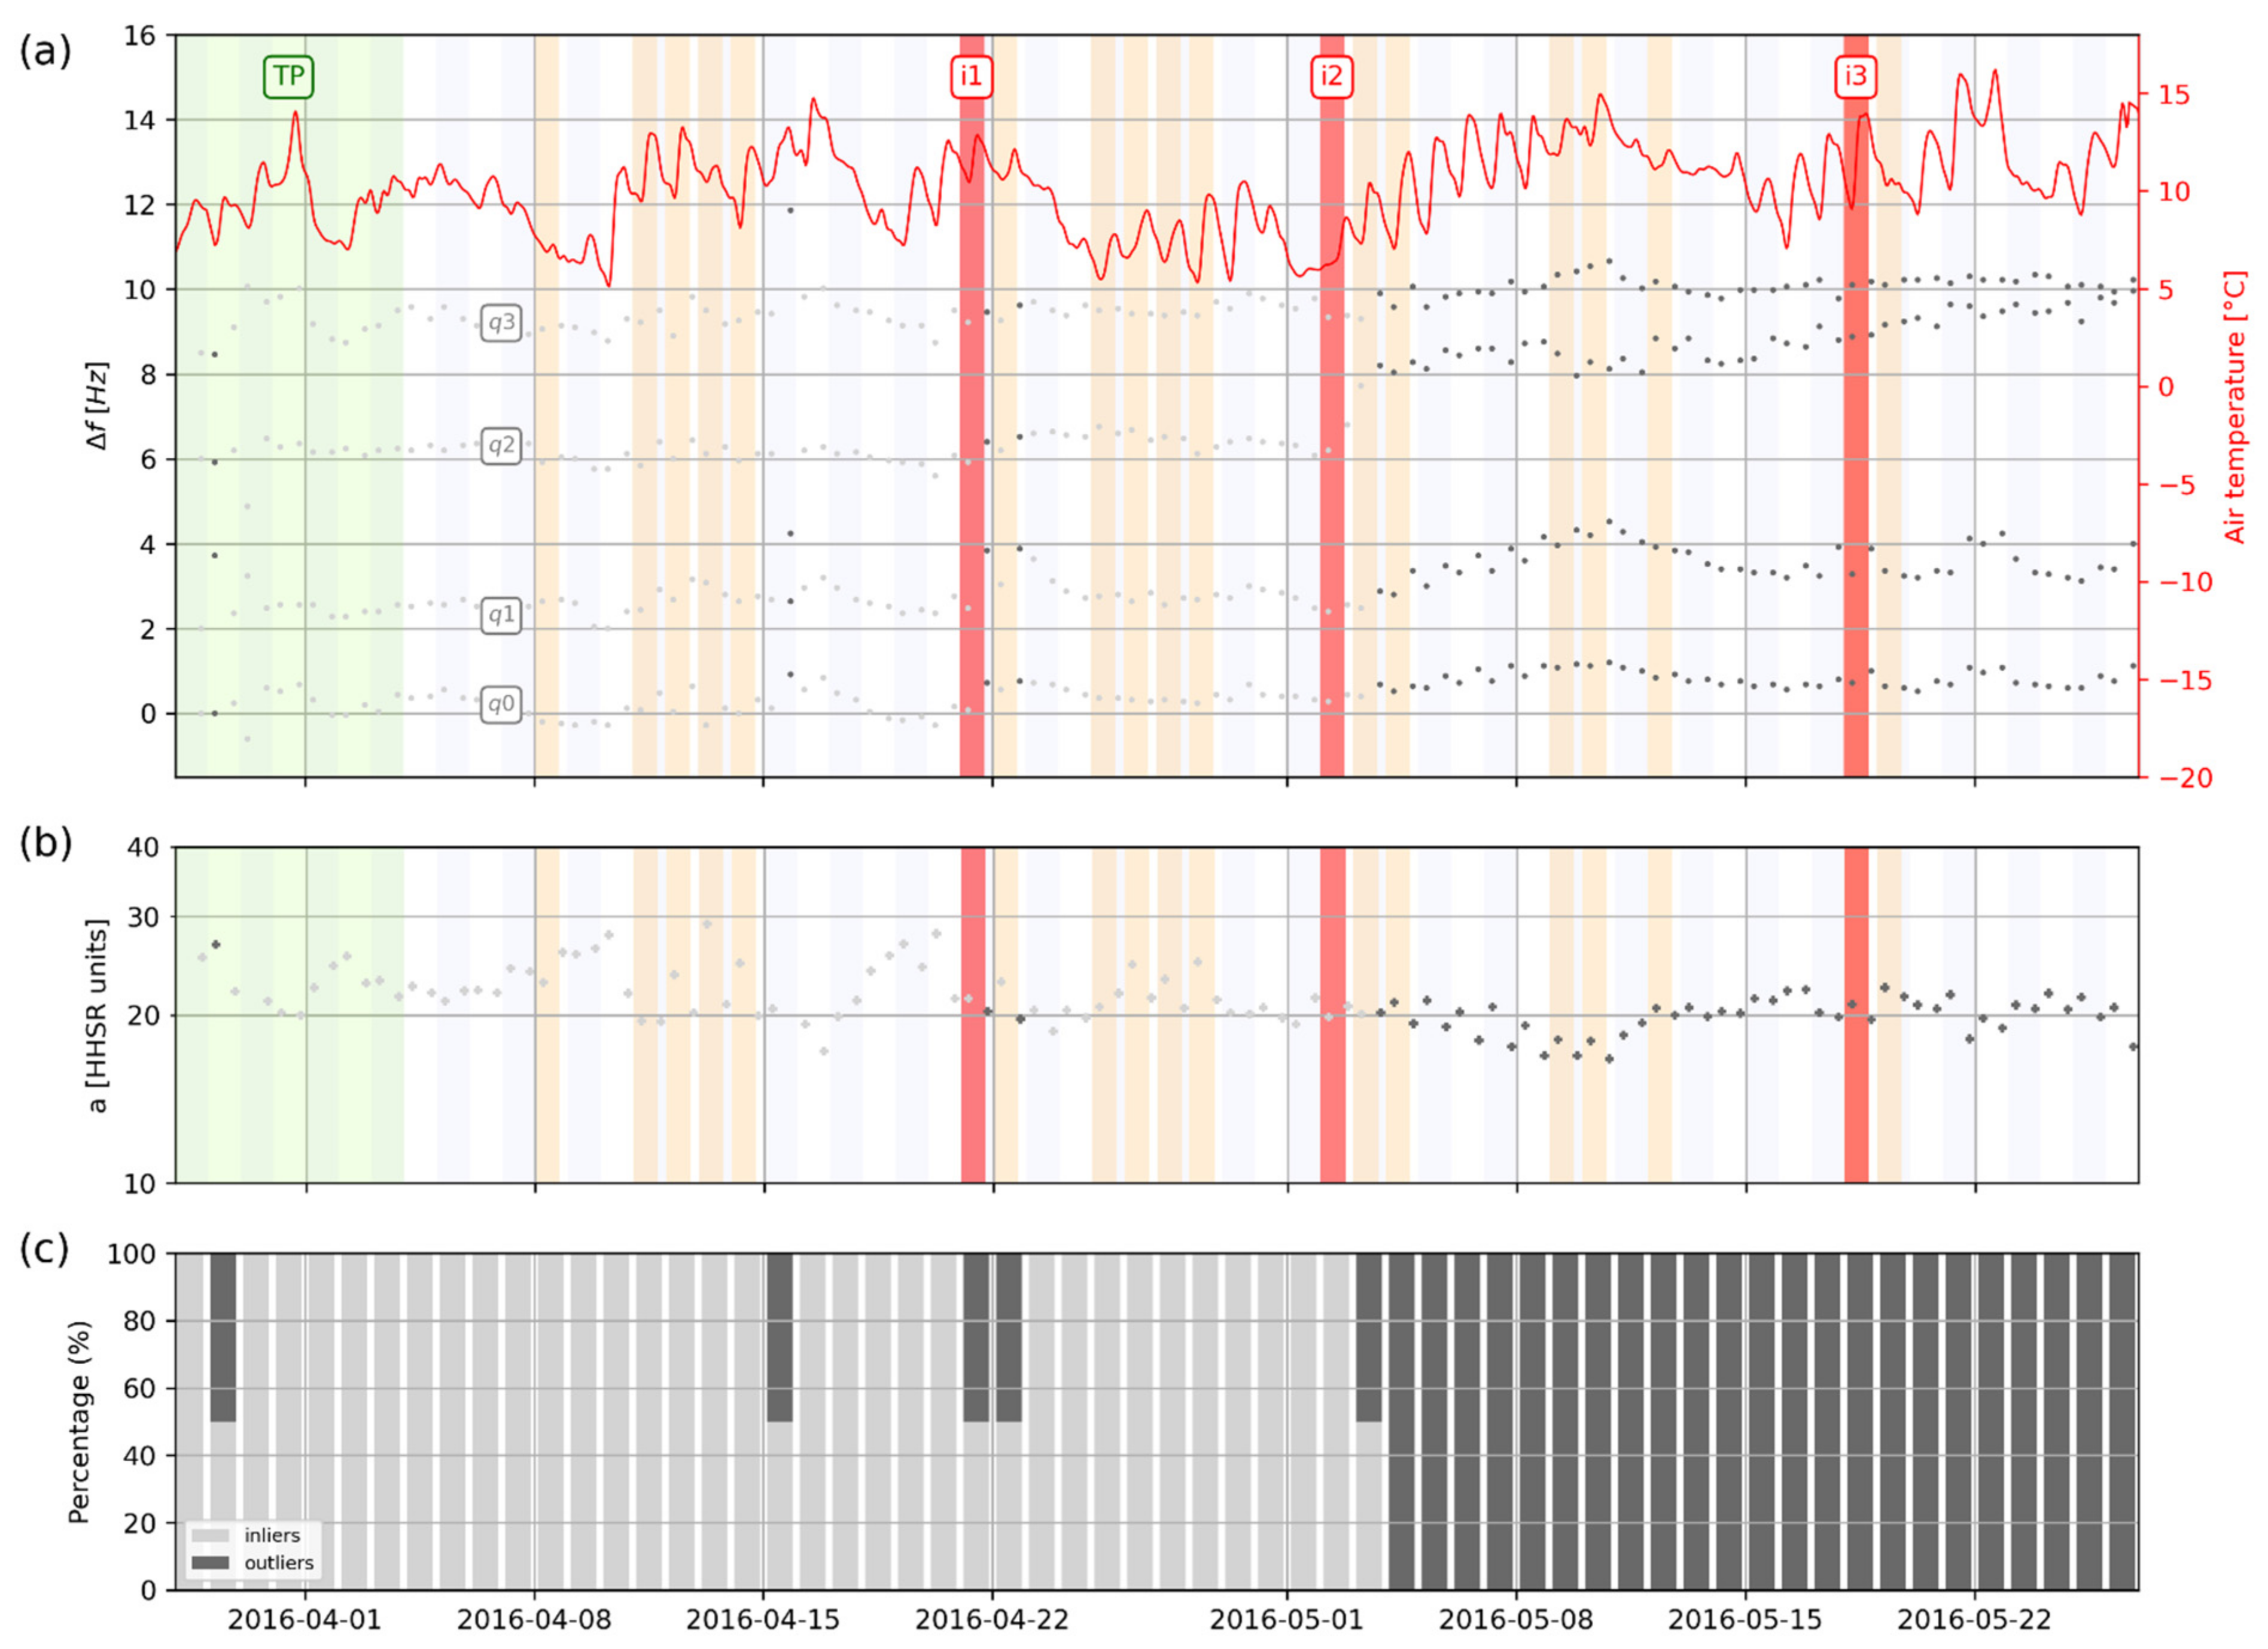
We applied the novelty detection algorithm on the HHSR time series. This seismic parameter revealed indeed robust and clearly brought out the column’s natural frequencies. The monitored dataset hence consists of HHSR peak frequencies fHHSR(q0, q1, q3, q5), the amplitude at mode q0 (aHHSR(q0)), and air temperature. It is referred to as dataset D1 hereafter. All time series are analyzed together with one hour sampling period. The algorithm was parametrized with a 7-day training period at the beginning (28 March 2016 to 04 April 2016), before the bolting works. This period was selected as a reasonable trade-off between sufficient training (4 days of data were observed as a minimum) and short enough to allow the evaluation of the algorithm robustness during the period before the works (05 April 2016 to 02 May 2016). The contamination parameter was arbitrarily set to 5%. Data from drilling days were discarded between 6 a.m. and 8 p.m. because of harder frequency peaking and unmeaningful amplitudes.
The novelty detection results are shown in Figure 13. For natural frequencies (a) and mode amplitude (b), inlier points are shown in grey (i.e., no significant change detected, points agree well with the elliptic shape fitted during the training period TP) and outliers are shown in black (i.e., significant change detected from initial training distribution). The percentage of inliers and outliers per day is shown as a bar graph in (c).
The novelty detection shows that most points are inliers between 28 March 2016 (beginning of the monitoring) and 02 May 2016 (day of grout injection i2). This suggests that EE is adequately insensitive to adverse thermomechanical variations affecting the column’s dynamic parameters. Yet, we spot a few outlier clusters in this period, most related to reinforcement works, which create variation in frequency peaking (10 April 2016 to 20 April 2016, Figure 13). Another outlier burst shows the 21 and 23 April 2016, i.e., right after grout injection i1. This effect is yet only temporarily detected, probably because i1 has only little influence on the column’s upper modes q3 and q5. A major change is detected on 03 May 2016 following grout injection i2. Most data lie irreversibly as outliers. These results show that EE’s novelty detection algorithm clearly detects the additional stiffness provided by the bolt grouting during i2.
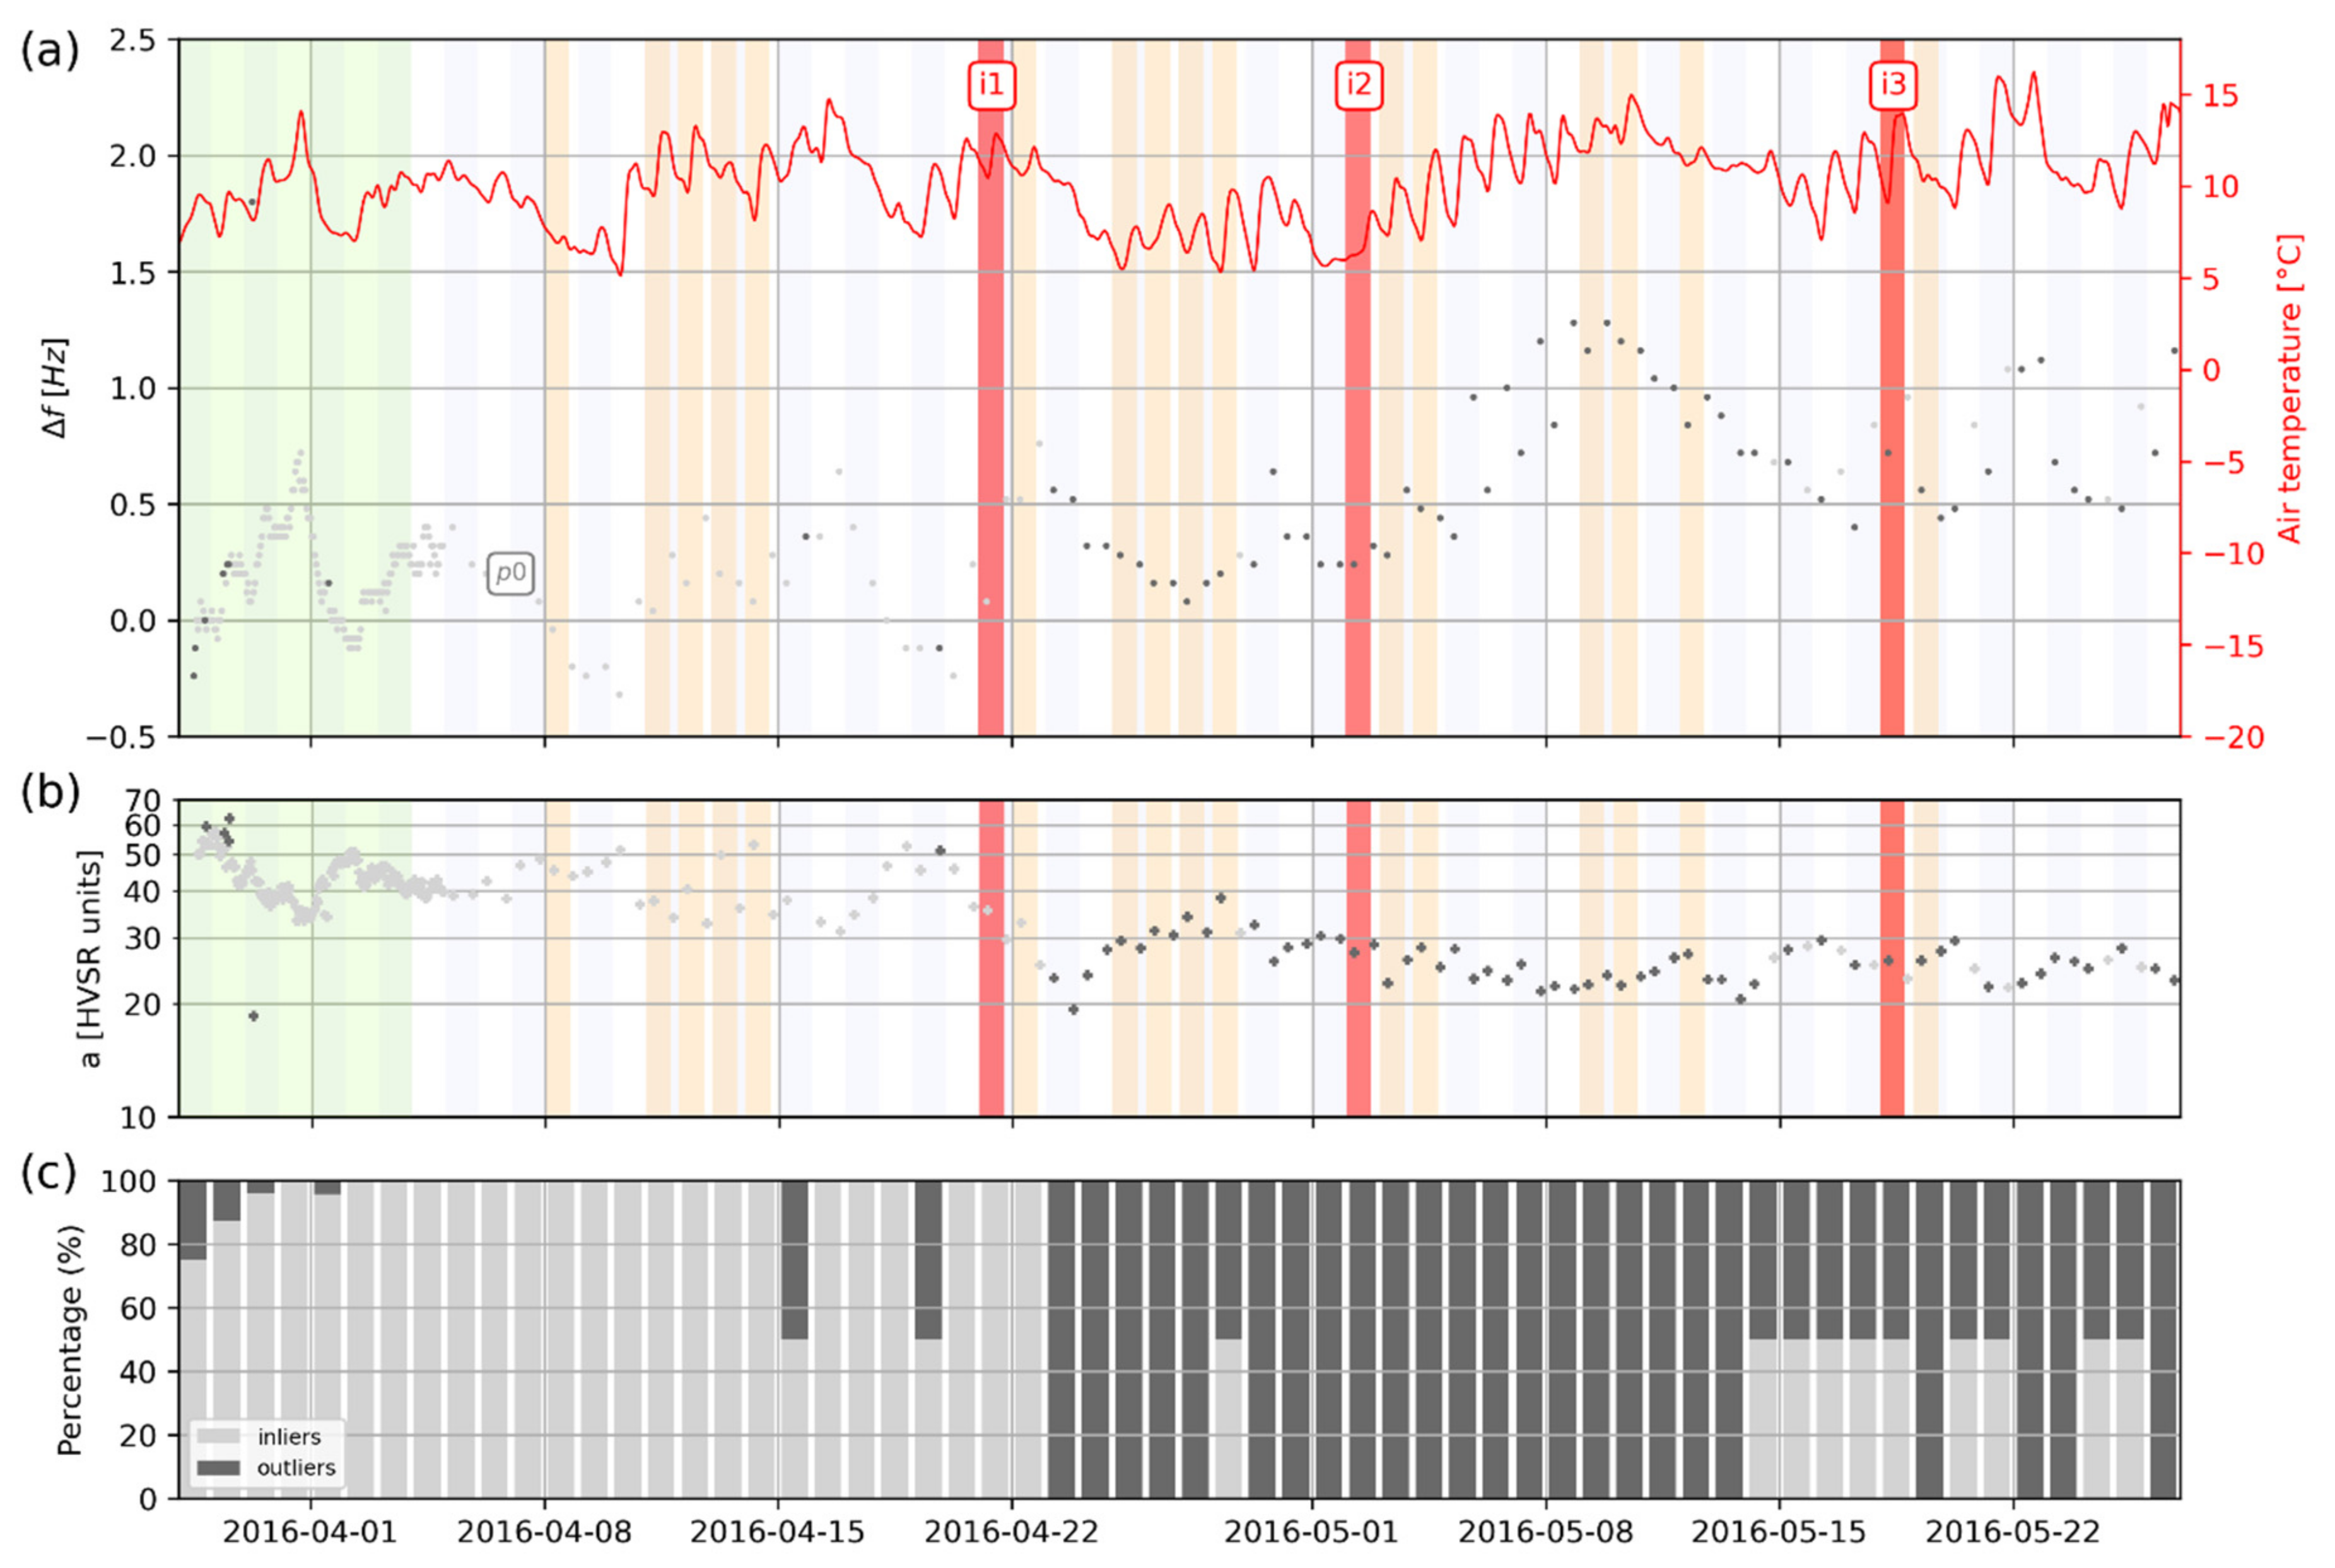
Considering these satisfying results on continuous data, we reduced the amount of information by simulating a triggered recording scheme on-site. This new dataset is referred to as D2 in the following. We selected two 1 h long seismic records starting at 6 a.m. and 20 p.m. each day, respectively. This downsampling was applied over the whole monitoring period, including the training period TP. These times were chosen because of reduced anthropic activity before and after working hours. The same EE novelty detection algorithm was applied to the downsampled dataset D2. Results are shown in Figure 14. As for the complete dataset D1, most of the D2 points lie in the initial distribution between the beginning of the monitoring and grout injection i1. A few isolated outliers are yet spotted during this period (29 March 2016 and 15 April 2016). Grout injection and following hardening i1 is once again only temporarily detected (outliers on the 21 and 22 April 2016). We note that the outliers systematically reach a 50% proportion in Figure 14c because the data downsampling keeps only two points per day in D2. The grout injection and hardening i2 are very clearly detected on 03 May 2016 since most points become outliers after this date (Figure 14b). These results compare very well with the analysis conducted on the full dataset D1 (Figure 13) and support the feasibility of monitoring unstable rock compartments with short-duration triggered ambient noise records on-site.
We tried to push further the application of the EE algorithm by processing only the fundamental frequency and associated amplitude, together with air temperature. This reduced dataset is referred to as D3 in the rest of this article. Acquisition of dataset D3 would advantageously require only one seismic sensor set up on top of the unstable column in the field. The fundamental peak is indeed very robust, can be easily picked on most unstable rock compartments, and reflects its global behavior. Since HVSR showed the largest changes for the fundamental mode during the bolting works (see Table 2 and Table 3), we chose to process p0 and aHVSR(p0) along with air temperature. We used downsampled time series (two points per day) for novelty detection. We yet kept a one-hour sampling period during TP to ensure a sufficient amount of data for training using only one vibration mode. The results for D3 processing are presented in Figure 15. They appear consistent with previous results obtained with D1 and D2 since most points drift from the initial distribution because of the bolting works. However, a significant change is detected sooner in D3, i.e., right after grout injection i1 during progressive grout hardening. These results agree well with Section 5 because the fundamental mode was shown to be the most sensitive to i1, while higher modes mostly rose after i2. This higher detection sensitivity obtained by processing the sole fundamental mode appears yet slightly less stable since a few points become inliers again at the end of the monitoring period (Figure 15c).

7. Discussion

This study investigates the feasibility of monitoring unstable rock compartments with the VB–SHM approach with the aim of paving the way for lightweight, power-efficient, edge-computing solutions. First, easy-to-compute, robust, and relevant seismic parameters must be selected for monitoring.
Although some studies show that statistical parameters can be extracted from raw, time-domain vibration measurements [34,43], our study showed that the use of the Particle Velocity (PV) parameter and PV ratio does represent the best choice for rock compartment monitoring. PV time series indeed appeared mostly controlled by variations in ambient noise source amplitude rather than by column resonance effects (Appendix B). In addition, PV processing required a priori filtering in a narrow bandwidth around f0 for best results. This represents a significant disadvantage since the f0 value is expected to change during the monitoring period.
In contrast, all three FFT, HVSR, and HHSR estimators succeeded in evidencing clear spectral peaks on the unstable column.
FFT spectra showed the best detection ability, revealing all-natural frequencies present along the east channel [78]. Such monitoring requires only one channel, oriented along the main direction of vibration, i.e., generally along the slope direction. FFT spectra yet showed significant amplitude fluctuation with time, revealing large sensitivity to drilling workdays and environmental wandering in ambient noise. FFT should hence be used carefully for monitoring purposes: peak frequency peaking may reveal difficulty due to low spectra repeatability and peak amplitude should not be taken into account.
The use of spectral ratios (HHSR and HVSR) allowed suppressing much ambient noise source variation effects, yielding very consistent amplitude and spectral content. Such observation was also made by [50] for the Bory site, with a clearer curve and a neater fundamental peak using spectral ratios (especially HHSR) than with FFT.
However, we recommend great caution when interpreting HVSR on unstable rock compartments because higher spectral peaks may not coincide with natural frequencies. In our case, only the fundamental mode and modes 1 and 5 could be isolated on HVSR curves (Figure 4a). In addition, HVSR theoretically requires rotating the three components to make the horizontal plane colinear with the slope, which is rarely conducted in the literature. Consequently, the unrotated vertical component frequently shows a peculiar spectrum with peaks and troughs, which affects HVSR. Despite these restrictions, HVSR amplitude at fundamental mode aHVSR(p0) showed the largest decrease related to the bolting, i.e., −39%.
HHSR requires two seismic channels on-site, one on the stable massif and one on the unstable compartment, both colinear and perpendicular to the main slope fracturing extension. In our case, it succeeded in evidencing all unstable column’s natural frequencies from the fundamental mode up to mode 5, with very reproducible, easy-to-pick, spectral ratio curves (Figure 7). The amplitude of the fundamental mode showed a consistent but limited decrease (−10.9%) during the bolting. This HHSR amplitude decrease at fundamental mode is three times smaller than the corresponding HVSR amplitude reduction. This might be due to our experimental setup where the reference sensor BOREF is located close to the unstable column and partially records its vibration (see Figure 2b). This proximity between sensors was forced by the site configuration, the vertical cliff preventing the further location of the reference sensor (Figure 1b). The reference sensor should be located further in future studies.
These results suggest that monitoring unstable compartments could be achieved with the following two approaches:
-
The first strategy consists of monitoring as many natural frequencies as possible, e.g., derived from HHSR, which facilitates the peak peaking process due to the normalization of spectral ratio. This assumes that most frequencies will experience significant changes during the monitoring, which is not straightforwardly supported by our results;
-
The other strategy consists of monitoring the sole fundamental mode since it represents the global behavior of the prone-to-fall mass. This can be achieved with HVSR or HHSR indistinctively, which show a similar change in fundamental natural frequency.
Whatever the approach, we recommend using the amplitude of the fundamental mode (aHVSR(p0) or aHHSR(q0)) only as a secondary parameter. Its value remains indeed very sensitive to environmental parameters such as drilling works (this study) or strong winds [50]. Higher resonance modes show unclear behavior and should not be included a priori in the monitoring without a dedicated survey including 3D reconstruction and numerical modal analysis.
In the case of the sole use of the fundamental mode, the choice of HVSR revealed pertinent in our case. It showed an increase in resonance frequency similar to HHSR (i.e., +7.5% versus +6.4%, respectively) but shows a greater amplitude decrease (−39% in aHVSR(p0) versus −10.9% for aHHSR(q0). This might yet be due to our experimental setup with a nearby reference sensor, which limits the decrease in aHHSR(q0). This will require a confirmation from complementary studies, with the further location of the reference sensor.
In order to test the feasibility of automatic VB–SHM data processing, machine learning routines have been used to detect the mechanical changes related to rock column bolting. Among many automatic detection algorithms [3,34], we selected the Elliptic Envelope (EE) routine [102,104] because of the elliptic-shaped distribution of seismic parameter vs. temperature (see Figure 10, Figure 11 and Figure 12). EE offered good performance on discontinuous, heterogeneous time series and required only a short training period (e.g., 7 days in this study). This allowed a very quick use of the system after startup. We yet should mention that the SHM training period is used to describe the baseline behavior of the structure [2,7,35]. As a consequence, training should occur before the occurrence of significant mechanical changes. This can prove difficult in practice, where prone-to-fall compartments may be detected late toward failure. In addition, training the algorithm may reveal to be longer and trickier in sites subject to long-period trends such as seasonal variations. This will require further tests to adapt the length of the training period and update the training model when necessary [105,106]. In our case, the monitoring period extended only over a few months, which allowed controlling most of the environmental factors.
The EE parameterization on the training dataset revealed simple: a single “contamination” parameter must be set, reflecting the number of outliers in the training data [96]. In comparison to pseudo-physical ARX models, the implementation of the EE algorithm is much easier in practice [37,80]. Especially, EE does not require continuous data, contrary to ARX, which fails to handle monitoring gaps. Such gaps cannot be excluded for remote instrumented sites in a mountainous environment. However, we point out that EE processing remains restricted to linearly correlated datasets. Other detection algorithms may be necessary for more complex relationships between forcing parameters and SHM data, such as seasonal variations and/or icing [44,48,49,57,62].
For the present rock bolting case study, the EE novelty detection algorithm performed very well. We tested various datasets by (1) changing the number of considered seismic parameters and (2) modifying the acquisition scheme by altering the sampling rate and sampling scheme of the data. The joint monitoring of several resonance peaks and amplitude at fundamental mode in datasets D1 and D2 improved the change detection robustness. However, this robustness came at the price of sensitivity since higher modes appeared only a little sensitive to grout injection i1. In contrast, the latter dataset D3 containing only the fundamental mode natural frequency (p0), amplitude (aHVSR(p0)), and air temperature succeeded in detecting grout injection i1. In the absence of a priori specific modal survey, we recommend giving more weight to the fundamental mode in automatic detection parametrization as this mode generally reflects the behavior of the whole unstable mass.
Whatever the dataset, the EE algorithm succeeded in removing adverse thermomechanical variations affecting the column’s dynamic parameters and detect the underlying changes in dynamic parameters due to bolting. We think that such detection performance should suffice for monitoring rockfalls, for which significant drops in dynamics parameters are expected before rupture [64].

8. Conclusions

This study paves the way toward monitoring unstable rock compartments with lightweight, power-efficient, edge-computing solutions. We tested this innovative approach with Vibration-Based Structural Health Monitoring (VB–SHM) records made during the bolting of a ~760 m3 limestone rock column (Vercors, France).
Our study highlighted the following findings:
-
Spectral estimators such as FFT, HVSR, and HHSR can be used to point out unstable compartment natural frequencies, although the use of HVSR should be restricted to fundamental mode only;
-
HHSR appears as a good trade-off between spectral stability and accuracy. HHSR amplitude yet revealed sensitivity to the location of the reference sensor. This sensor should be set close enough to the site to depict the incoming wavefield but far enough from the rock compartment to avoid recording its natural frequencies;
-
Column-shape rock compartments with clear rear fracture can be monitored with such lightweight instrumentations that are set up with a reduced number of sensors/channels.
For other sites, VB–SHM might require a preliminary survey to investigate possible peculiar resonance effects.
We also showed the following points regarding novelty detection algorithms:
-
The automatic Elliptic Envelope routine successfully removed adverse thermomechanical fluctuations affecting the time series. Such fluctuations substantially complicated the operational use of VB–SHM on natural structures until now.
The selection of the detection algorithm should yet be checked carefully on the training dataset, as different thermomechanical behaviors may be observed across study sites;
-
The novelty detection algorithm performed well on reduced datasets with only a few measurements per day. This suggesting that a triggered-recording scheme (e.g., a few tens of minutes of ambient vibrations recorded each day) could be used for massive power savings;
-
Ad hoc, robust, low-cost, and low-power hardware instrumentation with telecommunication ability is now required to facilitate such surveys in remote mountainous areas;
-
These promising results for rock bolting detection should also be tested against progressive damage before rockfall.

Author Contributions

Conceptualization, methodology, investigation, L.B., P.B., D.J., E.L., D.J., and A.C.; software, P.B., L.B.; validation, L.B., D.J., and E.L.; data curation, P.B.; writing—original draft preparation, P.B.; writing—review and editing, L.B., O.B., and H.C.; supervision, D.J. and E.L.; project administration, P.B. and L.B.; funding acquisition, P.B. All authors have read and agreed to the published version of the manuscript.

Funding

This research was funded by the C2ROP project (IREX-INDURA, www.c2rop.fr, accessed on 2 June 2021) and VOR program from Univ. Grenoble Alpes. ISTerre is part of the Labex Osug Habitability (https://www.osug.fr/en/labex/presentation, accessed on 2 June 2021).

Data Availability Statement

Not applicable.

Acknowledgments

Thanks to the L. Lorier; A. Mathy; J. Bourdat for raising their attention to this site and allowing its instrumentation. Authors express gratitude to Hydrokarst company (B. Arnaud; J-Y. Boussant) and CG38 (T. Sarras-Bournet) for granting access to the worksite, providing details on bolting design and the high-resolution DEM of the area.

Conflicts of Interest

The authors declare no conflict of interest.

Appendix A

Figure A1. Spectral amplitude of peaks f0, f1, f3, f5, f6, and f7 with time, labeled aFFT(fn) (logscale on Y-axis). Continuous lines show the rolling median computed on 12 h long windows. Air temperature on-site is shown as red curve, and daily rainfall is shown as blue bars (downward axis). Reinforcement work stages are shown in the background: drilling days (light orange) and grout injection (i1, i2, i3 in red).
Geosciences 11 00242 g0a1
Table A1. PV changes between bolting stages.
Parameter Before i1After i1After i2
stdPV on BOECAStd centroid along freq axis [Hz]4.1 × 10−74.5 × 10−75.1 × 10⁻⁷
Cumulated rise [%]-+9.8%+24.4%
stdPV Ratio between BOECA and BOREFStd RATIO centroid along freq axis [Hz]15.113.213.3
Cumulated change [%]-−12.6−11.9
Table A2. FFT changes between bolting stages.
Parameterf0f1f3f5f6f7
Before i1After i1After i1Before i1After i1After i2Before i1After i1After i2Before i1After i1After i2Before i1After i1After i2Before i1After i1After i2
Peak
Frequency
Centroid position along f [Hz]9.39.610.011.611.912.720.020.322.629.629.830.337.036.737.840.240.441.7
Cumulated rise [%]-+3.2+7.5-+2.6+9.5-+1.5+13.0-+0.7+2.4-−0.8+2.2-+0.5+3.7
Peak
Amplitude
Centroid position along a [FFT units]1.1 × 10−131.4 × 10−132.1 × 10−134.8 × 10−159.2 × 10−151.3 × 10−143.4 × 10−154.8 × 10−154.7 × 10−154.5 × 10−154.8 × 10−156.5 × 10−151.3 × 10−141.3 × 10−142.2 × 10−141.5 × 10−141.1 × 10−149.1 × 10⁻¹⁵
Cumulated rise [%]-+27.3+91-+92+171-+41.2+38.2-+6.7+44-0+69-−26.7−39
Table A3. HVSR changes between bolting stages.
Parameterp0p1p5
Before i1After i1After i2Before i1After i1After i2Before i1After i1After i2
Peak
Frequency
Centroid position along f[Hz]9.39.610.011.612.212.729.929.730.3
Cumulated rise [%]-+3.2+7.5-+5.2+9.5-−0.7+1.3
Peak
Amplitude
Centroid position along a [without units]40.430.524.710.313.014.07.17.87.5
Cumulated rise [%]-−25−39-+26.2+36-+9.9+5.6
Table A4. HHSR changes between bolting stages.
Parameterq0q1q3q5
Before i1After i1After i2Before i1After i1After i2Before i1After i1After i2Before i1After i1After i2
Peak FrequencyCentroid position along f[Hz]9.49.710.011.612.012.620.220.623.029.730.130.6
Cumulated rise [%]-+3.2+6.4-+3.5+8.6-+2.0+13.9-+1.4+3.0
Peak AmplitudeCentroid position along a [without units]22.121.319.77.19.49.212.313.211.823.221.321.0
Cumulated rise [%]-−3.6−10.9-+32.4+29.6-+7.3−4.1-−8.2−9.5

Appendix B. Ambient Vibration Particle Velocity (PV)
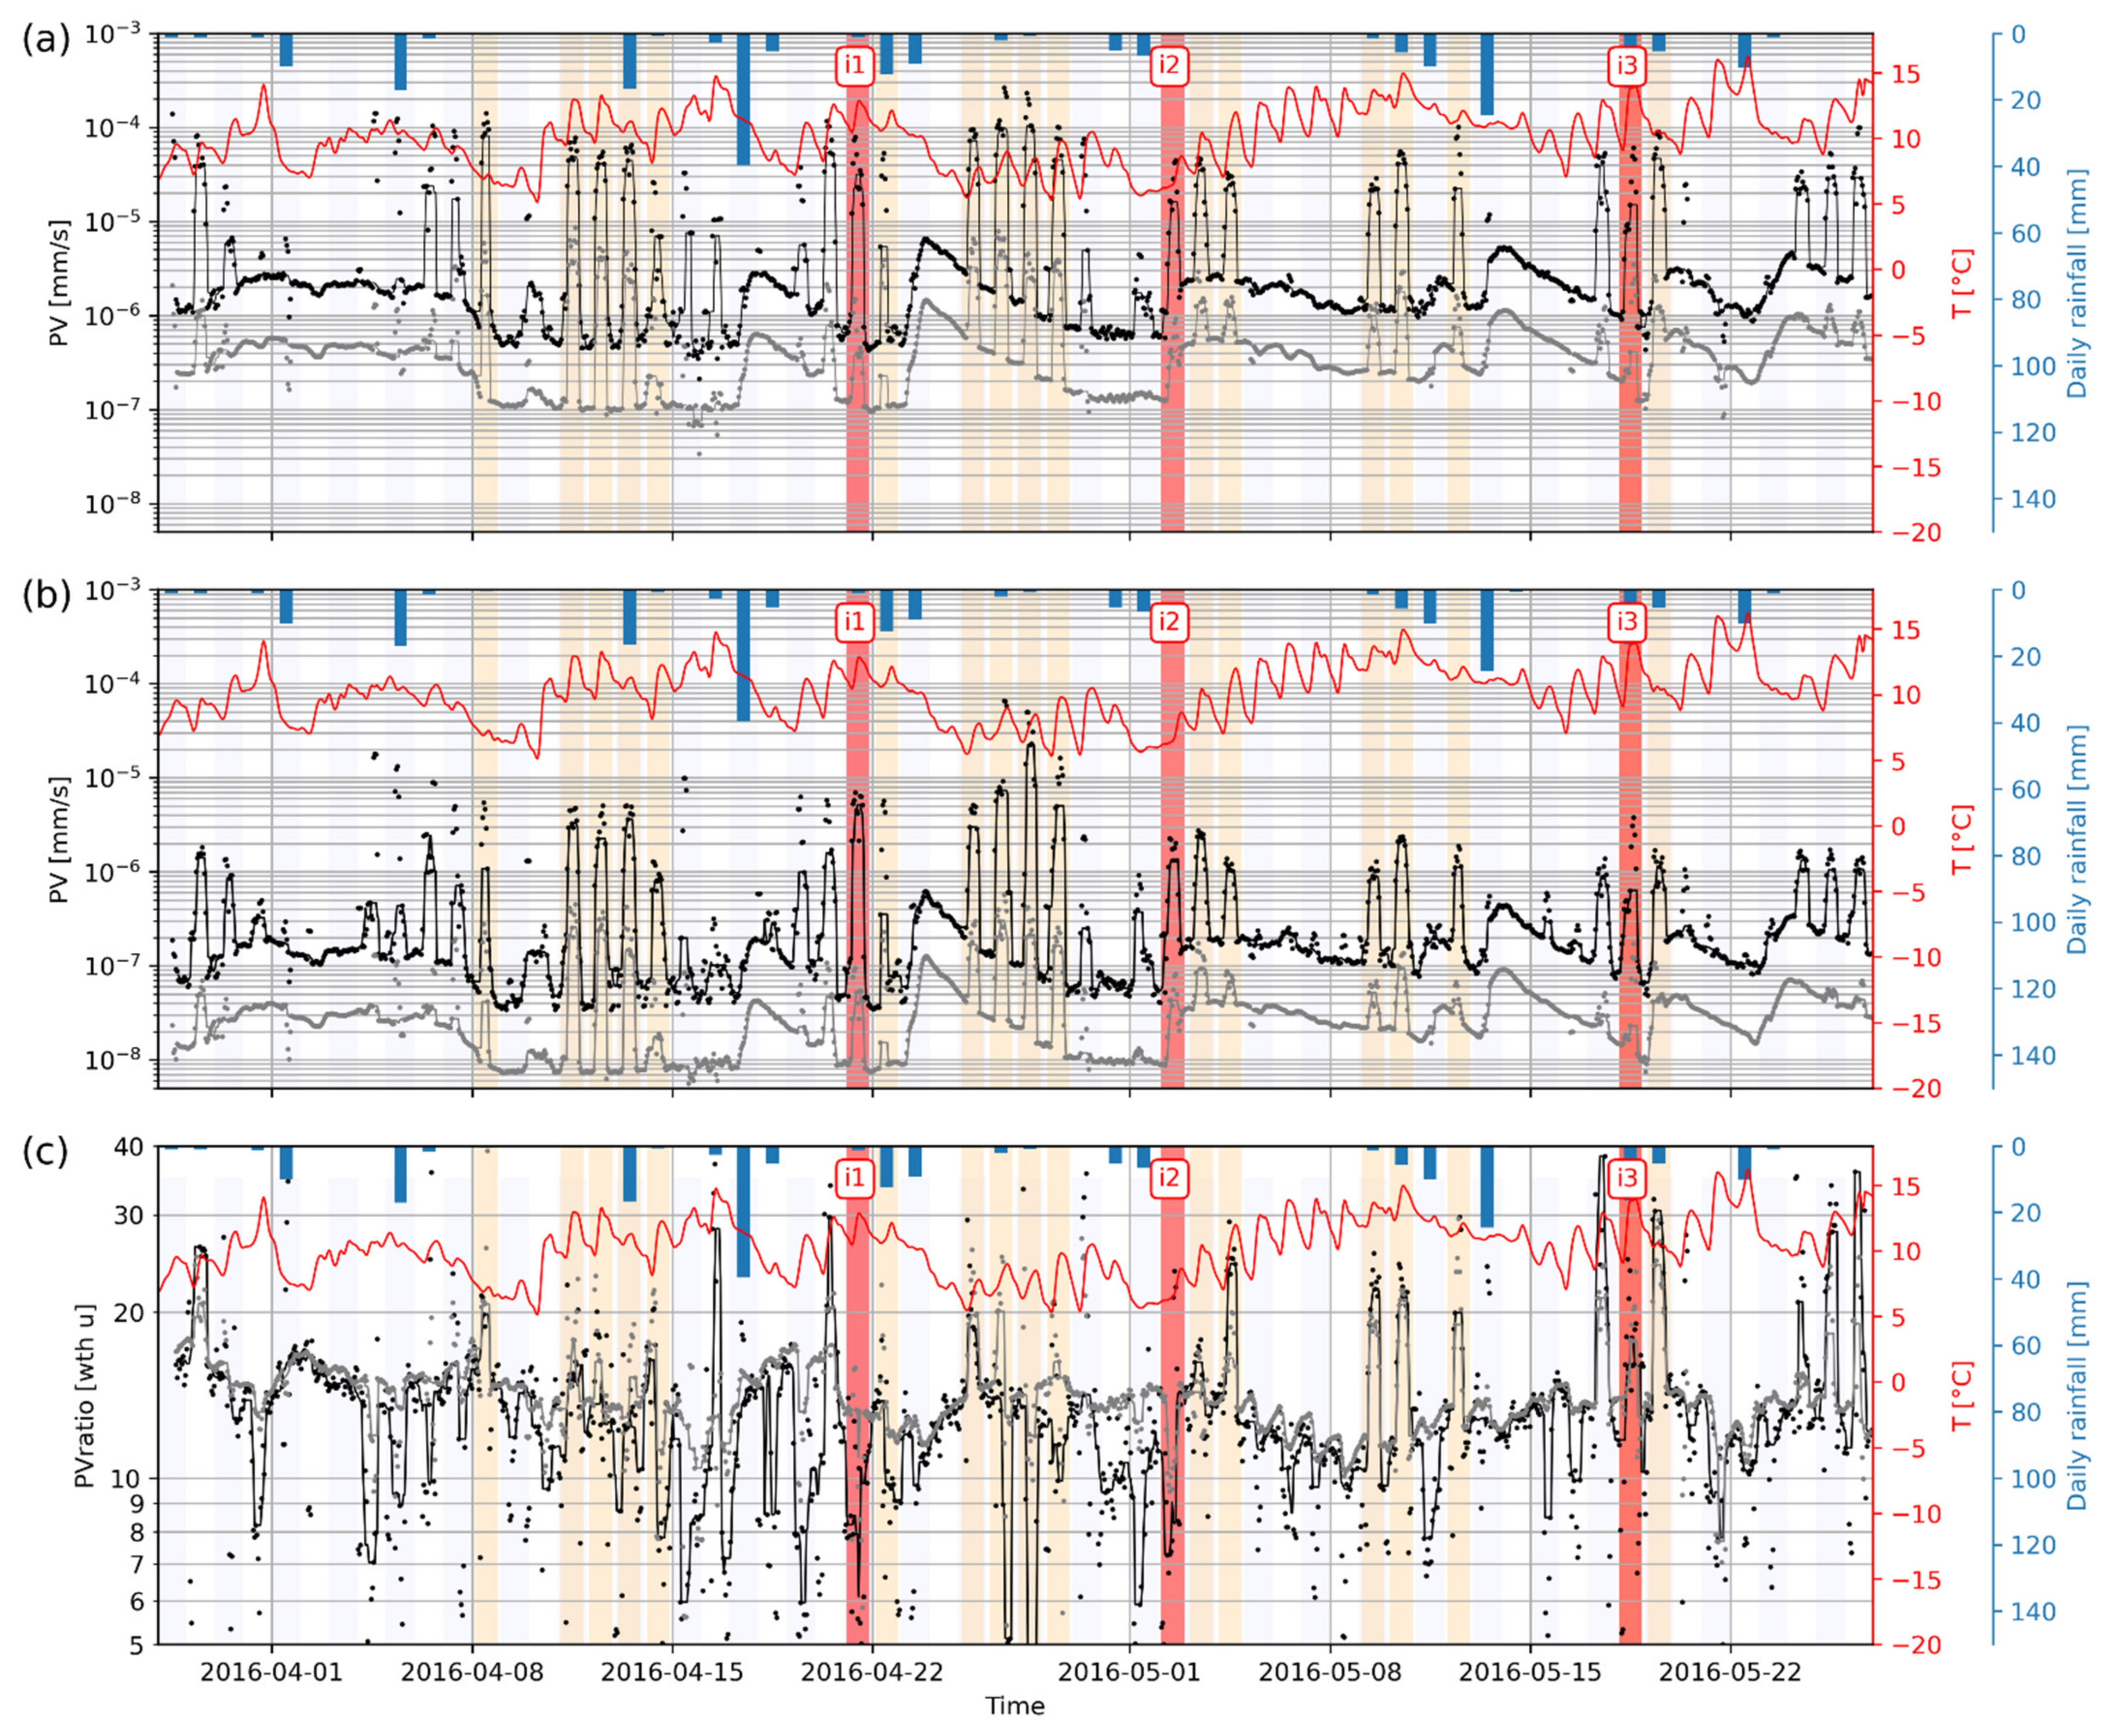
This section presents the investigation of ambient vibration Particle Velocity (PV) time series to seek a pertinent but very easy-to-compute monitoring parameter. Both absolute maximum (maxPV) and standard deviation (stdPV) were computed on 1 h long seismic records. Both raw data (not shown here) and bandpass-filtered data around the column’s fundamental natural frequency f0 ([80], i.e., [8–12 Hz]) were processed, although this second method requires more a priori tuning of the processing flow. Filtered PV monitoring is shown for the east channel in Figure A2 This direction corresponds to the flexural motion perpendicular to the rear fracture at the column’s fundamental mode f0 (bending mode). Results show great PV fluctuations for both sensors, with stdPV (grey) and maxPV (black) varying, respectively, of about three and two orders of magnitude. These changes appear mostly related to day/night cycles as well as working days/weekends alternations and are thus related to anthropogenic activities [94]. Environmental conditions such as air temperature, wind speed, nearby river discharge may also play a role in controlling PV. Most stdPV and maxPV peaks are due to on-site reinforcement work, notably during borehole drilling (red background, Figure A2). However, unexplained variation in PV amplitude is also detected during nonworking days, suggesting that PV amplitude is mostly controlled by ambient noise source power rather than site response characteristics. Similar conclusions were made for another PV time series filtered around the column’s upper mode f3 in [19–24 Hz] range. Unfiltered PV time series (not shown here) obey the same pattern, despite slightly higher scattering in the results. PV time series do not show clear changes over the monitoring period, which could be related to additional stiffness provided by the bolts.
We also investigated the ratio between PV measured on the rock column (BOECA), divided by PV recorded on the massif (BOREF). This is shown in Figure A2c, using PV both filtered around column’s mode f0. The ratio baseline wanders generally between 10 and 20, which is consistent with amplification factors reported at f0 for HHSR on the same site (see [80] and Section 4.4). It is also in good accordance with amplifications reported in other studies [54,55,57]. The maxPV ratio appears quite unstable, which prevents us from using it for monitoring purposes. It is discarded from use in the rest of this article. The stdPV ratio appears smoother and exhibits variations related to environmental conditions such as nearby Bourne river discharge. Yet, no clear and significant diminution of stdPV ratio due to the bolting could be observed at this stage on raw records.
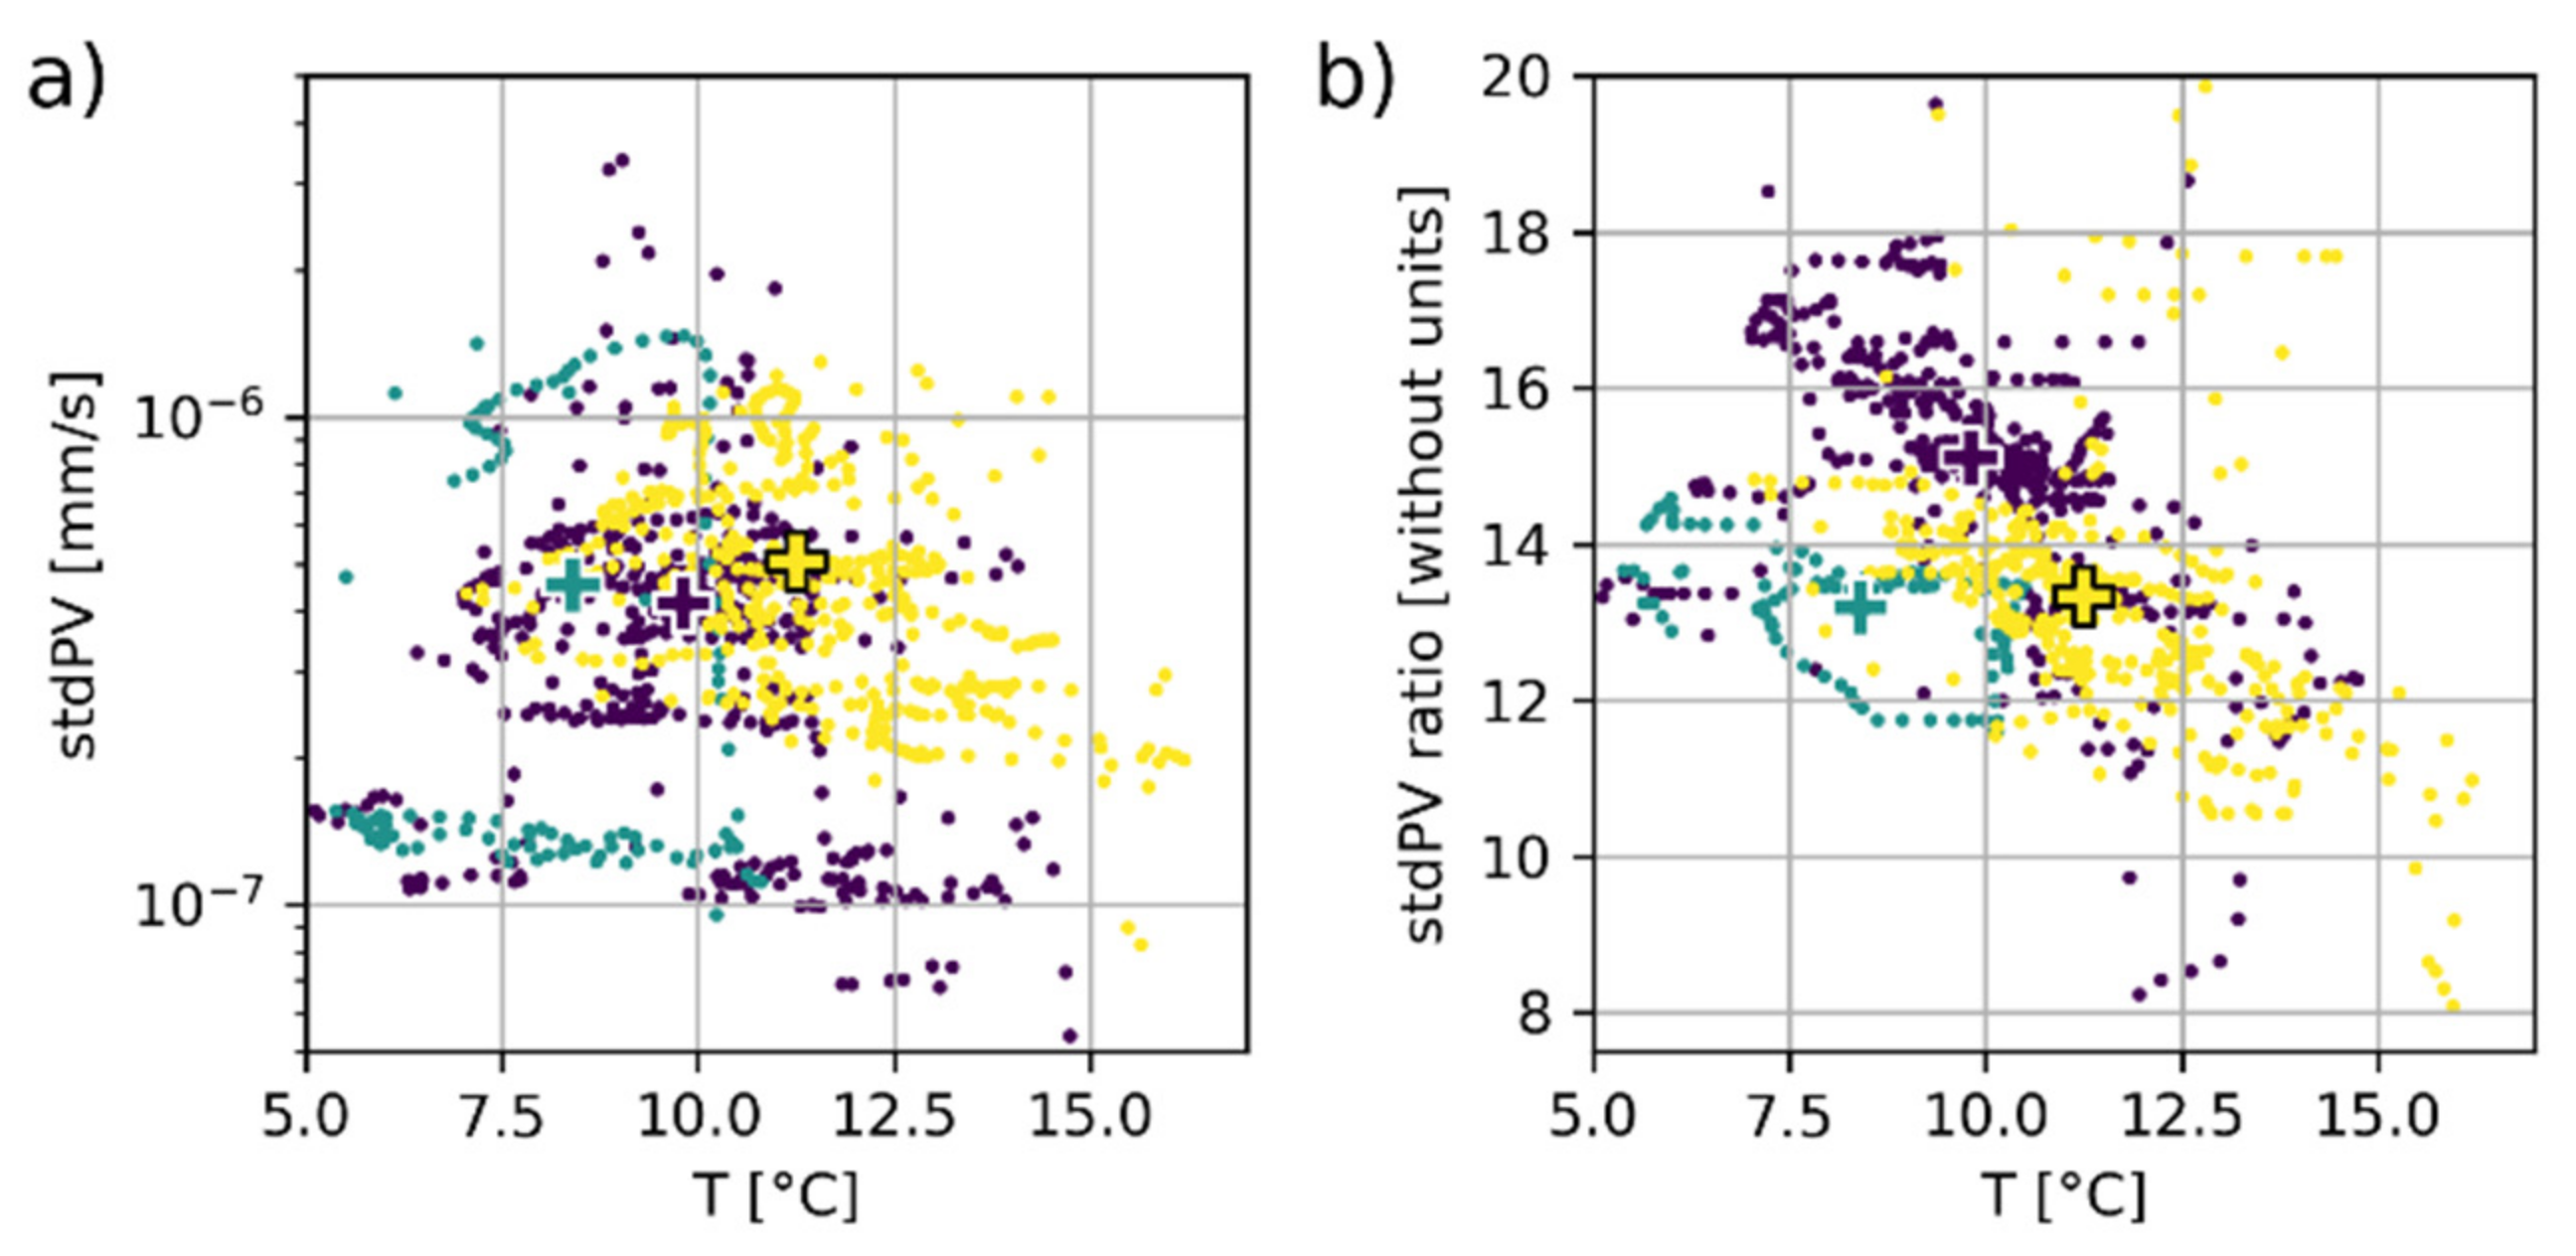
As performed for other seismic parameters in Section 5, we explored the relationship between Particle Velocity indicators and temperature. Ambient noise particle velocity standard deviation (stdPV) recorded on the unstable compartment (BOECA sensor) is shown as a function of air temperature in Figure A3a. The data were bandpass-filtered around f0, i.e., in the [8–12 Hz] frequency band. Blue dots represent data before grout injection i1, green dots between i1 and i2, and yellow dots after grouting i2. Colored crosses show the centroid of dots for each phase. We observe no clear relation between air temperature and stdPV (Figure A3a), nor marked trend across the bolting works. This was expected since PV is mainly controlled by ambient vibration sources. Surprisingly, stdPV tends to increase across the bolting work period (Table A1), while a drop in the column’s motion amplitude was expected after bolting. This confirms that particle velocity recorded on top of the unstable column is mainly controlled by environmental excitation (i.e., the amplitude of seismic noise sources) rather than a proxy of its stability. Particle velocity time-series are hence unable to reflect the mechanical change provided by the bolts and should not be used for structural monitoring purposes, especially when the amplitude of solicitation varies in time.
The stdPV ratio between the unstable column BOECA and the stable massif BOREF was computed in the [8–12 Hz] frequency band. As shown in Figure A3b, the use of a reference station helps to reduce the influence of environmental factors and seismic noise wavefield wandering. The stdPV ratio shows a negative correlation with temperature (Figure A3b), i.e., the stdPV ratio decreases when the air temperature increases. This could be related to rock fracture closure under thermal expansion as proposed in [49]. Figure A3b and Table A1 show the stdPV changes throughout the bolting period. The centroids drawn for each phase show a clear reduction in stdPV ratio of about −12% between the initial phase (before i1, blue) and after grout injection and hardening i1 (green). Further grouting phase i2 keeps the stdPV ratio almost unchanged.
This suggests that the PV ratio could reflect the mechanical changes provided by the bolts, causing a reduction in the column’s top motion at the fundamental mode f0. However, we do not recommend using PV ratio time series for monitoring purposes. This parameter appears indeed sensitive to the location of the reference sensor and may remain partly sensitive to environmental conditions. In addition, it requires a priori bandpass filtering around the fundamental frequency f0. Since f0 is expected to change during reinforcement works or toward failure, this greatly reduces PV’s practical interest.
Figure A2. Particle Velocity (PV) monitoring over time for sensor BOECA (a) and BOREF (b) east channel. Sensor location is shown in Figure 1b. Continuous lines show the rolling median computed on 12 h long windows. Seismic records have been filtered around column’s mode f0 in the [8–12 Hz] frequency band. For each 1 h slice, maxPV is shown in black, and stdPV is drawn in grey. Air temperature on-site is shown as red curve, and daily rainfall is shown as blue bars (downwards axis). Reinforcement work stages are shown in the background: drilling days (light orange) and grout injection (red). PV ratio between BOECA and BOREF is shown in (c), both for maxPV (black) and stdPV (grey). Y-axes for PV are log-scaled.
Geosciences 11 00242 g0a2
Figure A3. (a) PV standard deviation (stdPV) on BOECA in 8–12 Hz frequency band as a function of air temperature; (b) corresponding stdPV ratio between BOECA and BOREF. Initial stage before bolting is shown with dark blue dots. Stage between i1 and i2 is shown in green. Final stage after i2 is shown with yellow dots. Centroid of each phase is pointed with a colored cross. Days with drilling works have been removed from the dataset.
Geosciences 11 00242 g0a3

References

  1. Chang, F.-K. Structural Health Monitoring 2000; CRC Press: Boca Raton, FL, USA, 1999; ISBN 978-1-56676-881-8. [Google Scholar]
  2. Farrar, C.R.; Worden, K. An Introduction to Structural Health Monitoring. In New Trends in Vibration Based Structural Health Monitoring; Deraemaeker, A., Worden, K., Eds.; CISM Courses and Lectures; Springer: Vienna, Austria, 2010; pp. 1–17. ISBN 978-3-7091-0399-9. [Google Scholar]
  3. Farrar, C.R.; Worden, K. Structural Health Monitoring: A Machine Learning Perspective; John Wiley & Sons: Hoboken, NJ, USA, 2012; ISBN 978-1-118-44321-7. [Google Scholar]
  4. Humar, J.L.; Amin, M.S. Structural Health Monitoring. In Structural Engineering, Mechanics and Computation; Zingoni, A., Ed.; Elsevier Science: Oxford, UK, 2001; pp. 1185–1193. ISBN 978-0-08-043948-8. [Google Scholar]
  5. Balageas, D.; Fritzen, C.-P.; Güemes, A. Structural Health Monitoring; John Wiley & Sons: Hoboken, NJ, USA, 2010; ISBN 978-0-470-39440-3. [Google Scholar]
  6. Ostachowicz, W.; Güemes, A. New Trends in Structural Health Monitoring; Springer Science & Business Media: Berlin/Heidelberg, Germany, 2013; ISBN 978-3-7091-1390-5. [Google Scholar]
  7. Fu, Z.-F.; He, J. Modal Analysis; Elsevier: Amsterdam, The Netherlands, 2001. [Google Scholar]
  8. Brincker, R.; Ventura, C. Introduction to Operational Modal Analysis; John Wiley & Sons: Hoboken, NJ, USA, 2015; ISBN 978-1-119-96315-8. [Google Scholar]
  9. Avitabile, P. Experimental Modal Analysis. J. Sound Vib. 2001, 35, 20–31. [Google Scholar]
  10. Cunha, Á.; Caetano, E.; Magalhães, F.; Moutinho, C. From Input-Output to Output-Only Modal Identification of Civil Engineering Structures. In Proceedings of the 1st International Operational Modal Analysis Conference (IOMAC), Copenhagen, Denmark, 26–27 April 2005; p. 22. [Google Scholar]
  11. He, Q.; Ding, X. Time-Frequency Manifold for Machinery Fault Diagnosis. In Structural Health Monitoring: An Advanced Signal Processing Perspective; Yan, R., Chen, X., Mukhopadhyay, S.C., Eds.; Smart Sensors, Measurement and Instrumentation; Springer International Publishing: Cham, Switzerland, 2017; pp. 131–154. ISBN 978-3-319-56126-4. [Google Scholar]
  12. Tang, G.; Wang, H.; Ke, Y.; Luo, G. Compressive Sensing: A New Insight to Condition Monitoring of Rotary Machinery. In Structural Health Monitoring: An Advanced Signal Processing Perspective; Yan, R., Chen, X., Mukhopadhyay, S.C., Eds.; Smart Sensors, Measurement and Instrumentation; Springer International Publishing: Cham, Switzerland, 2017; pp. 203–225. ISBN 978-3-319-56126-4. [Google Scholar]
  13. Chen, X.; Wang, S. Matching Demodulation Transform and Its Application in Machine Fault Diagnosis. In Structural Health Monitoring: An Advanced Signal Processing Perspective; Yan, R., Chen, X., Mukhopadhyay, S.C., Eds.; Smart Sensors, Measurement and Instrumentation; Springer International Publishing: Cham, Switzerland, 2017; pp. 155–202. ISBN 978-3-319-56126-4. [Google Scholar]
  14. Lei, Y. Fault Diagnosis of Rotating Machinery Based on Empirical Mode Decomposition. In Structural Health Monitoring: An Advanced Signal Processing Perspective; Yan, R., Chen, X., Mukhopadhyay, S.C., Eds.; Smart Sensors, Measurement and Instrumentation; Springer International Publishing: Cham, Switzerland, 2017; pp. 259–292. ISBN 978-3-319-56126-4. [Google Scholar]
  15. Sohn, H.; Farrar, C.R.; Hemez, F.M.; Czarnecki, J.J. A Review of Structural Health Review of Structural Health Monitoring Literature 1996–2001; Los Alamos National Lab. (LANL): Los Alamos, NM, USA, 2002. [Google Scholar]
  16. Chang, F.-K.; Markmiller, J.F.C.; Yang, J.; Kim, Y. Structural Health Monitoring. In System Health Management; John Wiley & Sons, Ltd.: Hoboken, NJ, USA, 2011; pp. 419–428. ISBN 978-1-119-99405-3. [Google Scholar]
  17. Lorenzoni, F.; Casarin, F.; Caldon, M.; Islami, K.; Modena, C. Uncertainty Quantification in Structural Health Monitoring: Applications on Cultural Heritage Buildings. Mech. Syst. Signal Process. 2016, 66–67, 268–281. [Google Scholar] [CrossRef]
  18. De Stefano, A.; Matta, E.; Clemente, P. Structural Health Monitoring of Historical Heritage in Italy: Some Relevant Experiences. J. Civ. Struct. Health Monit. 2016, 6, 83–106. [Google Scholar] [CrossRef]
  19. Lorenzoni, F.; Caldon, M.; da Porto, F.; Modena, C.; Aoki, T. Post-Earthquake Controls and Damage Detection through Structural Health Monitoring: Applications in l’Aquila. J. Civ. Struct. Health Monit. 2018, 8, 217–236. [Google Scholar] [CrossRef]
  20. Brownjohn, J.M.W. Structural Health Monitoring of Civil Infrastructure. Philos. Trans. R. Soc. A Math. Phys. Eng. Sci. 2007, 365, 589–622. [Google Scholar] [CrossRef] [PubMed] [Green Version]
  21. Clinton, J.F.; Bradford, S.C.; Heaton, T.H.; Favela, J. The Observed Wander of the Natural Frequencies in a Structure. Bull. Seismol. Soc. Am. 2006, 96, 237–257. [Google Scholar] [CrossRef] [Green Version]
  22. Bradford, S.C.; Clinton, J.F.; Favela, J.; Heaton, T.H. Results of Millikan Library Forced Vibration Testing; Technical Report; California Institute of Technology: Pasadena, CA, USA, 2004. [Google Scholar]
  23. Michel, C.; Guéguen, P.; El Arem, S.; Mazars, J.; Kotronis, P. Full-Scale Dynamic Response of an RC Building under Weak Seismic Motions Using Earthquake Recordings, Ambient Vibrations and Modelling. Earthq. Eng. Struct. Dyn. 2010, 39, 419–441. [Google Scholar] [CrossRef] [Green Version]
  24. Michel, C.; Guéguen, P.; Bard, P.-Y. Dynamic Parameters of Structures Extracted from Ambient Vibration Measurements: An Aid for the Seismic Vulnerability Assessment of Existing Buildings in Moderate Seismic Hazard Regions. Soil Dyn. Earthq. Eng. 2008, 28, 593–604. [Google Scholar] [CrossRef] [Green Version]
  25. Mucciarelli, M.; Masi, A.; Gallipoli, M.R.; Harabaglia, P.; Vona, M.; Ponzo, F.; Dolce, M. Analysis of RC Building Dynamic Response and Soil-Building Resonance Based on Data Recorded during a Damaging Earthquake (Molise, Italy, 2002). Bull. Seismol. Soc. Am. 2004, 94, 1943–1953. [Google Scholar] [CrossRef]
  26. Peeters, B.; Maeck, J.; De Roeck, G. Vibration-Based Damage Detection in Civil Engineering: Excitation Sources and Temperature Effects. Smart Mater. Struct. 2001, 10, 518. [Google Scholar] [CrossRef]
  27. Farrar, C.R.; Cone, K.M. Vibration Testing of the I-40 Bridge before and after the Introduction of Damage; Los Alamos National Lab.: Los Alamos, NM, USA, 1994.
  28. Glisic, B.; Inaudi, D. Fibre Optic Methods for Structural Health Monitoring; John Wiley & Sons: Hoboken, NJ, USA, 2008; ISBN 978-0-470-51780-2. [Google Scholar]
  29. Rivera, E.; Mufti, A.A.; Thomson, D.J. Civionics for Structural Health Monitoring. Can. J. Civ. Eng. 2011, 34, 430–437. [Google Scholar] [CrossRef]
  30. Kim, S.; Pakzad, S.; Culler, D.; Demmel, J.; Fenves, G.; Glaser, S.; Turon, M. Wireless Sensor Networks for Structural Health Monitoring. In Proceedings of the 4th International Conference on Embedded Networked Sensor Systems (SenSys ’06), Boulder, CO, USA, NY, USA, 31 October–3 November 2006; Association for Computing Machinery: New York, NY, USA; pp. 427–428. [Google Scholar] [CrossRef]
  31. Lynch, J.; Loh, K. A Summary Review of Wireless Sensors and Sensor Networks for Structural Health Monitoring. Shock Vib. Dig. 2006, 38, 91–128. [Google Scholar] [CrossRef] [Green Version]
  32. Nagayama, T.; Spencer, B.F., Jr. Structural Health Monitoring Using Smart Sensors; Newmark Structural Engineering Laboratory, University of Illinois at Urbana-Champaign: Urbana, IL, USA, 2007. [Google Scholar]
  33. Worden, K.; Manson, G. The Application of Machine Learning to Structural Health Monitoring. Philos. Trans. R. Soc. A Math. Phys. Eng. Sci. 2007, 365, 515–537. [Google Scholar] [CrossRef] [PubMed]
  34. Abdeljaber, O.; Avci, O.; Kiranyaz, M.S.; Boashash, B.; Sodano, H.; Inman, D.J. 1-D CNNs for Structural Damage Detection: Verification on a Structural Health Monitoring Benchmark Data. Neurocomputing 2018, 275, 1308–1317. [Google Scholar] [CrossRef]
  35. Roux, P.; Guéguen, P.; Baillet, L.; Hamze, A. Structural-Change Localization and Monitoring through a Perturbation-Based Inverse Problem. J. Acoust. Soc. Am. 2014, 136, 2586–2597. [Google Scholar] [CrossRef] [PubMed]
  36. Sohn, H.; Czarnecki, J.A.; Farrar, C.R. Structural Health Monitoring Using Statistical Process Control. J. Struct. Eng. 2000, 126, 1356–1363. [Google Scholar] [CrossRef]
  37. Roy, K.; Bhattacharya, B.; Ray Chaudhuri, S. ARX Model-Based Damage Sensitive Features for Structural Damage Localization Using Output-Only Measurements. J. Sound Vib. 2015, 349, 99–122. [Google Scholar] [CrossRef]
  38. Hu, W.-H.; Cunha, Á.; Caetano, E.; Rohrmann, R.G.; Said, S.; Teng, J. Comparison of Different Statistical Approaches for Removing Environmental/Operational Effects for Massive Data Continuously Collected from Footbridges. Struct. Control Health Monit. 2017, 24, e1955. [Google Scholar] [CrossRef]
  39. Çelebi, M. Seismic Responses of Two Adjacent Buildings. I: Data and Analyses. J. Struct. Eng. 1993, 119, 2461–2476. [Google Scholar] [CrossRef]
  40. Ivanović, S.S.; Trifunac, M.D.; Novikova, E.I.; Gladkov, A.A.; Todorovska, M.I. Ambient Vibration Tests of a Seven-Story Reinforced Concrete Building in Van Nuys, California, Damaged by the 1994 Northridge Earthquake. Soil Dyn. Earthq. Eng. 2000, 19, 391–411. [Google Scholar] [CrossRef]
  41. Dunand, F.; Gueguen, P.; Bard, P.-Y.; Rodgers, J. Comparison of the Dynamic Parameters Extracted from Weak, Moderate and Strong Building Motion. In Proceedings of the First European Conference on Earthquake Engineering and Seismology, Geneva, Switzerland, 3–8 September 2006. [Google Scholar]
  42. Verma, R.K.; Pattanaik, K.K.; Dissanayake, P.B.R.; Dammika, A.J.; Buddika, H.A.D.S.; Kaloop, M.R. Damage Detection in Bridge Structures: An Edge Computing Approach. arXiv 2020, arXiv:2008.06724. [Google Scholar]
  43. Avci, O.; Abdeljaber, O.; Kiranyaz, S.; Hussein, M.; Inman, D.J. Wireless and Real-Time Structural Damage Detection: A Novel Decentralized Method for Wireless Sensor Networks. J. Sound Vib. 2018, 424, 158–172. [Google Scholar] [CrossRef]
  44. Starr, A.M.; Moore, J.R.; Thorne, M.S. Ambient Resonance of Mesa Arch, Canyonlands National Park, Utah. Geophys. Res. Lett. 2015, 42, 6696–6702. [Google Scholar] [CrossRef] [Green Version]
  45. Moore, J.R.; Thorne, M.S.; Koper, K.D.; Wood, J.R.; Goddard, K.; Burlacu, R.; Doyle, S.; Stanfield, E.; White, B. Anthropogenic Sources Stimulate Resonance of a Natural Rock Bridge. Geophys. Res. Lett. 2016, 43, 9669–9676. [Google Scholar] [CrossRef]
  46. Moore, J.R.; Geimer, P.R.; Finnegan, R.; Thorne, M.S. Use of Seismic Resonance Measurements to Determine the Elastic Modulus of Freestanding Rock Masses. Rock Mech. Rock Eng. 2018, 51, 3937–3944. [Google Scholar] [CrossRef]
  47. Moore, J.R.; Geimer, P.R.; Finnegan, R.; Michel, C. Dynamic Analysis of a Large Freestanding Rock Tower (Castleton Tower, Utah) Short Note. Bull. Seismol. Soc. Am. 2019, 109, 2125–2131. [Google Scholar] [CrossRef]
  48. Bottelin, P.; Jongmans, D.; Baillet, L.; Lebourg, T.; Hantz, D.; Lévy, C.; Le Roux, O.; Cadet, H.; Lorier, L.; Rouiller, J.-D. Spectral Analysis of Prone-to-Fall Rock Compartments Using Ambient Vibrations. J. Environ. Eng. Geophys. 2013, 18, 205–217. [Google Scholar] [CrossRef]
  49. Bottelin, P.; Lévy, C.; Baillet, L.; Jongmans, D.; Gueguen, P. Modal and Thermal Analysis of Les Arches Unstable Rock Column (Vercors Massif, French Alps). Geophys. J. Int. 2013, 194, 849–858. [Google Scholar] [CrossRef]
  50. Valentin, J.; Capron, A.; Jongmans, D.; Baillet, L.; Bottelin, P.; Donze, F.; Larose, E.; Mangeney, A. The Dynamic Response of Prone-to-Fall Columns to Ambient Vibrations: Comparison between Measurements and Numerical Modelling. Geophys. J. Int. 2017, 208, 1058–1076. [Google Scholar] [CrossRef]
  51. Moore, J.R.; Gischig, V.; Burjánek, J.; Loew, S.; Fäh, D. Site Effects in Unstable Rock Slopes: Dynamic Behavior of the Randa Instability (Switzerland). Bull. Seismol. Soc. Am. 2011, 101, 3110–3116. [Google Scholar] [CrossRef]
  52. Burjánek, J.; Gassner-Stamm, G.; Poggi, V.; Moore, J.R.; Fäh, D. Ambient Vibration Analysis of an Unstable Mountain Slope. Geophys. J. Int. 2010, 180, 820–828. [Google Scholar] [CrossRef] [Green Version]
  53. Burjánek, J.; Moore, J.R.; Yugsi Molina, F.X.; Fäh, D. Instrumental Evidence of Normal Mode Rock Slope Vibration. Geophys. J. Int. 2012, 188, 559–569. [Google Scholar] [CrossRef] [Green Version]
  54. Kleinbrod, U.; Burjánek, J.; Hugentobler, M.; Amann, F.; Fäh, D. A Comparative Study on Seismic Response of Two Unstable Rock Slopes within Same Tectonic Setting but Different Activity Level. Geophys. J. Int. 2017, 211, 1428–1448. [Google Scholar] [CrossRef]
  55. Kleinbrod, U.; Burjánek, J.; Fäh, D. Ambient Vibration Classification of Unstable Rock Slopes: A Systematic Approach. Eng. Geol. 2019, 249, 198–217. [Google Scholar] [CrossRef]
  56. Lévy, C.; Jongmans, D.; Baillet, L. Analysis of Seismic Signals Recorded on a Prone-to-Fall Rock Column (Vercors Massif, French Alps). Geophys. J. Int. 2011, 186, 296–310. [Google Scholar] [CrossRef] [Green Version]
  57. Burjánek, J.; Gischig, V.; Moore, J.R.; Fäh, D. Ambient Vibration Characterization and Monitoring of a Rock Slope Close to Collapse. Geophys. J. Int. 2018, 212, 297–310. [Google Scholar] [CrossRef]
  58. Burjánek, J.; Edwards, B.; Fäh, D. Empirical Evidence of Local Seismic Effects at Sites with Pronounced Topography: A Systematic Approach. Geophys. J. Int. 2014, 197, 608–619. [Google Scholar] [CrossRef] [Green Version]
  59. Häusler, M.; Michel, C.; Burjánek, J.; Fäh, D. Fracture Network Imaging on Rock Slope Instabilities Using Resonance Mode Analysis. Geophys. Res. Lett. 2019, 46, 6497–6506. [Google Scholar] [CrossRef] [Green Version]
  60. Hollender, F.; Roumelioti, Z.; Maufroy, E.; Traversa, P.; Mariscal, A. Can We Trust High-Frequency Content in Strong-Motion Database Signals? Impact of Housing, Coupling, and Installation Depth of Seismic Sensors. Seismol. Res. Lett. 2020, 91, 2192–2205. [Google Scholar] [CrossRef]
  61. Gischig, V.S.; Eberhardt, E.; Moore, J.R.; Hungr, O. On the Seismic Response of Deep-Seated Rock Slope Instabilities—Insights from Numerical Modeling. Eng. Geol. 2015, 193, 1–18. [Google Scholar] [CrossRef]
  62. Weber, S.; Fäh, D.; Beutel, J.; Faillettaz, J.; Gruber, S.; Vieli, A. Ambient Seismic Vibrations in Steep Bedrock Permafrost Used to Infer Variations of Ice-Fill in Fractures. Earth Planet. Sci. Lett. 2018, 501, 119–127. [Google Scholar] [CrossRef]
  63. Cooley, J.W.; Tukey, J.W. An Algorithm for the Machine Calculation of Complex Fourier Series. Math. Comp. 1965, 19, 297. [Google Scholar] [CrossRef]
  64. Lévy, C.; Baillet, L.; Jongmans, D.; Mourot, P.; Hantz, D. Dynamic Response of the Chamousset Rock Column (Western Alps, France). J. Geophys. Res. Earth Surf. 2010, 115, F04043. [Google Scholar] [CrossRef]
  65. Welch, P. The Use of Fast Fourier Transform for the Estimation of Power Spectra: A Method Based on Time Averaging over Short, Modified Periodograms. IEEE Trans. Audio Electroacoust. 1967, AU-15, 70–73. [Google Scholar] [CrossRef] [Green Version]
  66. McNamara, D.E.; Buland, R.P. Ambient Noise Levels in the Continental United States. Bull. Seismol. Soc. Am. 2004, 94, 1517–1527. [Google Scholar] [CrossRef]
  67. Prieto, G.A.; Parker, R.L.; Vernon, F.L., III. A Fortran 90 Library for Multitaper Spectrum Analysis. Comput. Geosci. 2009, 35, 1701–1710. [Google Scholar] [CrossRef]
  68. Vidale, J.E. Complex Polarization Analysis of Particle Motion. Bull. Seismol. Soc. Am. 1986, 76, 1393–1405. [Google Scholar]
  69. Torrence, C.; Compo, G.P. A Practical Guide to Wavelet Analysis. Bull. Am. Meteorol. Soc. 1998, 79, 61–78. [Google Scholar] [CrossRef] [Green Version]
  70. Koper, K.D.; Hawley, V.L. Frequency Dependent Polarization Analysis of Ambient Seismic Noise Recorded at a Broadband Seismometer in the Central United States. Earthq. Sci. 2010, 23, 439–447. [Google Scholar] [CrossRef] [Green Version]
  71. Koper, K.D.; Burlacu, R. The Fine Structure of Double-Frequency Microseisms Recorded by Seismometers in North America. J. Geophys. Res. Solid Earth 2015, 120, 1677–1691. [Google Scholar] [CrossRef]
  72. Bard, P.Y.; Acerra, C.; Aguacil, G.; Anastasiadis, A.; Atakan, K.; Azzara, R.M.; Basili, R.; Bertrand, E.; Bettig, B.; Blarel, F.; et al. Guidelines for the Implementation of the H/V Spectral Ratio Technique on Ambient Vibrations-Measurements, Processing and Interpretations. Bull. Earthq. Eng. 2008, 6, 1–2. [Google Scholar] [CrossRef]
  73. Lermo, J.; Chávez-García, F.J. Site Effect Evaluation Using Spectral Ratios with Only One Station. Bull. Seismol. Soc. Am. 1993, 83, 1574–1594. [Google Scholar]
  74. Nakamura, Y. Clear Identification of Fundamental Idea of Nakamura’s Technique and Its Applications. In Proceedings of the 12th World Conference on Earthquake Engineering, Auckland, New Zealand, 30 January–4 February 2000; Volume 2656, p. 8. [Google Scholar]
  75. Nakamura, Y. A Method for Dynamic Characteristics Estimation of Subsurface Using Microtremor on the Ground Surface; Railway Technical Research Institute, Quarterly Reports; Railway Technical Research Institute: Tokyo, Japan, 1989; pp. 25–33. [Google Scholar]
  76. Brincker, R.; Zhang, L.; Andersen, P. Modal Identification of Output-Only Systems Using Frequency Domain Decomposition. Smart Mater. Struct. 2001, 10, 441. [Google Scholar] [CrossRef] [Green Version]
  77. Bottelin, P. Characterization of Pre- and Post-Rupture of Intermediate Size Rockfalls: Insights from seismic records. Ph.D. Thesis, University of Grenoble, Grenoble, France, 2014. [Google Scholar]
  78. Bottelin, P.; Baillet, L.; Larose, E.; Jongmans, D.; Hantz, D.; Brenguier, O.; Cadet, H.; Helmstetter, A. Monitoring Rock Reinforcement Works with Ambient Vibrations: La Bourne Case Study (Vercors, France). Eng. Geol. 2017, 226, 136–145. [Google Scholar] [CrossRef]
  79. Peeters, B.; Roeck, G.D. One-Year Monitoring of the Z24-Bridge: Environmental Effects versus Damage Events. Earthq. Eng. Struct. Dyn. 2001, 30, 149–171. [Google Scholar] [CrossRef]
  80. Laory, I.; Trinh, T.N.; Smith, I.F.C.; Brownjohn, J.M.W. Methodologies for Predicting Natural Frequency Variation of a Suspension Bridge. Eng. Struct. 2014, 80, 211–221. [Google Scholar] [CrossRef] [Green Version]
  81. Moser, P.; Moaveni, B. Environmental Effects on the Identified Natural Frequencies of the Dowling Hall Footbridge. Mech. Syst. Signal Process. 2011, 25, 2336–2357. [Google Scholar] [CrossRef]
  82. Farrar, C.R.; Doebling, S.W.; Cornwell, P.J.; Straser, E.G. Variability of Modal Parameters Measured on the Alamosa Canyon Bridge; Los Alamos National Lab.: Los Alamos, NM, USA, 1996.
  83. Gidon, M. Carte Géologique Simplifiée des Alpes Occidentales Du Léman à Digne; Didier, R., Ed.; BRGM: Grenoble, France; Orléans, France, 1977. [Google Scholar]
  84. Beyreuther, M.; Barsch, R.; Krischer, L.; Megies, T.; Behr, Y.; Wassermann, J. ObsPy: A Python Toolbox for Seismology. Seismol. Res. Lett. 2010, 81, 530–533. [Google Scholar] [CrossRef] [Green Version]
  85. Megies, T.; Beyreuther, M.; Barsch, R.; Krischer, L.; Wassermann, J. ObsPy–What Can It Do for Data Centers and Observatories? Ann. Geophys. 2011, 54, 47–58. [Google Scholar]
  86. Endo, E.T.; Murray, T. Real-Time Seismic Amplitude Measurement (RSAM): A Volcano Monitoring and Prediction Tool. Bull. Volcanol. 1991, 53, 533–545. [Google Scholar] [CrossRef]
  87. Stephens, C.D.; Chouet, B.A.; Page, R.A.; Lahr, J.C.; Power, J.A. Seismological Aspects of the 1989–1990 Eruptions at Redoubt Volcano, Alaska: The SSAM Perspective. J. Volcanol. Geotherm. Res. 1994, 62, 153–182. [Google Scholar] [CrossRef]
  88. Bendat, J.S.; Piersol, A.G. Random Data: Analysis and Measurement Procedures, 4th ed.; Wiley: Hoboken, NJ, USA, 2010; ISBN 978-0-470-24877-5. [Google Scholar]
  89. Peterson, J.R. Observations and Modeling of Seismic Background Noise; Open-File Report; U.S. Geological Survey; Albuquerque Seismological Laboratory: Albuquerque, NM, USA, 1993; p. 94.
  90. Havskov, J.; Alguacil, G. Instrumentation in Earthquake Seismology, 2nd ed.; Springer International Publishing: Cham, Switzerland, 2016; ISBN 978-3-319-21313-2. [Google Scholar]
  91. Konno, K.; Omachi, T. Smoothing Function Suitable for Estimation of Amplification Factor of the Surface Ground from Microtremor and Its Application. Doboku Gakkai Ronbunshu 1995, 525, 247–259. [Google Scholar] [CrossRef] [Green Version]
  92. Díaz, J.; Ruiz, M.; Sánchez-Pastor, P.S.; Romero, P. Urban Seismology: On the Origin of Earth Vibrations within a City. Sci. Rep. 2017, 7, 15296. [Google Scholar] [CrossRef] [PubMed] [Green Version]
  93. Guillier, B.; Chatelain, J.-L.; Bonnefoy-Claudet, S.; Haghshenas, E. Use of Ambient Noise: From Spectral Amplitude Variability to H/V Stability. J. Earthq. Eng. 2007, 11, 925–942. [Google Scholar] [CrossRef]
  94. Thomas, R.; Judith, J.E. Voting-Based Ensemble of Unsupervised Outlier Detectors. In Advances in Communication Systems and Networks; Jayakumari, J., Karagiannidis, G.K., Ma, M., Hossain, S.A., Eds.; Springer: Singapore, 2020; pp. 501–511. [Google Scholar]
  95. Domingues, R.; Michiardi, P.; Barlet, J.; Filippone, M. A Comparative Evaluation of Novelty Detection Algorithms for Discrete Sequences. Artif. Intell. Rev. 2020, 53, 3787–3812. [Google Scholar] [CrossRef] [Green Version]
  96. Chandola, V.; Banerjee, A.; Kumar, V. Anomaly Detection for Discrete Sequences: A Survey. IEEE Trans. Knowl. Data Eng. 2012, 24, 823–839. [Google Scholar] [CrossRef]
  97. Kundzewicz, Z.W.; Robson, A.J. Change Detection in Hydrological Records—A Review of the Methodology. Hydrol. Sci. J. 2004, 49, 7–19. [Google Scholar] [CrossRef]
  98. Marchi, E.; Vesperini, F.; Eyben, F.; Squartini, S.; Schuller, B. A Novel Approach for Automatic Acoustic Novelty Detection Using a Denoising Autoencoder with Bidirectional LSTM Neural Networks. In Proceedings of the 40th IEEE International Conference on Acoustics, Speech, and Signal Processing (ICASSP), Brisbane, QLD, Australia, 19–24 April 2015; p. 5. [Google Scholar]
  99. Taylor, S.J.; Letham, B. Forecasting at Scale. Am. Stat. 2018, 72, 37–45. [Google Scholar] [CrossRef]
  100. Antonini, M.; Vecchio, M.; Antonelli, F.; Ducange, P.; Perera, C. Smart Audio Sensors in the Internet of Things Edge for Anomaly Detection. IEEE Access 2018, 6, 67594–67610. [Google Scholar] [CrossRef]
  101. Pedregosa, F.; Varoquaux, G.; Gramfort, A.; Michel, V.; Thirion, B.; Grisel, O.; Blondel, M.; Prettenhofer, P.; Weiss, R.; Dubourg, V. Scikit-Learn: Machine Learning in Python. J. Mach. Learn. Res. 2011, 12, 2825–2830. [Google Scholar]
  102. Rousseeuw, P.J.; Driessen, K.V. A Fast Algorithm for the Minimum Covariance Determinant Estimator. Technometrics 1999, 41, 212–223. [Google Scholar] [CrossRef]
  103. Hubert, M.; Debruyne, M. Minimum Covariance Determinant. WIREs Comp. Stat. 2010, 2, 36–43. [Google Scholar] [CrossRef]
  104. Fauconnier, C.; Haesbroeck, G. Outliers Detection with the Minimum Covariance Determinant Estimator in Practice. Stat. Methodol. 2009, 6, 363–379. [Google Scholar] [CrossRef]
  105. Worden, K.; Sohn, H.; Farrar, C.R. Novelty Detection in a Changing Environment: Regression and Interpolation Approaches. J. Sound Vib. 2002, 258, 741–761. [Google Scholar] [CrossRef]
  106. Faria, E.R.; Gonçalves, I.J.C.R.; de Carvalho, A.C.P.L.F.; Gama, J. Novelty Detection in Data Streams. Artif. Intell. Rev. 2016, 45, 235–269. [Google Scholar] [CrossRef] [Green Version]
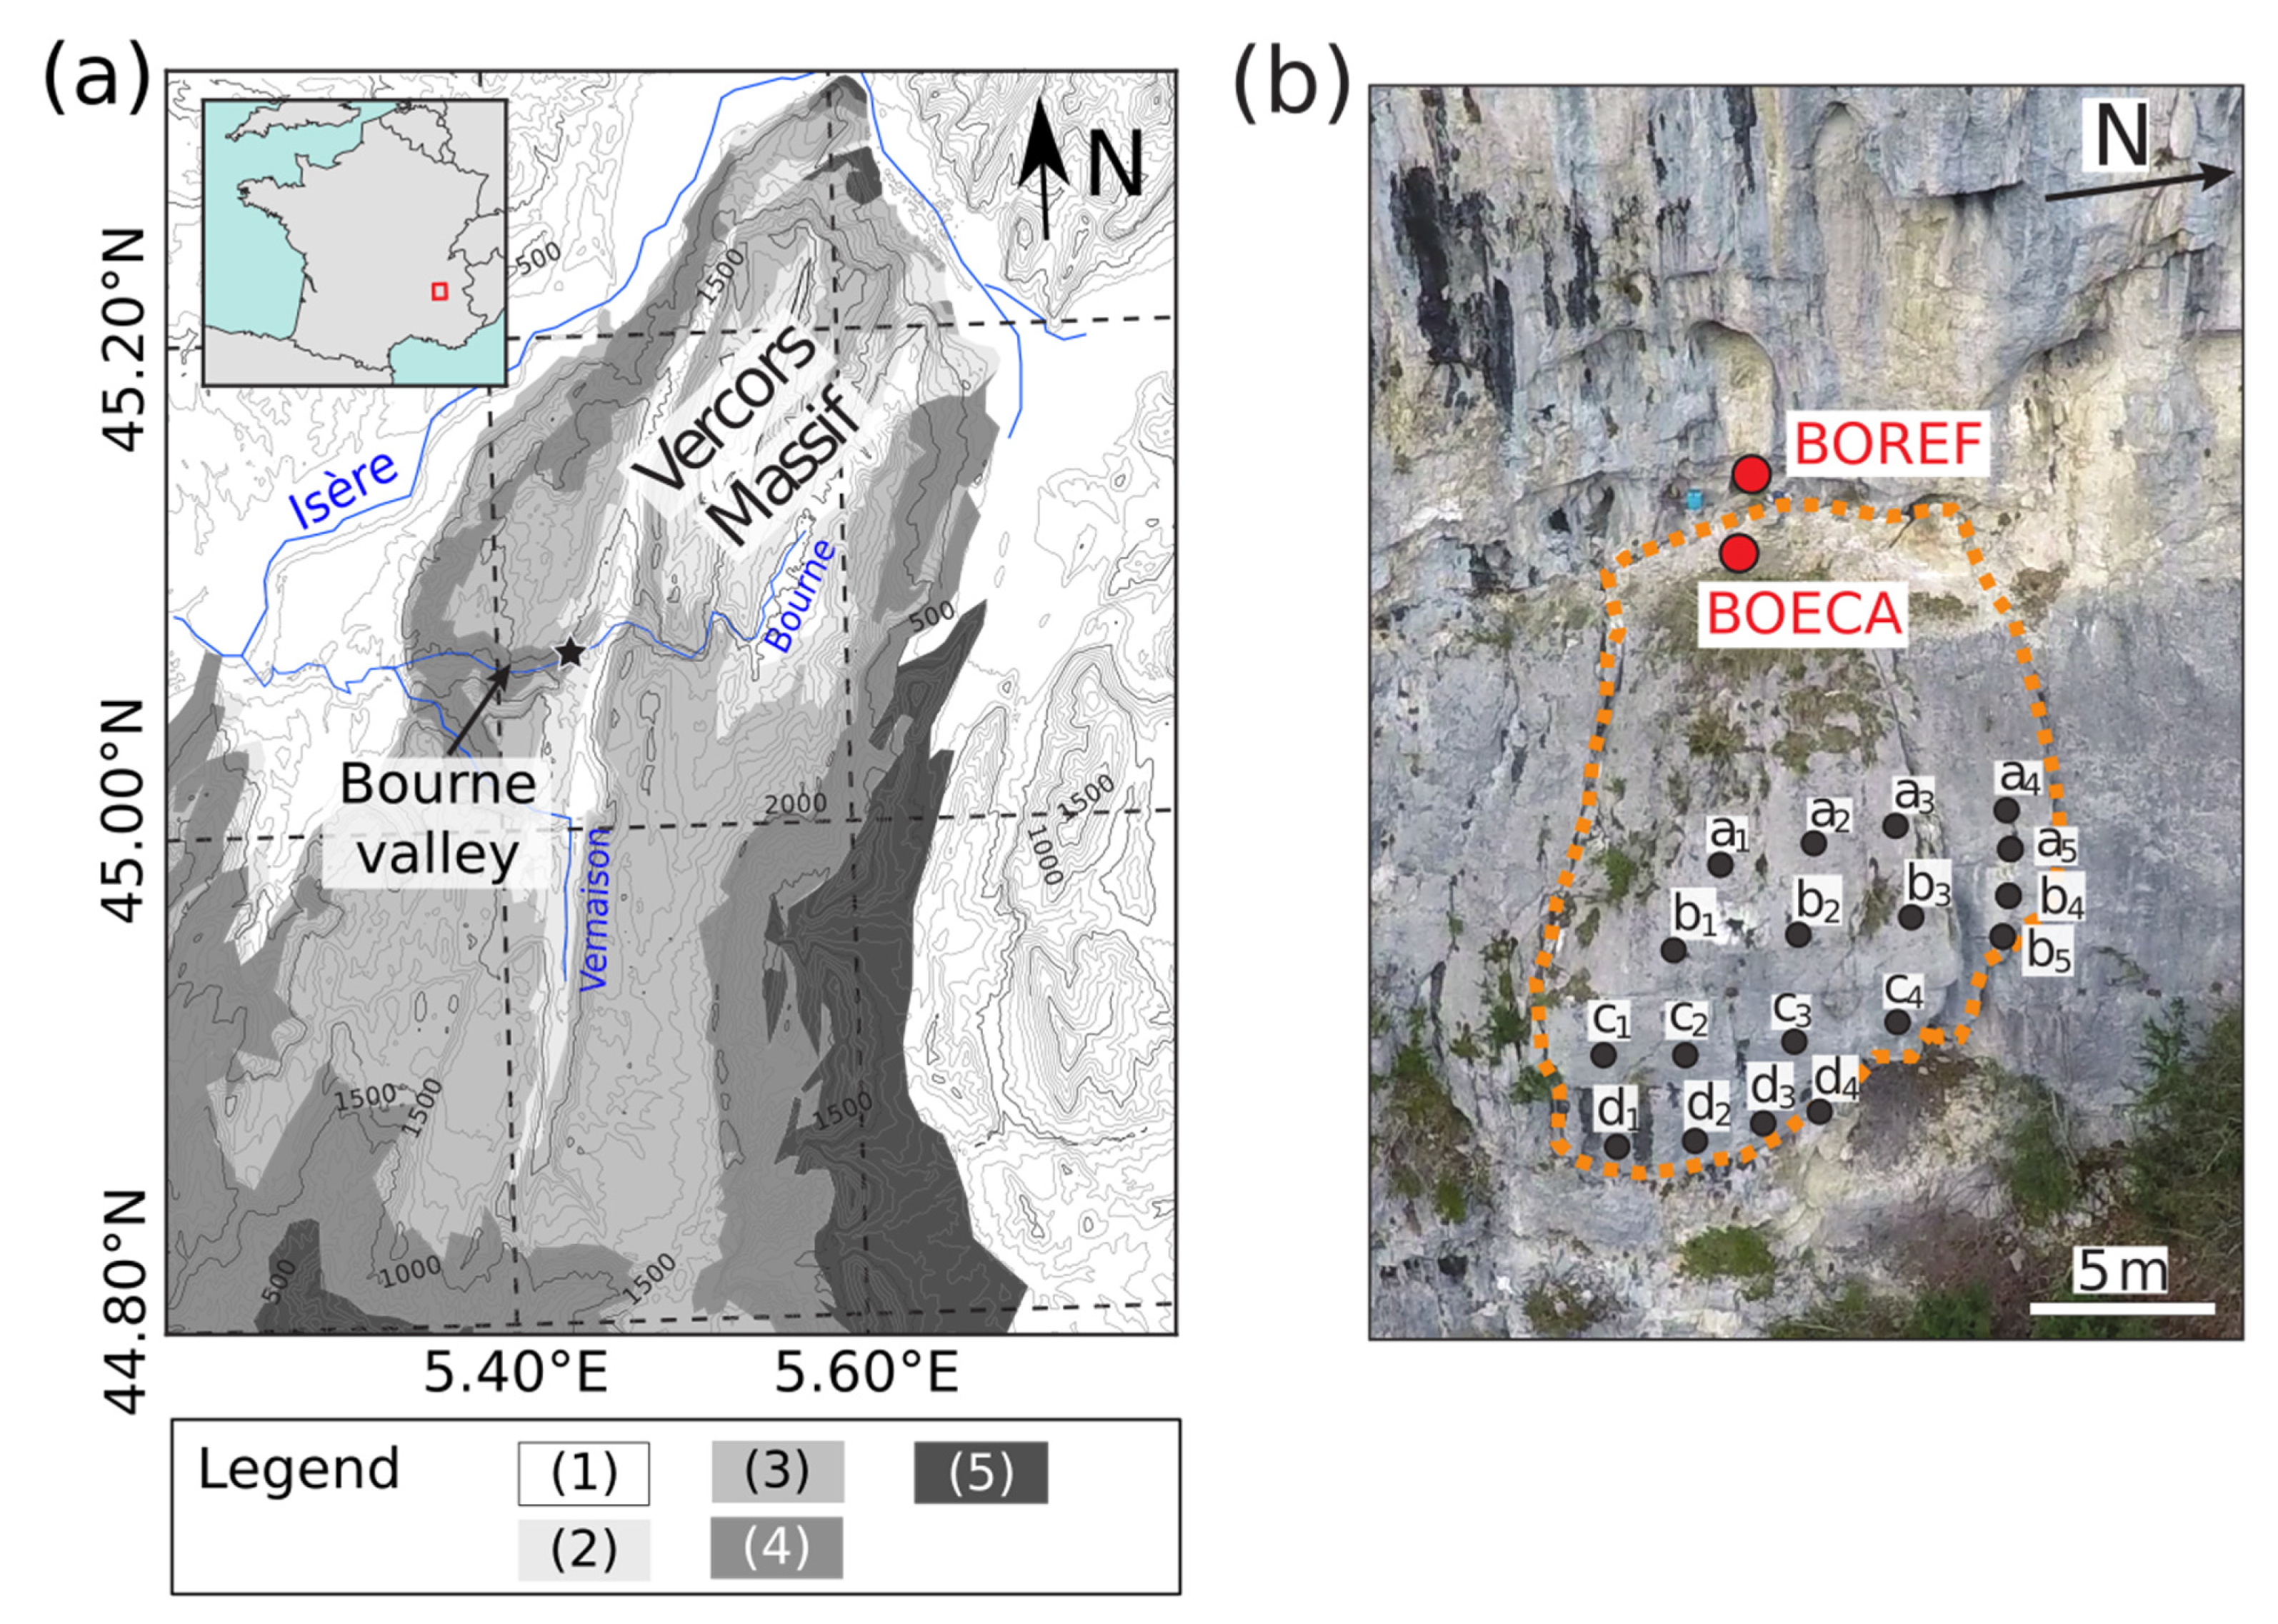
Figure 1. (a) Location map and geological settings (adapted from [83]). The study site is located in the Bourne Valley (black star). Geological legend: (1) Quaternary and Tertiary era (present > −65 Ma); (2) Late Cretaceous (−65 > −110 Ma); (3) Early Cretaceous—Ugonian (−110 > −114 Ma); (4) Early Cretaceous-undifferentiated (−114 > −130 Ma); (5) Jurrasic (−130 > −158 Ma). (2) to (5) belong to secondary era; (b) site aerial view. Grey dots show the bolt locations. Sensors BOECA (unstable column) and BOREF (stable reference) are shown with red circles.
Geosciences 11 00242 g001
Figure 2. Multitaper FFTs of 1 h segments for unstable column’s BOECA (a) and stable massif BOREF (b) sensors. The color scales with time during the monitoring period (from dark blue to yellow, see color bar). Column’s natural frequencies from the detailed study by [78] are shown with vertical arrows.
Geosciences 11 00242 g002
Figure 3. Natural frequencies f0, f1, f3, f5, f6, and f7 change with time (frequencies have been arbitrarily shifted for the sake of easier comparison). Continuous lines show the rolling median computed on 12 h long windows. Air temperature on-site is shown as red curve, and daily rainfall is shown as blue bars (downwards axis). Reinforcement work stages are shown in the background: drilling days (light orange) and grout injection (i1, i2, i3 in red).
Geosciences 11 00242 g003
Figure 4. HVSR of 1 h segments for unstable sensor BOECA (a) and stable sensor BOREF (b). The color scales with time during the monitoring period (from dark blue to yellow, see color bar). Clear HVSR peaks p0, p1, and p5 are shown with vertical arrows.
Geosciences 11 00242 g004
Figure 5. Variations in HVSR peak frequencies p0, p1, and p5 over time (frequencies have been arbitrarily shifted for the sake of easier comparison, labeled Δf). Continuous lines show the rolling median computed on 12 h long windows. Air temperature on-site is shown as red curve, and daily rainfall is shown as blue bars (downwards axis). Reinforcement work stages are shown in the background: drilling days (light orange) and grout injection (red).
Geosciences 11 00242 g005
Figure 6. HVSR amplitude of peaks p0, p1, and p5 with time (logscale on Y-axis). Continuous lines show the rolling median computed on 12 h long windows. Air temperature on-site is shown as red curve, and daily rainfall is shown as blue bars (downwards axis). Reinforcement work stages are shown in the background: drilling days (light orange) and grout injection (red).
Geosciences 11 00242 g006
Figure 7. HHSR of 1 h segments for BOECA/BOREF sensors, for the east component. The color scales with time during the monitoring period (from dark blue to yellow, see color bar). Clear HHSR peaks q0–q6–7 are shown with vertical arrows.
Geosciences 11 00242 g007
Figure 8. Variations in HHSR peak frequencies q0q5 over with time (frequencies have been arbitrarily shifted for the sake of easier comparison). Continuous lines show the rolling median computed on 12 h long windows. Air temperature on-site is shown as red curve, and daily rainfall is shown as blue bars (downward axis). Reinforcement work stages are shown in the background: drilling days (light orange) and grout injection (red).
Geosciences 11 00242 g008
Figure 9. HHSR amplitude of peaks q0q5 with time (logscale on Y-axis). Continuous lines show the rolling median computed on 12 h long windows. Air temperature on-site is shown as red curve, and daily rainfall is shown as blue bars (downwards axis). Reinforcement work stages are shown in the background: drilling days (light orange) and grout injection (red).
Geosciences 11 00242 g009
Figure 10. FFT peak frequencies fn (a) and corresponding peak amplitudes aFFT(fn) (b) as a function of air temperature. Initial stage before bolting is shown with dark blue dots. Stage between i1 and i2 is shown in green. Final stage after i2 is shown with yellow dots. Centroid of each phase is pointed with a colored cross. Days with drilling works have been removed from the dataset.
Geosciences 11 00242 g010
Figure 11. HVSR peak frequencies pn (a) and corresponding peak amplitudes aHVSR(pn) (b) as a function of air temperature. Initial stage before bolting is shown with dark blue dots. Stage between i1 and i2 is shown in green. Final stage after i2 is shown with yellow dots. Centroid of each phase is pointed with a colored cross. Days with drilling works have been removed from the dataset.
Geosciences 11 00242 g011
Figure 12. HHSR peak frequencies qn (a) and corresponding peak amplitudes aHHSR(qn) (b) as a function of air temperature. Initial stage before bolting is shown with dark blue dots. Stage between i1 and i2 is shown in green. Final stage after i2 is shown with yellow dots. Centroid of each phase is pointed with a colored cross. Days with drilling works have been removed from the dataset.
Geosciences 11 00242 g012
Figure 13. Novelty detection results performed on dataset D1 (HHSR (q0, q1, q3, q5, and aHHSR(q0)) along with air temperature time series). Peak frequencies q0, q1, q3, q5 shown from bottom to top in (a). They have been arbitrarily shifted for the sake of easier comparison. HHSR amplitude aHHSR(q0) is shown in (b). Inlier data are shown in dark gray while outliers are shown in light grey. Training period (TP) at the beginning is underlined in green. Air temperature on-site is shown as red curve in (a). Reinforcement work stages are shown in the background: drilling days (light orange) and grout injection (red). (c) Respective percentage of inlier and outlier data in the detection algorithm.
Geosciences 11 00242 g013
Figure 14. Novelty detection results performed on downsampled time series; dataset D2). Peak frequencies q0, q1, q3, q5 shown in (a) have been arbitrarily shifted for the sake of easier comparison. HHSR amplitude aHHSR(q0) is shown in (b). Inlier data are shown in dark gray while outliers are shown in light grey. The training period (TP) at the beginning is underlined in green. Air temperature on-site is shown as red curve in (a). Reinforcement work stages are shown in the background: drilling days (light orange) and grout injection (red). (c) Respective percentage of inlier and outlier data in the detection algorithm.
Geosciences 11 00242 g014
Figure 15. Novelty detection results performed on downsampled time series (dataset D3:p0 and aHVSR(p0) only, analyzed together with air temperature). Data were downsampled except during the training period TP (green rectangle in (a) and (b). Peak frequency p0 shown in (a) has been arbitrarily shifted for the sake of easier comparison. HVSR amplitude aHVSR(p0) is shown in (b). Inlier data are shown in dark gray while outliers are shown in light grey. The training period (TP) at the beginning is underlined in green. Air temperature on-site is shown as red curve in (a). Reinforcement work stages are shown in the background: drilling days (light orange) and grout injection (red). (c) Respective percentage of inlier and outlier data in the detection algorithm.
Geosciences 11 00242 g015
Table 1. Processing tools applied for ambient noise analyses on unstable slopes.
Type of MethodAlgorithmNumber of Required SensorsPaper for Method DescriptionParameter YieldedReferences of
Applications
SCSAFast Fourier Transform (FFT)1[63]Spectrum[48,49,50,56,64]
Power Spectral Density 1,2 (PSD)1[65,66,67]Spectrum[44,45,47]
SCPA 2Time-Frequency-dependent Polarization Analysis (TFPA)1[52], based on [68] and [69] or [70,71]Strike, dip, and ellipticity of ground motion[47,53,54,55,57]
SRSRFFT for spectrum computation2HHSRSpectral amplification ratio between site and a reference[50,51,52,54,55,62]
HVSRFFT for spectrum computation1[72,73,74,75]Spectral amplification ration between horizontal and vertical ground motion[50,55,57,62]
Modal analysis 2Frequency Domain Decomposition (FDD)≥2[76]Spectral peaks, associated damping, and modal shape[47,49,59]
1 PSD estimated with Welch’s method corresponds to the square of multitaper FFT. 2 Not applied in this study.
Table 2. Cumulated changes (in %) in spectral peaks throughout the bolting works (comparison between before works and after injection i2). n/a: not spotted by HVSR technique.
ParameterFundamental Peak (f0, p0, q0)Mode 1 (f1, p1, q1)Mode 3 (f3, q3)Mode 5 (f5, p5, q5)Mode 6 (f6, p6, q6)Mode 7 (f7, p7, q7)
fFFT (%)+7.5+9.5+13+2.4+2.2+3.7
fHVSR (%)+7.5+9.5n/a+5.6n/an/a
fHHSR (%)+6.4+8.6+13.9+3.0n/an/a
Table 3. Cumulated changes (in %) in spectral peak amplitudes throughout the bolting works (comparison between before works and after injection i2). n/a: not spotted by HVSR technique.
ParameterFundamental Peak (f0, p0, q0)Mode 1 (f1, p1, q1)Mode 3 (f3, q3)Mode 5 (f5, p5, q5)Mode 6 (f6, p6, q6)Mode 7 (f7, p7, q7)
aFFT (%)+91+171+41.2+44+69−39
aHVSR (%)−39+26.2n/a+5.6n/an/a
aHHSR (%)−10.9+29.6−4.1−9.5n/an/a
Publisher’s Note: MDPI stays neutral with regard to jurisdictional claims in published maps and institutional affiliations.