Article

Validation of an Index for Susceptibility to Earthquake-Induced Landslides Derived from Helicopter-Borne Electromagnetic Resistivity and Digital Elevation Data

1
Faculty of Engineering and Design, Kagawa University, Takamatsu 7610396, Japan
2
NEXCO-West Engineering Shikoku, Co. Ltd., 1-6-20 Dojima, Kita-ku, Osaka City 5300004, Japan
3
Public Project Consulting SBU, Land Conservation Department, Kokusai Kogyo Co., Ltd., Tokyo 1830057, Japan
4
Institute of Education, Research and Regional Cooperation for Crisis Management Shikoku, Kagawa University, Takamatsu 7608521, Japan
*
Author to whom correspondence should be addressed.
Geosciences 2021, 11(2), 95; https://doi.org/10.3390/geosciences11020095
Submission received: 8 January 2021 / Revised: 1 February 2021 / Accepted: 10 February 2021 / Published: 19 February 2021
(This article belongs to the Special Issue Geospatial Analysis for Disaster Risk Monitoring and Assessment)

Abstract

:
Catastrophic earthquake-induced landslides can occur on slopes composed of loosened and fractured rock masses. Although it is impossible to prevent such landslides, estimation of the susceptibility of slopes to earthquake-induced landslides is useful for risk management. An index of susceptibility to earthquake-induced landslides (ISEL) was developed by using helicopter-borne electromagnetic resistivity data. However, the ISEL has not yet been validated through the analysis of pre-earthquake data. In this study, ISEL values were estimated from resistivity and digital elevation data obtained in 2013 around Mt. Aso, Kyushu, before the 2016 Kumamoto earthquake. Although most of the landslides around Mt. Aso during the 2016 Kumamoto earthquake were mass movements of volcanic tephra layers, some of them occurred on loosened rock masses. Landslide susceptible areas at loosened rock masses are the target for ISEL value estimation. Our results validated the effectiveness of the ISEL as a predictor of earthquake-induced rock mass landslides.

1. Introduction

Several large-scale earthquakes occurred worldwide during the last few decades, especially in Asia, triggering several thousand landslides in mountainous areas [1,2,3,4,5,6,7,8,9]. Catastrophic earthquake-induced landslides tend to occur on slopes composed of loosened and fractured rock masses, for example, the 1999 Chi-Chi earthquake (Taiwan) [10,11], the 2004 Chuetsu earthquake (Japan) [12], the 2008 Wenchuan earthquake (China) [13], and the 2010 Darfield earthquake (Canterbury) [14]. The huge volume of debris generated by such landslides often causes secondary damage such as damming and outburst flooding of rivers, disrupting road networks, and isolating villages. In order to mitigate landslide damage, it is first necessary to estimate the risk of landslide occurrence and damage extent, then develop a disaster management plan in advance.
There are several approaches to estimating landslide susceptibility. Deterministic models based on infinite slope stability analyses employing simplified assumptions such as basic failure mechanisms or homogeneous mechanical properties of soil and rock have been used [15]. For regional landslide susceptibility assessments, such models might oversimplify some components of the analyses.
Landslide occurrence probability is one of the key components of landslide susceptibility mapping. Probability can be derived from statistical analyses of past landslide events, which include assessment of landslide frequency [16]. This method can be used to establish zones of relative landslide susceptibility if complete records of landslide events in a particular region exist. However, preparing complete records is impossible because large-scale catastrophic landslides are too infrequent to make a record of landslide inventory for statistical analysis of landslide occurrence [16,17]. Surface morphology and topography can also provide useful clues for identifying loosened slopes and assessing landslide susceptibility since slopes that exhibit landslide morphologies have usually been weakened and loosened by previous landslides [7,18,19,20,21]. However, landslide topography cannot always be used for mapping landslide susceptibility because the mechanically weakened bedrock in such areas results in particularly rapid decay of the relief that characterizes them [22]. Interferometric Synthetic-Aperture Radar (InSAR) systems for early detection and continuous monitoring of landslides have also been used because of their wide-swath, cloud-independent, day-and-night observation capability [23,24]. However, during large-scale earthquakes, strong tremors can cause sudden landslides on loosened slopes even without precursor movement, thus InSAR data cannot be used to predict such landslides.
In order to identify landslide susceptibility, the looseness of slopes needs to be determined by identifying geological structures and detecting loosened bedrock zones. This may be accomplished by core drilling and ground-based geophysical surveys, which can provide high-resolution subsurface data [25]. However, these methods are too expensive for regional applications, especially in mountainous areas. In large areas with limited surface accessibility, airborne surveying is the only practical approach to compensate for the shortage of ground-based observational data. Helicopter-borne electromagnetic (HEM) data are useful for the extrapolation of information acquired from geological field surveys [26,27,28]. Resistivity data collected through HEM surveys have been used to quickly investigate subsurface slope structures over broad, and in some cases, inaccessible areas, for purposes such as tunnel design and construction (e.g., [29,30,31]). Although it is known that resistivity data are useful to estimate the looseness of rock masses, caution must be exercised in their interpretation because they measure several geological parameters including water content, clay mineralogy, and lithology. These must be excluded in order to extract data specific to bedrock looseness. Nonomura et al. [32] analyzed HEM resistivity data to differentiate loosened slopes from sound bedrock and identify deep-seated landslide susceptible zones. From this, Nonomura et al. [32] developed a parameter for estimating looseness named “average ruggedness of resistivity.” Nonomura and Hasegawa [33] validated the parameter’s effectiveness in estimating the looseness of rock masses and proposed an index for earthquake-induced landslide (ISEL) susceptibility at the Kanagi landslide where a catastrophic, deep-seated landslide was triggered by the 1707 Hoei earthquake (M 8.6) [34,35]. The “average ruggedness of resistivity” at various locations around the Kanagi landslide was compared based on the assumption that most of the loosened rock masses within the landslide area were removed in the 1707 earthquake, and loosened rock masses outside of the landslide area remain.
The results indicate that areas with lower “average ruggedness of resistivity” are located within the landslide area and areas with higher “average ruggedness of resistivity” are located outside of the landslide area. Based on this, Nonomura and Hasegawa [33] confirmed that loosened rock masses can be identified by using this parameter.
Moreover, they assumed that landslides tend to occur on slopes when loosened rock masses are affected by strong tremors during an earthquake and proposed the index of susceptibility for earthquake-induced landslides (ISEL) by multiplying the looseness of bedrock (“average ruggedness of resistivity”) by the amplification of seismic vibration on slopes (estimation of topographic effect using DEM) [33].
However, the ISEL has not yet been validated for landslide occurrence tendency during an earthquake in areas with high ISEL values. In order to make practical use of the index to estimate the location of earthquake-induced landslides, validation is indispensable.
The aim of this study is to validate the extent to which the ISEL can estimate the occurrence of landslides using pre-earthquake airborne resistivity data collected in 2013 from areas where landslides triggered by the 2016 Kumamoto earthquake occurred. The ISEL was calculated using these data after the earthquake.

2. Study Area

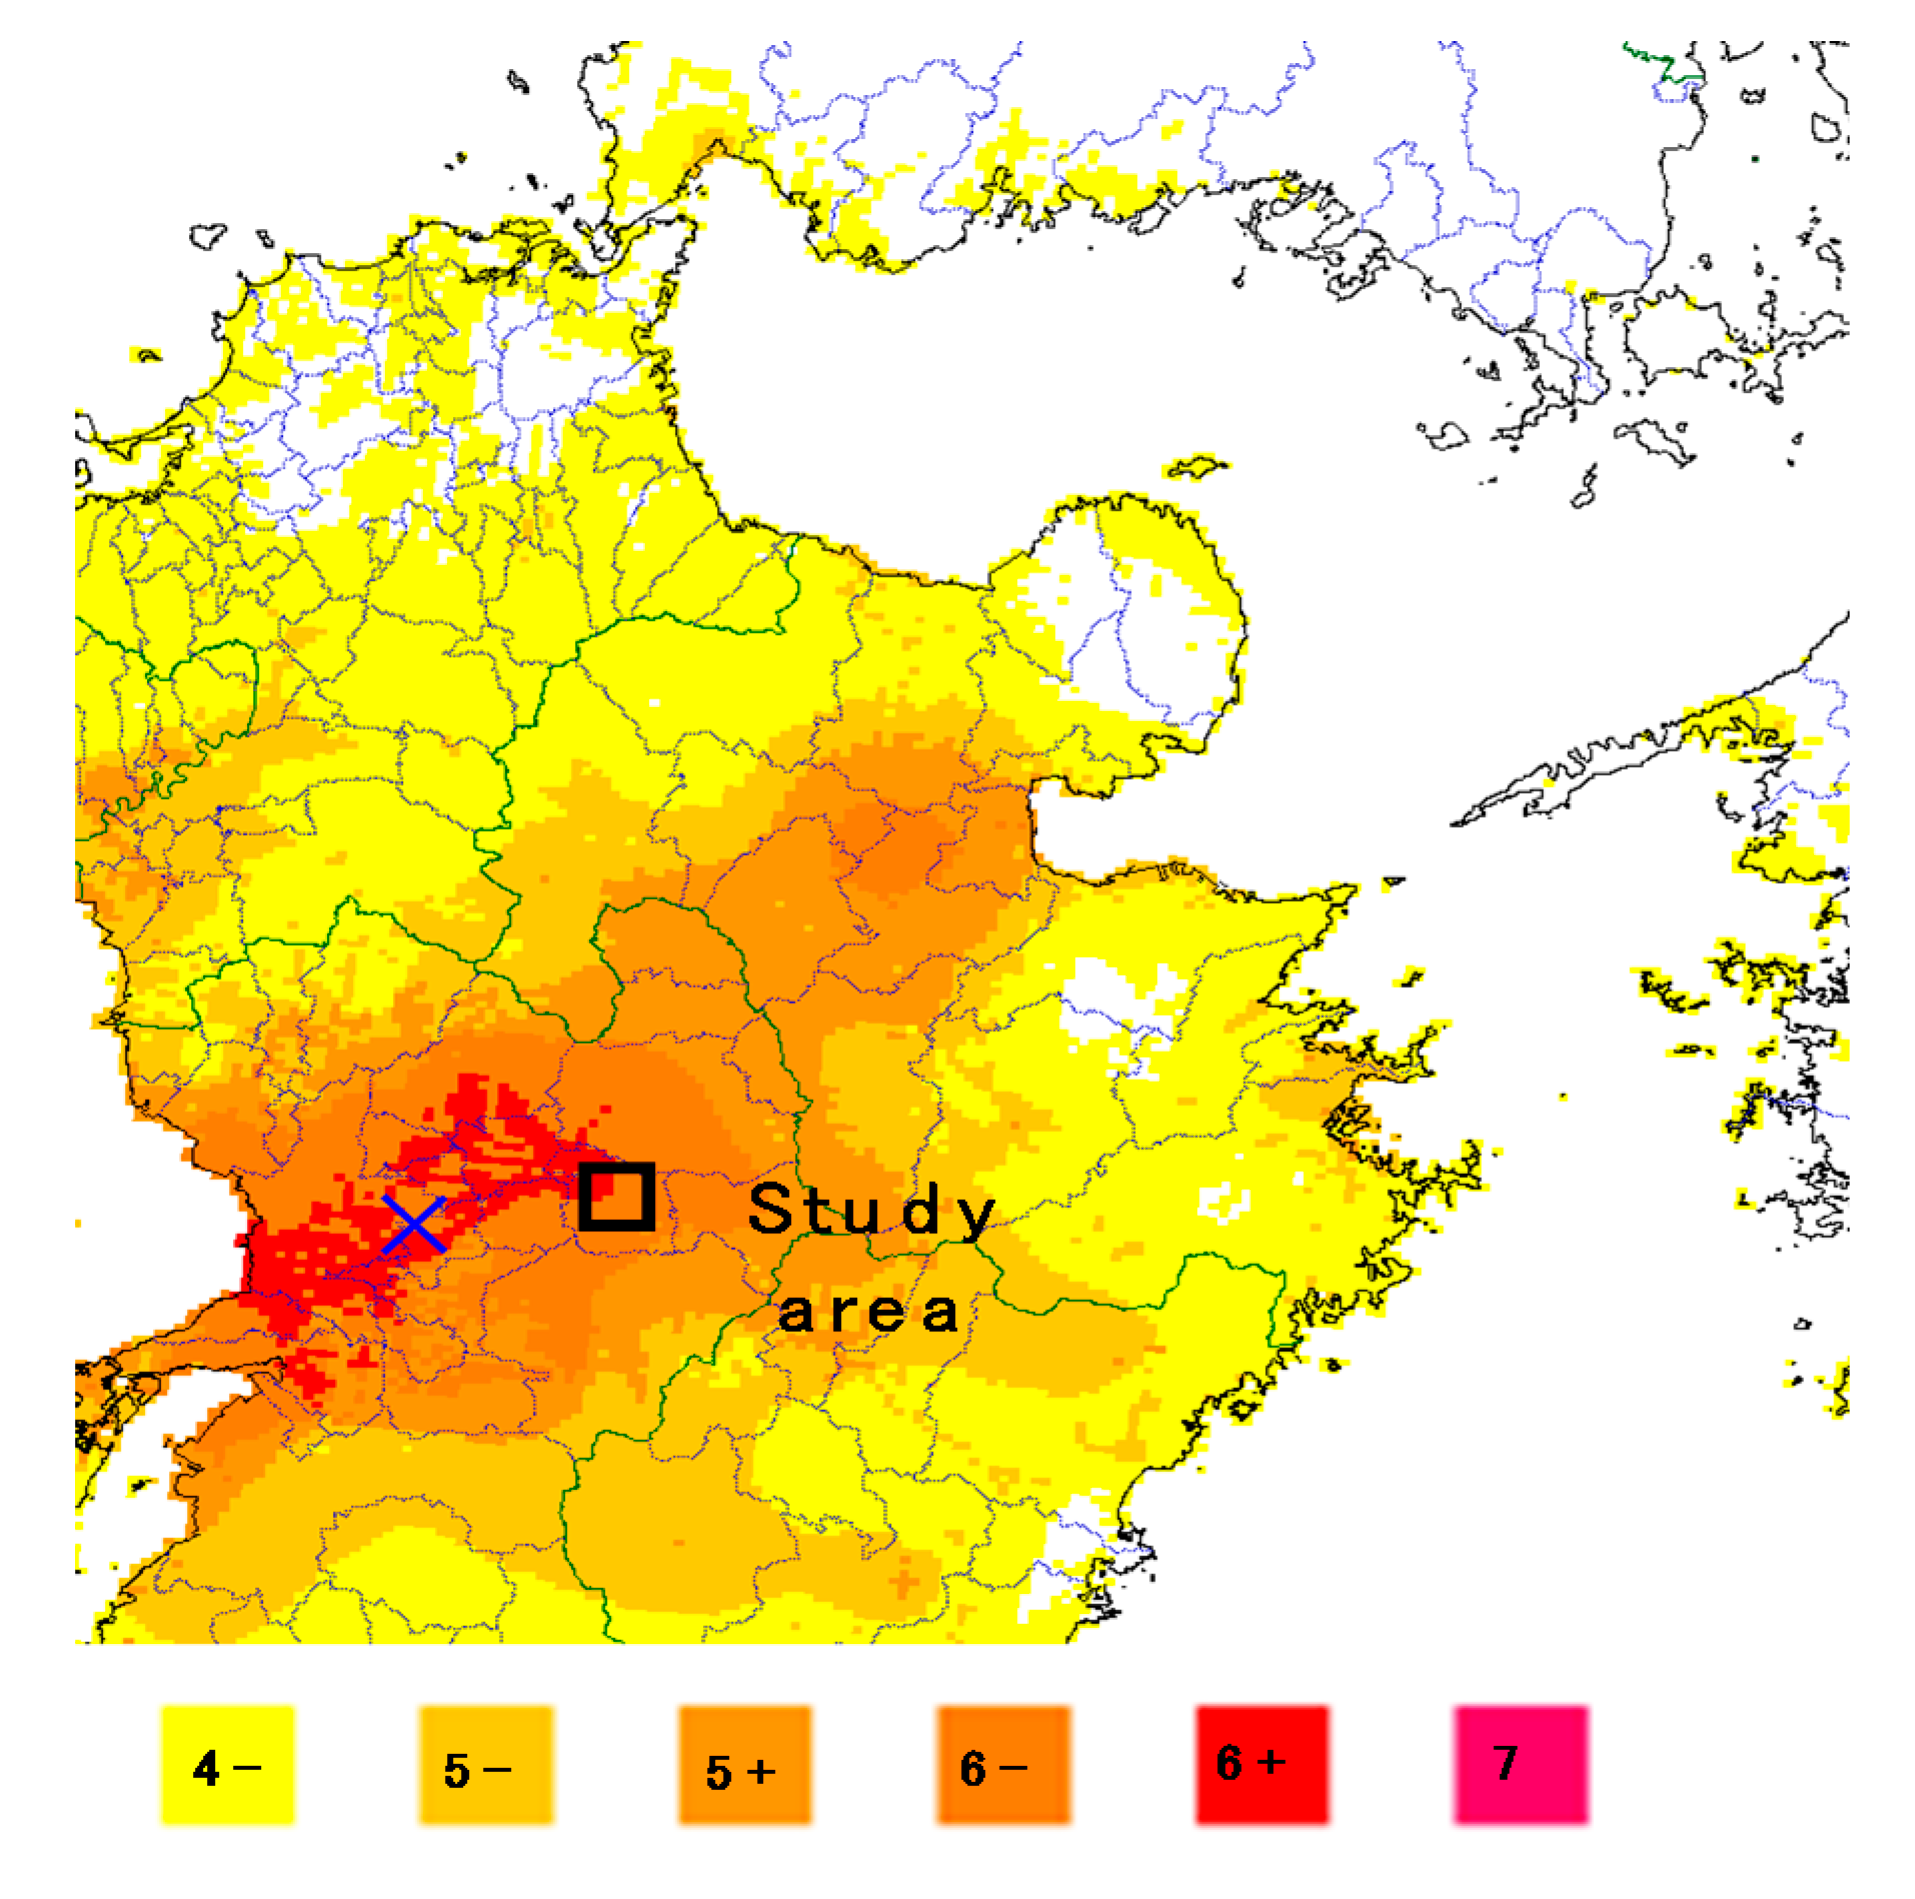
Figure 1 shows the location and lithology of the study area. Figure 2 shows the Japan Meteorological Agency (JMA) seismic intensity distribution of the 2016 Kumamoto earthquake around the study area. The main shock of the April 2016 Kumamoto earthquake occurred at 12 km depth in the central Kyushu region with a moment magnitude of 7.3. The strong tremor, which was widely observed, caused considerable damage in and around central Kyushu [8], (Figure 2) [36].
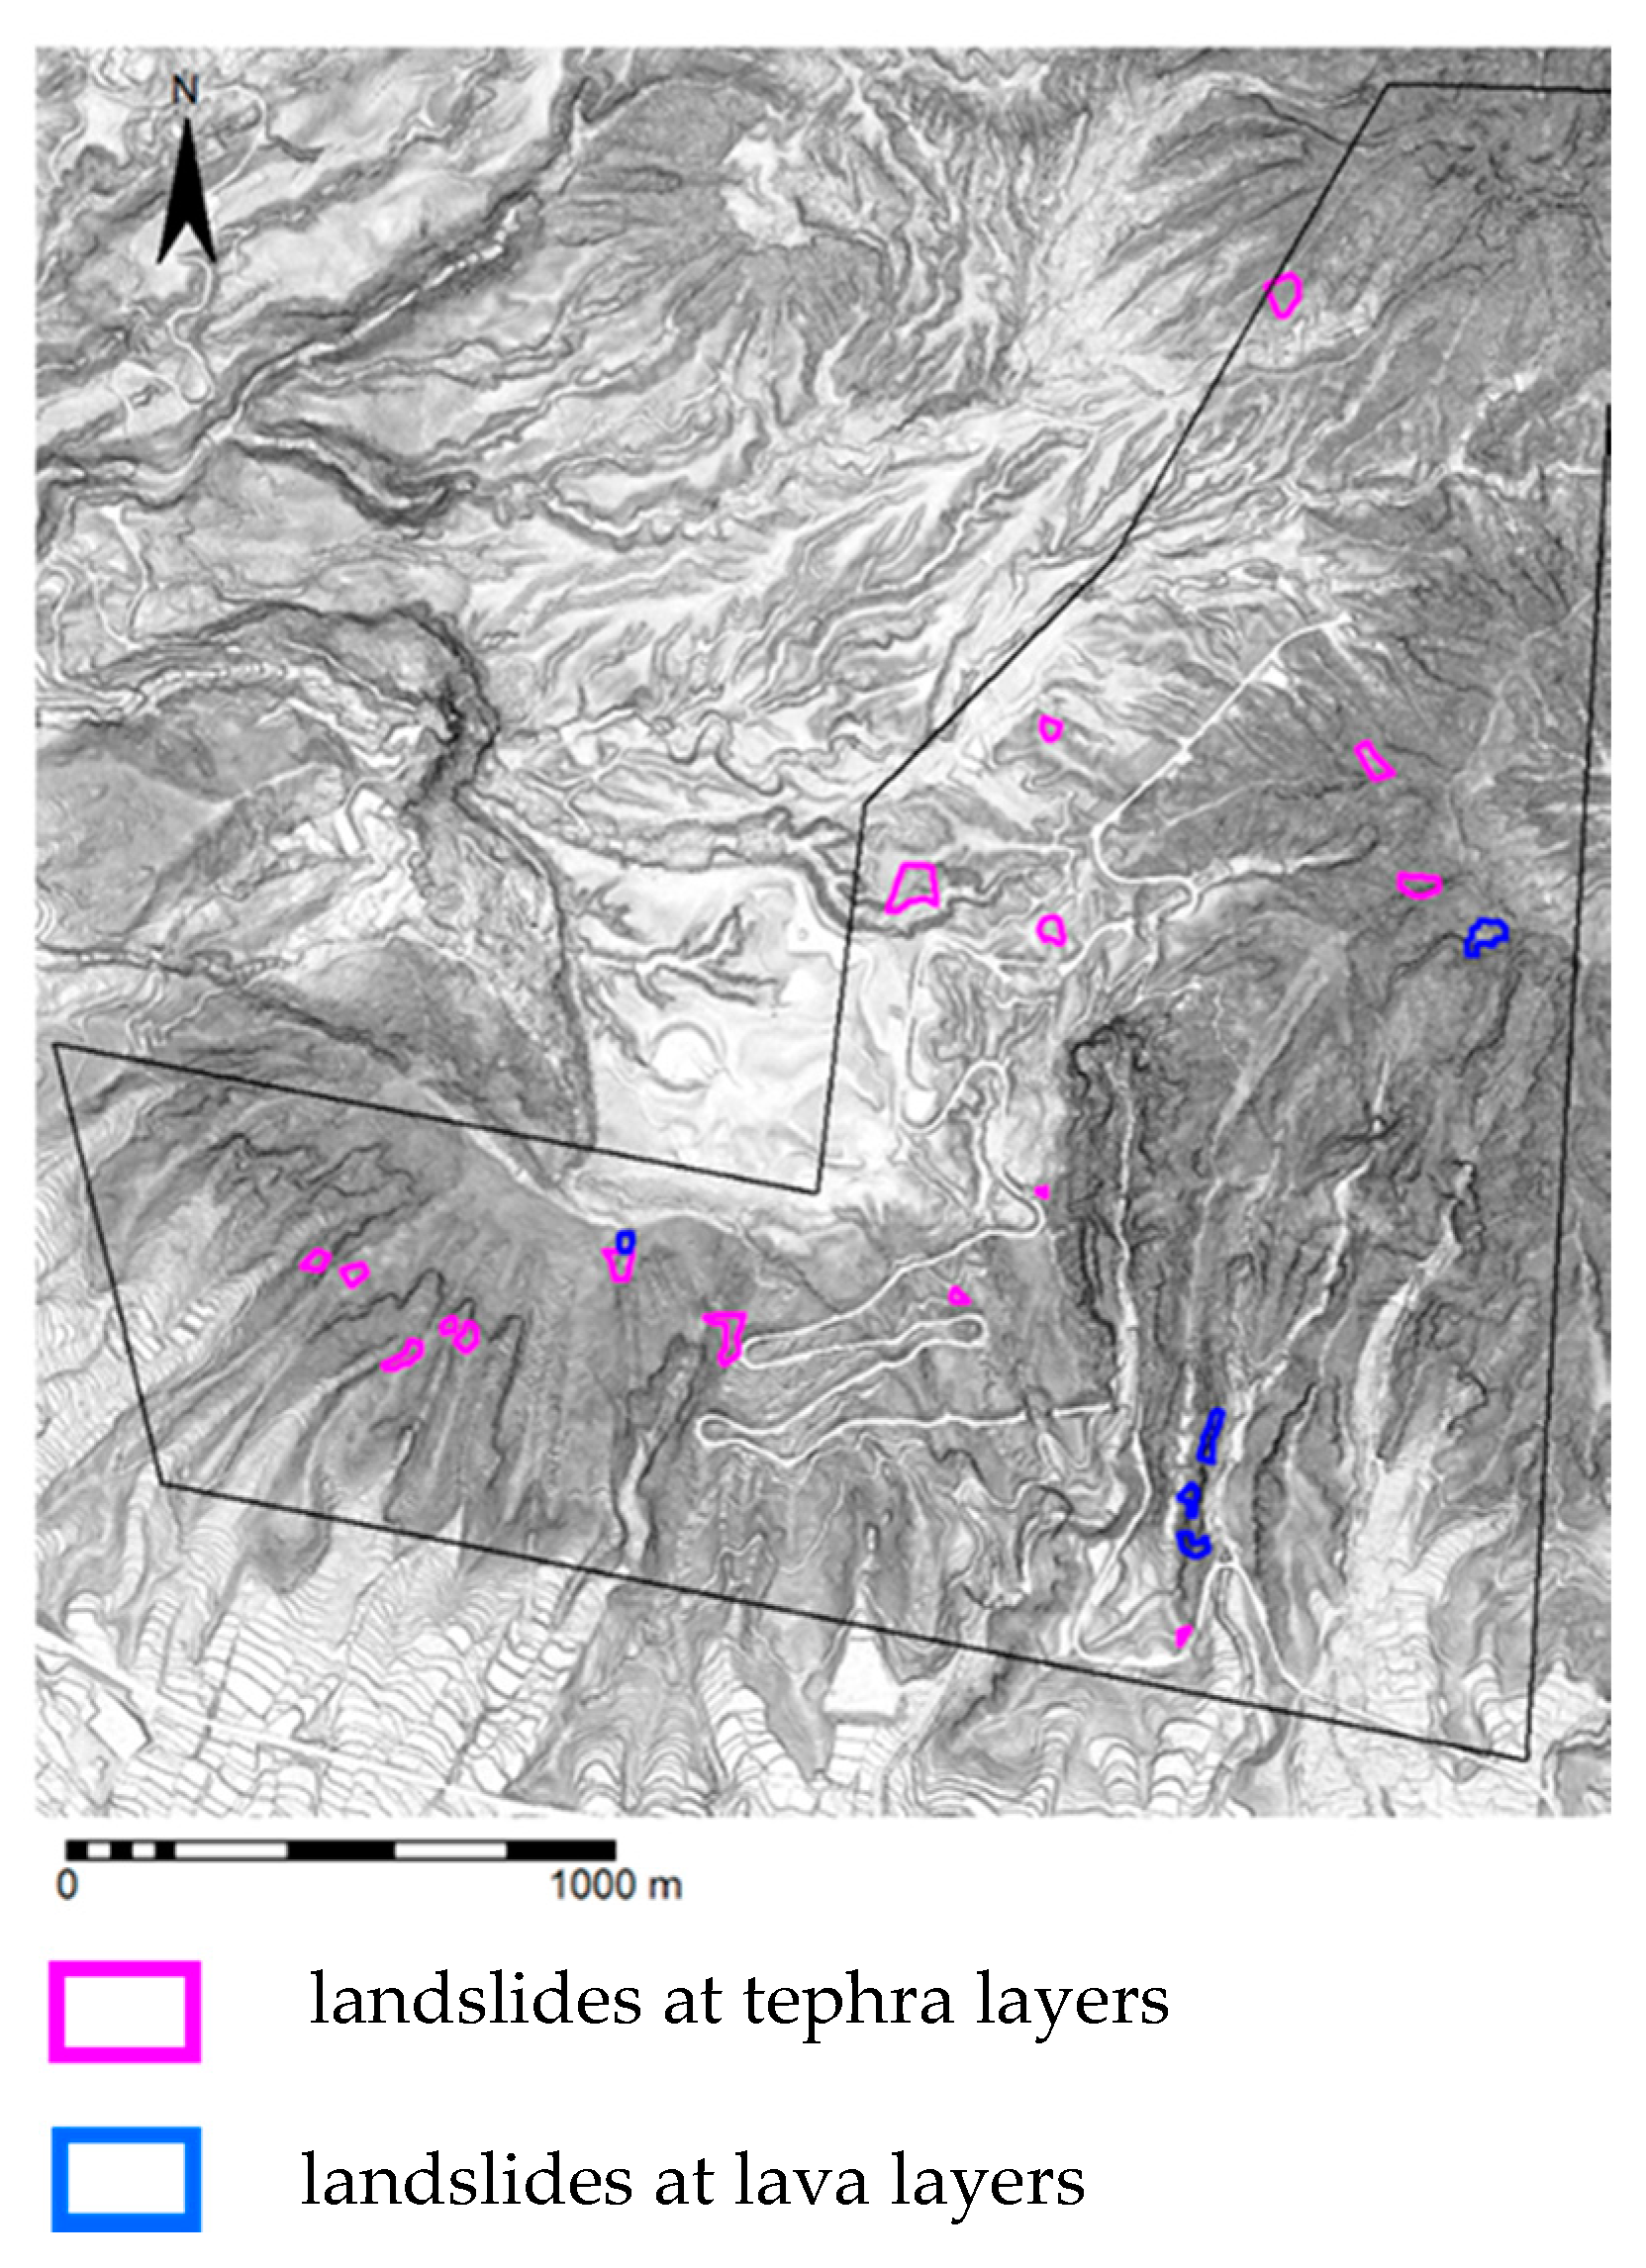
There were several landslides, especially in the Minami-Aso area (Figure 1). The landslides were traced on the estimated ground deformation using airborne LiDAR data acquired before and after the earthquake, where a decrease in elevation of more than 1m was detected in several places after the landslides [37] (Figure 3). The pre-earthquake LiDAR data were acquired in April 2010 and the post-earthquake LiDAR data were acquired in April and May 2016. The traced landslides were categorized into two types: those occurring at lava layers and those occurring at volcanic tephra layers. The categorization is based on field observations conducted between 15–17 November 2016.
Most of the landslides occurred as mass movements at volcanic tephra layers which are composed of soft soils, while some landslides occurred at lava layers composed of hard rock masses. This is because surface deposits in the Minami-Aso area are mostly black and brown tephra layers overlying lava flows [8].

3. Method for Estimating Landslide Susceptibility

This study attempts to validate the “index of susceptibility for earthquake-induced landslides” (ISEL) by using HEM resistivity data acquired before the 2016 Kumamoto earthquake. These data were processed using the same method as in Nonomura et al. [32] and used to calculate the ISEL using the same method as in Nonomura and Hasegawa [33].

3.1. HEM Data Acquisition

HEM survey data provide information about subsurface resistivity distribution [38,39,40,41,42,43]. The HEM system used in this study is comprised of transmitting and receiving coils operating at six frequencies (140 kHz, 31 kHz, 6.9 kHz, 3.3 kHz, 1.5 kHz, and 340 Hz) inside a cylindrical container suspended below a helicopter by wires 30 m in length at a maintained height of about 30 m above the ground during data recording. The survey was carried out between 16–25 December 2013, more than two years before the 2016 Kumamoto earthquake.
The flight line interval was approximately 100 m and the flight velocity was 30 km/h. At each frequency, approximately 10 data points were obtained for every 8 m along the flight lines. The HEM data were processed using the same method as in Nonomura et al. [32] in order to obtain resistivity data. The resistivity pixel size was 10 m.
In order to determine the looseness of rock masses where the landslides occurred, resistivity data obtained at the 140 kHz frequency were used. The exploration depth (skin depth) of this frequency was calculated at 11.0–21.8 m using Sengpiel and Siemon’s equation [44].

3.2. Index of Susceptibility for Earthquake-Induced Landslides

In Nonomura and Hasegawa [33], the ISEL was developed as an index of susceptibility for earthquake-induced landslides, which incorporates estimates of rock mass looseness and the topographic amplification of seismic vibration. In this study, the extent to which the ISEL can estimate the occurrence of landslides was validated by using data from landslides triggered by the 2016 Kumamoto earthquake. A flow diagram (Figure 4) illustrates how the ISEL was calculated and later validated.
Seismic waves during earthquakes tend to be amplified at ridges with steep slopes; the strong seismic vibrations can trigger landslides [45,46]. Uchida et al. [47], in an extensive study of the 1995 Kobe earthquake in the Rokko mountain range, statistically quantified the topographic effect on earthquake-induced landslide susceptibility in terms of the slope, mean curvature of the ground surface, and maximum seismic acceleration as follows:
F = 0.075 × Slope − 8.9 × Mean curvature + 0.0056 × PGA − 3.2
where F < 0 means there is no possibility of a landslide. For F > 0, the larger the value of F, the higher the probability of a landslide.
Equation (1) was developed using data obtained in an area of granite overlain by weathered sandy soil. The equation was considered applicable in areas of Pleistocene and Pliocene sedimentary rocks affected by the 2007 Niigataken Chuetsu-Oki earthquake [48]. The main types of landslides in the Kobe earthquake and the Niigataken Chuetsu-Oki earthquake were shallow landslides. However, Equation (1) does not apply to landslides triggered by the 2004 Chuetsu earthquake because they were deep-seated [49]. It implies that the main contributors to deep-seated landslides are not only related to topography but also underlying subsurface structures, such as looseness and the existence of potential sliding surfaces. In order to focus on deep-seated landslides and landslides from rock masses, we used F to represent a topographical index of seismic wave amplification together with the index of rock mass looseness and set the peak ground acceleration (PGA) at 300 gal based on the JMA seismic intensity scale of 6-lower observed in the 2016 Kumamoto earthquake (Figure 2).
Resistivity distributions show several subsurface properties over wide areas, such as rock mass looseness, clay mineralogy, and water content. Under dry conditions, the resistivity of loosened and fractured rock is high because the fractures are filled with air rather than water [50,51]. To estimate looseness from resistivity data, the influence of lithology on the resistivity distribution must be minimized. Nonomura et al. [32] proposed that the distribution of relatively higher resistivity, calculated by applying the concept of the openness to resistivity data [52], could be used to determine the looseness of rock masses. The localized distribution of resistivity within a given radial distance in one direction is defined as the “ruggedness of resistivity.” A positive value of ruggedness of resistivity at a pixel indicates that the resistivity at that pixel is higher than at neighboring pixels; the greater the value of ruggedness, the greater the resistivity difference between neighboring pixels. Nonomura et al. [32] measured ruggedness in eight azimuthal directions (separated by 45°) from each pixel, the average of which they called “average ruggedness of resistivity” and used as an index of looseness.
Landslides tend to occur on slopes when loosened rock mass is affected by strong tremors during an earthquake. By multiplying the looseness of bedrock (“average ruggedness of resistivity”) with seismic vibration amplification on slopes (the topographic effect “F”), the index of susceptibility for earthquake-induced landslides (ISEL) was obtained.
ISEL = Average ruggedness of resistivity × F

4. Results

4.1. Topographic Seismic Vibration Amplification

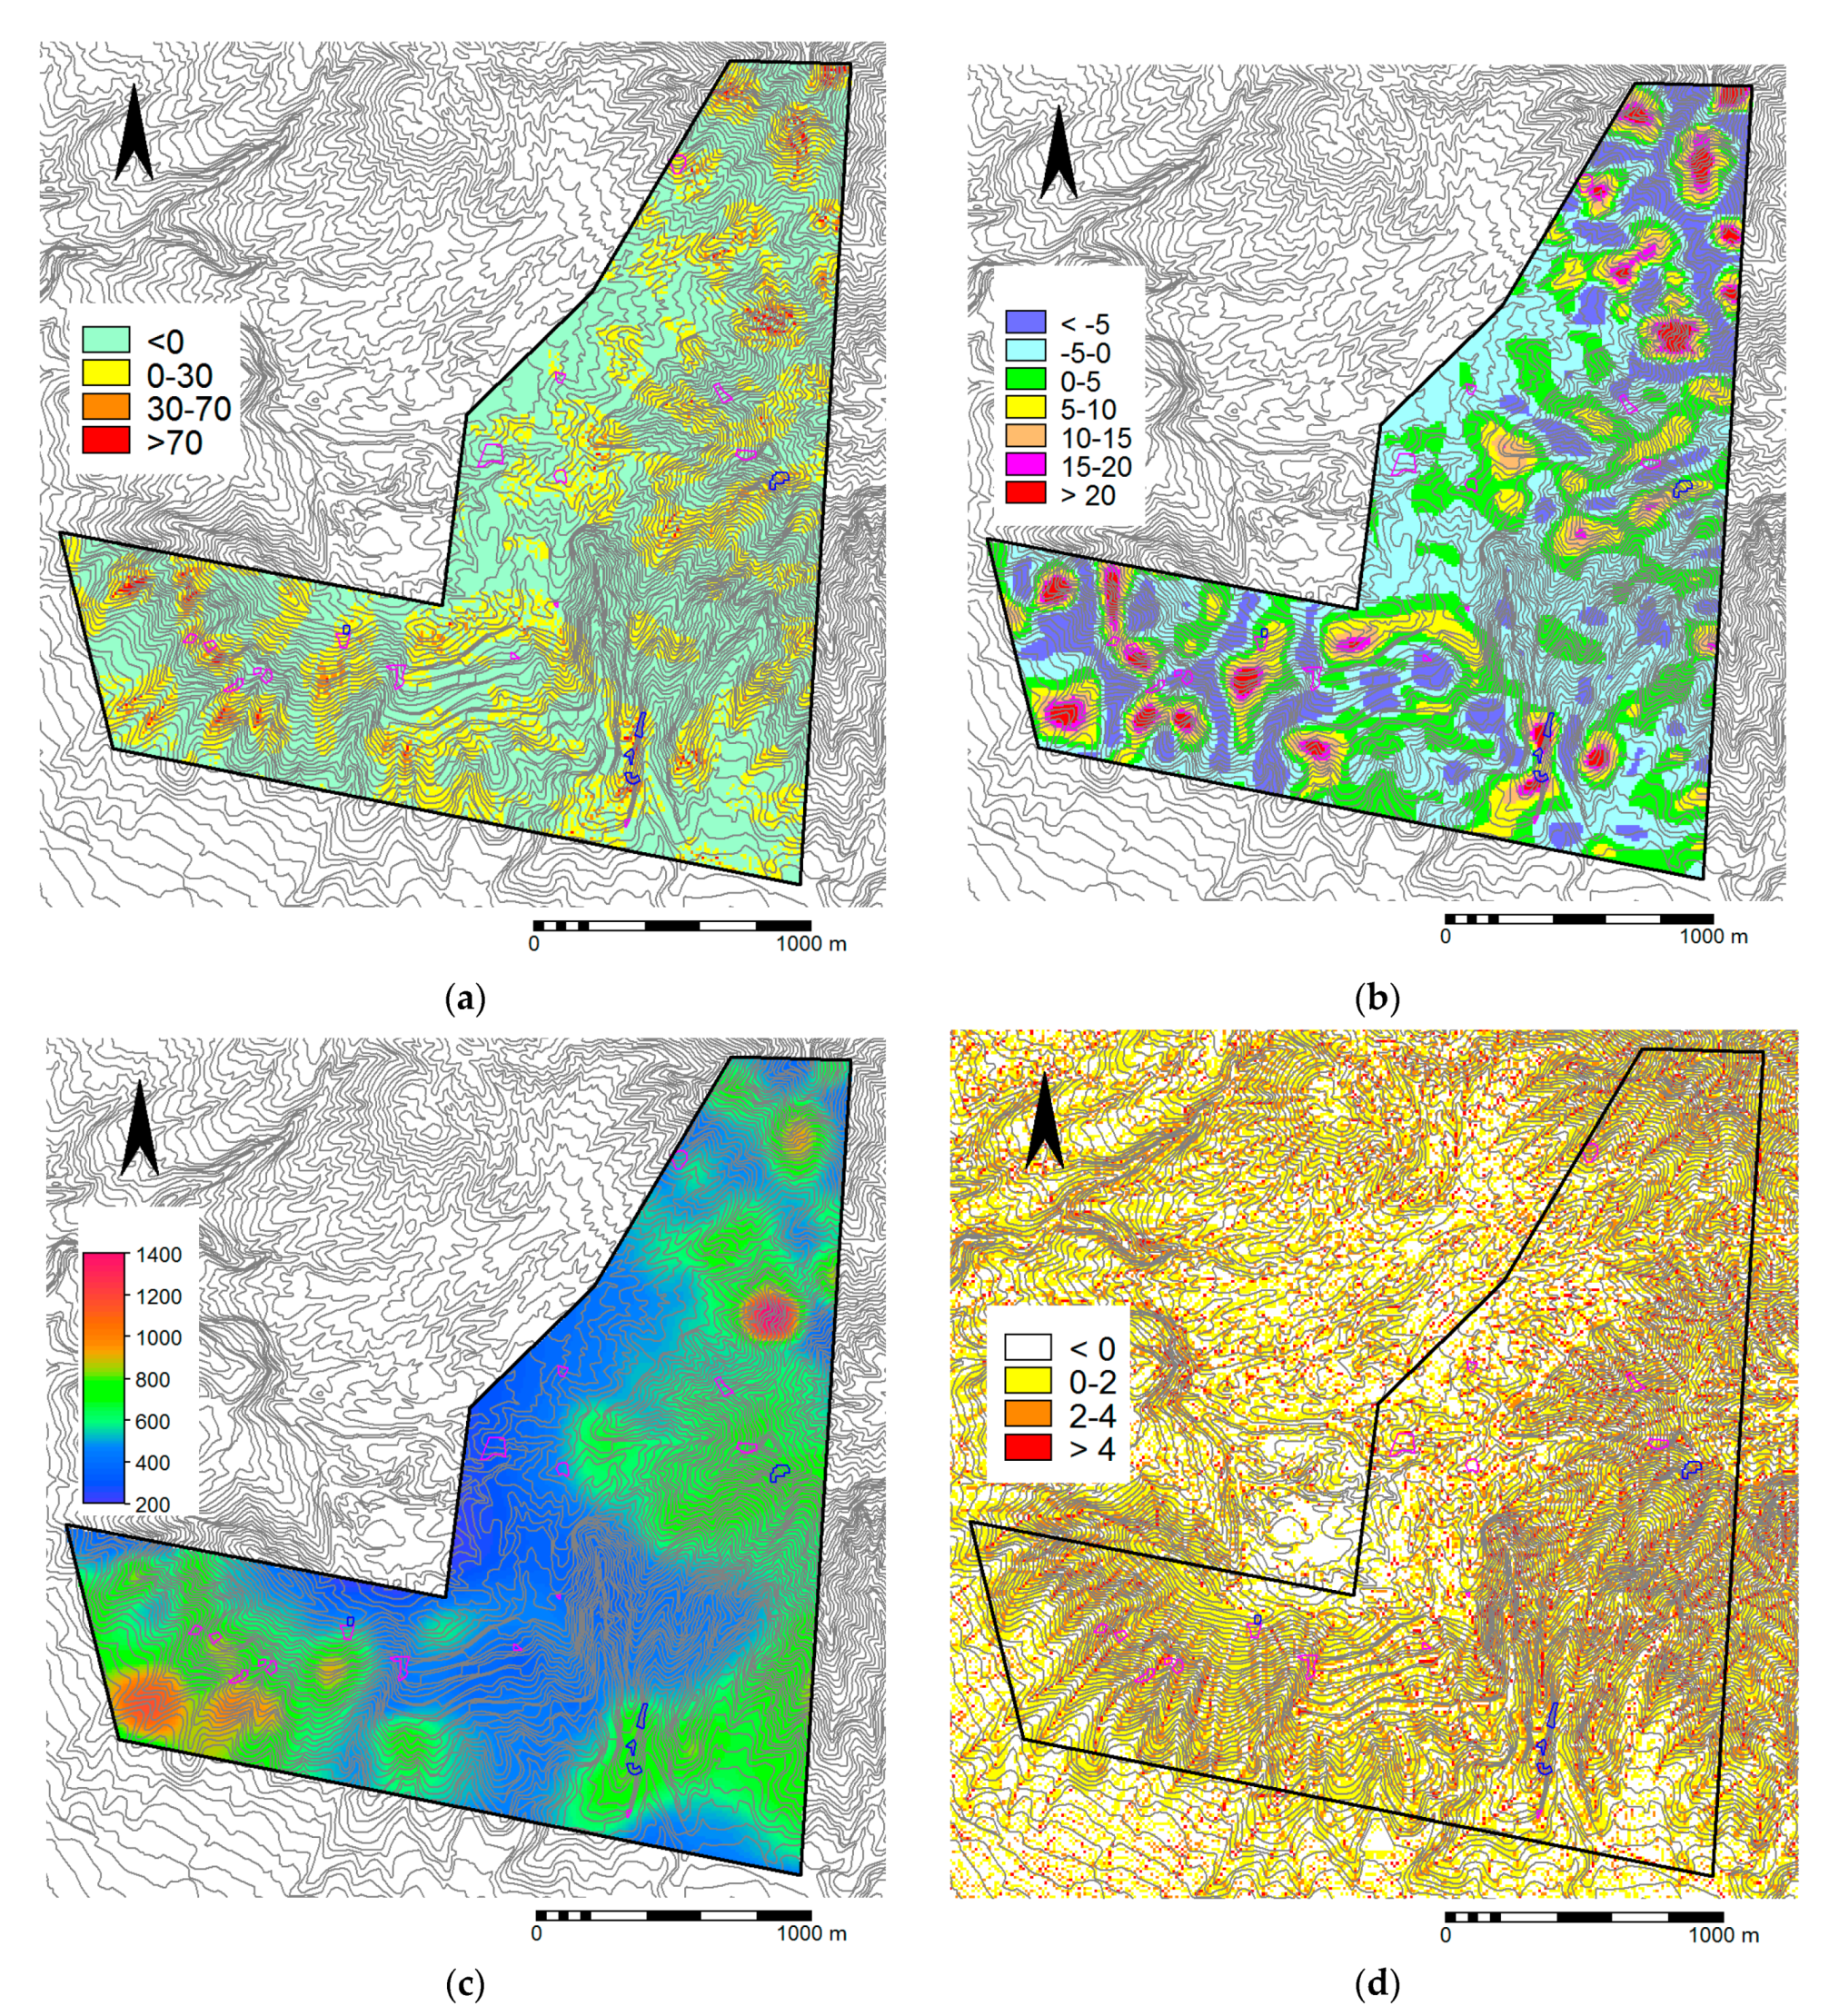
According to Uchida et al. [47], pixels with positive F-values (Equation (1)) where topographic seismic vibration amplification is possible, are prone to shallow landslides. Figure 5a shows the distribution of topographic index F in the study area, calculated using Equation (1), with a PGA of 300 gal. Higher F-values are estimated on steep slopes and convex slopes. Landslides occurring at lava layers were distinguished from those at volcanic tephra layers and overlaid on the F distribution. Landslides at lava layers had relatively higher F-values (F = 2–4 or F > 4). However, there were many pixels with relatively high F-values where landslides did not occur. Therefore, landslide susceptibility at lava layers cannot be estimated by using F-values alone. On the other hand, landslides at volcanic tephra layers occurred where F-values were relatively low. Therefore, landslide occurrence at tephra layers cannot be estimated using F-values.

4.2. Resistivity and Average Ruggedness of Resistivity—Estimation of Looseness

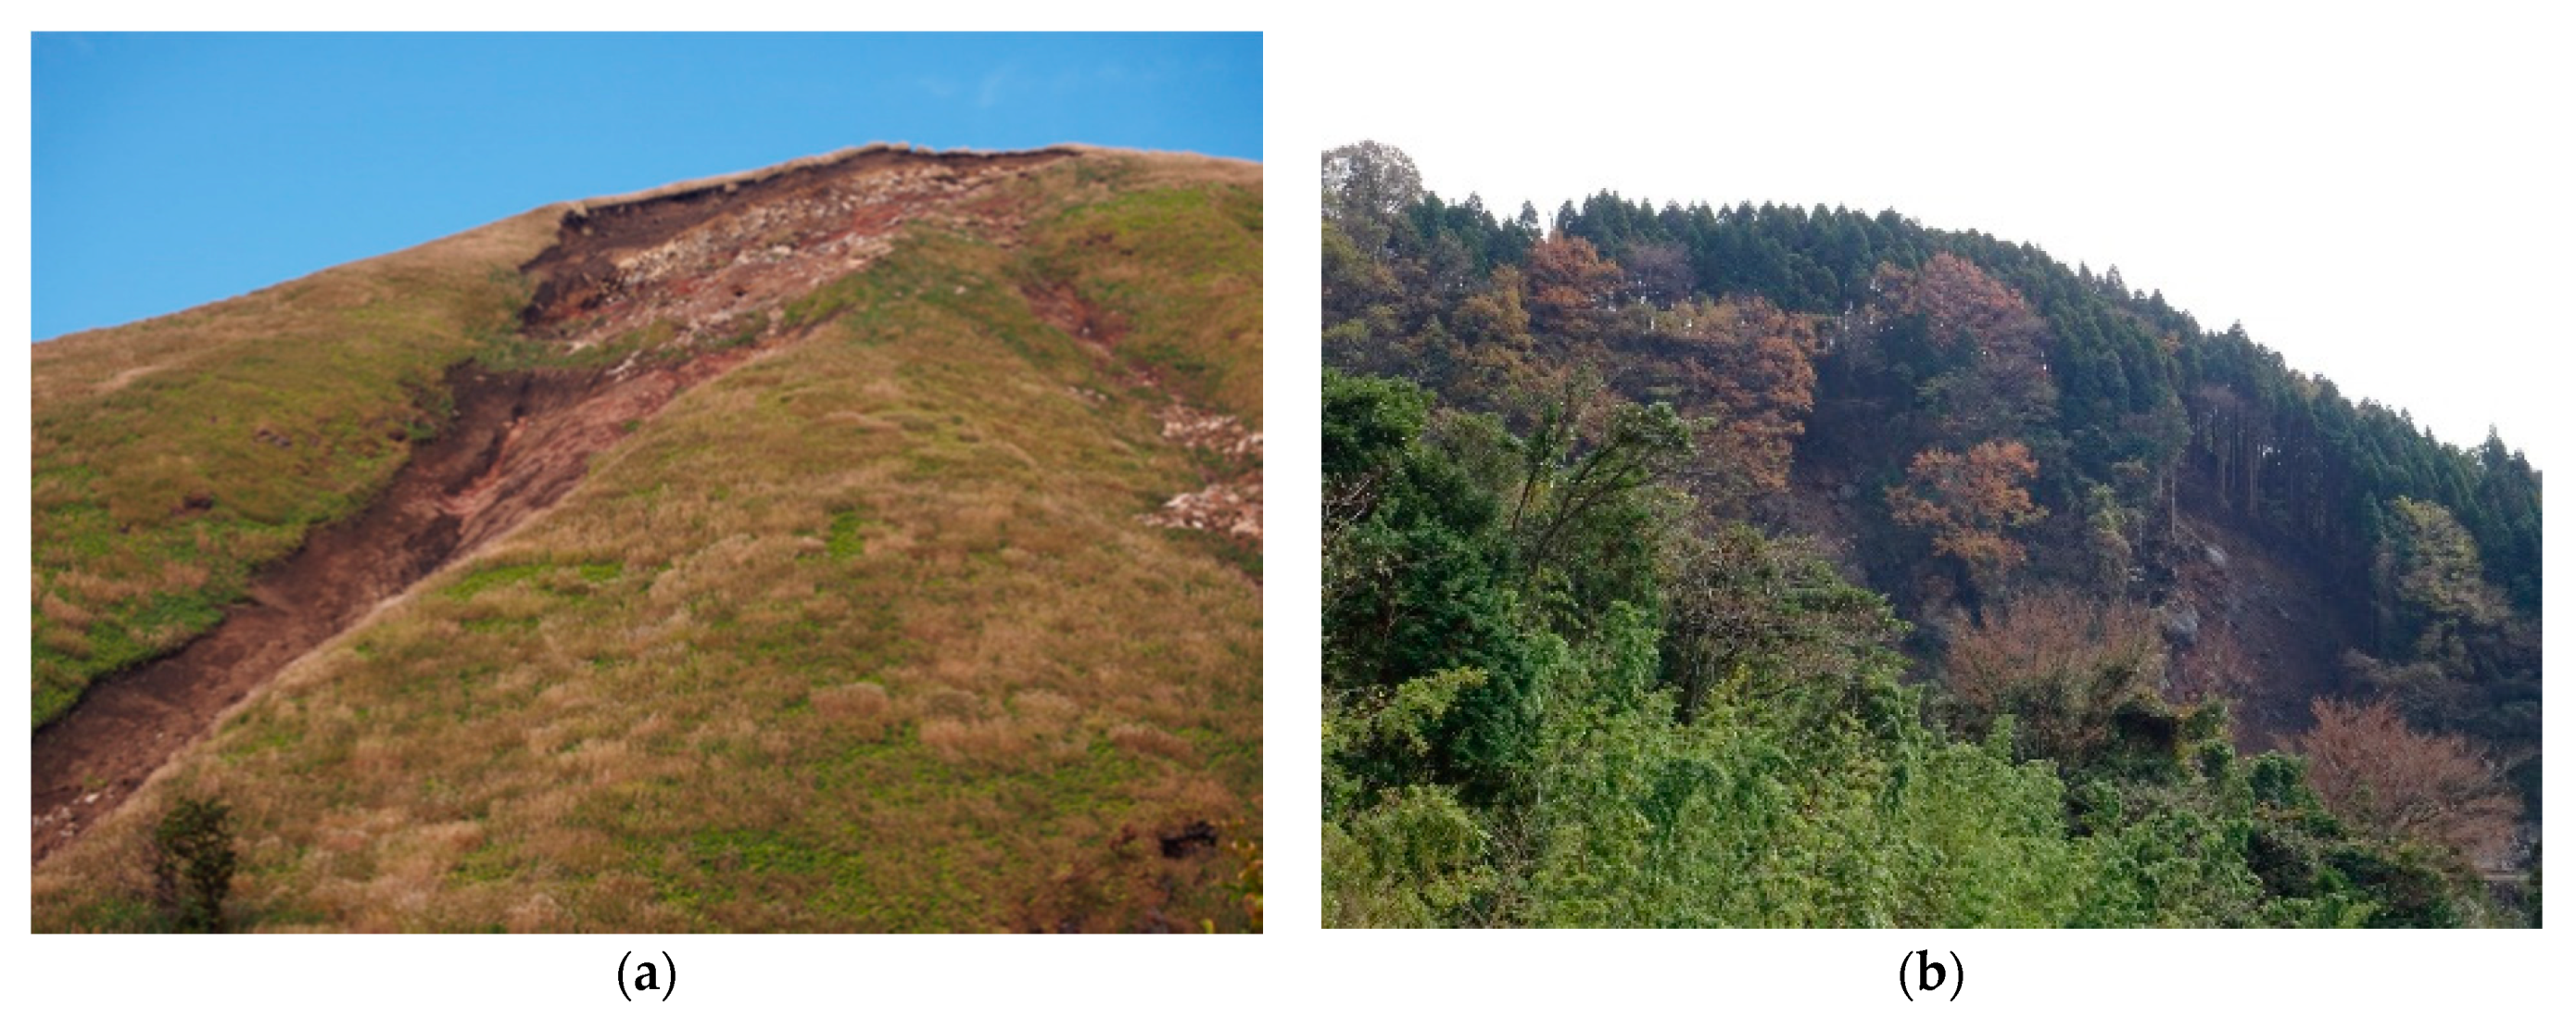
Figure 5b shows the distribution of the 140 kHz resistivity data with landslides at lava layers and at volcanic tephra layers. Landslides from lava layers occurred in areas where the resistivity is 500–700 Ωm. However, there were also many areas within this range of resistivity where landslides did not occur. Landslides at volcanic tephra layers (Figure 6a,b) occurred in areas where the resistivity is 300–800 Ωm. Therefore, the relationship between resistivity distribution and landslide occurrence is not clear. Figure 5c shows the average ruggedness of resistivity calculated with 50 m radial distance. A positive value of ruggedness at one data point (pixel) indicates that the resistivity at that pixel is higher than at neighboring pixels; the greater the value of ruggedness, the greater the resistivity difference between neighboring pixels. The landslides at lava layers and at volcanic tephra layers were overlaid. The landslides at lava layers showed higher average ruggedness of resistivity (>5). The relationship between landslide occurrence at tephra layers and average ruggedness of resistivity is not clear; some of the landslides occurred at higher values (5–10), while others occurred at lower values (<−5). It can be said that areas with higher average ruggedness of resistivity are related to the looseness of rock mass at lava layers, but not to the looseness of tephra layers.

4.3. The Distribution of ISEL and Occurrence of Landslides at Bedrock

The index of susceptibility for earthquake-induced landslides (ISEL) was calculated by multiplying the seismic vibration amplification on slopes (F-value) with the looseness of rock masses (“average ruggedness of resistivity”) (Equation (2)). The distribution of the ISEL is shown in Figure 5d. Landslides triggered by the 2016 Kumamoto earthquake were overlaid on the ISEL distribution. Landslides at lava layers occurred at ISEL > 0. On the other hand, landslides at tephra layers occurred at both ISEL < 0 and ISEL > 0. Therefore, the ISEL can be used to estimate landslide susceptibility at rock masses, but it cannot be used to estimate susceptibility at volcanic tephra layers.

5. Discussion

In the Pacific Ocean, nearly 90% of the world’s earthquakes occur along plate boundaries. In order to mitigate earthquake-induced landslide damage, it is necessary to estimate the possible damage extent and conduct disaster management in advance. Earthquakes can cause devastating secondary damage, such as fire, tsunami, and landslides. For tsunami disaster management, tsunami hazard maps and tsunami inundation maps have already been widely prepared. On the other hand, although deep-seated landslides in mountainous areas can also cause serious damage, methods for identifying susceptible areas and estimating damage extent have not yet been established.
Landslide susceptibility has been regionally estimated by geologists’ interpretation of surface morphology and topographic characteristics [18,19,20]. This approach is useful for finding earthquake-induced deep-seated landslide susceptible zones, but it is difficult to use it for estimating the degree and extent of deep-seated landslide susceptibility.
On the other hand, by using airborne electromagnetic methods, subsurface conditions can be observed and visualized [43]. Nonomura and Hasegawa [30] proposed a method for estimating the earthquake-induced landslide susceptibility by using airborne resistivity data and topographic data. In order to establish a practical method, its possibilities and limitations need to be validated in areas where earthquake-induced landslides actually occurred.
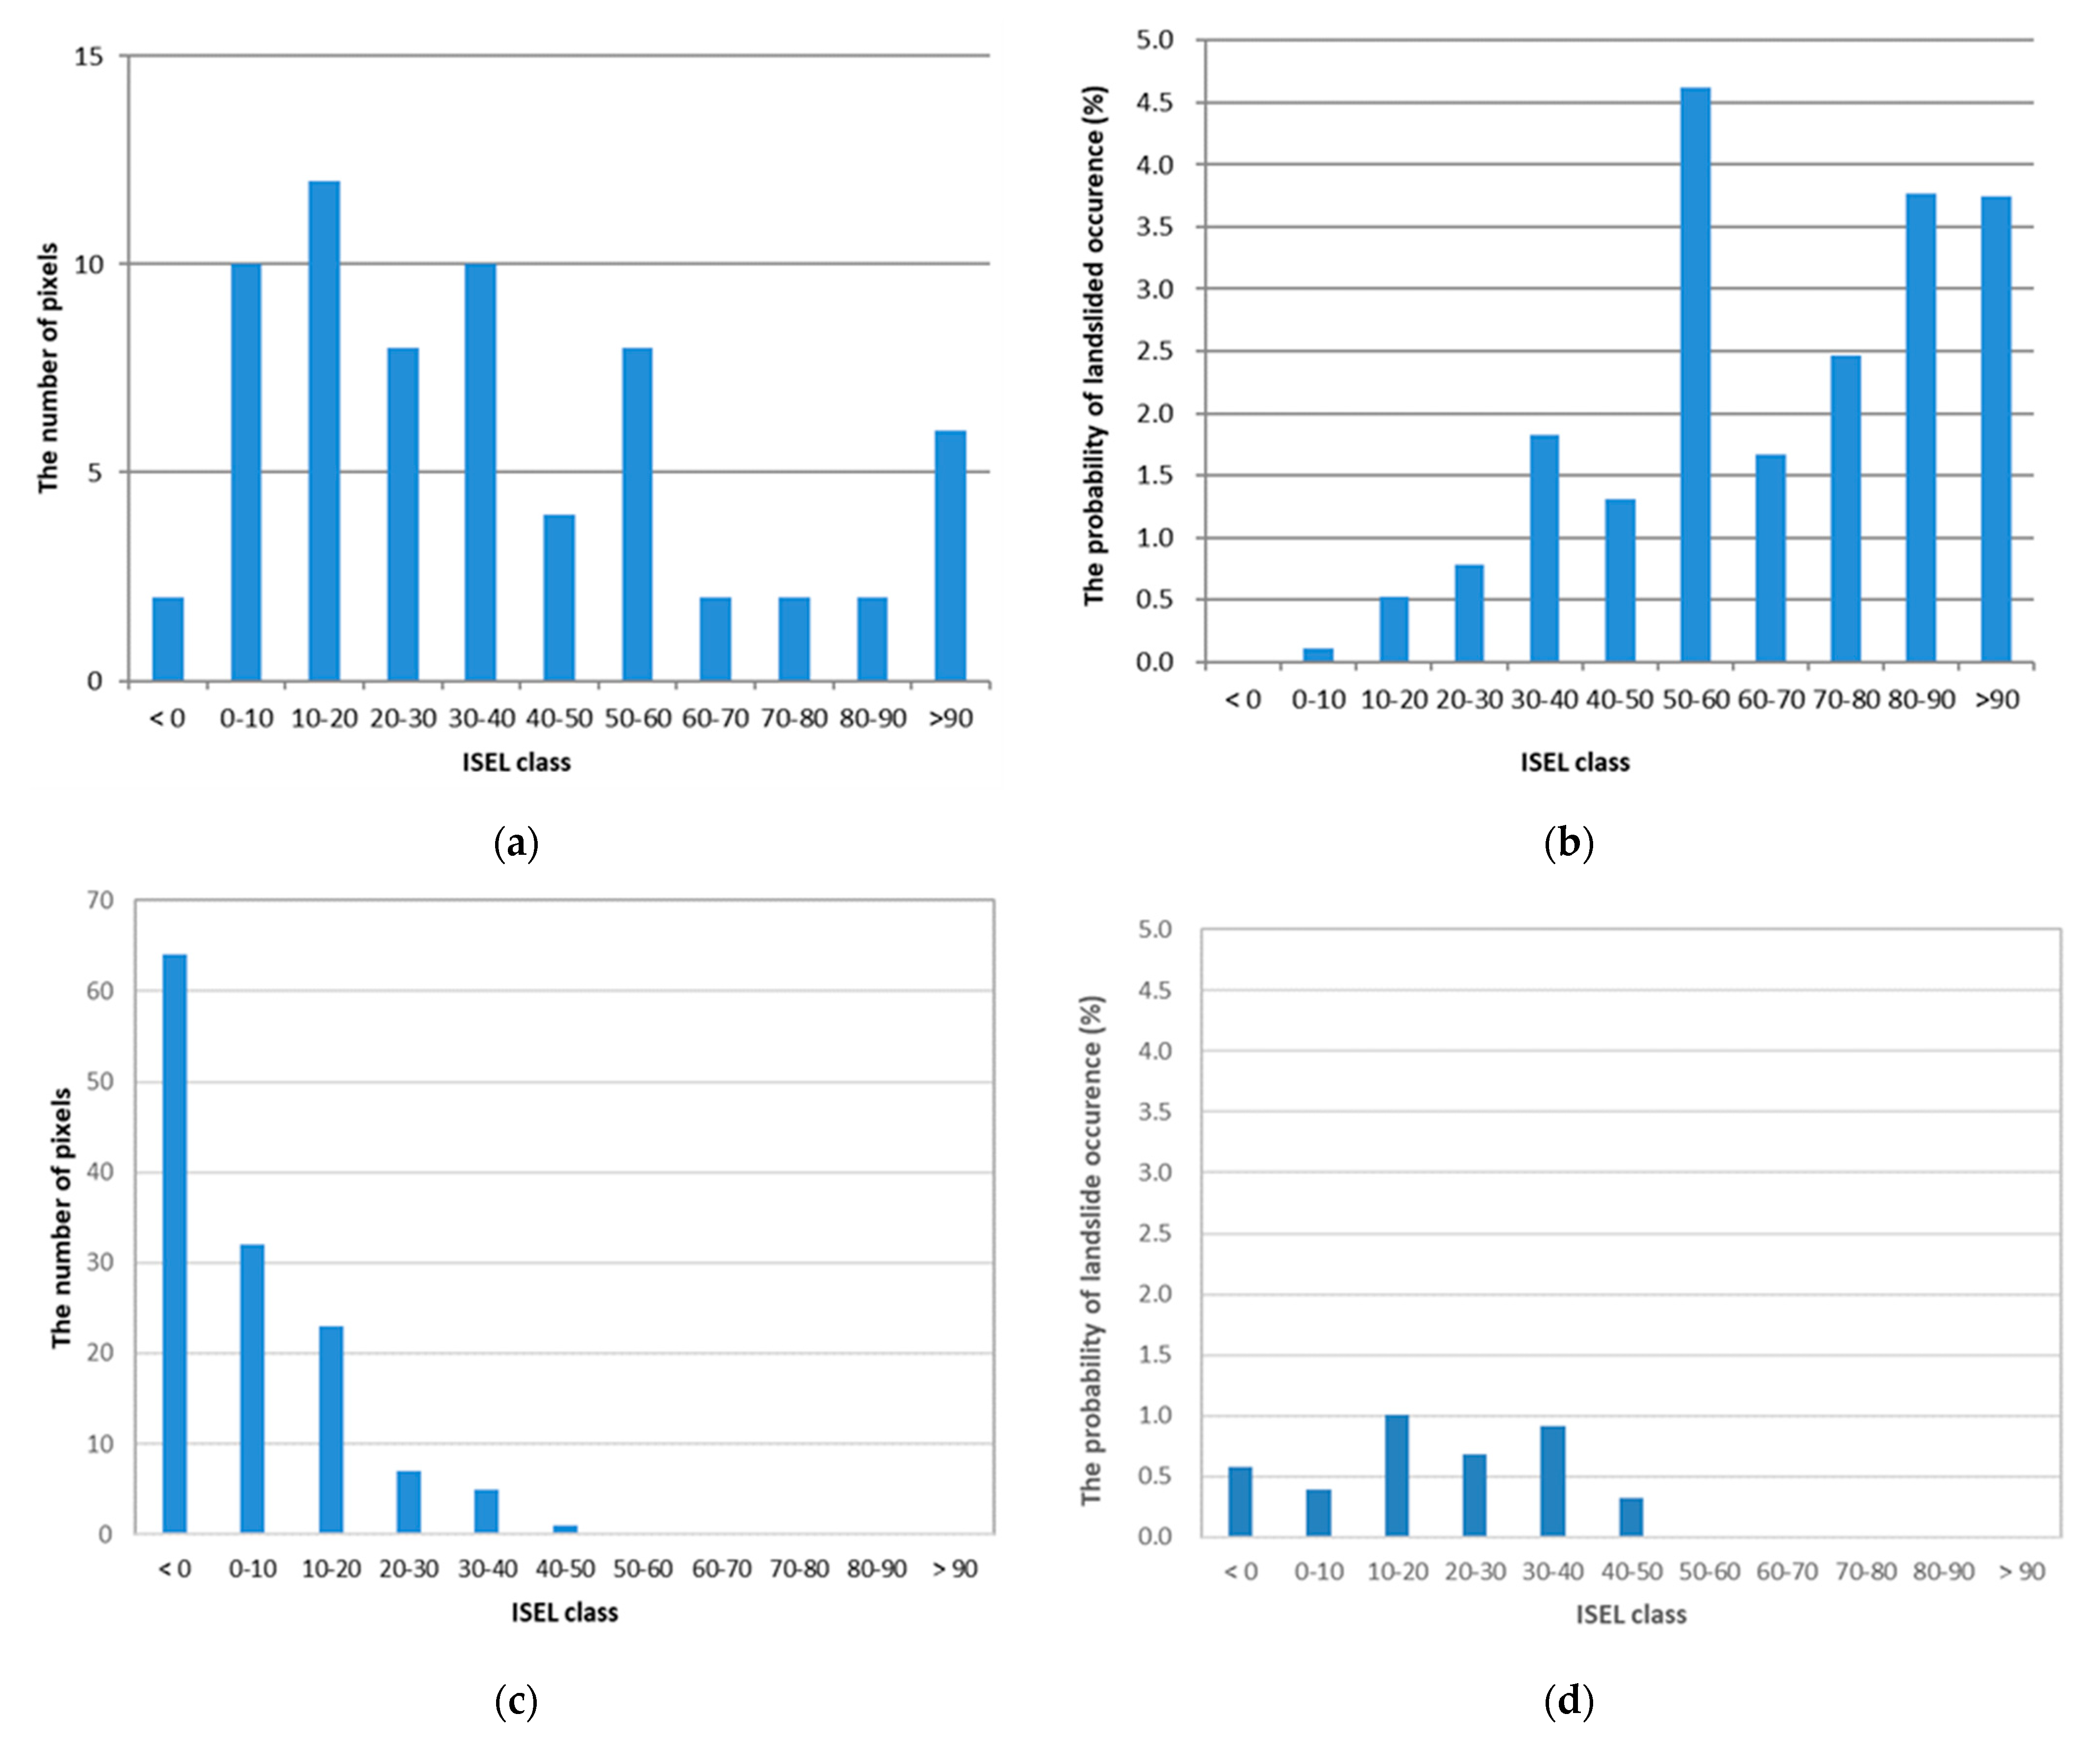
The distribution of the ISEL values was compared with the distribution of landslides caused by the 2016 Kumamoto earthquake around Mt. Aso. The number of pixels in each ISEL class range for landslides at lava layers (Figure 7a) and landslides at volcanic tephra layers (Figure 7c) were counted. Probability was calculated in each ISEL class range; the number of pixels where landslides occurred was divided by the total number of pixels within the study area per ISEL class range (Figure 7b,d). As Figure 7a indicates, a clear relationship between the ISEL values and the number of pixels could not be established, but Figure 7b indicates that the increase in the probability of landslide occurrence correlates with the increase of ISEL values; the entire range where ISEL > 30 indicates a greater than 1% probability of landslide occurrence at rock masses (Figure 7b). On the other hand, in the case of volcanic tephra layers, neither the number of landslide occurrences (Figure 7c) nor the probability of landslide occurrence (Figure 7d) is related to ISEL value.
Therefore, ISEL value is related to the probability of landslide occurrence at lava layers and not volcanic tephra layers. In Nonomura and Hasegawa [30], the ISEL was developed as an index of susceptibility for earthquake-induced landslides in the Paleogene Murotohanto Group, which consists of sandstone, mudstone, and interbedded sandstone and mudstone. Therefore, the ISEL can be regarded as a useful index to estimate landslide susceptibility at rock masses but not at volcanic tephra.
Although the increase in the probability of landslide occurrence at lava layers correlates with the increase in ISEL values, the maximum probability itself is not so high, around 5%. While the probability of landslide occurrence is low, it is necessary to take measures if the risk is high. Therefore, the ISEL is an important tool for estimating landslide susceptibility. It is also useful for comparing and prioritizing regions and routes for disaster management planning.
The 2016 Kumamoto earthquake provided a key opportunity for ISEL validation because resistivity data collected prior to the earthquake, a pre-requisite for validation, were available. In order to make practical use of the ISEL for disaster risk management, it needs to be further validated using earthquake-induced landslide data. However, since resistivity data are usually not widely available, such opportunity is limited. Therefore, it is important to share resistivity data in the research community.

6. Conclusions

This study used airborne resistivity data acquired in 2013 in the area of Mt. Aso, Kyushu, to calculate the spatial distribution of an index for susceptibility to earthquake-induced landslides (ISEL) developed by Nonomura and Hasegawa [33]. It then compared the distribution of the ISEL values to the distribution of landslides at rock masses, which were triggered during the 2016 Kumamoto earthquake. The results validated the effectiveness of the ISEL as a predictor of landslide occurrence by using pre-earthquake data collected from areas affected by the 2016 Kumamoto earthquake. Further work is needed to develop a practical method of using the ISEL for landslide disaster management planning.

Author Contributions

A.N.; methodology, investigation, validation, and writing, S.H.; supervision and validation, T.A.; investigation, S.M.; investigation; Y.K.; supervision. All authors have read and agreed to the published version of the manuscript.

Funding

This research was funded by SECOM Science and Technology Foundation.

Acknowledgments

The Kyushu Regional Development Bureau of the Japanese Ministry of Land, Infrastructure, Transport and Tourism provided the resistivity data. Raphael K. Kaliko and Megumi Takahashi corrected the English grammar.

Conflicts of Interest

The authors declare no conflict of interest.

References

  1. Chigira, M.; Wang, W.N.; Furuya, T.; Kamai, T. Geological causes and geomorphological precursors of the Tsaoling landslide triggered by the 1999 Chi-Chi earthquake, Taiwan. Eng. Geol. 2003, 68, 259–273. [Google Scholar] [CrossRef]
  2. Shou, K.-J.; Wang, C.-F. Analysis of the Chiufengershan landslide triggered by the 1999 Chi-Chi earthquake in Taiwan. Eng. Geol. 2003, 68, 237–250. [Google Scholar] [CrossRef]
  3. Wang, W.-N.; Chigira, M.; Furuya, T. Geological and geomorphological precursors of the Chiu-fen-erh-shan landslide triggered by the Chi-chi earthquake in central Taiwan. Eng. Geol. 2003, 69, 1–13. [Google Scholar] [CrossRef]
  4. Chigira, M.; Yagi, H. Geological and geomorphological characteristics of landslides triggered by the 2004 Mid Niigata prefecture earthquake in Japan. Eng. Geol. 2006, 82, 202–221. [Google Scholar] [CrossRef]
  5. Sato, H.P.; Hasegawa, H.; Fujiwara, S.; Tobita, M.; Koarai, M.; Une, H.; Iwahashi, J. Interpretation of landslide distribution triggered by the 2005 Northern Pakistan earthquake using SPOT 5 imagery. Landslides 2007, 4, 113–122. [Google Scholar] [CrossRef]
  6. Yagi, H.; Sato, G.; Higaki, D.; Yamamoto, M.; Yamasaki, T. Distribution and characteristics of landslides induced by the Iwate–Miyagi Nairiku Earthquake in 2008 in Tohoku District, Northeast Japan. Landslides 2009, 6, 335–344. [Google Scholar] [CrossRef]
  7. Chigira, M.; Wu, X.; Inokuchi, T.; Wang, G. Landslides induced by the 2008 Wenchuan earthquake, Sichuan, China. Geomorphology 2010, 118, 225–238. [Google Scholar] [CrossRef]
  8. Doi, I.; Kamai, T.; Azuma, R.; Wang, G. A landslide induced by the 2016 Kumamoto Earthquake adjacent to tectonic displacement—Generation mechanism and long-term monitoring. Eng. Geol. 2019, 248, 80–88. [Google Scholar] [CrossRef]
  9. Kawamura, S.; Kawajiri, S.; Hirose, W.; Watanabe, T. Slope failures/landslides over a wide area in the 2018 Hokkaido Eastern Iburi earthquake. Soils Found. 2019, 59, 2376–2395. [Google Scholar] [CrossRef]
  10. Wu, J.-H.; Tsai, P.-H. New dynamic procedure for back-calculating the shear strength parameters of large landslides. Eng. Geol. 2011, 123, 129–147. [Google Scholar] [CrossRef]
  11. Wu, J.H.; Chen, C.H. Back calculating the seismic shear strengths of the Tsaoling landslide associated with accelerograph and GPS data. Iran. J. Sci. Technol. Trans. B Eng. 2009, 33, 301–311. [Google Scholar]
  12. Hikima, K.; Koketsu, K. Rupture processes of the 2004 Chuetsu (mid-Niigata prefecture) earthquake, Japan: A series of events in a complex fault system. Geophys. Res. Lett. 2005, 32, 18303. [Google Scholar] [CrossRef] [Green Version]
  13. Huang, R.; Zhao, J.; Ju, N.; Li, G.; Lee, M.L.; Li, Y. Analysis of an anti-dip landslide triggered by the 2008 Wenchan earthquake in China. Nat Hazards 2013, 68, 1021–1039. [Google Scholar] [CrossRef] [Green Version]
  14. Stahl, T.; Bilderback, E.L.; Quigley, M.C.; Nobes, D.C.; Massey, C.I. Coseismic landsliding during the Mw 7.1 Darfield (Canterbury) earthquake: Implications for paleoseismic studies of landslides. Geomorphology 2014, 214, 114–127. [Google Scholar] [CrossRef]
  15. Al-Homoud, A.S.; Tahtamoni, W.W. A reliability based expert system for assessment and mitigation of landslides hazard under seismic loading. Nat. Hazards 2001, 24, 13–51. [Google Scholar] [CrossRef]
  16. Corominas, J.; Moya, J. A review of assessing landslide frequency for hazard zoning purposes. Eng. Geol. 2008, 102, 193–213. [Google Scholar] [CrossRef]
  17. Eeckhaut, M.V.D.; Poesen, J.; Govers, G.; Verstraeten, G.; Demoulin, A. Characteristics of the size distribution of recent and historical landslides in a populated hilly region. Earth Planet. Sci. Lett. 2007, 256, 588–603. [Google Scholar] [CrossRef]
  18. Tabor, R.W. Origin of ridge-top depressions by large-scale creep in the Olympic Mountains, Washington. GSA Bull. 1971, 82, 1811–1822. [Google Scholar] [CrossRef]
  19. Chigira, M. Long-term gravitational deformation of rocks by mass rock creep. Eng. Geol. 1992, 32, 157–184. [Google Scholar] [CrossRef]
  20. Chigira, M.; Kiho, K. Deep-seated rockslide-avalanches preceded by mass rock creep of sedimentary rocks in the Akaishi Mountains, central Japan. Eng. Geol. 1994, 38, 221–230. [Google Scholar] [CrossRef]
  21. Nonomura, A.; Hasegawa, S. Regional extraction of flexural-toppled slopes in epicentral regions of subduction earthquakes along the Nankai Trough using DEMs. Environ. Earth Sci. 2013, 68, 139–149. [Google Scholar] [CrossRef]
  22. Kasprzak, M.; Jancewicz, K.; Różycka, M.; Kotwicka, W.; Migoń, P. Geomorphology- and geophysics-based recognition of stages of deep-seated slope deformation (Stdetes, SW Poland). Eng. Geol. 2019, 260, 105230. [Google Scholar]
  23. Strozzi, T.; Farina, P.; Corsini, A.; Ambrosi, C.; Thüring, M.; Zilger, J.; Wiesmann, A.; Wegmüller, U.; Werner, C. Survey and monitoring of landslide displacements by means of L-band satellite SAR interferometry. Landslides 2005, 2, 193–201. [Google Scholar] [CrossRef]
  24. Scaioni, M.; Longoni, L.; Melillo, V.; Papini, M. Remote sensing for landslide investigations: An overview of recent achievements and perspectives. Remote Sens. 2014, 6, 9600–9652. [Google Scholar] [CrossRef] [Green Version]
  25. Jianjun, G.; Zhang, Y.; Xiao, L. An application of the high-density electrical resistivity method for detecting slide zones in deep-seated landslides in limestone areas. J. Appl. Geophys. 2020, 177, 104013. [Google Scholar] [CrossRef]
  26. Supper, R.; Baroň, I.; Ottowitz, D.; Motschka, K.; Gruber, S.; Winkler, E.; Jochum, B.; Römer, A. Airborne geophysical mapping as an innovative methodology for landslide investigation: Evaluation of results from the Gschliefgraben landslide, Austria. Nat. Hazards Earth Syst. Sci. 2013, 13, 3313–3328. [Google Scholar] [CrossRef] [Green Version]
  27. Baroň, I.; Supper, R.; Winkler, E.; Motschka, K.; Ahl, A.; Čarman, A.; Kumelj, Š. Airborne geophysical survey of the catastrophic landslide at Stože, Log pod Mangrtom, as a test of an innovative approach for landslide mapping in steep alpine terrains. Nat. Hazards Earth Syst. Sci. 2013, 13, 2543–2550. [Google Scholar] [CrossRef] [Green Version]
  28. Schamper, C.; Jørgensen, F.; Auken, E.; Effersø, F. Assessment of near-surface mapping capabilities by airborne transient electromagnetic data—An extensive comparison to conventional borehole data. Geophysics 2014, 79, B187–B199. [Google Scholar] [CrossRef] [Green Version]
  29. Christensen, C.W.; Pfaffhuber, A.A.; Anschütz, H.; Smaavik, T.F. Combining airborne electromagnetic and geotechnical data for automated depth to bedrock tracking. J. Appl. Geophys. 2015, 119, 178–191. [Google Scholar] [CrossRef] [Green Version]
  30. Baranwal, V.C.; Brönner, M.; Rønning, J.-S.; Elvebakk, H.; Dalsegg, E. 3D interpretation of helicopter-borne frequency-domain electromagnetic (HEM) data from Ramså Basin and adjacent areas at Andøya, Norway. Earth Planets Space 2020, 72, 52. [Google Scholar] [CrossRef]
  31. Okazaki, K.; Mogi, T.; Utsugi, M.; Ito, Y.; Kunishima, H.; Yamazaki, T.; Takahashi, Y.; Hashimoto, T.; Ymamaya, Y.; Ito, H.; et al. Airborne electromagnetic and magnetic surveys for long tunnel construction design. Phys. Chem. Earth A/B/C 2011, 36, 1237–1246. [Google Scholar] [CrossRef]
  32. Nonomura, A.; Hasegawa, S.; Kageura, R.; Kawato, K.; Chiba, T.; Onoda, S.; Dahal, R.K. A method for regionally mapping gravitationally deformed and loosened slopes using helicopter-borne electromagnetic resistivity data. Nat. Hazards 2016, 81, 123–144. [Google Scholar] [CrossRef]
  33. Nonomura, A.; Hasegawa, S. Susceptibility of slopes to earthquake-induced landslides: A new index derived from helicopter-borne electromagnetic resistivity and digital elevation data sets. Landslides 2017, 14, 2155–2163. [Google Scholar] [CrossRef]
  34. Chigira, M. Geological prediction of rock avalanches. In Proceedings of the 8th Congress of the International Association for Engineering Geology and the Environment, Vancouver, BC, Canada, 21–25 September 1998; pp. 1409–1414. [Google Scholar]
  35. Chigira, M. Kanagi-kuzure. In Earthquake Sabo; Nakamura, H., Tsuchiya, S., Inoue, K., Ishikawa, Y., Eds.; Kokon Shoin: Tokyo, Japan, 2000; pp. 38–41. (In Japanese) [Google Scholar]
  36. Japan Meteorological Agency. Available online: http://www.data.jma.go.jp/svd/eew/data/suikei/201604160125_741/201604160125_741_506.html (accessed on 7 January 2021). (In Japanese)
  37. Mukoyama, S.; Sato, T.; Takami, T.; Nishimura, T. Estimation of Ground Displacements around Aso-Caldera Caused by the 2016 Kumamoto, Earthquake, from the Geomorphic Image Analysis of Temporal LiDAR DEMs, JSEG 2016 Kumamoto-Oita Earthquake Disaster Investigation Team. Available online: https://www.jseg.or.jp/00-main/pdf/20160822_kumamoto_rep.pdf (accessed on 7 January 2021). (In Japanese).
  38. Beard, L.P. Comparison of methods for estimating earth resistivity from airborne electromagnetic measurements. J. Appl. Geophys. 2000, 45, 239–259. [Google Scholar] [CrossRef]
  39. Huang, H.; Fraser, D.C. The differential parameter method for multifrequency airborne resistivity mapping. Geophysics 1996, 61, 100–109. [Google Scholar] [CrossRef] [Green Version]
  40. Nakazato, H.; Konishi, N. Subsurface structure exploration of wide landslide area by Aerial electromagnetic exploration. Landslides 2005, 2, 165–169. [Google Scholar] [CrossRef]
  41. Pellerin, L.; Labson, V.F. An empirical approach to inversion of an unconventional helicopter electromagnetic dataset. J. Appl. Geophys. 2003, 53, 49–61. [Google Scholar] [CrossRef]
  42. Siemon, B.; Auken, E.; Christiansen, A.V. Laterally constrained inversion of helicopter-borne frequency-domain electromagnetic data. J. Appl. Geophys. 2009, 67, 259–268. [Google Scholar] [CrossRef]
  43. Steuer, A.; Siemon, B.; Auken, E. A comparison of helicopter-borne electromagnetics in frequency- and time-domain at the Cuxhaven valley in Northern Germany. J. Appl. Geophys. 2009, 67, 194–205. [Google Scholar] [CrossRef]
  44. Sengpiel, K.P.; Siemon, B. Advanced inversion methods for airborne electromagnetic exploration. Geophysics 2000, 65, 1983–1992. [Google Scholar] [CrossRef]
  45. Lin, C.-W.; Shieh, C.-L.; Yuan, B.-D.; Shieh, Y.-C.; Liu, S.-H.; Lee, S.-Y. Impact of Chi-Chi earthquake on the occurrence of landslides and debris flows: Example from the Chenyulan River watershed, Nantou, Taiwan. Eng. Geol. 2004, 71, 49–61. [Google Scholar] [CrossRef]
  46. Miles, S.B.; Keefer, D.K. Evaluation of seismic slope-performance models using a regional case study. Environ. Eng. Geosci. 2000, 6, 25–39. [Google Scholar] [CrossRef]
  47. Uchida, T.; Kataoka, S.; Iwao, T.; Matsuo, O.; Terada, H.; Nakano, Y.; Sugiura, N.; Osanai, N. A Study on Methodology for Assessing the Potential of Slope Failures During Earthquakes; Technical Note No. 204; National Institute for Land and Infrastructure Management: Tsukaba, Japan, 2004. (In Japanese) [Google Scholar]
  48. Hasegawa, S.; Dahal, R.K.; Nishimura, T.; Nonomura, A.; Yamanaka, M. DEM-Based analysis of earthquake-induced shallow landslide susceptibility. Geotech. Geol. Eng. 2008, 27, 419–430. [Google Scholar] [CrossRef]
  49. Uchida, T.; Osanai, N.; Onoda, S.; Takayama, T.; Tomura, K. A simple method for producing probabilistic seismic shallow landslide hazard maps. In Proceedings of the INTERPRAEVENT International Symposium Disaster mitigation of debris flows, slope failures and landslides, Niigata, Japan, 25–27 September 2006; pp. 529–534. [Google Scholar]
  50. Palacky, G.J. Resistivity characteristics of geologic targets. In Electromagnetic Methods in Applied Geophysics; Nabighian, N.M., Ed.; Investigations in Geophysics 3; Society of Exploration Geophysicists: Tulsa, OK, USA, 2008; pp. 53–129. [Google Scholar]
  51. Leucci, G.; Giorgi, L.D. Integrated geophysical surveys to assess the structural conditions of a karstic cave of archaeological importance. Nat. Hazards Earth Syst. Sci. 2005, 5, 17–22. [Google Scholar] [CrossRef] [Green Version]
  52. Yokoyama, R.; Shirasawa, M.; Pike, R.J. Visualizing topography by openness: A new application of image processing to digital elevation models. Photogramm. Eng. Remote Sens. 2002, 68, 257–265. [Google Scholar]
Figure 1. Study area (a) Elevation and the location of the study area (b) The lithology of the study area.
Geosciences 11 00095 g001
Figure 2. The intensity distribution of the Kumamoto earthquake (1:25 on 16th April 2016) in Japan’s Metrological Agency (JMA) seismic intensity scale. [36].
Geosciences 11 00095 g002
Figure 3. The distribution of landslides triggered by the 2016 Kumamoto earthquake. The landslides are categorized into two types: In pink—landslides at tephra layers; in blue—landslides at lava layers.
Geosciences 11 00095 g003
Figure 4. Flow diagram of this study.
Geosciences 11 00095 g004
Figure 5. Parameters for calculating ISEL and ISEL distribution with landslides (a) Topographic index F calculated by using Equation (1) (b) Resistivity distribution (c) Average ruggedness of resistivity (d) ISEL. In blue—landslides at lava layer; in pink—landslide at volcanic tephra layers
Geosciences 11 00095 g005
Figure 6. Photos of landslides at rock mass (a) Landslides occurred on andesitic rock slope (b) Landslides occurred on andesitic rock slopes. The outcrop was partially covered with trees.
Geosciences 11 00095 g006
Figure 7. The histogram of the ISEL distribution (a) The number of pixels for landslide at lava layers (b) The probability of landslide occurrence at lava layers (c) The number of pixels for landslide at tephra layers (d) The probability of landslide occurrence from the tephra layers.
Geosciences 11 00095 g007
Publisher’s Note: MDPI stays neutral with regard to jurisdictional claims in published maps and institutional affiliations.