
Probabilistic Tsunami Hazard Analysis of Inundated Buildings Following a Subaqueous Volcanic Explosion Based on the 1716 Tsunami Scenario in Taal Lake, Philippines


Abstract
1. Introduction
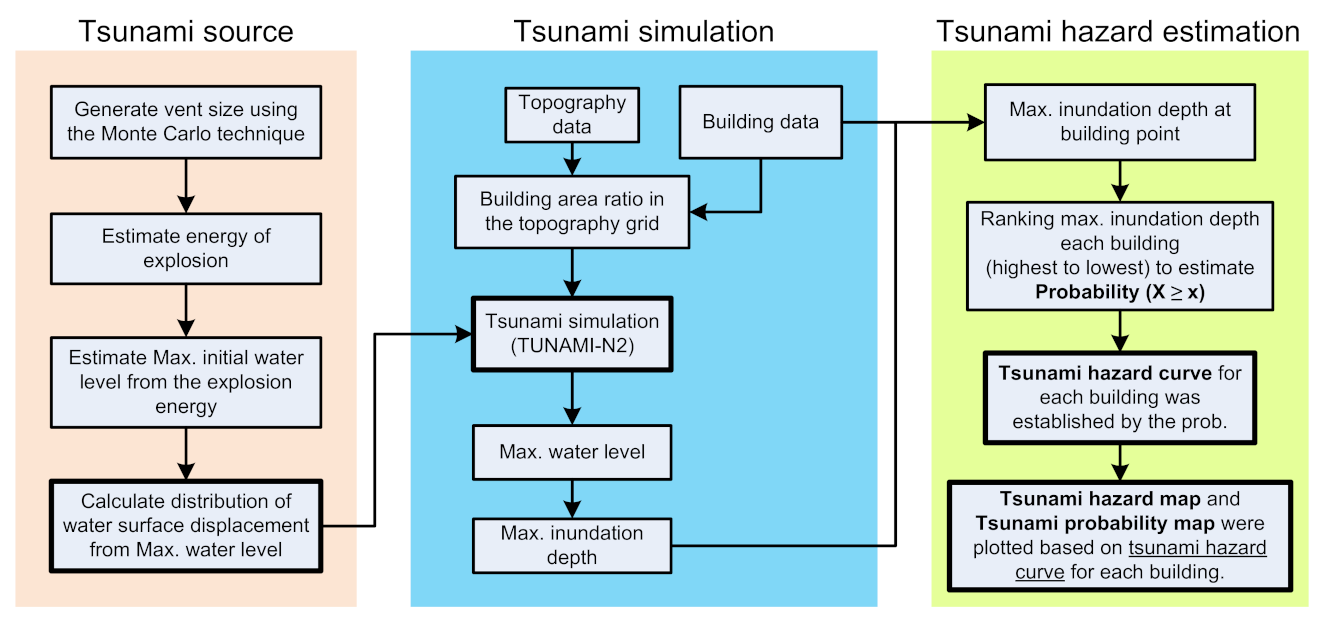
2. Methodology
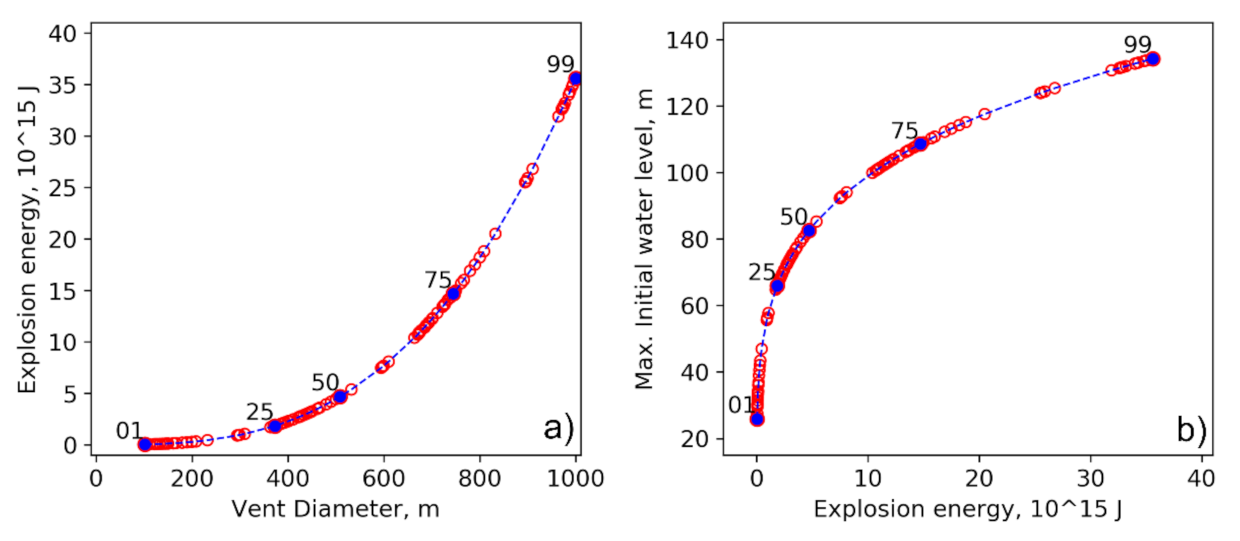
2.1. Model of Subaqueous Explosion and Tsunami Generation
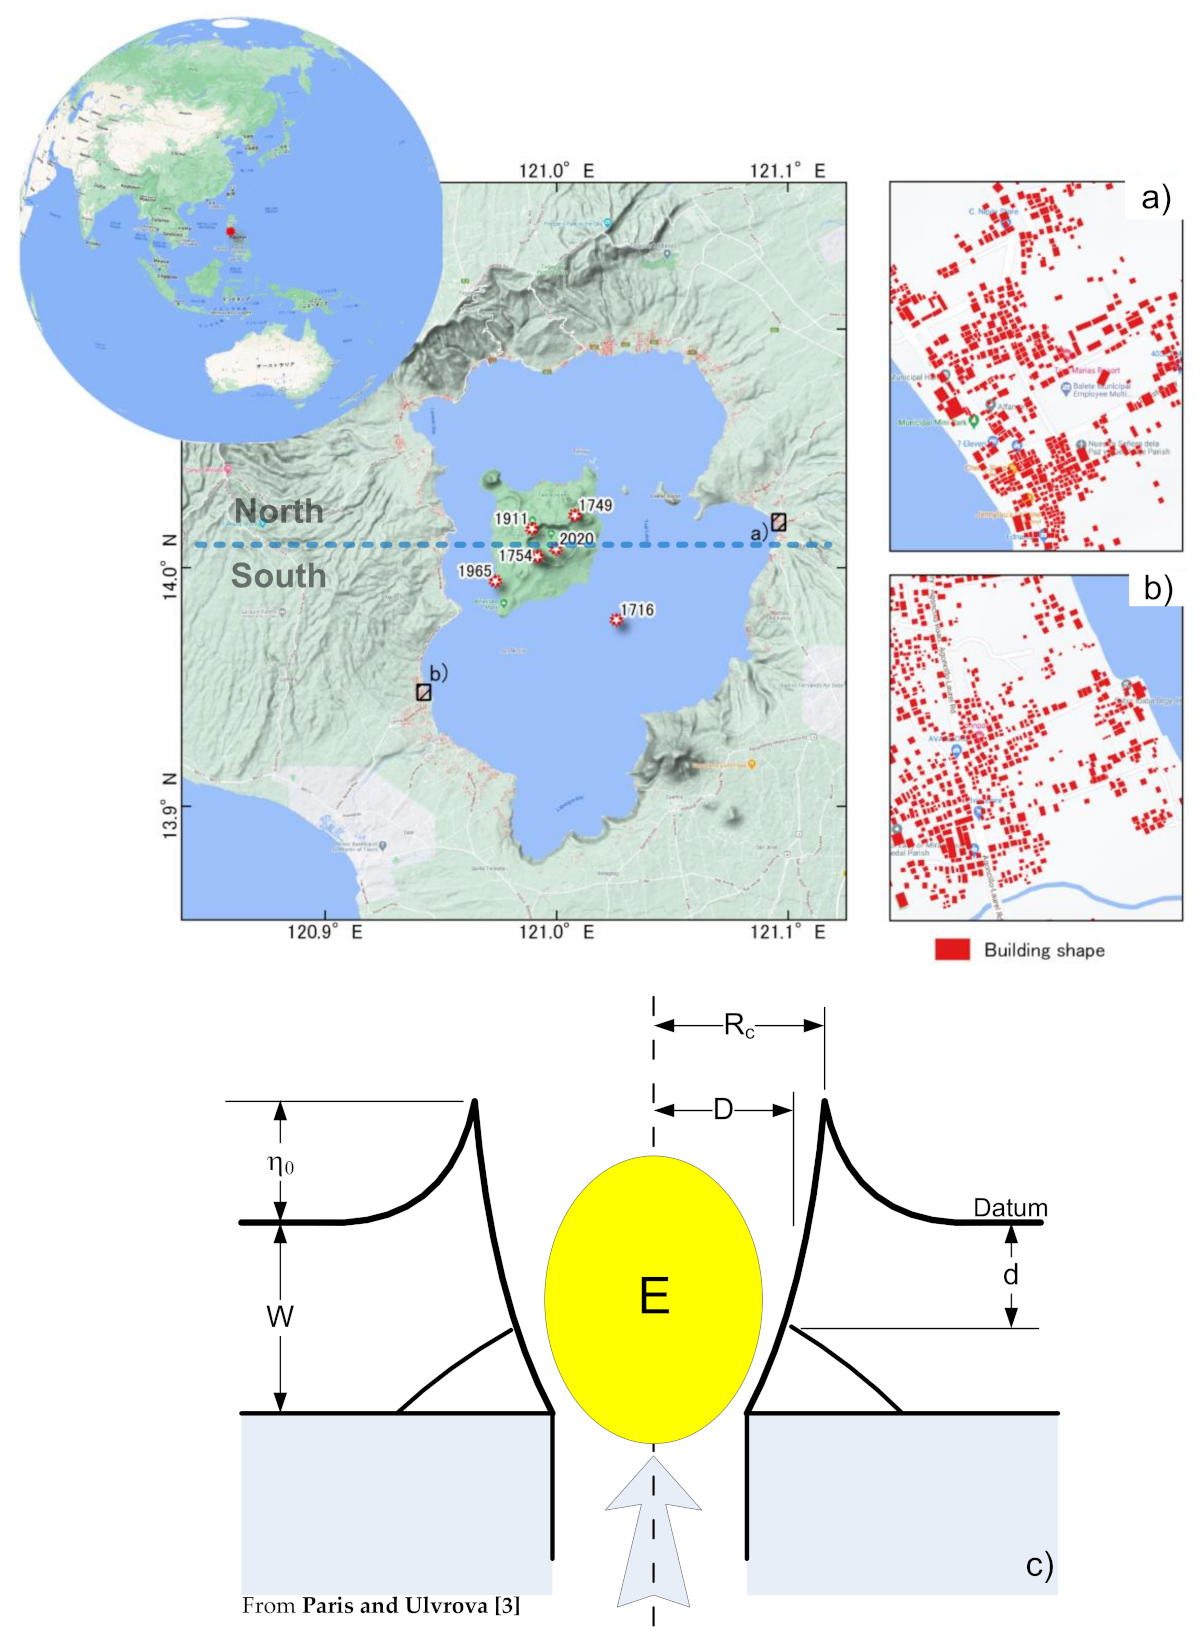
2.2. Numerical Simulation of a Tsunami
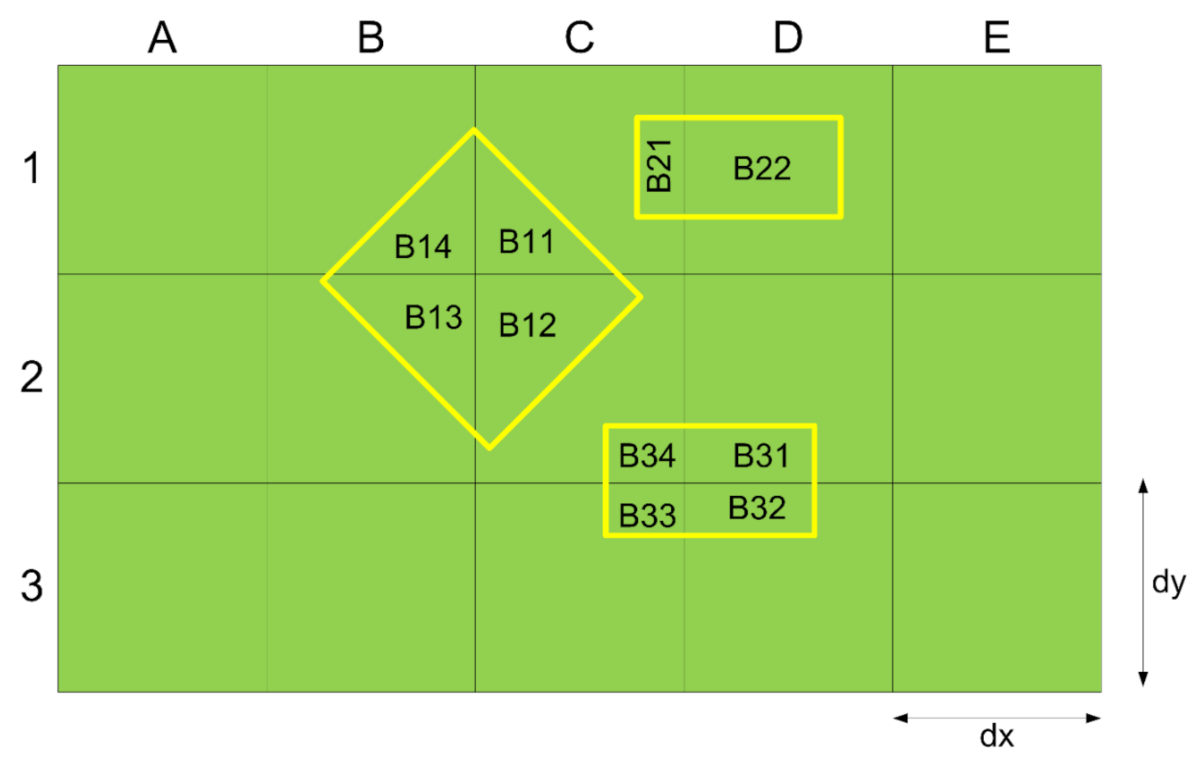
2.3. Probabilistic Hazard Analysis
3. Results
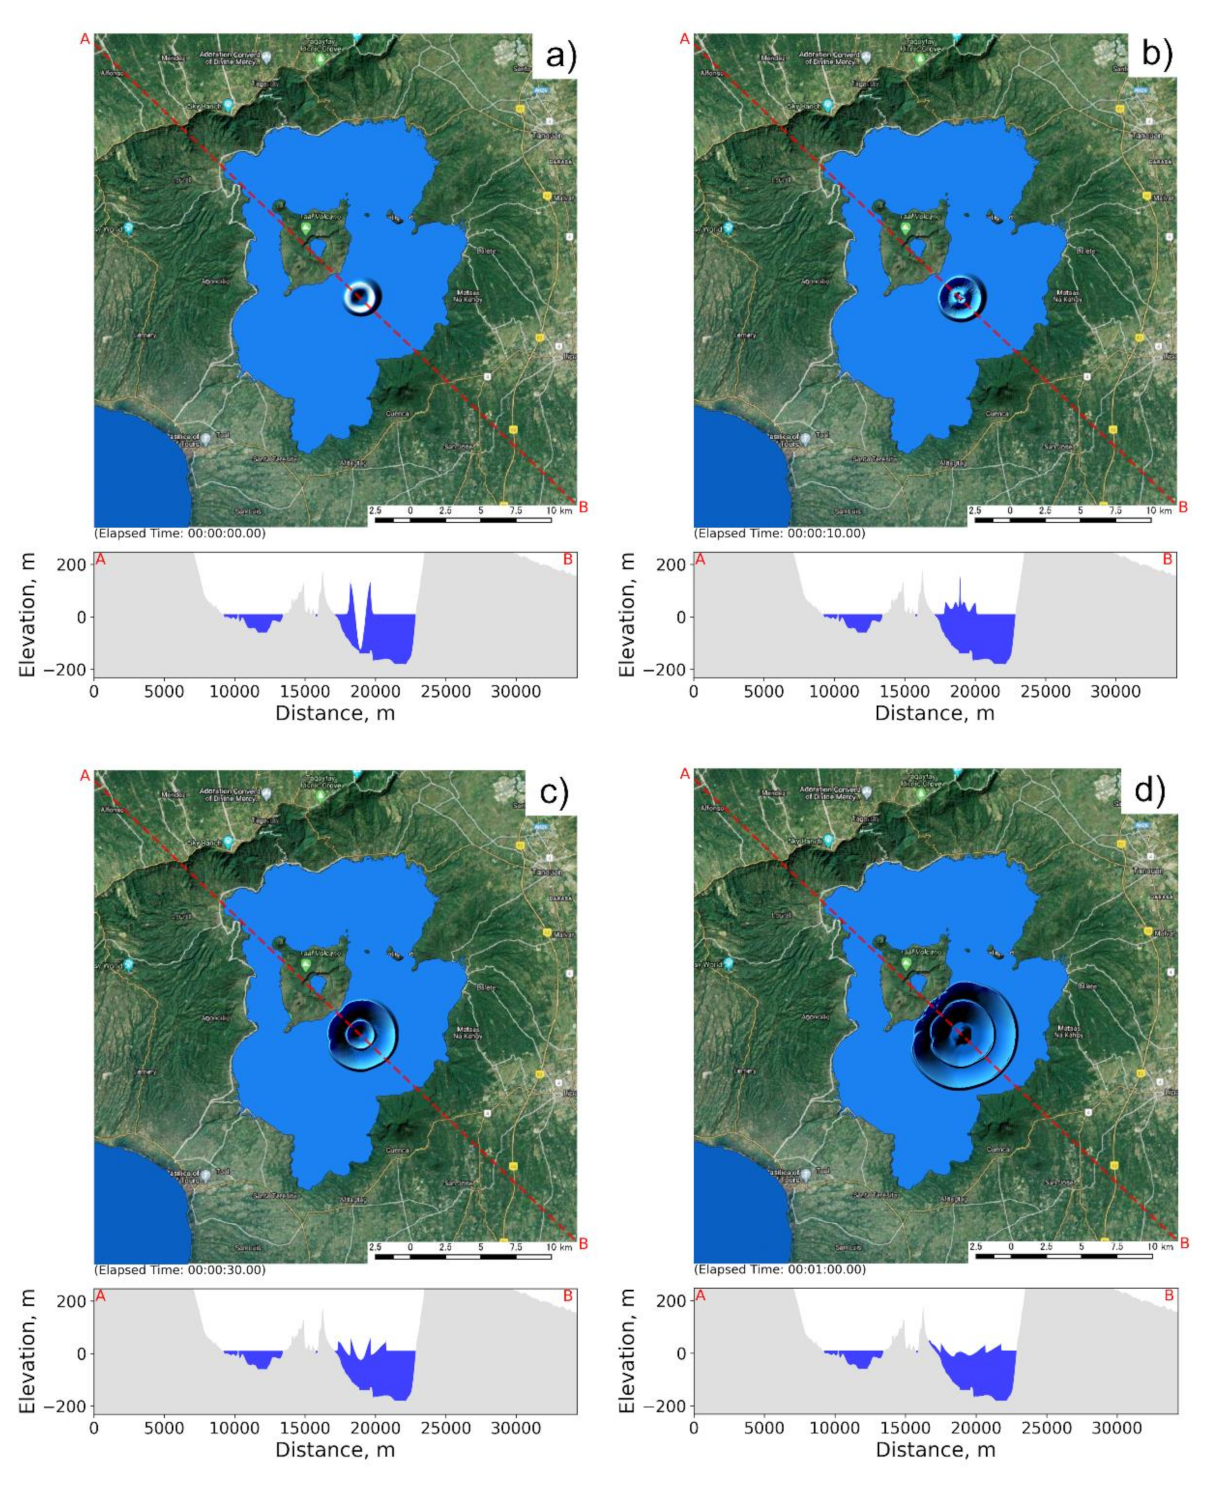
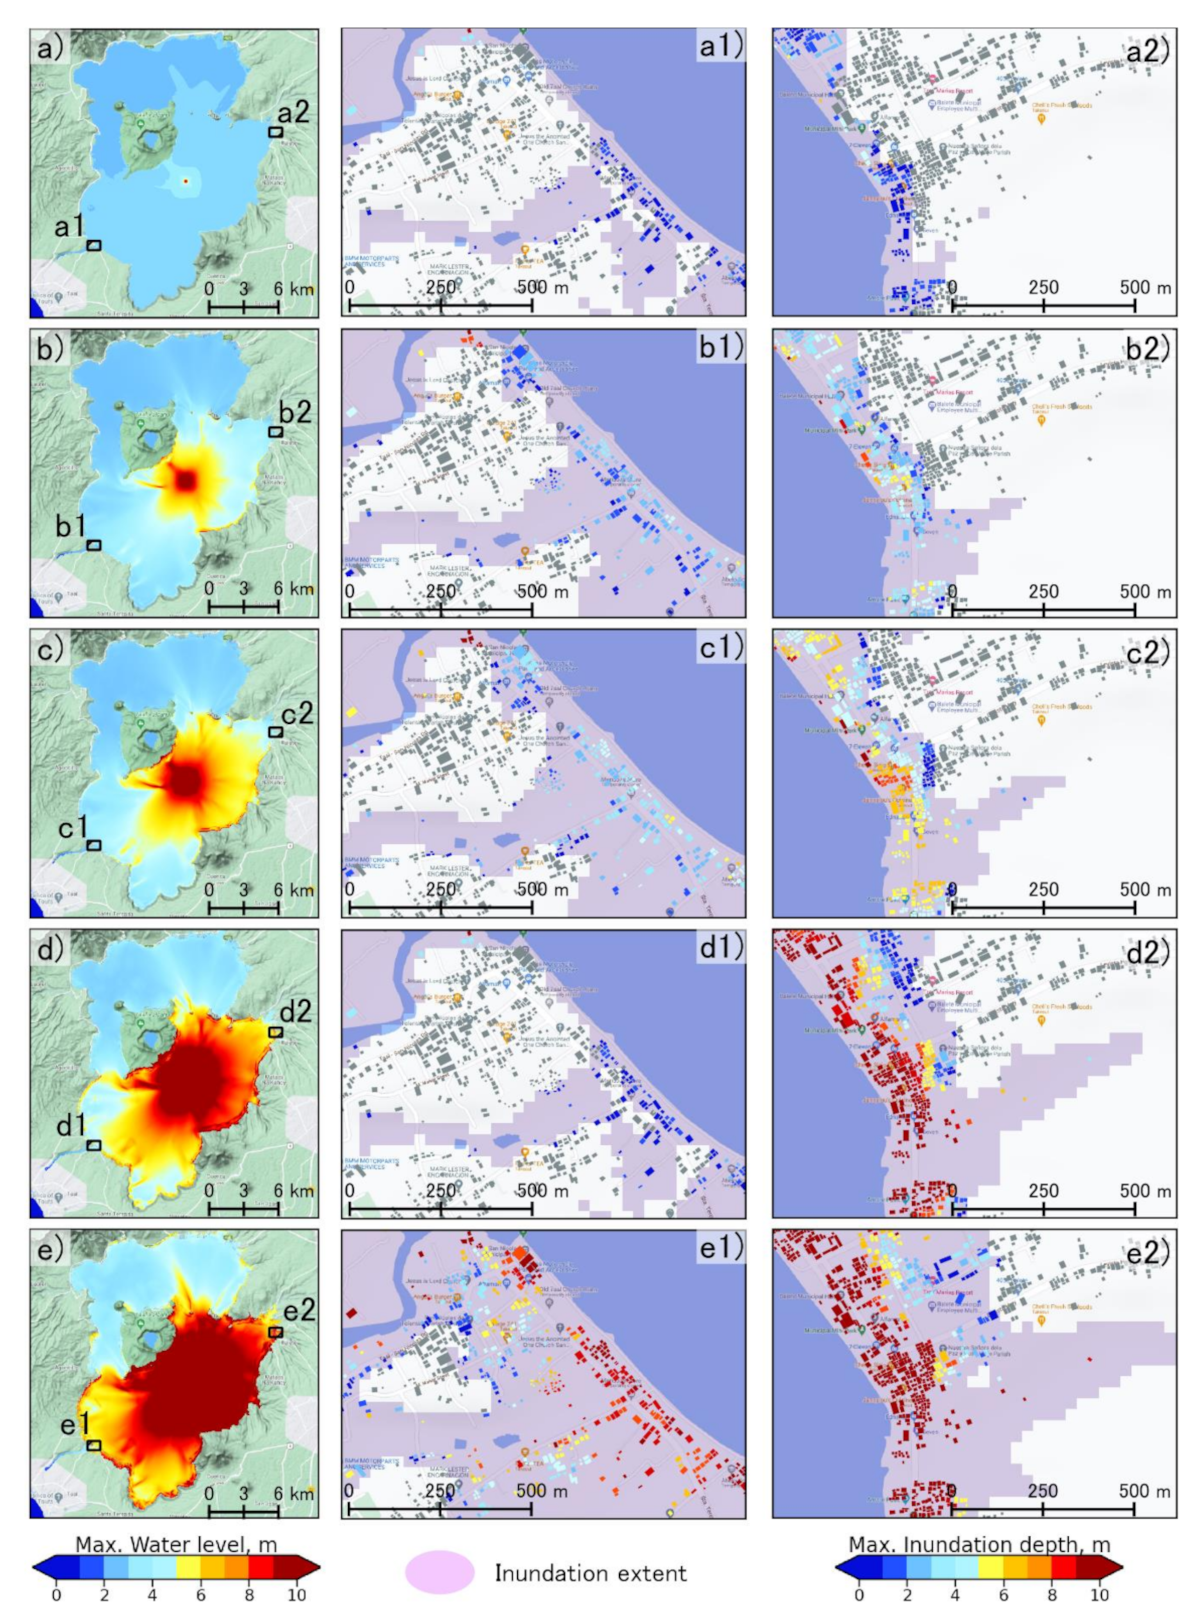
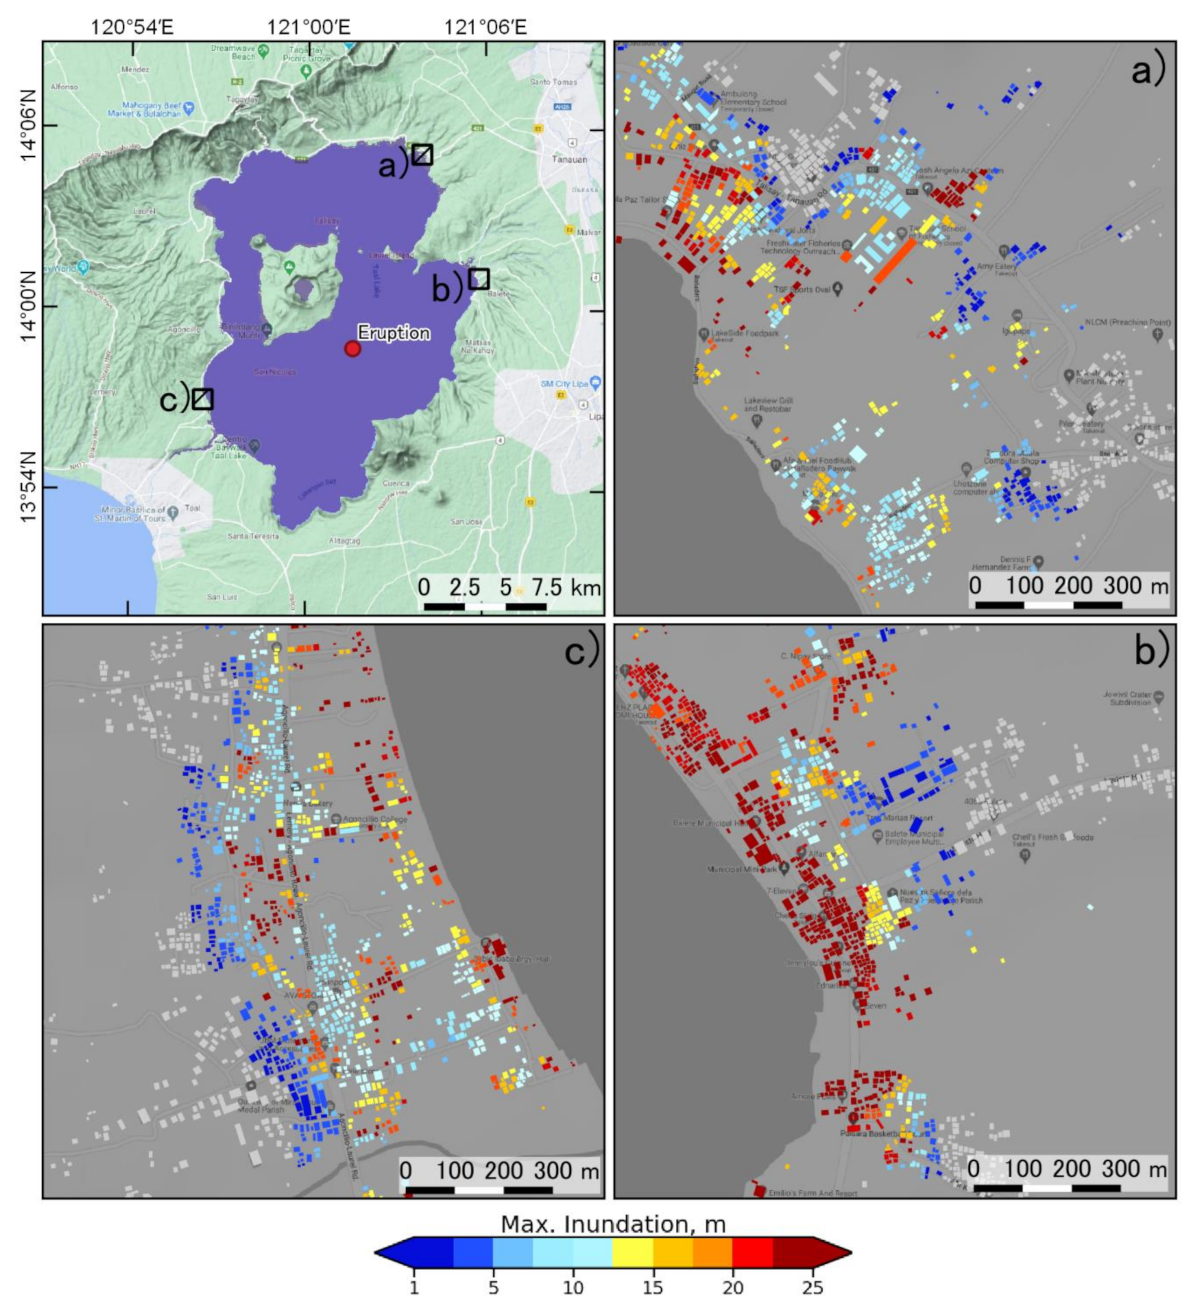
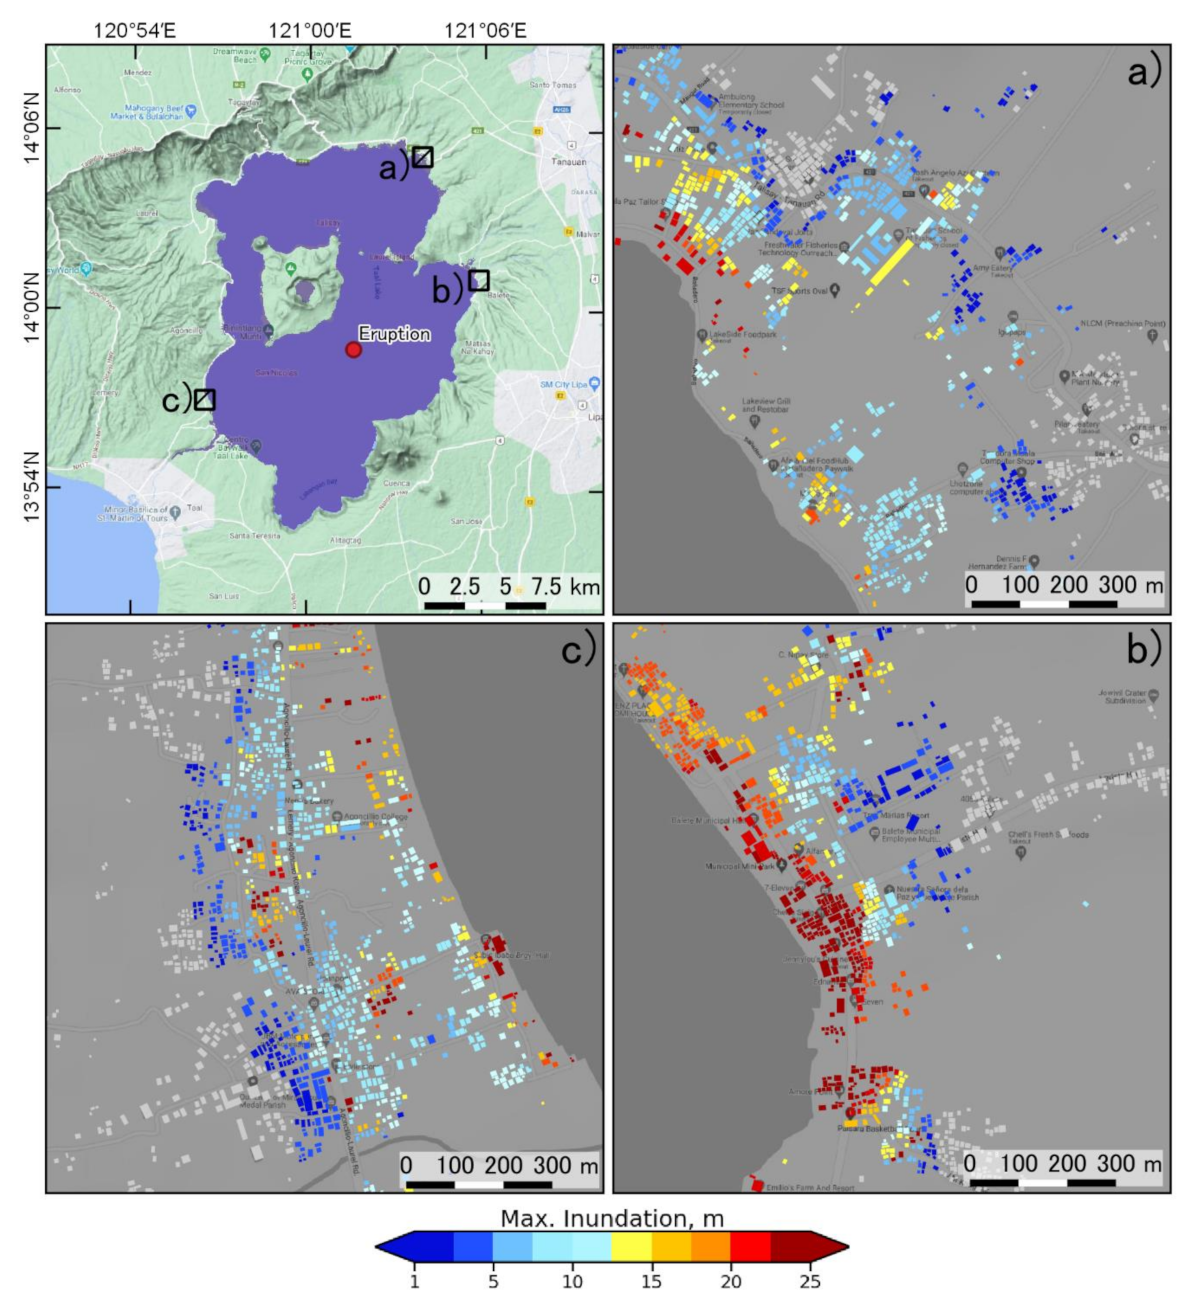
3.1. Tsunami Wave Generation and Inundation Extent
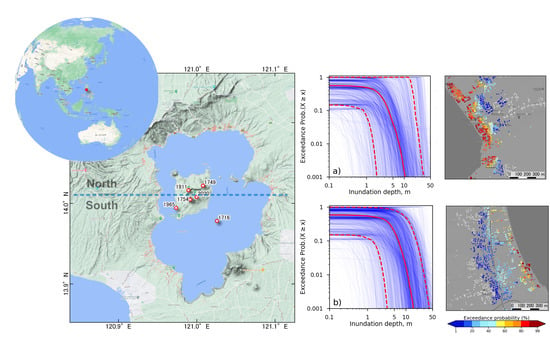
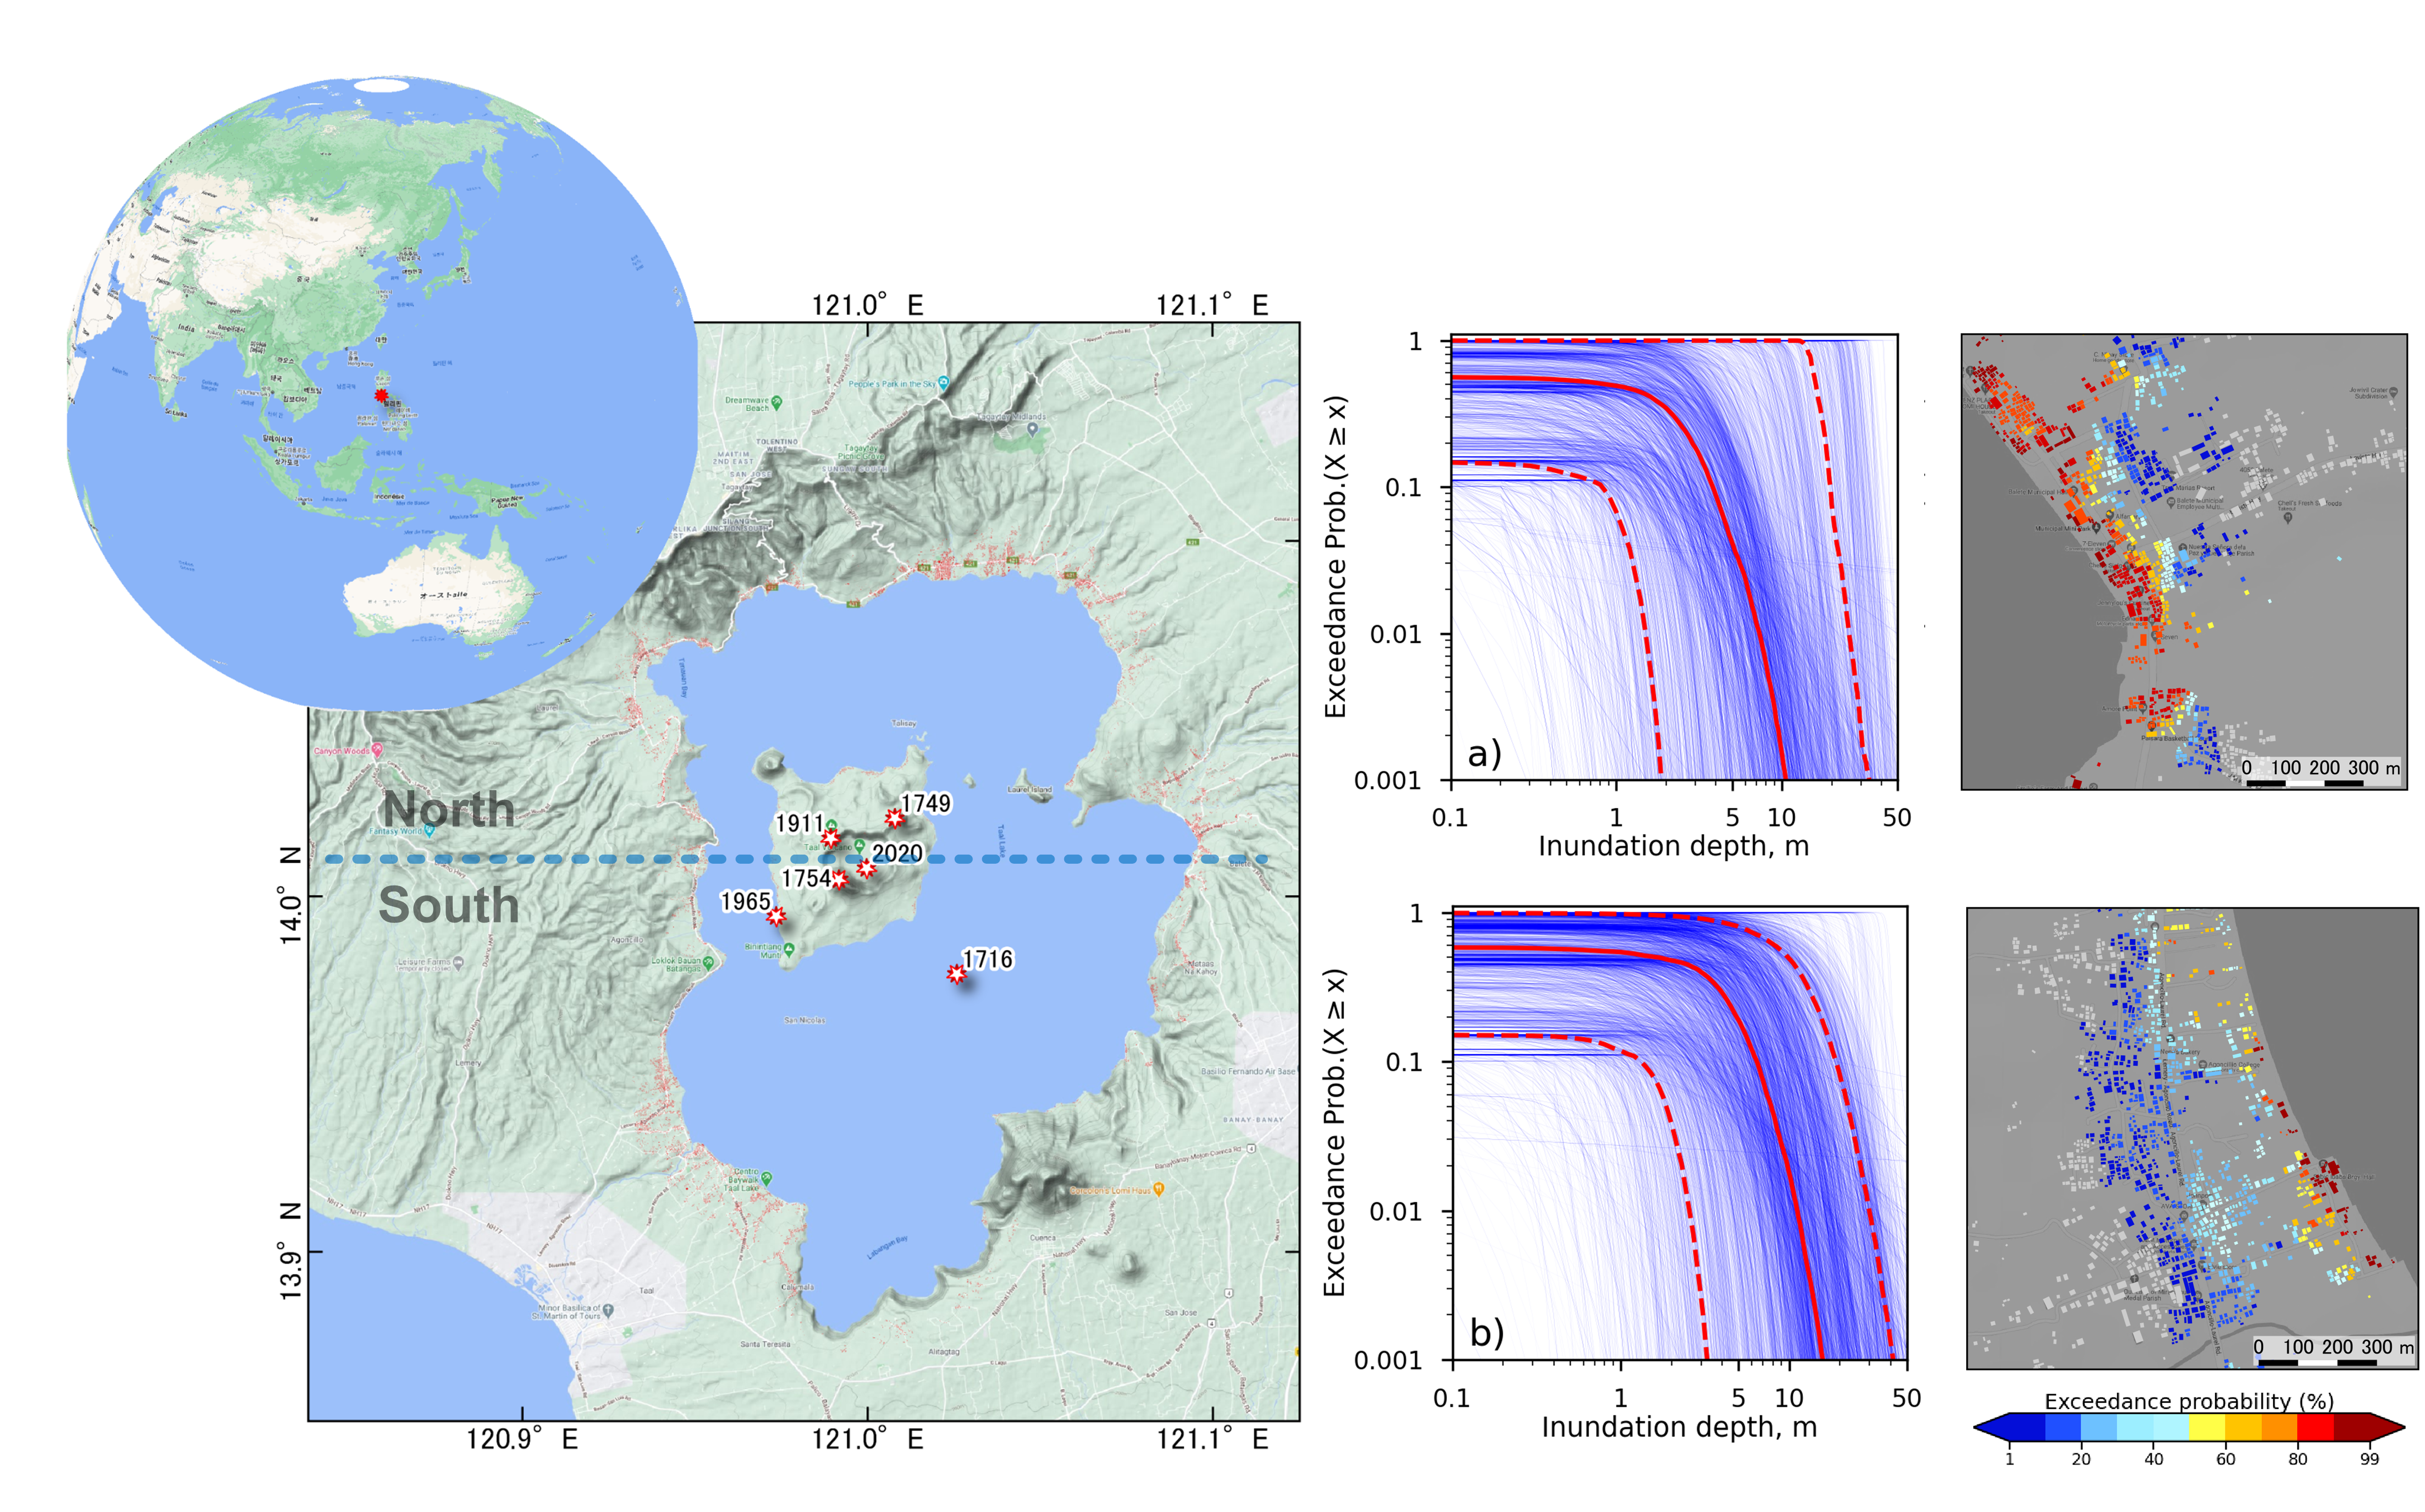
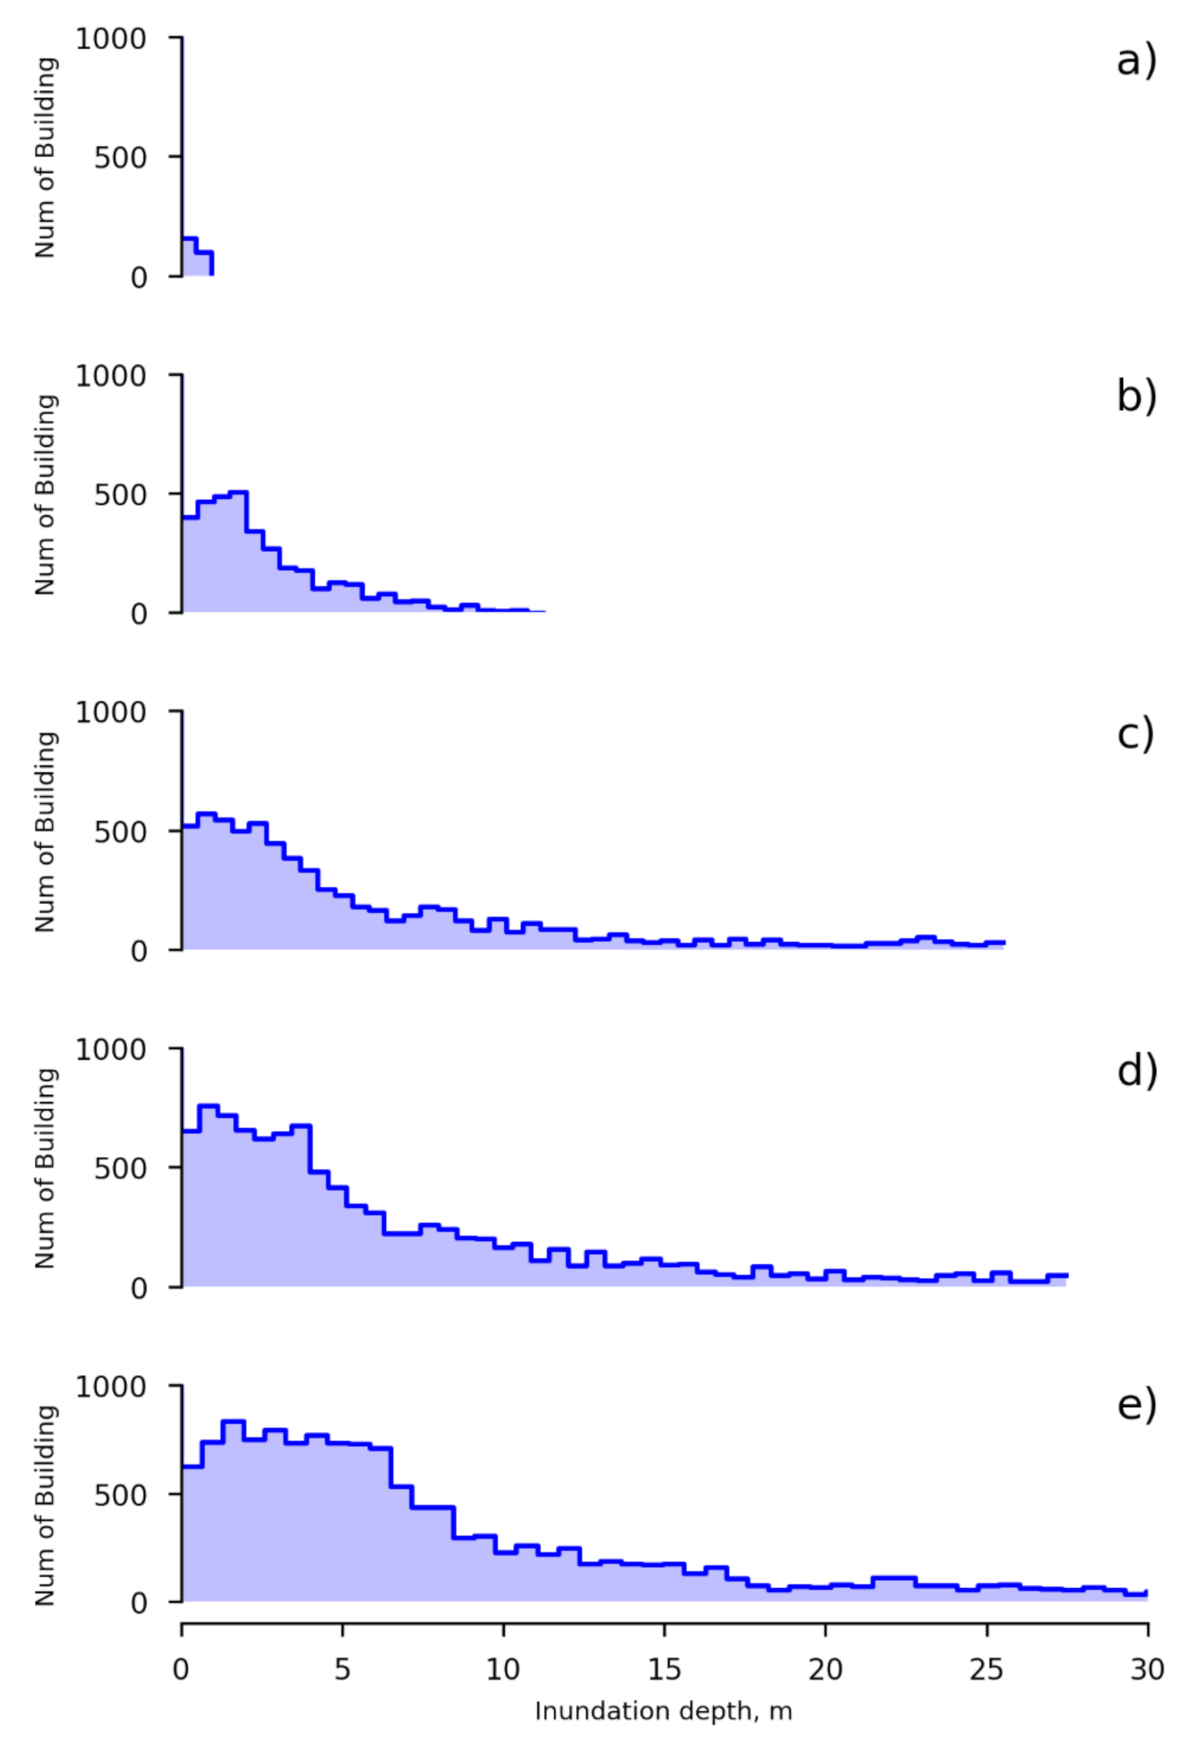
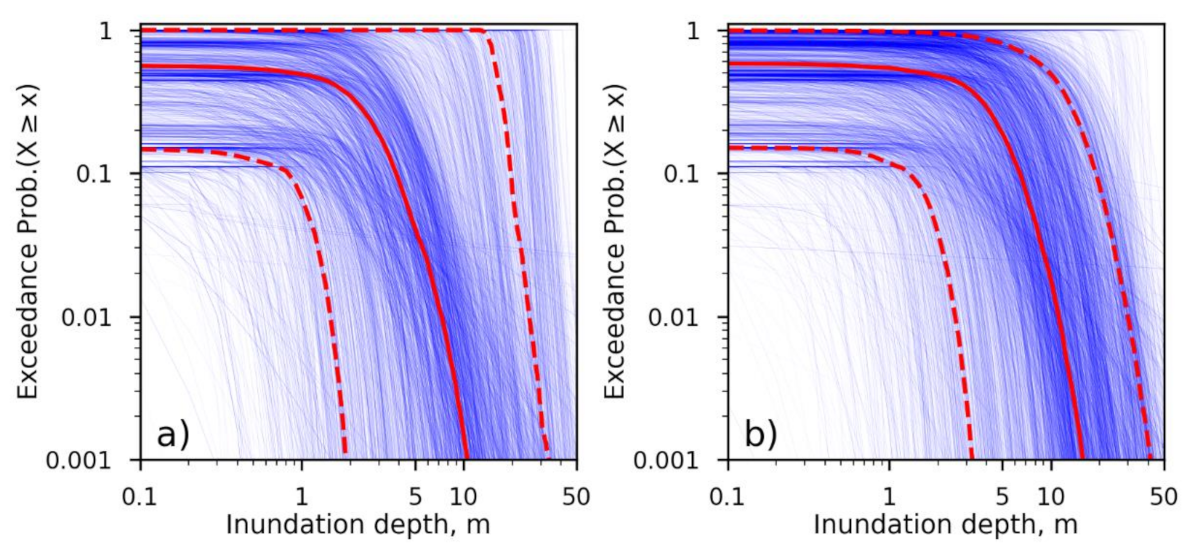
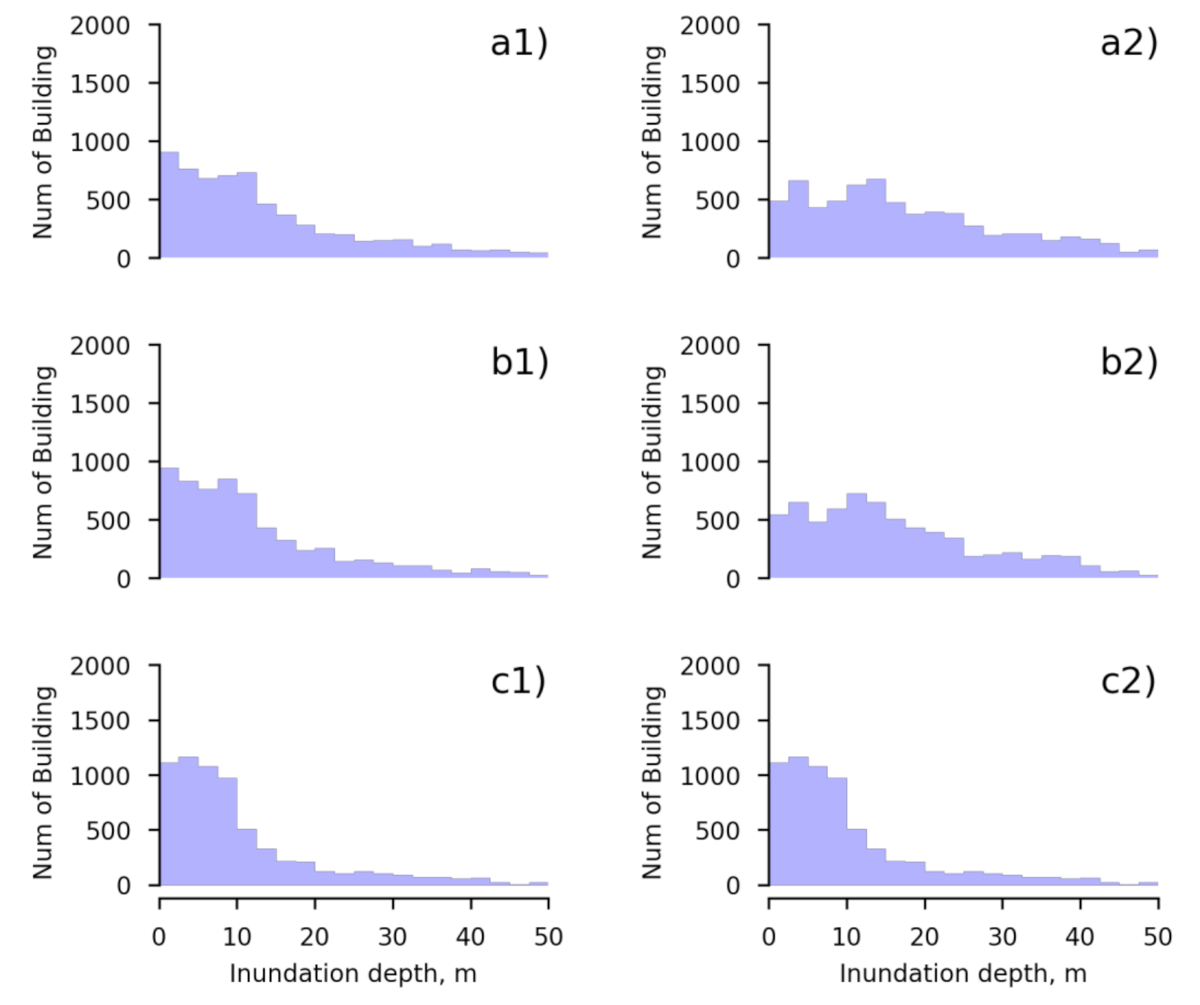
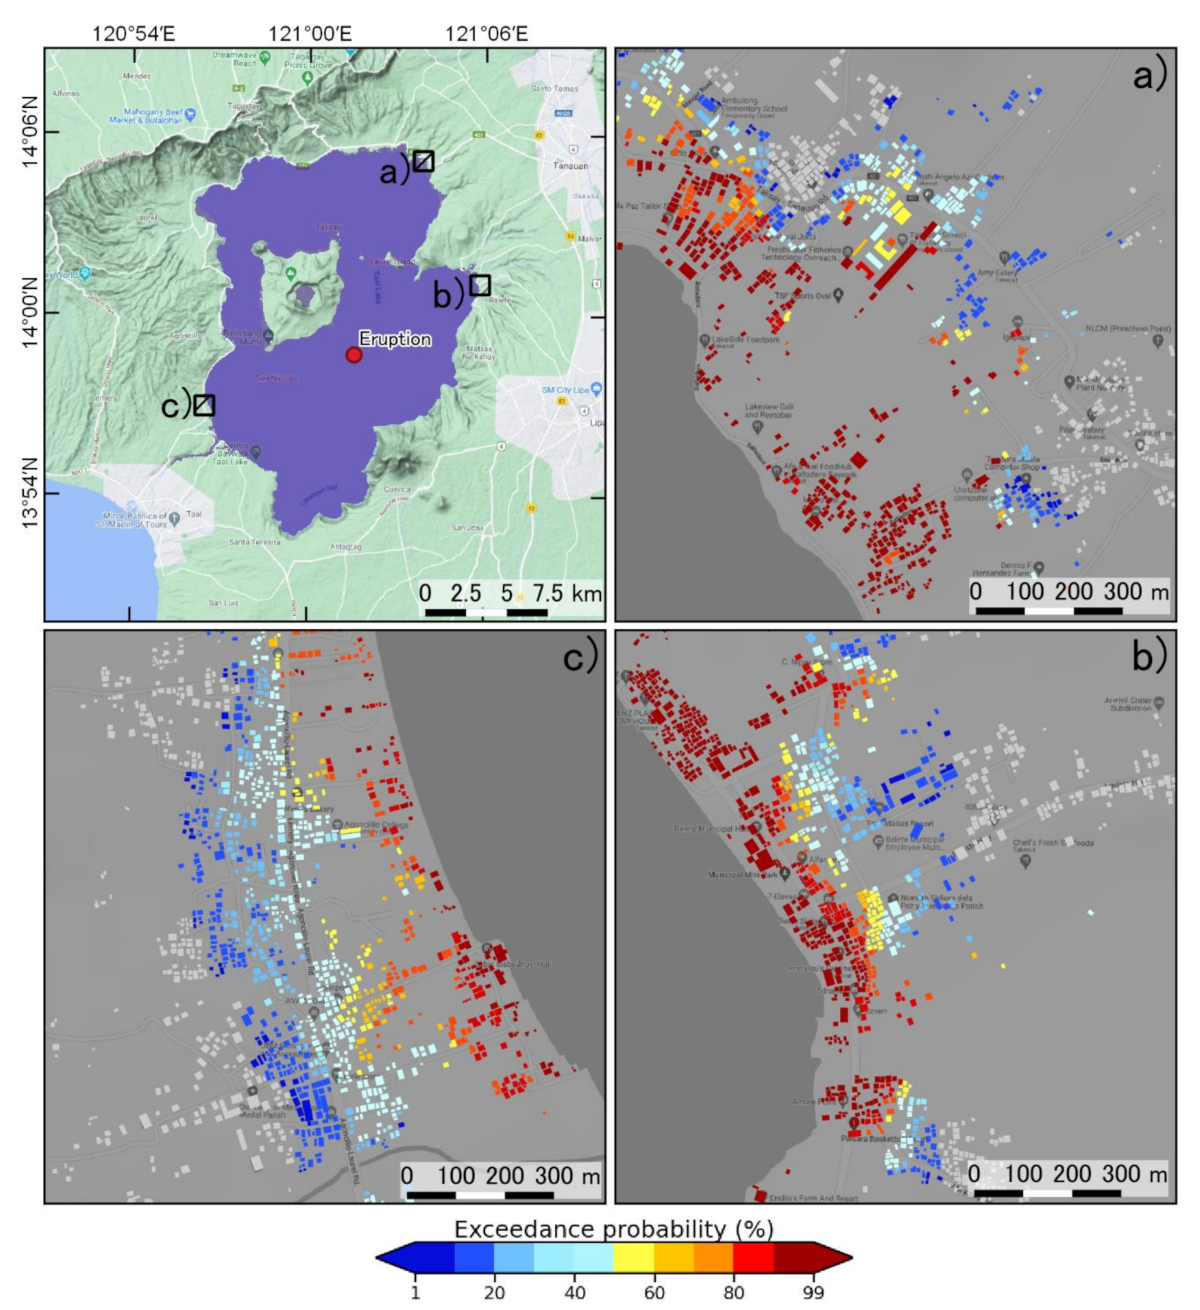
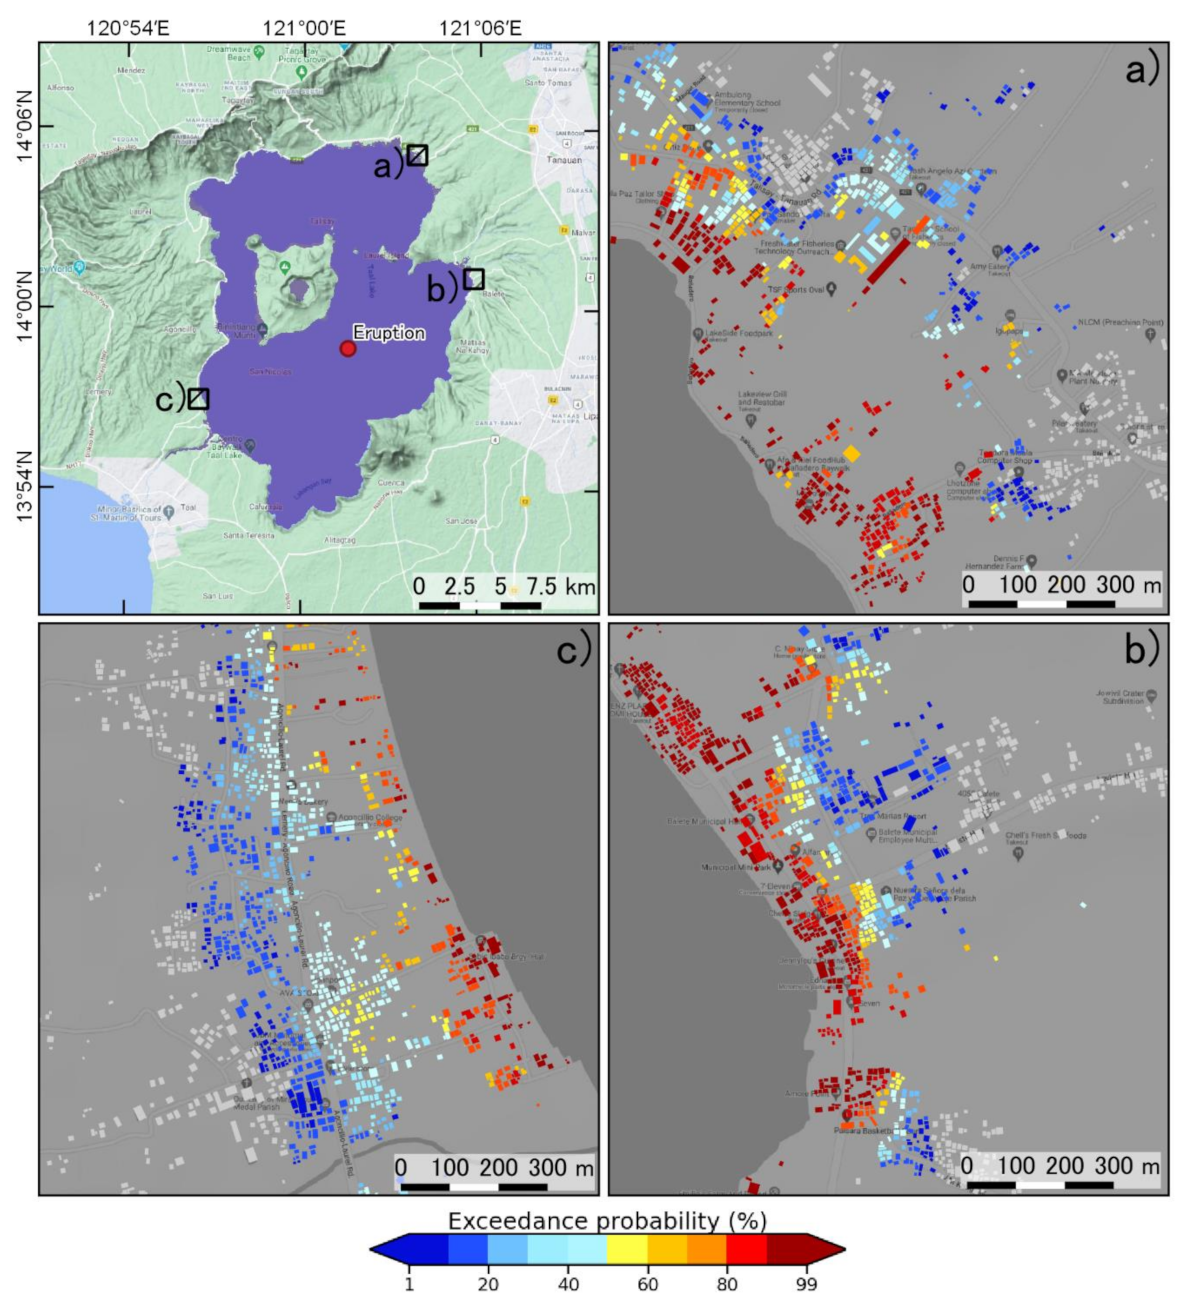
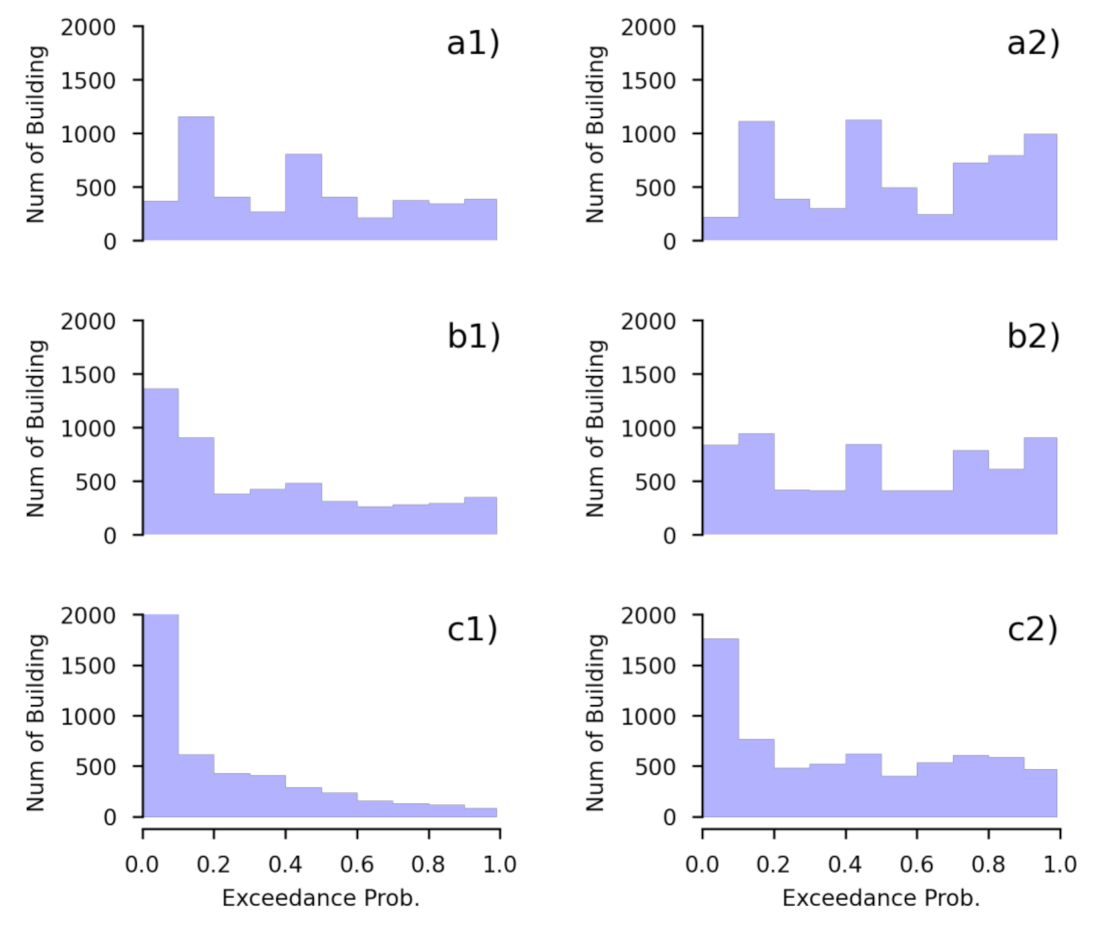
3.2. Probabilistic Condition Hazard Assessment of Inundated Buildings
4. Discussion
5. Conclusions
Author Contributions
Funding
Acknowledgments
Conflicts of Interest
Appendix A

References
- Ichinose, G.A.; Anderson, J.G.; Satake, K.; Schweickart, R.A.; Lahren, M.M. The potential hazard from tsunami and seiche waves generated by large earthquakes within Lake Tahoe, California-Nevada. Geophys. Res. Lett. 2000, 27, 1203–1206. [Google Scholar] [CrossRef]
- Freundt, A.; Strauch, W.; Kutterolf, S.; Schmincke, H.U. Volcanogenic tsunamis in lakes: Examples from Nicaragua and general implications. Pure Appl. Geophys. 2007, 164, 527–545. [Google Scholar] [CrossRef]
- Paris, R.; Ulvrova, M. Tsunamis generated by subaqueous volcanic explosions in Taal Caldera Lake, Philippines. Bull. Volcanol. 2019, 81, 14. [Google Scholar] [CrossRef]
- Delos Reyes, P.J.; Bornas, M.A.; Dominey-Howes, D.; Pidlaoan, A.C.; Magill, C.R.; Solidum, R.U. A synthesis and review of historical eruptions at Taal volcano, Southern Luzon, Philippines. Earth Sci. Rev. 2018, 177, 565–588. [Google Scholar] [CrossRef]
- Maso, S.J.; Saderra, M. Volcanoes and seimic centers of the Philippines Archipelago. Department of Commerce and Labor, Bureau of Census of the Philippine Islands. Bulletin 1904, 3, 80. [Google Scholar]
- Moore, J.G.; Nakamura, K.; Alcaraz, A. The 1965 eruption of Taal volcano. Science 1966, 151, 955–960. [Google Scholar] [CrossRef]
- Cartier, K.M.S. Taal eruption and ashfall continue; thousands still at risk. Eos 2020, 101. [Google Scholar] [CrossRef]
- Li, L.; Switzer, A.D.; Chan, C.H.; Wang, Y.; Weiss, R.; Qiu, Q. How heterogeneous coseismic slip affects regional probabilistic tsunami hazard assessment: A case study in the South China Sea. J. Geophys. Res. Solid Earth 2016, 121, 6250–6272. [Google Scholar] [CrossRef]
- Li, L.; Switzer, A.D.; Chan, C.H.; Wang, Y.; Qiu, Q.; Weiss, R. A modest 0.5-m rise in sea level will double the tsunami hazard in Macau. Sci. Adv. 2018, 4, 1–12. [Google Scholar] [CrossRef]
- Le Méhauté, B.L. Theory of explosion-generated water waves. In Advances in Hydroscience; Chow, V.T., Ed.; Academic Press: New York, NY, USA, 1971; Volume 7, pp. 1–79. [Google Scholar]
- Kokelaar, P. Magma-water interactions in subaqueous and emergent basaltic volcanism. Bull. Volcanol. 1986, 48, 275–289. [Google Scholar] [CrossRef]
- Wohletz, K.H. Explosive magma-water interactions: Thermodynamics, explosion mechanisms, and field studies. Bull. Volcanol. 1986, 48, 245–2654. [Google Scholar] [CrossRef]
- Mirchina, N.R.; Pelinovsky, E.N. Estimation of underwater eruption energy based on tsunami wave data. Nat. Hazards 1988, 1, 277–283. [Google Scholar] [CrossRef]
- Duffy, D.G. On the generation of oceanic surface waves by underwater volcanic explosions. J. Volcanol. Geotherm. Res. 1992, 50, 323–344. [Google Scholar] [CrossRef]
- Le Méhauté, B.L.; Wang, S. Water Waves Generated by Underwater Explosion; Advanced Series on Ocean Engineering; World Scientific Publishing: Hackensack, NJ, USA, 1996; Volume 10, p. 384. [Google Scholar]
- Kedrinskii, V.K. Hydrodynamics of Explosion; Springer: Berlin, Germany, 2005; p. 362. [Google Scholar]
- Egorov, Y. Tsunami wave generation by the equption of underwater volcano. Nat. Hazards Earth Syst. Sci. 2007, 7, 65–69. [Google Scholar] [CrossRef]
- Morrissey, M.; Gisler, G.; Weaver, R.; Gittings, M. Numerical model of crater lake eruptions. Bull. Volcanol. 2010, 72, 1169–1178. [Google Scholar] [CrossRef]
- Sato, H.; Taniguchi, H. Relationship between crater size and ejecta volume of recent magmatic and phreato-magmatic eruptions: Implications for energy partitioning. Geophys. Res. Lett. 1997, 24, 205–208. [Google Scholar] [CrossRef]
- Goto, A.; Taniguchi, H.; Yoshida, M.; Ohba, T.; Oshima, H. Effects of explosion energy and depth to the formation of blast wave and crater: Field explosion experiment for the understanding of volcanic explosion. Geophys. Res. Lett. 2001, 28, 4287–4290. [Google Scholar] [CrossRef]
- Torsvik, T.; Paris, R.; Didenkulova, I.; Pelinovsky, E.; Belousov, A.; Belousova, M. Numerical simulation of explosive tsunami wave generation and propagation in Karymskoye Lake, Russia. Nat. Hazards Earth Syst. Sci. 2010, 10, 2359–2369. [Google Scholar] [CrossRef]
- Ulvrova, M.; Paris, R.; Kelfoun, K.; Nomikou, P. Numerical simulations of tsunami generated by underwater volcanic explosions at Karymskoye Lake (Kamchatka, Russia) and Kolumbo volcano (Aegean Sea, Greece). Nat. Hazards Earth Syst. Sci. 2014, 14, 401–412. [Google Scholar] [CrossRef]
- Grezio, A.; Babeyko, A.; Baptista, M.A.; Behrens, J.; Costa, A.; Davies, G.; Geist, E.L.; Glimsdal, S.; Gonzàlez, F.I.; Griffin, J.; et al. Probabilistic tsunami hazard analysis: Multiple sources and global applications. Rev. Geophys. 2017, 55, 1158–1198. [Google Scholar] [CrossRef]
- Ulvrova, M.; Paris, R.; Nomikou, P.; Kelfoun, K.; Leibrandt, S.; Tappin, D.R.; McCoy, F.W. Source of the tsunami generated by the 1650 AD eruption of Kolumbo submarine volcano (Aegean Sea, Greece). J. Volcanol. Geotherm. Res. 2016, 321, 125–139. [Google Scholar] [CrossRef]
- Maeno, F.; Imamura, F. Tsunami generation by a rapid entrance of pyroclastic flow into the sea during the 1883 Krakatau eruption, Indonesia. J. Geophys. Res. Solid Earth 2011, 116, 1–24. [Google Scholar]
- Imamura, F. Review of tsunami simulation with a finite difference method. In Long-Wave Runup Models; World Scientific Pub Co Inc.: Singapore, 1995; pp. 25–42. [Google Scholar]
- Goto, C.; Ogawa, Y.; Shuto, N.; Imamura, F. IUGG/IOC Time Project, Numerical Method of Tsunami Simulation with the Leap-Frog Scheme, IOC Manuals and Guides, 35; UNESCO: Paris, France, 1997; p. 130. [Google Scholar]
- Copeland, R. Determinate of Flow Resistance Coefficient Due to Shrubs and Woody Vegetation, ERDC/CHL HETN-II-3; US Army Corps of Engineers: Washington, DC, USA, 2000; pp. 1–7.
- Dutta, D.; Alam, J.; Umeda, K.; Hayashi, M.; Hironaka, S. A two-dimensional hydrodynamic model for flood inundation simulation: A case study in the lower Mekong river basin. Hydrol. Process. 2007, 21, 1223–1237. [Google Scholar] [CrossRef]
- Aburaya, T.; Imamura, F. The proposal of a tsunami run-up simulation using combined equivalent roughness. Annu. J. Coast. Eng. JSCE 2002, 49, 276–280. (In Japanese) [Google Scholar]
- Federal Emergency Management Agency (FEMA). Coastal Construction Manual (CCM), 3rd ed.; Federal Emergency Management Agency (FEMA): Washington, DC, USA, 2003; p. 296.
- Koshimura, S.; Oie, T.; Yanagisawa, H.; Imamura, F. Developing fragility curves for tsunami damage estimation using numerical model and post-tsunami data from Banda Aceh, Indonesia. Coast. Eng. J. 2009, 51, 243–273. [Google Scholar]
- Ramos, E.G. Origin and geologic features of Taal Lake, Philippines. Aquat Ecosyst. Health Manag. 2002, 5, 155–162. [Google Scholar] [CrossRef]
- Farr, T.G.; Rosen, P.A.; Caro, E.; Crippen, R.; Duren, R.; Hensley, S.; Kobrick, M.; Paller, M.; Rodriguez, E.; Roth, L.; et al. The shuttle radar topography mission. Rev. Geophys. 2007, 45, 1–33. [Google Scholar] [CrossRef]
- Pakoksung, K.; Takagi, M. Mixed Zero-Inflation Method and Probability Distribution in Fitting Daily Rainfall Data. Eng. J. 2017, 21, 63–80. [Google Scholar] [CrossRef]
- Nofal, O.M.; Van De Lindt, J.W. Probabilistic Flood Loss Assessment at the Community Scale: Case Study of 2016 Flooding in Lumberton, North Carolina. ASCE J. Risk Uncertain. Eng. Syst. Part A Civ. Eng. 2020, 6, 05020001. [Google Scholar] [CrossRef]
- Strunz, G.; Post, J.; Zosseder, K.; Wegscheider, S.; Mück, M.; Riedlinger, T.; Mehl, H.; Dech, S.; Birkmann, J.; Gebert, N.; et al. Tsunami risk assessment in Indonesia. Nat. Hazards Earth Syst. Sci. 2011, 11, 67–82. [Google Scholar]
- Horspool, N.; Pranantyo, I.; Griffin, J.; Latief, H.; Natawidjaja, D.H.; Kongko, W.; Cipta, A.; Bustaman, B.; Anugrah, S.D.; Thio, H.K. A probabilistic tsunami hazard assessment for Indonesia. Nat. Hazards Earth Syst. Sci. 2014, 14, 3105–3122. [Google Scholar] [CrossRef]
- Mulia, I.E.; Ishibe, T.; Satake, K.; Gusman, A.R.; Murotani, S. Regional probabilistic tsunami hazard assessment associated with active faults along the eastern margin of the Sea of Japan. Earth Planets Space 2020, 72, 123. [Google Scholar] [CrossRef]
- Taddeucci, J.; Sottili, G.; Palladino, D.M.; Ventura, G.; Scarlato, P. A note on maar eruption energetics: Current models and their applications. Bull. Volcanol. 2010, 72, 75–83. [Google Scholar] [CrossRef]
- Valentine, G.A.; Graettinger, A.H.; Sonder, I. Explosion depths for phreatomagmatic eruptions. Geophys. Res. Lett. 2014, 41, 3045–3051. [Google Scholar] [CrossRef]
- Valentine, G.A.; Graettinger, A.H.; Macorps, É.; Ross, P.S.; White, J.D.L.; Döhring, E.; Sonder, I. Experiments with vertically and laterally migrating subsurface explosions with applications to the geology of phreatomagmatic and hydrothermal explosion craters and diatremes. Bull. Volcanol. 2015, 77, 1–17. [Google Scholar] [CrossRef]
- Grezio, A.; Tonini, R.; Sandri, L.; Pierdominici, S.; Selva, J. A methodology for a comprehensive probabilistic tsunami hazard assessment: Multiple sources and short-term interactions. J. Mar. Sci. Eng. 2015, 3, 23–51. [Google Scholar]


Publisher’s Note: MDPI stays neutral with regard to jurisdictional claims in published maps and institutional affiliations. |
© 2021 by the authors. Licensee MDPI, Basel, Switzerland. This article is an open access article distributed under the terms and conditions of the Creative Commons Attribution (CC BY) license (http://creativecommons.org/licenses/by/4.0/).
Share and Cite
Pakoksung, K.; Suppasri, A.; Imamura, F. Probabilistic Tsunami Hazard Analysis of Inundated Buildings Following a Subaqueous Volcanic Explosion Based on the 1716 Tsunami Scenario in Taal Lake, Philippines. Geosciences 2021, 11, 92. https://doi.org/10.3390/geosciences11020092
Pakoksung K, Suppasri A, Imamura F. Probabilistic Tsunami Hazard Analysis of Inundated Buildings Following a Subaqueous Volcanic Explosion Based on the 1716 Tsunami Scenario in Taal Lake, Philippines. Geosciences. 2021; 11(2):92. https://doi.org/10.3390/geosciences11020092
Chicago/Turabian StylePakoksung, Kwanchai, Anawat Suppasri, and Fumihiko Imamura. 2021. "Probabilistic Tsunami Hazard Analysis of Inundated Buildings Following a Subaqueous Volcanic Explosion Based on the 1716 Tsunami Scenario in Taal Lake, Philippines" Geosciences 11, no. 2: 92. https://doi.org/10.3390/geosciences11020092
APA StylePakoksung, K., Suppasri, A., & Imamura, F. (2021). Probabilistic Tsunami Hazard Analysis of Inundated Buildings Following a Subaqueous Volcanic Explosion Based on the 1716 Tsunami Scenario in Taal Lake, Philippines. Geosciences, 11(2), 92. https://doi.org/10.3390/geosciences11020092