Abstract
Here, we investigated the crustal structure beneath eastern Anatolia, an area of high seismicity and critical significance for earthquake hazards in Turkey. The study was based on the local tomography method using data from earthquakes that occurred in the study area provided by the Turkiye Cumhuriyeti Ministry of Interior Disaster and Emergency Management Directorate Earthquake Department Directorate of Turkey. The dataset used for tomography included the travel times of 54,713 P-waves and 38,863 S-waves from 6355 seismic events. The distributions of the resulting seismic velocities (Vp, Vs) down to a depth of 60 km demonstrate significant anomalies associated with the major geologic and tectonic features of the region. The Arabian plate was revealed as a high-velocity anomaly, and the low-velocity patterns north of the Bitlis suture are mostly associated with eastern Anatolia. The upper crust of eastern Anatolia was associated with a ~10 km thick high-velocity anomaly; the lower crust is revealed as a wedge-shaped low-velocity anomaly. This kind of seismic structure under eastern Anatolia corresponded to the hypothesized existence of a lithospheric window beneath this collision zone, through which hot material of the asthenosphere rises. Thus, the presented results help to clarify the deep structure under eastern Anatolia.
1. Introduction
Active tectonic forces at the boundaries of lithospheric plates lead to strong seismic activity in tectonically active regions that affects the infrastructure and lives of people therein. In many cases, the plate interaction mechanisms, which are important for assessing long-term seismic hazards, are not completely clear. Promptly addressing problems related to collisional processes requires robust information about the main structural elements in the crust and upper mantle. For this reason, geophysical investigations, particularly seismic tomography studies, are in high demand for establishing geodynamic scenarios of lithospheric evolution in many regions of the world.
We implemented seismic tomography to study the crustal structure beneath eastern Anatolia, including the eastern Anatolian accretionary complex and the surrounding areas. Figure 1 shows the main tectonic features of the study region. The East Anatolian Plateau is bounded by two Neo-Tethyan sutures: the İzmir-Ankara-Erzincan suture (IAES, shown in Figure 1) in the north and the Bitlis suture in the south [1]. Moreover, the IAES separates the Pontides Unit (PU) in the north from the East Anatolian Accretionary Complex (EAAC) to the south [2] (Figure 1). The eastern part of Turkey is characterized by the junction of three large plates: the Anatolian plate in the west, the Arabian plate in the south, and the Iranian plate in the east. This system is divided by tectonic faults, including the North Anatolian fault (NAF) and the East Anatolian fault (EAF), which intersect in the study area and form the Karliova triple junction (KTJ) (Figure 1). This system of plates is pushed northward by the movement of the Arabian plate at a rate of ~18 mm/year with respect to the Eurasian plate [3,4]. This movement causes westward displacement of the Anatolian block along the right-lateral strike-slip NAF at a rate of ~24 mm/year. To the south, the Anatolian plate is bounded by the EAF, which exhibits left-lateral displacement at a rate of ~9 mm/year [4]. To the west of the NAF is the central Anatolian fault zone (CAFZ), which is a transtensional left-lateral strike-slip fault zone extending from central Anatolia to the Mediterranean Sea [5].
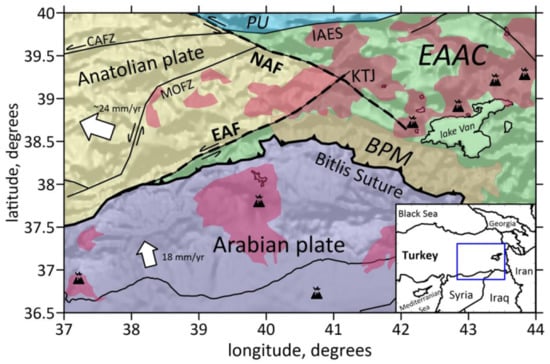
Figure 1.
The simplified regional tectonic map of Eastern Turkey with topographic relief (modified from [6]). Pink areas are Neogene–Quaternary volcanism. Arrows indicate the direction of plate and fault motions. BPM–Bitlis-Poturge Massif; CAFZ–Central Anatolia Fault Zone; EAAC—East Anatolian Accretionary Complex; EAF—East Anatolian Fault; IAES–Izmir-Ankara-Erzincan Suture; KTJ—Karlova Triple Junction; MOFZ—Malatya-Ovacik Fault Zone; NAF—North Anatolian Fault; PU—Pontide Unit.
The region of eastern Anatolia features complex tectonic structures, which formed during its multistage evolutionary history. The general shortening regime of eastern Anatolia is mostly controlled by the Arabian-Eurasian collision, which began in the mid-Miocene [1,7,8,9]. The continental collision between the Arabian and Eurasian plates began after the closure of the Tethys Ocean, which separated Gondwana and Laurasia. The formation of marginal basins and the accretion of island arcs and other continental fragments, as well as the subduction of intervening portions of the oceanic lithosphere, took place during the closure of the Neo-Tethys. The East Anatolian Accretionary Complex (EAAC, shown in Figure 1) was formed during subduction from the Late Cretaceous to the earliest Oligocene and included Neo-Tethyan material. The EAAC, having formed on the northward-subducting oceanic lithosphere, can be considered as a remnant of a large accretionary prism situated between the Pontides and the Bitlis-Portuge massif. There is no subducting slab beneath the EAAC.; This could be due to the detachment of the plate under the collision zone. [10] argues that the slab, whose subduction was generating the Pontide arc in the north, was not attached to the Arabian plate. Instead, the slab was possibly attached to the Bitlis-Poturge block before the break-off. The Bitlis-Portuge massif (BPM shown in Figure 1) consists of medium-to-highly metamorphosed units [11].
Several petrological studies suggest that subduction was the likely cause of volcanic activity in the region [10,12]. Although this issue is still actively discussed in the scientific community, most argue that the large volume of melt generated under eastern Anatolia was caused by hot asthenospheric upwelling. Most of the area of eastern Anatolia is covered by the products of recent volcanism (with ages from 20 Ma to the present day). According to the results of isotopic dating, the younger magmatism (6–4 Ma) occurred around Lake Van, whereas the older magmatism is mostly concentrated in the northern part of the plateau (eastward part of the study area). This suggests that the heating and melting zones migrated southward during the past 20 Ma [13,14].
In the high-elevation East Anatolian Plateau, an uplift of ~2 km is observed relative to the adjacent parts of the Arabian plate to the south (e.g., [9,15]). According to the results of receiver function analysis and surface wave tomography studies, the crust of the Anatolian plate gradually thickens to the east. The deepest Moho boundary is observed beneath eastern Anatolia (~50 km) [16]; beneath central Anatolia, the crustal thickness is ~37–47 km, and beneath western Anatolia, the crust is ~30 km thick [16,17]. According to the results of [18], in the latitudinal direction, the crust thickens northward from 42 km near the southern part of the Bitlis suture zone to 50 km along the northern edge of the Anatolian plateau in the vicinity of the North Anatolian fault. The thickness of the crust on the Arabian plate is ~40 km [19].
Some geodynamic models (see, for example, [11,20,21,22]) suggest that the thickening of the eastern Anatolia crust and its uplift are associated with the delamination of the mantle lithosphere within the Arabian plate. Several regional seismic tomography models consistently show traces of slab detachment/break-off and asthenospheric upwelling beneath the Arabia-Eurasia convergence zone (see, for example, [23,24,25,2627,28,29,30]). In all of the above studies, high-velocity anomalies beneath the margins of the Arabian and Eurasian plates indicate the subsidence of delaminated material, whereas low-velocity anomalies are observed directly under the collision zone, which can be explained by the absence of strong thinning of the mantle lithosphere and the filling of this gap with hot asthenospheric material.
Over the last decade, many regional- and local-scale tomography studies were performed for different parts of Turkey. Seismic velocity models of the lithosphere were obtained for the areas of central Anatolia [31,32], western Turkey [33], eastern Turkey [34,35], the North Anatolian fault [36,37,38], the Marmara Basin [39,40], and the Erzincan Basin [41].
As shown above, a large number of studies have been performed on the regional structures of Turkey, and the geodynamic processes in these areas were successfully investigated. However, despite the abundance of publications, the crustal structure of eastern Turkey is far from being perfectly understood, as many of the derived models demonstrate considerable inconsistencies with each other. In this study, we present new seismic tomography models of the crust and uppermost mantle (down to ~60 km), which were built using a new large set of travel time data. These results can help determine the links between the surface geology and deep structures controlled by complex collisional processes.
2. Data and Method
The models of seismic velocities were obtained using the arrival times of P- and S-body waves from local events in the eastern Anatolia region recorded by stations in Turkey and the surrounding countries. The dataset was provided by the Turkiye Cumhuriyeti Ministry of Interior Disaster and Emergency Management Directorate Earthquake Department Directorate of Turkey. The magnitudes of most of the earthquakes in the study were generally between 1 and 7, and their focal depths were mostly between 5 and 35 km. The dataset included the travel times of 114,800 P-waves and 88,962 S-waves from 13,029 earthquakes were recorded by 187 seismic stations.
To perform the tomographic inversion, we discarded data with fewer than a total of eight P and S picks per event. At the stage of determining the preliminary source locations in the initial 1D velocity model, we removed the data with residuals exceeding 1 s. After applying these two criteria, for the tomographic inversion, we obtained a dataset with 54,713 P- and 38,863 S-wave picks from 6355 events (almost 15 picks per event on average). Figure 2 demonstrates the coverage of the rays from this dataset.
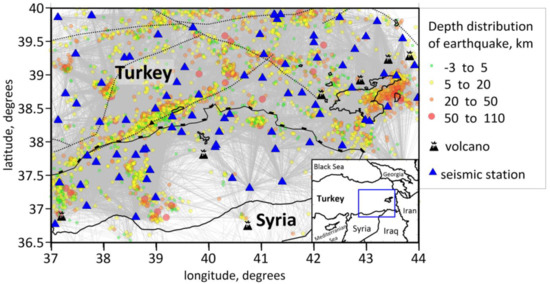
Figure 2.
Distribution of data used for seismic tomography in the study region. Blue triangles denote seismic stations. Red dots are the events. Grey lines indicate the horizontal projection of the ray-path.
The inversion of the P- and S-waves arrival times were performed to obtain 3D velocity models and the locations of the events by using the nonlinear local earthquake tomography code LOTOS (Local Tomography Software) [42]. This code has been used to study various collision zones with similar data distribution geometries, such as the Tien Shan [43,44], the Caucasus [24], India [45], Calabria [46], and others.
The calculations began with locating the sources in the reference 1D velocity model using the grid search method. At this step, to make the calculations faster, the travel times of seismic waves were computed using a table of travel times calculated at a preliminary stage for all possible depths of events and epicentral distances.
Then, we performed several iterations of the tomographic inversion procedure, which included the relocation of sources, the calculation of the sensitivity matrix, and the inversion. The source relocation procedure in the first iteration was performed with the reference 1D velocity model and then with the updated 3D velocity models calculated in the preceding iterations. The search for the optimal source coordinates was based on the gradient optimization method (see [42]), which more rapidly calculates the most likely source locations. The algorithm of a 3D seismic ray tracing, based on the bending method proposed by [47], was used to calculate the travel times within the iteration.
The velocity models were parameterized using a set of nodes deployed according to the ray density. In map view, the nodes were installed regularly with a spacing of 25 km. In the vertical direction, the grid spacing was inversely proportional to the ray density, but the spacing could not be smaller than a predefined value of 10 km. The results were calculated using four grids (with orientations of 0°, 22°, 45°, and 67°) and then averaged them in one 3D model. The inversion was performed simultaneously for the P- and S-wave velocities, as well as for the source parameters (dx, dy, dz, and dt) and for the station corrections. For the inversion, we used the LSQR algorithm by [48] and [49]. The inversion stability was controlled by damping and flattening. This procedure minimized the differences in the solutions from neighboring nodes. To derive the final models, we used five iterations in total.
The optimal initial 1D model was estimated after several runs of the full inversion. In the first run, we used a starting model defined as an average model derived from previous studies in eastern Turkey (e.g., [50]). Then, to determine the optimal reference model, we computed the average values of the P- and S-wave velocities at certain depths were computed after the full inversion procedure. These values were used as a new reference model for the next run. Thus, after several runs, we obtained the optimal reference model presented in Table 1. The P and S velocity values in the 1D model were defined at few depth levels. The velocity changes were linear between those depths. We avoided sharp interfaces, such as the Moho, to define artificial horizontal structures to obtain the final velocity model.

Table 1.
The 1D Reference Model.
3. Seismic Tomography Models and Tests
The main local tomography results are the 3D models of P- and S-wave velocity anomalies, which are presented in horizontal slices at depths of 10, 30, and 50 km in Figure 3 and in four vertical sections passing through the whole study area and crossing the Bitlis suture zone in Figure 4.
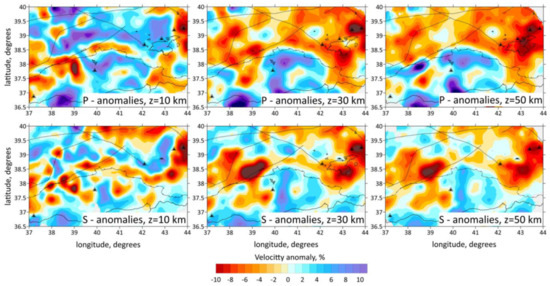
Figure 3.
P- and S-velocity anomalies in horizontal sections.
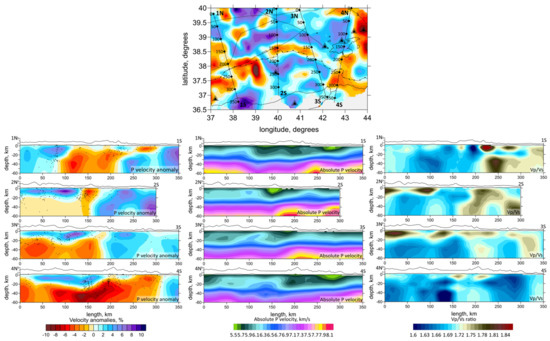
Figure 4.
P-velocity anomalies in vertical sections (at left), absolute P-velocities (in the middle), the Vp/Vs ratio (at right). Horizontal section 10 km with main geological structure elements and profiles locations on the top.
Figure 3 shows that the derived P- and S-wave velocity structures correlated fairly well with each other, which may serve as an informal verification criterion. Indeed, at a regional scale, most of the geological structures (for example, sedimentary basins and igneous provinces) were similarly expressed by the P- and S-wave velocities. The vertical sections of Vp/Vs ratio models, shown in Figure 4, demonstrated similar structures as in the vertical sections of the main resulting dVp models. The fact that the independently derived dVp and dVs highlighted the same structures, the existing data provide sufficient coverage to reliably recover the structures discussed.
To assess the role of random noise in the data, we performed the so-called odd/even test, which consists of independent inversions of two data subsets distinguished by a random criterion, for example, using odd- and even-numbered events. Then, we compared the inversion results obtained using the same parameters and the same algorithms. If the images were strongly different, it means that the random factor in the data was essential. The results of the odd/even test in our case were demonstrated for both the P-wave and the S-wave velocity anomalies at a depth of 30 km in Figure 5. We could observe a good correlation between the major recovered structures. The main features of the velocity heterogeneities, which are important for our interpretation, could be traced in all the models.
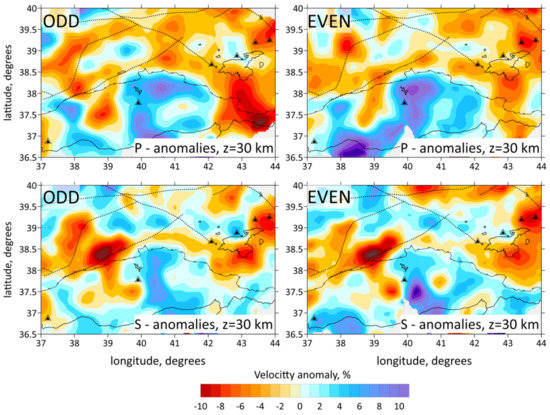
Figure 5.
Odd/Even events test.
Synthetic modeling is an important step in tomography, as it provides estimates of the spatial resolution and reliability of the recovered model and allows the optimal values of free parameters (grid spacing, damping, and smoothing) to be determined. When performing synthetic modeling, we simulated the conditions of actual tomographic studies. Synthetic travel times were calculated for the existing source-receiver pairs through a predefined 3D synthetic model using the bending ray tracing algorithm and were then perturbed with random noise. To start recovering the model, we started processing with the absolute source determination results with the initial 1D velocity model, similar to the experimental data inversion. All the steps and controlling parameters during the recovery procedure were identical to the case of computing the main tomographic model based on the experimental data.
To assess the horizontal resolution of the model, we performed a series of checkerboard tests with anomalies of different sizes, as presented in Figure 6. We preset a horizontal checkerboard with rectangular positive and negative anomalies with lateral dimensions of 40 × 40 km, 60 × 60 km, and 80 × 80 km, and with amplitudes of ± 6% (Figure 6). In this particular case, the anomalies remained unchanged with depth. As shown in Figure 6, the checkerboard structure was robustly resolved for both the P-wave and the S-wave velocity models. For shallower depths (up to ~10–15 km), even the 40 km size pattern was robustly resolved in most parts of the study area. At a depth of ~30 km, the anomalies at 60 × 60 km were more resolvable than those at a depth of 40 km. Additionally, in the 60 km depth section, the resolvable pattern size was approximately 60 km. However, the models with smaller anomalies were strongly smeared at this depth.
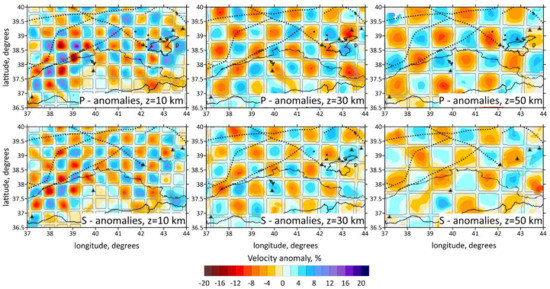
Figure 6.
Checkerboard tests for three P- and S-velocity models. The sizes of anomalies are 40, 60, 80 km. Gray lines mark the boundaries of the synthetic anomalies.
Based on this test, we could conclude that for most parts of the study area, we had sufficient resolution to reveal the main structures, which will be discussed later. The parts of the model where the checkerboard was not correctly restored should be considered with prudence in the interpretation.
To estimate the vertical resolution, we performed a synthetic test with anomalies defined along vertical profiles. Because of the trade-off between the source depth and velocity distribution, the vertical resolution is typically much poorer than the horizontal resolution in cases of passive source tomography studies. In Figure 7, we present vertical checkerboard tests associated with the vertical profiles used to present the main results. Across these sections, the anomalies were defined within a 100 km thick band. In the horizontal direction, the anomalies had a size of 90 km. In the vertical direction, the signs of the anomalies changed at depths of 20 km and 70 km. For the shallow part of the model, the recovery result of this test appeared to be robust; the vertical resolution was sufficient to detect the change in the anomaly sign at a depth of 20 km depth, but the model did not have a sufficient resolution to recognize anomaly sign changes at 70 km. It may also be observed that the anomalies at the ends of the profiles were smeared due to the poor data coverage along the margins of the study area.
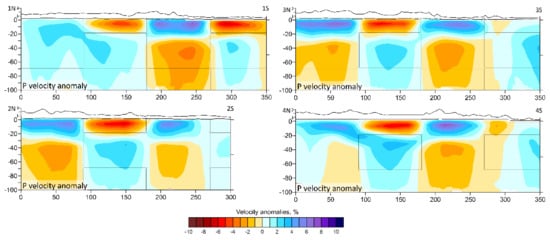
Figure 7.
Vertical checkerboard test.
4. Discussion and Interpretation
The horizontal sections of the obtained seismic tomography model demonstrated a strong predominance of high-velocity anomalies in the southern part of the studied region beneath the Arabian plate. To the north of the Bitlis suture zone, we observed low-velocity anomalies that mark a boundary between the Arabian plate and the East Anatolian plate. Horizontal sections at a depth of 10 km (Figure 3) showed a clear correlation between the low-velocity anomalies and known tectonic features, such as the NAF, the EAF, and the MAFZ, which are highlighted in the Figures with black dotted lines. Deeper horizontal sections at depths of 30 and 60 km show that the entire study area to the north of the Bitlis suture zone is associated with low-velocity anomalies.
The four vertical profiles shown in Figure 4 are oriented north-south and are nearly perpendicular to the Bitlis suture zone. The first section crosses the Anatolian block, the second section crosses the NAF and EAF, the third section passes through the KTJ, and the fourth section passes through the EAAC and crosses the volcanic province around Lake Van.
In all vertical sections, the Bitlis suture zone was associated with a low-velocity anomaly at the surface, which is most likely due to the accretion of sedimentary and upper crustal rocks at the boundary between the Arabian and East Anatolian plates. Moreover, the vertical sections demonstrate some clear structural differences between the high-velocity Arabian plate to the south and the low-velocity East Anatolian plate to the north of the Bitlis border. Compared with the crust of eastern Anatolia, the crust of the Arabian plate was denser and more consolidated; therefore, high P- and S-wave velocities prevail.
In addition, according to the results shown in the vertical sections, a shallow high-velocity anomaly with a thickness of ~10–12 km was observed to the north of the Bitlis suture boundary, which was underlain by a thick low-velocity anomaly. Based on our model, it was difficult to evaluate the actual thickness of this deeper layer, as, according to the results of the synthetic test shown in Figure 7, the anomalies were smeared at great depth in the obtained models. This low-velocity anomaly has an inclined shape that dips northward from the Bitlis suture zone underneath the East Anatolian plate. This feature seems to be consistent with available receiver function results showing the gradual northward thickening of the crust [16,17]. According to [18], in the Bitlis suture zone, the Moho depth is 42 km, while in the northern part, for example, under the NAF, the Moho reaches 50 km in depth [19].
Beneath eastern Anatolia, the crustal structure appears to be atypical. In the upper part of the velocity sections, the velocities appear to be higher than those of regular continental crustal structures, whereas, in the lower crust, we observe prominent low-velocity anomalies. The higher-velocity structures in the upper crust might be associated with the widespread distribution of Neogene-Quaternary volcanism. Strongly consolidated intrusions and massive effusive flows have an integral effect of increasing the velocity in the upper crust.
The low velocities of seismic waves in the lower mafic crust can be explained by active shortening, which led to the entrainment of highly weakened material in the lower crust. This material was immersed to great depth, where it underwent phase changes and melting. An important additional factor affecting the lower crust is the absence of strong thinning of the mantle lithosphere beneath eastern Anatolia (see, for example, [20,21]). As a result, the lithospheric window is filled with overheated asthenospheric material that reaches the bottom of the crust. In this case, the low velocities in the lower crust in our tomography models may represent anomalous heating of the crust and possible melting due to elevated heat flow from the asthenosphere. Our findings are strongly consistent with the modeling results by [51], who presented a rheological model of eastern Anatolia and showed that the crust consists of a strong brittle upper crust (down to depths of 10–15 km) and a weak ductile lower crust (depths from 10–15 km to 40 km).
In the southern part of vertical profiles 1, 2, and 3 (Figure 4), there was a high-velocity anomaly related to the Arabian plate, which has north immersion trending underneath the observed low-velocity anomaly. This positive anomaly was divided into two parts: one has an isometric shape and was located directly below the Bitlis suture zone, and another larger anomaly was located to the south. We propose that the former anomaly represents a remnant of the Neo-Tethys oceanic lithosphere remaining under the Bitlis suture zone, the main part of which broke off and plunged into the mantle during subduction. The larger part belongs to the crust of the Arabian plate. A schematic structure of the crust beneath eastern Anatolia according to the results obtained in this work is shown in Figure 8.

Figure 8.
Scheme of the Crustal Structure along profile 1 under Eastern Anatolia.
In the southern part of the vertical sections, we can see that the crust of the Arabian plate is associated with a high-velocity anomaly reaching depths of more than 60 km, although the Moho boundary reaches only 40 km, according to [19]. This structure can be explained by the ongoing northward dipping of the Arabian plate. Since the crust of the Arabian plate does not differ structurally (thick sedimentary layer, many faults, etc.), the velocity anomaly throughout all of the investigated volume (up to a depth of 60 km) looks uniformly positive. In the northern part of vertical profile 1, a high-velocity anomaly stands out, which most likely belongs to a denser crust under the Pontides.
5. Conclusions
Using the LOTOS algorithm, we obtained a 3D model of heterogeneous crustal P- and S-wave velocities beneath eastern Anatolia down to a depth of ~60 km. We used a large amount of data provided by the T. C. Ministry of Interior Disaster and Emergency Management Directorate Earthquake Department Directorate of Turkey. The obtained tomographic models were verified using different tests showing high reliability and fair resolution.
The tomographic models demonstrate a clear separation of the study region into two tectonic units. To the south of the Bitlis suture zone, the crust of the consolidated Arabian plate is marked as a high-velocity anomaly. The low-velocity patterns to the north of the Bitlis suture are mostly associated with eastern Anatolia. According to the presented vertical sections, beneath the East Anatolian plate, we observed a thin (~10–12 km) high-velocity anomaly in the upper crust, which might be associated with massive Neogene-Quaternary magmatic activity in this area. In the lower crust, we observed an inclined low-velocity anomaly having the smallest thickness beneath the Bitlis zone and the largest thickness beneath the northern part of the section (>50 km). This feature seems to be consistent with the general northward thickening trend of the crust, as revealed from existing receiver function studies.
It is most likely that the upper crustal high-velocity anomaly corresponds to the strong felsic layer of the crust, while the low-velocity anomaly is associated with the weak lower mafic crust. Thus, the presented results confirm the hypothesis of the existence of a lithospheric window beneath eastern Anatolia, through which hot material of the asthenosphere rises, and these findings help clarify the deep structure under eastern Anatolia.
Author Contributions
G.P. analyzed the data; I.M. and I.K. obtained seismic tomography models and contributed to preparing figures; All authors participated in discussions of the results and writing the manuscript. All authors have read and agreed to the published version of the manuscript.
Funding
The reported study was funded by Russian Foundation for Basic Research, project number 19-35-60002.
Data Availability Statement
The full directory of LOTOS code with data corresponding to this study is available at https://doi.org/10.5281/zenodo.3944178 (accessed on 15 February 2021).
Conflicts of Interest
The authors declare no conflict of interest.
References
- Okay, A.I.; Zattin, M.; Cavazza, W. Apatite fission-track data for the Miocene Arabia-Eurasia collision. Geology 2010, 38, 35–38. [Google Scholar] [CrossRef]
- Mueller, M.A.; Licht, A.; Campbell, C.; Ocakoğlu, F.; Taylor, M.H.; Burch, L.; Ugrai, T.; Kaya, M.; Kurtoğlu, B.; Coster, P.M.C.; et al. Collision Chronology Along the İzmir-Ankara-Erzincan Suture Zone: Insights From the Sarıcakaya Basin, Western Anatolia. Tectonics 2019, 38, 3652–3674. [Google Scholar] [CrossRef]
- Tan, O.; Taymaz, T. Active tectonics of the Caucasus: Earthquake source mechanisms and rupture histories obtained from inversion of teleseismic body waveforms. Spec. Pap. Geol. Soc. Am. 2006, 409, 531. [Google Scholar]
- McClusky, S.; Balassanian, S.; Barka, A.; Demir, C.; Ergintav, S.; Georgiev, I.; Gurkan, O.; Hamburger, M.; Hurst, K.; Kahle, H.; et al. Global Positioning System constraints on plate kinematics and dynamics in the eastern Mediterranean and Caucasus. J. Geophys. Res. Solid Earth 2000, 105, 5695–5719. [Google Scholar]
- Yıldırım, C.; Sarıkaya, M.A.; Çiner, A. Late Pleistocene intraplate extension of the Central Anatolian Plateau, Turkey: Inferences from cosmogenic exposure dating of alluvial fan, landslide, and moraine surfaces along the Ecemiş Fault Zone. Tectonics 2016, 35, 1446–1464. [Google Scholar] [CrossRef]
- Özacar, A.A.; Zandt, G.; Gilbert, H.; Beck, S.L. Seismic images of crustal variations beneath the East Anatolian Plateau (Turkey) from teleseismic receiver functions. Geol. Soc. Spec. Publ. 2010, 340, 485–496. [Google Scholar] [CrossRef]
- Şengör, A.M.C.; Yilmaz, Y. Tethyan evolution of Turkey: A plate tectonic approach. Tectonophysics 1981, 75, 181–241. [Google Scholar] [CrossRef]
- Allen, M.; Jackson, J.; Walker, R. Late Cenozoic reorganization of the Arabia-Eurasia collision and the comparison of short-term and long-term deformation rates. Tectonics 2004, 23. [Google Scholar] [CrossRef]
- Dewey, J.F.; Hempton, M.R.; Kidd, W.S.F.; Saroglu, F.; Şengör, A.M.C. Shortening of continental lithosphere: The neotectonics of Eastern Anatolia - A young collision zone. Geol. Soc. Spec. Publ. 1986, 19, 1–36. [Google Scholar] [CrossRef]
- Keskin, M. Magma generation by slab steepening and break-off beneath a subduction-accretion complex: An alternative model for collision-related volcanism in Eastern Anatolia, Turkey. Geophys. Res. Lett. 2003, 30, 7–10. [Google Scholar] [CrossRef]
- Şengör, A.M.C.; Özeren, S.; Genç, T.; Zor, E. East Anatolian High Plateau as a mantle-supported, north-south shortened domal structure. Geophys. Res. Lett. 2003, 30, 2–5. [Google Scholar] [CrossRef]
- Yilmaz, Y. Comparison of young volcanic associations of western and eastern Anatolia formed under a compressional regime: A review. J. Volcanol. Geotherm. Res. 1990, 44, 69–87. [Google Scholar] [CrossRef]
- Schleiffarth, W.K.; Darin, M.H.; Reid, M.R.; Umhoefer, P.J. Dynamics of episodic Late Cretaceous-Cenozoic magmatism across Central to Eastern Anatolia: New insights from an extensive geochronology compilation. Geosphere 2018, 14, 1990–2008. [Google Scholar] [CrossRef]
- Rabayrol, F.; Hart, C.J.R.; Thorkelson, D.J. Temporal, spatial and geochemical evolution of late Cenozoic post-subduction magmatism in central and eastern Anatolia, Turkey. Lithos 2019, 336, 67–96. [Google Scholar]
- Şengör, A.M.C.; Kidd, W.S.F. Post-collisional tectonics of the Turkish-Iranian plateau and a comparison with Tibet. Tectonophysics 1979, 55, 361–376. [Google Scholar] [CrossRef]
- Vanacore, E.A.; Taymaz, T.; Saygin, E. Moho structure of the anatolian plate from receiver function analysis. Geophys. J. Int. 2013, 193, 329–337. [Google Scholar] [CrossRef]
- Tezel, T.; Shibutani, T.; Kaypak, B. Crustal structure variation in western Turkey inferred from the receiver function analysis. Tectonophysics 2010, 492, 240–252. [Google Scholar]
- Zor, E.; Sandvol, E.; Gürbüz, C.; Türkelli, N.; Seber, D.; Barazangi, M. The crustal structure of the East Anatolian plateau (Turkey) from receiver functions. Geophys. Res. Lett. 2003, 30. [Google Scholar] [CrossRef]
- Gök, R.; Pasyanos, M.E.; Zor, E. Lithospheric structure of the continent-continent collision zone: Eastern Turkey. Geophys. J. Int. 2007, 169, 1079–1088. [Google Scholar] [CrossRef]
- Gans, C.R.; Beck, S.L.; Zandt, G.; Biryol, C.B.; Ozacar, A.A. Detecting the limit of slab break-off in central Turkey: New high-resolution Pn tomography results. Geophys. J. Int. 2009, 179, 1566–1572. [Google Scholar]
- Memiş, C.; Göğüş, O.H.; Uluocak, E.Ş.; Pysklywec, R.; Keskin, M.; Şengör, A.M.C.; Topuz, G. Long Wavelength Progressive Plateau Uplift in Eastern Anatolia Since 20 Ma: Implications for the Role of Slab Peel-Back and Break-Off. Geochem. Geophy. Geosys. 2020, 21. [Google Scholar] [CrossRef]
- Pearce, J.A.; Bender, J.F.; De Long, S.E.; Kidd, W.S.F.; Low, P.J.; Güner, Y.; Saroglu, F.; Yilmaz, Y.; Moorbath, S.; Mitchell, J.G. Genesis of collision volcanism in Eastern Anatolia, Turkey. J. Volcanol. Geotherm. Res. 1990, 44, 189–229. [Google Scholar] [CrossRef]
- Koulakov, I.; Zabelina, I.; Amanatashvili, I.; Meskhia, V. Nature of orogenesis and volcanism in the Caucasus region based on results of regional tomography. Solid Earth 2012, 3, 327–337. [Google Scholar] [CrossRef]
- Zabelina, I.; Koulakov, I.; Amanatashvili, I.; El Khrepy, S.; Al-Arifi, N. Seismic structure of the crust and uppermost mantle beneath Caucasus based on regional earthquake tomography. J. Asian Earth Sci. 2016, 119, 87–99. [Google Scholar] [CrossRef]
- Zor, E. Tomographic evidence of slab detachment beneath eastern Turkey and the Caucasus. Geophys. J. Int. 2008, 175, 1273–1282. [Google Scholar] [CrossRef]
- Lei, J.; Zhao, D. Teleseismic evidence for a break-off subducting slab under Eastern Turkey. Earth Planet. Sci. Lett. 2007, 257, 14–28. [Google Scholar] [CrossRef]
- Portner, D.E.; Delph, J.R.; Berk Biryol, C.; Beck, S.L.; Zandt, G.; Özacar, A.A.; Sandvol, E.; Türkelli, N. Subduction termination through progressive slab deformation across Eastern Mediterranean subduction zones from updated P-wave tomography beneath Anatolia. Geosphere 2018, 14, 907–925. [Google Scholar] [CrossRef]
- Kaban, M.K.; Petrunin, A.G.; El Khrepy, S.; Al-Arifi, N. Diverse Continental Subduction Scenarios Along the Arabia-Eurasia Collision Zone. Geophys. Res. Lett. 2018, 45, 6898–6906. [Google Scholar] [CrossRef]
- Al-Lazki, A.I.; Seber, D.; Sandvol, E.; Turkelli, N.; Mohamad, R.; Barazangi, M. Tomographic Pn velocity and anisotropy structure beneath the Anatolian plateau (eastern Turkey) and the surrounding regions. Geophys. Res. Lett. 2003, 30, 4–7. [Google Scholar] [CrossRef]
- Maggi, A.; Priestley, K. Surface waveform tomography of the Turkish-Iranian plateau. Geophys. J. Int. 2005, 160, 1068–1080. [Google Scholar] [CrossRef]
- Salah, M.K.; Şahin, Ş.; Topatan, U. Crustal velocity and Vp/Vs structures beneath central Anatolia from local seismic tomography. Arab. J. Geosci. 2014, 7, 4101–4118. [Google Scholar] [CrossRef]
- Warren, L.M.; Beck, S.L.; Biryol, C.B.; Ozacar, A.A.; Yang, Y. Crustal velocity structure of Central and Eastern Turkey from ambient noise tomography. Geophys. J. Int. 2013, 194, 1941–1954. [Google Scholar] [CrossRef]
- Salaün, G.; Pedersen, H.A.; Paul, A.; Farra, V.; Karabulut, H.; Hatzfeld, D.; Papazachos, C.; Childs, D.M.; Pequegnat, C.; Afacan, T.; et al. High-resolution surface wave tomography beneath the Aegean-Anatolia region: Constraints on upper-mantle structure. Geophys. J. Int. 2012, 190, 406–420. [Google Scholar] [CrossRef]
- Angus, D.A.; Wilson, D.C.; Sandvol, E.; Ni, J.F. Lithospheric structure of the Arabian and Eurasian collision zone in eastern Turkey from S-wave receiver functions. Geophys. J. Int. 2006, 166, 1335–1346. [Google Scholar] [CrossRef]
- Salah, M.K.; Şahin, Ş.; Aydin, U. Seismic velocity and Poisson’s ratio tomography of the crust beneath East Anatolia. J. Asian Earth Sci. 2011, 40, 746–761. [Google Scholar] [CrossRef]
- Koulakov, I.; Bindi, D.; Parolai, S.; Grosser, H.; Milkereit, C. Distribution of seismic velocities and attenuation in the crust beneath the North Anatolian fault (Turkey) from local earthquake tomography. Bull. Seismol. Soc. Am. 2010, 100, 207–224. [Google Scholar] [CrossRef]
- Kaypak, B. Three-dimensional VP and VP/VS structure of the upper crust in the Erzincan basin (eastern Turkey). J. Geophys. Res. Solid Earth 2008, 113. [Google Scholar] [CrossRef]
- Yolsal-Çevikbilen, S.; Biryol, C.B.; Beck, S.; Zandt, G.; Taymaz, T.; Adiyaman, H.E.; Özacar, A.A. 3-D crustal structure along the North Anatolian Fault Zone in north-central Anatolia revealed by local earthquake tomography. Geophys. J. Int. 2012, 188, 819–849. [Google Scholar] [CrossRef]
- Karabulut, H.; Özalaybey, S.; Taymaz, T.; Aktar, M.; Selvi, O.; Kocaoǧlu, A. A tomographic image of the shallow crustal structure in the Eastern Marmara. Geophys. Res. Lett. 2003, 30, 1–4. [Google Scholar] [CrossRef]
- Polat, G.; Özel, N.M.; Koulakov, I. Investigating P-and S-wave velocity structure beneath the Marmara region (Turkey) and the surrounding area from local earthquake tomography. Earth Planets Sp. 2016, 68, 1–14. [Google Scholar] [CrossRef]
- Gökalp, H. Tomographic Imaging of the Seismic Structure Beneath the East Anatolian Plateau, Eastern Turkey. Pure Appl. Geophys. 2012, 169, 1749–1776. [Google Scholar] [CrossRef]
- Koulakov, I. LOTOS code for local earthquake tomographic inversion: Benchmarks for testing tomographic algorithms. Bull. Seismol. Soc. Am. 2009, 99, 194–214. [Google Scholar] [CrossRef]
- Zabelina, I.V.; Koulakov, I.Y.; Buslov, M.M. Deep mechanisms in the Kyrgyz Tien Shan orogen (from results of seismic tomography). Russ. Geol. Geophys. 2013, 54, 695–706. [Google Scholar] [CrossRef]
- Sychev, I.V.; Koulakov, I.; Sycheva, N.A.; Koptev, A.; Medved, I.; El Khrepy, S.; Al-Arifi, N. Collisional Processes in the Crust of the Northern Tien Shan Inferred From Velocity and Attenuation Tomography Studies. J. Geophys. Res. Solid Earth 2018, 123, 1752–1769. [Google Scholar] [CrossRef]
- Koulakov, I.; Gerya, T.; Rastogi, B.K.; Jakovlev, A.; Medved, I.; Kayal, J.R.; El Khrepy, S.; Al-Arifi, N. Growth of mountain belts in central Asia triggers a new collision zone in central India. Sci. Rep. 2018, 8, 1–8. [Google Scholar] [CrossRef] [PubMed]
- Koulakov, I.; Jakovlev, A.; Zabelina, I.; Roure, F.; Cloetingh, S.; El Khrepy, S.; Al-Arifi, N. Subduction or delamination beneath the Apennines? Evidence from regional tomography. Solid Earth 2015, 6, 669–679. [Google Scholar] [CrossRef]
- Um, J.; Thurber, C.A. Fast algorithm for two-point seismic ray tracing. Bull. Seismol. Soc. Am. 1987, 77, 972–986. [Google Scholar]
- Paige, C.C.; Saunders, M.A. LSQR: An algorithm for sparse linear equations and sparse least squares. ACM Trans. Math. Softw. 1982, 8, 43–71. [Google Scholar] [CrossRef]
- Nolet, G. Seismic wave propagation and seismic tomography. Seism. Tomogr. 1987, 1–23. Available online: https://link.springer.com/chapter/10.1007%2F978-94-009-3899-1_1 (accessed on 14 February 2021).
- Çivgin, B.; Kaypak, B. Estimation of the crustal structure in Central Anatolia (Turkey) using receiver functions. Turk. J. Earth Sci. 2017, 26, 314–330. [Google Scholar] [CrossRef]
- Oruç, B.; Gomez-Ortiz, D.; Petit, C. Lithospheric flexural strength and effective elastic thicknesses of the Eastern Anatolia (Turkey) and surrounding region. J. Asian Earth Sci. 2017, 150, 1–13. [Google Scholar] [CrossRef]
Publisher’s Note: MDPI stays neutral with regard to jurisdictional claims in published maps and institutional affiliations. |
© 2021 by the authors. Licensee MDPI, Basel, Switzerland. This article is an open access article distributed under the terms and conditions of the Creative Commons Attribution (CC BY) license (http://creativecommons.org/licenses/by/4.0/).