Article

Case Study of a Heavily Damaged Building during the 2016 MW 7.8 Ecuador Earthquake: Directionality Effects in Seismic Actions and Damage Assessment

Department of Civil and Environmental Engineering, Universitat Politècnica de Catalunya, 08034 Barcelona, Spain
*
Author to whom correspondence should be addressed.
Geosciences 2021, 11(2), 74; https://doi.org/10.3390/geosciences11020074
Submission received: 23 December 2020 / Revised: 2 February 2021 / Accepted: 4 February 2021 / Published: 9 February 2021
(This article belongs to the Special Issue Engineering Analysis of Near-Source Strong Ground Motion)

Abstract

:
In this work, the directionality effects during the MW 7.8 earthquake, which occurred in Muisne (Ecuador) on 16 April 2016, were analyzed under two perspectives. The first one deals with the influence of these effects on seismic intensity measures (IMs), while the second refers to the assessment of the expected damage of a specific building located in Manta city, Ecuador, as a function of its azimuthal orientation. The records of strong motion in 21 accelerometric stations were used to analyze directionality in seismic actions. At the closest station to the epicenter (RRup = 20 km), the peak ground acceleration was 1380 cm/s2 (EW component of the APED station). A detailed study of the response spectra ratifies the importance of directionality and confirms the need to consider these effects in seismic hazard studies. Differences between IMs values that consider the directionality and those obtained from the as-recorded accelerograms are significant and they agree with studies carried out in other regions. Concerning the variation of the expected damage with respect to the building orientation, a reinforced concrete building, which was seriously affected by the earthquake, was taken as a case study. For this analysis, the accelerograms recorded at a nearby station and detailed structural documentation were used. The ETABS software was used for the structural analysis. Modal and pushover analyses were performed, obtaining capacity curves and capacity spectra in the two main axes of the building. Two advanced methods for damage assessment were used to obtain fragility and mean damage state curves. The performance points were obtained through the linear equivalent approximation. This allows estimation and analysis of the expected mean damage state and the probability of complete damage as functions of the building orientation. Results show that the actual probability of complete damage is close to 60%. This fact is mainly due to the greater severity of the seismic action in one of the two main axes of the building. The results are in accordance with the damage produced by the earthquake in the building and confirm the need to consider the directionality effects in damage and seismic risk assessments.

1. Introduction

On 16 April 2016, an earthquake with moment magnitude, MW, 7.8, struck the north-western coast of Ecuador at 6:58 pm. (UTC-5, local time). The epicenter was located near the town of Muisne, 170 km northwest from Quito. Although the epicenter was in a remote rural area, several towns in the coastal provinces were affected due to their high intensity. The earthquake occurred at a 20-km depth as a result of the relative displacement between the Nazca plate and the South American plate, through a subduction process [1]. This process has generated catastrophic events in South America throughout the contact zone between these two plates, repeatedly, affecting Chile, Peru, and Ecuador [2].
During the 2016 Ecuador earthquake, around 700 deceased were reported, and thousands of buildings and structures suffered damage. The most affected areas were the provinces of Manabí, Esmeraldas, Santa Elena, Guayas, Santo Domingo, and Los Ríos, where the government declared a state of emergency. The canton of Pedernal, in the province of Manabí, was declared a disaster zone. This confirms the need for increasing the efforts in the knowledge of this natural phenomenon, providing advanced tools to improve the assessment of the seismic hazard, and, particularly, the seismic risk management in urban environments [3]. These facts suggest being more critical in the design of future structures and focus on a better understanding of the seismic hazard of the region. For this reason, it is necessary to develop new seismic hazard studies to update the seismic code of the country.
One interesting topic regarding the seismic hazard and the damage assessment is the one related to directionality effects. Directionality-related issues have been investigated in two areas: (i) in seismic hazard studies and (ii) in the expected structural performance [4,5,6,7]. The first one focuses on the influence of the sensor’s orientation on the ground motion records of an earthquake. Whereby, it is possible to estimate intensity measures (IMs) that consider the orientation of the sensor, directly influencing the development of new ground motion prediction equations (GMPEs). These kinds of IMs help to reduce the epistemic uncertainty involved in the development of seismic hazard studies. In the second point, the variation of structural damage is studied with respect to the incidence angle of the seismic action to the structure.
In this research, both aspects were studied based on data from the Ecuador earthquake of 16 April 2016. Here, we analyzed the effects of directionality on the seismic action, estimating IMs independent of the orientation of the sensor, and defining the variability of the action through these effects. The accelerograms recorded by the National Acelerographic Network of Ecuador (RENAC for its acronym in Spanish) were used. The available 21 ground motions pairs (only horizontal components) were selected. Sensor orientation-independent IMs [6,8,9] were estimated for both the peak ground acceleration (PGA) and the spectral response (Sa). These measures were compared with the traditional ones (e.g., the larger of the two as-recorded components and the geometric mean of the as-recorded components). Finally, the results were compared with those obtained by other authors, corresponding to other studies in other countries.
In addition, the expected damage of a reinforced concrete building located in the city of Manta (Ecuador) was studied according to its orientation with respect to the closest seismic action recorded. This building suffered complete damage during the 2016 earthquake (see Section 3.1.4 for more details on the definition of complete damage). The original construction plans were used to model the building. The well-known ETABS software [10] was used for this aim. The effects of directionality on seismic demand were considered to validate the damage suffered during the event. Non-linear static analysis, Pushover, and the parametric model developed by Pujades et al. [11] were used to obtain the fragility curves of the structure and subsequently estimate the expected damage with the performance point. Results indicate that for the actual orientation of the building, the probability of complete damage is close to 60%, thus corresponding with the damage suffered during the event.

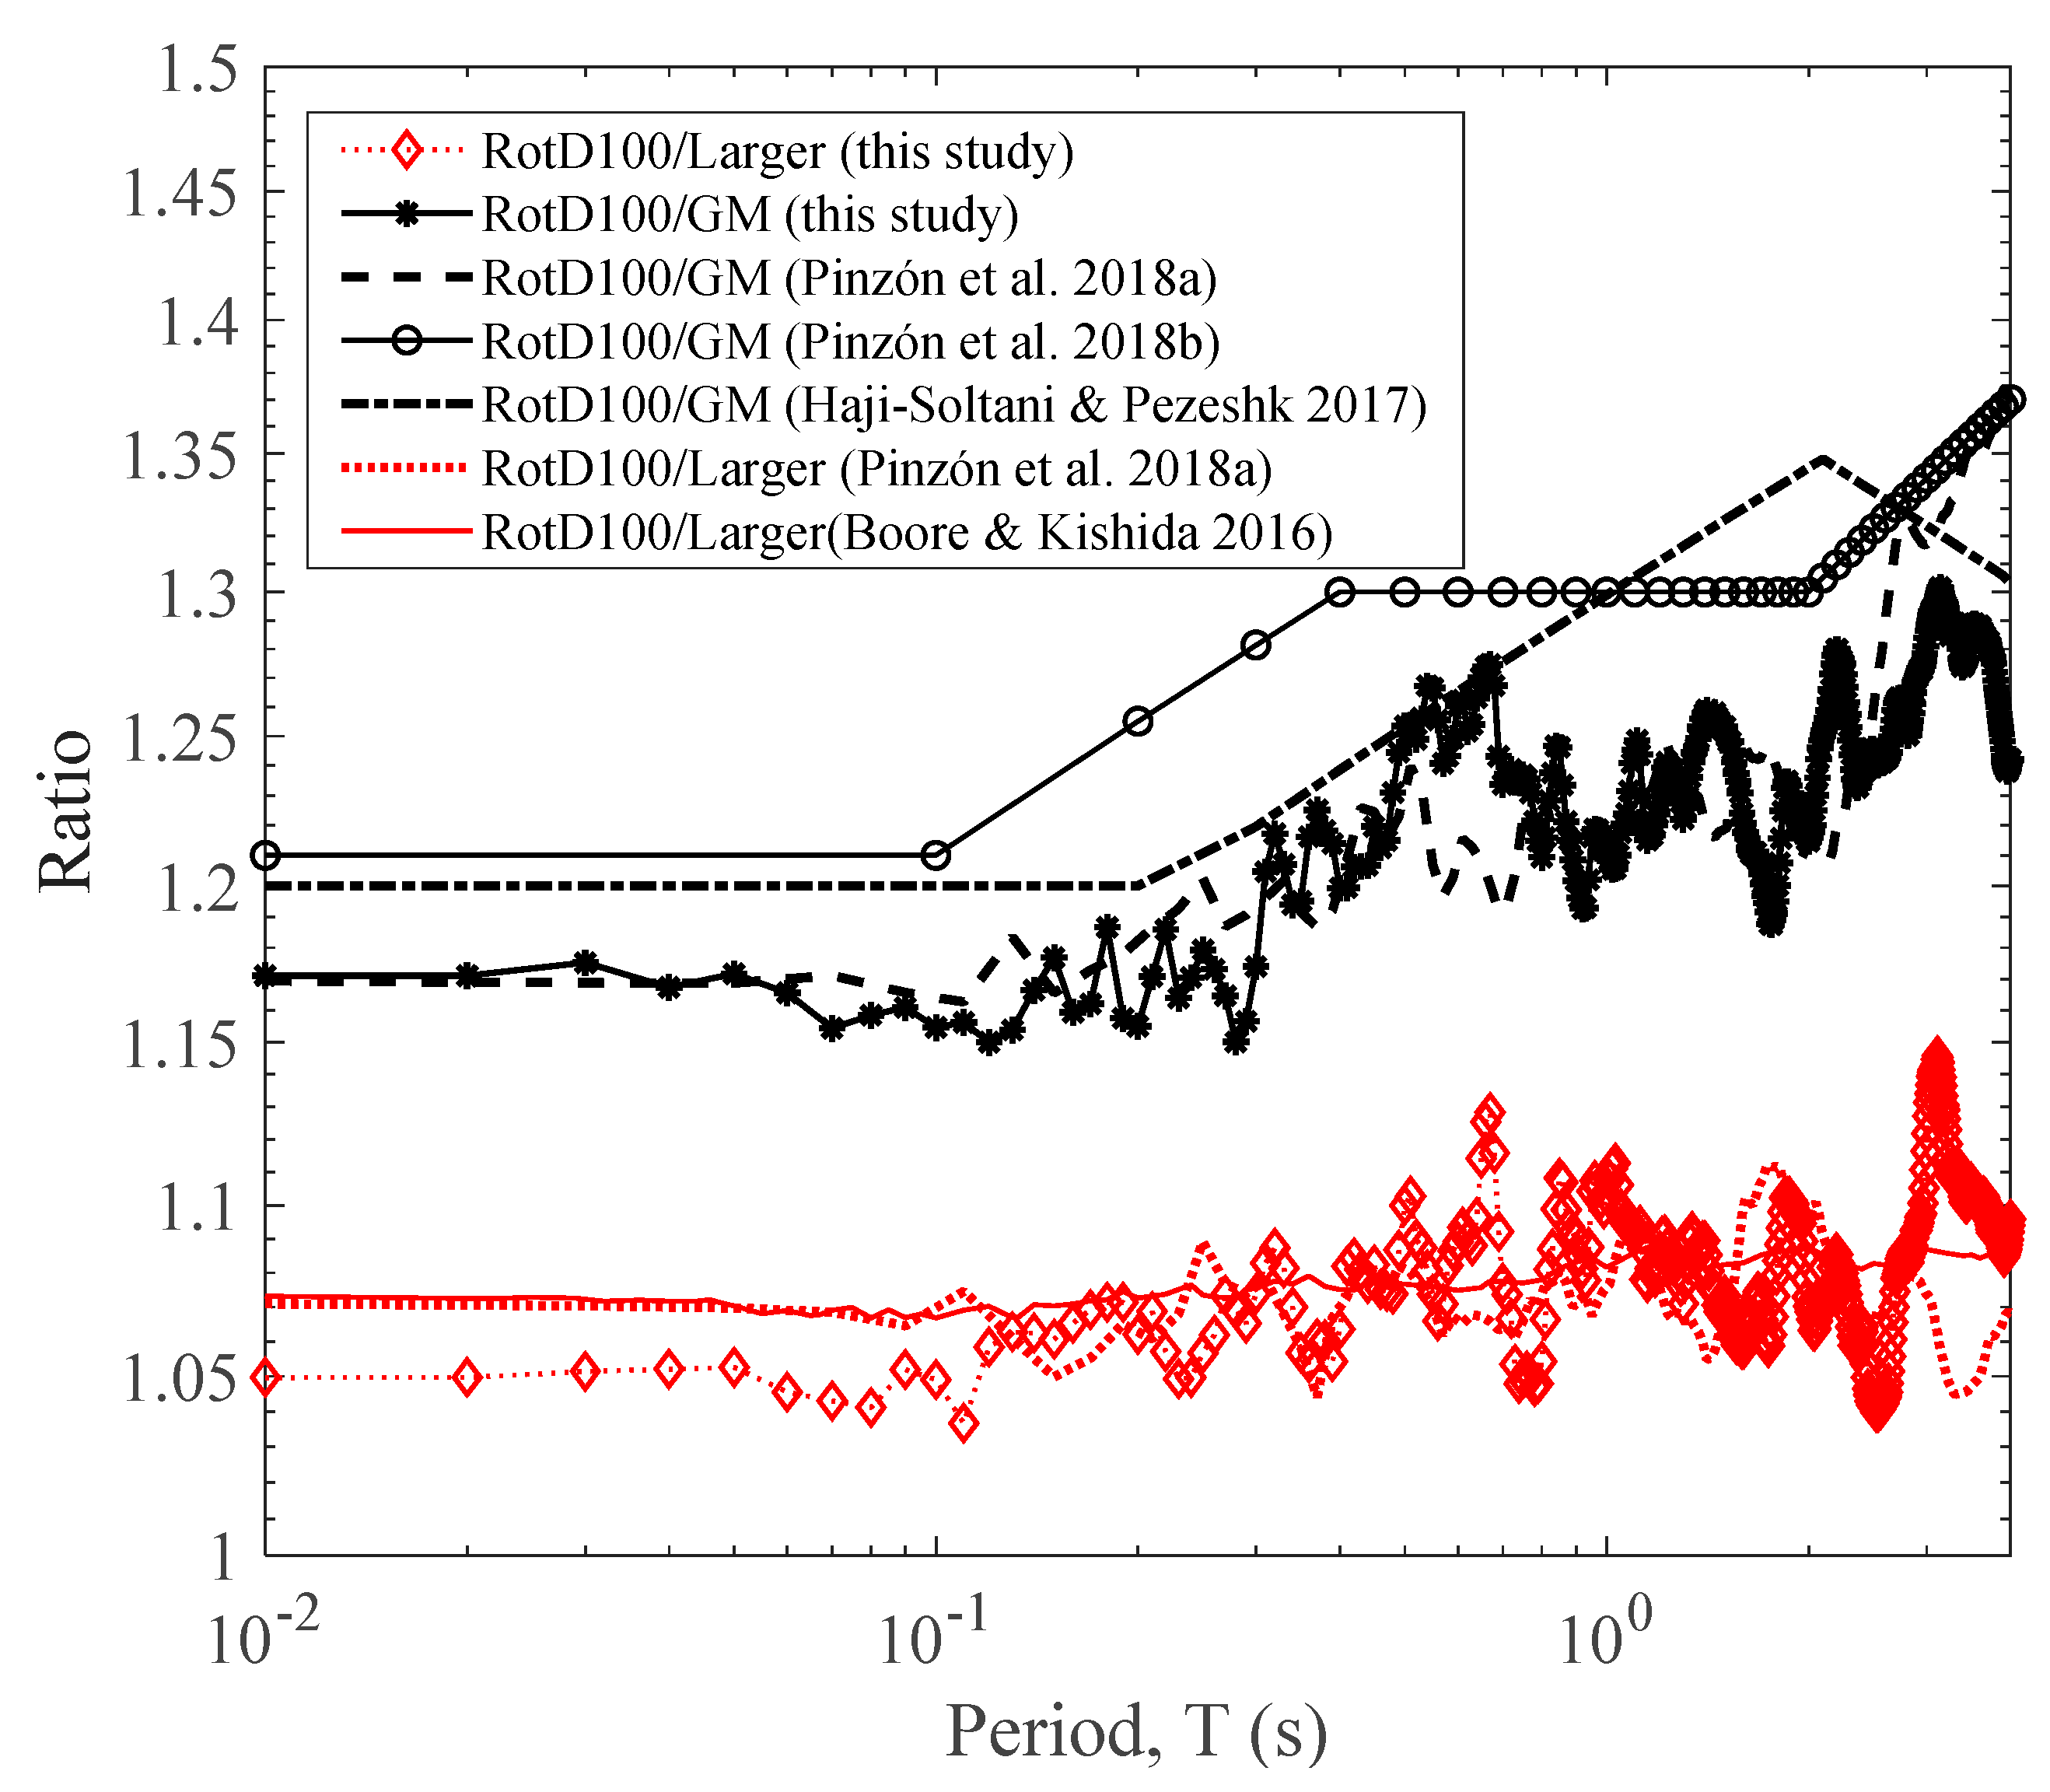
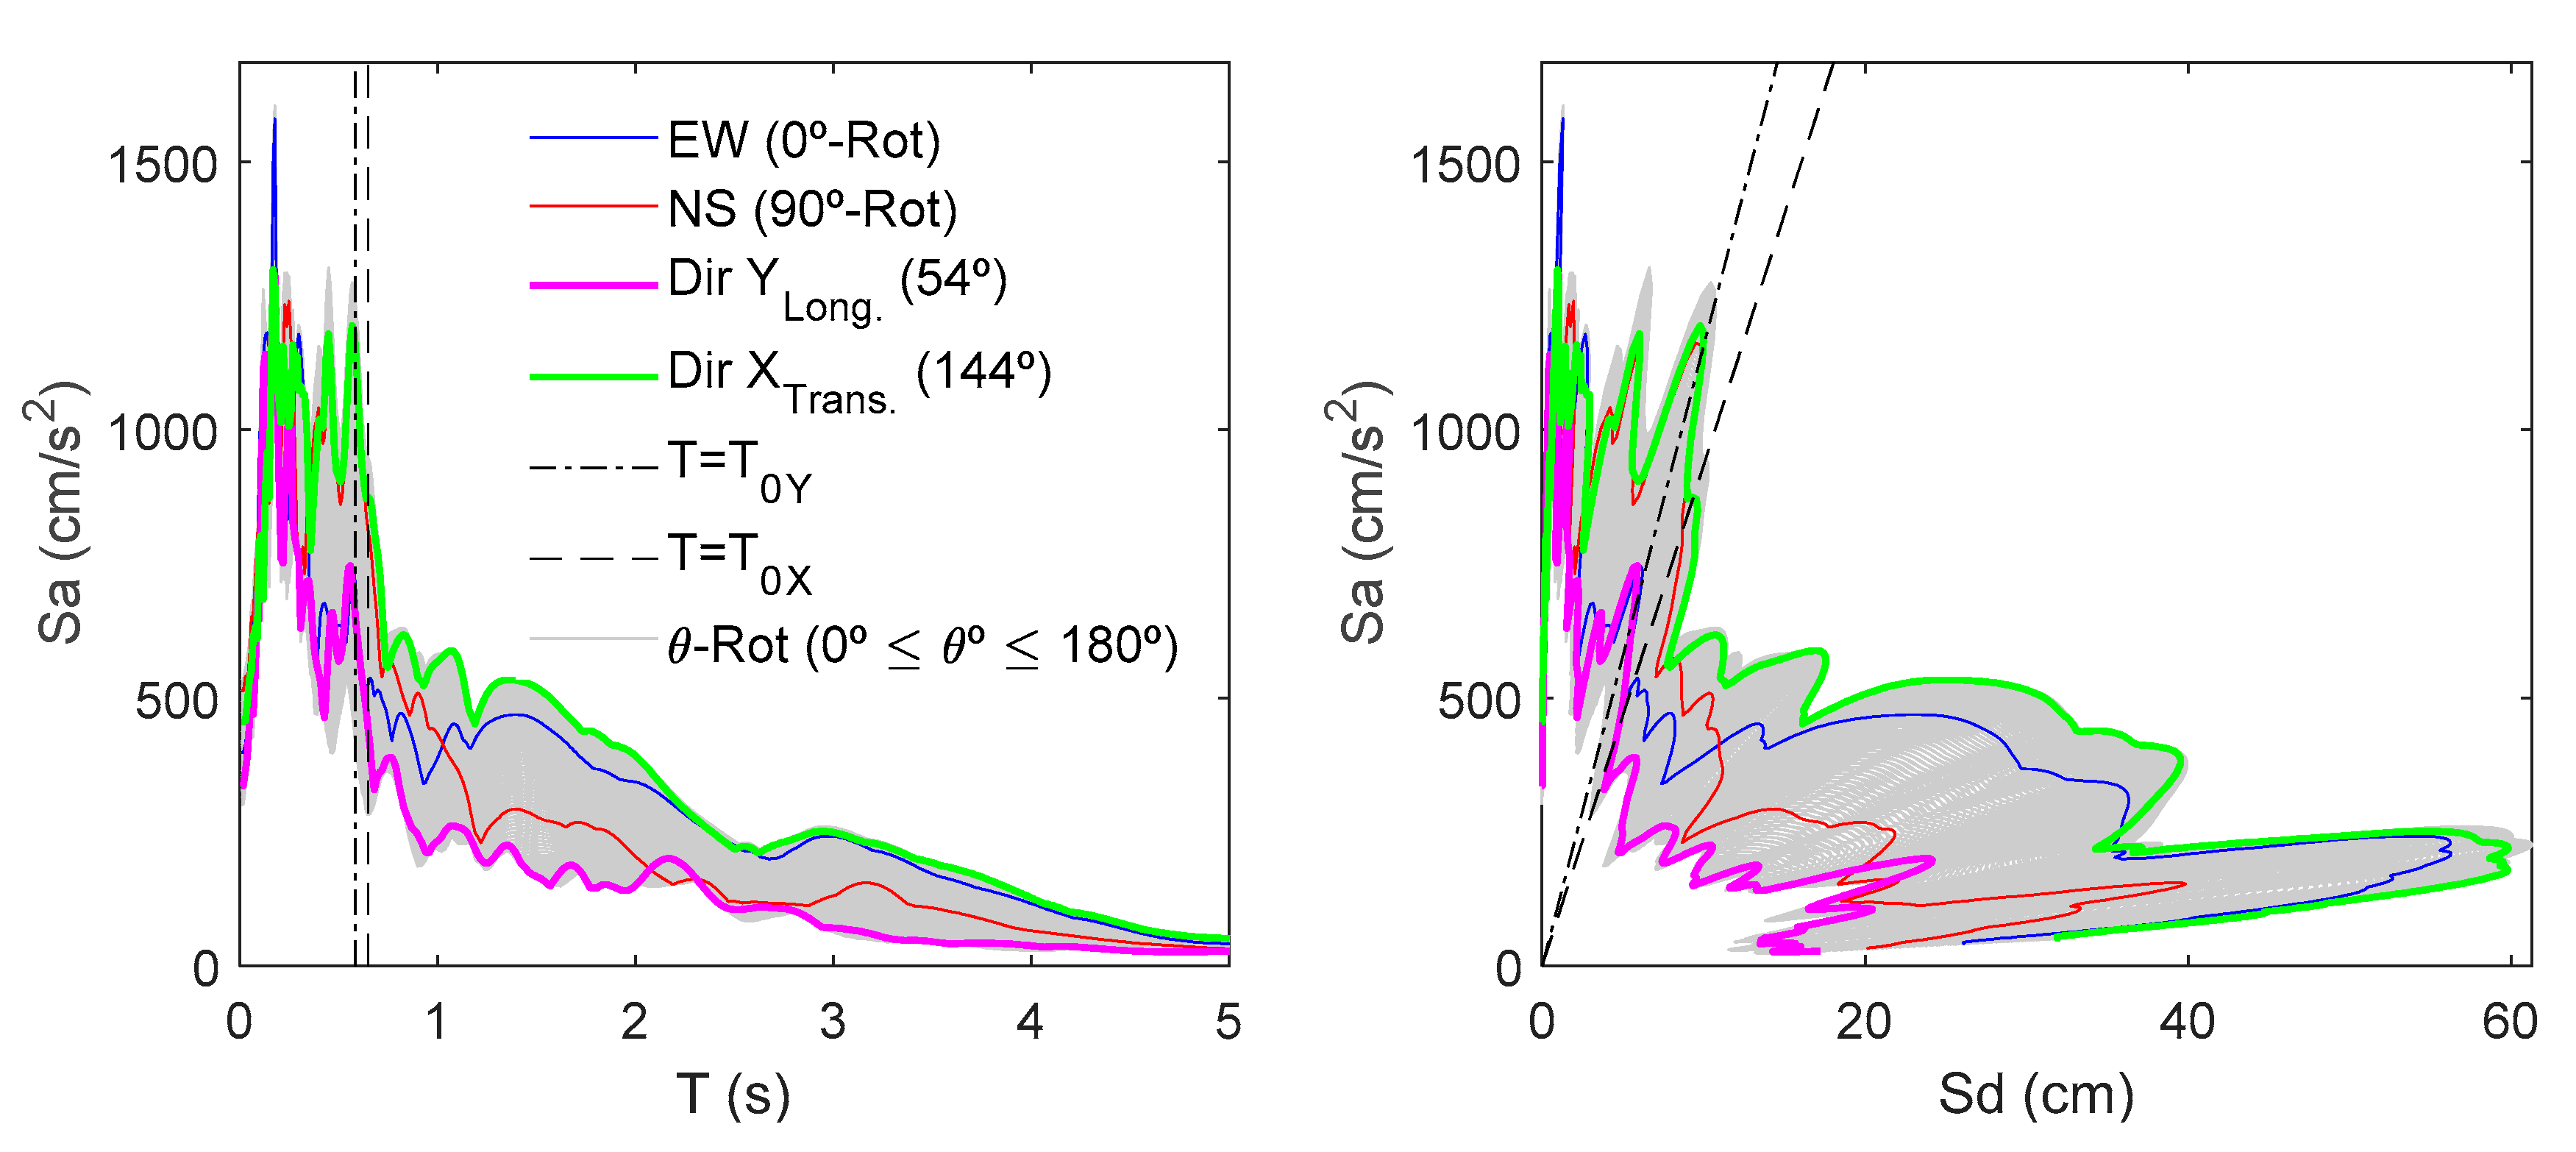
2. Part I: Directionality in the Seismic Action

2.1. Materials and Methods
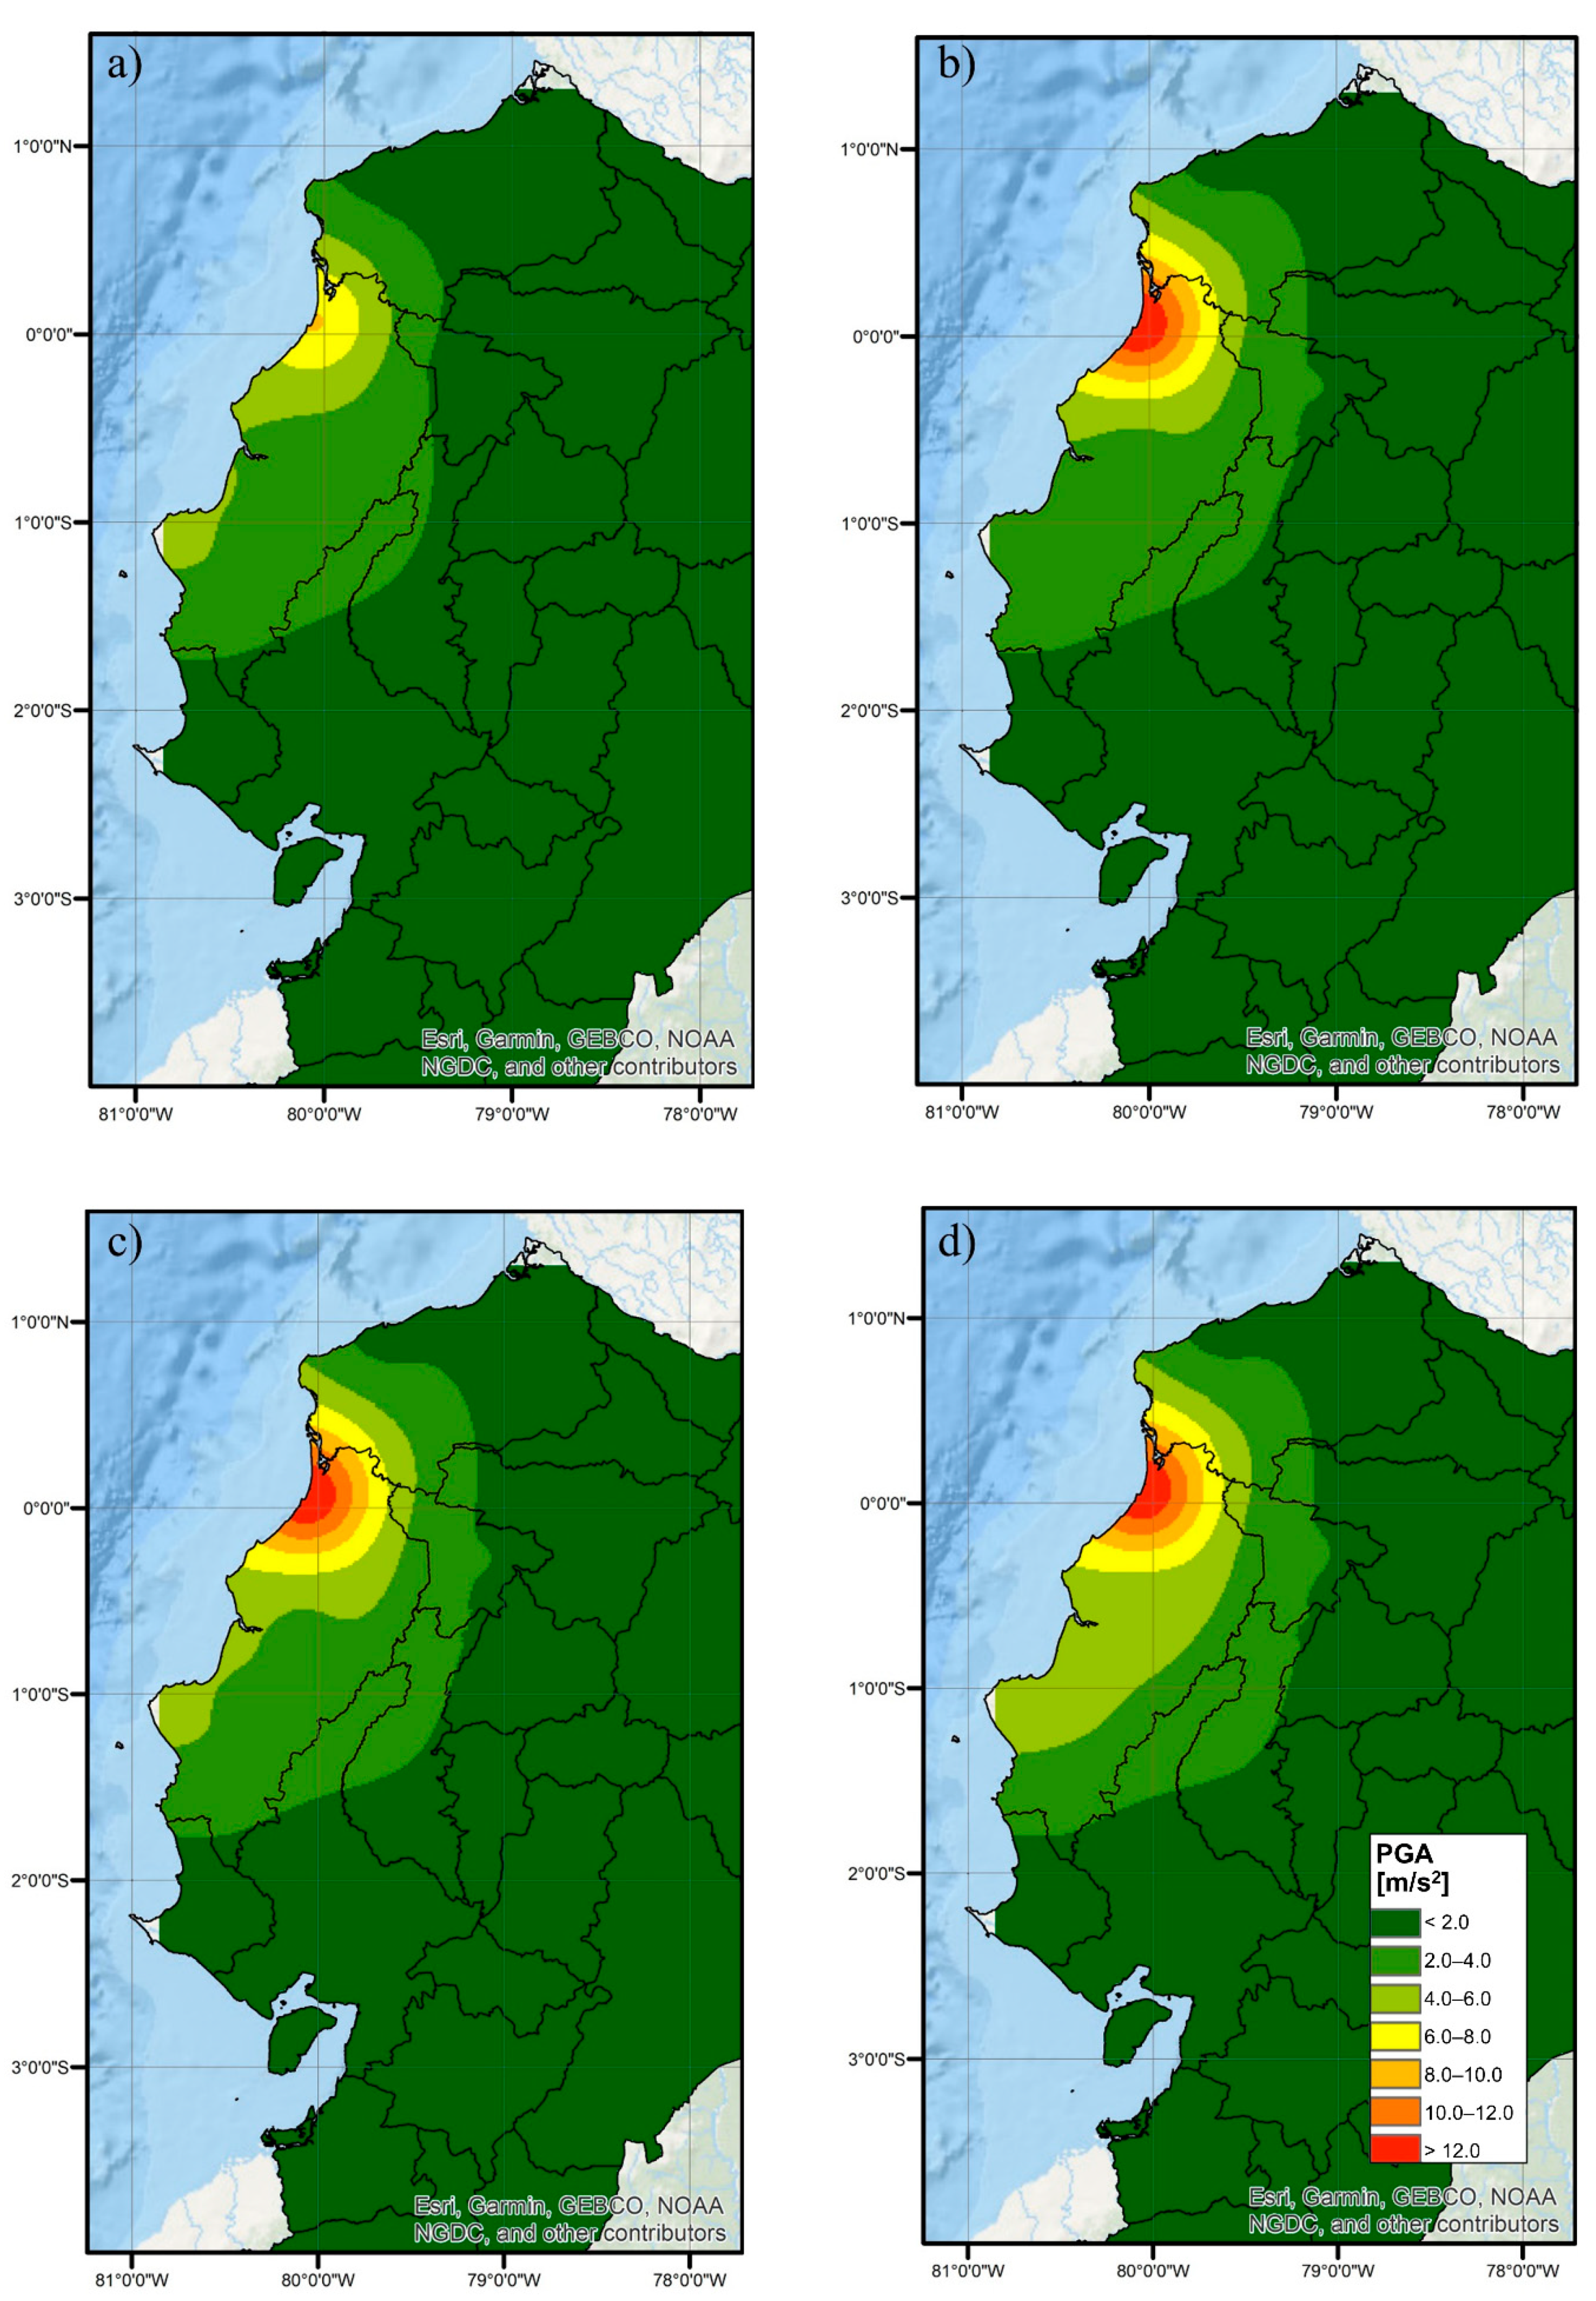
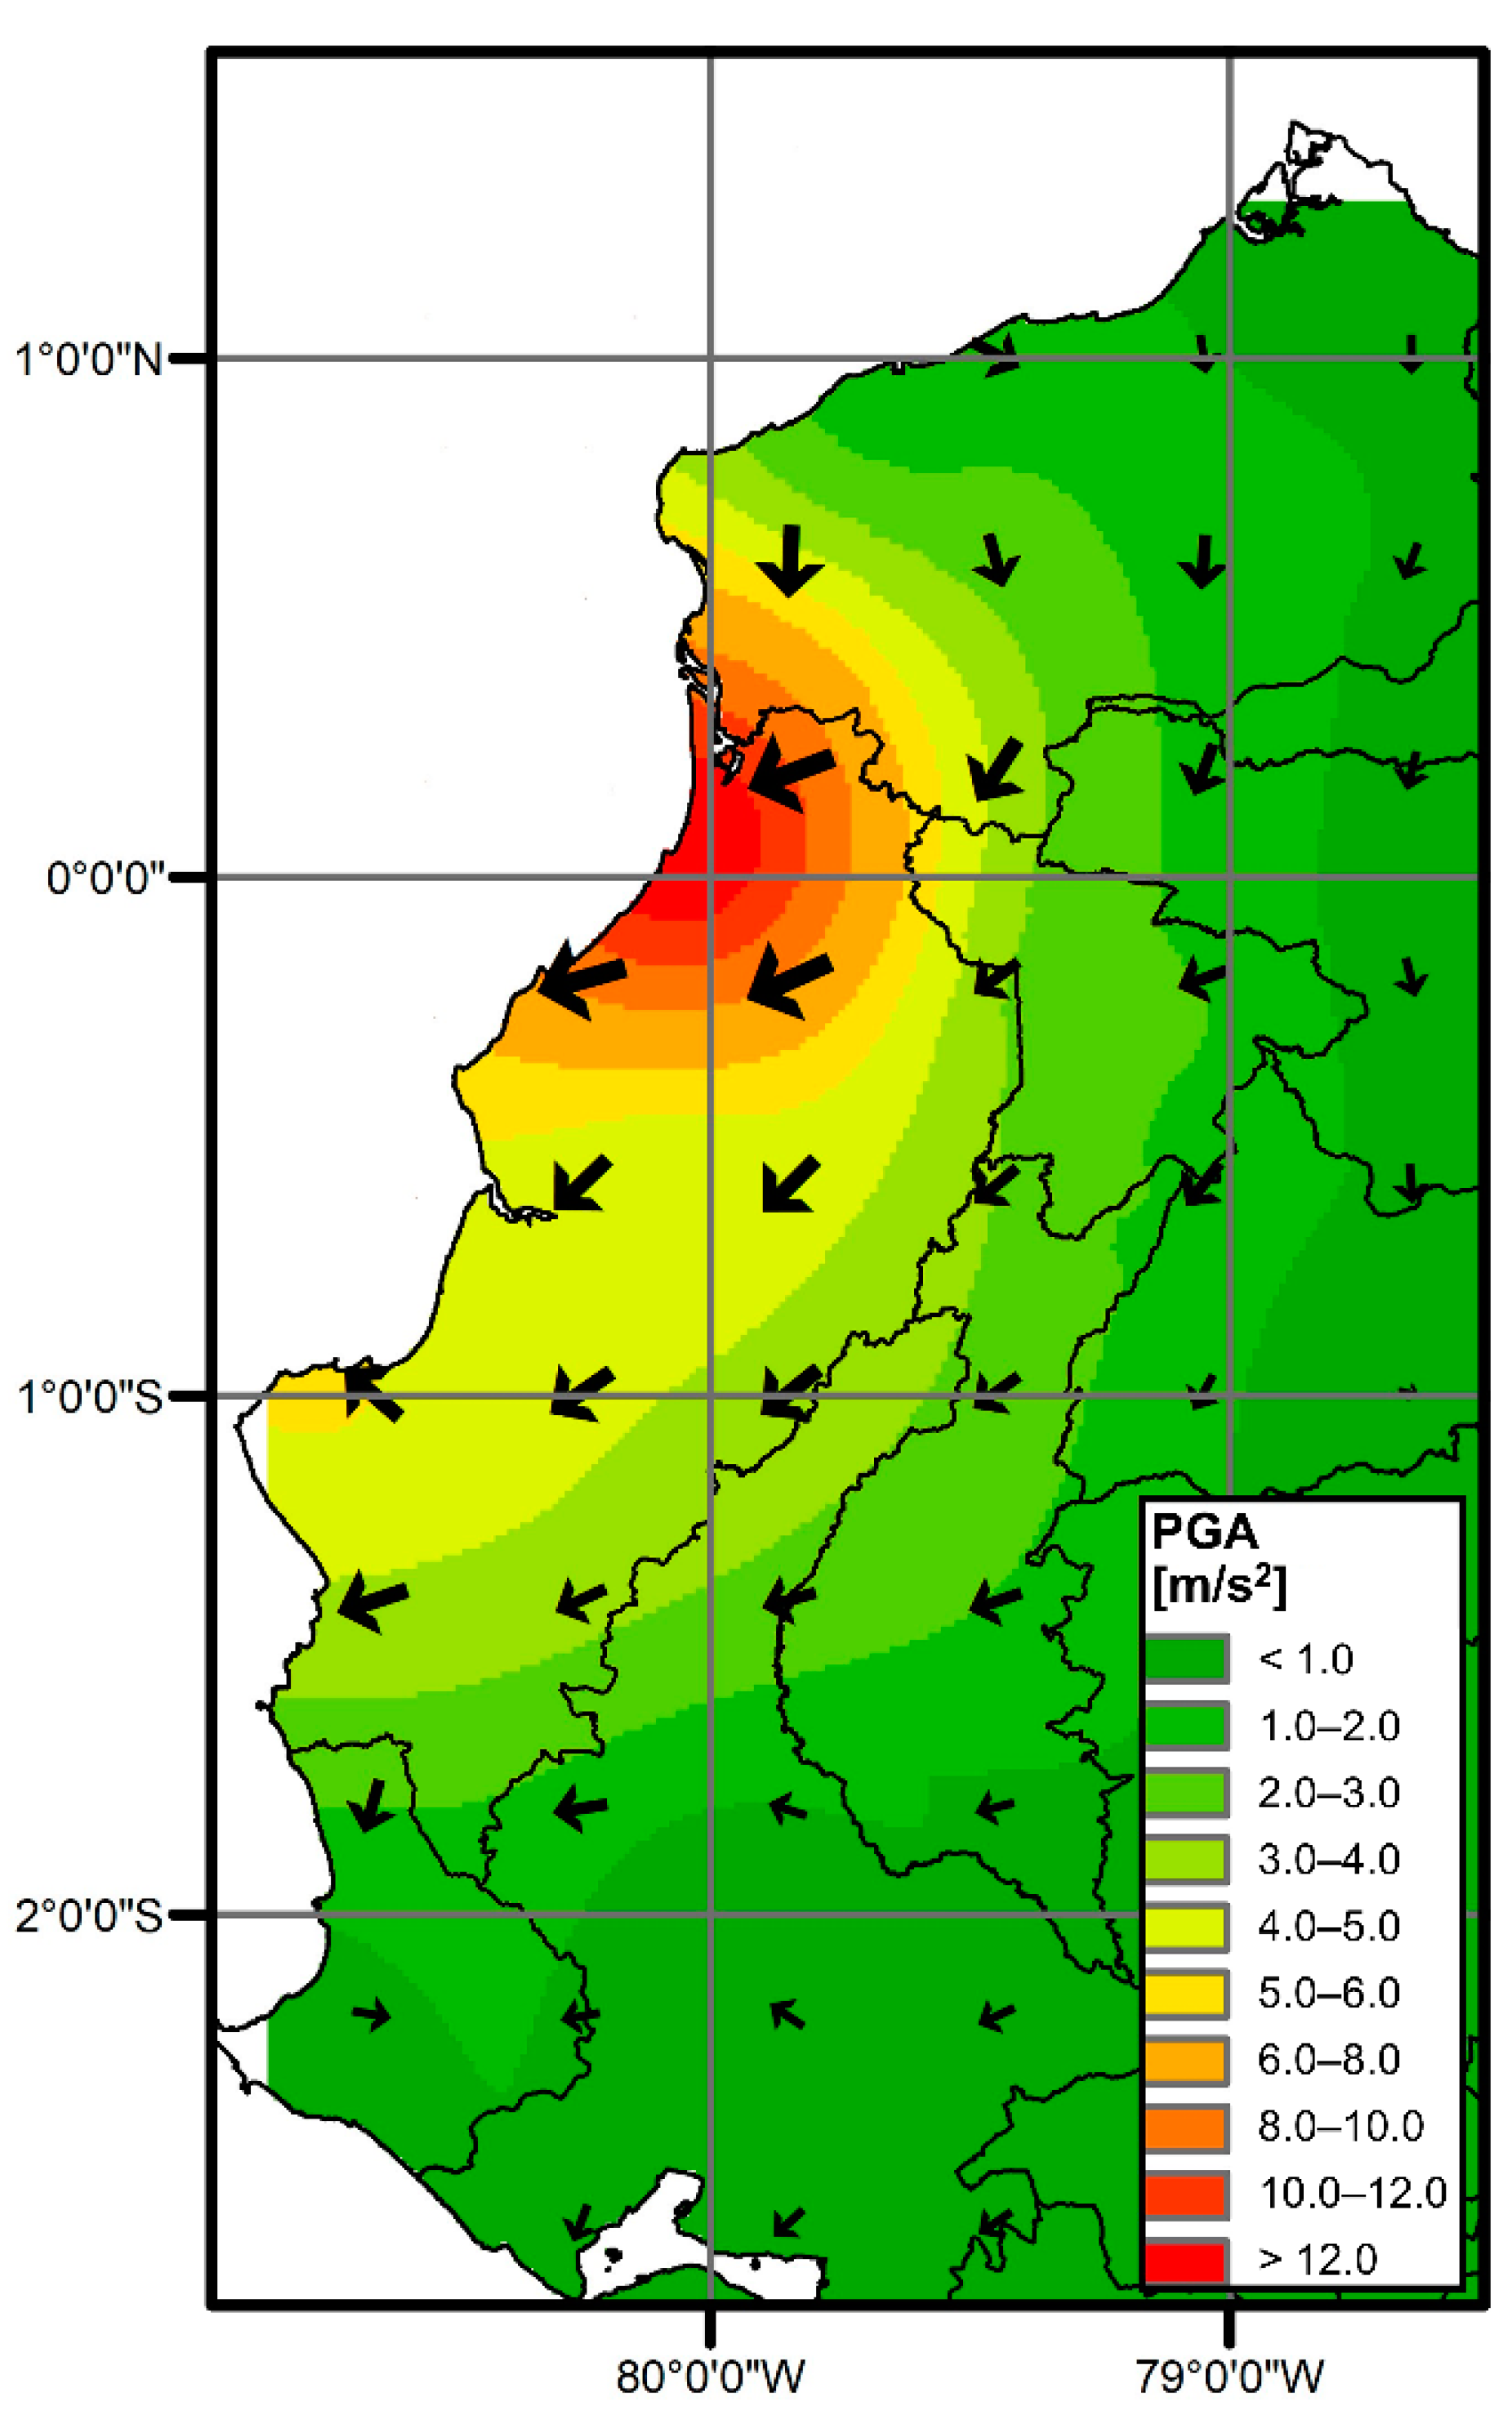
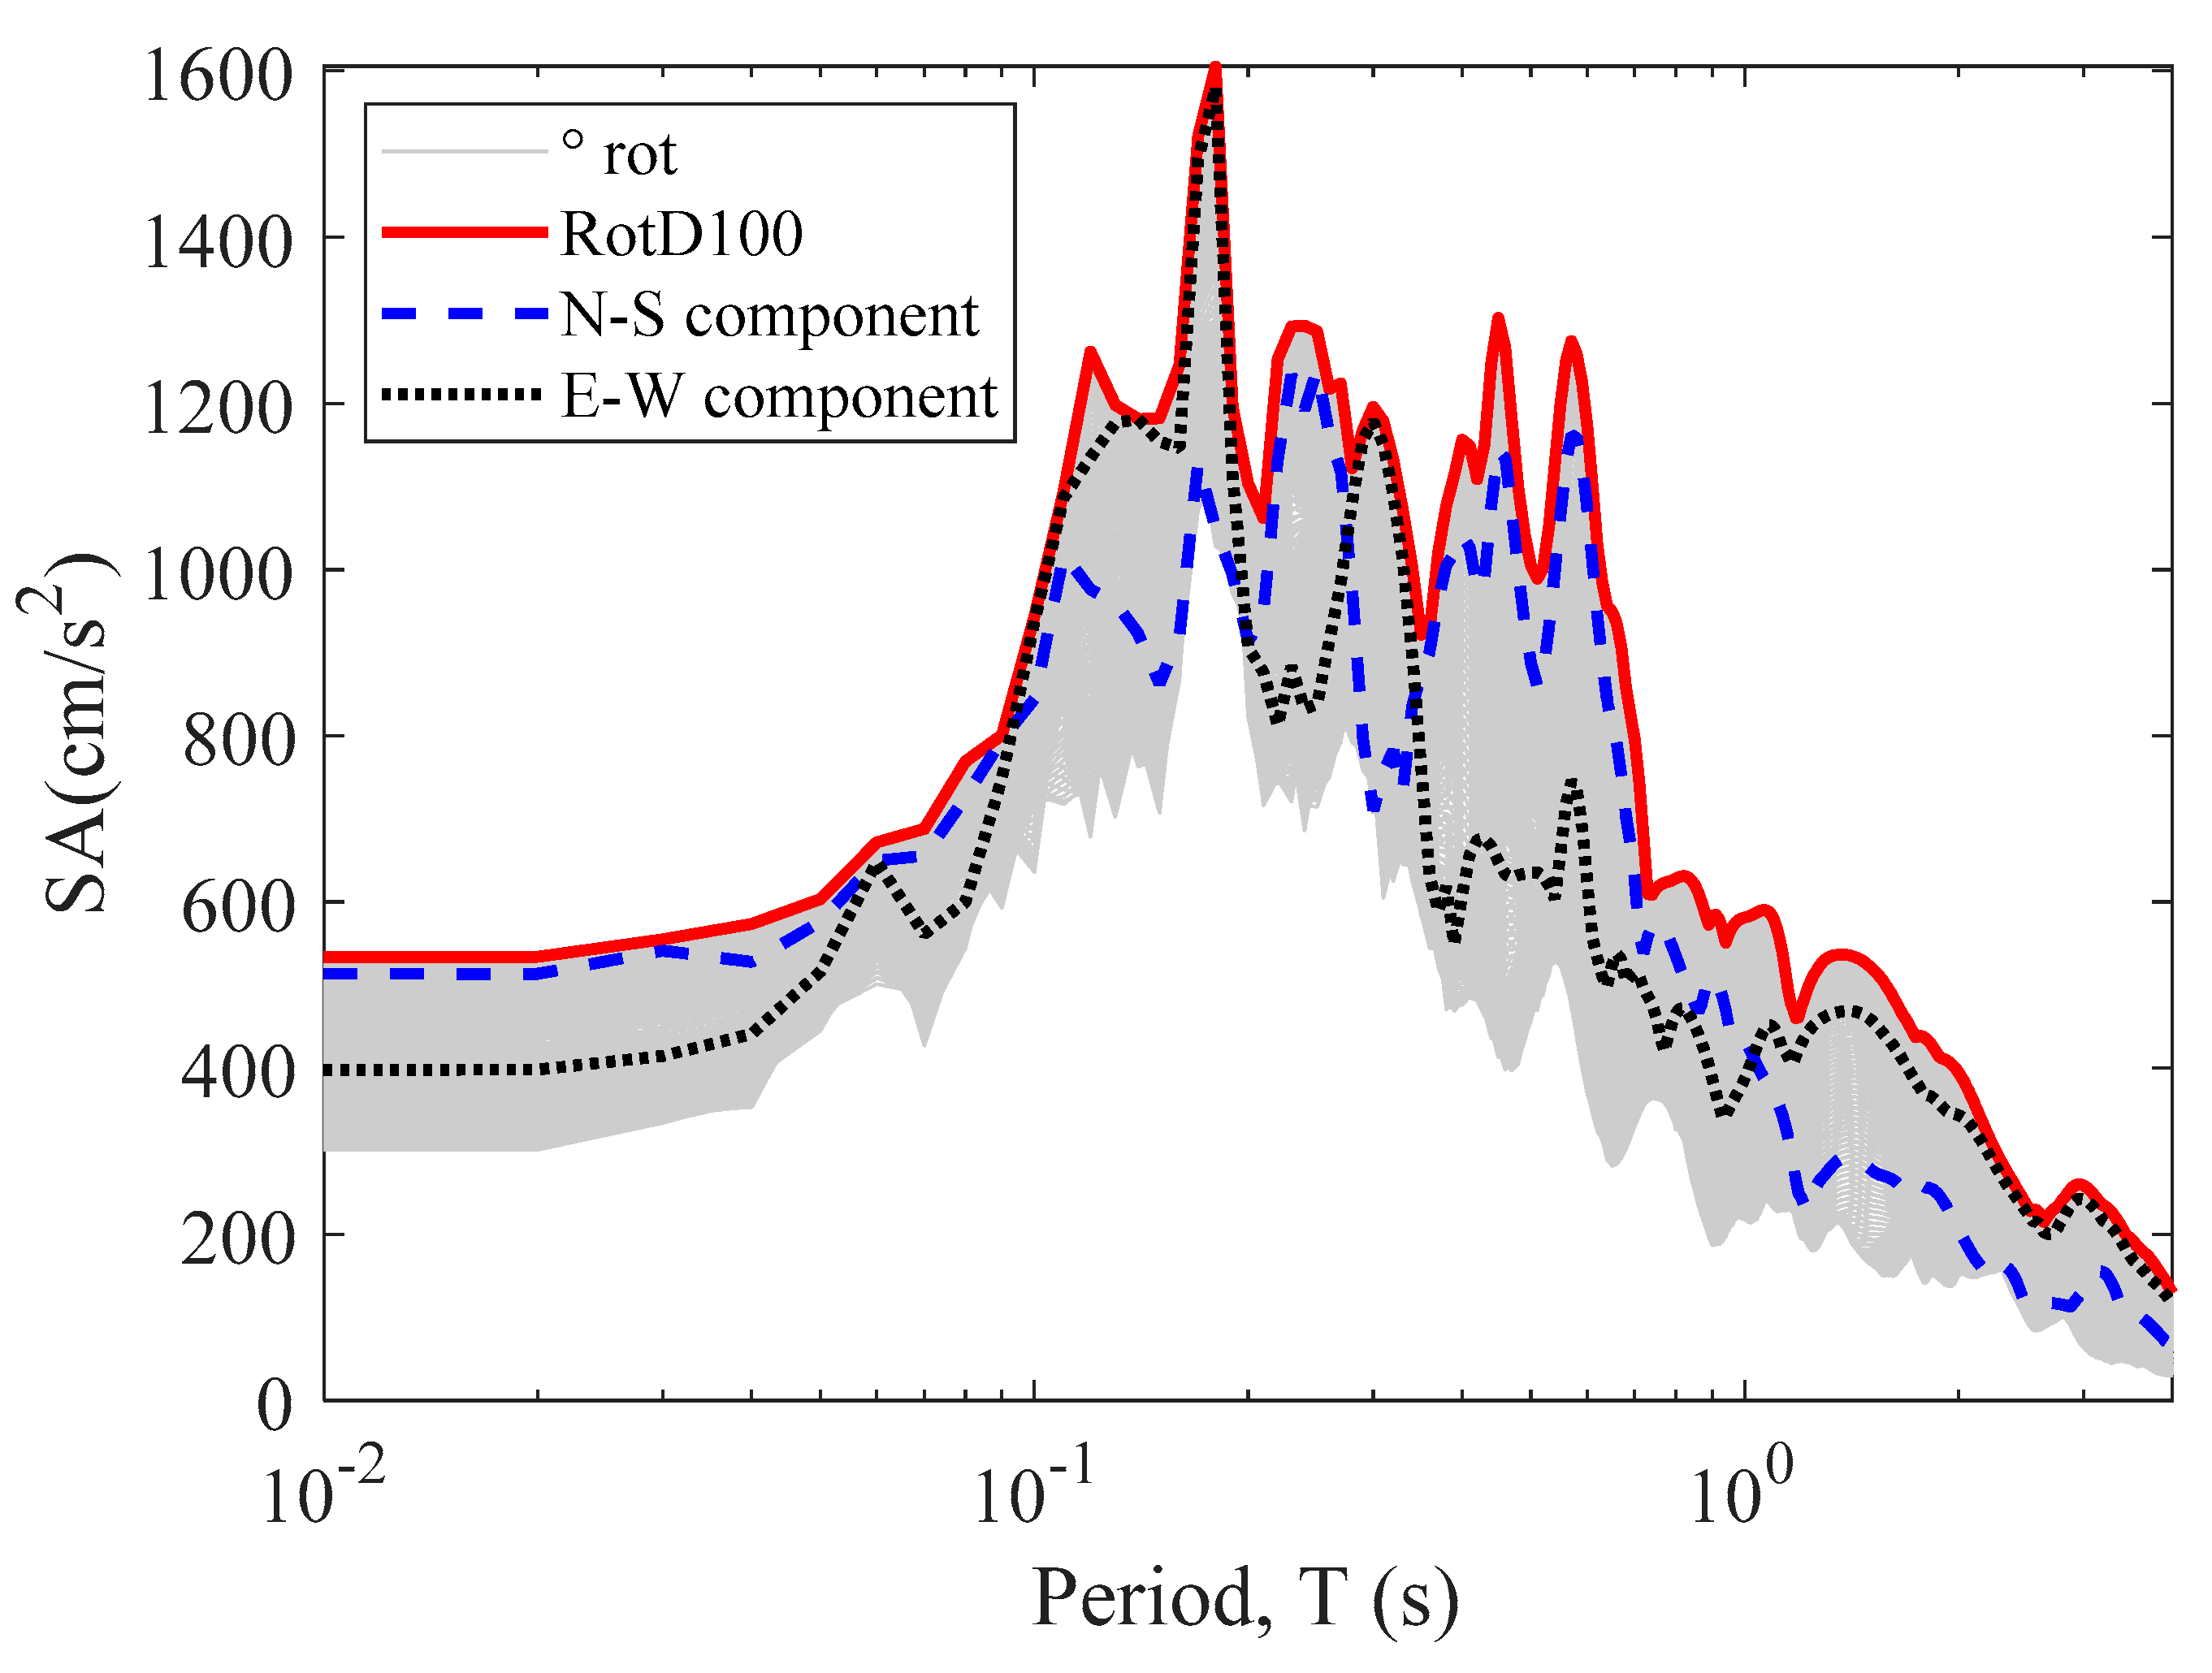
Normally, the peak ground acceleration (PGA) on the horizontal plane is estimated with the maximum value of the as-recorded acceleration components, accX and accY [PGAX and PGAY, see Equations (1) and (2)]. Then, a combination (e.g., geometric mean, PGAGM) or the larger value (PGALarger) of the PGA of the as-recorded components are commonly used as intensity measures in the development of ground motion prediction equations (GMPEs):
P G A X = m a x | a c c X ( t ) |
P G A Y = m a x | a c c Y ( t ) |
P G A G M = P G A X · P G A Y
P G A L a r g e r = m a x [ | a c c X ( t ) |   , | a c c Y ( t ) | ]
The fact is that the peak acceleration is rarely captured with the as-recorded components and, therefore, the true PGA occurs in an unknown intermediate angle. For this reason, the PGA is also estimated for the linear combinations of the as-recorded components for all the non-redundant angles, θ. The ground motions are rotated using linear combinations of the horizontal as-recorded components for a range [0, 180) with 1° increments of θ, according to the following equation:
a c c R O T ( t , θ ) = a c c X ( t ) · cos θ + a c c Y ( t ) · sin θ
where a c c X ( t ) and a c c Y ( t ) correspond to the as-recorded acceleration horizontal components, t is time, and θ is the rotation angle.
Then, the maximum value of the linear combinations represents the maximum PGA considering all the non-redundant angles. This PGA corresponds to the true maximum acceleration at the ground level and is called PGAmax herein. This PGA can also be obtained, in a simplified way, computing the maximum value of the Euclidean norm or the root-sum-of-squares of the as-recorded acceleration components (Equation (7)):
P G A m a x = m a x | a c c R O T ( t , θ ) | θ = [ 0 ,   180 )
P G A m a x = m a x [ a c c 1 ( t ) ] 2 + [ a c c 2 ( t ) ] 2
The orientation where the maximum ground acceleration (PGAmax) is produced is estimated through the following equation:
θ P G A ( m a x ) = tan 1 [ a c c N S ( t i ) a c c E W ( t i ) ]
where t i is the time instant where PGAmax occurs.
Regarding the spectral response (Sa), the RotDpp is a relatively new intensity measure that considers the directionality effects of earthquakes. Rot means rotated, D means period dependent, and pp means percentile. It was introduced by Boore [8] and has been used in the development of the newest GMPE (e.g., NGA-West2 and NGA-East projects). This IM is defined as the percentile values of the projection of the response spectra of the two as-recorded components rotated onto all non-redundant azimuths. Once obtained, the vector composition of the acceleration components for each rotation, using Equation (5), the acceleration response spectra with 5% of critical damping are computed; a single spectrum for each composition is obtained. Once the 180 spectra are obtained, the spectral values for a certain percentile are selected. The percentile 100th, RotD100, represents the maximum acceleration response for each oscillator period.
To evaluate the directionality effects of the 16 April 2016 earthquake, peak parameters are estimated with the ground-motion records from the RENAC network (Figure 1). A total of 21 ground-motion records are used.

2.2. Results

PGAX, PGAY, PGALarger, and PGAmax were computed for the 21 ground-motion records available. Since all the stations are oriented so that the horizontal components coincide with the east-west and north-south directions, the PGAX and PGAY are now called PGAEW and PGANS, respectively. Results are shown in Table 1. Acceleration maps for each measure (Figure 2) were georeferenced and interpolated from values presented in Table 1. In Figure 2a,b, maps with PGANS and PGAEW are presented. Clearly, PGAEW presents larger values when compared to PGANS. Figure 2c,d present the PGALarger and PGAmax results, respectively. Both variables show comparable results, but the PGAmax has greater accelerations, as can be seen in Table 1. The maximum as-recorded PGA was produced in the APED station with a value of 1380 cm/s2. At this station, the true maximum acceleration (PGAmax) was 1397 cm/s2. Notice that the stations ACH1, ACHN, ALIB, AOTA, and APO1 exhibit differences between PGAmax and PGALarger higher than 10%. This fact is interesting since we can underestimate the peak acceleration up to 20% (see station ACH1).
In Figure 3, a flow map representing the direction where the maximum acceleration occurred is presented. In general, maximum acceleration values were observed in the SW direction. Notice that this flow map shows similar patterns compared with the obtained coseismic slip measurements during the same event [12], and also compared with coseismic slips from other events that occurred in the same subduction zone (e.g., the 2015 MW 8.3 Illapel, Chile [13]; 2010 MW 8.8 Maule, Chile [14]). From our perspective, these patterns should be considered in the design of seismic resistant structures. For instance, in near-fault areas, orienting the strong axis of buildings in the direction normal to the fault may reduce the risk of suffering a higher seismic damage due to directionality or directivity effects.
In the case of the spectral response, Figure 4 shows a comparison between RotD100 and the response spectra from the as-recorded and the rotated components (between 0° and 179° with increments of 1°). To compare the intensity measures based on Sa, the ratios between the as-recorded components (N-S and E-W), the geometric mean of the as-recorded components (GM), the larger of the two as-recorded components (Larger), and the RotD100 were performed using the 21 available records. First, the 5% damped acceleration response spectra were obtained for all the ground-motion pairs and for all the linear combinations considered with the angle variation. Subsequently, RotD100 IM was calculated following the methodology described above. For the calculation of the mean ratios, the antilogarithm of the average of the natural logarithms of the ratios was used; this represents the GM of the ratios [15]. All the ratios were calculated using RotD100 as dividend to compare with the maximum Sa response.
Figure 5 displays the results obtained for all the ratios. One common comparison used by many authors is RotD100/GM [4,6,16]. The ratios values are 1.17 for small periods going up to 1.30 for larger periods, which are very similar to the ones obtained by other researchers. Another interesting comparison is the one with the Larger measure, where the results for all the periods are very constant and are, in average, around 1.07 [4,17].

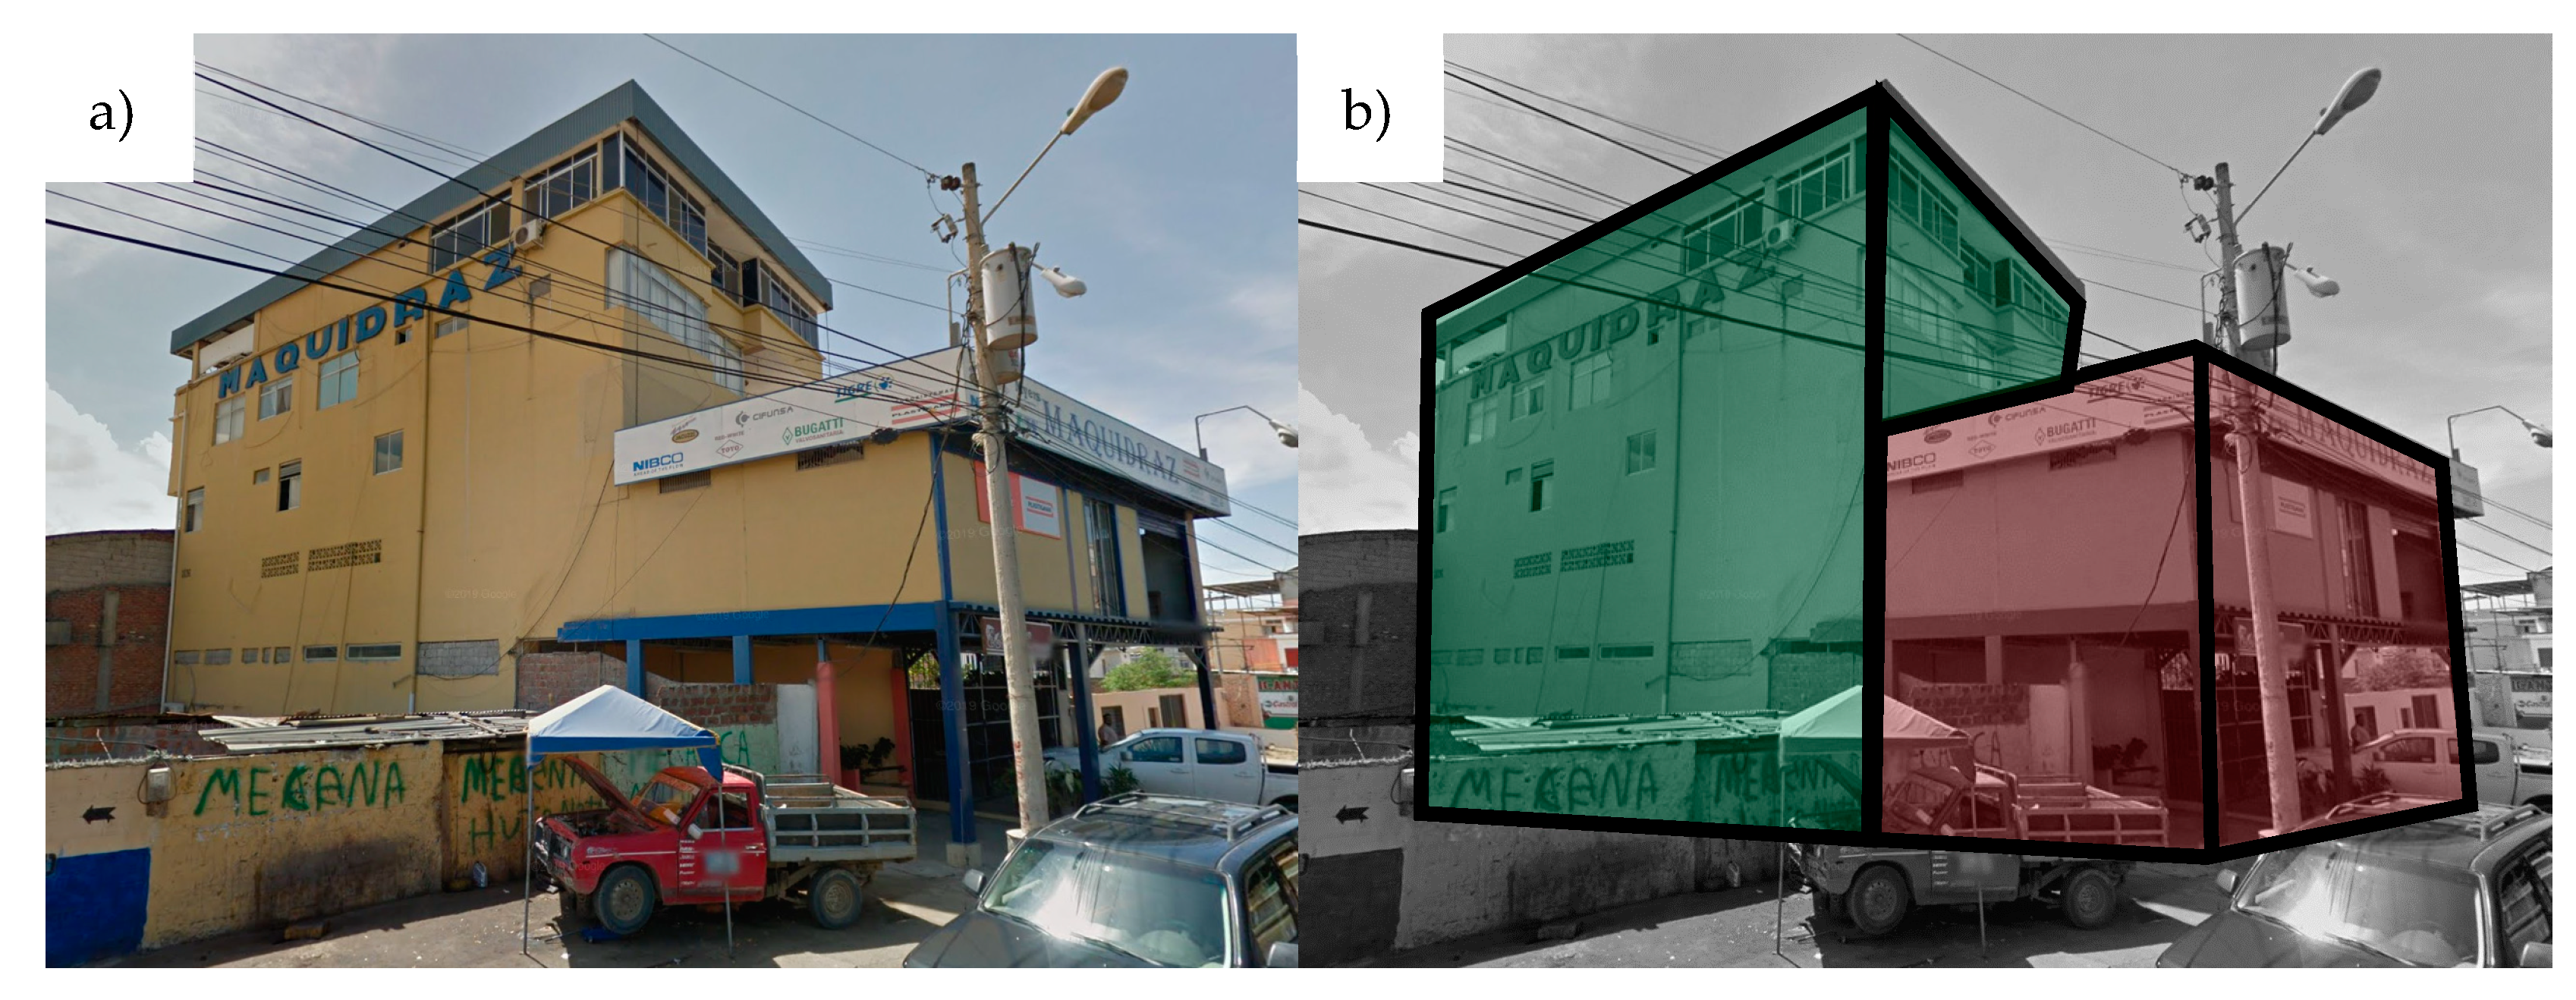
3. Part II: Case Study: Damage Assessment of a Heavily Damaged Building

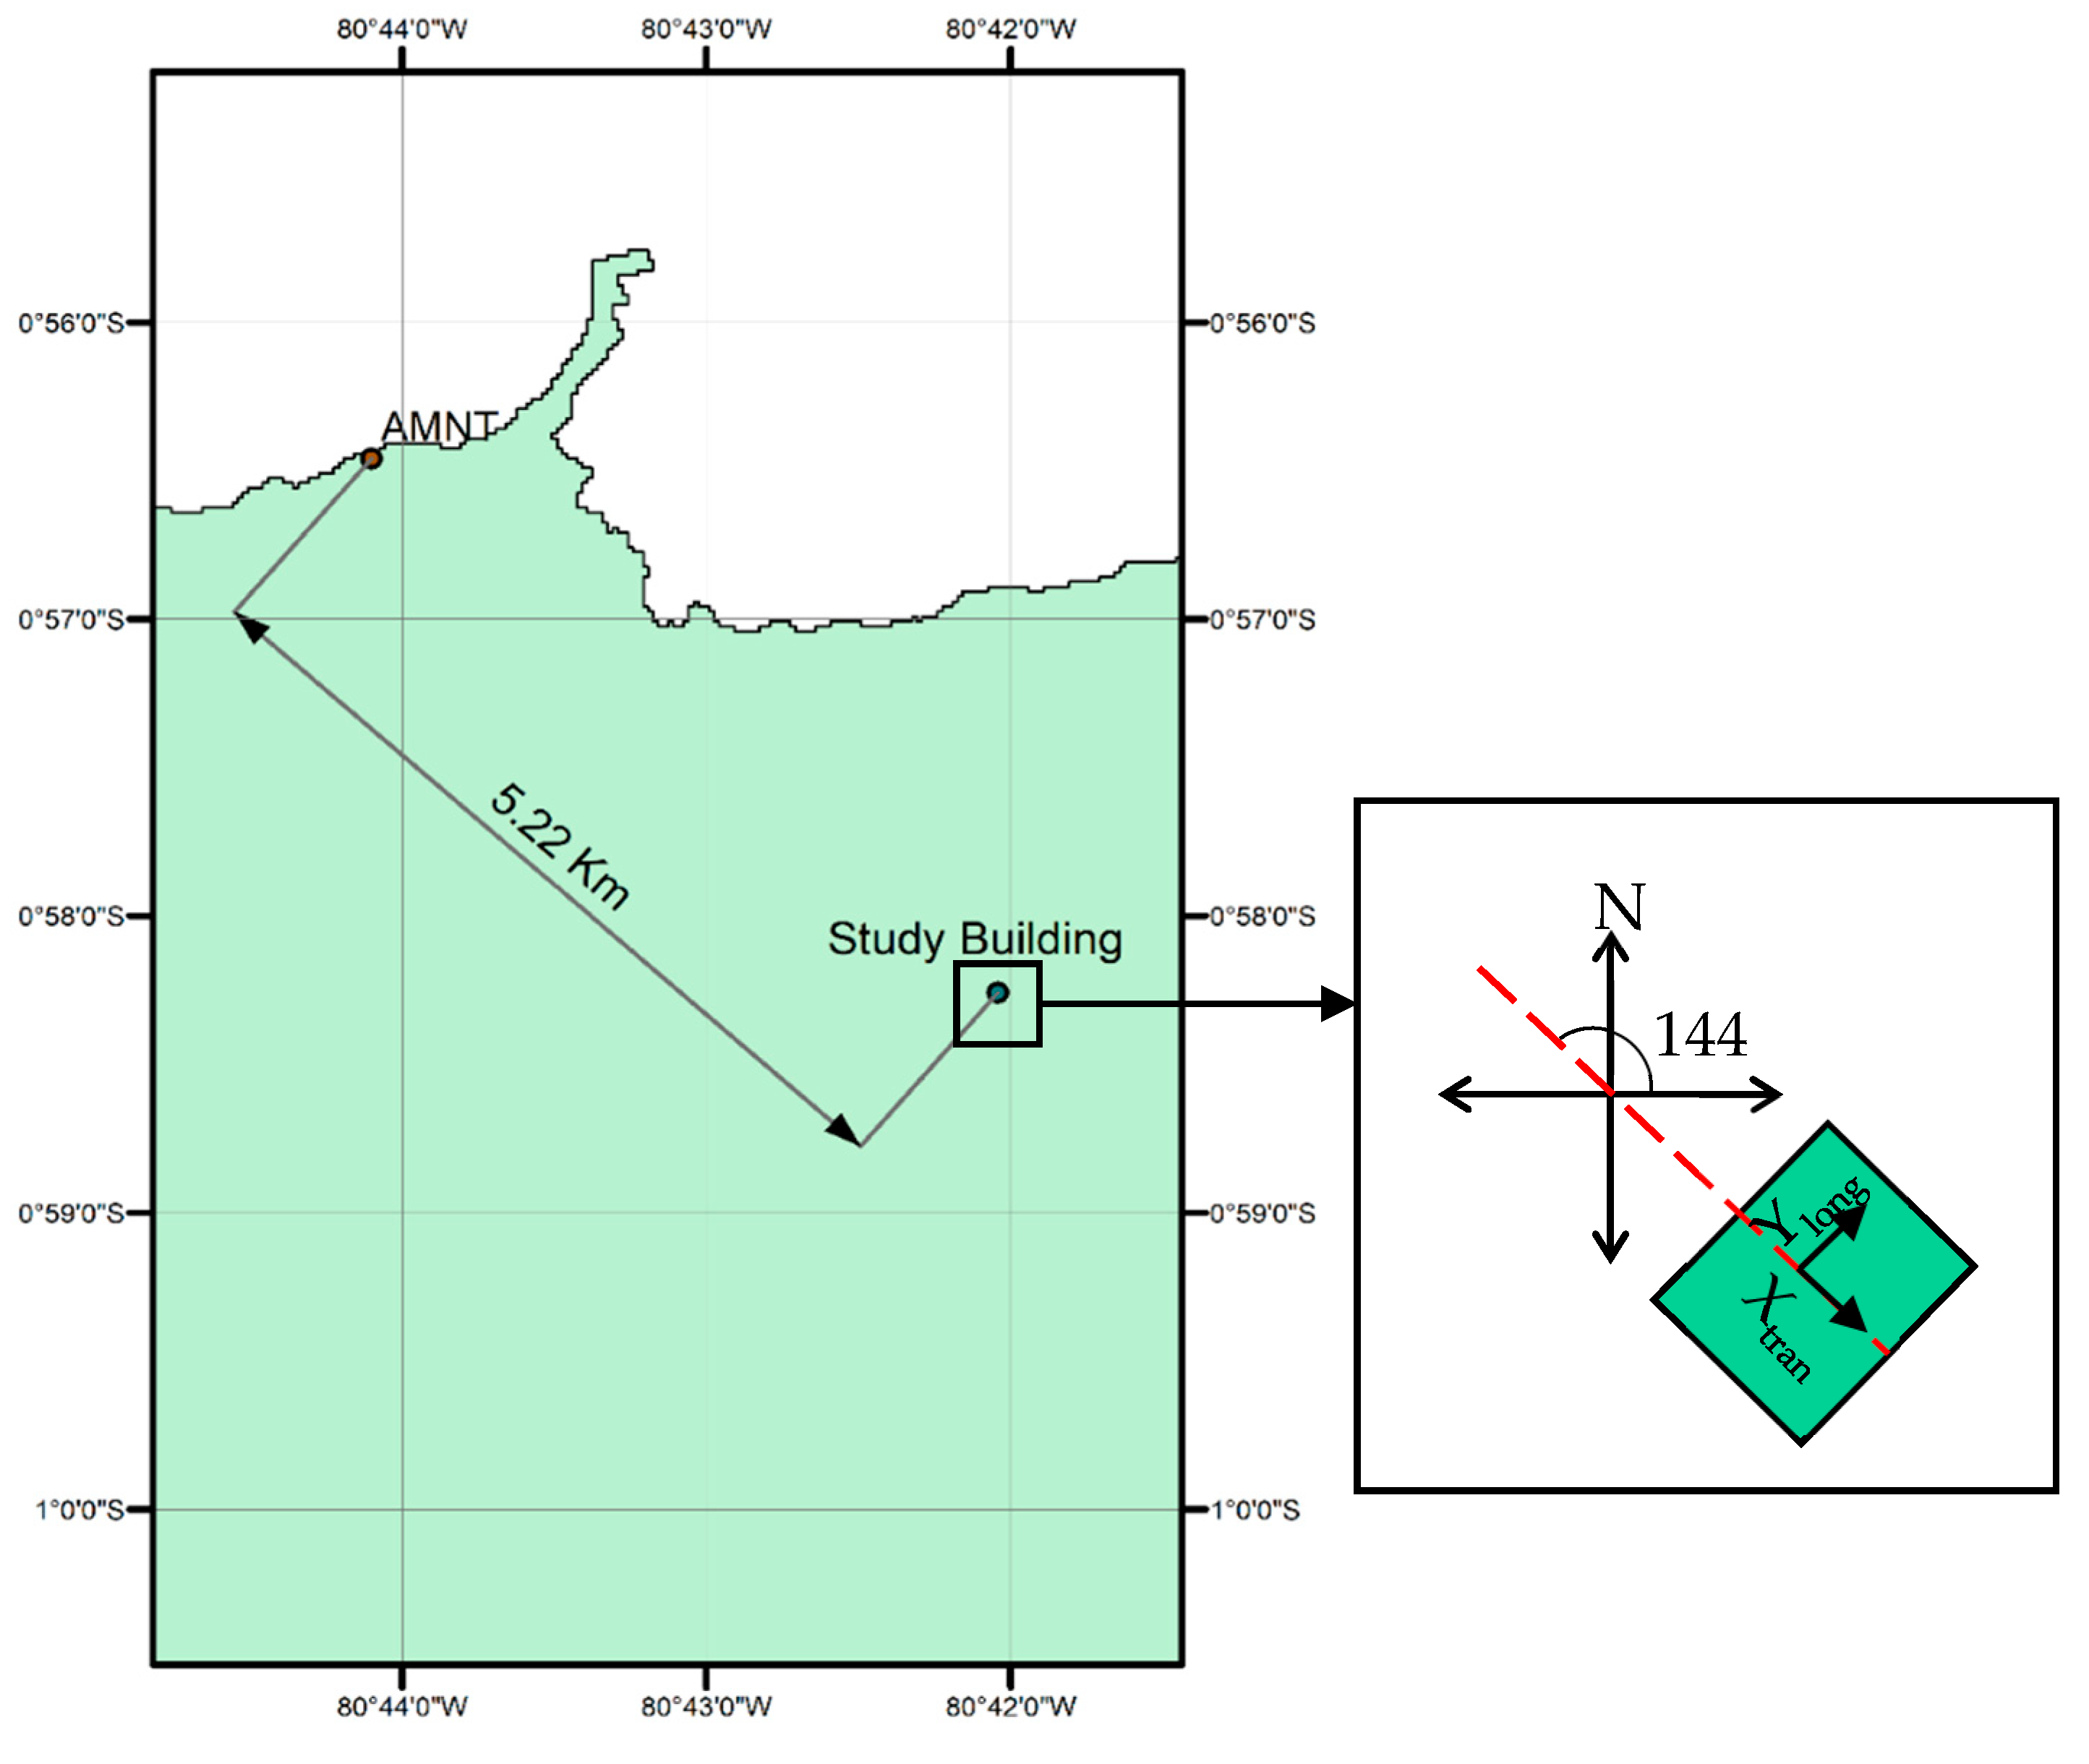
3.1. Materials and Methods

In this second part, a reinforced concrete building, which was seriously affected by the 2016 Ecuador earthquake, is taken as a case study. For this analysis, the accelerograms recorded at a nearby station together with detailed structural documentation were used. An analysis of the capacity, fragility, and damage of the studied building was developed. The building is defined by its capacity spectra in the two main axes of the building. The parametric model proposed by Pujades et al. [11] was applied for both capacity spectra. Then, a damage index that has been previously calibrated based on time-history analysis was estimated.
Moreover, fragility and expected damage analyses were performed. In addition to the null damage state, four damage states were considered in the analysis: 0. Null, 1. Slight, 2. Moderate, 3. Severe, and 4. Complete. The damage states thresholds were defined by the approximation adopted in the European Risk-UE project and the one based on the damage index as defined in [11].
The structure is a five-story reinforced concrete building of mixed use (commercial and residential). The structure is composed of a main concrete building and, in the front part, there is an annex with a steel structure (see Figure 6a). The building is located in Manta city. In this city, many buildings collapsed during the 2016 earthquake, despite it being more than 170 km away from the epicenter. The area with the greatest impact was the Tarqui neighborhood, in which the studied building is located, and where the largest commercial activity of the city occurs.
From a structural evaluation report generated by a professional engineer of Ecuador, it was determined that the building suffered irreparable damage and should be demolished. In the report, they detailed that plastic hinges were formed in the structural system (beam-column), partial collapse of the stairs, and collapse of the internal walls and façade. The principal damage occurred on the ground floor and the first story. Plastic hinges were formed in both ends of the columns with significant loss of section, cracking, and wall collapse.

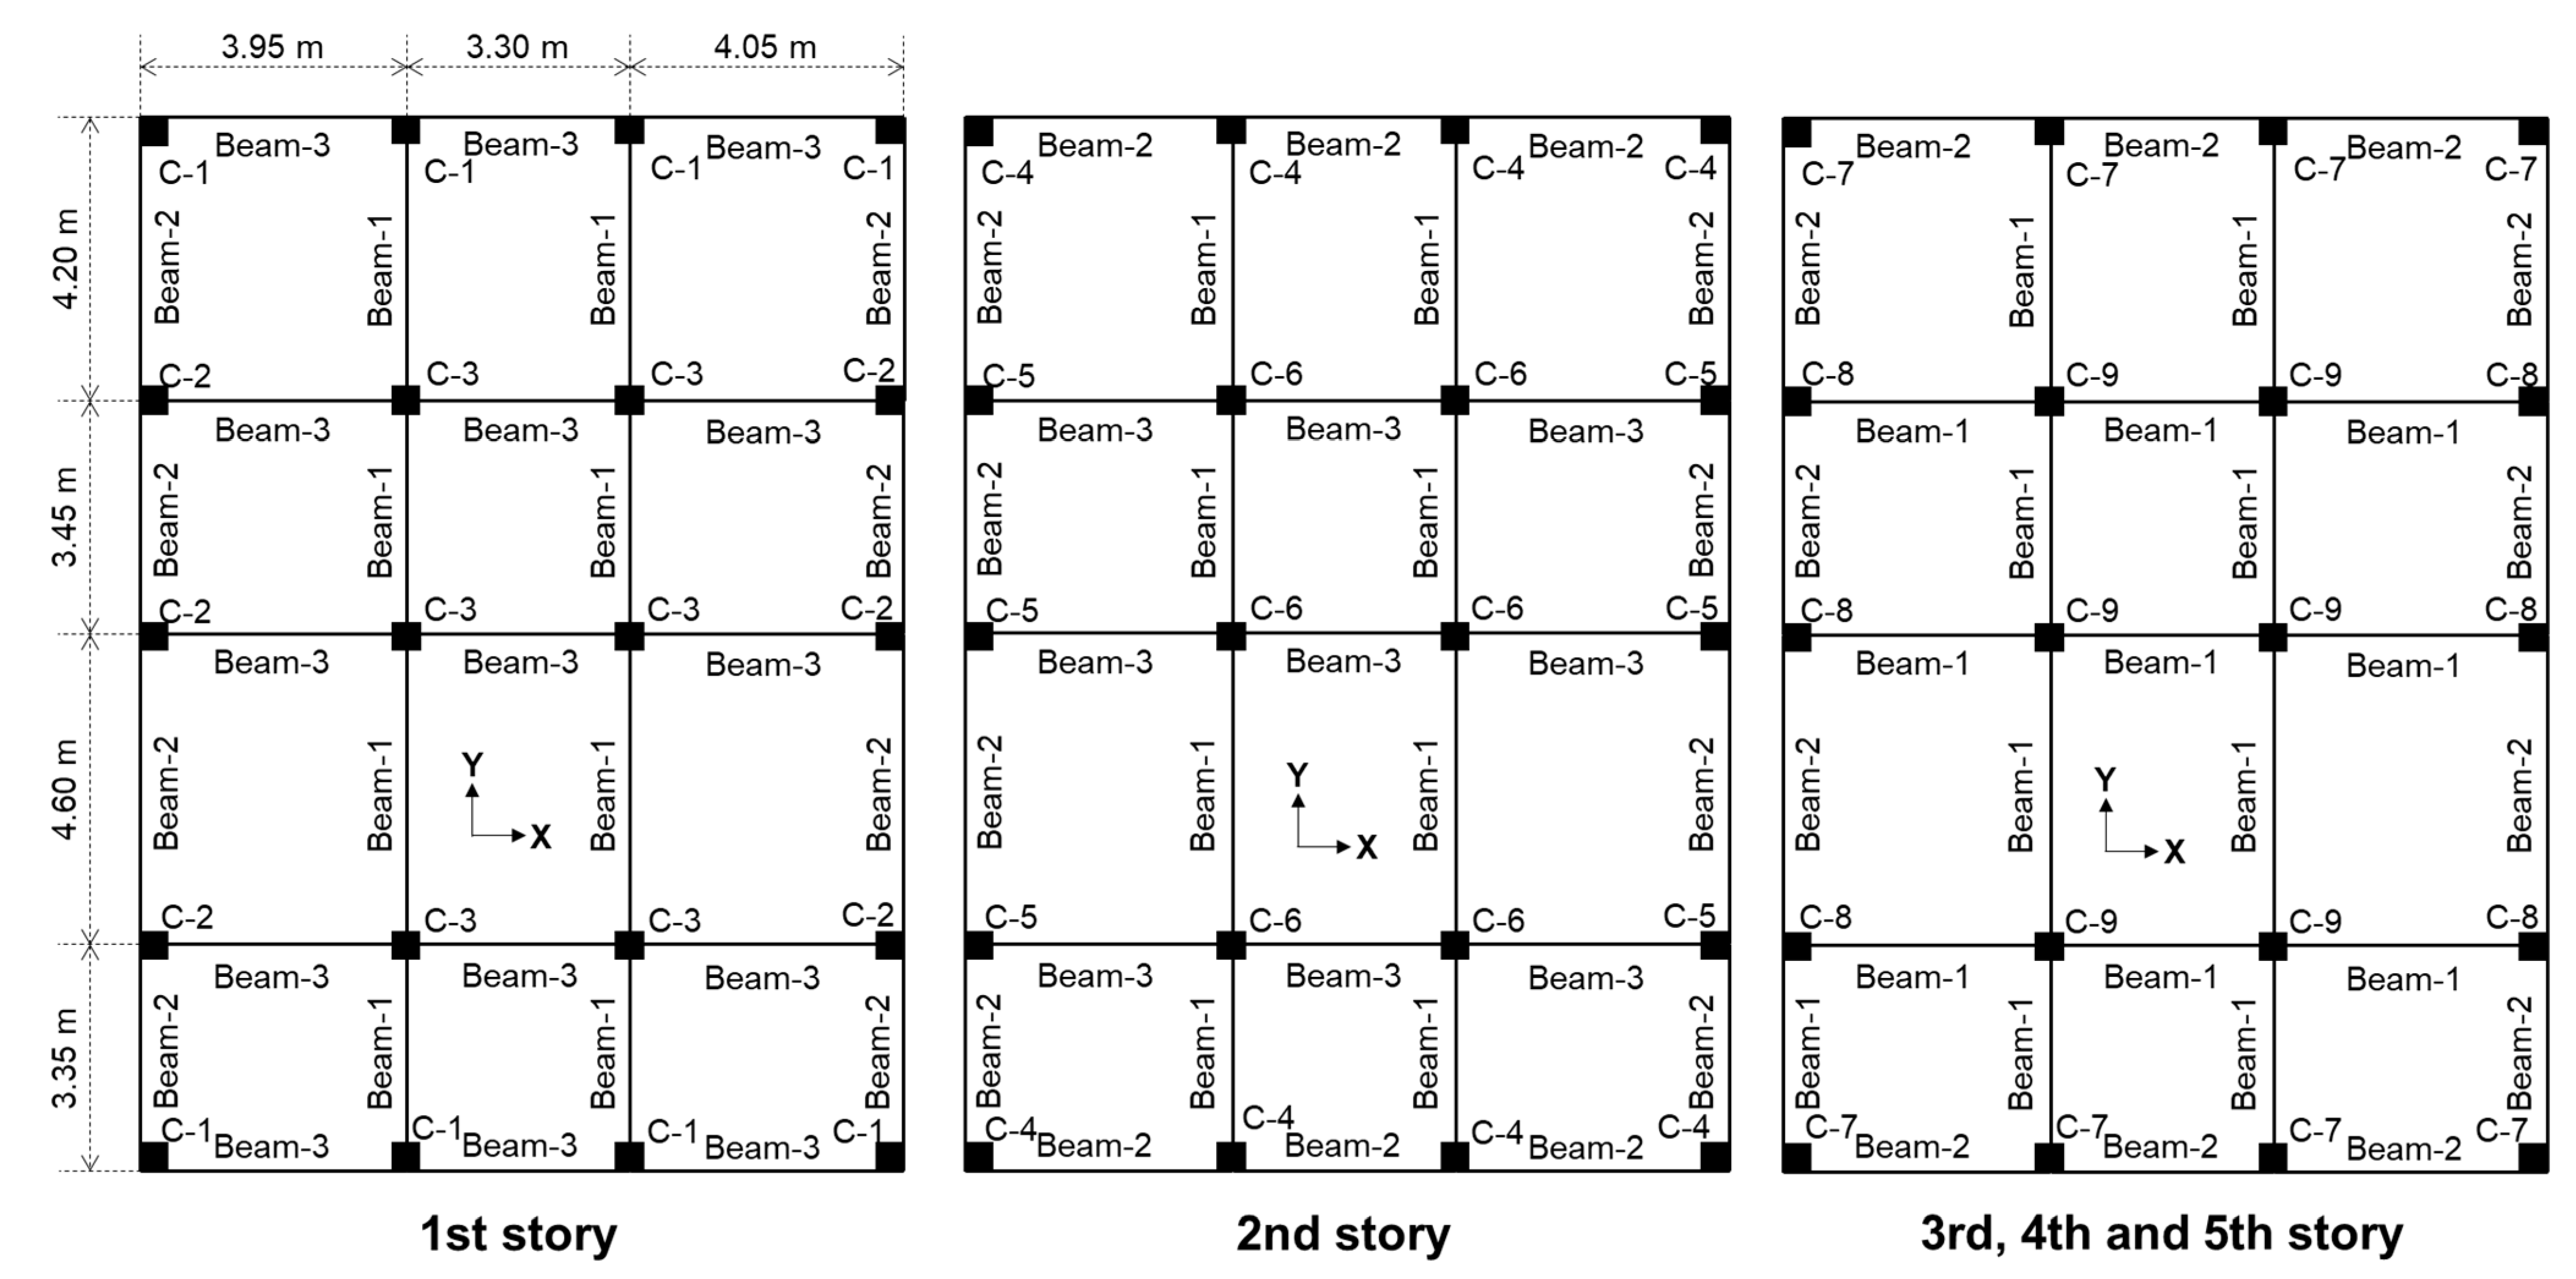
3.1.1. Structural Model

In order to perform the damage assessment of the building, a structural model was developed in ETABS software [10]. Only the main building was considered in the model (Figure 6b). The adjacent building is a steel frame structure that was built several years after the main concrete structure. This structure was built independently with joints. For this reason, it was not considered in the analysis. It is important to note that the original blueprints of the main building were used to develop the structural model. The beam-column distribution and geometry are shown in Figure 7. The inter-story height is 2.70 m. The geometry of the structural sections, steel rebars, and material specifications are shown in Table 2. The cross-section geometry and steel rebar specifications were taken from the original blueprints; the concrete compressive strength was obtained from the structural evaluation report.
To consider the nonlinearity of the structure, beams and columns were modeled using concentrated plastic hinge models, defined at both ends of the structural elements. The inelastic behavior of the plastic hinges is characterized by idealized force–deformation relations, defined by the modeling parameters for reinforced concrete columns and beams of the FEMA 356 standards [18]. In order to estimate the capacity of the building, two non-linear incremental static analyses, Pushover, were performed in the main axes of the structure. Figure 8 shows the capacity curves and capacity spectra obtained in the X (transversal) and Y (longitudinal) directions. In this figure, the original points resulting from the pushover analysis, the interpolated capacity spectra at a fixed step, and the bilinear forms are shown for the two main orthogonal directions of the building. The fundamental period of the building is 0.58 s in the X axis and 0.62 s in the Y axis.

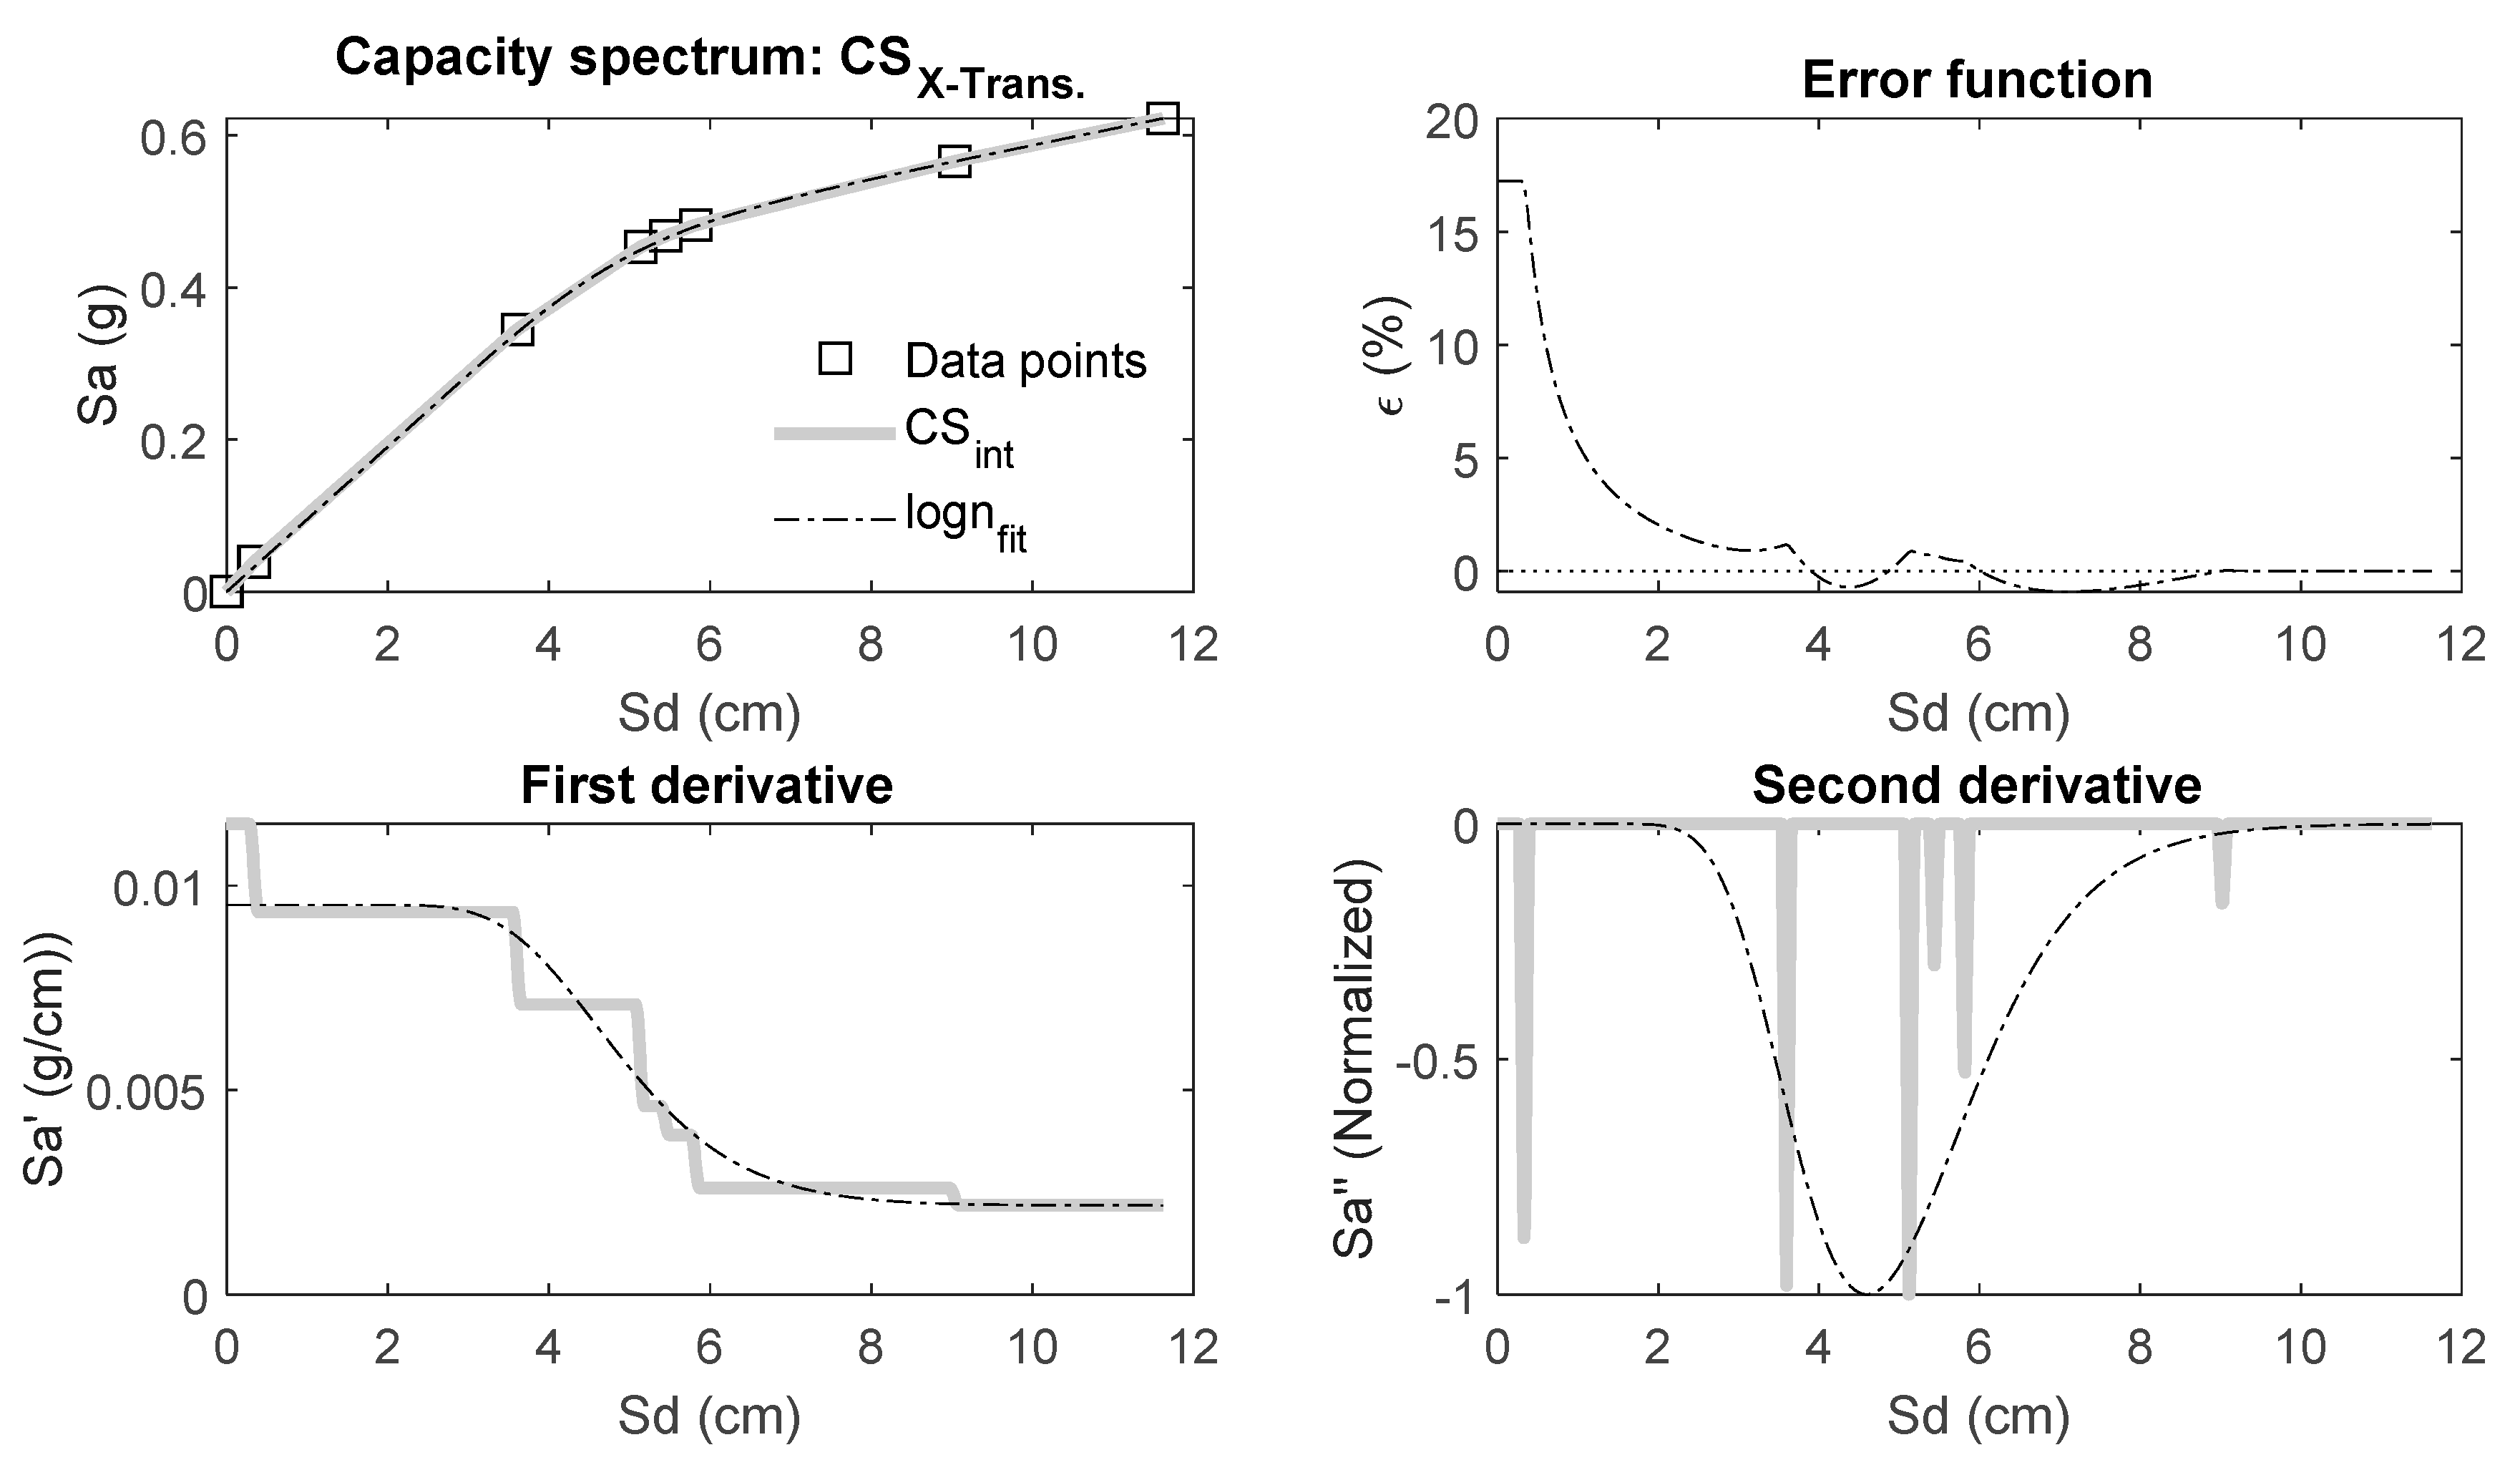
3.1.2. Parametric Model

Pujades et al. [11] proposed a relatively simple mathematical model that allows the capacity and spectra curves to be represented through five independent parameters. The aim of the model is to separate the linear and non-linear parts of the capacity curve or spectrum since the model is valid for both. The non-linear part, doubly normalized (in abscissa and in ordinates), is modeled by the cumulative integral of a cumulative lognormal function. This lognormal function can be fully represented by two parameters, the mean value, μ, and the standard deviation, σ. For more detail, the parametric model is explained and described well in Pujades et al. [11].
This model was successfully applied to the capacity spectra in both X (transversal) and Y (longitudinal) directions of the studied building. In Figure 9, the adjustment of the capacity spectrum in the X direction is presented. Specifically, the capacity spectrum is shown with the following curves: the original data from the pushover analysis, the interpolated capacity spectrum (CS), and the lognormal fit. For the lognormal fit, all the interpolated points were used. The improved setting was refined by minimizing the error between the model and the empirical points resulting from the pushover analysis. Additionally, in this figure, the first and second derivatives of the capacity spectra and the error function in percentages are shown. The second derivatives were normalized, so that the value of the minimum is one. The excellent quality of the fit should be noted. Figure 10 is analogous to Figure 9 but for the capacity spectrum in the Y direction.
In this way, the capacity spectra are fully defined by the following five parameters: the mean value (μ) and the standard deviation (σ) of the lognormal function, the slope (m) at the origin of the capacity spectrum, and the ultimate capacity point (Sdu and Sau). Table 3 shows the parameters of the models fitted and the errors (εL).

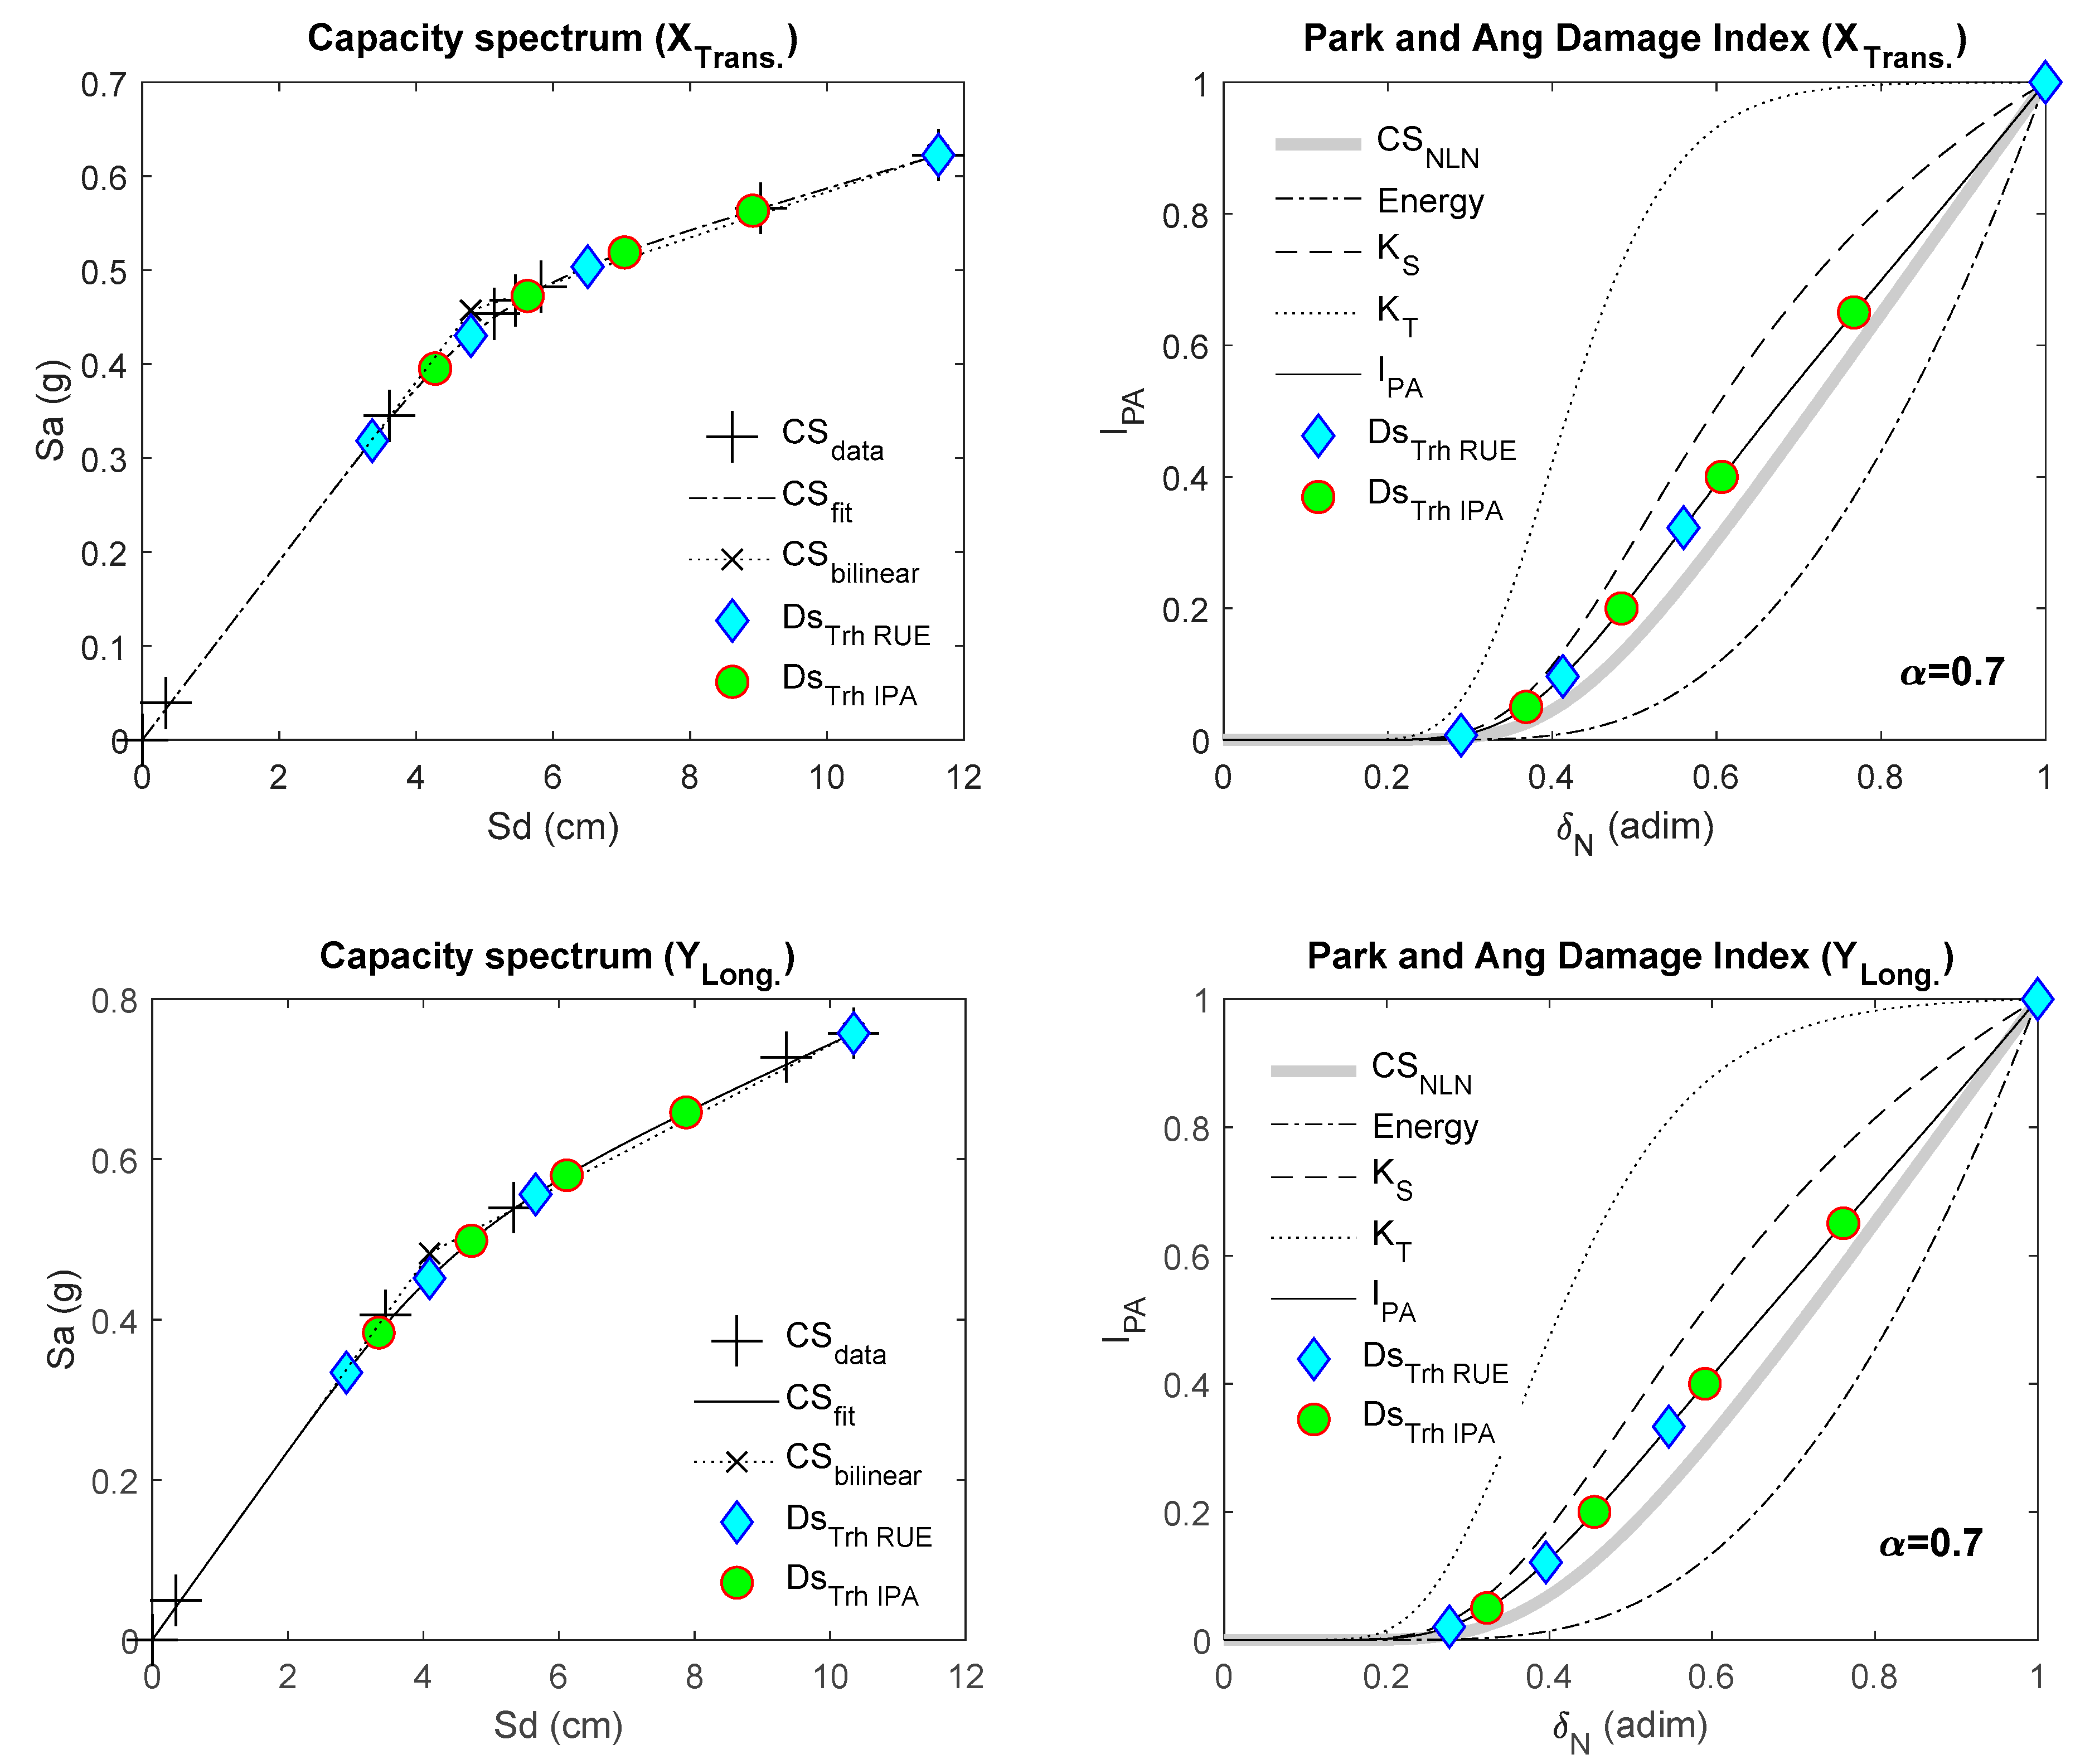
3.1.3. Park and Ang-Based Damage Index

Pujades et al. [11] defined a new damage index based on capacity curves/spectra. This index is based on the well-known damage index of Park and Ang [19,20]. The damage contributions are separated in two parts, one due to the deformation and another due to the energy dissipation. These two contributions are modeled by two functions that can be obtained from the normalized non-linear part of the capacity curve or spectrum.
In addition, Pujades et al. [11] performed dynamic analyses with reinforced concrete buildings and typical seismic actions to calibrate the contributions of the deformation and energy dissipation in damage. Thus, the damage index based on the Park and Ang index is defined by the following equation:
I P A ( δ N ) = α K S ( δ N ) + ( 1 α ) E ( δ N )
In this equation, δN is the normalized spectral displacement, IPA is the new damage index based on the damage index of Park and Ang, KS is the secant stiffness, and E is the energy dissipated; α is the parameter that distributes the contributions of the stiffness degradation and the dissipation of the energy to the global damage.
In this work, Equation (9) with a value of α = 0.7 was used. Based on previous studies [11], a mean value of this parameter for typical seismic actions and reinforced concrete buildings is α = 0.7, which may be higher or lower depending on the typology of the buildings and seismic actions. It is expected that for seismic actions of long duration and high intensity, the contribution of the energy dissipation to the damage may be greater.
Another function that has also proved to be useful is the tangent stiffness function, KT, related to the first derivative of the capacity spectrum [21]. The incorporation of this function into the damage index allows the incorporation of sharp variations in the damage due to sudden drops in stiffness that are not considered well in the secant stiffness function. This improved index is defined by modifying Equation (9) as follows:
I P A _ m ( δ N ) = α   [ β   K S ( δ N ) + ( 1 β ) K T ( δ N ) ] + ( 1 α ) E ( δ N )
In general, this approach is adequate for most of the capacity curves. The more sophisticated model of Equation (10) is useful in special cases, particularly when brittle hinges are incorporated. The estimation of the secant stiffness and energy functions is explained well in Pujades et al. [11]. In a simplified way, the secant stiffness function is obtained through the quotient between the ordinates and the abscissa of the non-linear part of the capacity spectrum. The tangent stiffness is obtained by deriving the non-linear part of the capacity spectrum, and the energy function is the cumulative integral of the non-linear part of the capacity spectrum. A normalization of the functions finds that the damage index takes values of 1 for the unit abscissa, so the damage index starts with zero in the origin and ends with a unit in the point of ultimate capacity. Figure 11 shows the capacity spectra and the damage curves. This figure shows the normalized non-linear capacity spectrum (CSNLN), and the energy, E, the secant stiffness, KS, the tangent stiffness, KT, functions, and the damage index, IPA, based on the Park and Ang index. In this same figure, damage state thresholds are also shown. These damage states and thresholds are briefly described below.

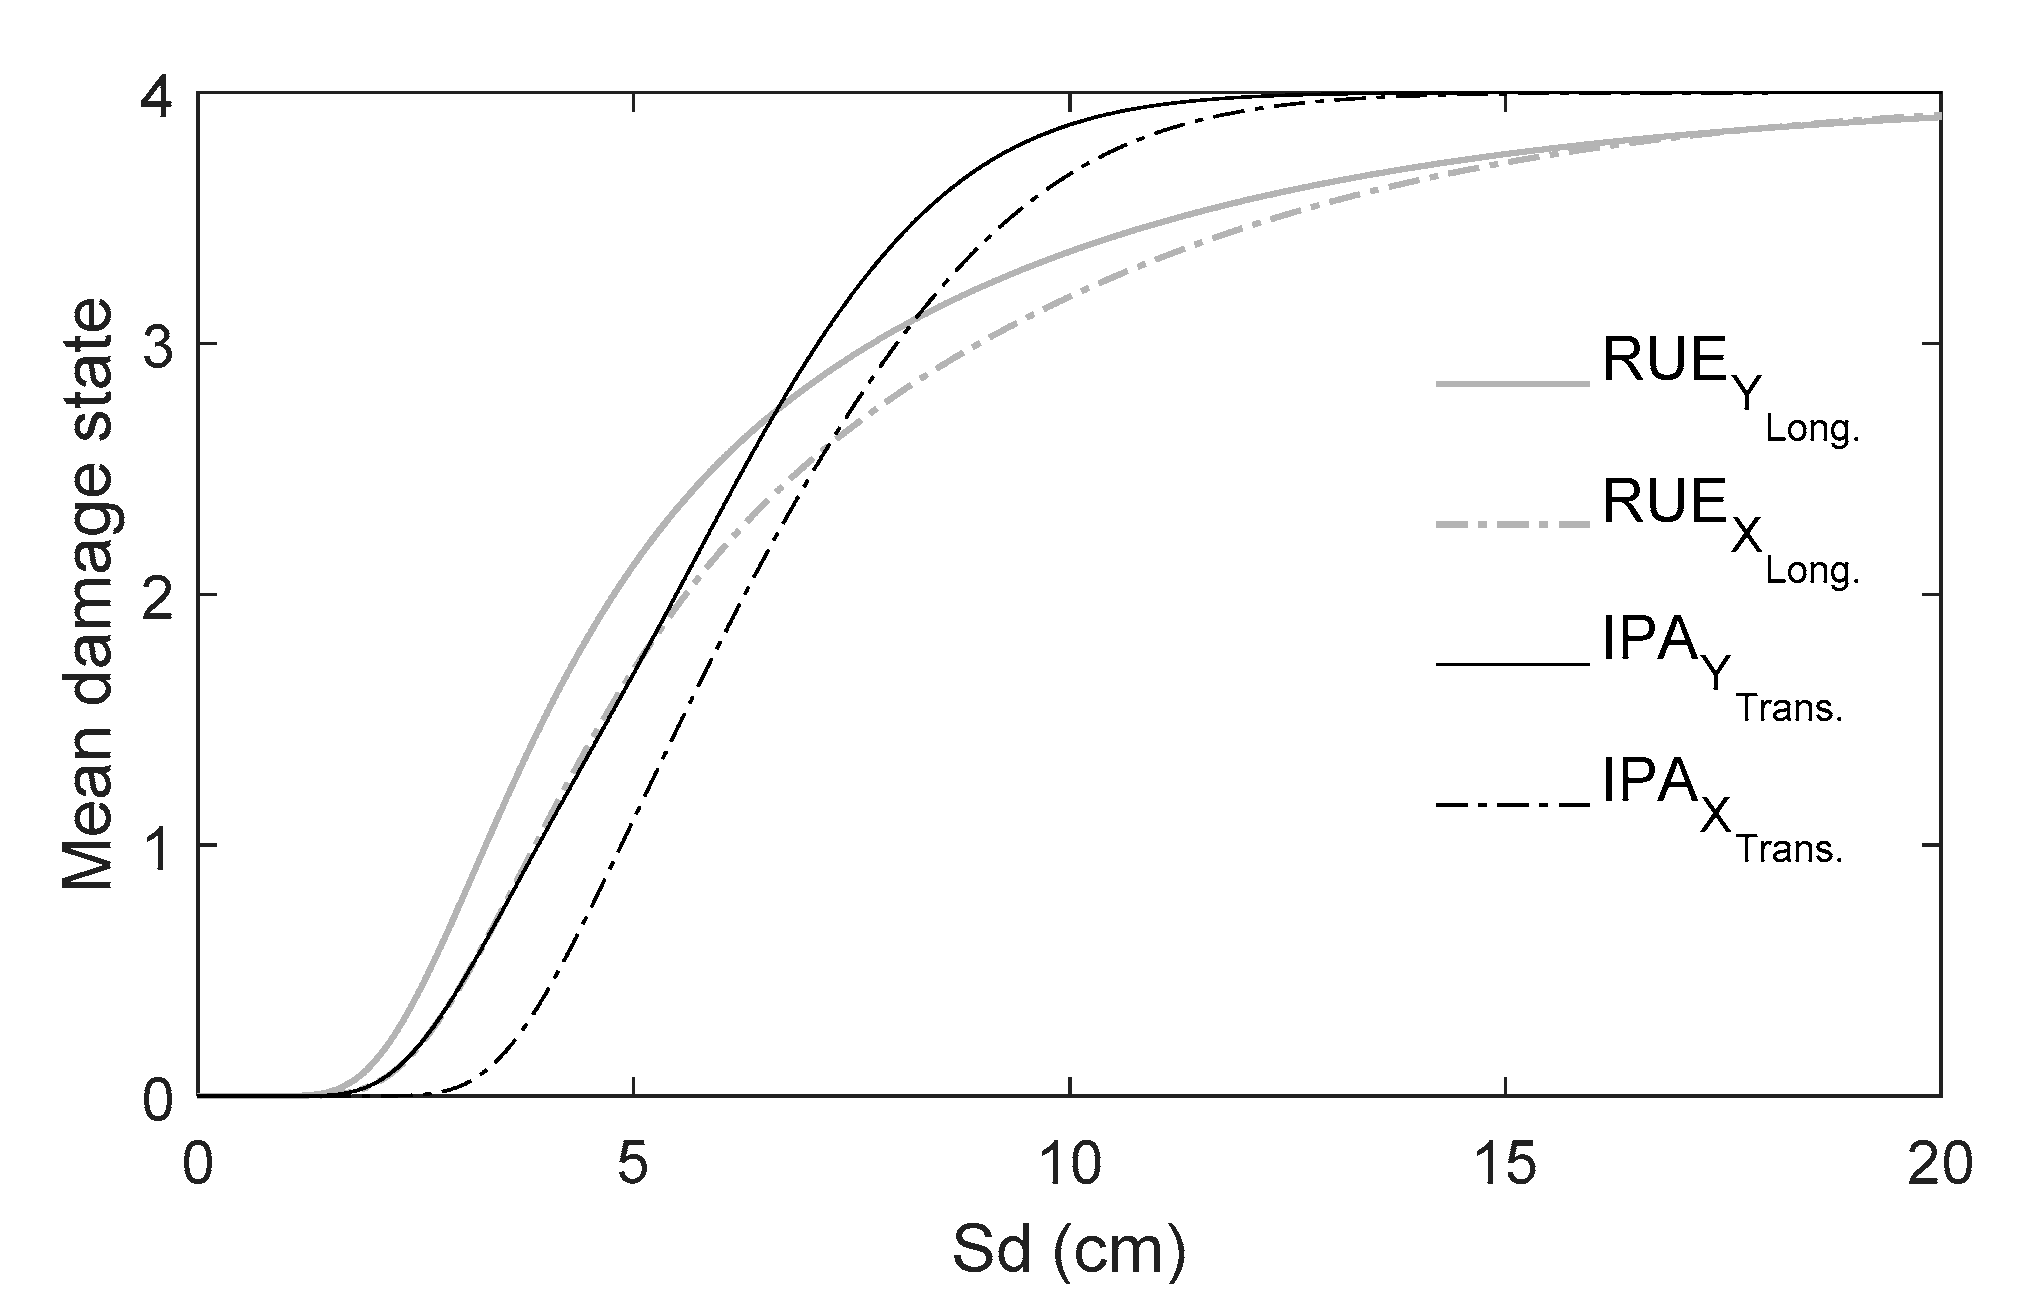
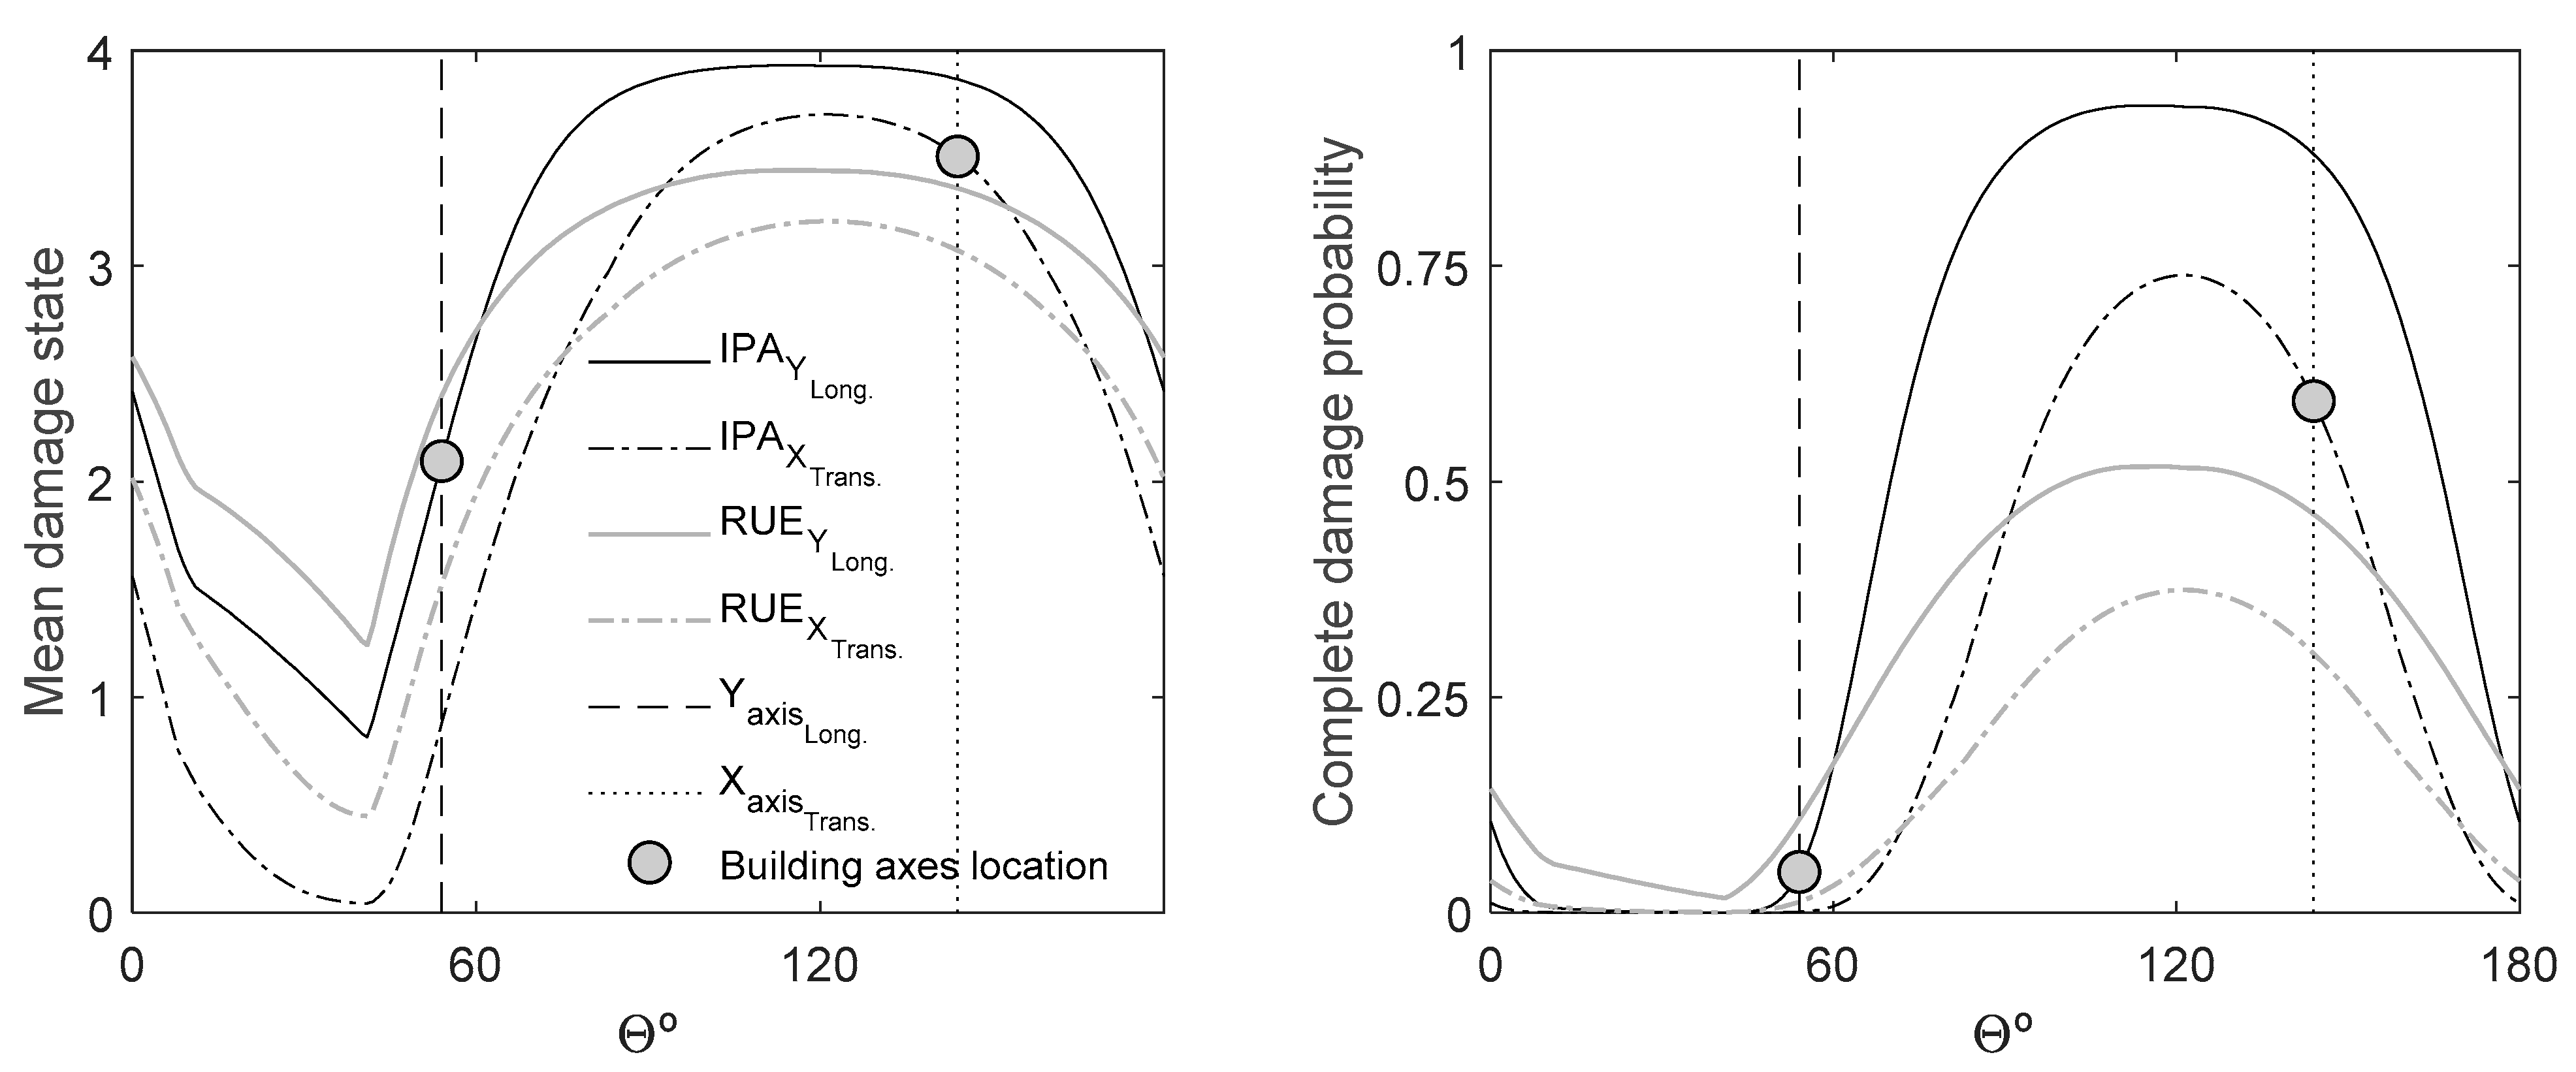
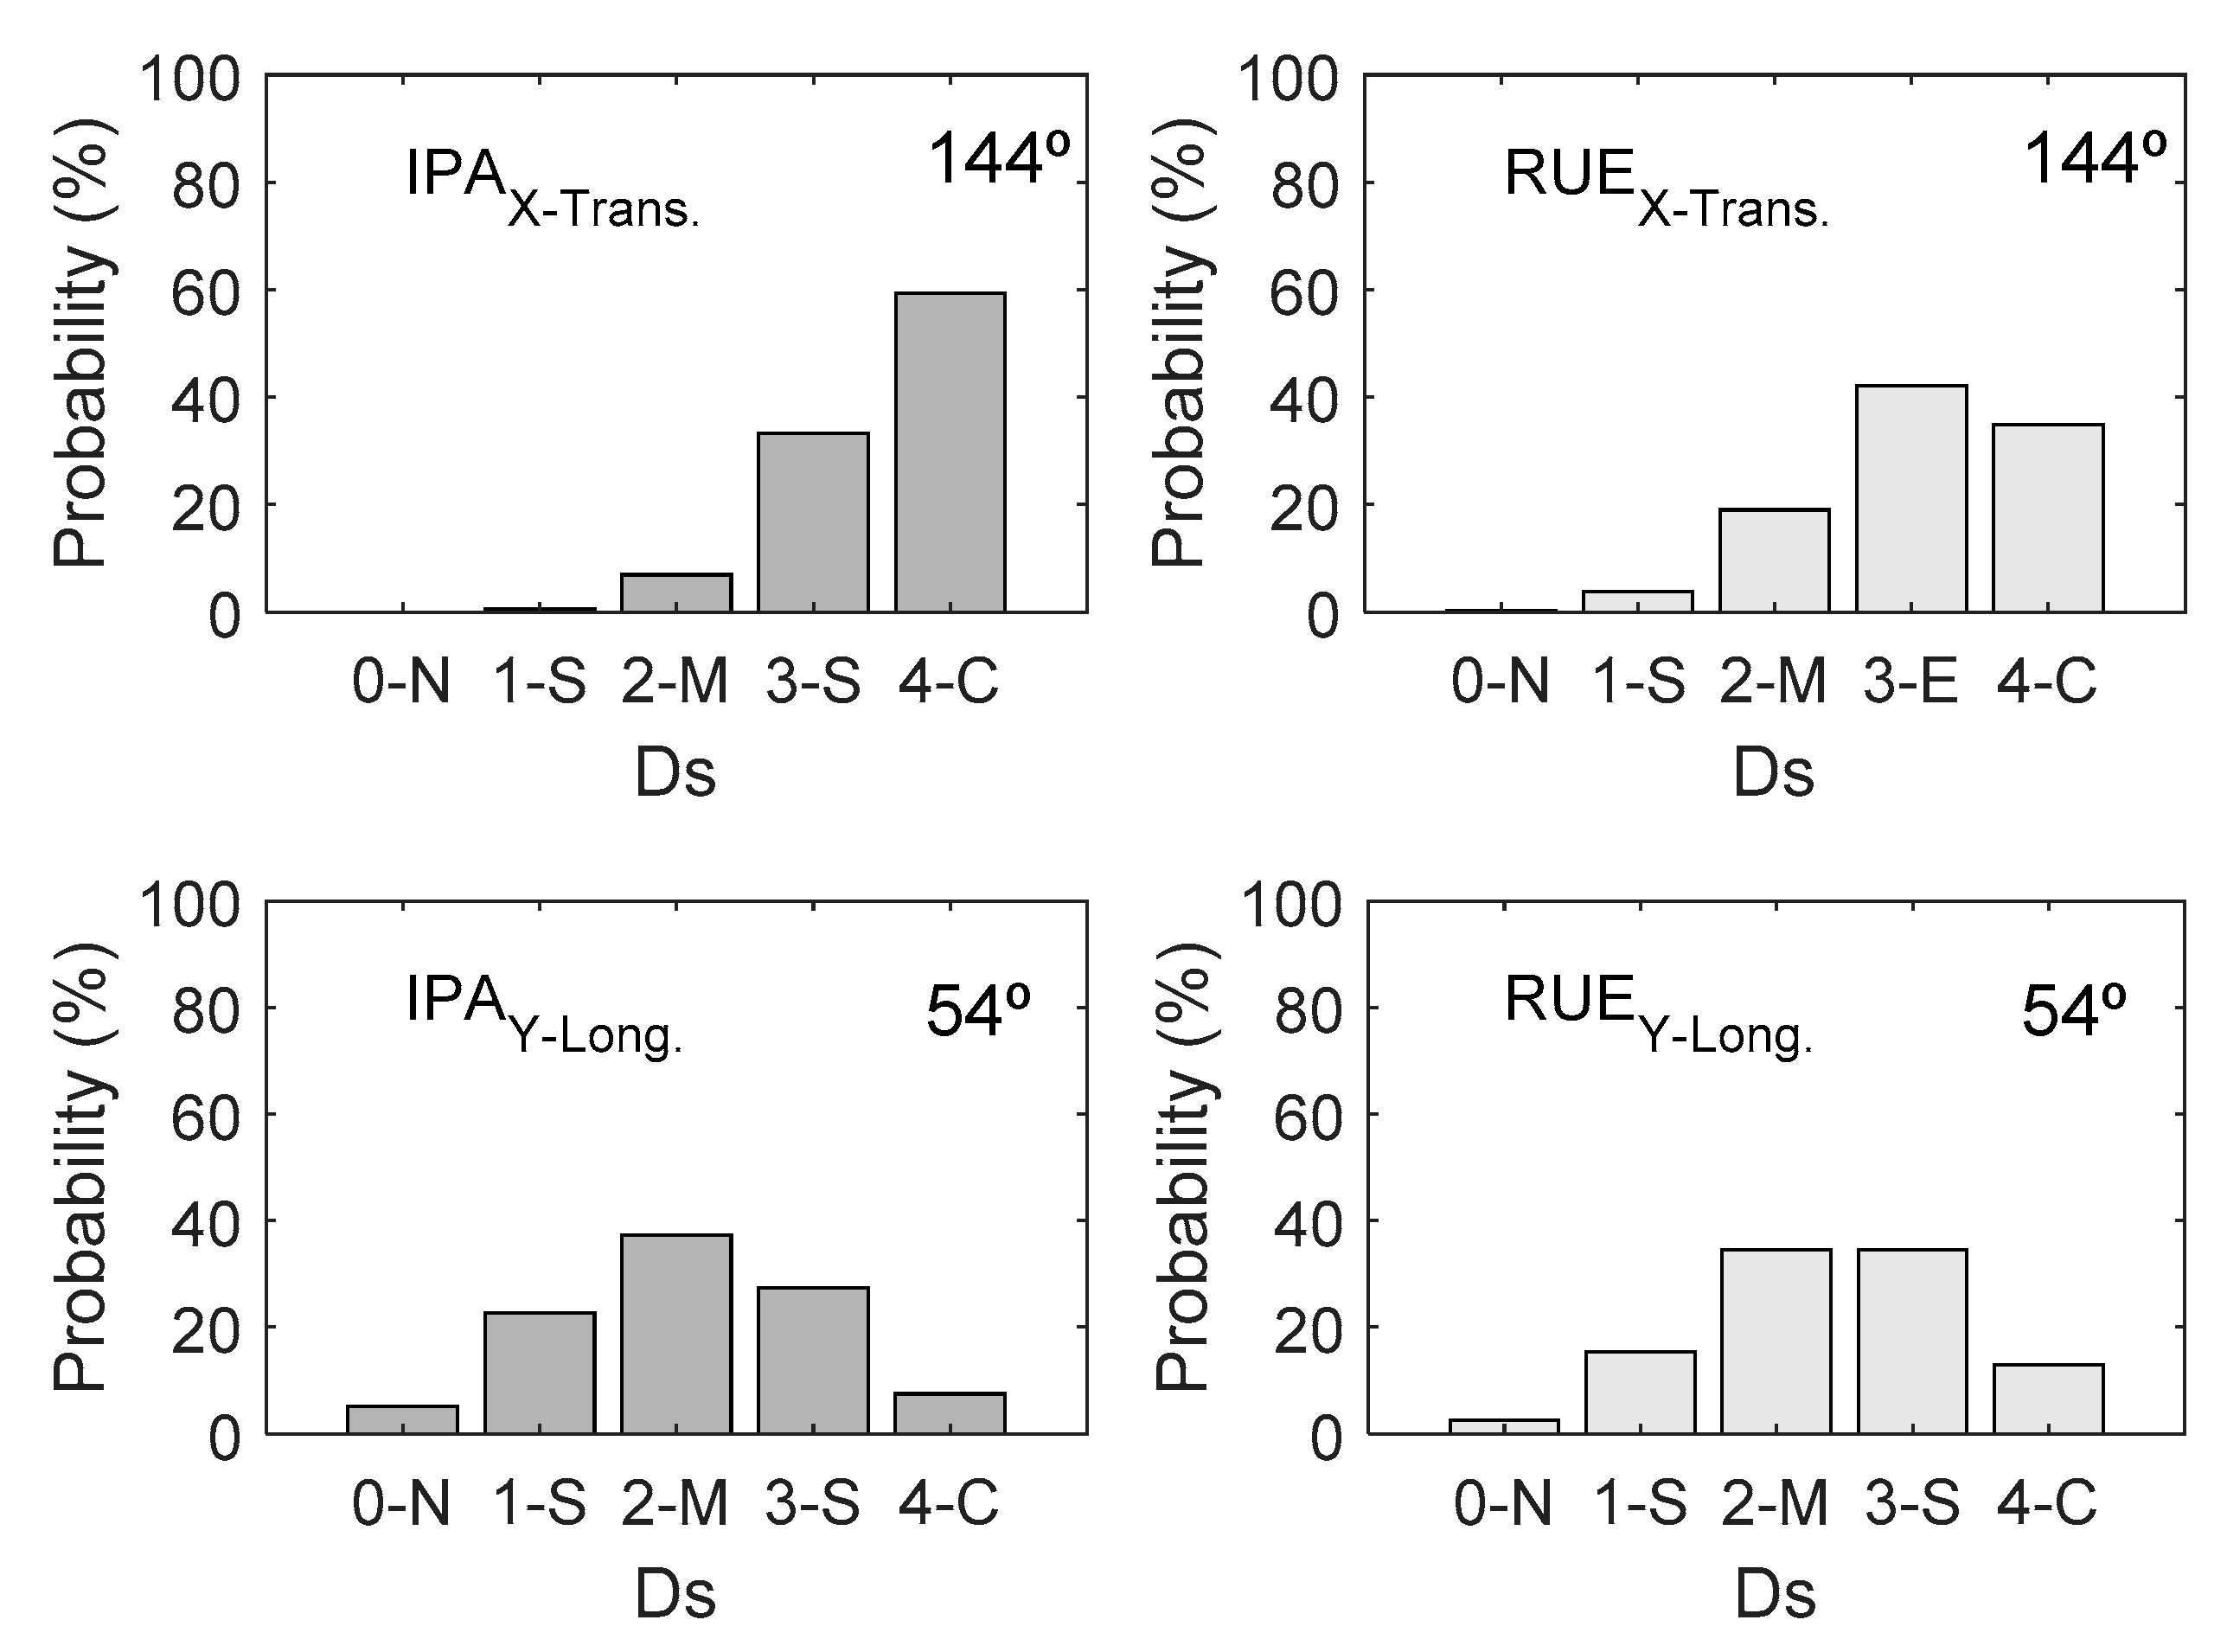
3.1.4. Fragility Curves and Mean Damage State
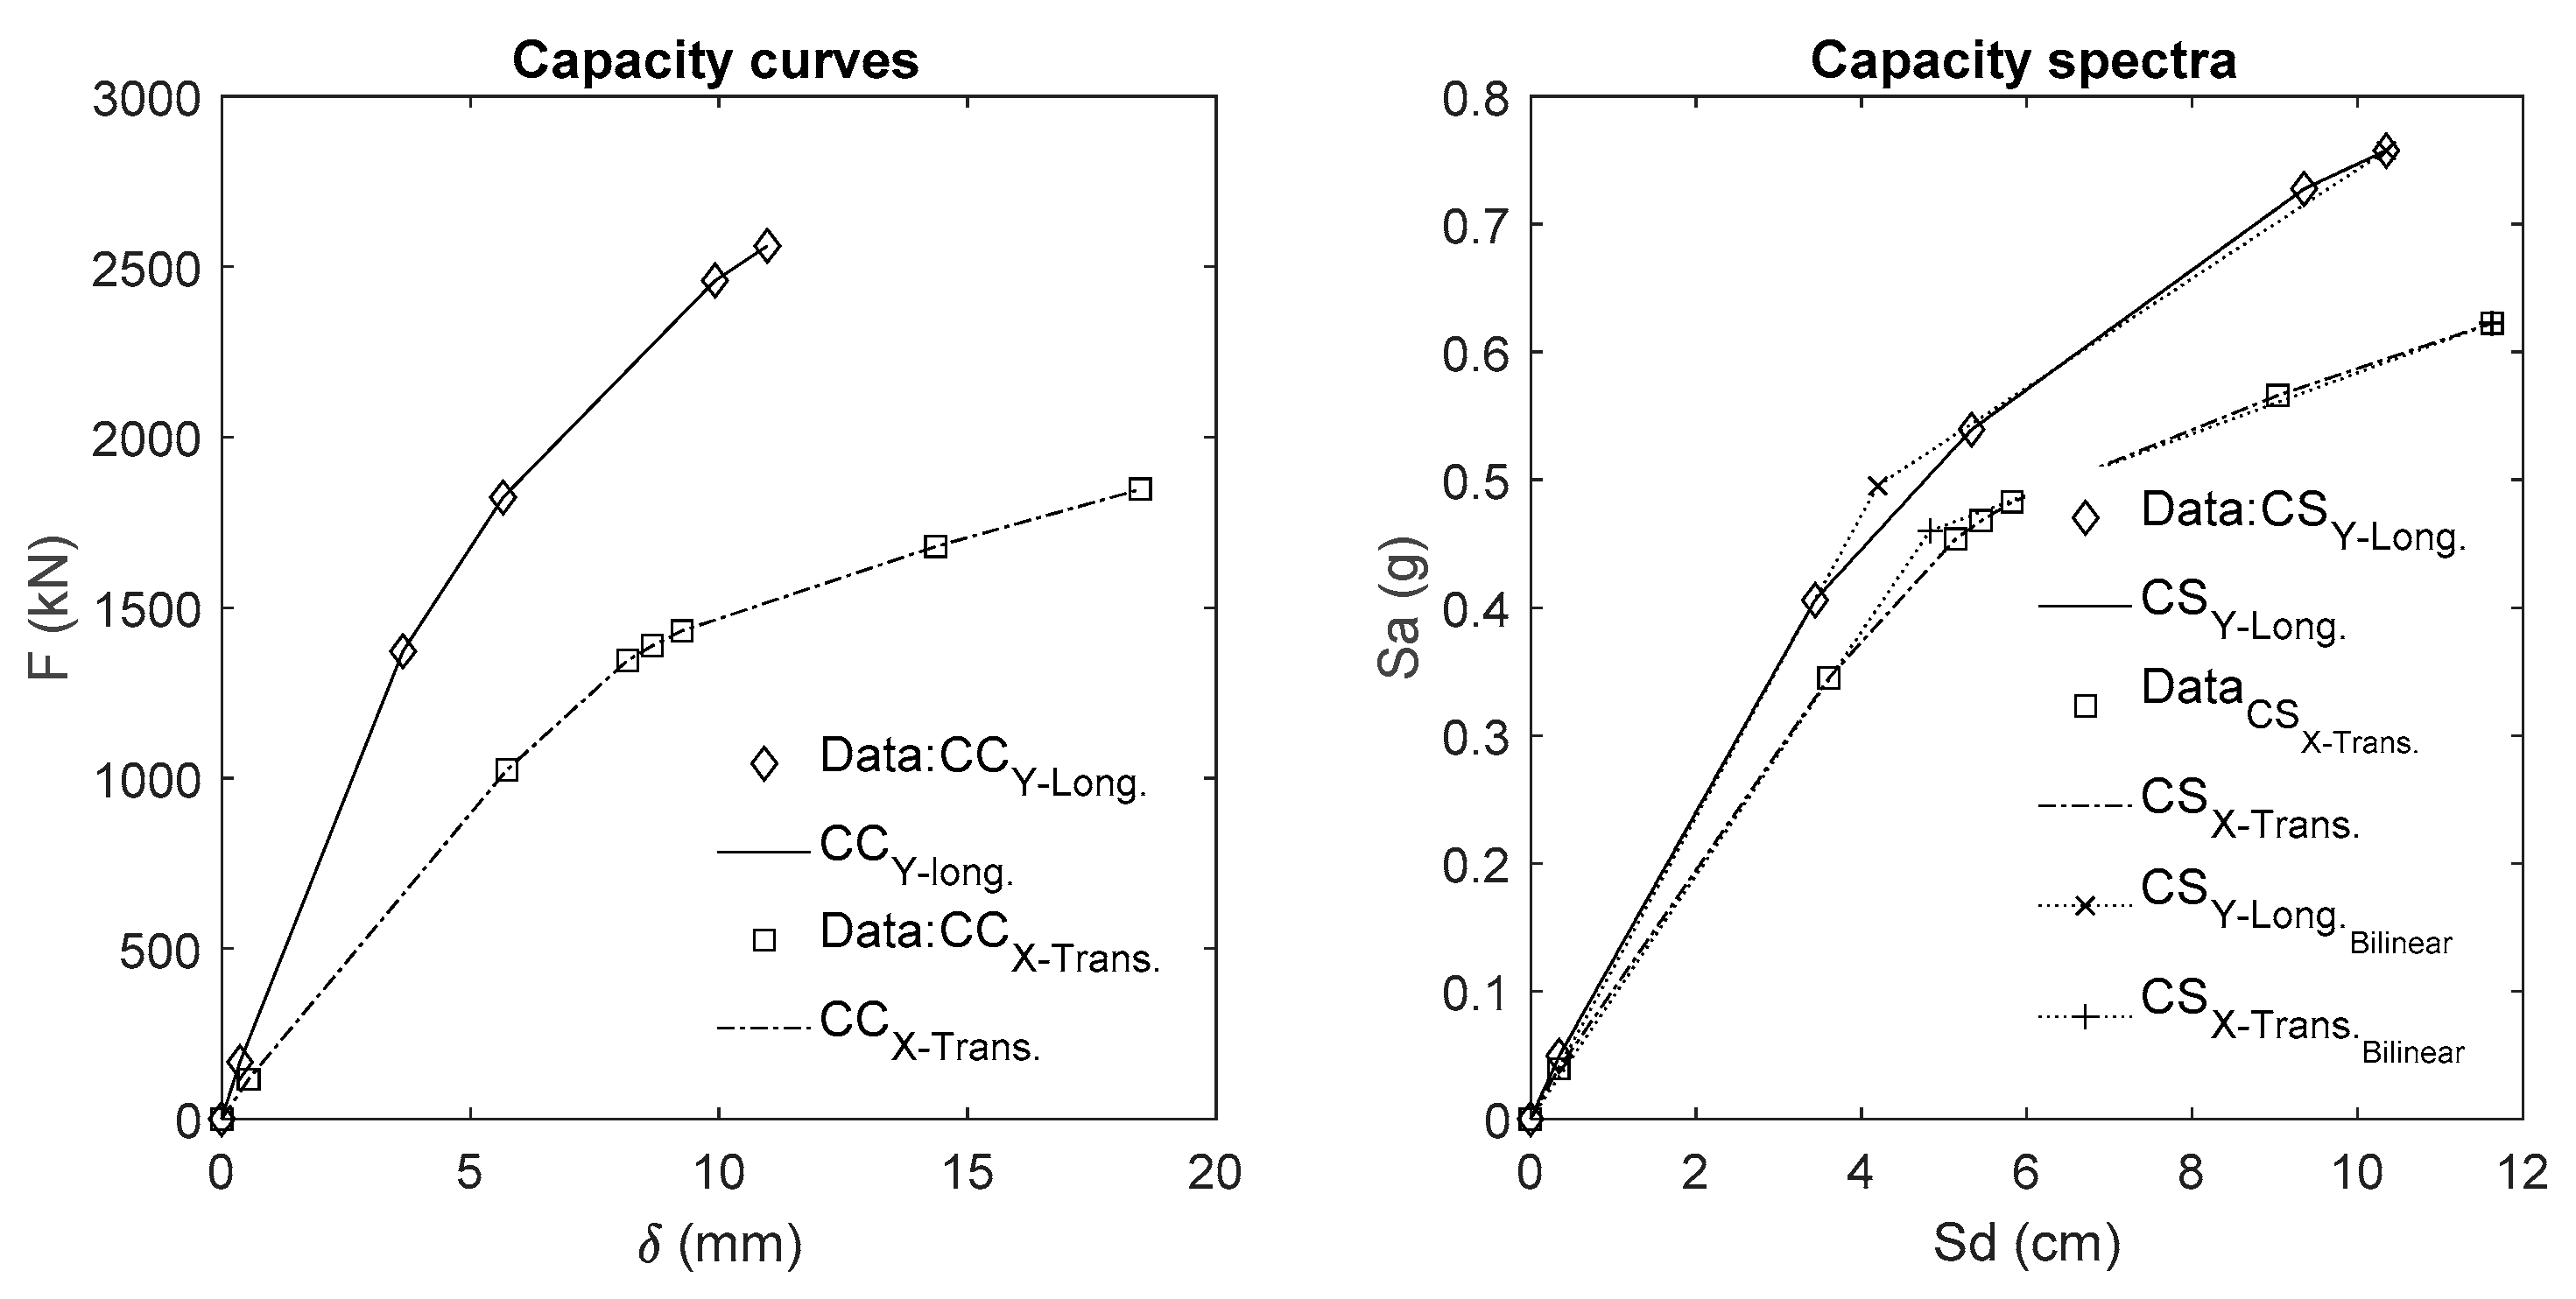
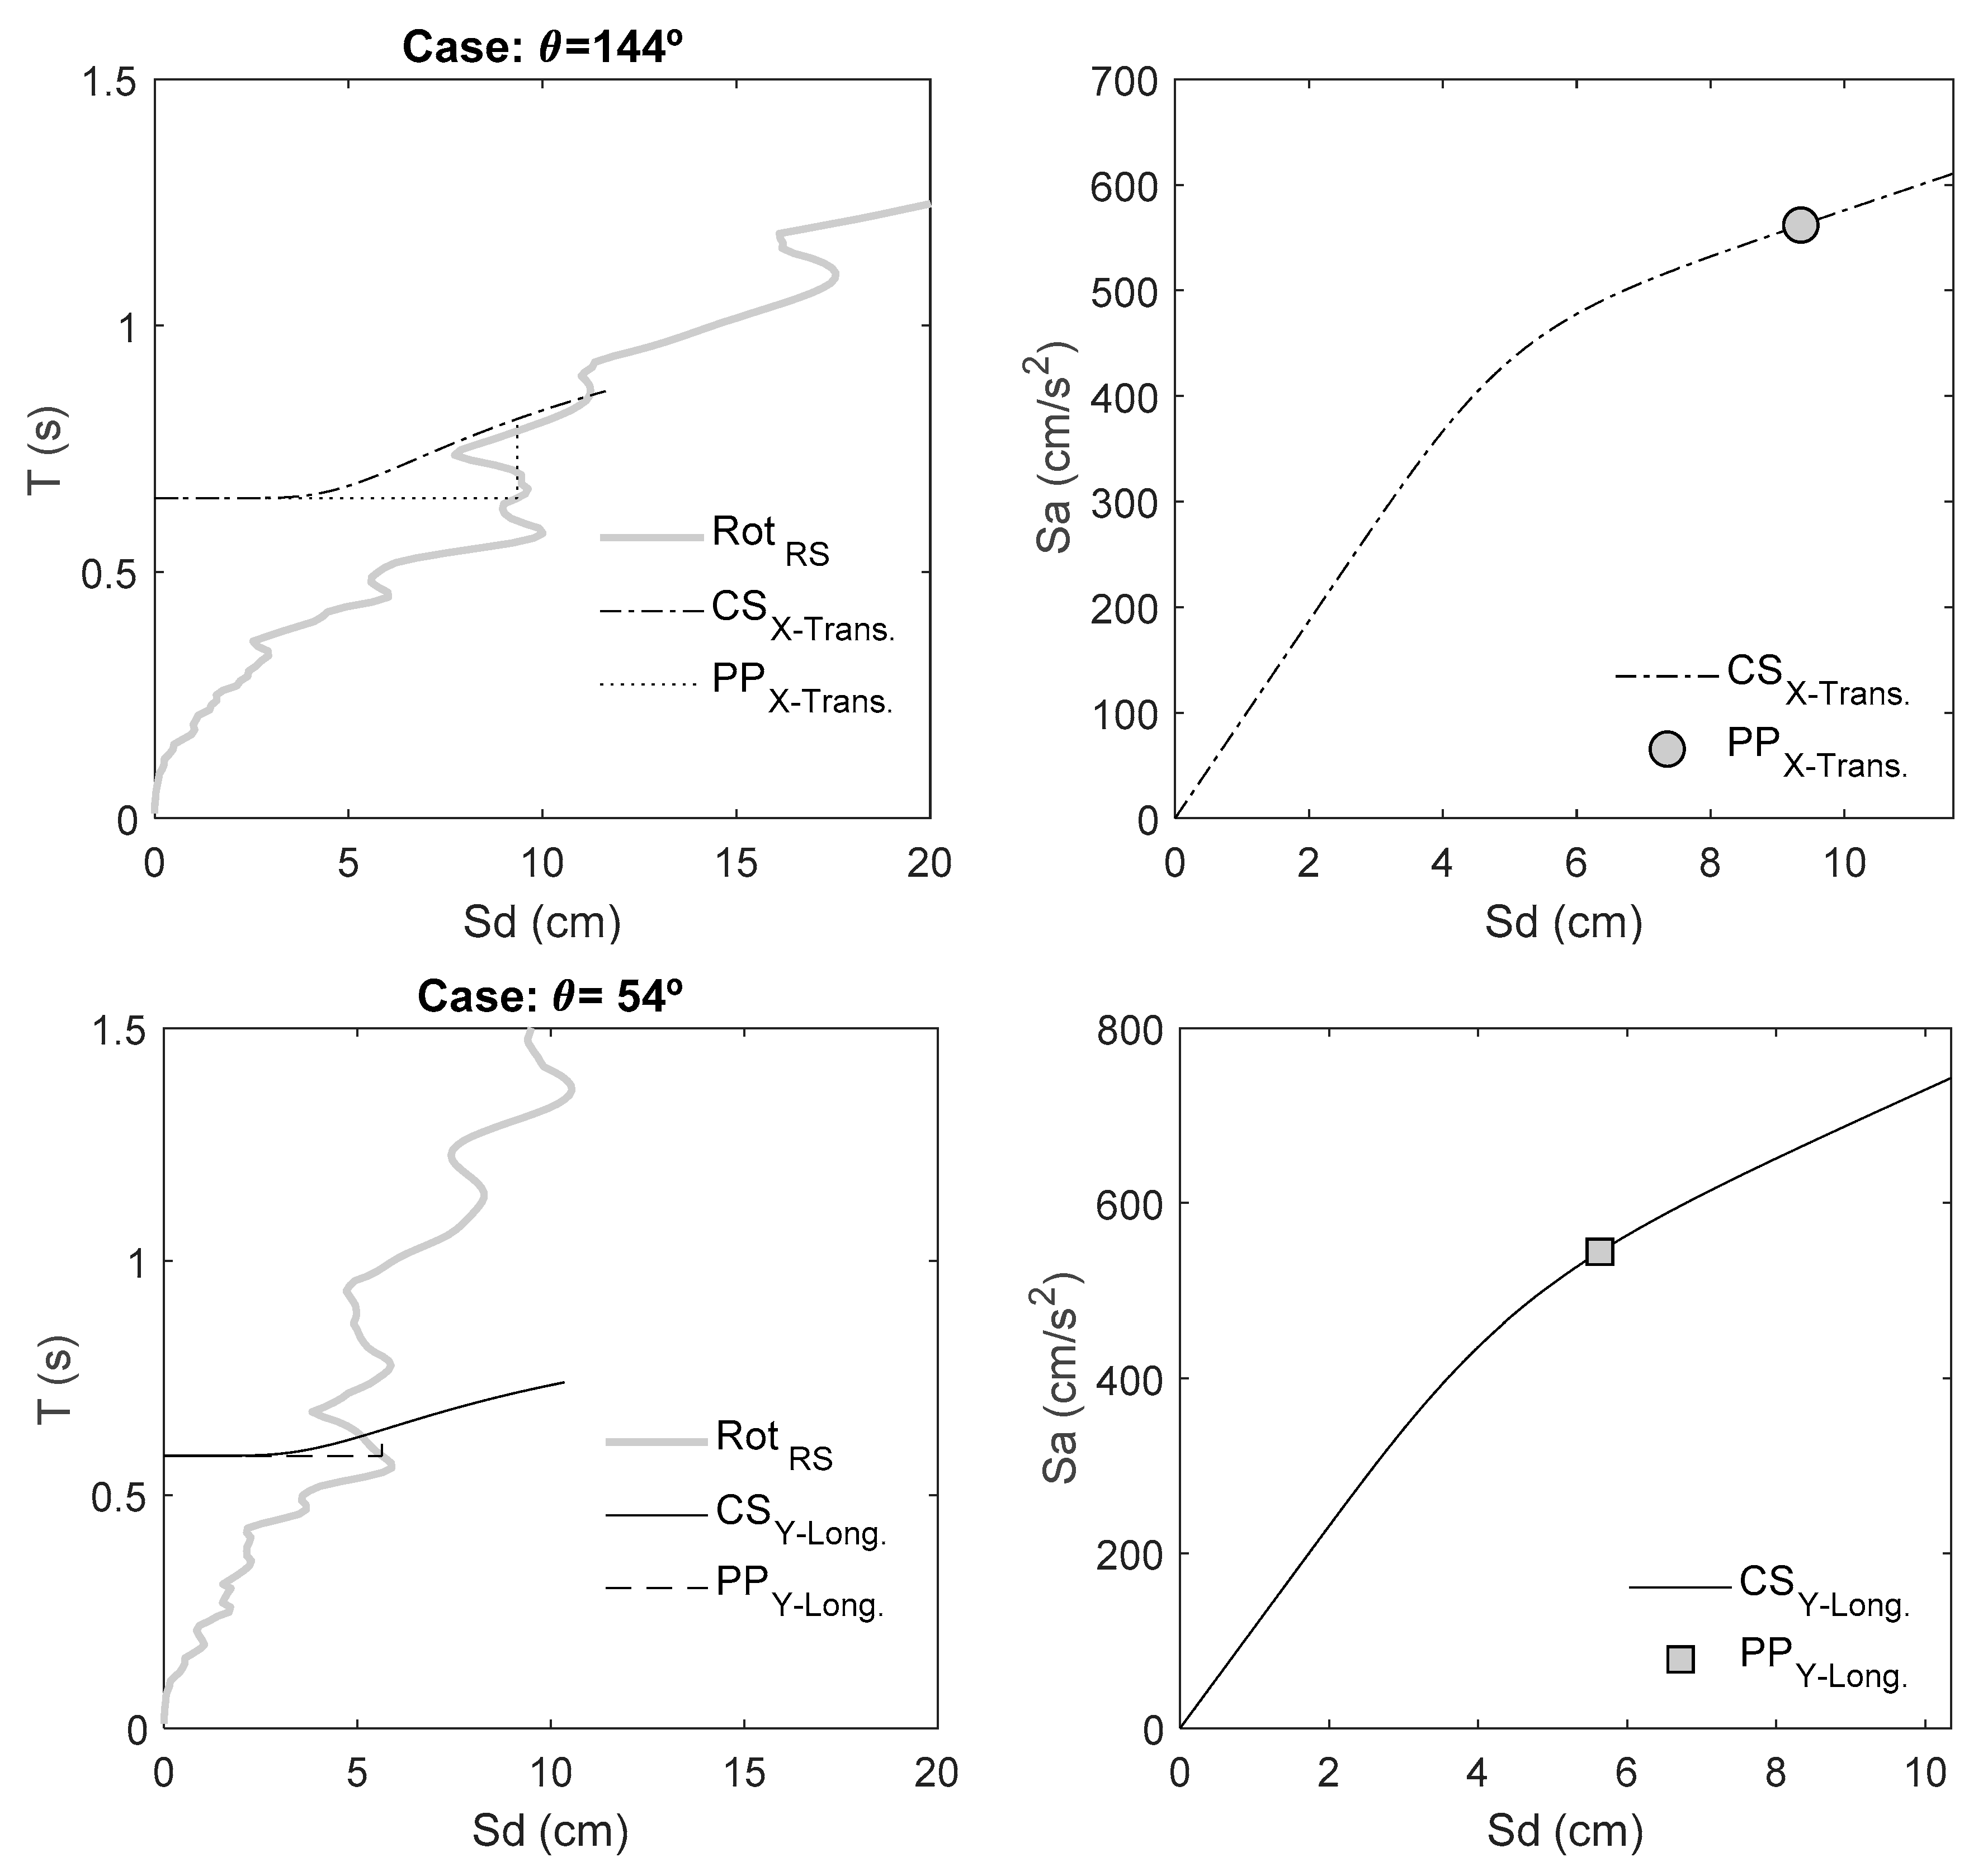
The damage states allow a qualitative evaluation of the expected damage in a structure or infrastructure. Thus, the most frequently used damage states are: 0 or Null damage, 1 or Slight damage, 2 or Moderate damage, 3 or Severe damage, and 4 or Complete damage. In the intensity scale EMS’98, five grades or damage states are used, so that the damage state 4 (Complete) is separated into two: 4 or Extensive and 5 or Collapse. The assessment methods used by engineers understand that the repair cost in case of Extensive damage do not compensate with respect to replacement cost. For this reason, when Generalized damage occurs, it is advisable to demolish; hence, the states of Generalized damage and Collapse are grouped into a single damage state that we refer to as Complete.
A delicate and relevant aspect in the evaluation of the expected damage of a structure is the damage state threshold definition. The probabilities of damage states are usually quantified by damage probability matrices, fragility curves, and mean damage states. For a specific damage state, the damage probability matrix defines the probability that a building suffers this damage state, and the fragility curve defines the probability that this state is matched or exceeded. The damage state threshold is defined for a probability that the damage state is equal to or exceeded by 50%. This fact added to the hypothesis that the damage is distributed according to a binomial distribution, which has been used to construct fragility curves in a simplified way. The hypothesis of the binomial distribution is robust and has been contrasted with the observed damage in seismic catastrophes in Italy [22,23]. The damage state threshold and the binomial distribution of damage allow us to directly construct the fragility curves and, based on them, the damage probability matrices, and curves of the mean damage state.
Within the framework of the European project Risk-UE [24], different damage states thresholds were proposed based on the bilinear form of the capacity spectrum, taking as a reference the spectral displacement of the yield point (Sdy, Say). Based on expert opinion, the following thresholds were chosen:
S d 1 = 0.7   S d y ; S d 2 = S d y ; S d 3 = S d y + 0.25 ( S d u S d y ) ; S d 4 = S d u
The damage state thresholds are shown in Figure 11. Moreover, based on damage studies in reinforced concrete buildings [19,20,25], Pujades et al. [11] established a Park and Ang damage index value of 0.05 for the threshold of Slight damage, 0.20 for the threshold of Moderate damage, 0.40 for Severe damage, and 0.65 for the Complete damage state. These thresholds, together with the corresponding spectral displacements, are also shown in Figure 11, both in the bilinear forms of the capacity spectra through the Risk-UE approach, and in the damage index based on the Park and Ang index, IPA. Significant differences are observed, especially for the states of Severe and Complete damage. Although it depends on the shape of the capacity spectrum, in general, the Risk-UE proposal tends to overestimate minor damage and underestimate severe damage.
For a given damage state, the fragility curve defines the probability that it be equal or exceeded. The following hypotheses are assumed: (i) the fragility curves can be modeled with a cumulative lognormal function, (ii) the damage is distributed in a binomial way [22,23], and (iii) in the thresholds of the damage states, the fragility curve is 0.50, allowing the fragility curves to be built expeditiously. Figure 12 shows the four fragility curves obtained. It can be seen how the thresholds based on the Risk-UE proposal leads to an underestimation of the probabilities of exceeding Severe and Complete damage states with respect to the thresholds based on the Park and Ang index, both in the X and Y directions.
These fragility curves are useful for the estimation of the damage probability matrices (DPM). Damage probability matrices define the probability of each of the five damage states. The following equation allows this estimation from the fragility curves:
P 0 ( S d ) = 1 F 1 ( S d ) P i ( S d ) = F i ( S d ) F i + 1 ( S d ) 1 i < 4 P 4 ( S d ) = F 4 ( S d )
In this equation, Pi(Sd) is the probability of damage state i and Fi(Sd) is the fragility curve of damage state i. It is also useful to have the mean damage state curve (MDS), which is defined by the following equation:
Mean   Damage   State   =   M D S ( S d ) = i = 0 4 i P i ( S d )
Figure 13 shows the evolution of the mean damage state for the X and Y directions and for the fragility curves based on the proposal of the Risk-UE project and the Park and Ang damage index. It can be seen how the Risk-UE proposal tends to overestimate minor damages and underestimate serious damages. On the other hand, this figure also shows the sensitivity of the expected damage to the choice of the thresholds of the damage states and the need to be careful in their definition.

3.2. Results

Building–Seismic Action Interaction

The impact of the earthquake on the building was analyzed assuming that the seismic action did not significantly differ from the one recorded near the site. The accelerograms recorded at AMNT station, the closest station to the building (5.22 km distant), were used (see Figure 14 and Figure 15). The X-Trans. axis of the building is oriented 144° from the east (counter-clockwise) and therefore the Y-Long. axis is oriented E54°N (see Figure 14). Figure 15 shows the horizontal as-recorded acceleration components and the particle motion (hodogram). As seen in this figure, the maximum acceleration (PGAmax) occurred at a different angle (see pink arrow and Table 1) from the as-recorded ones (0°—EW and 90°—NS). The maximum intensity occurred close to the transversal axis of the building.
To explore the influence of the directionality effects on the spectral response of this motion, the as-recorded components EW and NS were projected on an axis, which was rotated between 0- and 180-degrees using Equation (4) and the response spectra for each component were computed as well. Figure 16 shows the 5% damped response spectra of the rotated accelerograms. These spectra are shown in Sa-T and in Sa-Sd formats. This figure highlights the response spectra for an angle 0° (EW component), 90° (NS component), for the transversal direction of the building (X direction, Dir XTrans.) and for the longitudinal direction (Y direction, Dir YLong.). This figure also indicates the periods of the building in the X and Y axes. Note how the most intense seismic action is given for the XTrans. direction of the building, which most likely meant an increase in the damage caused by the earthquake on this building.
For a given seismic action and a specific building, the performance point, PP, specifies the maximum spectral displacement that the earthquake defined by the 5% damped response spectrum in the spectral acceleration-displacement format (Sd-Sa) would cause to the building defined by its capacity spectrum, also in the Sd-Sa format. Then, fragility curves and functions that define the mean damage state allow the level of expected damage that the earthquake would cause in the building to be known. An expedited, although approximate, way of estimating the performance point is the linear-equivalent approximation that assumes that the displacement would be the same as if the structure would have a linear behavior. Although this approach is conservative, it was considered sufficient for the purpose of this work.
Figure 17 illustrates the linear-equivalent approximation to obtain the performance points from the 5% damped response spectrum of the rotated accelerograms, in the transversal (X at 144°) and longitudinal (Y at 54°) directions of the building, respectively. As can be seen in this figure, despite the similarity in the capacity of each of the axes of the building, the expected damage in the XTrans. direction would be larger due to a higher seismic demand. The PP values obtained are shown in Table 4.
The mean damage state curves (see Figure 13) were used to estimate the expected damage and the fragility curves (see Figure 12) were used to estimate the probability of the Complete damage state as a function of the rotation angle of the seismic action. Figure 18 shows the results obtained. Table 5 summarizes the numerical values for the directions of the main axes of the building, which correspond to angles of 54° and 144°. The values of the mean damage state and the probability of Complete damage (P4, in percentage) are given for the two hypotheses used to define the thresholds of the damage states, the one based on the Risk-EU project and the one based on the damage index of Park and Ang. It is observed that if we take the thresholds of the damage states based on the Park and Ang damage index as the reference, the expected mean damage state is 3.50 and the probability of the complete damage state is 59.2%. This result also agrees with the damage observed in the studied building after the earthquake.
Finally, the damage probability matrices for the orientation of the main axes of the building were calculated. Figure 19 shows the results obtained for these two orientations and for the two hypotheses used to define the thresholds of the damage states. It is concluded that the lower damage obtained in the Y axis direction (approximately 54°) is due more to the lower intensity of the action in this direction than to the greater resistance of the building. The greater damage in the direction of the X axis (approximately 144°) is due more to the greater severity of the action than to the lower resistance of the building. However, it is also true that differences in the resistant properties of the building in its two main directions may also influence the expected damage.

4. Discussion and Conclusions

In this study, the peak ground-motion measures of the 2016 Ecuador earthquake were evaluated, obtaining interesting results. This event reaffirms the importance of continuing to develop research to reduce the seismic hazard and risk in Ecuador. Use of only the as-recorded components is not entirely correct when the effects of earthquakes are analyzed since, very often, the maximum acceleration does not occur in one of these components. As can be seen in the results presented herein, PGA is underestimated by about 10%, on average, when PGALarger and PGAmax are compared.
When the spectral acceleration is estimated, RotD100 is considered as the maximum possible response corresponding to the most critical case. Thus, these values can be used for design or risk assessment of structures of special importance. It is possible to estimate the maximum value for an available ground-motion dataset and this envelope can be considered as an earthquake with a large return period, representing the 100th percentile of all possible spectra for the available database.
In addition, the directionality effects were evaluated, through a deterministic analysis, in a building that was seriously damaged. The parametric model was applied to the capacity curves/spectra of the studied building. This model is useful and was adequate to model the capacity spectra resulting from the pushover analysis in both the transversal (X) and longitudinal (Y) directions of the building. The capacity in the X direction is slightly higher than in the Y direction. To obtain the fragility and damage curves, the proposals adopted in the Risk-UE project and those of the damage index proposed by Pujades et al. [11] based on the Park and Ang damage index were used. The trend of the Risk-UE proposal to overestimate the moderate damage and to underestimate the severe and complete damage referring to the method based on the Park and Ang index was confirmed. However, the sensitivity of the fragility and damage curves to the way of deciding/establishing the ultimate capacity point and the thresholds of the four non-null damage states must be carefully considered. Thus, studies oriented towards increasing the reliability and robustness of these limits are recommended. In the authors’ view, thresholds based on the Park and Ang index are more versatile and robust than those based on the bilinear form of the capacity spectrum (Risk-UE method).
The ground motion records from AMNT station, located 5 km away from the building, were used to estimate the expected damage under the hypothesis that this seismic action is what affected the building. For this purpose, a directionality analysis was carried out, concluding that the acceleration at the direction that coincides with the transversal axis of the building (144°) is close to the greater intensity, and this probably would have been the main cause of the damage. The probability of complete damage is close to 60%, which is in a reasonable agreement with the damage suffered by the building during the earthquake. However, this important damage must be attributed more to the severity of the action than to the uneven resistance of the two directions of the main axes of the building since, although they present differences in resistant properties, these differences are not very significant. This study allowed us to test the parametric model, verify the robustness and utility of the Park and Ang damage index, and verify the importance of considering the directionality of the seismic actions in damage assessment and seismic risk studies.
Since the orientation of the weak axis of a building and the direction of the maximum intensity of a motion can match, the directionality effects should be included within risk studies. Similar buildings, located in the same place, may suffer different damage grades depending on their orientation [4,26]. Thus, it will be essential to consider the azimuthal orientation of buildings when estimating seismic risk. Within the framework of the KaIROS project [27], several strategies to diminish uncertainties related to the seismic risk quantification are presented. One of them includes the directionality effect considering the azimuthal position of structures, the location of the epicenter, as well as the distance-to-the-hypocenter. In this way, it is possible to take into account that urban environments may be more prone to damage at specific incidence angles.

Author Contributions

L.A.P., L.G.P. and I.M.: data curation, formal analysis, software and writing; R.E.A.: formal analysis and software. All authors have read and agreed to the published version of the manuscript.

Funding

This research has been partially funded by the Ministry of Economy and Competitiveness (MINECO) of the Spanish Government and by the European Regional Development Fund (ERDF) of the European Union (EU) through projects with references CGL2015-65913-P (MINECO/ERDF, EU) and EFA158/16/POCRISC (INTERREG/POCTEFA. EU). R.E.A. holds a PhD fellowship from the Consejo Nacional de Ciencia y Tecnología (CONACyT) in México.

Acknowledgments

We would like to thank the Geophysical Institute of the National Polytechnic School of Ecuador (IGEPN for its acronym in Spanish) for share with us the acceleration records of the 2016 earthquake. In addition, we would like to thank José Gregorio Zambrano for providing us with the structural blueprints of the building under study.

Conflicts of Interest

The authors declare no conflict of interest.

References

  1. Singaucho, J.C.; Aurore, L.; Viracucha, C.; Ruiz, M. Observaciones del sismo del 16 de abril de 2016 de magnitud Mw 7.8. Intensidades y aceleraciones. Inf. Ref. Datos RENAC 2016, 1–20. [Google Scholar]
  2. Bilek, S.L. Invited review paper: Seismicity along the South American subduction zone: Review of large earthquakes, tsunamis, and subduction zone complexity. Tectonophysics 2010, 495, 2–14. [Google Scholar] [CrossRef]
  3. Pinzón, L.A.; Pujades, L.G.; Macau, A.; Figueras, S. Increased seismic hazard in Barcelona (Spain) due to soil-building resonance effects. Soil Dyn. Earthq. Eng. 2019, 117, 245–250. [Google Scholar] [CrossRef]
  4. Pinzón, L.A.; Pujades, L.G.; Diaz, S.A.; Alva, R.E. Do Directionality Effects Influence Expected Damage? A Case Study of the 2017 Central Mexico Earthquake. Bull. Seismol. Soc. Am. 2018, 108, 2543–2555. [Google Scholar] [CrossRef] [Green Version]
  5. Pinzón, L.A.; Mánica, M.A.; Pujades, L.G.; Alva, R.E. Dynamic soil-structure interaction analyses considering directionality effects. Soil Dyn. Earthq. Eng. 2020, 130, 106009. [Google Scholar] [CrossRef]
  6. Pinzón, L.A.; Pujades, L.G.; Hidalgo-Leiva, D.A.; Diaz, S.A. Directionality models from ground motions of Italy. Ing. Sismica 2018, 35, 43–63. [Google Scholar]
  7. Pinzón, L.A.; Diaz, S.A.; Pujades, L.G.; Vargas, Y.F. An efficient method for considering the directionality effect of earthquakes on structures. J. Earthq. Eng. 2019, 1–30. [Google Scholar] [CrossRef]
  8. Boore, D.M. Orientation-Independent, Nongeometric-Mean Measures of Seismic Intensity from Two Horizontal Components of Motion. Bull. Seismol. Soc. Am. 2010, 100, 1830–1835. [Google Scholar] [CrossRef]
  9. Moya-Fernández, A.; Pinzón, L.A.; Schmidt-Díaz, V.; Hidalgo-Leiva, D.A.; Pujades, L.G. A Strong-Motion Database of Costa Rica: 20 Yr of Digital Records. Seismol. Res. Lett. 2020, 91, 3407–3416. [Google Scholar] [CrossRef]
  10. Computers and Structures, Inc. ETABS—Integrated Analysis, Design and Drafting of Building; Systems Computers and Structures, Inc.: Walnut Creek, CA, USA, 2019. [Google Scholar]
  11. Pujades, L.G.; Vargas-Alzate, Y.F.; Barbat, A.H.; González-Drigo, J.R. Parametric model for capacity curves. Bull. Earthq. Eng. 2015, 13, 1347–1376. [Google Scholar] [CrossRef] [Green Version]
  12. Ye, L.; Kanamori, H.; Avouac, J.P.; Li, L.; Cheung, K.F.; Lay, T. The 16 April 2016, MW 7.8 (MS 7.5) Ecuador earthquake: A quasi-repeat of the 1942 MS 7.5 earthquake and partial re-rupture of the 1906 MS 8.6 Colombia–Ecuador earthquake. Earth Planet. Sci. Lett. 2016, 454, 248–258. [Google Scholar] [CrossRef] [Green Version]
  13. Shrivastava, M.N.; González, G.; Moreno, M.; Reddy, C.; Salazar, P.; Yáñez, G.; González, J.; de la Llera, J.C.; Báez, J.C. Coseismic and Afterslip of the Mw 8.3 Illapel Earthquake 2015 from Continuous GPS data. Geophys. Res. Lett. 2016, 43, 10710–10719. [Google Scholar] [CrossRef] [Green Version]
  14. Vigny, C.; Socquet, A.; Peyrat, S.; Ruegg, J.-C.; Métois, M.; Madariaga, R.; Morvan, S.; Lancieri, M.; Lacassin, R.; Campos, J.; et al. The 2010 Mw 8.8 Maule Megathrust Earthquake of Central Chile, Monitored by GPS. Science 2011, 330, 1417–1422. [Google Scholar] [CrossRef] [Green Version]
  15. Shahi, S.K.; Baker, J.W. NGA-West2 models for ground motion directionality. Earthq. Spectra 2014, 30, 1285–1300. [Google Scholar] [CrossRef] [Green Version]
  16. Haji-Soltani, A.; Pezeshk, S. Relationships among Various Definitions of Horizontal Spectral Accelerations in Central and Eastern North America. Bull. Seismol. Soc. Am. 2017, 108, 409–417. [Google Scholar] [CrossRef]
  17. Boore, D.M.; Kishida, T. Relations Between Some Horizontal-Component Ground-Motion Intensity Measures Used in Practice 1. Bull. Seismol. Soc. Am. 2016, 107, 334–343. [Google Scholar] [CrossRef]
  18. FEMA. Prestandard and commentary for the seismic rehabilitation of buildings, FEMA 365. Fed. Emerg. Manag. Agency 2000, 518. [Google Scholar]
  19. Park, Y.; Ang, A.H.S.; Wen, Y.K. Seismic damage analysis of reinforced goncrete buildings. J. Struct. Eng. 1985, I11, 740–757. [Google Scholar] [CrossRef]
  20. Park, Y.; Ang, A.H.-S. Mechanistic Seismic Damage Model for Reinforced Concrete. J. Struct. Eng. 1985, 111, 722–739. [Google Scholar] [CrossRef]
  21. Hidalgo-Leiva, D.A.; Pujades, L.G.; Barbat, A.H.; Diaz, S.A.; Vargas-, Y.; Pinzón, L.A. Damage index for structures with elements of high flexural stiffness and/or brittle behavior. In Proceedings of the 16th European Conference on Earthquake Engineering, Thessaloniki, Greece, 18–21 June 2018; pp. 1–12. [Google Scholar]
  22. Braga, F.; Dolce, M.; Liberatore, D. A Statistical Study on Damaged Buildings and an Ensuing Review of the MSK-76 Scale. In Proceedings of the Seventh European Conference on Earthquake Engineering, Athens, Greece, 20–25 September 1982; pp. 431–450. [Google Scholar]
  23. Braga, F.; Dolce, M.; Liberatore, D. Assessment of the relationships between Macroseismic Intensity, Type of Building and Damage, based on the recent Italy Earthquake Data. In Proceedings of the 8th European Conference on Earthquake Engineering, Lisbon, Portugal, 7–12 September 1986; pp. 39–46. [Google Scholar]
  24. Milutinovic, Z.V.; Trendafiloski, G.S. WP4: Vulnerability of Current Buildings; Institute of Earthquake Engineering and Engineering Seismology (IZIIS): Skopje, North Macedonia, 2003; Volume 111. [Google Scholar]
  25. Cosenza, E.; Manfredi, G. Damage indices and damage measures. Prog. Struct. Eng. Mater. 2000, 2, 50–59. [Google Scholar] [CrossRef]
  26. Vargas-Alzate, Y.F.; Pujades, L.G.; Barbat, A.H.; Hurtado, J.E.; Diaz, S.A.; Hidalgo-Leiva, D.A. Probabilistic seismic damage assessment of reinforced concrete buildings considering direccionality effects. Struct. Infrastruct. Eng. 2018, 14, 817–829. [Google Scholar] [CrossRef]
  27. Vargas-Alzate, Y.F. KaIROS Project. Keeping and Increasing Resilience Opportunities and Sustainability of Communities against Earthquakes. European Commission: Brussels, Belgium. Available online: https://cordis.europa.eu/project/rcn/215743/factsheet/en2018 (accessed on 8 February 2021).
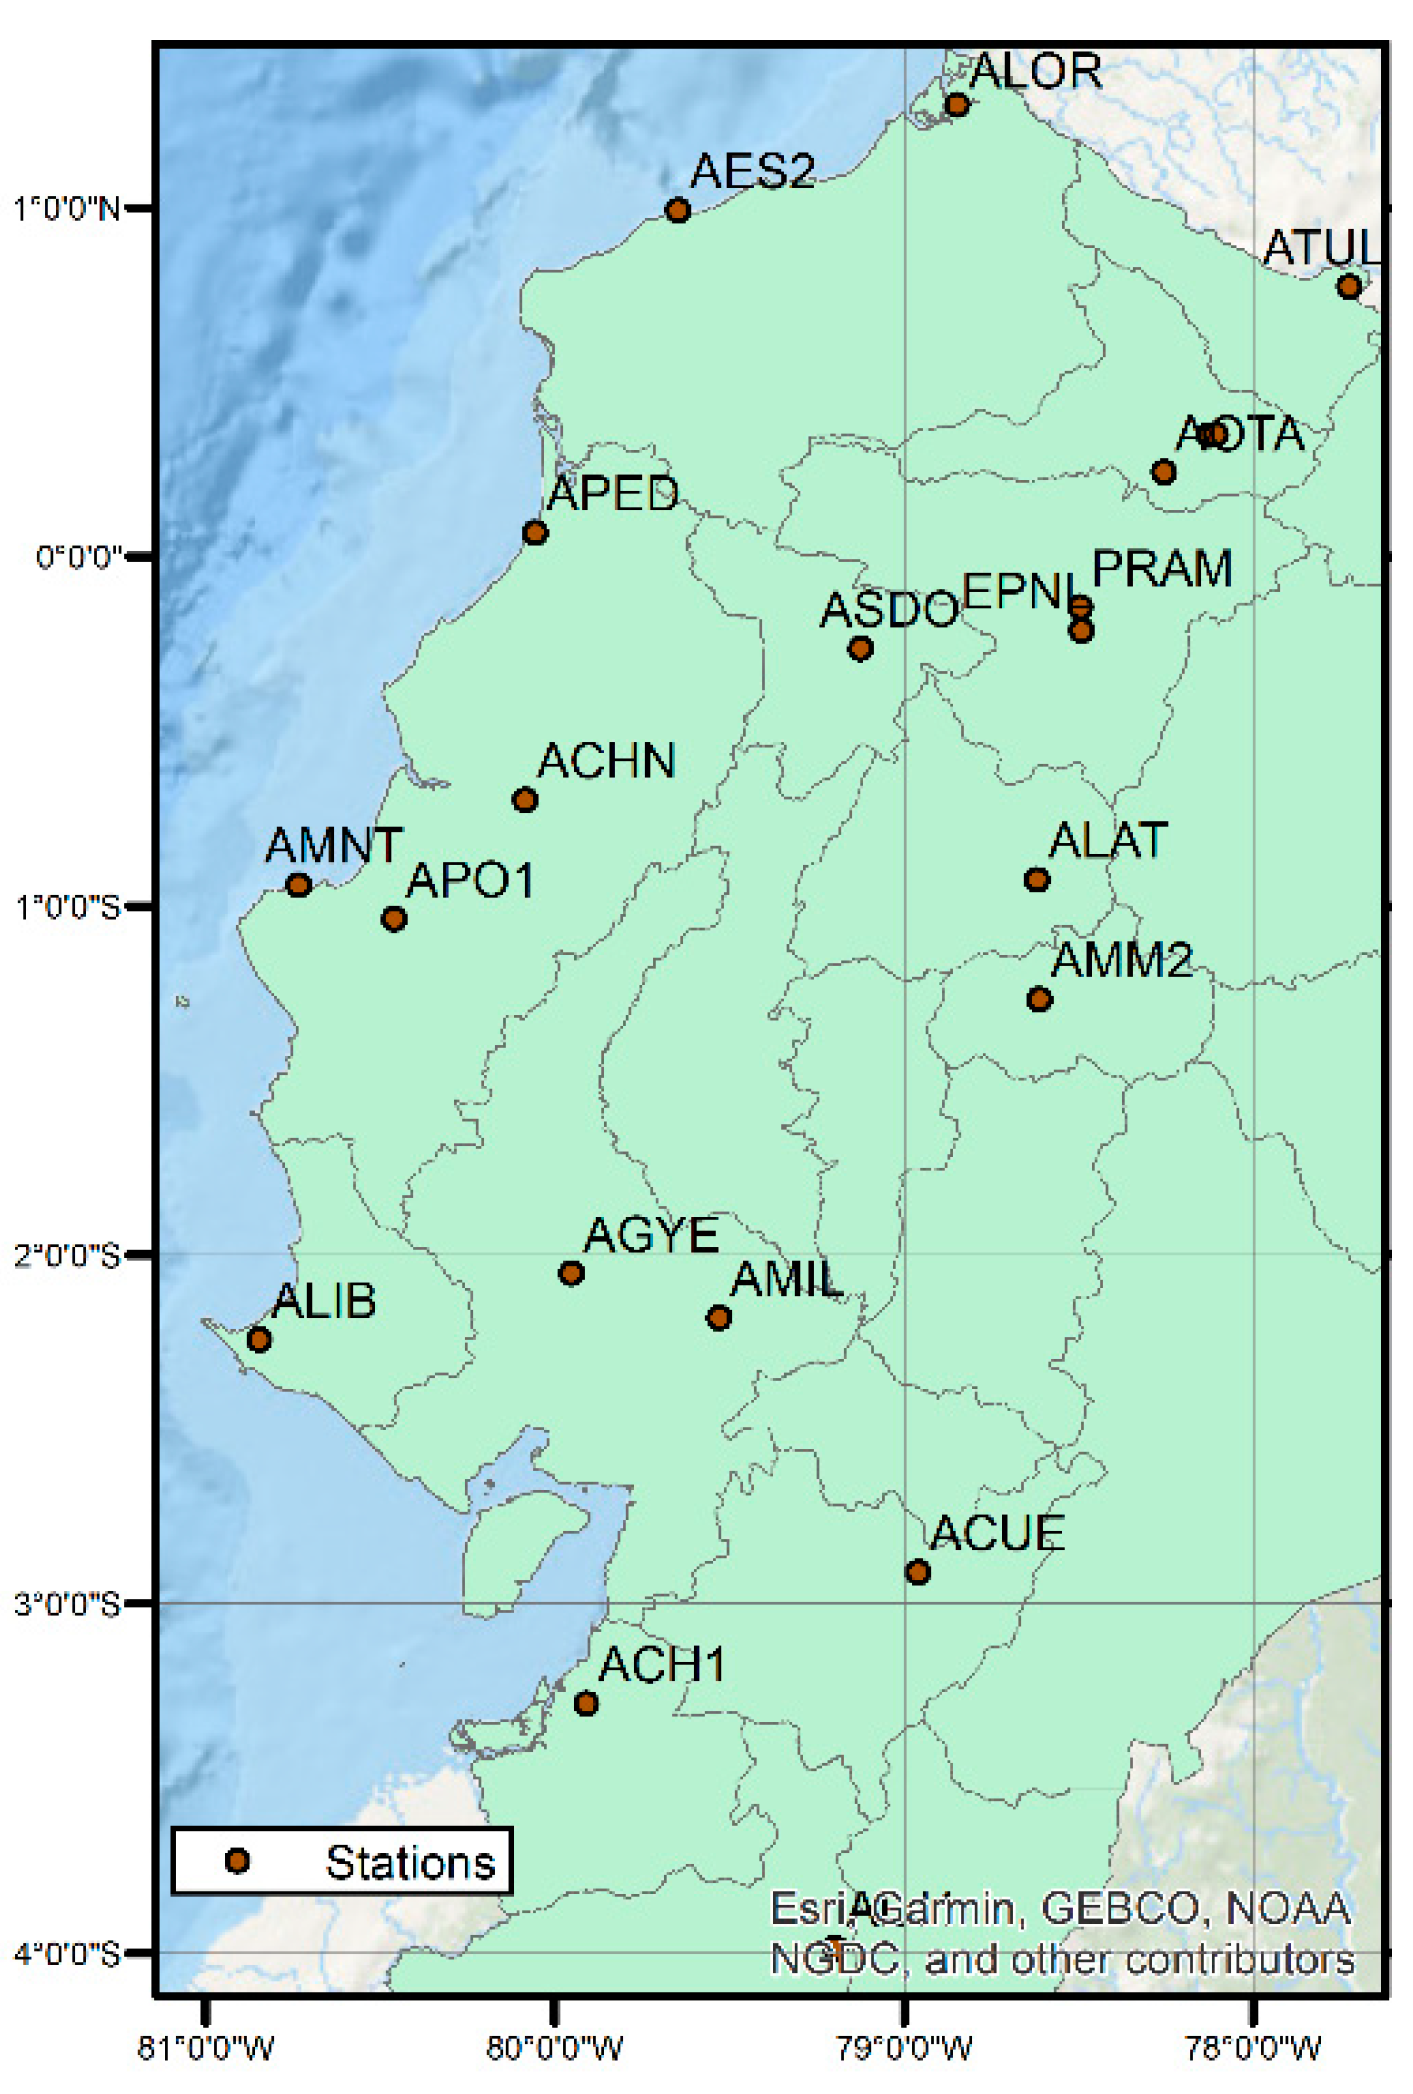
Figure 1. Strong-motion stations from the National Accelerographic Network of Ecuador (RENAC).
Geosciences 11 00074 g001
Figure 2. Peak ground acceleration maps of the as-recorded components (a) N-S and (b) E-W, (c) the larger value of the as-recorded components, and (d) the true peak acceleration (PGAmax).
Geosciences 11 00074 g002
Figure 3. Flow direction of the PGAmax in the horizontal plane during the 2016 Ecuador earthquake.
Geosciences 11 00074 g003
Figure 4. Response spectra of the horizontal as-recorded rotated components and the RotD100 response spectrum for the 2016 Ecuador earthquake ground motion recorded in AMNT station.
Geosciences 11 00074 g004
Figure 5. Comparison of the ratios RotD100/GM and RotD100/Larger obtained with the 2016 Ecuador earthquake motion with the ratios obtained by other researchers.
Geosciences 11 00074 g005
Figure 6. (a) Studied building. (b) In green, the main building used to build up the structural model and in red, the annex that was not considered in the structural model (pictures taken from Google Maps street view).
Geosciences 11 00074 g006
Figure 7. Distribution and geometry of the beams and columns.
Geosciences 11 00074 g007
Figure 8. Capacity curve and spectra in the X and Y directions. The points resulting from the pushover analysis, the interpolated curves (int) at a fixed step, and the bilinear forms (Bilinear) are shown.
Geosciences 11 00074 g008
Figure 9. Parametric model fit in the X-direction.
Geosciences 11 00074 g009
Figure 10. Parametric model fit in the Y-direction.
Geosciences 11 00074 g010
Figure 11. Capacity spectra (left) and damage functions (right) for: X direction and Y direction. Bilinear forms of capacity spectra and thresholds of damage states based on the Risk-UE project (DsTrh RUE) and those based on the Park and Ang damage index (DsTrh IPA) are shown. See also the explanations in the text.
Geosciences 11 00074 g011
Figure 12. Fragility curves: (a) X-direction, Risk-UE thresholds, (b) X-direction, Park and Ang index thresholds; (c) Y-direction, Risk-UE thresholds, (d) Y-direction, Park and Ang index thresholds.
Geosciences 11 00074 g012
Figure 13. Mean damage state curves based on Risk-UE and Park and Ang damage-based index.
Geosciences 11 00074 g013
Figure 14. Location and distance between the studied building and the closest accelerometric station, AMNT. The orientation of the building with respect to north is also depicted.
Geosciences 11 00074 g014
Figure 15. 2016 MW 7.8 Ecuador earthquake recorded at AMNT station. (a) As-recorded E-W and N-S accelerograms, and (b) acceleration hodogram.
Geosciences 11 00074 g015
Figure 16. The 5% damped response spectra for the accelerograms obtained in the direction defined by the angle θ, from the projection of the as-recorded components EW and NS recorded at AMNT station. This figure is given in period-spectral acceleration (T-Sa) and in spectral displacement-spectral acceleration (Sd-Sa) formats. The fundamental periods of the principal axes of the building (XTrans. and YLong.) are also indicated.
Geosciences 11 00074 g016
Figure 17. Linear-equivalent approximation to estimate the performance point of XLong. (144° case) and YLong. (54° case) axes.
Geosciences 11 00074 g017
Figure 18. Mean damage state and complete damage probability as a function of the rotation angle of the seismic action. The orientation of the principal axes of the building (54° and 144°) is shown.
Geosciences 11 00074 g018
Figure 19. Damage probability matrices for the two main axes of the building (54° and 144° approximately) and for the two hypotheses used to define the damage states’ thresholds.
Geosciences 11 00074 g019
Table 1. Values of PGAEW, PGANS, PGAmax, PGAmax/PGALarger ratio, and θPGA(max) for the 21 ground motions recorded by the National Accelerographic Network of Ecuador. Repi: epicentral distance.
StationRepi
(km)
PGAEW
(m/s2)
PGANS
(m/s2)
PGAmax
(m/s2)
P G A m a x P G A L a r g e r   θPGA(max)
Azimuth North
AMM22350.250.350.351.00354°
ACH14070.250.240.301.2043°
ACHN1203.203.644.121.13210°
ACUE3810.350.290.351.00271°
AES2761.511.081.521.0096°
AGYE2700.180.230.241.04340°
AIB12020.480.570.581.02166°
AIB22040.210.320.321.00357°
ALAT2060.310.270.311.0085°
ALIB3080.410.390.461.1256°
ALJ14920.150.160.171.06209°
ALOR1590.260.260.261.00175°
AMIL2880.510.450.531.04244°
AMNT1713.975.145.341.04340°
AOTA1880.420.340.481.14240°
APED3613.808.1313.971.01279°
APO11673.113.744.161.11226°
ASDO1152.021.092.061.02260°
ATUL2510.160.210.211.00
EPNL1740.260.200.271.04260°
PRAM1710.240.230.251.0444°
Table 2. Geometry of the sections and specifications of the materials of the beams and columns of the building studied.
Section Codefc (kg/cm2)Dimensions (mm)Steel RebarRebar
C-1 and C-2180400 × 4008 #5A615 Grade 40
C-3180450 × 4504 #5 + 4 #6A615 Grade 40
C-4 and C-5180350 × 3508 #5A615 Grade 40
C-6180400 × 4004 #5 + 4 #6A615 Grade 40
C-7 and C-8180300 × 3008 #4A615 Grade 40
C-9180350 × 3504 #4 + 4 #5A615 Grade 40
Beam-1170200 × 5002 #3 + 2 #4A615 Grade 40
Beam-2170200 × 3002 #3 + 2 #4A615 Grade 40
Beam-3170200 × 6002 #3 + 2 #4A615 Grade 40
Table 3. Parameters of the parametric model for the capacity spectra (CS) in the X and Y axes.
CSm (g/cm)Sdu (cm)Sau (g)µ (adim)σ (adim)εL (adim)
X0.09511.620.6220.4200.2417.35 × 10−3
Y0.11810.350.7570.4100.3311.28 × 10−2
Table 4. Performance point values from the principal axes of the studied building.
AxisAngleSapp (cm/s2)Sdpp (cm)
X-Trans.144°561.89.3
Y-Long.54°544.25.6
Table 5. Mean damage state and complete damage probability in the main axes of the building based on the proposal of the Risk- UE project and, the Park and Ang damage index.
AxisAngleMean Damage StateComplete Damage Probability (%)
IPARUEIPARUE
X-Trans.144°3.503.0759.2434.85
Y-Long.54°2.092.407.5212.91
Publisher’s Note: MDPI stays neutral with regard to jurisdictional claims in published maps and institutional affiliations.

