
Potentially Mobilizable Geogenic As and Sb in an Agricultural Wetland Soil

PEIRENE Laboratory, University of Limoges, 123 Av. Albert Thomas, CEDEX, 87060 Limoges, France
*
Author to whom correspondence should be addressed.
Geosciences 2021, 11(11), 444; https://doi.org/10.3390/geosciences11110444
Submission received: 13 July 2021
/
Revised: 20 October 2021
/
Accepted: 24 October 2021
/
Published: 28 October 2021
(This article belongs to the Special Issue Wetland Soils as Regulators of the Quality and Quantity of Surface Water)
Abstract
:The mobility of arsenic (As) and antimony (Sb) in soils is controlled by several processes (adsorption/desorption, (co)precipitation/dissolution and oxidation/reduction), depending on various environmental factors that are often convoluted and site-dependent. This study investigated: (i) the content and solid-phase distribution of geogenic As and Sb in a vertical soil profile (0–130 cm) of an agricultural wetland subject into alternating oxic and anoxic conditions induced by periodic waterlogging and (ii) identifies the stability of the As and Sb host phases during soil reduction (laboratory incubation) using a sequential extraction procedure (fractions: loosely and strongly adsorbed, carbonates, easily reducible, reducible, oxidable and residual). The field results showed that, in the deeper, permanently water-saturated soil layers (<60 cm), the amounts of As and Sb were relatively low (As: 8 ± 2 µg·g−1 and Sb: 0.9 ± 0.2 µg·g−1) and related to the Fe content. In the periodically flooded upper soil layers (0–40 cm), the amounts of As and Sb were higher compared to the deeper layers (As: 36 ± 3 µg·g−1 and Sb: 1.14 ± 0.05 µg·g−1). The observed enrichment towards the surface was attributed to the higher content of organic matter (for Sb) and metalloids distribution among the easily reducible fraction (for As). The anoxic laboratory incubation of periodically waterlogged soil showed that, during soil reduction, As is largely mobilized from the easily reducible fraction and undergoes partial readsorption. Unlike As, Sb displayed a higher affinity for more stable soil components (e.g., reducible and residual fractions), which highlights its limited mobility in periodically waterlogged soil compared to As. The potentially mobilizable As and Sb estimated as the sum of the acetate-exchangeable, P-exchangeable, easily reducible and H2O2-organic fractions represent up to 83%, 69% and 53% of the total As and up to 53%, 44% and 54% of the total Sb at 0–20-cm, 40–60-cm and 90–110-cm depths, respectively. Thus, unpolluted soils may act as sources of As and Sb to aquatic environments and therefore have negative consequence on the downstream water quality.
1. Introduction
In most unpolluted soils, the average geochemical background of arsenic (As) ranges between 1 and 20 mg·kg−1 and is about 1 mg·kg−1 for antimony (Sb) [1,2,3,4]. Despite their low concentration in natural soils, both elements pose an environmental concern because of their toxicity, especially when they occur in a dissolved, reduced oxidation state (H3AsO30 (As(III)) and Sb(OH)3 (Sb(III)) [5,6,7,8].
In soil, As and Sb are distributed between the solid compartment (mineral and organic particles) and dissolved fractions. The mobility of Sb and As at the soil/water interface is controlled by naturally occurring biogeochemical processes (e.g., by adsorption/desorption, (co)precipitation/dissolution and oxidation/reduction reactions). The adsorption of As and Sb usually occurs when soils are exposed to oxidizing conditions (Eh > 400 mV, pH 5–8). Under such conditions, dissolved As and Sb prevail as oxyanions As(V) (H2AsO4− and HAsO42−) and Sb(V) (Sb(OH)6−) species [7,9] and, thus, display an affinity for positively charged mineral surfaces (e.g., Fe/Mn oxyhydroxides) [10,11]. The As(V) and Sb(V) association with solid phases occurs through weak (electrostatic interactions or the formation of outer sphere complexes) and strong adsorption (interactions with inner-sphere complexes) [12,13,14]. The reduced form of As oxyanions (As(III)) has less affinity for soil surfaces compared to its oxidized counterpart (As(V)) [15,16], whereas Sb in its oxidized oxyanion form (Sb(V)) was reported to have less affinity for sorbing surfaces compared to the reduced form (Sb(III)) [17]. Therefore, the adsorbed fraction of As and Sb in soils can be mobilized by desorption processes through anion-exchange processes, which can be induced by a pH increase (exchange with OH−) or mineral or organic competitive anions (e.g., phosphate, carbonate, acetate and sulfate) [18,19,20,21]. The (co)precipitation of As and Sb is usually observed in soils characterized by sulfate-reducing conditions involving the precipitation of sulfide (e.g., realgar, orpiment and arsenopyrite [22]) or in soils exposed to oxidizing conditions causing Fe(II) oxidation and, thus, the formation of Fe-precipitates (e.g., oxyhydroxides and scorodite [23,24]). Under extreme reducing conditions, elemental arsenic may be also present. In both cases, the mobilization of As and Sb requires the dissolution of the host minerals. This phenomenon usually occurs under: (i) extremely acidic conditions (pH < 3) for several As or Sb host minerals; (ii) oxidizing conditions, which is the case for sulfide minerals, or (iii) reducing conditions for Fe and Mn oxyhydroxides [25,26,27,28]. In all cases, the dissolution of minerals induces the release of (co)precipitated and adsorbed As and Sb.
In addition to the adsorption and (co)precipitation retention processes, As and Sb may also be retained by complexation with soil organic matter or dissolved organic matter (DOM) immobilized onto mineral surfaces [29]. Oxyanions may associate with humic substances and be bound in ternary metal-bridging complexes [30,31]. In this case, the release of both metalloids is governed by the solubilization and/or the release of DOM, which itself enhances As and Sb mobilization through: (i) the formation of DOM–As/Sb complexes [32,33,34] or (ii) competition for oxyanion-binding sites [31,35,36].
In wetland soils subjected to periodic waterlogging, the mobility of As and Sb at the soil–water interface is impacted by the oscillation of reducing and oxidizing conditions induced by water table fluctuations [37,38,39]. In soils developing moderately reducing conditions (absence of nitrates, ferrous iron and sulfate present), (i) the release of dissolved As occurs preferentially under Fe-reducing conditions, whereas the release of dissolved Sb is mainly favored under oxidizing conditions, particularly when dissolved organic carbon (DOC) is released in soil porewater [39]. This indicates that, in periodically waterlogged soils, As and Sb behave differently and can be mobilized from different host phases and/or through different mechanisms. The main processes governing the release of dissolved As and Sb in such systems is attributed to the reductive dissolution of As- and Sb-bearing Fe-oxyhydroxides and the decomposition of soil organic matter. Since an increase in pH is often observed in wetland soils developed on crystalline substratum during developing Fe-reducing conditions [40,41], the release of As and Sb could be amplified by the desorption process.
In order to assess the potential mobility of soluble As and Sb in periodically waterlogged soils, i.e., soils subjected to everlasting changes in the redox state (and soil pH), it is important to determine the carrier phases of both elements, as some bearing phases can only be “activated” under specific conditions. Being susceptible to changes under changing biophysicochemical conditions, As and Sb can be released, transferred or redistributed onto soil mineral and organic host phases [42] upon soil reduction or oxidation. Therefore, in periodically wetland soils, the mobility and associated bioavailability and toxicity of As and Sb depend largely on their solid-phase distribution, while the assessment of the total As and Sb contents does not adequately reflect their environmental hazard.
The aim of this study was to assess the potential mobility of As and Sb in an unpolluted, redox-active soil environment. For this purpose, both the total content and solid-phase distribution of As and Sb were evaluated within a vertical wetland soil profile (0–130 cm) subject to short-term water table fluctuations and impacted by oscillating oxic and anoxic conditions. The impact of the developed anoxic conditions on the release and redistribution of As in soil was also determined through a laboratory batch incubation. The solid-phase distribution of As and Sb was obtained by a chemical sequential extraction procedure (SEP) (fractions: loosely and strongly adsorbed, carbonates, easily reducible, reducible, oxidable and residual).
2. Materials and Methods
2.1. Soil Sampling and Characterization
This study was conducted on soil samples collected from an agricultural headwater wetland (in the northeast of region Nouvelle Aquitaine and the west area of French Massif Central, LaRoselle catchment, France) used for cattle feeding. The 0–60-cm horizon is periodically waterlogged, while the 60–130-cm horizon is permanently water saturated (see Figure 1) and is classified as a gleysol, according to the world reference base for soil resources [43]. The studied soil was developed into a crystalline substratum, potentially inducing high concentrations of trace elements. The soil samples were collected at 20-cm increments from the surface to a 130-cm depth. The collected soil samples were air-dried at room temperature (20 ± 2 °C) and sieved at 2 mm until further experimentations. The total contents of As, Sb, Fe and Mn were determined by adding 0.5 g of dry soil (in triplicate) to 5 mL of H2O2, 4 mL of HCl (37%) and 4 mL of HNO3 (69%) for 10 min at 180 °C by microwave heating (Multiwave Go). The loss on ignition (LOI%) was determined for all the soil samples by heating dry samples at 550 °C for 2 h. The analysis methods were reported in detail by Rouwane et al. [39].
2.2. Experimental Setup: Soil Incubation under Reducing Conditions
Anoxic soil incubations were conducted on the wetland topsoil (0–40 cm). Each glass bottle contained 12.5 g of soil and 250 mL of a synthetic solution. The chemistry of the synthetic solution simulated the composition of the wetland surface runoff (5-mg·L−1 NO3−, 15-mg·L−1 SO42−, 17.8-mg·L−1 Cl−, 25.5-mg·L−1 HCO3−, 7-mg·L−1 K+, 10-mg·L−1 Ca2+, 3.8-mg·L−1 Mg2+ and 7.1-mg·L−1 Na+). Prior to incubation, the soil solution was flushed with a nitrogen stream (ultra-high purity grade (5.0) nitrogen); then, the bottles were septum-sealed. Soil incubations were carried out in darkened batches at 20 ± 2 °C for 36 days with stirring (130 rpm). More details on a similar batch experimental setup were reported in a previous study [39]. The soil used for laboratory incubation was rich in organic components (loss on ignition: 29.6%; total C content: 116 g·kg−1) and Fe (Fe2O3: 3.1%). The pHH2O of the soil was 5.4, and the granulometric distribution was as follows: 35% clays, 35% silt and 30% sand.
2.3. Soil Solution Analysis
A soil solution was obtained by sampling on days 0, 3, 7, 11, 22 and 36 in a nitrogen-filled (ultra-high purity grade (5.0) nitrogen) glove box to avoid oxidation of the reduced species. The soil solution pH and Eh were measured using a pH meter (Mettler Toledo FE20) and a platinum electrode combined with an Ag/AgCl probe (WTW Electrode sentix ORP), respectively, immediately after batch opening inside the oxygen-free glove box. The values were represented in millivolts (mV) relative to the standard hydrogen electrode and corrected according to the temperature and pH from Bohn [44]. The samples were filtered through a 0.2-µm cellulose acetate membrane (Minisart), and the dissolved Fe(II) was determined on an aliquot by the colorimetric 1.1 phenanthroline method (with a quantification limit of 0.02 mg·L−1). The hydrogenocarbonate (HCO3−) concentration was determined by titration using HCl (10–3 –10−2 mol·L−1) immediately after sampling. The total dissolved Fe was performed by the colorimetric 1.1 phenanthroline method for the soil solution from incubation, whereas, for solutions from sequential extractions, it was determined by flame atomic absorption spectroscopy (AAS) using a Varian SpectrAA220 spectrometer with a quantification limit of 0.1 mg·L−1.
The aliquots devoted for dissolved organic carbon (DOC) measurements were stored at −21 °C, whereas those devoted for As, Sb and Mn measurements were acidified (2% HNO3 (v/v)) and stored at 4 °C. Dissolved concentrations of As, Sb and Mn were determined by ICP–MS (Agilent 7700×, Agilent technologies) with average limits of quantification (LOQ) of 0.03, 0.02 and 0.1 µg·L−1, respectively. The concentrations of DOC were quantified in triplicate by a Shimadzu TOC–L analyzer with a LOQ of 0.5 mC·L−1. Wet soil samples were collected on days 11 and 36 and were immediately used for the sequential extraction procedure.
2.4. Sequential Extractions Procedure
A 7-step sequential extraction procedure (SEP) based on previous studies [45,46,47] was applied on the soil samples to define the operational solid host phases of each studied metalloid/metal. The SEP was conducted in triplicate on: (i) the dry soil samples (at room temperature: 20 ± 2 °C) from the 0–20-, 40–60- and 90–110-cm layers and (ii) wet soil samples (0–40 cm) collected during anoxic incubation on days 11 and 36.
Prior to the SEP, the wet samples were washed in 50-mL polypropylene centrifuge tubes with 40 mL of ultrapure water in order to remove the remaining dissolved species from the soil solution. The obtained soil suspension was shaken for 30 min (130 rpm), then centrifuged at 6000× g for 15min. The washing step was performed twice to maximize the removal of the dissolved species, whereas the dry soil samples were not prewashed with ultrapure water and were directly subjected to the SEP. The weighted mass of the wet/dry soil samples was equivalent to 1 g of oven-dried soil at 105 °C. Table 1 summarizes the SEP and the solid compartments targeted by each extracting agent.
Between each extraction step, the soil sample was washed with 40 mL of ultrapure water for 30 min. The separation of the soil fraction and the liquid fraction was made by centrifugation at 6000× g for 15 min. The soil recovered from each step was used for the next one, and all the supernatants were pooled separately, filtered through 0.2-µm acetate filters (Minisart), acidified with 20 µL of concentrated HNO3 (69%) and stored at 4 °C until analysis.
2.5. Mass Balance
The amounts of each metal/metalloid extracted within a given fraction, as well as the summations of all the fractions are presented in µg per g of dried soil (µg·g−1). To check the accuracy of the acceptable extract summations of each element (between 80 and 120%) [48], the mass balance (sum of fractions out of the total amount in the soil measured by HCl/HNO3 digestion) was determined. The mass balance was consistently good for As (90–110%) and Mn (81–100%) and was rather acceptable for Sb (72–83%) and Fe (72–89%). This difference is usually caused by the accumulation of uncertainties due to several reasons, such as the occurrence of the element at a very low trace concentration (e.g., Sb) or precipitation due to the oxidation ability (e.g., Fe).
On the other hand, the mass balance between dissolved As and the remaining As in the soil measured after soil incubation (day 36) was not achieved. In fact, the sum of the decreased fractions was up to twice the amount than the sum of the increased fractions added to dissolved As. This can possibly be explained by a loss of colloidal As during filtration of the soil solution at 0.2 µm [49].
2.6. Enrichment Factor
The influence of the element origin upon element distribution within the soil depth was estimated by calculating the enrichment factor (EF), defined as the element-to-Fe ratio in soil layers [(M/Fe)soil] over that of the reference [(M/Fe)r], which is:
EF = [(M/Fe)soil]/[(M/Fe)r]
The Fe, As and Sb contents within the 90–130-cm soil layer (Mr and Fer) were considered as the reference.
3. Results
3.1. Depth Distribution of As, Sb, Fe, Mn, LOI and pH
The total As concentrations along the soil layers (0–20-, 20–40-, 40–60-, 60–90-, 90–110- and 110–130-cm depths) are displayed in Figure 2a. Arsenic was enriched in the upper soil layers (0–60 cm) with average concentrations decreasing with the depth (36 ± 2 µg·g−1 at 0–20 cm against 18.5 ± 0.3 µg·g−1 at 40–60 cm). In the deeper soil layers (60–130), the variation of As was rather smaller among the soil layers, averaging 8 ± 2 µg·g−1, and was at least twice lower than in the upper soil layers.
Antimony was also mainly enriched in the upper soil layers (0–40 cm) but to a lesser extent compared to As, with the average concentrations decreasing from the surface to the depths (1.14 ± 0.05 µg·g−1 at 0–40 cm compared to 0.71 ± 0.04 µg·g−1 at the 40–60-cm depth interval) (Figure 2b). In deeper soil layers (40–130 cm), the Sb content was only about 1.3 times lower than in the 0–20-cm layer and was homogenously distributed, averaging 0.9 ± 0.2 µg·g−1.
In the upper layers (0–60 cm), the depth distribution pattern of Fe and Mn (Figure 2) was similar to that of As and Sb. The total amounts of Fe and Mn decreased with the depth and were 2.0 and 2.6 times lower in the 40–60-cm layer (25.1 ± 0.1 mg·g−1 for Fe and 230 ± 20 µg·g−1 for Mn) compared to the 0–20-cm layer (13 ± 3 mg·g−1 for Fe and 87 ± 4 µg·g−1 for Mn). The variation of the Fe and Mn amounts among the deeper soil layers (60–130 cm) was relatively constant, averaging 17 ± 2 mg·g−1 for Fe and 150 ± 20 µg·g−1 for Mn, and the amounts of both elements were about 1.5 times lower than those in the upper soil layer (0–20 cm). The LOI decreased with the depth in the 0–60-cm layers (39.2 ± 0.8% in the 0–20-cm layer compared to 10 ± 10% in the 40–60-cm layer). In the 60–130-cm layer, the LOI did not show any variation along the depth, averaging 3.3 ± 0.4% (Figure 2e). The soil pH measured in water increased with the soil depth, from 4.3 to 5.3. The soil pH measured in KCl presented a contrasted pathway and increased toward the surface layers, from 3.4 to 3.8 (Figure 2f).
3.2. Solid-Phase Distribution of As, Sb, Fe and Mn along the Soil Depth
Arsenic. The solid-phase distribution of As in the three soil layers (0–20, 40–60 and 90–110 cm) is displayed in Figure 3a. The percentages of each extracted fraction are displayed in Table 2. In the 0–20-cm layer, As was found mainly in the easily reducible fraction (20 ± 2 µg·g−1; 58.6 ± 0.7%), followed by the P-exchangeable (5.2 ± 0.2 µg·g−1;15.2 ± 0.1%), residual (2.8 ± 0.1 µg·g−1; 8.0 ± 0.4%) ≈ reducible (2.7 ± 0.1 µg·g−1; 7.9 ± 0.1%) and H2O2–Org (2.8 ± 0.1 µg·g−1; 8.0 ± 0.2%), with other fractions being minor (<5%) (Ac-exchangeable (0.4 ± 0.1 µg·g−1), and carbonate-bound fractions (1.0 ± 0.1 µg·g−1).
The P-exchangeable, easily reducible and reducible fractions decreased with the depth and were, respectively, five, eight and three times lower in the 90–110-cm layer compared to the 0–20-cm layer. The H2O2–Org fraction also decreased with the depth and was not quantifiable in the 90–110-cm layer. The amounts of the residual fraction were 4.0 ± 0.1 µg·g−1 in the 40–60-cm layer and 2.2 ± 0.1 µg·g−1 in the 90–110-cm layer.
Antimony. The solid-phase distribution of Sb in the 0–20-cm layer was as follows: residual (0.31 ± 0.02 µg·g−1; 33 ± 2%) > easily reducible (0.26 ± 0.01 µg·g−1; 27 ± 1%) > H2O2–Org (0.20 ± 0.00 µg·g−1; 21.0 ± 0.9%) > reducible (0.14 ± 0.01 µg·g−1; 15 ± 2%) > P-exchangeable (0.03 ± 0.00 µg·g−1; 3.6 ± 0.2%) (Figure 3b and Table 2). The remaining fractions (Ac-exchangeable and carbonate-bound fractions) were nonquantifiable. The amount of the easily reducible fraction was about twice lower in the 40–60-cm layer (0.12 ± 0.01 µg·g−1) compared to the 0–20-cm layer. It was also slightly higher in the 90–110-cm layer (0.18 ± 0.04 µg·g−1) compared to the 40–60-cm layer. The amount of the reducible fraction also decreased with the depth and was 1.6 times lower in the 40–60-cm and 90–110-cm layers (0.09 ± 0.01 µg·g−1 and 0.11 ± 0.02 µg·g−1) compared to the 0–20-cm layer. On the other hand, Sb in the H2O2–Org fraction was not quantifiable in the 40–60-cm and 90–110-cm layers. The amounts of the P-exchangeable and residual fractions were almost similar among the three soil layers (0–20, 40–60 and 90–110 cm), averaging 0.03 ± 0.01 µg·g−1 and 0.30 ± 0.03 µg·g−1.
Iron and Manganese. In the 0–20-cm soil layer, Fe was mainly found in the easily reducible fraction (9.7 ± 0.3 mg·g−1; 54 ± 1%), followed by the residual (4.4 ± 0.3 mg·g−1; 24 ± 2%), the reducible (2.8 ± 0.5 mg·g−1; 16 ± 4%) and the H2O2–Org fractions (1.1 ± 0.1 mg·g−1; 5.9 ± 0.3%), while it was minor in the remaining fractions (<1%) (Figure 3c and Table 2). The distribution of Mn in the 0–20-cm layer was as follows: Ac-exchangeable (67 ± 4 µg·g−1; 29 ± 2%) > carbonate-bound (50 ± 2 µg·g−1; 21.8 ± 0.6%) > easily reducible (42.9 ± 0.1 µg·g−1; 18.7 ± 0.1%) > reducible (25.9 ± 0.5 µg·g−1; 11.2 ± 0.2%) ≈ residual (26.7 ± 0.8 µg·g−1; 11.6 ± 0.3%) > H2O2–Org (14.0 ± 0.6 µg·g−1; 6.1 ± 0.3%) (Figure 3d and Table 2). The amounts of Fe in the easily reducible fraction decreased with the depth and were 3.7 ± 0.2 mg·g−1 in the 40–60-cm layer and 1.6 ± 0.2 mg·g−1 in the 90–110-cm layer. The same tendency was observed for Mn, with 5.2 ± 0.4 µg·g−1 in the 40–60-cm layer and 1.26 ± 0.03 µg·g−1 in the 90–110-cm layer. The amounts of Fe and Mn within the reducible fraction in the 40–60-cm and 90–130-cm layers were lower than in the 0–20-cm layer.
The amounts of Fe and Mn in the residual fraction were relatively the same among the 0–20- and 40–60-cm layers, averaging 4.2 ± 0.3 mg·g−1 and 26.9 ± 0.6 µg·g−1, whereas they were found 2.6 and times 3.4 higher in the 90–110-cm layer.
3.3. Laboratory Incubation: Mobility and Solid-phase Distribution of As in Wetland Soil (0–40 cm) during Development of the Reducing Conditions
The evolution of the soil solution chemistry (dissolved As concentration, pH, Eh, dissolved Mn, Fe(II) and organic carbon and alkalinity) is displayed in Table 3 and confirms the establishment of reducing the conditions and the strong mobilization of As (3.4 ± 0.1 µg·L−1 at the beginning and 370 ± 50 µg·L−1 after 36 days of soil incubation). During the 36-day incubations, the Eh decreased from 290 ± 20 mV to –11 ± 10 mV, whereas the reduced Fe, dissolved organic carbon (DOC), carbonates and pH increased.
Given the limited mobility of Sb (only 3% of the total Sb was solubilized under the reducing conditions and the accumulation of uncertainties during the sequential extraction procedure), it is very difficult to identify the origin of mobilized Sb. Therefore, in the following section, only the results regarding As solid-phase distribution during the development of the reducing conditions will be presented.
The variations of As solid-phase distribution during soil incubation are displayed in Figure 4. The easily reducible fraction showed a two-fold decrease during soil anoxic incubation (from 32 ± 2 µg·g−1 on day 0 to 16.2 ± 0.5 µg·g−1 on day 36). On the other hand, the P-exchangeable fraction increased by a factor of 2.3 on day 11 and then decreased by a factor 1.4 on day 36 (2.7 ± 0.2 µg·g−1 on day 0, 6.4 ± 0.1 µg·g−1 on day 11 and 4.7 ± 0.1 µg·g−1 on day 36). Similarly, the carbonate-bound fraction slightly increased by a factor of 4 on day 11, then decreased by a factor of 1.6 on day 36 (0.3 ± 0.1 µg·g−1 on day 0, 1.0 ± 0.1 µg·g−1 on day 11 and 0.6 ± 0.10 µg·g−1 on day 36). The H2O2–Org fraction slightly increased from 1.4 ± 0.1 µg·g−1 on day 0 to 2.2 ± 0.1 µg·g−1 on day 11, then remained relatively constant until day 36.
4. Discussion
As shown in Figure 2a, the total As concentrations in the studied soil are slightly higher (7–35 µg·g−1) than the average background in soils (~1–20 µg·g−1 [1]). As the studied soil is unpolluted, the high levels of As are due to the presence of geochemical anomalies in the local bedrock. The bedrock of French Massif Central, as well as other European regions (e.g., Harz Mountains in Germany, Iberian Pyrite Belt in Spain, Cornwall in England, Silvretta in Austria and Central Jämtland in Sweden), are characterized by high As mineralization linked to As hydrothermal activity during granite intrusions [50]. Thus, soils developed over such materials are naturally enriched in As. Similar naturally elevated levels of As have been reported in soils developed over a granitic saprolite, which contained up to 1500 µg·g−1 in the 135–165-cm deepest soil layer and up to 385 µg·g−1 in the upper 0–5-cm soil layer [51].
Based on the pattern of the total metal/metalloid contents, the soil profile was divided into three main distinct layers (Figure 2). The upper part of the soil (0–40 cm) was enriched with OM (~20–40%) and subject to seasonal flooding, especially during the winter and spring periods (Figure 1). The soil below 60 cm (60–130 cm) was relatively poor in OM (3.3 ± 0.4%) and was permanently waterlogged. The 40–60-cm soil layer was defined as a zone of “transition” between permanently and periodically reduced soil layers, with a moderate content of OM (9.7 ± 0.3%). As shown in Figure 2, the 0–40-cm soil layer also displayed a higher content in As and Sb (36 ± 3 µg·g−1 and 1.1 ± 0.1 µg·g−1, respectively) compared to the 40–60- and 60–130-cm layers (8 ± 2 µg·g−1 and 18.5 ± 0.3 µg·g−1, respectively). However, even if the 0–40-cm soil layer was enriched in both metalloids, their vertical distributions were quite different. The total As content gradually decreased with the depth and followed the same pattern as the OM content. Differently, the total Sb content decreased until 40–60 cm and then slightly increased at 60 cm and followed the total Fe and Mn trends. Given the fact that As and Sb have binding affinities towards Fe and OM [24,39,49,52], the question that arises is to which extent the As, Sb, Fe and OM dynamics are related in wetland soil.
4.1. Fe and Organic Matter Impact As and Sb Dynamics in Wetland Soil
A previous study of Rouwane et al. [39] conducted on the same wetland soil showed a periodic mobilization of dissolved As and Sb to the soil porewater. Field monitoring of the chemistry of the porewater organic soil layer (at 40 cm) reveled that As and Sb exhibited different temporal behaviors; As release (up to 93 μg L−1) occurred under Fe-reducing conditions, whereas Sb release was favored under oxidizing conditions (up to 5 μg L−1) and, particularly, when the dissolved organic carbon (DOC) increased in the soil porewater (up to 92.8 mg L−1) [39].
This study demonstrates that As and Sb are distributed differently within the solid phases and that their distributions are variable in the vertical soil profile (Figure 3). In deeper, permanently waterlogged soil (90–130-cm layer), the dominant fractions for As were the easily reducible and residual (~35% and ~32%, respectively), followed by the P-exchangeable and reducible (~16% ~14%, respectively). This trend was not observed for Sb. The dominant fractions of Sb were the residual (~46%) and the easily reducible (~30%), followed by the reducible fraction (~19%). The P-exchangeable fraction was relatively small and accounted for only ~6%. In the 90-110-cm layer, As and Sb were not released in the H2O2–Org fraction, suggesting the absence of association to persistent OM and/or secondary sulfides. In the uppermost organic soil (0-20-cm layer), most of As was found in the easily reducible (~59%) and the P-exchangeable (~15%) fractions, whereas Sb displayed a homogeneous partitioning among different fractions: residual (~33%), easily reducible (~27%), H2O2–Org fraction (~21%) and reducible (~15%). The observed contrasting distributions of As and Sb in the solid phases are related to the biogeochemical processes occurring in the soil (reduction/oxidation, adsorption/desorption, etc.), which are linked to the hydrodynamics of the studied wetland. In the permanently waterlogged soil (90–130-cm layer; Figure 2), the amount of Fe was lower (17 ± 2 mg.g−1) compared to the uppermost 0-20-cm layer, and most of Fe (~70%) was found in the residual fraction (Table 3). On the other hand, the amount of Fe increased toward the surface, and most of Fe was found in the easily reducible fraction (~54% in 0–20 cm). Meanwhile, the proportions of Fe within the easily reducible fraction increased towards the surface. This trend was observed also for As (Figure 3). Thus, it is possible that As released in deeper, permanently waterlogged soil, together with reduced Fe, is transported during the period of water table or capillary rise and in contact with oxygen in the upper part of soil and is immobilized (by adsorption or coprecipitation) with newly formed Fe phases or its transformation. However, the enrichment factors (EF) reflect a higher As enrichment relative to Fe toward the soil surface (the EF ranged from 1.1 ± 0.1 below 60 cm to 3.5 ± 0.5 above 60 cm). According to the literature, EF values lower than 0.5 indicate a loss of the element relative to Fe, whereas those between 0.5 and 1.5 reflect an element origin from the parent materiel or from natural weathering processes. EF values higher than 1.5 indicate likely anthropogenic sources [53]. As the studied wetland is located in an unpolluted area, the excessive accumulation of As toward the soil surface relative to Fe could be explained by two phenomena. The first is that the upper soil layers are highly enriched in OM (Figure 2e), and according to the literature, in a periodically flooded wetland, OM may enhance the formation of small Fe mineral phases (nano-lepidocrocite, a small Fe cluster), resulting in an indirect higher adsorption capacity towards As [54]. Organic compounds are also known to inhibit crystallization processes and, thus, promote the abundance of amorphous mineral phases [55]. Indeed, the highest amount of As (~59% of the total As) in the upper layer (0–20 cm) was found in the easily reducible fraction (20 ± 2 µg·g−1), which is twice higher than the 40–60-cm layer (10 ± 2 µg·g−1) and eight times higher than the 90–110-cm layer (2.5 ± 0.2 µg·g−1) (Figure 3 and Table 3). These results were consistent with the study of Mansfeldt and Overesch [37], showing that up to 88% of the total As in a natural Haplic gleysol was found in the easily reducible fraction, especially in the top surface layer (0–15 cm), where ferrihydrite was the dominant Fe phase. The second hypothesis is that As retention in the upper organic layer is enhanced by particulate or colloidal OM through organosulfur groups [56,57,58] or by the formation of sulfides [22,59]. This hypothesis can be supported by the occurrence of As within the H2O2–Org fraction (~8% at 0–20 cm), which usually contains more refractory OM and secondary sulfides (Figure 3), and by anoxic soil incubation (Figure 4). Laboratory incubation of the uppermost organic soil under reducing conditions revealed that the sulfates presented in the soil solution at the beginning of the incubation decreased from 17.7 ± 1.6 mg·L−1 to 0.2 ± 0.1 mg·L−1 on day 36 of the incubation (Table 3). Thus, it is very likely that bisulfide ions (HS-) are present during the development of the reduction conditions. They are among the most important anions affecting the mobility of As(V) and As(III) in the reducing environments both through the formation of secondary sulfide minerals and soluble thioarsenite species [22,59]. However, the relatively low content of the thiol groups in natural OM may explain a predominance of the mechanisms involving Fe in As sequestering. It could take place by (co)precipitation with Fe or by the formation of ternary complexes between OM, arsenate/arsenite and Fe such as Fe(III) or Fe oxides or other metal-bringing complexes [30,31,32,49]. Beside, only less than 5% of the total As was found in the H2O2–Org fraction in the 40–60-cm layer despite the presence of OM (~9.3 ± 0.3%) (Figure 3a and Table 3), suggesting a low direct scavenging effect of refractory OM towards As [29].
Concerning Sb, its enrichment towards the surface (0–20 cm) could be attributed to its homogeneous occurrence in the easily reducible, H2O2–Org and residual fractions (Figure 3b and Table 3). These proportions are partly in accordance with those reported in an unpolluted Fluvisol (total Sb~0.95 µg·g−1 at a 0–30-cm depth), where 15.8%, 7% and 10.9% of the total Sb were associated with amorphous, well-crystallized oxyhydroxides and OM [60]. Unlike As, the constant EF of Sb throughout the soil profile (1.1 ± 0.1) suggests that Sb and Fe have similar depth distribution patterns. Moreover, the similar depth patterns of Sb, Fe and Mn within the reducible fraction (Figure 3b–d) suggest that Sb is probably preferentially trapped by more stable Fe-Mn oxyhydroxides. In addition, the H2O2–Org fraction contributed more significantly to Sb sequestration in the surface layers in comparison to As (Table 2), highlighting a preferential affinity of Sb for refractory OM and/or secondary sulfides compared to As. Some authors suggested that this affinity difference can be attributed to the fact that Sb oxyanions are able to form complexes with ligand sites of soil humic acids more selectively than As oxyanions and, thus, tend to accumulate more strongly in organic-rich soils [29,39,61]. However, Sb was nonquantifiable in the deeper soil layers (40–60 and 90–110 cm) (Figure 3b and Table 2). This suggest that the amount of OM in the 40–60-cm (LOI~10%) and 90–110-cm (LOI~5%) layers (Figure 2e) was probably not high enough for Sb trapping, or OM in the deeper soil layers does not provide enough efficient sorption sites for Sb sequestration.
4.2. Dynamics of Strongly Exchangeable and Carbonate-bound As and Sb in Wetland Soil
The total amount of As within the P-exchangeable fraction decreased significantly with depth (Figure 3a); however, its proportion was ~15% no matter the soil depth (Table 1). This suggests that, in addition to (co)precipitation processes, specific adsorption is also important in As sequestration in soil. On the other hand, the % of P-exchangeable Sb (~5% in the 0–20-cm layer) was much lower and rather constant along the depths (Figure 3b). The P-exchangeable fraction usually reflects the strongly bound As and Sb involving the formation of inner-sphere complexes with mineral and organic phases in soils [10] and can be mobilized as a result of a pH increase or host-phase dissolution. As shown in Figure 2, the pH of permanently waterlogged soil was 4.3 and increased to 5.3 toward the surface. Since acidic soil conditions are beneficial for dissolved As and Sb adsorption, one part of released As and Sb could be immobilized onto the mineral surfaces. The experimental soil incubation showed an increase of P-exchangeable As after the onset of the reducing conditions (Figure 4), even if the pH of the soil suspension increased up to 6.7 ± 0.1 during the soil reduction (Table 3). This suggests that As mobilized from the easily reducible pool under the reducing conditions is partly resorbed onto the soil surfaces. It is also possible that the conversion of the strongly bound form of As (As(V)) into a potentially more mobile form (As(III)) [16,62] unlikely enhanced the As desorption while using phosphate as the exchanging oxyanion during the extraction procedure. This result is in accordance with a previous study [42], reporting an important increase of the Na4P2O7-extractable As targeting the strongly adsorbed and organically bound As under anoxic conditions. They attributed this to the formation of surface complexes by specific sorption onto mineral surfaces. In the present study, while exchanging As and Sb with phosphate, the extractant became slightly brownish, reflecting the simultaneous exchange of DOM (about 2% of the total organic carbon in the soil). Thus, in addition to strongly adsorbed As and Sb, this fraction could also contain DOM complex-bound As adsorbed onto the soil organic and mineral surfaces [63]. This fraction, extracted using Na4P2O7, accounted for about 14% of the total Sb in an unpolluted Fluvisol (0–30 cm) [60].
It should be noted that Sb was not quantified in the Ac-exchangeable and carbonate-bound fractions (Figure 3). In the case of As, both fractions mentioned above represented a very small percentage of the total As. In fact, given the low pH of the soil (in the range between 4.3 and 5.3, carbonate minerals are not likely to be present; thus, they may hardly be involved in As and Sb mobility in this soil).
4.3. Dynamics of Less Mobilizable As and Sb in Wetland Soil
In the 0–20-cm layer, only 8% of As was associated with the residual fraction. This proportion increased with the depth (between 19.9 ± 0.3% and 31.9 ± 0.8%; see Table 2), while the total content remained rather constant (Figure 2a). Accordingly, previous studies [25,37] reported that residual As accounts for less than 10% in the 0–15-cm layer and increased up to ~15% in the 15–35-cm layer. On the other hand, the residual fraction contained 33% of the total Sb in the 0–20-cm layer, which increased with the depth (Table 2). The proportion of residual Sb in the given wetland soil was at the same level of magnitude (~27.2–43%) as in the nonpolluted soils [60]. The higher content of Sb in the residual fraction compared to As in the 0–20-cm layer indicates that Sb is relatively less mobile in the wetland soil. The residual fraction usually reflects elements associated with recalcitrant minerals. However, the proportion of elements within the residual fraction widely depends on the element source (anthropogenic or natural) and the occurrence of primary phases [64,65]. In the wetland soil, despite the high increase of Fe and Mn amounts within the residual fraction between the 0–40-cm layer and the 90–110-cm layer (Figure 3), the amounts of As and Sb in this fraction remained relatively constant, no matter the soil depth. This suggests that As and Sb in the residual fraction are not associated with Fe/Mn-rich recalcitrant minerals and are rather trapped with other minerals (e.g., primary sulfide and clays).
4.4. Soil Hydrology Affect the Solid-Phase Distribution of As and Sb and, thus, the Content of Potentially Mobilizable As and Sb
As displayed in Figure 2, the enrichment pattern (towards the soil surface) of As and Sb can be attributed to the hydrological dynamics in the wetland. The permanent waterlogging of the deeper soil layers (>60 cm depth) (Figure 1) enhances the development of anaerobic conditions and causes the reduction of redox-sensitive elements; the reductive dissolution of soil As; Sb-bearing minerals (Fe/Mn oxyhydroxides, arsenates and sulfatoarsenates) and subsequent leaching and further translocation of As and Sb towards the upper horizons. The upper soil layers (<60-cm depths) subject to water table variations are characterized by varying redox conditions. The alternations of the redox conditions promote the everlasting cycling of As- and Sb-bearing minerals and the subsequent trapping or release of As and Sb at the soil/water interface [66,67,68], which is either directly or indirectly impacted by the OM dynamics. Within the flooding period, the mobilized elements may be redistributed onto solid phases or be transferred to the surrounding aquifers and rivers [66,67].
The potentially mobilizable As and Sb estimated as the sum of the Ac-exchangeable, P-exchangeable, easily reducible and H2O2-Org fractions represent up to 83%, 69% and 53% of the total As at the 0–20-cm, 40–60-cm and 90–110-cm depths, respectively. The content of potentially mobilizable Sb is lower and represents up to 53%, 44% and 54% of the total Sb at the 0–20-cm, 40–60-cm and 90–110-cm depths, respectively.
Headwater wetlands are very dynamic and critical elements in the hydrological system. Any changes in the dominant hydrological processes associated, for example, with climate change may alter the redox conditions in wetland soils and the subsequent changes in the solid As- and Sb-phase distributions, thus impacting their mobility.
5. Conclusions
The present study investigated the total content and solid-phase distributions of geogenic As and Sb up to 130 cm in depth in a periodically waterlogged wetland soil and estimated the potentially mobilizable fractions. This soil was characterized by a higher content of As and lower amount of Sb. The results showed that the soil was more enriched in As and Sb towards the soil surface; however, they did not display the same content and solid-phase distribution patterns. The arsenic soil enrichment correlated well with the increase of the easily reducible fraction, suggesting that As was associated with Fe and Mn towards the surface. However, the high enrichment factor of As relative to the Fe content in the upper layer (0–40 cm) suggests that As sequestration results from other factors/mechanisms. We attributed this enrichment to the high content in OM in the upper soil layers, which likely enhances the formation of highly reactive minerals towards As or the formation of complexes between OM, arsenate/arsenite and Fe, such as Fe(III) or Fe oxides or other metal-bringing complexes. The results also showed that, during soil waterlogging, As was mobilized from the easily reducible fraction and was mainly redistributed within the strongly exchangeable fraction (phosphate-exchangeable). The highest proportion of As in the soil (83% in the 0–20-cm layer) was potentially mobilizable under oxic or anoxic conditions or by exchange with competing anions. Unlike As, the enrichment factor of Sb relative to Fe was constant, suggesting that both elements display similar distribution patterns. In addition, Sb exhibited a higher affinity for OM in same layers compared to As. Unlike As, Sb had a tendency to be homogeneously associated with less labile fractions (i.e., well-crystallized oxyhydroxides and residual-bound Sb), which highlights its low mobility in soils compared to As. The potentially mobilizable Sb was estimated to be 53% of the total Sb content for the soil layer between 0 and 20 cm.
Author Contributions
Conceptualization, M.G. and M.R.; Data curation, A.R.; Formal analysis, A.R.; Funding acquisition, G.G.; Methodology, M.G., M.R. and G.G.; Supervision, M.G., M.R. and G.G.; Writing—original draft, A.R., M.G., M.R. and G.G. All authors have read and agreed to the published version of the manuscript.
Funding
This research was funded by Conseil Régional du Limousin.
Data Availability Statement
The data presented in this study are available on request from the corresponding author.
Acknowledgments
The authors gratefully acknowledge the Limousin Region (France) for the financial support of a Ph.D. program, Patrice Fondanèche for assistance with ICP-MS analyses, and the wetland owner for making the field available for soil water level monitoring and soil sampling.
Conflicts of Interest
The authors declare no conflict of interest.
References
- Kabata-Pendias, A. Trace Elements in Soils and Plants, 4th ed.; CRC Press: New York, NY, USA, 2010; ISBN 978-0-429-19203-6. [Google Scholar]
- Martin, J.-M.; Whitfield, M. The Significance of the River Input of Chemical Elements to the Ocean. In Trace Metals in Sea Water; Wong, C.S., Boyle, E., Bruland, K.W., Burton, J.D., Goldberg, E.D., Eds.; Springer US: Boston, MA, USA, 1983; pp. 265–296. ISBN 978-1-4757-6866-4. [Google Scholar]
- Golfinopoulos, S.; Varnavas, S.; Alexakis, D. The Status of Arsenic Pollution in the Greek and Cyprus Environment: An Overview. Water 2021, 13, 224. [Google Scholar] [CrossRef]
- Alexakis, D.E.; Bathrellos, G.D.; Skilodimou, H.D.; Gamvroula, D.E. Spatial Distribution and Evaluation of Arsenic and Zinc Content in the Soil of a Karst Landscape. Sustainability 2021, 13, 6976. [Google Scholar] [CrossRef]
- Léonard, A.; Gerber, G.B. Mutagenicity, Carcinogenicity and Teratogenicity of Antimony Compounds. Mutat. Res. Genet. Toxicol. 1996, 366, 1–8. [Google Scholar] [CrossRef]
- Yoshida, T. Chronic Health Effects in People Exposed to Arsenic via the Drinking Water: Dose? Response Relationships in Review. Toxicol. Appl. Pharmacol. 2004, 198, 243–252. [Google Scholar] [CrossRef] [Green Version]
- Smedley, P.L.; Kinniburgh, D.G. A Review of the Source, Behaviour and Distribution of Arsenic in Natural Waters. Appl. Geochem. 2002, 17, 517–568. [Google Scholar] [CrossRef] [Green Version]
- Filella, M.; Belzile, N.; Chen, Y.-W. Antimony in the Environment: A Review Focused on Natural Waters: I. Occurrence. Earth-Sci. Rev. 2002, 57, 125–176. [Google Scholar] [CrossRef]
- Filella, M.; Belzile, N.; Chen, Y.-W. Antimony in the Environment: A Review Focused on Natural Waters: II. Relevant Solution Chemistry. Earth-Sci. Rev. 2002, 59, 265–285. [Google Scholar] [CrossRef]
- Wilson, S.C.; Lockwood, P.V.; Ashley, P.M.; Tighe, M. The Chemistry and Behaviour of Antimony in the Soil Environment with Comparisons to Arsenic: A Critical Review. Environ. Pollut. 2010, 158, 1169–1181. [Google Scholar] [CrossRef]
- Herath, I.; Vithanage, M.; Bundschuh, J. Antimony as a Global Dilemma: Geochemistry, Mobility, Fate and Transport. Environ. Pollut. 2017, 223, 545–559. [Google Scholar] [CrossRef]
- Belzile, N.; Chen, Y.-W.; Wang, Z. Oxidation of Antimony (III) by Amorphous Iron and Manganese Oxyhydroxides. Chem. Geol. 2001, 174, 379–387. [Google Scholar] [CrossRef]
- McComb, K.A.; Craw, D.; McQuillan, A.J. ATR-IR Spectroscopic Study of Antimonate Adsorption to Iron Oxide. Langmuir 2007, 23, 12125–12130. [Google Scholar] [CrossRef]
- Waychunas, G.A.; Rea, B.A.; Fuller, C.C.; Davis, J.A. Surface Chemistry of Ferrihydrite: Part 1. EXAFS Studies of the Geometry of Coprecipitated and Adsorbed Arsenate. Geochim. Cosmochim. Acta 1993, 57, 2251–2269. [Google Scholar] [CrossRef]
- Sarkar, B.; Jacks, G.; Frisbie, S.; Smith, H.; Naidu, R.; Sarkar, B. Arsenic in the Environment: A Global Perspective. In Heavy Metals in The Environment; CRC Press: New York, NY, USA, 2002; pp. 147–215. ISBN 978-0-8247-0630-2. [Google Scholar]
- Zobrist, J.; Dowdle, P.R.; Davis, J.A.; Oremland, R.S. Mobilization of Arsenite by Dissimilatory Reduction of Adsorbed Arsenate. Environ. Sci. Technol. 2000, 34, 4747–4753. [Google Scholar] [CrossRef]
- Leuz, A.-K.; Mönch, H.; Johnson, C.A. Sorption of Sb(III) and Sb(V) to Goethite: Influence on Sb(III) Oxidation and Mobilization. Environ. Sci. Technol. 2006, 40, 7277–7282. [Google Scholar] [CrossRef]
- Griggs, C.S.; Martin, W.A.; Larson, S.L.; O’Connnor, G.; Fabian, G.; Zynda, G.; Mackie, D. The Effect of Phosphate Application on the Mobility of Antimony in Firing Range Soils. Sci. Total Environ. 2011, 409, 2397–2403. [Google Scholar] [CrossRef]
- Signes-Pastor, A.; Burló, F.; Mitra, K.; Carbonell-Barrachina, A.A. Arsenic Biogeochemistry as Affected by Phosphorus Fertilizer Addition, Redox Potential and PH in a West Bengal (India) Soil. Geoderma 2007, 137, 504–510. [Google Scholar] [CrossRef]
- Smith, E.; Naidu, R.; Alston, A.M. Chemistry of Inorganic Arsenic in Soils: II. Effect of Phosphorus, Sodium, and Calcium on Arsenic Sorption. J. Environ. Qual. 2002, 31, 557–563. [Google Scholar] [CrossRef]
- Spuller, C.; Weigand, H.; Marb, C. Trace Metal Stabilisation in a Shooting Range Soil: Mobility and Phytotoxicity. J. Hazard. Mater. 2007, 141, 378–387. [Google Scholar] [CrossRef]
- O’Day, P.A.; Vlassopoulos, D.; Root, R.; Rivera, N. The Influence of Sulfur and Iron on Dissolved Arsenic Concentrations in the Shallow Subsurface under Changing Redox Conditions. Proc. Natl. Acad. Sci. USA 2004, 101, 13703–13708. [Google Scholar] [CrossRef] [Green Version]
- Bostick, B.C.; Fendorf, S. Arsenite Sorption on Troilite (FeS) and Pyrite (FeS2). Geochim. Cosmochim. Acta 2003, 67, 909–921. [Google Scholar] [CrossRef]
- Mitsunobu, S.; Takahashi, Y.; Terada, Y.; Sakata, M. Antimony(V) Incorporation into Synthetic Ferrihydrite, Goethite, and Natural Iron Oxyhydroxides. Environ. Sci. Technol. 2010, 44, 3712–3718. [Google Scholar] [CrossRef]
- Hindersmann, I.; Mansfeldt, T. Trace Element Solubility in a Multimetal-Contaminated Soil as Affected by Redox Conditions. Water. Air. Soil Pollut. 2014, 225, 2158. [Google Scholar] [CrossRef]
- Pedersen, H.D.; Postma, D.; Jakobsen, R. Release of Arsenic Associated with the Reduction and Transformation of Iron Oxides. Geochim. Cosmochim. Acta 2006, 70, 4116–4129. [Google Scholar] [CrossRef]
- Schwertmann, U. Solubility and Dissolution of Iron Oxides. Plant Soil 1991, 130, 1–25. [Google Scholar] [CrossRef]
- Wan, X.; Tandy, S.; Hockmann, K.; Schulin, R. Effects of Waterlogging on the Solubility and Redox State of Sb in a Shooting Range Soil and Its Uptake by Grasses: A Tank Experiment. Plant Soil 2013, 371, 155–166. [Google Scholar] [CrossRef] [Green Version]
- Dousova, B.; Buzek, F.; Herzogova, L.; Machovic, V.; Lhotka, M. Effect of Organic Matter on Arsenic(V) and Antimony(V) Adsorption in Soils: Comparison of Arsenic and Antimony Adsorption Properties. Eur. J. Soil Sci. 2015, 66, 74–82. [Google Scholar] [CrossRef]
- Buschmann, J.; Kappeler, A.; Lindauer, U.; Kistler, D.; Berg, M.; Sigg, L. Arsenite and Arsenate Binding to Dissolved Humic Acids: Influence of PH, Type of Humic Acid and Aluminum. Environ. Sci. Technol. 2006, 40, 6015–6020. [Google Scholar] [CrossRef] [Green Version]
- Redman, A.D.; Macalady, D.L.; Ahmann, D. Natural Organic Matter Affects Arsenic Speciation and Sorption onto Hematite. Environ. Sci. Technol. 2002, 36, 2889–2896. [Google Scholar] [CrossRef]
- Mikutta, C.; Kretzschmar, R. Spectroscopic Evidence for Ternary Complex Formation between Arsenate and Ferric Iron Complexes of Humic Substances. Environ. Sci. Technol. 2011, 45, 9550–9557. [Google Scholar] [CrossRef]
- Tella, M.; Pokrovski, G.S. Stability and Structure of Pentavalent Antimony Complexes with Aqueous Organic Ligands. Chem. Geol. 2012, 292–293, 57–68. [Google Scholar] [CrossRef]
- Tella, M.; Pokrovski, G.S. Antimony(III) Complexing with O-Bearing Organic Ligands in Aqueous Solution: An X-Ray Absorption Fine Structure Spectroscopy and Solubility Study. Geochim. Cosmochim. Acta 2009, 73, 268–290. [Google Scholar] [CrossRef]
- Hockmann, K.; Schulin, R. Leaching of Antimony from Contaminated Soils. In Competitive Sorption and Transport of Heavy Metals in Soils and Geological Media; Selim, H., Ed.; CRC Press: New York, NY, USA, 2012; pp. 119–145. ISBN 978-1-4398-8014-2. [Google Scholar]
- Verbeeck, M.; Thiry, Y.; Smolders, E. Soil Organic Matter Affects Arsenic and Antimony Sorption in Anaerobic Soils. Environ. Pollut. 2020, 257, 113566. [Google Scholar] [CrossRef] [PubMed]
- Mansfeldt, T.; Overesch, M. Arsenic Mobility and Speciation in a Gleysol with Petrogleyic Properties: A Field and Laboratory Approach. J. Environ. Qual. 2013, 42, 1130–1141. [Google Scholar] [CrossRef] [PubMed] [Green Version]
- Arsic, M.; Teasdale, P.R.; Welsh, D.T.; Johnston, S.G.; Burton, E.D.; Hockmann, K.; Bennett, W.W. Diffusive Gradients in Thin Films Reveals Differences in Antimony and Arsenic Mobility in a Contaminated Wetland Sediment during an Oxic-Anoxic Transition. Environ. Sci. Technol. 2018, 52, 1118–1127. [Google Scholar] [CrossRef]
- Rouwane, A.; Rabiet, M.; Grybos, M.; Bernard, G.; Guibaud, G. Effects of NO3 − and PO4 3− on the Release of Geogenic Arsenic and Antimony in Agricultural Wetland Soil: A Field and Laboratory Approach. Environ. Sci. Pollut. Res. 2016, 23, 4714–4728. [Google Scholar] [CrossRef]
- Rouwane, A.; Grybos, M.; Bourven, I.; Rabiet, M.; Guibaud, G. Waterlogging and Soil Reduction Affect the Amount and Apparent Molecular Weight Distribution of Dissolved Organic Matter in Wetland Soil: A Laboratory Study. Soil Res. 2018, 56, 28. [Google Scholar] [CrossRef]
- Grybos, M.; Davranche, M.; Gruau, G.; Petitjean, P.; Pédrot, M. Increasing PH Drives Organic Matter Solubilization from Wetland Soils under Reducing Conditions. Geoderma 2009, 154, 13–19. [Google Scholar] [CrossRef]
- Huang, G.; Chen, Z.; Zhang, Y.; Liu, F.; Wang, J.; Hou, Q. Changes of Arsenic Fractionation and Bioaccessibility in Wastewater-Irrigated Soils as a Function of Aging: Influence of Redox Condition and Arsenic Load. Geoderma 2016, 280, 1–7. [Google Scholar] [CrossRef]
- WRB. World Reference Base for Soil Resources. I: International Soil Classification System for Naming Soils and Creating Legends for Soil Maps; Food and Agriculture Organization: Rome, Italy, 2014; p. 203. [Google Scholar]
- Bohn, H.L. Redox potentials. Soil Sci. 1971, 112, 39–45. [Google Scholar] [CrossRef]
- Tessier, A.; Campbell, P.G.C.; Bisson, M. Sequential Extraction Procedure for the Speciation of Particulate Trace Metals. Anal. Chem. 1979, 51, 844–851. [Google Scholar] [CrossRef]
- Wenzel, W.W.; Kirchbaumer, N.; Prohaska, T.; Stingeder, G.; Lombi, E.; Adriano, D.C. Arsenic Fractionation in Soils Using an Improved Sequential Extraction Procedure. Anal. Chim. Acta 2001, 436, 309–323. [Google Scholar] [CrossRef]
- Keon, N.E.; Swartz, C.H.; Brabander, D.J.; Harvey, C.; Hemond, H.F. Validation of an Arsenic Sequential Extraction Method for Evaluating Mobility in Sediments. Environ. Sci. Technol. 2001, 35, 2778–2784. [Google Scholar] [CrossRef]
- Chen, M.; Ma, L.Q. Comparison of Three Aqua Regia Digestion Methods for Twenty Florida Soils. Soil Sci. Soc. Am. J. 2001, 65, 491–499. [Google Scholar] [CrossRef] [Green Version]
- Bauer, M.; Blodau, C. Arsenic Distribution in the Dissolved, Colloidal and Particulate Size Fraction of Experimental Solutions Rich in Dissolved Organic Matter and Ferric Iron. Geochim. Cosmochim. Acta 2009, 73, 529–542. [Google Scholar] [CrossRef]
- Tarvainen, T.; Salminen, R.; Vos, W.D. Geochemical Atlas of Europe. Background Information, Methodology and Maps Part 1; Geological Survey of Finland: Espoo, Finland, 2005; ISBN 978-951-690-913-7. [Google Scholar]
- Bossy, A.; Grosbois, C.; Beauchemin, S.; Courtin-Nomade, A.; Hendershot, W.; Bril, H. Alteration of As-Bearing Phases in a Small Watershed Located on a High Grade Arsenic-Geochemical Anomaly (French Massif Central). Appl. Geochem. 2010, 25, 1889–1901. [Google Scholar] [CrossRef] [Green Version]
- Tang, H.; Ke, Z.; Yan, M.; Wang, W.; Nie, H.; Li, B.; Zhang, J.; Xu, X.; Wang, J. Concentrations, Distribution, and Ecological Risk Assessment of Heavy Metals in Daya Bay, China. Water 2018, 10, 780. [Google Scholar] [CrossRef] [Green Version]
- Zhang, J.; Liu, C.L. Riverine Composition and Estuarine Geochemistry of Particulate Metals in China—Weathering Features, Anthropogenic Impact and Chemical Fluxes. Estuar. Coast. Shelf Sci. 2002, 54, 1051–1070. [Google Scholar] [CrossRef]
- Guénet, H.; Davranche, M.; Vantelon, D.; Pédrot, M.; Al-Sid-Cheikh, M.; Dia, A.; Jestin, J. Evidence of Organic Matter Control on As Oxidation by Iron Oxides in Riparian Wetlands. Chem. Geol. 2016, 439, 161–172. [Google Scholar] [CrossRef] [Green Version]
- Escudey, M.; Förster, J.E.; Galindo, G. Relevance of Organic Matter in Some Chemical and Physical Characteristics of Volcanic Ash-Derived Soils. Commun. Soil Sci. Plant Anal. 2004, 35, 781–797. [Google Scholar] [CrossRef]
- Catrouillet, C.; Davranche, M.; Dia, A.; Bouhnik-Le Coz, M.; Pédrot, M.; Marsac, R.; Gruau, G. Thiol Groups Controls on Arsenite Binding by Organic Matter: New Experimental and Modeling Evidence. J. Colloid Interface Sci. 2015, 460, 310–320. [Google Scholar] [CrossRef] [Green Version]
- Couture, R.-M.; Wallschläger, D.; Rose, J.; Van Cappellen, P. Arsenic Binding to Organic and Inorganic Sulfur Species during Microbial Sulfate Reduction: A Sediment Flow-through Reactor Experiment. Environ. Chem. 2013, 10, 285. [Google Scholar] [CrossRef] [Green Version]
- Al-Sid-Cheikh, M.; Pédrot, M.; Dia, A.; Guenet, H.; Vantelon, D.; Davranche, M.; Gruau, G.; Delhaye, T. Interactions between Natural Organic Matter, Sulfur, Arsenic and Iron Oxides in Re-Oxidation Compounds within Riparian Wetlands: NanoSIMS and X-Ray Adsorption Spectroscopy Evidences. Sci. Total Environ. 2015, 515–516, 118–128. [Google Scholar] [CrossRef]
- Zhao, Z.; Wang, S.; Jia, Y. Effect of Sulfide on As(III) and As(V) Sequestration by Ferrihydrite. Chemosphere 2017, 185, 321–328. [Google Scholar] [CrossRef]
- Hou, H.; Takamatsu, T.; Koshikawa, M.K.; Hosomi, M. Concentrations of Ag, In, Sn, Sb and Bi, and Their Chemical Fractionation in Typical Soils in Japan: Fractionation of Ag, In, Sn, Sb and Bi in Soils. Eur. J. Soil Sci. 2006, 57, 214–227. [Google Scholar] [CrossRef]
- Ceriotti, G.; Amarasiriwardena, D. A Study of Antimony Complexed to Soil-Derived Humic Acids and Inorganic Antimony Species along a Massachusetts Highway. Microchem. J. 2009, 91, 85–93. [Google Scholar] [CrossRef]
- Hamon, R.E.; Lombi, E.; Fortunati, P.; Nolan, A.L.; McLaughlin, M.J. Coupling Speciation and Isotope Dilution Techniques to Study Arsenic Mobilization in the Environment. Environ. Sci. Technol. 2004, 38, 1794–1798. [Google Scholar] [CrossRef]
- Hou, H.; Takamatsu, T.; Koshikawa, M.K.; Hosomi, M. Migration of Silver, Indium, Tin, Antimony, and Bismuth and Variations in Their Chemical Fractions on Addition to Uncontaminated Soils. Soil Sci. 2005, 170, 624–639. [Google Scholar] [CrossRef]
- Krysiak, A.; Karczewska, A. Arsenic Extractability in Soils in the Areas of Former Arsenic Mining and Smelting, SW Poland. Sci. Total Environ. 2007, 379, 190–200. [Google Scholar] [CrossRef]
- Pfeifer, H.-R.; Gueye-Girardet, A.; Reymond, D.; Schlegel, C.; Temgoua, E.; Hesterberg, D.L.; Chou, J.W. Dispersion of Natural Arsenic in the Malcantone Watershed, Southern Switzerland: Field Evidence for Repeated Sorption–Desorption and Oxidation–Reduction Processes. Geoderma 2004, 122, 205–234. [Google Scholar] [CrossRef]
- Blodau, C.; Fulda, B.; Bauer, M.; Knorr, K.-H. Arsenic Speciation and Turnover in Intact Organic Soil Mesocosms during Experimental Drought and Rewetting. Geochim. Cosmochim. Acta 2008, 72, 3991–4007. [Google Scholar] [CrossRef]
- Xue, Q.; Ran, Y.; Tan, Y.; Peacock, C.L.; Du, H. Arsenite and Arsenate Binding to Ferrihydrite Organo-Mineral Coprecipitate: Implications for Arsenic Mobility and Fate in Natural Environments. Chemosphere 2019, 224, 103–110. [Google Scholar] [CrossRef] [PubMed]
- Johnston, S.G.; Bennett, W.W.; Doriean, N.; Hockmann, K.; Karimian, N.; Burton, E.D. Antimony and Arsenic Speciation, Redox-Cycling and Contrasting Mobility in a Mining-Impacted River System. Sci. Total Environ. 2020, 710, 136354. [Google Scholar] [CrossRef] [PubMed]
Figure 1.
Water table variations in the studied wetland soil. The piezometer was installed at a 60-cm depth.
Figure 1.
Water table variations in the studied wetland soil. The piezometer was installed at a 60-cm depth.

Figure 2.
Total concentrations of As (a), Sb (b), Fe (c) and Mn (d); loss on ignition (e) and pH (f) along the soil depth. Bars are represented as the mean value ± standard variation (n = 3).
Figure 2.
Total concentrations of As (a), Sb (b), Fe (c) and Mn (d); loss on ignition (e) and pH (f) along the soil depth. Bars are represented as the mean value ± standard variation (n = 3).
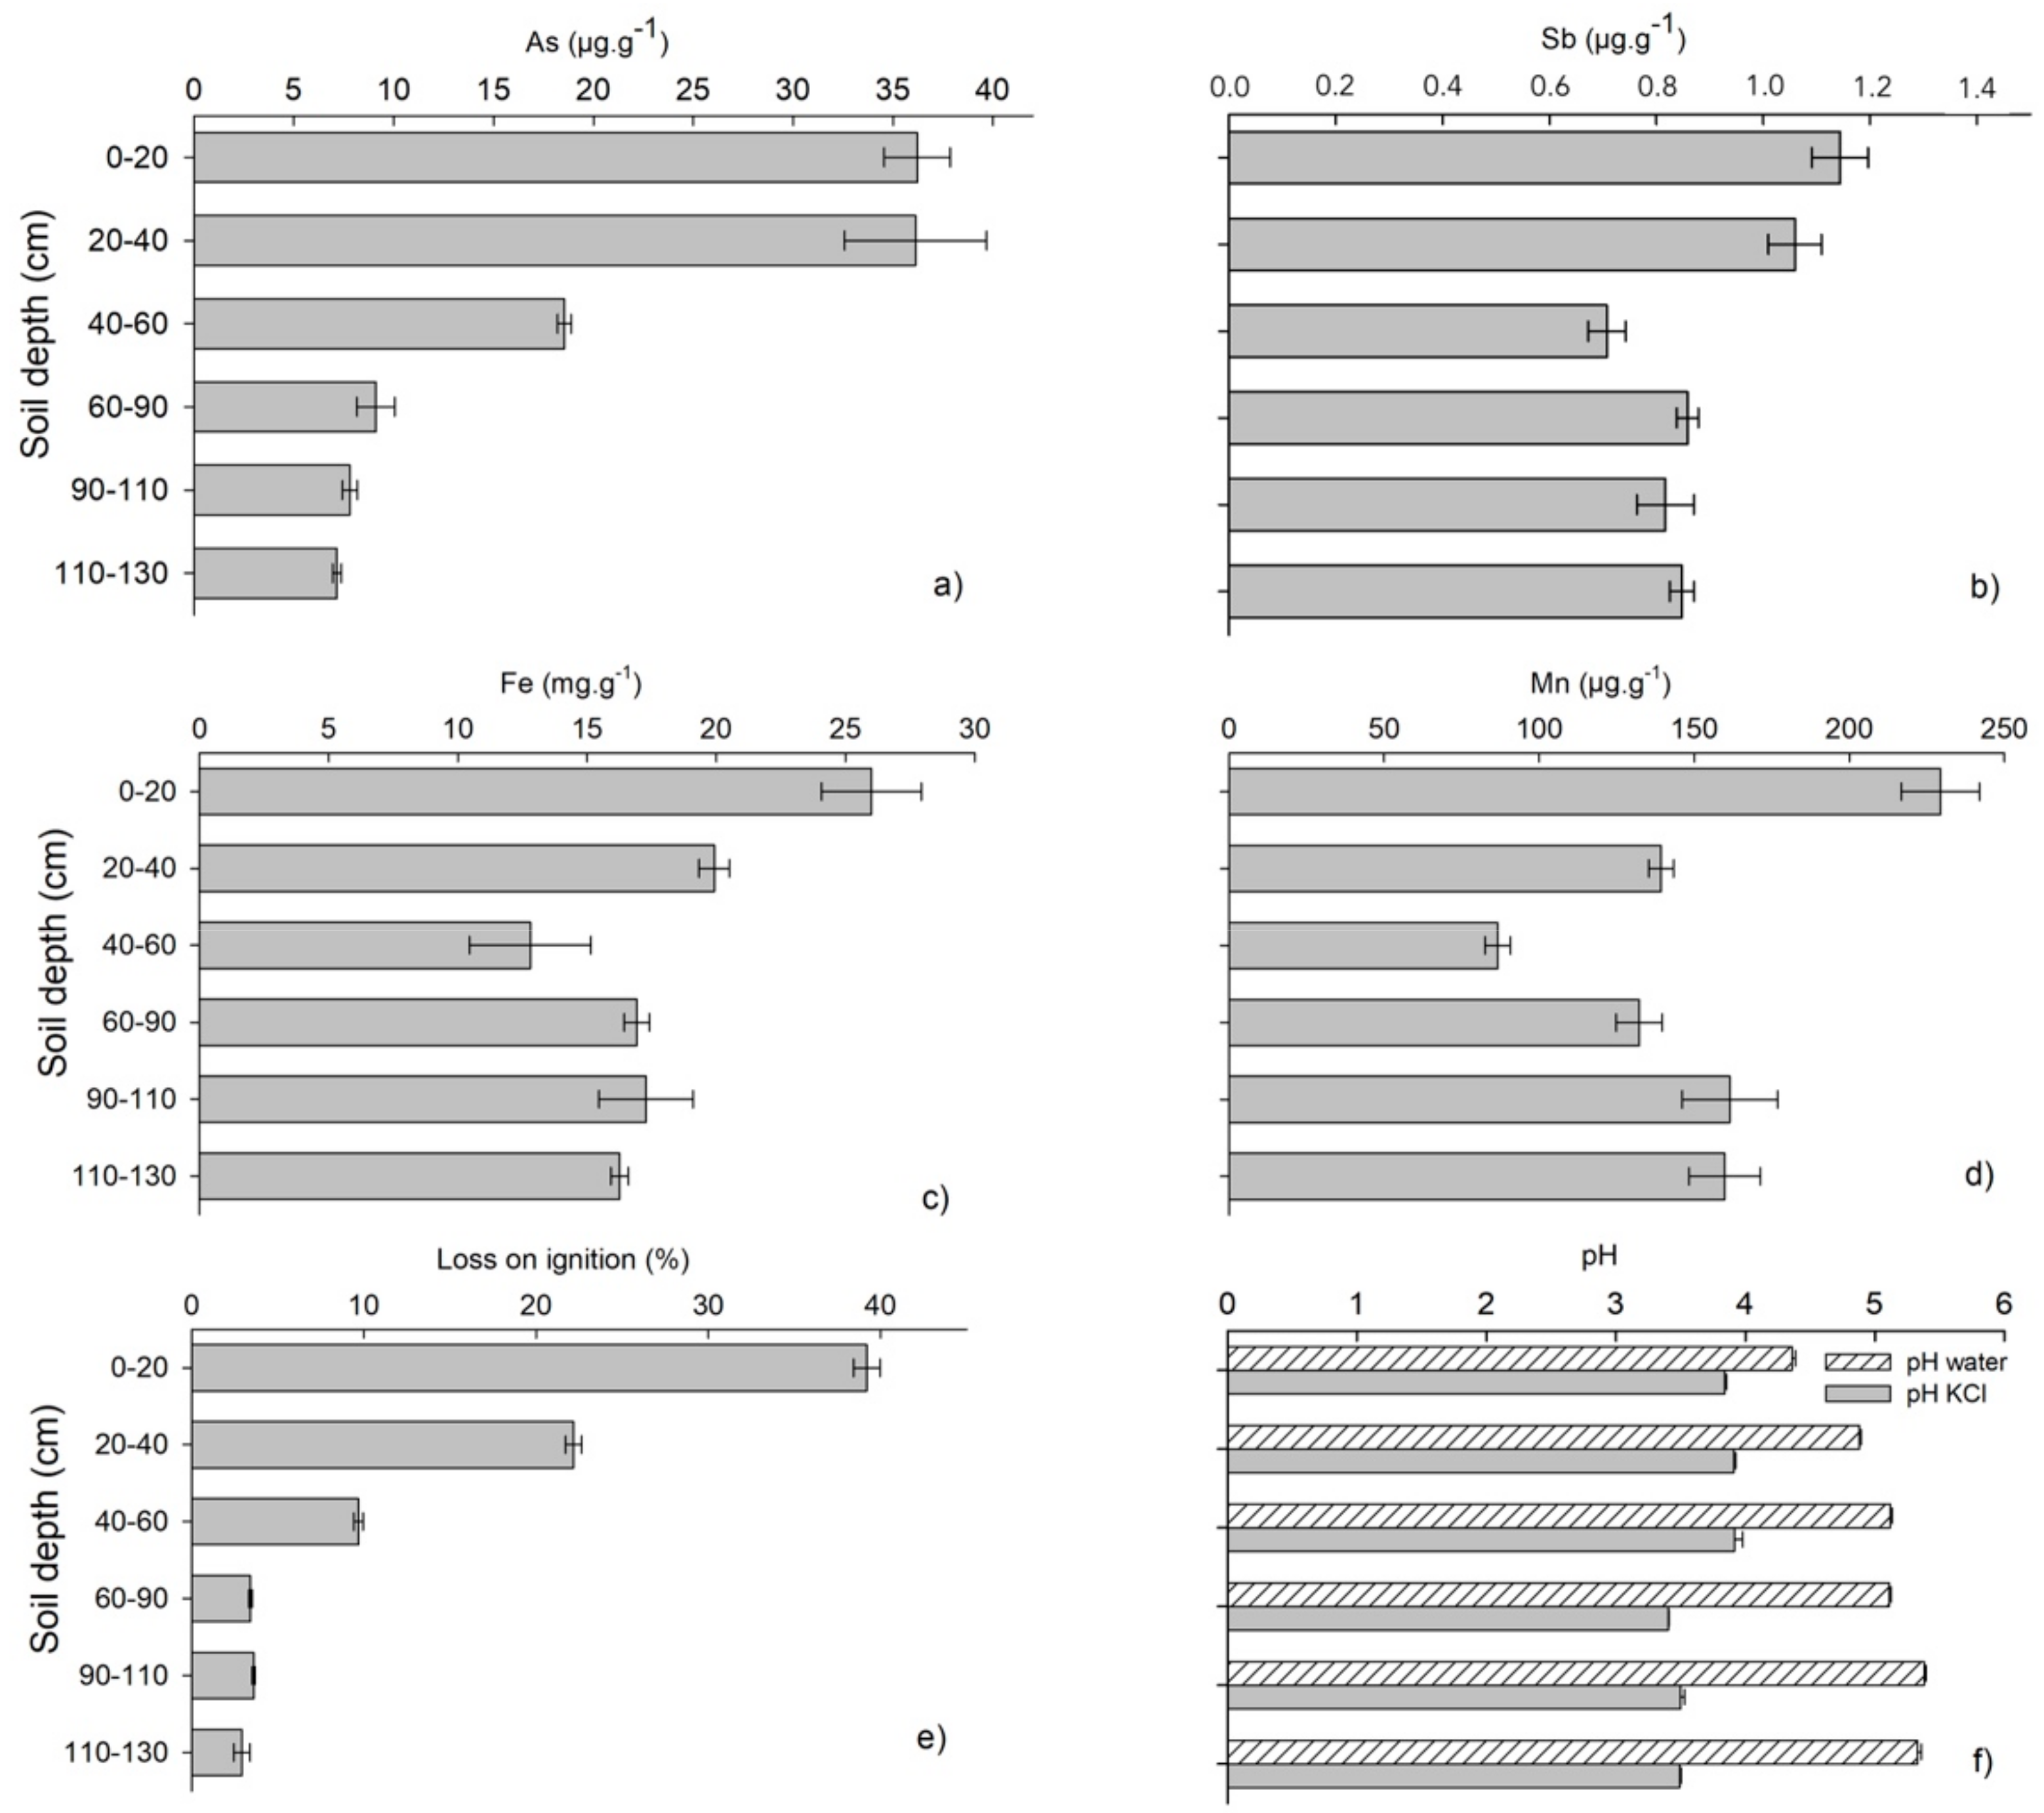
Figure 3.
Solid-phase distribution of the elements (µg/g DW) in the three soil layers (0–20 cm, 40–60 cm and 90–110 cm): As (a), Sb (b), Fe (c) and Mn (d). Bars are represented as the mean value ± standard variation (n = 2).
Figure 3.
Solid-phase distribution of the elements (µg/g DW) in the three soil layers (0–20 cm, 40–60 cm and 90–110 cm): As (a), Sb (b), Fe (c) and Mn (d). Bars are represented as the mean value ± standard variation (n = 2).
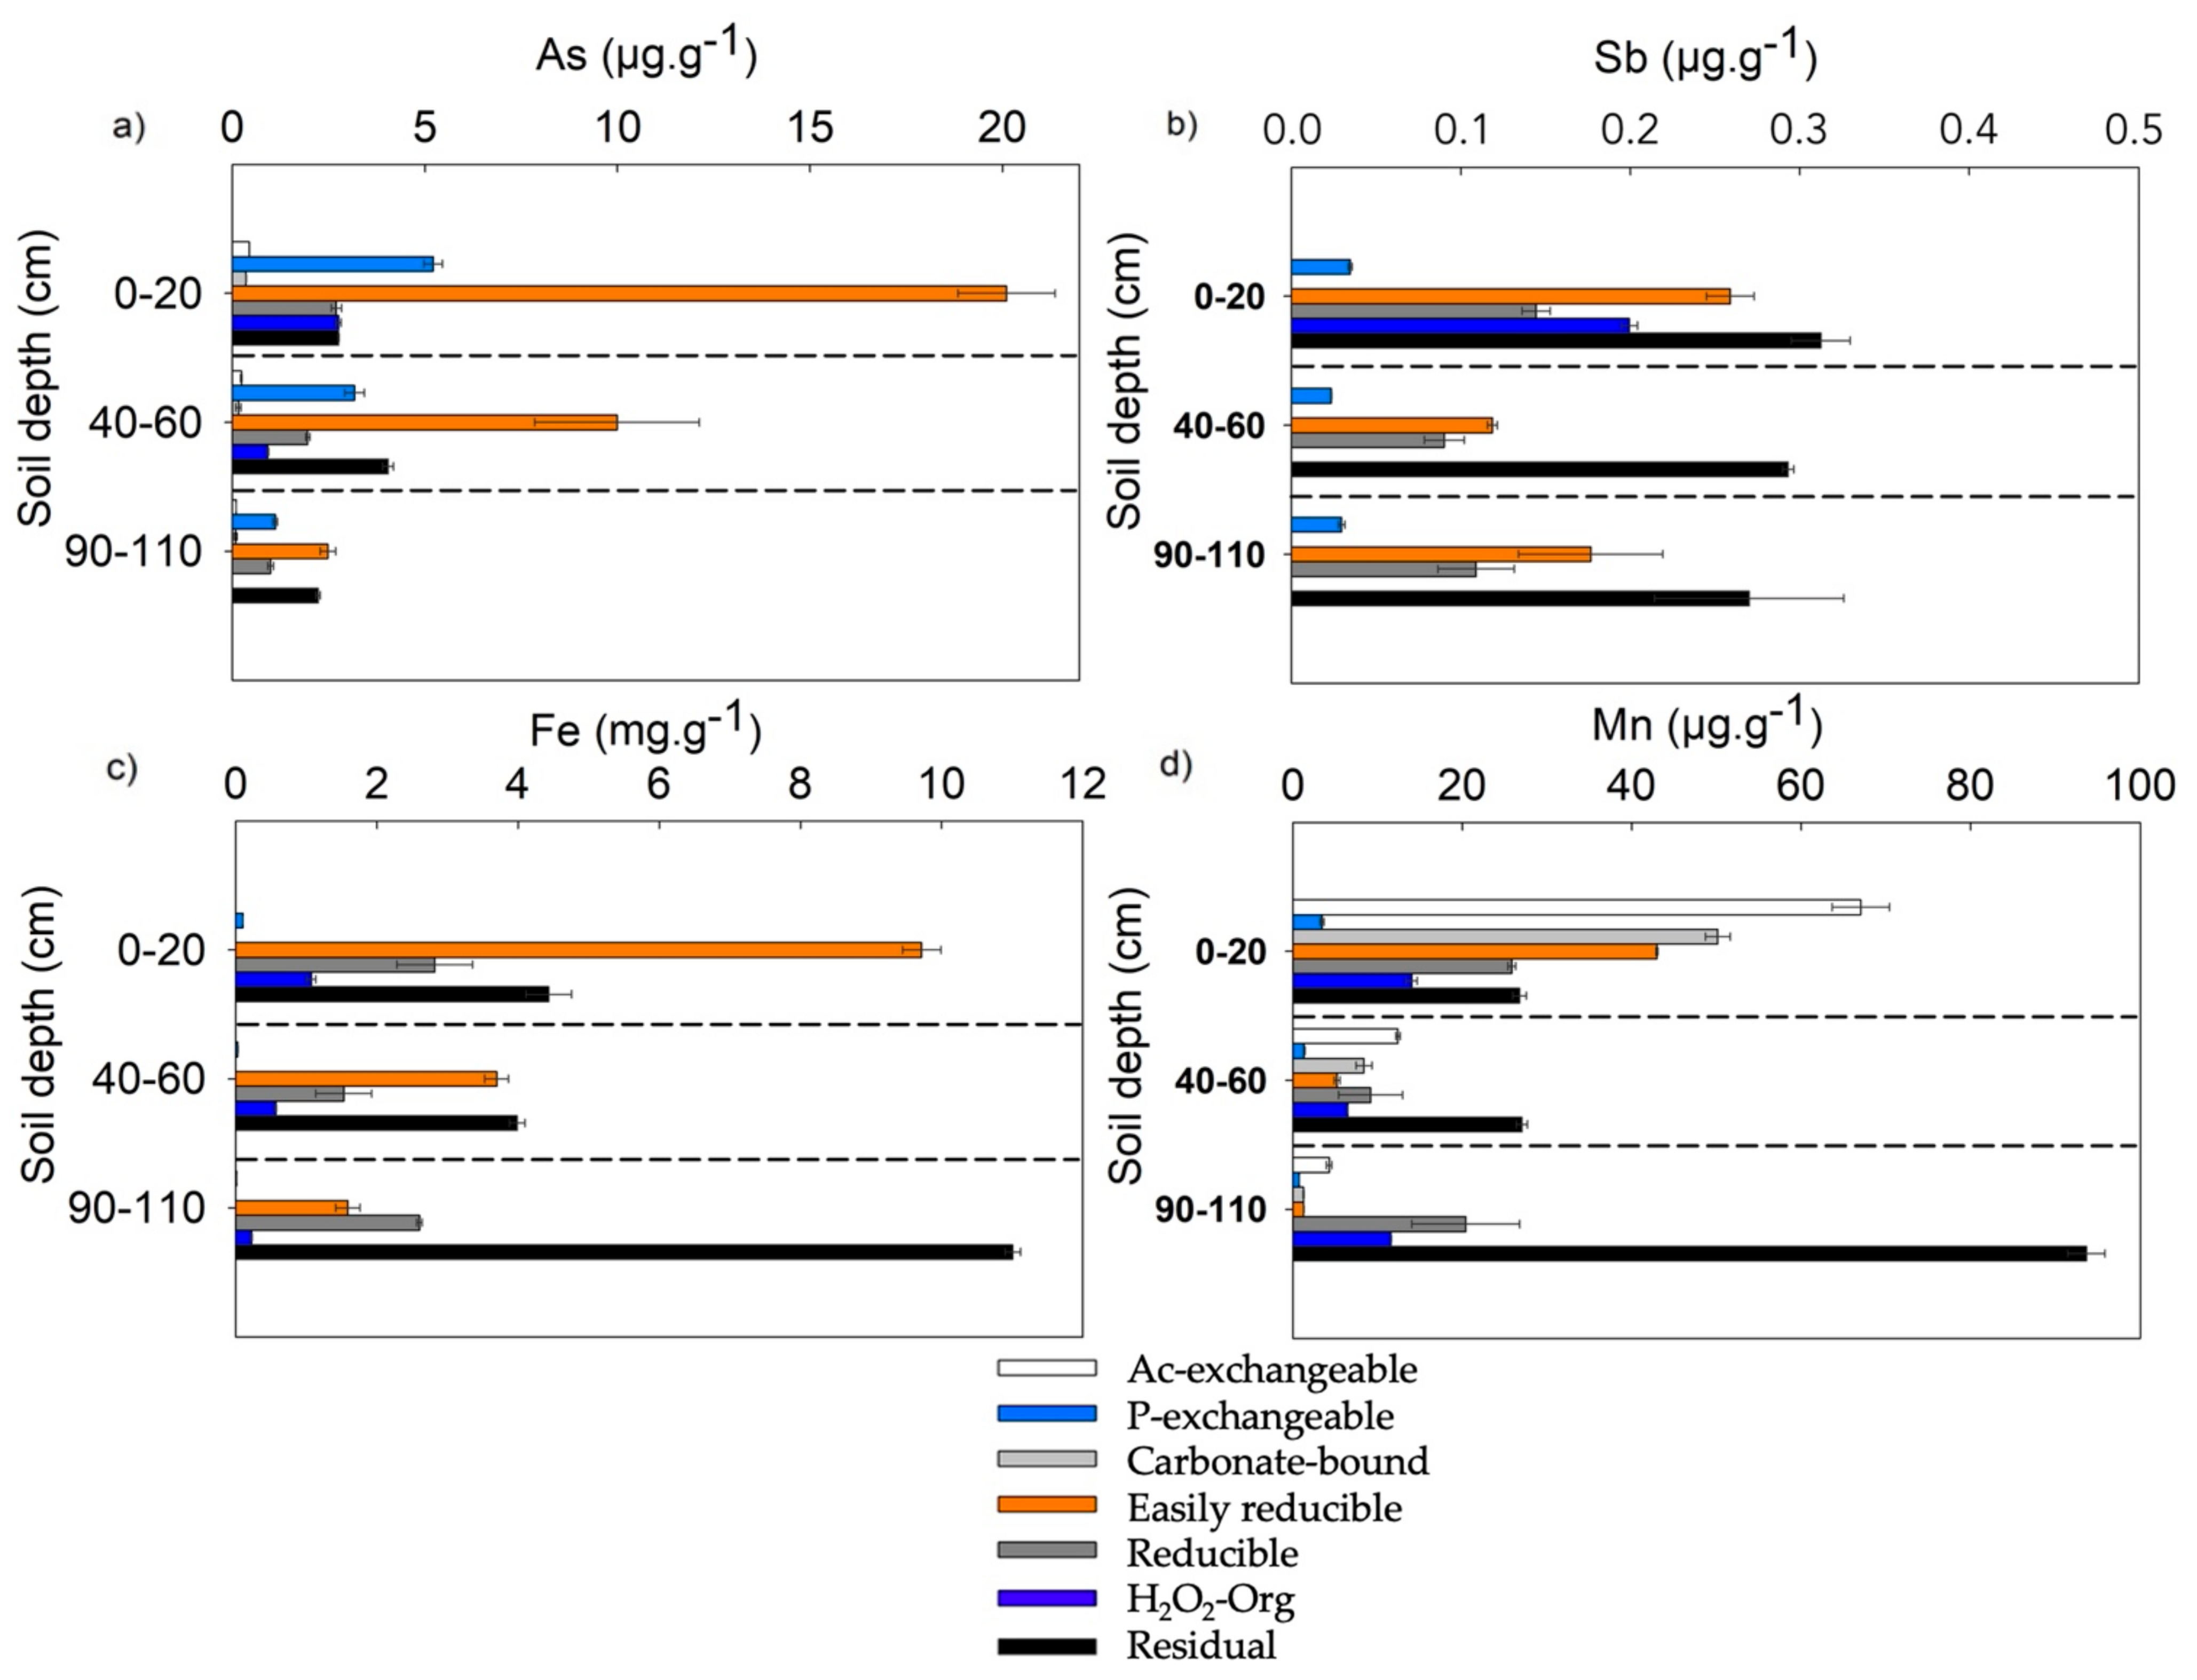
Figure 4.
Solid-phase distribution of As during anoxic soil incubation (µg/g DW). Bars are represented as the mean value ± standard variation (n = 3).
Figure 4.
Solid-phase distribution of As during anoxic soil incubation (µg/g DW). Bars are represented as the mean value ± standard variation (n = 3).


Table 1.
Sequential extraction procedure for the identification of metalloid/metal solid host phases in soil.
Table 1.
Sequential extraction procedure for the identification of metalloid/metal solid host phases in soil.
| Step | Target Phase/Mechanisms | Labels/Abbreviation in Figures and Text | Extracting Agent | Reference |
|---|---|---|---|---|
| F1 | Loosely adsorbed | Ac-exchangeable | 1-M sodium acetate pH 8.2 2 h of shaking at 20 ± 2 °C | [45] |
| F2 | Strongly adsorbed | P-exchangeable | 0.05-M sodium phosphates pH 5 16 h of shaking at 20 ± 2 °C | [46,47] |
| F3 | Carbonates bound | Carbonate-bound | 1-M sodium acetate pH 5 5 h of shaking at 20 ± 2 °C | [45] |
| F4 | Expected to be bound to easily reducible fraction | Easily reducible | 0.2-M ammonium oxalate/oxalic acid pH 3 2 h of shaking at 20 ± 2 °C in the dark * | [47] |
| F5 | Expected to be reducible fraction | Reducible | 0.2-M ammonium oxalate/oxalic acid + ascorbic acid (0.1 M) pH 3.25 30 min at 96 °C * | [46] |
| F6 | Expected to be associated with persistent OM and sulfides | H2O2–Org | (1) 6 mL of 0.02-M HNO3 + 10 mL of 30% H2O2 (pH 2) 2h at 85 °C (2) 6 mL of 30% H2O2 (pH 2) 3 h at 85 °C (3) 10 mL of ammonium acetate in HNO3 20% (v/v) + ultrapure water up to 40 mL 30 min at 20 ± 2 °C ** | [45] |
| F7 | Residual | Residual | 4-mL HCl (37%) + 4-mL HNO3 (65%) by microwave heating (Multiwave Go) 10 min at 180 °C | – |
* For the steps F4 and F5, the extractions were repeated twice to completely remove As and Sb. ** All extractants from step 6 were combined.
Table 2.
Percentages (%) of extracted As, Sb, Fe and Mn relative to the element amounts measured in each fraction out of the sum of all the fractions. n.q: non quantifiable.
Table 2.
Percentages (%) of extracted As, Sb, Fe and Mn relative to the element amounts measured in each fraction out of the sum of all the fractions. n.q: non quantifiable.
| Soil Layers | ||||||
|---|---|---|---|---|---|---|
| 0–20 cm | 40–60 cm | 90–110 cm | 0–20 cm | 40–60 cm | 90–110 cm | |
| Fraction | Extracted As (%) | Extracted Sb (%) | ||||
| Ac-exchangeable | 1.3 ± 0.1 | 1.1 ± 0.1 | 1.4 ± 0.1 | n.q | n.q | n.q |
| P-exchangeable | 15.2 ± 0.1 | 15.5 ± 0.5 | 15.9 ± 0.1 | 3.6 ± 0.2 | 4.5 ± 0.2 | 5.1 ± 0.8 |
| Carbonate-bound | 1.0 ± 0.0 | 0.7 ± 0.2 | 1.2 ± 0.6 | n.q | n.q | n.q |
| Easily reducible | 58.6 ± 0.7 | 48 ± 5 | 35 ± 2 | 27 ± 1 | 22.6 ± 0.2 | 30 ± 1 |
| Reducible | 7.9 ± 0.0 | 10 ± 2 | 14.2 ± 0.3 | 15 ± 1 | 17 ± 2 | 18.6 ± 0.0 |
| H2O2–Org | 8.0 ± 0.2 | 4.5 ± 0.4 | n.q | 21.0 ± 0.9 | n.q | n.q |
| Residual | 8.0 ± 0.4 | 19.9 ± 0.3 | 31.9 ± 0.8 | 33 ± 1 | 55.8 ± 0.1 | 46.2 ± 0.1 |
| Fraction | Extracted Fe (%) | Extracted Mn (%) | ||||
| Ac-exchangeable | n.q | n.q | n.q | 29 ± 2 | 17.7 ± 0.9 | 3.2 ± 0.0 |
| P-exchangeable | <1 | <1 | <1 | 1.5 ± 0.1 | 1.9 ± 0.2 | <1 |
| Carbonate-bound | n.q | n.q | n.q | 21.8 ± 0.6 | 12.0 ± 0.4 | 0.9 ± 0.1 |
| Easily reducible | 54 ± 2 | 38 ± 3 | 10.3 ± 0.5 | 18.7 ± 0.1 | 8 ± 1 | 1.0 ± 0.0 |
| Reducible | 16 ± 4 | 16 ± 4 | 17 ± 4 | 11.2 ± 0.2 | 13 ± 5 | 15 ± 4 |
| H2O2–Org | 5.9 ± 0.3 | 5.8 ± 0.1 | 1.5 ± 0.1 | 6.1 ± 0.3 | 9.3 ± 0.7 | 8.7 ± 0.6 |
| Residual | 24 ± 2 | 40.7 ± 0.2 | 72 ± 4 | 11.6 ± 0.3 | 38.7 ± 0.2 | 70 ± 3 |
Table 3.
Evolution of the soil water characteristics on days 0, 22 and 36. Values are represented as the mean ± standard variation (n = 3).
Table 3.
Evolution of the soil water characteristics on days 0, 22 and 36. Values are represented as the mean ± standard variation (n = 3).
| Incubation Time | |||
|---|---|---|---|
| Day 0 | Day 22 | Day 36 | |
| As (µg·L−1) | 3.4 ± 0.1 | 138 ± 4 | 370 ± 50 |
| Sb (µg·L−1) | 0.22 ± 0.01 | 0.89 ± 0.02 | 0.51 ± 0.12 |
| pH | 5.7 ± 0.1 | 6.7 ± 0.1 | 6.7 ± 0.1 |
| Eh (mV) | 290 ± 20 | 3 ± 5 | −11 ± 10 |
| Fe(II) (mg·L−1) | 0.2 ± 0.1 | 47 ± 4 | 39 ± 4 |
| Mn (µg·L−1) | 65 ± 2 | 440 ± 20 | 430 ± 20 |
| DOC (mgC·L−1) | 51 ± 1 | 267 ± 3 | 250 ± 20 |
| HCO3− (mg·L−1) | 27 ± 1 | 370 ± 20 | 414 ± 5 |
| SO42− (mg·L−1) | 17.7 ± 1.6 | Not mesured | 0.2 ± 0.1 |
Publisher’s Note: MDPI stays neutral with regard to jurisdictional claims in published maps and institutional affiliations. |
© 2021 by the authors. Licensee MDPI, Basel, Switzerland. This article is an open access article distributed under the terms and conditions of the Creative Commons Attribution (CC BY) license (https://creativecommons.org/licenses/by/4.0/).
Share and Cite
MDPI and ACS Style
Rouwane, A.; Grybos, M.; Rabiet, M.; Guibaud, G. Potentially Mobilizable Geogenic As and Sb in an Agricultural Wetland Soil. Geosciences 2021, 11, 444. https://doi.org/10.3390/geosciences11110444
AMA Style
Rouwane A, Grybos M, Rabiet M, Guibaud G. Potentially Mobilizable Geogenic As and Sb in an Agricultural Wetland Soil. Geosciences. 2021; 11(11):444. https://doi.org/10.3390/geosciences11110444
Chicago/Turabian StyleRouwane, Asmaa, Malgorzata Grybos, Marion Rabiet, and Gilles Guibaud. 2021. "Potentially Mobilizable Geogenic As and Sb in an Agricultural Wetland Soil" Geosciences 11, no. 11: 444. https://doi.org/10.3390/geosciences11110444
Note that from the first issue of 2016, this journal uses article numbers instead of page numbers. See further details here.