Article

Monitoring the Organic Matter Quality Highlights the Ways in Which Organic Matter Is Removed from Wetland Soil

by
Anne-Catherine Pierson-Wickmann
1,*,
Mélanie Davranche
1,
Julien Kerloc'h
1,
Charlotte Catrouillet
1 and
Elaheh Lotfi-Kalahroodi
1,2
1
University Rennes, CNRS, Géosciences Rennes—UMR 6118, 35000 Rennes, France
2
Institut des Sciences Analytiques et de Physico-Chimie pour l’Environnement et les Matériaux, IPREM, UMR 5254, CNRS-Université de Pau et des Pays de l’Adour, 2 Avenue P. Angot—Technopôle Hélioparc, 64000 Pau, France
*
Author to whom correspondence should be addressed.
Geosciences 2021, 11(3), 134; https://doi.org/10.3390/geosciences11030134
Submission received: 18 November 2020 / Revised: 16 February 2021 / Accepted: 9 March 2021 / Published: 13 March 2021

Abstract

:
It has long been considered that ferric phases stabilize organic matter (OM) in soils. Temporarily waterlogged soils, in which Fe is submitted to regular reductive solubilization and oxidizing precipitation, have often been used to study these processes. However, few studies have been interested in the evolution of the OM quality under such conditions. We therefore experimentally investigated the impact of a redox cycle on the quality of the dissolved organic matter (DOM) from wetland soil. The DOM quality was monitored using a combination of analyses run on the elements (%C, %N, C/N), isotopes (δ15N, δ13C), optical index (specific UV absorbance at 254 nm), and fluorescence indexes (FI, HIX, BIX). In addition, the cation and anion concentrations were also determined in the soil solutions throughout the experiment. As classically demonstrated, OM is solubilized as terrestrial aromatic molecules in the first stage of the reducing period, and then as nonaromatic molecules until the end of the reduction, in response to the dissimilatory reductive dissolution of Fe-oxyhydroxides in the soil. More interestingly, we demonstrate that the reintroduction of O2 involves significant lysis of reducing bacterial cells involving the production of small labile organic carbon which represents a significant pathway for OM degradation. Moreover, in response to the physical constraints, the newly formed Fe-OM precipitates produce small aggregates rich in aromatic OM that are expected to disseminate in the environment, representing a second significant way to remove OM.

1. Introduction

The organic matter (OM) cycle cannot be dissociated from that of Fe in different environmental systems such as soils, sediments, surface waters and permafrosts (in response to thawing), or peatlands and wetlands. Several studies have demonstrated that the stabilization of OM is related to the presence of ferric species [1,2,3]. More specifically in wetlands, ferric species enhance the biodecomposition of natural organic matter (NOM) by acting as terminal acceptor electrons during soil waterlogging periods. In contrast, in response to the water level decrease in wetland soils, in the presence of high amounts of OM, Fe(III) precipitates with DOM, forming aggregates of Fe and OM nanoparticles expected to stabilize OM [4]. Herndon et al. [5] showed that, by complexing low-molecular-weight OM, i.e., the most labile and bioavailable carbon, ferric species inhibit the microbial degradation of OM. Through 14C analysis, Hall et al. [6] demonstrated that the C residence time in humid soil is positively correlated with the crystallinity of the Fe(III) oxyhydroxides. Chen et al. [7] also demonstrated that the alternation of redox conditions results in decreased C degradation and increased crystallinity of the ferric species. They suggest that repeated redox cycles induce the loss of dissolved organic matter (DOM), which is coprecipitated as Fe-OM aggregates, but that part of the DOM bound to Fe-minerals is preserved from the degradation involved via the reducing conditions. However, many of these processes depend on the variations in the quality and composition of the OM water during the redox cycles. Organic matter coating and binding processes with minerals depend on their binding sites, site density, molecular weight, and/or physicochemical structure (molecular vs. colloidal). However, in many studies dedicated to the impact of redox variations on OM degradation, DOM is considered whole and is only monitored by measuring the dissolved organic carbon (DOC) concentration. However, all of these processes are theoretically accompanied by transformations of the DOM quality and source variations.
Despite our understanding of the impact of the Fe cycle on DOM degradation or protection, few data are available on the variation in DOM quality within a redox cycle. The whole DOM quality and source variations can be specifically followed and studied using simple spectroscopic methods (UV–Vis absorbance, 3D fluorescence) and the C and N isotopic composition (δ13C and δ15N) [8,9,10]. For this purpose, we performed a series of successive reduction/oxidation incubations using natural wetland soil. The C and N isotopic compositions were measured over time and combined with measurements of the DOM quality evolution with time and redox-alternating conditions. Element solution chemistry and thermodynamic modeling approach were also used.

2. Materials and Methods

All of the chemicals used were of analytical grade. The solutions were prepared with deionized water (Milli-Q system, Millipore). The containers used were (i) soaked in 10% ultrapure HNO3 for 48 h at 60 °C to remove all possible contaminant sources, (ii) soaked in and then rinsed with Milli-Q water for 24 h at 60 °C, and (iii) finally dried at 30 °C.

2.1. Soil Sampling and Soil Characteristics

The soil sample was collected in a riparian wetland, the so-called Mercy wetland, located in the Kervidy-Naizin catchment (Brittany, north-western France), belonging to the French network of long-term Environmental Research Observatories (ORE Agrhys). Numerous hydrological and biogeochemical studies [11,12,13,14] provided good information about the water sources and pathways throughout the hydrological periods.
The Mercy wetland regularly undergoes periodic fluctuations in the water level, leading to the establishment of redox cycles involving Fe [12,13,15,16,17].
The soil sample corresponds to an aliquot of the upper organo-mineral horizon (Ah) from a Planosol (according to the WRB classification), developed on Proterozoic schists. This schist is mainly composed of quartz, muscovite, chlorite, K-Felspar, and plagioclase [18]. The soil horizons comprise a large number of secondary minerals, including illite, smectite, kaolinite, various Fe-oxyhydroxides, such as hematite and goethite, and Mn oxides [11].
The soil sample was collected in February 2013 during the water table rise. The soil was air-dried for five days and sieved to 2 mm [19].

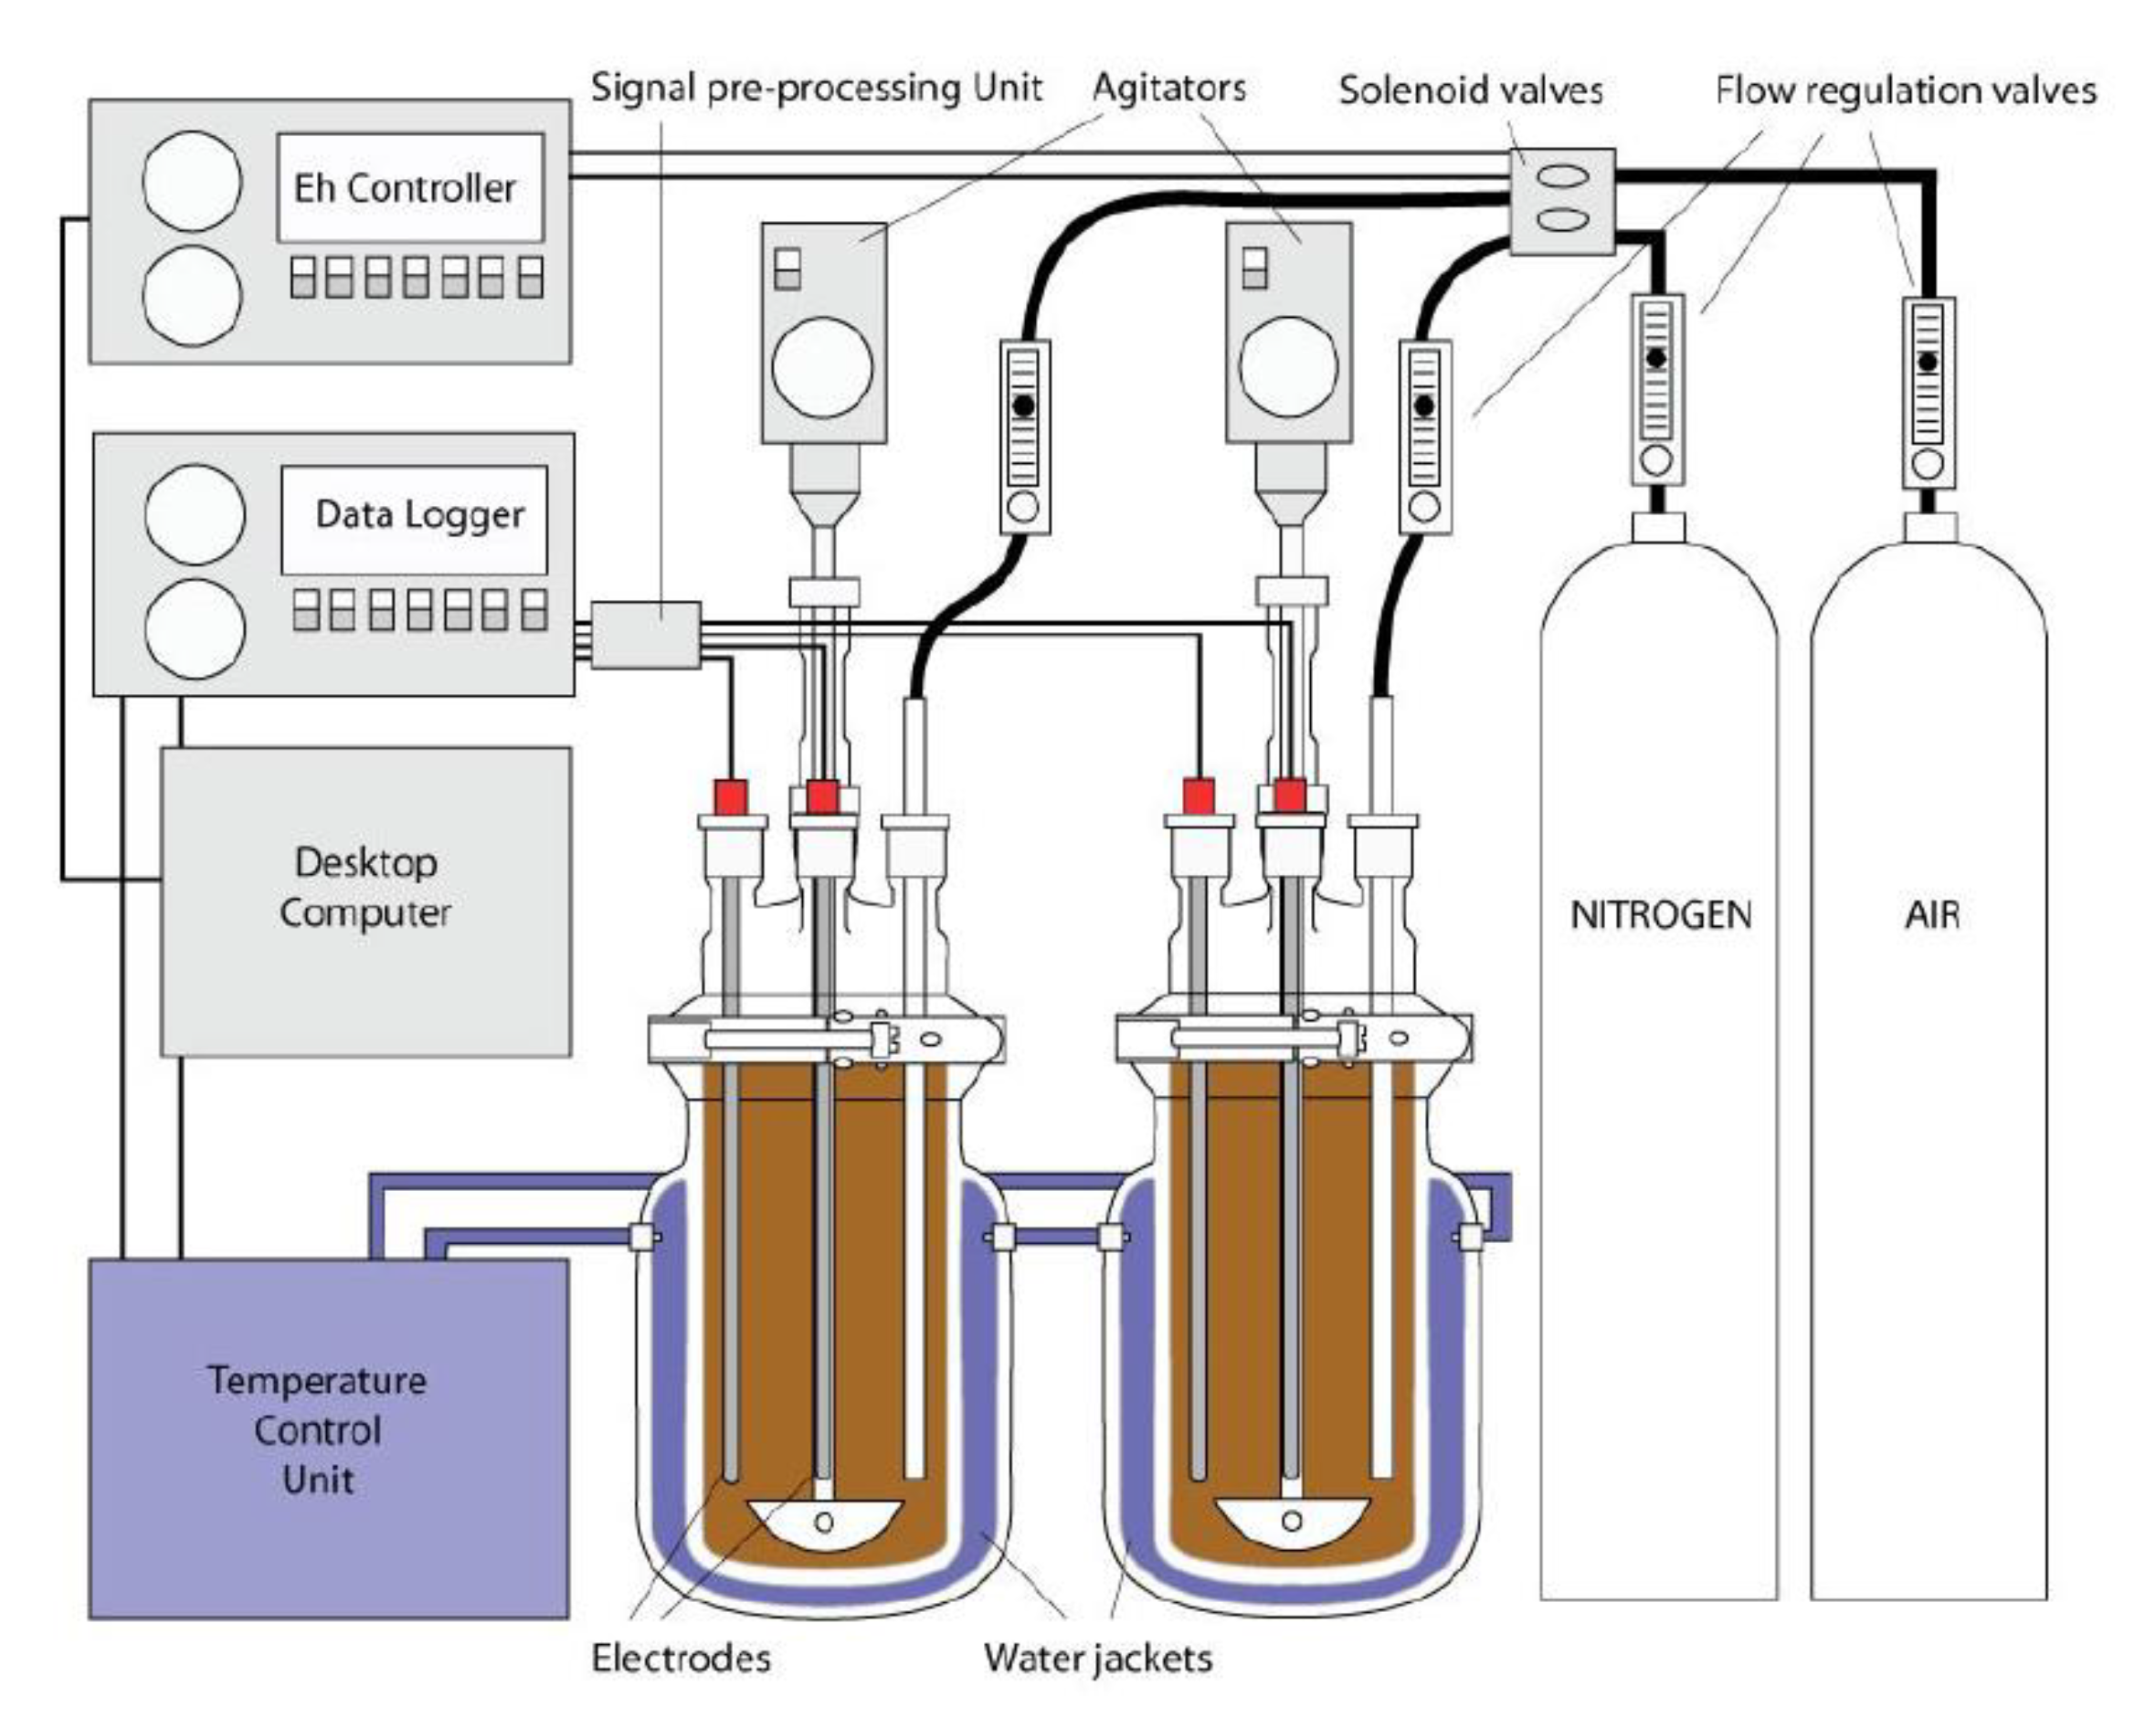
2.2. Experimental Setup

The experimental procedure was based on a two-stage experiment using a soil suspension, settled under reducing and then under oxidizing conditions. The soil suspension was prepared at a 1:20 ratio of dry soil/solution by mixing 50 g of soil with a solution containing 30 mg L−1 of Cl, 30 mg L−1 of NO3, and 10 mg L−1 of SO42− to mimic the anion composition of the soil solution in the Mercy wetland during the rise of the water table.
The suspension was placed in an air-tight, 1 L batch reactor (Guerin, Biolafite) at 30 °C (Figure A1 of Appendix A). Prior to the start of the experiment, the soil suspension was gently stirred under aerobic conditions for the first two days until the pH and DOC concentrations stabilized. The suspension was continuously and gently stirred, with a stream of N2 continuously supplied via an autogas injection system at 2 L min−1 for the first 5 h and then at 0.2 L min−1. The Eh and pH of the suspension were monitored with combination electrodes (405-DPAS-SC-K8S/225 Mettler Toledo (Greifensee, Switzerland) for the pH and Pt4805-DPAS-SC-K8S/225 Mettler Toledo (Greifensee, Switzerland) for the Eh). Approximately 30 mL of the soil suspension was drawn off daily with a sterile syringe (under N2 gas in the anaerobic treatments), centrifuged for 10 min at 1950 g, and directly filtered through a 0.2 μm cellulose acetate membrane filter (Millipore, Burlington, MA, USA). The experiments were carried out in duplicate, and the errors bars reported in each figure represent the analysis standard errors. On the collected soil solutions, the DOC, Fe(II), cation, and anion concentrations were determined, as well as the SUVA and 3D fluorescence of the soil solutions and δ13C and δ15N values for both the soil solutions.

2.3. Analytical Procedures

2.3.1. Elemental Concentrations

After fusion of the whole-rock sample with LiBO2 flux and acidic dissolution with HNO3, the major and trace element composition was determined at the CNRS Analytical Research Facility (SARM, CNRS, France) by ICP-OES and ICP-MS (Table A1 of Appendix B). The soil organic carbon content was determined using a carbon-sulfur analyzer (Leco SC144 DRPC) (Table A1). The soil sample contained 1.40 wt % of Fe and 6.64 wt % of organic carbon.
For the soil solutions, the major and trace element concentrations were determined using an Agilent Technologies HP 7100 inductively coupled plasma–mass spectrometry (ICP-MS) system in the Geosciences Laboratory at Rennes University (Rennes, France). Briefly, each soil solution was acid-digested two times with 14 N HNO3 at 90 °C in a clean Savillex® (Eden Prairie, MN, USA) digestion vessel and evaporated to complete dryness. In the case of a high DOC concentration, 20 drops of ultrapure hydrogen peroxide (H2O2, of ultrapure grade) were added to the samples in order to ensure the total oxidation of the organic matter, and then the vessel was closed and heated on a hot plate (80 °C) for 24 h. Afterwards, the solution was evaporated. The samples were then dissolved in 0.37 N HNO3 and analyzed. International geostandard SLRS-4 (riverine water reference) was used to check the validity and reproducibility of the analyses. The typical rates of uncertainty (including all error sources) are <5% for all of the trace elements, whereas for major anions, the uncertainty lies between 2% and 5%, depending on the concentration levels.
The dissolved organic carbon (DOC) and dissolved inorganic carbon (DIC) concentrations of the soil solutions were analyzed with a Total Organic Carbon (TOC) analyzer (Shimadzu TOC-V-CSH). The accuracy of the DOC measurements was estimated at ±5% for all of the samples using a standard solution of potassium hydrogen phthalate. Ion chromatography measurements were performed on a Dionex DX-120 system. Respectively, the detection and quantification limits are 0.27 and 0.89 mg L−1 for NO3, 0.32 and 1.06 mg L−1 for Cl, and 0.38 and 1.25 mg L−1 for SO42−, with an estimated accuracy of ±5%.
The concentrations of Fe(II) in the soil solutions were determined with the 1.10 phenanthroline colorimetric method (AFNOR NF T90-017 (AFNOR, 1997)) at 510 nm using a UV–Vis spectrophotometer (UVIKON XS, Bio-Tek Instruments, Saint Quentin Yvelines, France).

2.3.2. Stable Carbon and Nitrogen Isotopic Compositions

The carbon and nitrogen isotopic compositions of the soil solutions (δ13Csolution, δ15Nsolution) and soil (δ13Csoil, δ15Nsoil) values were determined at the Stable Isotope Laboratory of the PEGASE Joint Research Unit of the INRA in Saint-Gilles, France. Each soil solution aliquot was filtrated through a previously washed 0.2 µm acetate filter and then acidified by adding 1 mL of 1 N HCl to remove all traces of inorganic carbon. The solution samples were then frozen and freeze-dried before analysis. Each soil sample was also acidified by adding 1 N HCl and then rinsed with Milli-Q water in order to remove any trace of inorganic carbon. Each soil sample was frozen and freeze-dried before analysis. The δ13C and δ15N of both soil and soil solutions were determined using an elemental analyzer (Vario Micro Cube, Elementar) interfaced with an isotope ratio mass spectrometer (IRMS) (VG Isoprime). Tin capsules were used for sample loading. The δ13C or δ15N values are expressed as relative to the international standard Vienna Pee Dee Belemnite (V-PDB) or atmospheric N2, as follows:
δ13C or δ15N (‰) = [(Rsample/Rstandard) − 1] × 1000
where Rstandard and Rsample are the ratios of 13C/12C or 15N/14N in the standard and sample.
International standards were also measured for the analysis period: (i) USGS 24 (δ13C = −16.0 ± 0.1‰ (n = 8)), (ii) ANU sucrose (δ13C = −10.5 ± 0.1‰ (n = 8)), (iii) Glutamine (δ13C = −14.5 ± 0.1‰; δ15N = 0.9 ± 0.1‰ (n = 8)), (iv) urea (δ13C − 38.1 ± 0.1‰; δ15N = 0.0 ± 0.1‰ (n = 8)), and (v) Glutamic acid (δ13C = −27.6 ± 0.1‰; δ15N = 3.8 ± 0.1‰ (n = 8)). The accuracy of the measured δ13C values is better than ±0.2‰, based on repeated measurements of the samples and standards.

2.3.3. Spectroscopic Analyses

The dissolved organic matter was characterized using UV–Vis absorbance and fluorescence. The absorption spectra (UV–Vis) of the soil solutions were determined with a Perkin-Elmer Lambda 20 spectrophotometer in a 1 cm quartz cuvette, with a wavelength ranging from 200 to 600 nm with 0.5 nm increments. The specific UV absorbance measured at 254 nm (SUVA) characterizes the absorption in the mass units following this equation: SUVA (L mgC−1 m−1) = A254 (m−1)/[DOC] (mgC L−1). SUVA is often used as a proxy for DOM aromaticity (aromaticity = 6.52 SUVA + 3.63) [20]. The absorption properties measured at 280 and 287 nm are correlated with both the apparent molecular weight and aromaticity of the aquatic natural organic matter [21,22]. Distilled water was used as a blank. Possible interference due to Fe(III) absorbance at A254 nm was taken into account (<5%) based on repeated measurements of the soil water extracts with variable levels of Fe(III) enrichment, and the SUVA values were corrected for the presence of iron.
All of the soil solutions were analyzed using a Perkin-Elmer LS 55 spectrofluorometer in a 10 mm quartz cuvette. The soil solutions were diluted with deionized water until A254 was below 0.10 to minimize the inner filter effect [23] and were subsequently analyzed using a 3D-fluorescence excitation–emission matrix (3D-FEEM). The three-dimensional excitation–emission fluorescence spectra were obtained by collecting individual emission spectra (250–600 nm) over a range of excitation wavelengths (200–420 nm), with a 0.5 nm increment and a scan speed of 1500 nm min−1, and then by merging the data together into a single three-dimensional data file. Instrument stability was determined using the Raman peak of deionized water excited at 350 nm, with the emission monitored at 395 nm as suggested by Lawaetz and Stedmon [24]. Raman scattering was mitigated by subtracting a blank EEM spectrum collected on deionized (18.2 MΩ) water from each corrected EEM. The FI, BIX, and HIX values were determined using data from the corrected EEM spectra.

2.4. Speciation Modeling

Modeling calculations were performed with PHREEQC/Model VI [25]. The model was used to calculate the speciation (saturation index, redox, sorption, etc.) in organic-rich solutions. This model assumes that the complexation of ions by humic substances occurs through eight discrete sites: four weak sites (carboxylic groups) and four strong sites (phenolic groups). The “minteq.v4” database was completed by both (i) the solubility constants of the reduced soil phases that were possibly encountered in this soil from [26], such as green rusts (GR1(Cl) with log K = 28.3; GR2(SO42−) with log K = 3.9) and hydroxyl-green rusts (hydroGR2 with log K = 25.4), and (ii) model VI specific binding parameters corresponding to the complexation of Ca, Mg, Al(III), Fe(II), and Fe(III) with the organic matter. Specific binding parameters for Ca and Mg are from Tipping [27], those for Al(III) and Fe(III) are from Marsac et al. [28], and those for Fe(II) are from Catrouillet et al. [29]. The speciation was calculated from the chemical composition of the experimental soil solutions at each sampling point.

3. Results

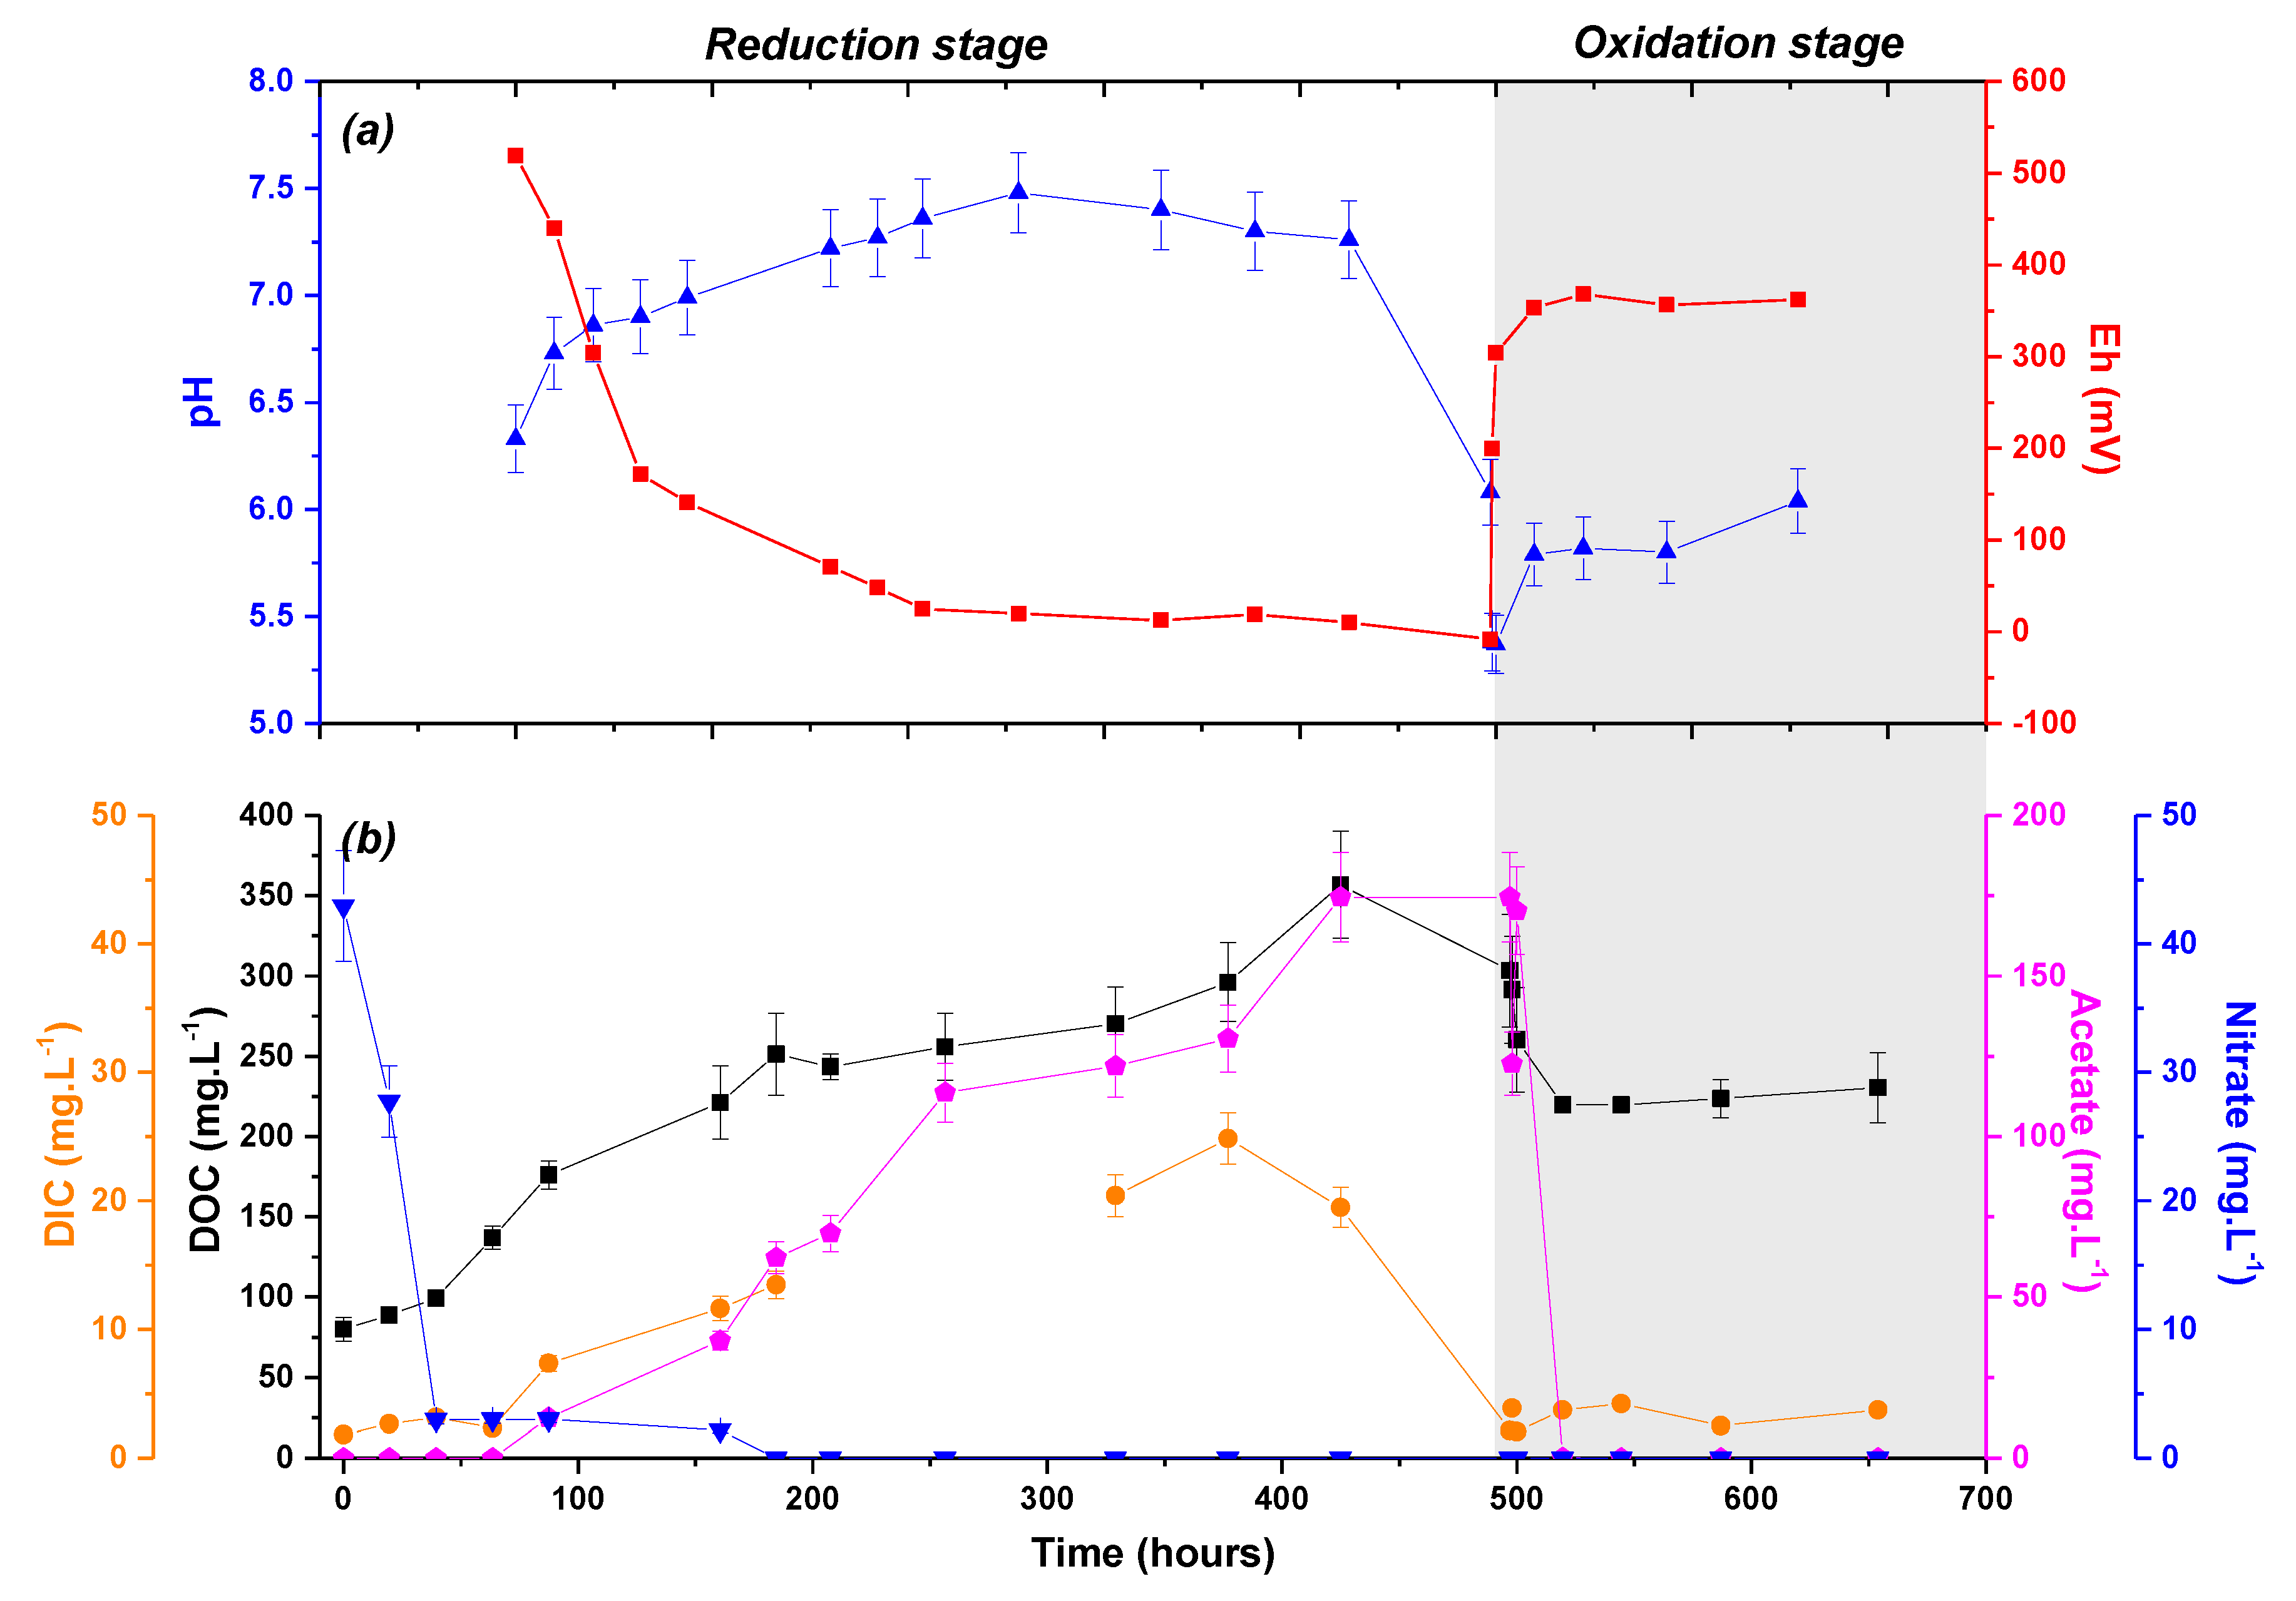
3.1. Evolution of the Soil Solution Chemistry

The evolution of the elemental composition of the wetland soil with the anoxic and oxic periods is consistent with the establishment of reducing and oxidizing conditions [12,30,31,32].
During the reducing period (0–497 h), pH increased from 6.3 ± 0.2 to 7.5 ± 0.3 in response to the consumption of H+ by the reduction reactions. The Eh progressively decreased from 519 to −8.2 mV, reflecting the establishment of moderate reducing conditions (Figure 1a).
Iron(II) and acetate, a by-product of the consumption of OC by bacteria, were produced as soon as the solution was free of NO3 (< quantification limit 0.5 mg L−1) at t = 160–184 h (Figure 1b and Figure 2). The iron(II) and total Fe (Fetot) concentrations were similar, suggesting that the released Fe corresponded to Fe(II) (Figure 2). The maximum Fe(II) concentrations reached 14.4 ± 1.4 mg L−1 at t = 425 h, along with the maximum acetate concentration of 174.5 mg L−1, which represented 49% of the produced DOC at the end of the reduction period. This indicates the onset of Fe-oxyhydroxides reductive biodissolution. Released Fe(II) mainly occurs as Fe(II)-organic complexes (90–100%), as shown by the modeling calculations (Figure 3).
In the early reduction period, the DOC concentration slowly increased from 80.1 ± 13.3 to 99.3 ± 2.8 mg L−1 after 39.5 h and reached 356.7 ± 33.3 mg L−1, i.e., nearly 4.5 times the initial DOC concentration, at the end of the reduction period (Figure 1). The DIC concentrations also increased from 1.9 ± 0.2 to 24.9 ± 2.0 mg L−1 at the end of the reduction period, combined with the production of acetate. Note that the reduction experiment was performed under constant N2 flux preventing large CO2 solubilization.
During the oxidation (497–654 h), the pH rapidly decreased from 7.3 ± 0.2 to 5.4 ± 0.2 after 2 h of oxidation and then increased to 6.0 at the end of the oxidation. Meanwhile, the Eh rapidly increased from −8.2 to 300 mV after 2 h and then slowly to 362 mV (Figure 1a). The dissolved organic carbon decreased from 356.7 ± 33.3 mg L−1 at the end of the reduction to 219.8 ± 2.5 mg L−1 in the early stage of the oxidation. Then, the DOC slightly increased to reach 230.4 ± 21.7 mg L−1 at this end of the oxidation period. Acetate was still present after 2 h, reaching 170 mg L−1, and then it completely disappeared. The DIC also significantly decreased to approximately 2.0 mg L−1; this value is close to the one obtained at the beginning of the redox cycle. The abiotic oxidation of Fe(II) by O2 also produces CO2 [33,34,35]; however, the venting of the reactor to produce oxic conditions involved significant CO2 degassing. After this significant decrease, DIC progressively increased to reach 3.7 ± 0.4 mg L−1 at the end of the experiment. This concentration is approximately 100 times higher than the DIC concentration expected due to atmospheric CO2 solubilization. This DIC concentration combined with the weak increase in DOC suggests a possible OM degradation. Iron(II) (from 15.4 ± 1.5 mg L−1 to 2.2 ± 0.4 mg L−1) and Fetot (14.4 ± 1.4 mg L−1 to approximately 3.1 ± 0.2 mg L−1) decreased rapidly in response to the O2 increase and subsequent Fe oxidation and precipitation (Figure 1b and Figure 2). However, both Fe(II) and Fetot stabilized rapidly (since t = 19.5 h) at about 3.1 and 4.7 mg L−1, respectively, indicating that approximately 65% of the dissolved Fe is present as Fe(II). Moreover, this final Fe(II) concentration remains larger than that at the beginning of the redox cycle.

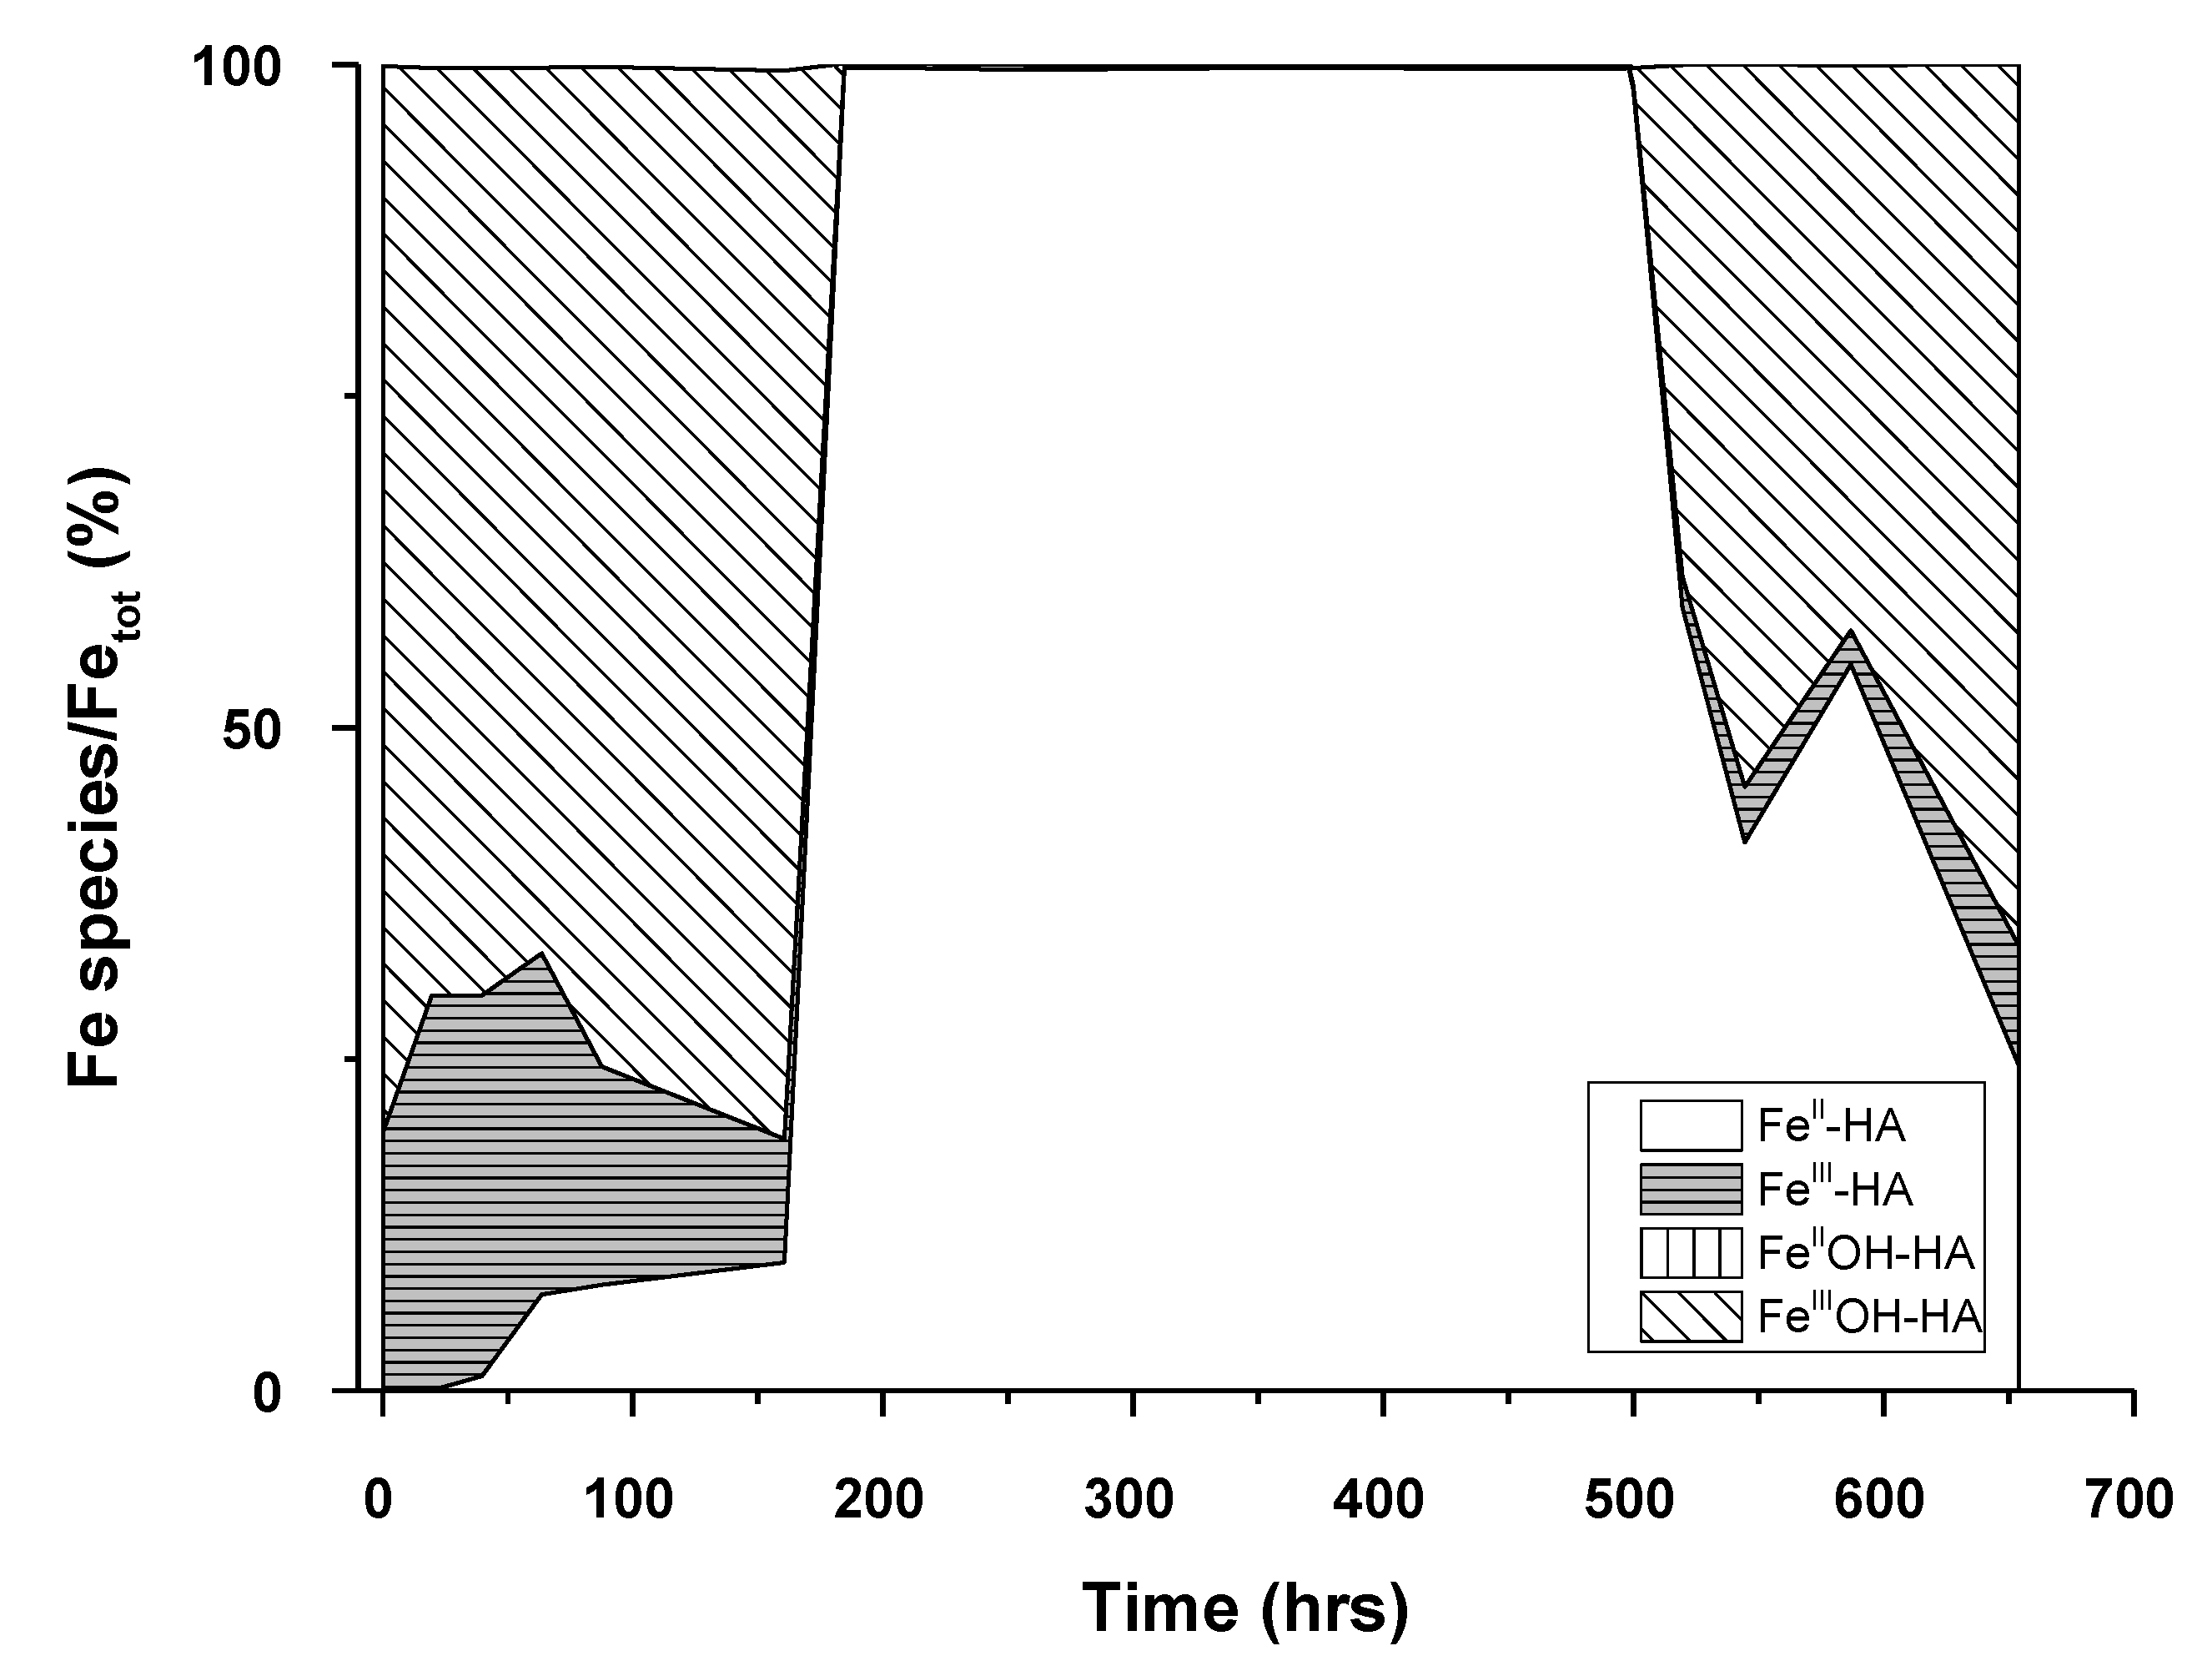
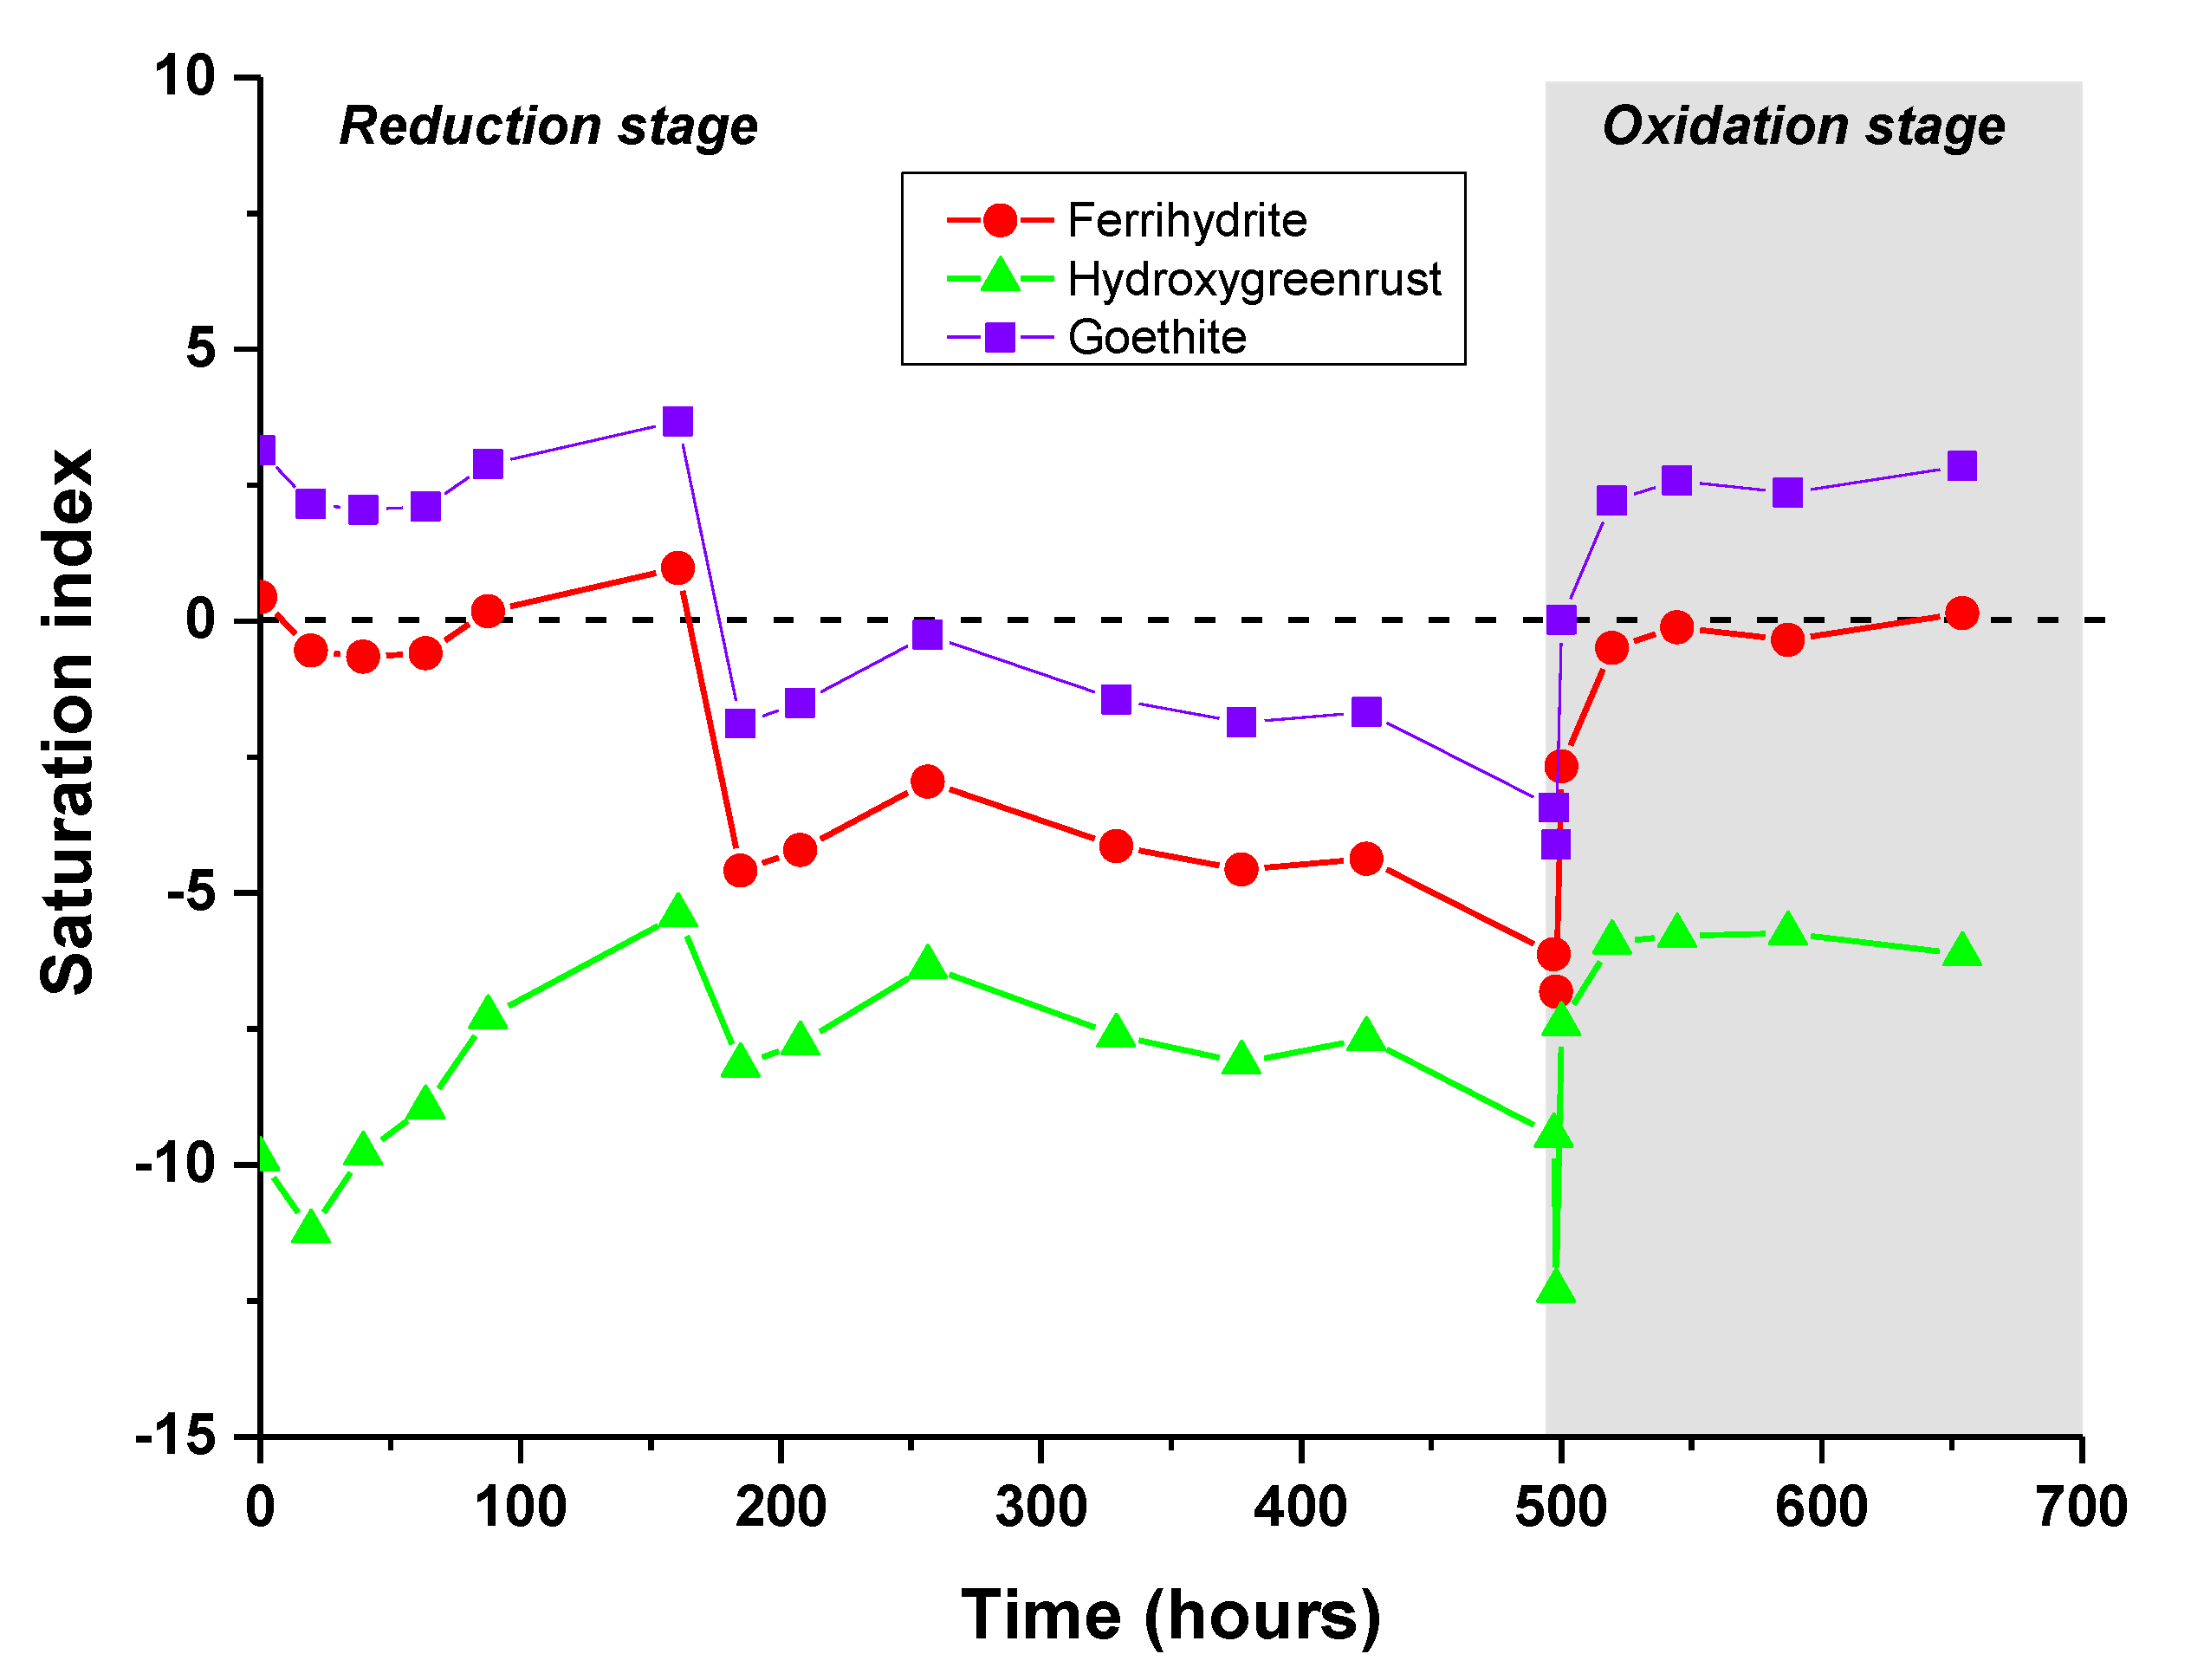
3.2. PHREEQC-Model VI Modeling

PHREEQC-Model VI modeling was used to determine the Fe speciation and saturation indexes of the potential Fe(II)/Fe(III) newly formed minerals that could precipitate under reducing and oxidizing periods (Figure 3). The results showed that from 0 to 39.5 h, nearly 100% of the Fe in solution was present as Fe(III), as Fe(III)-organic complexes. From 39.6 to 160.5 h, roughly 7–10% of the Fe occurred as Fe(II) complexed to organic ligands (Figure 4). From 184.5 to 500 h, Fe(II)-organic complexes were the dominant Fe species in solution, even at the beginning of the oxidizing period. After 519.5 h, the Fe(II)-organic complexes were less present, down to 24.5% at the end of the experiment, while the Fe(III)-organic complexes represented the dominant Fe species. Both at the beginning of the reducing period and at the end of the oxidizing period, when Fe was mainly bound to DOM, the solution was saturated with respect to ferrihydrite (−0.5 < saturation index (SI) < +0.5).

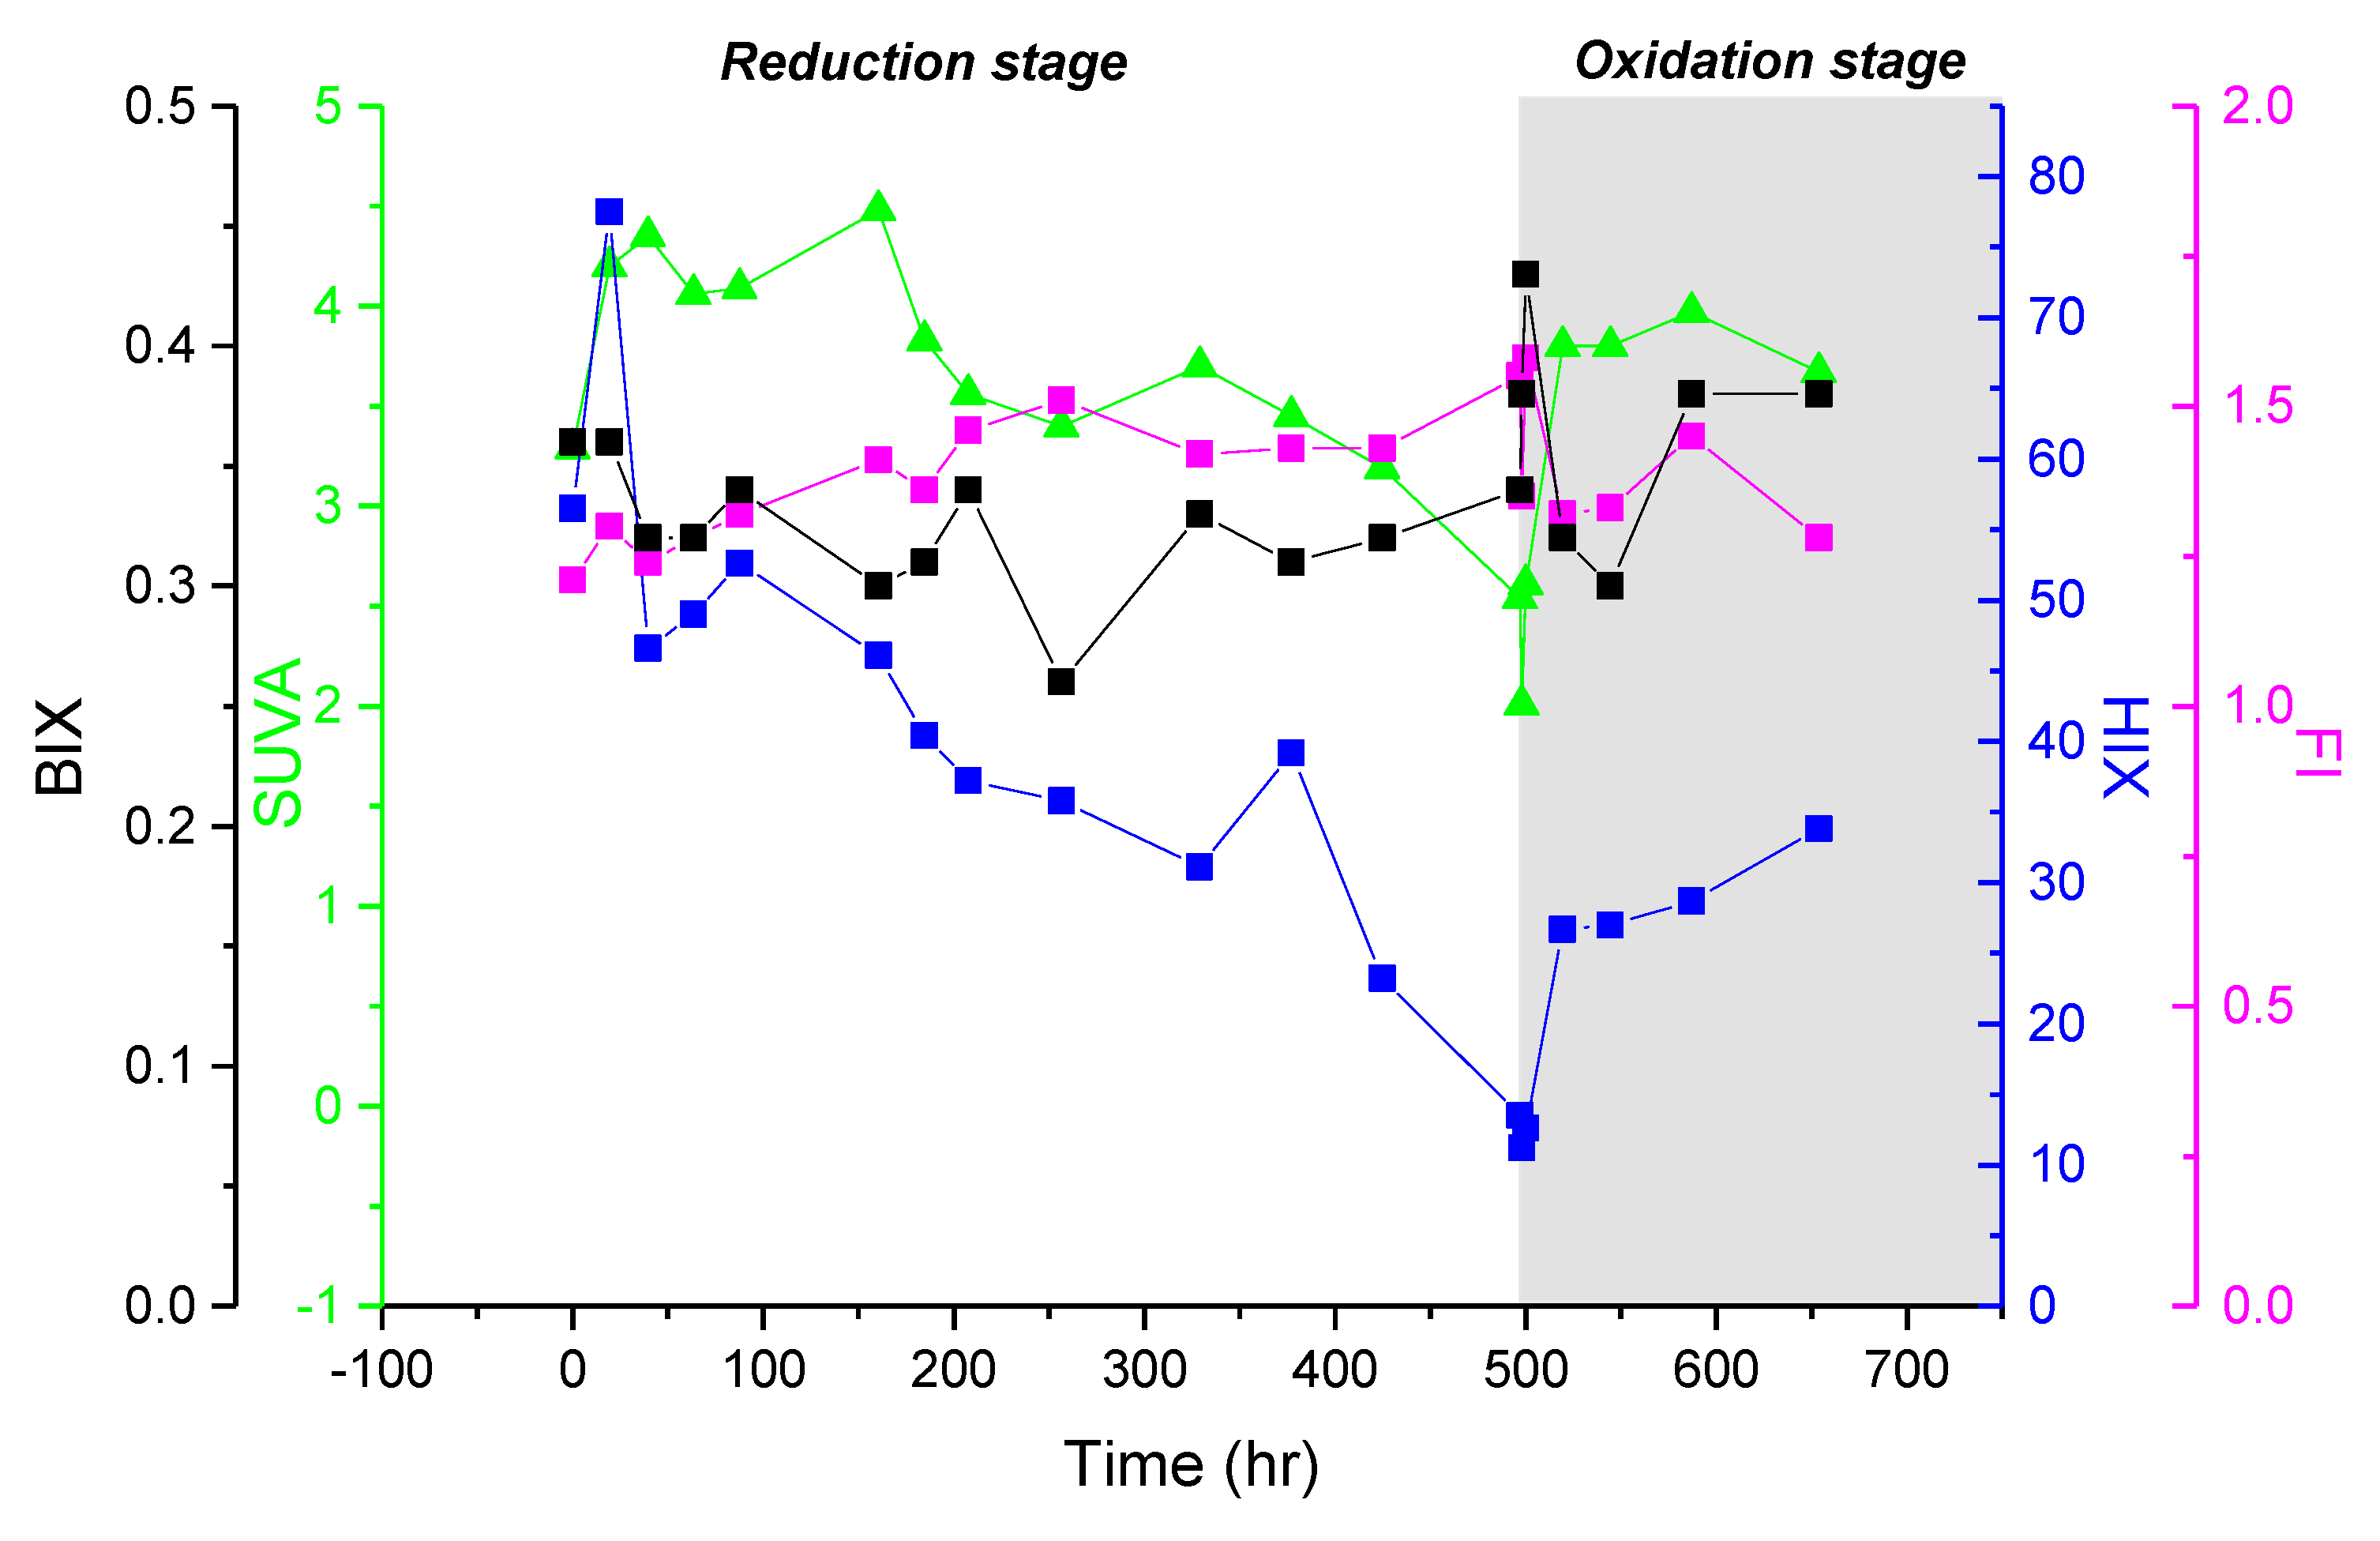
3.3. Spectroscopic Properties of Bulk DOM

At the early stage of the reducing period, SUVA and HIX increased from 3.19 to 4.48 and from 56 to 77.7, respectively (Figure 5), suggesting that DOM was composed of aromatic molecules (humic-like DOM). Then, SUVA and HIX decreased continuously to reach 3.19 and 23, respectively, indicating a decreasing DOM aromaticity.
At the beginning of the oxidation, all of the fluorescence indices significantly decreased concomitantly with the DOC, DIC, acetate, and Fe concentrations in response to the precipitation of Fe as Fe(III)-OM nanoaggregates and their subsequent sedimentation [4,10,36,37,38]. However, BIX and FI rapidly increased to reach their highest values at 0.41 and 1.6, respectively, indicating that DOM was mainly constituted of microbial-derived DOM [39]. After 19.5 h of oxidation, BIX and FI decreased, whereas SUVA and HIX increased, which is consistent with the release of aromatic DOM in the solution. This release seems to dominate the DOM composition, since BIX and FI increased once again after 19.5 h, whereas SUVA and HIX remained constant.

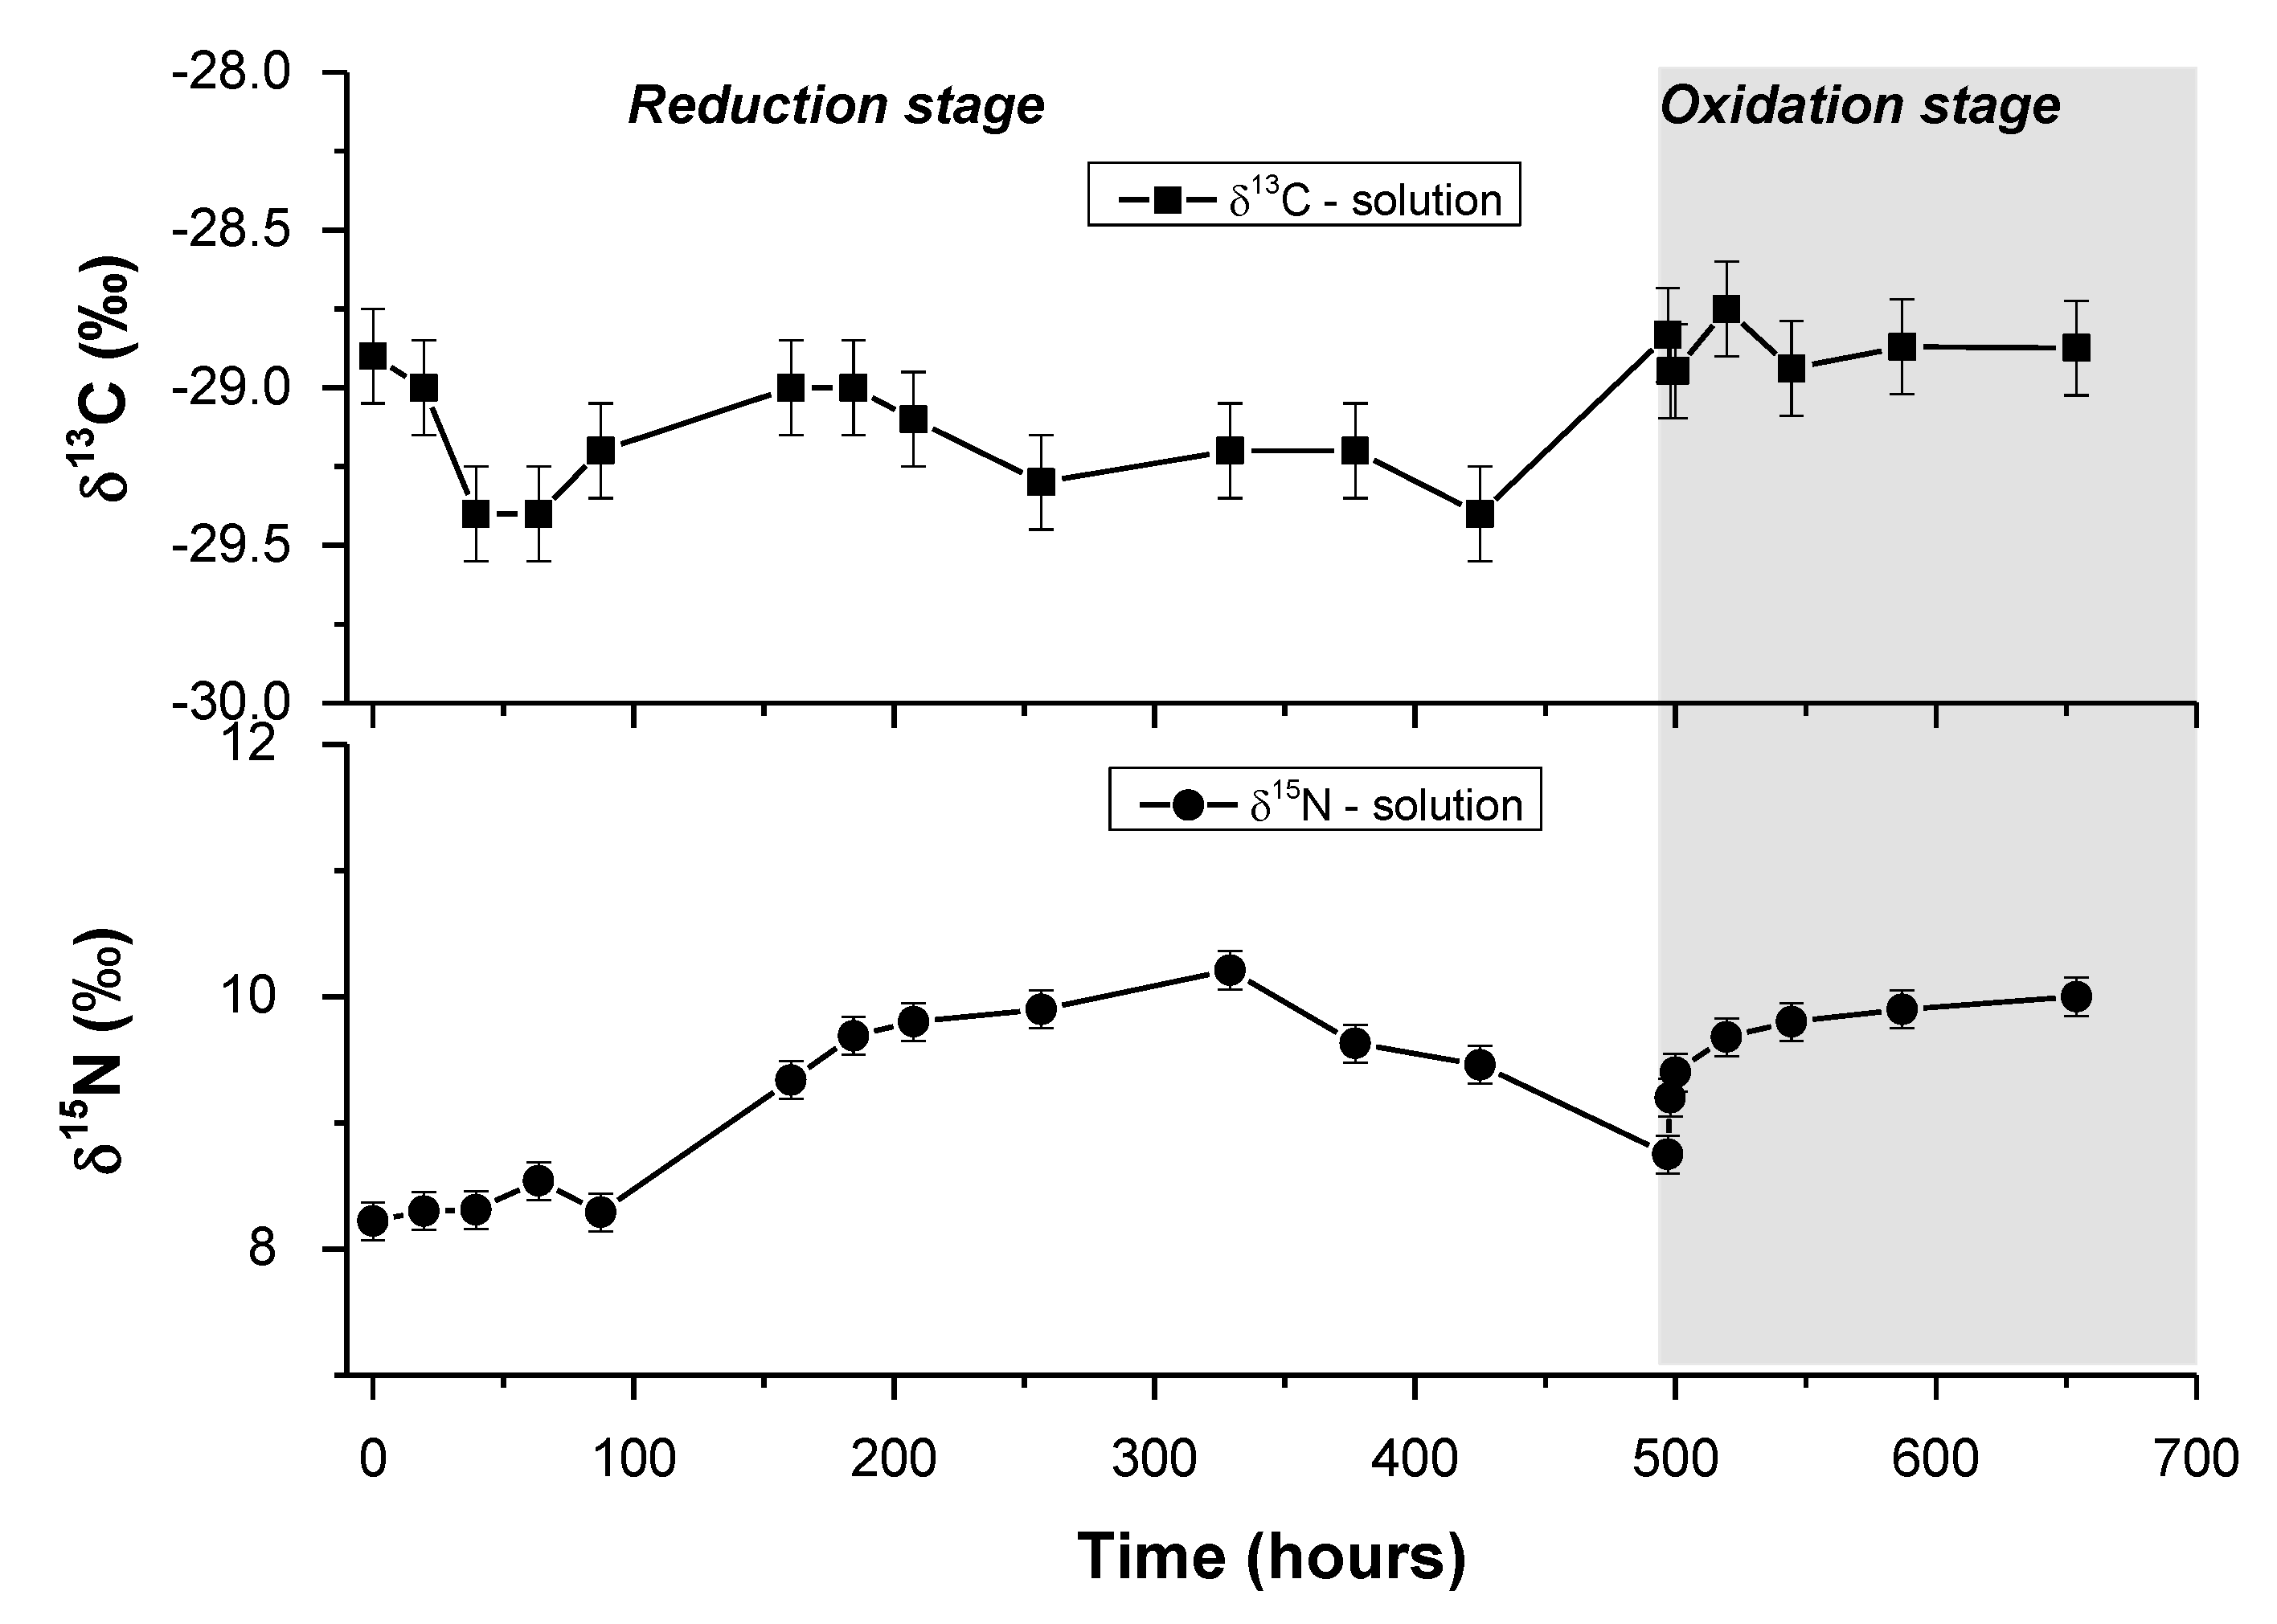
3.4. Carbon Isotopic Composition of DOC during the Experiment

The δ13Csolution values displayed a narrow range, averaging −29.2 ± 0.2‰ (from −28.9 to −29.4‰) and −28.9 ± 0.1‰ during both the reduction and oxidation periods, respectively. These values are typical of C3 plants and in the same range as those already observed in both soil and soil solutions at the same site [13,40]. For information, the soil OM (SOM) remained constant all throughout the experiment, and within the same range as the soil solution, with a δ13Csoil of −29.2 ± 0.2‰. During the reduction period, between 39.5 and 63.5 h, even if the δ13Csolution range remains narrow, the small but significant variation indicates an enrichment in 12C by 0.5‰ in the soil solution.
From 63.5 to 160.5 h, the δ13Csolution slowly increased (to −29.1‰) but never reached its initial value (Figure 6). This period corresponds to an increase in pH (from 6.9 to 7.2) and to the release of aromatic organic molecules in the solution, as indicated by the concomitant SUVA and DOC increase. However, here, this significant release does not entirely mask the signal of the 13C-enriched microbial metabolites.
With regard to oxidation, δ13C increased from −29.4 to −28.8‰ and became enriched in 13C.
During the first 100 h of the reducing period, the δ15Nsolution remained stable at close to 8‰, equivalent to the constant δ15Nsoil (+7.9 ± 0.2‰) and then regularly increased to reach 10‰. Under the oxidizing period, after a decrease of the initial value to 8‰, the δ15Nsolution increased once again to reach 10‰.

4. Discussion

4.1. Evolution of the DOM Quality during the Redox Cycle

During the redox cycle, DOM is released through both anoxic and oxic mineralization mediated by microorganisms and desorption from soil components. Specifically during reduction, the DOM release was produced by the desorption of DOM from the soil in response to the increase of pH, as suggested by Grybos et al. [12]. During the early stage of the reduction period, DOM was bound to Fe, as Fe(III), and then as Fe(II) when the reducing conditions were completely established (Figure 4). The DOC concentrations reached very high values (up to 352 mg L−1). In addition, the DIC release, associated with acetate production, and as highlighted by the evolution of the SUVA, HIX, BIX, and FI indices, indicating the production of nonaromatic organic molecules, suggests that OM was first solubilized as aromatic organic molecules and, in a second step, as nonaromatic metabolites such as acetate and other small organic molecules from OM degradation [41,42,43]. This is also highlighted by the concomitant release of 13C-enriched DOC from microbial metabolites. After 160.5 h, a small and significant decrease in δ13C, concomitant with the strong acetate increase and SUVA decrease, was consistent with the higher activity of the microorganisms.
When Fe(II) dominated as Fe(II) bound to DOC (Figure 3), its adsorption onto soil minerals or still-not dissolved Fe-oxyhydroxides and its subsequent precipitation as secondary minerals (such as siderite, magnetite, or green rust) were thus prevented [44]. All these results suggest that the increase in the DOC concentration in the solution was produced by both desorption from Fe-oxyhydroxides and OM mineralization. They are consistent with increasing microorganism metabolic activity that results in the production of metabolites in response to the biodissolution of reducing Fe-oxyhydroxides in the soil [45]. This production of metabolites is also corroborated by the evolution of slowly decreasing BIX and increasing FI, suggesting the production and release of a low C/N ratio OM and indicating the production of DOM from microbiological activity [39]. This time period corresponds to the establishment of reducing conditions and therefore to the exponential growth of the microorganisms involved in the soil Fe-oxyhydroxides bioreduction, which preferentially consumed 12C. However, the release of 12C-enriched organic carbon, typical of the humic-like substances encountered in these soil solutions, as indicated by the high SUVA values [9,40], seems to mask the 12C consumption via the metabolic activity of the microorganisms.
During oxidation, when O2 was reintroduced in the system, close to 70% of the DOC disappeared from the solution and Fe(II) was oxidized as Fe(III), hydrolyzed, and partially precipitated as newly formed amorphous nano ferric oxides with colloidal DOM as previously demonstrated by Guenet et al. [4,37] and Beauvois et al. [46] (Figure 4). This decrease in DOC results in an instantaneous decrease in all of the DOM quality indexes. After that, BIX and FI increased once again, thereby suggesting that fresh DOM was produced in response to the lysis of reducing bacterial cells, as also highlighted by the remaining DOM in the soil solutions enriched in 13C relative to the reduced solution (+0.6‰), corresponding to released 13C-enriched microbial DOM. The precipitation of Fe-oxyhydroxides seems to preferentially adsorb 12C-enriched DOM following microbial cell lysis. The relative increase in δ15Nsolution observed during the reducing conditions followed by the oxidizing conditions can be explained either by the preferential gain of nitrogen enriched in 15N or the loss of a fraction depleted in 15N. In some bacterial cultures, the total proteins within a cell have been found to be enriched in 15N relative to the bulk nitrogen [47]. The increase in the δ15N values with the degradation of OM could partly reflect the selective gain in proteins. The activity of the microorganisms may modify the δ15N value through the consumption and fractionation of the soil N organic matter content but also via the increase in the bacterial biomass [48,49].
After this first oxidative step, aromatic molecules were progressively released in the solution, concomitantly with a slight increase in Fe(III), indicating the abiotic oxidation/precipitation of Fe involves the precipitation/sedimentation of Fe-OM aggregates and the release of Fe-OM colloids. This release may be due to the continuous stirring of the suspension and the subsequent disaggregation of a part of the freshly formed Fe-OM aggregates. This disaggregation is also expected in natural systems in response to the establishment of the water flow. This release represents approximately 22% of the previously sedimented DOM. This result highlights the binding of Fe with the most aromatic molecules during its precipitation. Several studies have demonstrated that Fe nano-oxides are bound to DOM via inner spheres formed between Fe and C in bidentate complexes [4,46,50]. These complexes are preferentially formed with molecules that have high binding site densities such as aromatic humic molecules. However, a small part of Fe is maintained as Fe(II) due to its binding with DOM. These results may be explained by (i) the preferential retention of small nonaromatic organic molecules in the solution in response to the preferential binding of aromatic organic molecules with the newly formed Fe(III) nano-oxides [51] or (ii) the production of small organic molecules due to the lysis of reducing bacterial cells under oxidizing conditions.

4.2. Impact on Soil OM Degradation and Preservation

In soil, the stabilization of OM through its binding to minerals has long been considered to prevent OM degradation by microorganisms [1,52,53]. Generally, it is admitted that ferric oxyhydroxides preserve, via their binding, SOM from degradation. Several mechanisms have been evoked for the stabilization of OM by ferric species, such as the coprecipitation of DOM with ferric oxide particles or nano-oxides, sorption to highly crystallized Fe oxides, or inhibition of the consumption of labile C by microorganisms due to their binding to ferric species [54].
In the present study, the evolution of the DOM quality relative to the redox conditions, combined with recent studies on the structure of the Fe-OM associations, shed new light on these hypotheses. Under reducing conditions, OM degradation occurs by producing and releasing CO2 as well as metabolites in sufficient amounts that are able to modify the quality indexes of the terrestrial aromatic molecules. These organic molecules act as electron donors for a microbial consortium, as previously shown by Dia et al. [45]. They are also bound to Fe as ferrous species. This strong binding allows the preservation of a significant amount of Fe(II) even under oxidizing conditions. Here, it may represent approximately 25% of the Fe(II) present under reducing conditions (Figure 2). When oxidizing conditions are established, the abiotic precipitation of Fe as Fe(III) nano-oxides involves the coprecipitation of DOM as Fe-OM aggregates, but also promotes the lysis of reducing bacterial cells as small nonaromatic molecules, as indicated by the evolution of the BIX and FI indexes. This lysis is supported by the release of 13C-enriched DOM under oxidizing conditions. Therefore, it is fundamental to take into account the lysis of the bacterial cells involved by considering the alternating reducing and oxidizing conditions in temporarily waterlogged soils. As microorganisms grow at the expense of SOM, the cell lysis represents a second way of SOM degradation. Moreover, these results show that the newly formed Fe-OM aggregates are not stable with regard to the stirring constraints. As a result, the Fe(III)-OM aggregates produced under the oxidation period may be more unstable than expected. When there are enough physical constraints, e.g., in response to the water flux, to involve their disaggregation, smaller and more mobile Fe-OM aggregates are produced, involving the removal of DOM and all of the associated elements.

5. Conclusions

With the context of climate change likely being responsible for the increase in the frequency of soil flooding or drying, it is crucial to understand how nano- and microscale environmental conditions affect organomineral interactions and hence the stability of SOM [55]. It has long been considered that the binding of DOM with ferric species preserves DOM from degradation by microorganisms. Soils that are temporarily waterlogged are perfect targets to study these processes since Fe is alternatively soluble and insoluble under high water level periods (reducing conditions) and low water level periods (oxidizing conditions), respectively. In this study, we tested the impact of a redox cycle on the solubilization of OM. Under reducing conditions, DOM is released from both OM mineralization and desorption from soil minerals in response to the increase in pH. These processes involve changes in the DOM quality from an aromatic OM corresponding to soil terrestrial material to less-aromatic OM due to the production of metabolites in response to the dissimilatory reductive dissolution of Fe-oxyhydroxides in the soil. When oxidizing conditions are re-established, the precipitation of aromatic OM with Fe and the lysis of reducing bacterial cells involve a release of nonaromatic and very labile organic molecules in the solution. This process is rapidly followed by the release of more aromatic OM in the solution. This secondary solubilization occurs in response to the disaggregation of the newly formed Fe-OM aggregates due to the physical constraints applied due to the stirring under our experimental conditions, but which can be compared to the physical constraints of the water flow under natural conditions. These results shed new light on the stabilization/preservation of OM by ferric phases; here, we demonstrate that bacterial cell lysis can be a significant way to solubilize OM from soil during the redox cycle and that the fresh Fe-OM aggregates formed under oxidizing conditions relative to the physical constraints to which they are submitted could release smaller entities that are rich in colloidal OM and able to disseminate in the environment.

Author Contributions

Formal analysis, J.K.; Funding acquisition, A.-C.P.-W.; Investigation, E.L.-K.; Methodology, J.K.; Software, C.C.; Supervision, A.-C.P.-W. and M.D.; Writing–original draft, A.-C.P.-W.; Writing–review & editing, A.-C.P.-W. and M.D. All authors have read and agreed to the published version of the manuscript.

Funding

This research was funded by CNRS.-INSU, grant number PRODYNAMOS.

Acknowledgments

We thank J.N. Thibault from PEGASE INRA unit for his assistance with C isotopic analyses. This research was partly funded by the CNRS-INSU Program EC2CO via the “PRODYNAMOS” project allocated to AC Pierson-Wickmann. Sara Mullin post-edited the English style.

Conflicts of Interest

The authors declare no conflict of interest.

Appendix A

Figure A1. Experimental setup for the soil experiment.
Geosciences 11 00134 g0a1

Appendix B

Table A1. Chemical composition of soil sample.
SiO2
(wt. %)
Al2O3
(wt. %)
Fe2O3
(wt. %)
MnO
(wt. %)
MgO
(wt. %)
CaO
(wt. %)
Na2O
(wt. %)
K2O
(wt. %)
TiO2
(wt. %)
P2O5
(wt. %)
PF
(wt. %)
TotalOrganic Carbon (%)
58.3911.512.850.010.440.250.371.980.710.1222.5699.196.64
As (ppm)Cd (ppm)Co (ppm)Cr (ppm)Cu (ppm)Ni (ppm)Pb (ppm)Zn (ppm)U (ppm)----
7.647.654.8074.8810.5121.2625.1340.962.34----

References

  1. Torn, M.S.; Trumbore, S.E.; Chadwick, O.A.; Vitousek, P.M.; Hendricks, D.M. Mineral control of soil organic carbon storage and turnover. Nature 1997, 389, 170–173. [Google Scholar] [CrossRef]
  2. Masiello, C.A.; Chadwick, O.A.; Southon, J.; Torn, M.S.; Harden, J.W. Weathering controls on mechanisms of carbon storage in grassland soils. Glob. Biogeochem. Cycles 2004, 18, 1–9. [Google Scholar] [CrossRef]
  3. Kramer, M.G.; Chadwick, O.A. Climate-driven thresholds in reactive mineral retention of soil carbon at the global scale. Nat. Clim. Chang. 2018, 8, 1104–1108. [Google Scholar] [CrossRef]
  4. Guénet, H.; Davranche, M.; Vantelon, D.; Pédrot, M.; Al-Sid-Cheikh, M.; Dia, A.; Jestin, J. Evidence of organic matter control on As oxidation by iron oxides in riparian wetlands. Chem. Geol. 2016, 439, 161–172. [Google Scholar] [CrossRef] [Green Version]
  5. Herndon, E.; Al Bashaireh, A.; Singer, D.; Chowdhury, T.R.; Gu, B.; Graham, D. Influence of iron redox cycling on organo-mineral associations in Arctic tundra soil. Geochim. Cosmochim. Acta 2017, 207, 210–231. [Google Scholar] [CrossRef] [Green Version]
  6. Hall, S.J.; Berhe, A.A.; Thompson, A. Order from disorder: Do soil organic matter composition and turnover co-vary with iron phase crystallinity? Biogeochemistry 2018, 140, 93–110. [Google Scholar] [CrossRef] [Green Version]
  7. Chen, C.; Hall, S.J.; Coward, E.; Thompson, A. Iron-mediated organic matter decomposition in humid soils can counteract protection. Nat. Commun. 2020, 11. [Google Scholar] [CrossRef]
  8. Henneberry, Y.K.; Kraus, T.E.C.; Nico, P.S.; Horwath, W.R. Structural stability of coprecipitated natural organic matter and ferric iron under reducing conditions. Org. Geochem. 2012, 48, 81–89. [Google Scholar] [CrossRef] [Green Version]
  9. Lambert, T.; Pierson-Wickmann, A.C.; Gruau, G.; Jaffrezic, A.; Petitjean, P.; Thibault, J.N.; Jeanneau, L. DOC sources and DOC transport pathways in a small headwater catchment as revealed by carbon isotope fluctuation during storm events. Biogeosciences 2014, 11, 3043–3056. [Google Scholar] [CrossRef] [Green Version]
  10. Riedel, T.; Zak, D.; Biester, H.; Dittmar, T. Iron traps terrestrially derived dissolved organic matter at redox interfaces. Proc. Natl. Acad. Sci. USA 2013, 110, 10101–10105. [Google Scholar] [CrossRef] [Green Version]
  11. Curmi, P.; Durand, P.; Gascuel-Odoux, C.; Merot, P.; Walter, C.; Taha, A. Hydromorphic soils, hydrology and water quality: Spatial distribution and functional modelling at different scales. Nutr. Cycl. Agroecosys. 1998, 50, 127–142. [Google Scholar] [CrossRef]
  12. Grybos, M.; Davranche, M.; Gruau, G.; Petitjean, P. Is trace metal release in wetland soils controlled by organic matter mobility or Fe-oxyhydroxides reduction? J. Colloid Interface Sci. 2007, 314, 490–501. [Google Scholar] [CrossRef] [PubMed]
  13. Lambert, T.; Pierson-Wickmann, A.C.; Gruau, G.; Jaffrezic, A.; Petitjean, P.; Thibault, J.N.; Jeanneau, L. Hydrologically driven seasonal changes in the sources and production mechanisms of dissolved organic carbon in a small lowland catchment. Water Resour. Res. 2013, 49, 5792–5803. [Google Scholar] [CrossRef] [Green Version]
  14. Merot, P.; Durand, P.; Morisson, C. Four-component hydrograph separation using isotopic and chemical determinations in an agricultural catchment in western France. Phys. Chem. Earth 1995, 20, 415–425. [Google Scholar] [CrossRef]
  15. Al-Sid-Cheikh, M.; Pédrot, M.; Dia, A.; Guenet, H.; Vantelon, D.; Davranche, M.; Gruau, G.; Delhaye, T. Interactions between natural organic matter, sulfur, arsenic and iron oxides in re-oxidation compounds within riparian wetlands: NanoSIMS and X-ray adsorption spectroscopy evidences. Sci. Total Environ. 2015, 515–516, 118–128. [Google Scholar] [CrossRef]
  16. Dia, A.; Gruau, G.; Olivié-Lauquet, G.; Riou, C.; Molénat, J.; Curmi, P. The distribution of rare earth elements in groundwaters: Assessing the role of source-rock composition, redox changes and colloidal particles. Geochim. Cosmochim. Acta 2000, 64, 4131–4148. [Google Scholar] [CrossRef]
  17. Gruau, G.; Dia, A.; Olivié-Lauquet, G.; Davranche, M.; Pinay, G. Controls on the distribution of rare earth elements in shallow groundwaters. Water Res. 2004, 38, 3576–3586. [Google Scholar] [CrossRef]
  18. Pauwels, H.; Kloppmann, W.; Foucher, J.C.; Martelat, A.; Fritsche, V. Field tracer test for denitrification in a pyrite-bearing schist aquifer. Appl. Geochem. 1998, 13, 767–778. [Google Scholar] [CrossRef]
  19. AFNOR. Evaluation De La Qualité des Sols. Méthodes D’analyse Chimique; AFNOR: La Plaine Saint Denis, France, 2004; Volume 1. (In French) [Google Scholar]
  20. Weishaar, J.L.; Aiken, G.R.; Bergamaschi, B.A.; Fram, M.S.; Fujii, R.; Mopper, K. Evaluation of specific ultraviolet absorbance as an indicator of the chemical composition and reactivity of dissolved organic carbon. Environ. Sci. Technol. 2003, 37, 4702–4708. [Google Scholar] [CrossRef] [PubMed]
  21. Chin, Y.-P.; Aiken, G.; O’Loughlin, E. Molecular weight, polydispersity, and spectroscopic properties of aquatic humic substances. Environ. Sci. Technol. 1994, 28, 1853–1858. [Google Scholar] [CrossRef] [PubMed]
  22. Leenheer, J.A.; Croué, J.-P. Peer Reviewed: Characterizing aquatic dissolved organic matter. Environ. Sci. Technol. 2003, 37, 18A–26A. [Google Scholar] [CrossRef] [Green Version]
  23. Ohno, T. Fluorescence inner-filtering correction for determining the humification index of dissolved organic matter. Environ. Sci. Technol. 2002, 36, 742–746. [Google Scholar] [CrossRef]
  24. Lawaetz, A.J.; Stedmon, C.A. Fluorescence intensity calibration using the Raman scatter peak of water. Appl. Spectrosc. 2009, 63, 936–940. [Google Scholar] [CrossRef]
  25. Marsac, R.; Davranche, M.; Gruau, G.; Bouhnik-Le Coz, M.; Dia, A. An improved description of the interactions between rare earth elements and humic acids by modeling: PHREEQC-Model VI coupling. Geochim. Cosmochim. Acta 2011, 75, 5625–5637. [Google Scholar] [CrossRef]
  26. Rickard, D.; Luther, G.W. Chemistry of iron sulfides. Chem. Rev. 2007, 107, 514–562. [Google Scholar] [CrossRef] [PubMed]
  27. Tipping, E. Humic ion-binding model VI: An improved description of the interactions of protons and metal ions with humic substances. Aquat. Geochem. 1998, 4, 3–48. [Google Scholar] [CrossRef]
  28. Marsac, R.; Davranche, M.; Gruau, G.; Dia, A.; Bouhnik-Le Coz, M. Aluminium competitive effect on rare earth elements binding to humic acid. Geochim. Cosmochim. Acta 2012, 89, 1–9. [Google Scholar] [CrossRef]
  29. Catrouillet, C.; Davranche, M.; Dia, A.; Bouhnik-Le Coz, M.; Marsac, R.; Pourret, O.; Gruau, G. Geochemical modeling of Fe(II) binding to humic and fulvic acids. Chem. Geol. 2014, 372, 109–118. [Google Scholar] [CrossRef] [Green Version]
  30. Ponnamperuma, F.N. The Chemistry of submerged soils. Adv. Agron. 1972, 24, 29–96. [Google Scholar] [CrossRef]
  31. Thompson, A.; Chadwick, O.A.; Boman, S.; Chorover, J. Colloid mobilization during soil iron redox oscillations. Environ. Sci. Technol. 2006, 40, 5743–5749. [Google Scholar] [CrossRef] [PubMed]
  32. Lotfi-Kalahroodi, E.; Pierson-Wickmann, A.-C.A.-C.; Guénet, H.; Rouxel, O.; Ponzevera, E.; Bouhnik-Le Coz, M.; Vantelon, D.; Dia, A.; Davranche, M.; LeCoz-Bouhnik, M.; et al. Iron isotope fractionation in iron-organic matter associations: Experimental evidence using filtration and ultrafiltration. Geochim. Cosmochim. Acta 2019, 250, 98–116. [Google Scholar] [CrossRef] [Green Version]
  33. Wood, P.M. Pathways for production of Fenton’s reagent by wood-rotting fungi. FEMS Microbiol. Rev. 1994, 13, 313–320. [Google Scholar] [CrossRef]
  34. Hammel, K.E.; Kapich, A.N.; Jensen, K.A.; Ryan, Z.C. Reactive oxygen species as agents of wood decay by fungi. Enzyme Microb. Technol. 2002, 30, 445–453. [Google Scholar] [CrossRef]
  35. Hall, S.J.; Silver, W.L. Iron oxidation stimulates organic matter decomposition in humid tropical forest soils. Glob. Chang. Biol. 2013, 19, 2804–2813. [Google Scholar] [CrossRef]
  36. Cismasu, A.C.; Michel, F.M.; Tcaciuc, A.P.; Tyliszczak, T.; Brown, G.E. Composition et propriétés structurales des ferrihydrites naturelles. Comptes Rendus Geosci. 2011, 343, 210–218. [Google Scholar] [CrossRef]
  37. Guénet, H.; Davranche, M.; Vantelon, D.; Bouhnik-Le Coz, M.; Jardé, E.; Pierson-Wickmann, A.C.; Dorcet, V.; Demangeat, E.; Jestin, J. Highlighting the wide variability in arsenic speciation in wetlands: A new insight into the control of the behavior of arsenic. Geochim. Cosmochim. Acta 2017, 203, 284–302. [Google Scholar] [CrossRef] [Green Version]
  38. Keiluweit, M.; Bougoure, J.J.; Nico, P.S.; Pett-Ridge, J.; Weber, P.K.; Kleber, M. Mineral protection of soil carbon counteracted by root exudates. Nat. Clim. Chang. 2015, 5, 588–595. [Google Scholar] [CrossRef]
  39. Gabor, R.S.; McKnight, D.M.; Miller, M.P. Fluorescence indices and their interpretation. In Aquatic Organic Matter Fluorescence; Cambridge University Press: Cambridge, UK, 2014; pp. 303–338. [Google Scholar]
  40. Lambert, T.; Pierson-Wickmann, A.C.; Gruau, G.; Thibault, J.N.; Jaffrezic, A. Carbon isotopes as tracers of dissolved organic carbon sources and water pathways in headwater catchments. J. Hydrol. 2011, 402, 228–238. [Google Scholar] [CrossRef]
  41. Lipson, D.A.; Jha, M.; Raab, T.K.; Oechel, W.C. Reduction of iron (III) and humic substances plays a major role in anaerobic respiration in an Arctic peat soil. J. Geophys. Res. Biogeosci. 2010, 115. [Google Scholar] [CrossRef]
  42. Lovley, D.R.; Phillips, E.J.P. Availability of ferric iron for microbial reduction in bottom sediments of the freshwater tidal Potomac River. Appl. Environ. Microbiol. 1986, 52, 751–757. [Google Scholar] [CrossRef] [Green Version]
  43. Roden, E.E.; Wetzel, R.G. Kinetics of microbial Fe(III) oxide reduction in freshwater wetland sediments. Limnol. Oceanogr. 2002, 47, 198–211. [Google Scholar] [CrossRef]
  44. Davranche, M.; Dia, A.; Fakih, M.; Nowack, B.; Gruau, G.; Ona-nguema, G.; Petitjean, P.; Martin, S.; Hochreutener, R. Organic matter control on the reactivity of Fe(III)-oxyhydroxides and associated As in wetland soils: A kinetic modeling study. Chem. Geol. 2013, 335, 24–35. [Google Scholar] [CrossRef]
  45. Dia, A.; Lauga, B.; Davranche, M.; Fahy, A.; Duran, R.; Nowack, B.; Petitjean, P.; Henin, O.; Martin, S.; Marsac, R.; et al. Bacteria-mediated reduction of As(V)-doped lepidocrocite in a flooded soil sample. Chem. Geol. 2015, 406, 34–44. [Google Scholar] [CrossRef] [Green Version]
  46. Beauvois, A.; Vantelon, D.; Jestin, J.; Rivard, C.; Bouhnik-Le Coz, M.; Dupont, A.; Briois, V.; Bizien, T.; Sorrentino, A.; Wu, B.; et al. How does calcium drive the structural organization of iron-organic matter aggregates? A multiscale investigation. Environ. Sci. Nano 2020, 7, 2833–2849. [Google Scholar] [CrossRef]
  47. Macko, S.A.; Fogel, M.L.; Hare, P.E.; Hoering, T.C. Isotopic fractionation of nitrogen and carbon in the synthesis of amino acids by microorganisms. Chem. Geol. Isot. Geosci. Sect. 1987, 65, 79–92. [Google Scholar] [CrossRef]
  48. Lehmann, M.F.; Bernasconi, S.M.; Barbieri, A.; McKenzie, J.A. Preservation of organic matter and alteration of its carbon and nitrogen isotope composition during simulated and in situ early sedimentary diagenesis. Geochim. Cosmochim. Acta 2002, 66, 3573–3584. [Google Scholar] [CrossRef]
  49. Kohzu, A.; Imai, A.; Miyajima, T.; Fukushima, T.; Matsushige, K.; Komatsu, K.; Kawasaki, N.; Miura, S.; Sato, T. Direct evidence for nitrogen isotope discrimination during sedimentation and early diagenesis in Lake Kasumigaura, Japan. Org. Geochem. 2011, 42, 173–183. [Google Scholar] [CrossRef]
  50. Guénet, H.; Davranche, M.; Vantelon, D.; Gigault, J.; Prévost, S.; Taché, O.; Jaksch, S.; Pédrot, M.; Dorcet, V.; Boutier, A.; et al. Characterization of iron-organic matter nano-aggregate networks through a combination of SAXS/SANS and XAS analyses: Impact on As binding. Environ. Sci. Nano 2017, 4, 938–954. [Google Scholar] [CrossRef]
  51. Adhikari, D.; Yang, Y. Selective stabilization of aliphatic organic carbon by iron oxide. Sci. Rep. 2015, 5, 1–7. [Google Scholar] [CrossRef] [PubMed] [Green Version]
  52. Mikutta, R.; Kleber, M.; Torn, M.S.; Jahn, R. Stabilization of soil organic matter: Association with minerals or chemical recalcitrance? Biogeochemistry 2006, 77, 25–56. [Google Scholar] [CrossRef]
  53. Kögel-Knabner, I.; Guggenberger, G.; Kleber, M.; Kandeler, E.; Kalbitz, K.; Scheu, S.; Eusterhues, K.; Leinweber, P. Organo-mineral associations in temperate soils: Integrating biology, mineralogy, and organic matter chemistry. J. Plant Nutr. Soil Sci. 2008, 171, 61–82. [Google Scholar] [CrossRef]
  54. Eusterhues, K.; Neidhardt, J.; Hädrich, A.; Küsel, K.; Totsche, K.U. Biodegradation of ferrihydrite-associated organic matter. Biogeochemistry 2014, 119, 45–50. [Google Scholar] [CrossRef]
  55. Newcomb, C.J.; Qafoku, N.P.; Grate, J.W.; Bailey, V.L.; De Yoreo, J.J. Developing a molecular picture of soil organic matter–mineral interactions by quantifying organo–mineral binding. Nat. Commun. 2017, 8, 396. [Google Scholar] [CrossRef] [PubMed]
Figure 1. Temporal evolution of the (a) pH and Eh of the soil solutions; (b) nitrate, acetate, dissolved organic carbon (DOC) and dissolved inorganic carbon (DIC) concentrations (mg L−1) relative to time (in hours).
Geosciences 11 00134 g001
Figure 2. Temporal evolution of the DOC concentration and total Fe and Fe(II) concentrations (mg L−1).
Geosciences 11 00134 g002
Figure 3. Fe speciation throughout the experiment.
Geosciences 11 00134 g003
Figure 4. Saturation indices for the hydroxy green rusts: [FeIII2FeII(OH)8] and [FeIIFeIII(OH)5], goethite and ferrihydrite versus time for the incubation experiment modeled with PHREEQC/Model VI [25].
Geosciences 11 00134 g004
Figure 5. Evolution of the fluorescence and UV indexes during and between the reducing and oxidizing periods.
Geosciences 11 00134 g005
Figure 6. Evolution of the δ13CDOC and δ15N variations both during and between the reducing and oxidizing periods in the soil solution.
Geosciences 11 00134 g006
Publisher’s Note: MDPI stays neutral with regard to jurisdictional claims in published maps and institutional affiliations.

