Article

Long-Term Evolution of Fracture Permeability in Slate: An Experimental Study with Implications for Enhanced Geothermal Systems (EGS)

1
GFZ German Research Centre for Geosciences, 14473 Potsdam, Germany
2
Institute of Drilling Engineering and Fluid Mining, Technische Universität Bergakademie Freiberg, 09599 Freiberg, Germany
3
Department of Structural Geology and Geodynamics, Geoscience Centre of the University of Göttingen, 37077 Göttingen, Germany
4
Universitätsenergie Göttingen GmbH, Hospitalstraße 3, 37073 Göttingen, Germany
*
Author to whom correspondence should be addressed.
Geosciences 2021, 11(11), 443; https://doi.org/10.3390/geosciences11110443
Submission received: 30 September 2021 / Revised: 23 October 2021 / Accepted: 26 October 2021 / Published: 28 October 2021

Abstract

:
The long-term sustainability of fractures within rocks determines whether it is reasonable to utilize such formations as potential EGS reservoirs. Representative for reservoirs in Variscan metamorphic rocks, three long-term (one month each) fracture permeability experiments on saw-cut slate core samples from the Hahnenklee well (Harz Mountains, Germany) were performed. The purpose was to investigate fracture permeability evolution at temperatures up to 90 °C using both deionized water (DI) and a 0.5 M NaCl solution as the pore fluid. Flow with DI resulted in a fracture permeability decline that is more pronounced at 90 °C, but permeability slightly increased with the NaCl fluid. Microstructural observations and analyses of the effluent composition suggest that fracture permeability evolution is governed by an interplay of free-face dissolution and pressure solution. It is concluded that newly introduced fractures may be subject to a certain permeability reduction due to pressure solution that is unlikely to be mitigated. However, long-term fracture permeability may be sustainable or even increase by free-face dissolution when the injection fluid possesses a certain (NaCl) salinity.

1. Introduction

Geothermal energy is ubiquitous at a certain depth of the Earth’s crust and may provide great potential to meet the energy demand [1]. To utilize such hot formations for district heating or electricity generation, a sufficient amount of fluid needs to be injected and extracted into/from the reservoirs. Therefore, high hydraulic conductivity of the reservoir determines the success and economic efficiency of such utilization. However, often deep hot reservoirs are of low or no hydraulic conductivity, and thus need to be stimulated to increase their permeability by creating new fracture networks or by activating pre-existing fractures, denoted as Enhanced Geothermal Systems (EGS) [2]. Sustainable fractures, acting as the main pathways for fluid flow, are most important in this context.
Fracture permeability changes associated with, e.g., effective stress, fracture surface roughness, fracture offset/shear displacement, and the mechanical properties of the rock matrix have been widely investigated in experiments e.g., [3,4,5,6,7,8,9,10,11]. Such short-term experiments mainly focused on the stress-dependent permeability variation to shed light on the critical factors (e.g., shear displacement, surface roughness, mechanical properties of the reservoir rock) that determine the sustainability of fracture permeability. Most rock fractures, once created, are always conductive for fluid flow and difficult to close completely by mechanical loading [11,12], which is favorable for EGS. However, a decline in fracture permeability with time has been observed in the field and in laboratory experiments. For example, the productivity index of the geothermal reservoir in Groß Schönebeck, Germany, decreased by about one order of magnitude within two and a half years [13], which was believed to be induced by fluid–rock interactions [14]. Time-dependent fracture permeability reduction in core samples under constant pressure and temperature conditions was also documented in some previous studies e.g., [4,8,15,16,17,18], including various rock types, such as novaculite [15,17], granite [4,19,20,21], shale [21,22], limestone [16], dolomitic anhydrite [18], sandstone, and mudstone [23].
Typically, such permeability reduction occurs at the early stage of an experiment after pressure build-up and progressively towards a steady state with time. The mechanisms governing the fracture permeability evolution are expected to be an interplay of pressure solution, stress corrosion, and mineral dissolution/precipitation [15,17,20,24,25,26,27,28,29], which are often referred to as sealing/healing for macroscopic fracture strengthening or strength recovery [30]. Pressure solution and stress corrosion cracking are driven by the imposed (effective) stress on the fracture plane. The former is a three-step process that involves dissolution at the fracture contacts (i.e., asperities), diffusion along the contact interface, and precipitation within the unstressed fracture void space [31]. The latter mainly results in subcritical crack propagation due to fluid–rock interaction at the stressed crack tips [32,33,34]. Mineral dissolution/precipitation under hydrostatic pore fluid pressure is driven by chemical potential gradients and independent of the applied effective stress on the solid phases. All of the former processes imply a change in the fracture void space, i.e., the fracture aperture, available for fluid flow and thereby yield either a decrease (pressure solution, stress corrosion, and precipitation) or increase (free-face dissolution) in fracture permeability. In addition, fine particle migration-induced permeability reduction was commonly observed in porous media, where fines/clay particles attached to grain surfaces are susceptible to fluid flow [35]. Fines migration may also occur in (re-)activated rock fractures, where gouge material may lead to clogging of the main flow pathways, resulting in permeability reduction [5].
Depending on the dominating mechanisms, the overall process of fracture evolution, permeability may change differently. For example, for the dissolution/precipitation-dominated processes, open fractures can be sealed by mineral deposits within months to hours depending on temperature [29,36,37]. Supersaturated alkaline fluids result in permeability reduction in granite due to promoted precipitation of clay minerals, but under-saturated alkaline fluids can create cavities along the fractures by dissolution, generating sustainable and pressure-independent fracture permeability [38]. Reactive flow experiments with high and low flow rates show significant fracture permeability reduction and unchanged permeability over time, respectively, indicating that equilibrium of fluid–rock interaction processes is important [18]. By using an injection fluid close to chemical equilibrium with the rock matrix, precipitation-induced permeability reduction can be minimized [39]. In some cases, permeability can persist to hundreds of days at intermittent flow of deionized water (DI), where fluid–rock interactions tend to equilibrium during the stopped flow stages [23,24]. Even for substantial mineral precipitation in fractures, permeability can remain almost unchanged up to two months duration if the deposition is mainly located behind contact asperities with respect to the flow direction [30]. Interestingly, limestone permeability can even increase with time if flowing DI produces “wormholes” that develop due to dissolution and mass transfer [16].These findings suggest that mineral dissolution/precipitation effects on fracture permeability evolution are closely related to the fluid/rock compositions, the reaction kinetics, and how the reactive components reshape the flow channel patterns [40,41,42].
In addition to pure chemical effects, stress-induced fracture deformation is also an important process leading to time-dependent permeability reduction. A high fracture closure rate occurs under high effective stress, indicating the contribution of pressure solution [20,43]. The permeability reduction with time can be described by a power-law relation under constant differential stress conditions [21,22], which may result from decreasing normal stress acting on an increasing area of the contact asperities [17,19,44,45,46]. In the presence of stress, subcritical crack growth by stress corrosion may also contribute to the mechano-chemical processes that affect permeability evolution [28], but the effect on fluid chemistry is small [17].
In the aforementioned mechanisms, temperature plays an important role since it determines the reaction kinetics and the solubility of minerals [15,27,43,47]. Fracture permeability evolution, either increase or reduction, depends on the coupled process of mechano-chemical compaction and free mineral dissolution/precipitation under specific pressure and temperature conditions [48]. Therefore, the thermodynamic boundary conditions (pressure, temperature), fluid composition, and rock composition are important for predicting fracture permeability evolution with time.
This experimental study is part of the ‘MEET’ project (Multidisciplinary and multi-context demonstration of EGS exploration and Exploitation Techniques and potentials) within the framework of the European Union’s Horizon 2020. With the aim of evaluating the potential of Variscan metamorphic rocks for EGS in the future, this study focuses on slate material, which is one of the target rocks for a planned EGS at the Göttingen University campus, Germany. We investigated the time-dependent fracture permeability evolution in slates, considering the effects of flow operations (continuous or intermittent flow), fluid composition (deionized water (DI) or brine), and temperature (up to 90 °C as the expected upper bound fluid reinjection temperature after energetic use of the geothermal fluid).

2. Materials and Methods
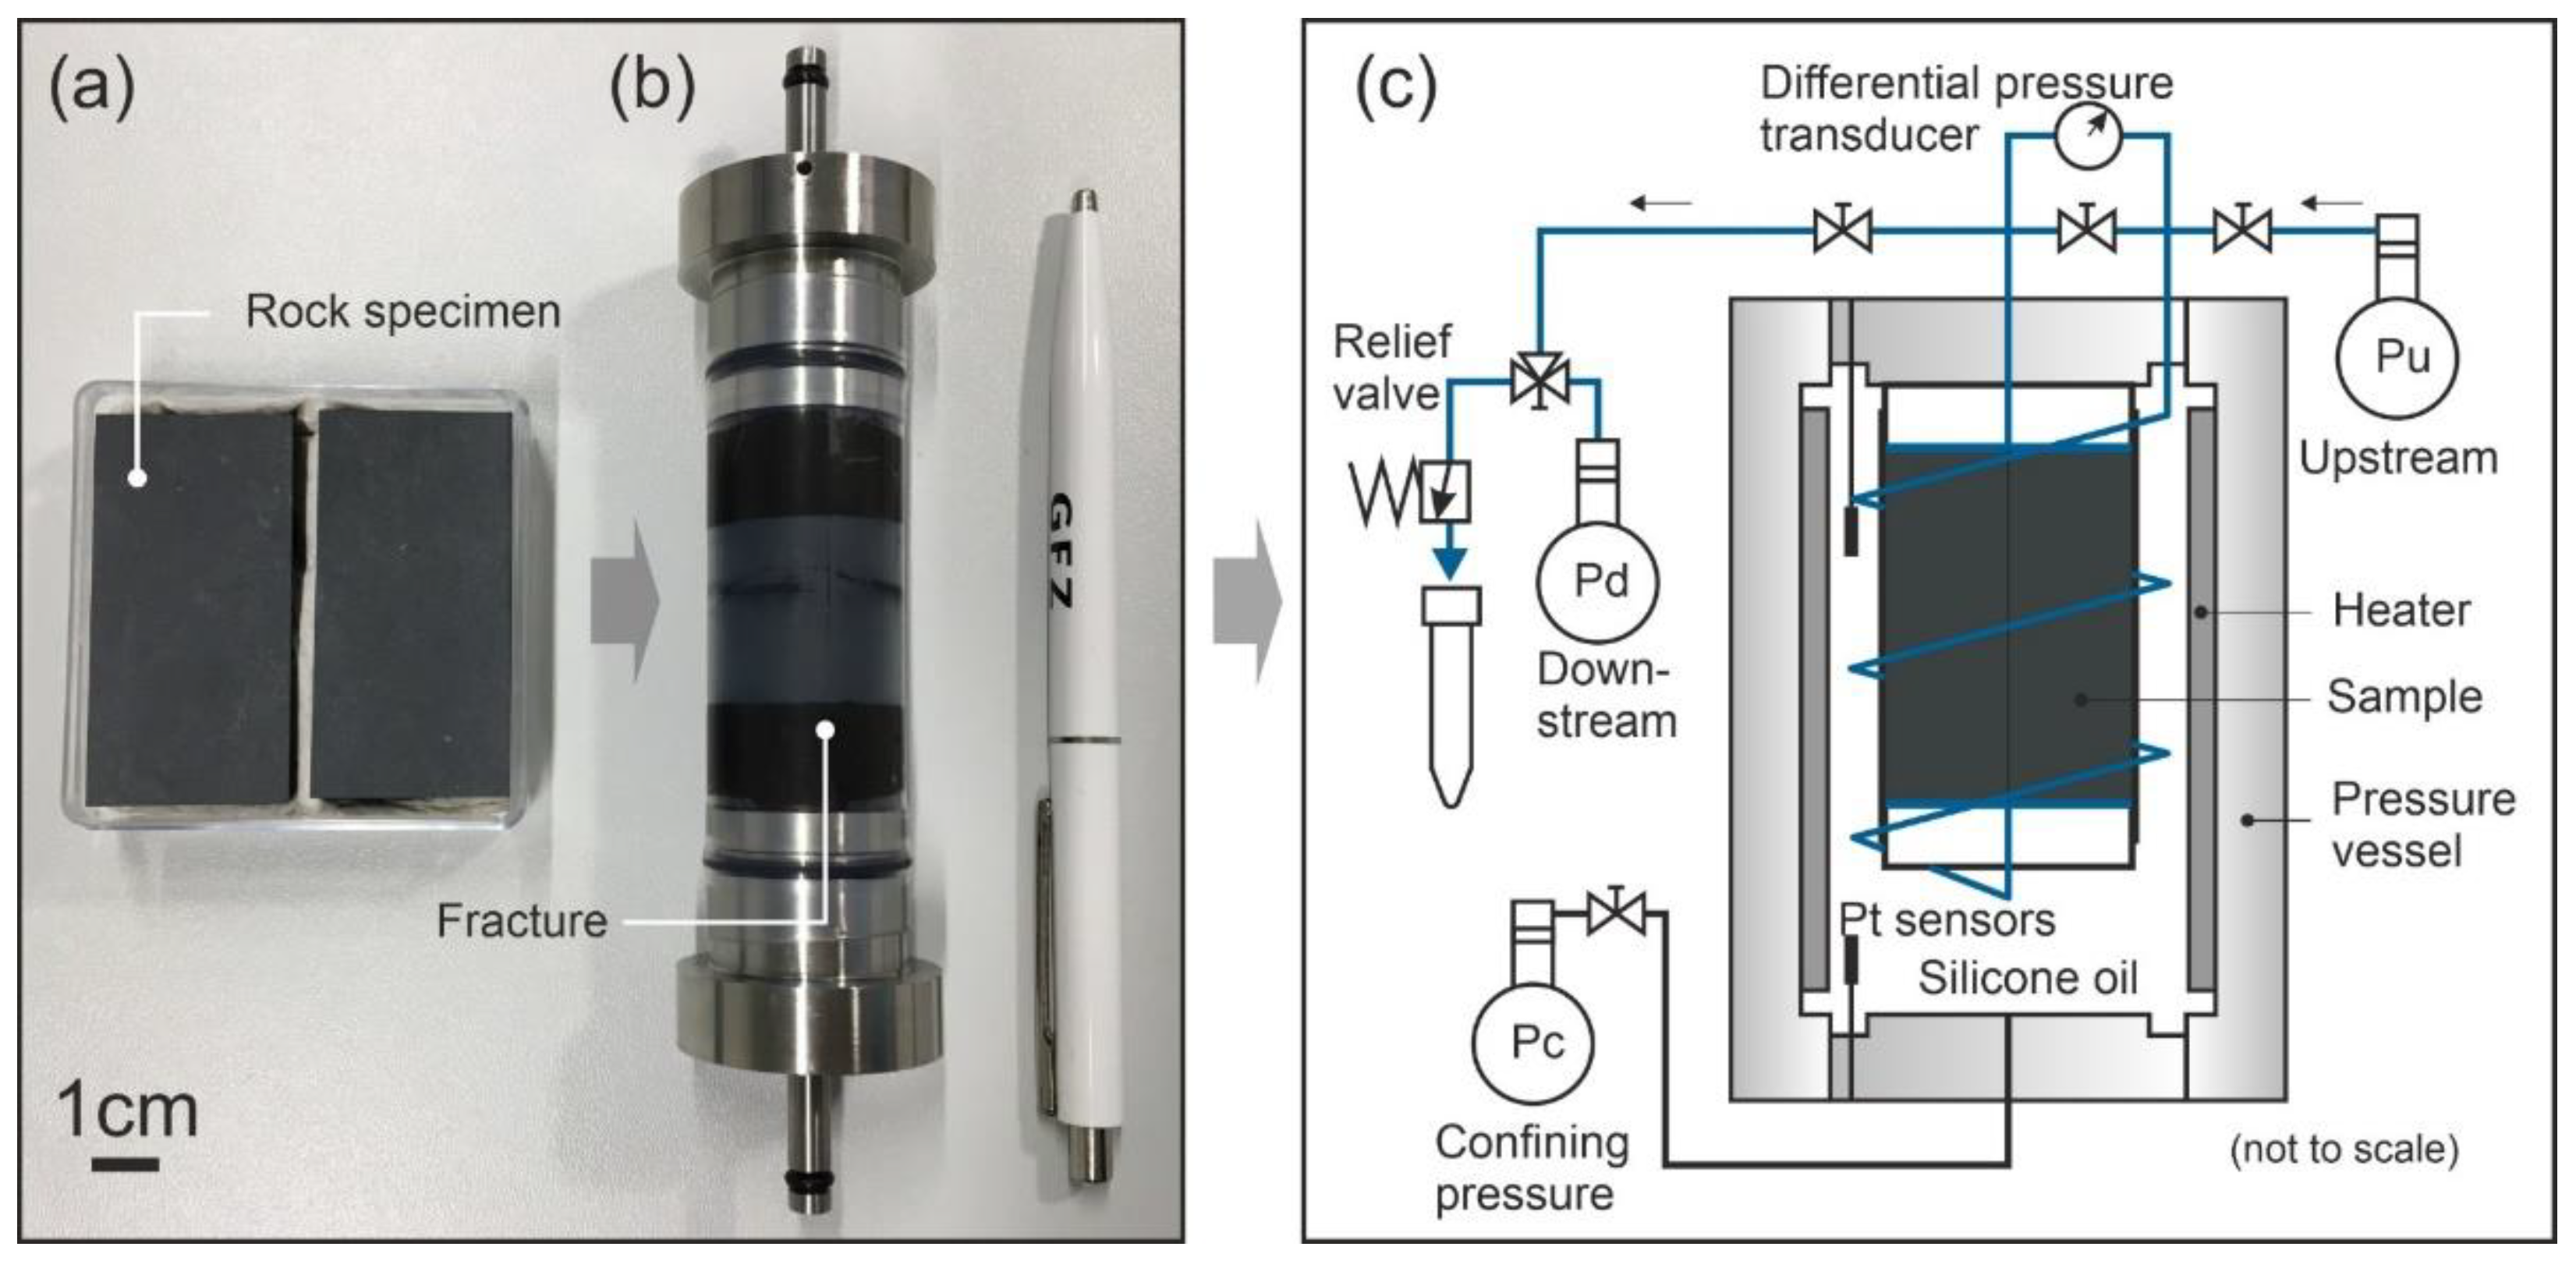
2.1. Rock Samples

The samples were extracted from a drill core made up of dark grey to black Middle Devonian Wissenbach slate from the Hahnenklee well, Harz Mountains, Germany. The original drill core was taken about 40 years ago, is 80 mm in diameter and 320 mm in length, and originates from a well depth between 1156 and 1156.32 m. The core has no macroscopic veins (i.e., a distinct sheet-like body of crystallized minerals within a rock) or obvious fractures (i.e., separated voids in rocks). It should be noted that the choice of well analogue rocks may not fully represent the rock encountered in the reservoir to be accessed and used later for geothermal energy provision. However, in the absence of an exploration well at a particular site, this is the closest one can get and, consequently, has become a standard in experimental reservoir assessment. The sample material used in this study was carefully selected in this regard and originates from a well that is located in geologically close vicinity to the well to be drilled later at the Göttingen University campus, Germany. Regarding possible aging or alteration of the cores during storage in the repository, based on our experiences, there is no indication that this were the case to a degree that would impede any conclusions drawn on the corresponding behavior of the rock encountered in situ.
To prepare three cylindrical samples, SM1, SM2, and SM3, the drill core was first cut with a saw perpendicular to its longitudinal axis to create a macroscopic fracture. Subsequently, smaller cores with a diameter of 25 mm were drilled with maintaining the saw-cut fracture in its center. The two ends of each core were cut and polished to obtain a cylinder with a length of 50 mm. Finally, the saw-cut fracture surfaces were ground using rolling grains of a defined diameter to obtain closely identical surface roughness spectra and thereby ensure comparability between the samples. Some leftover material was used for X-ray powder diffraction (XRD) analysis at the University of Göttingen, Germany, to determine the mineral composition. The main constituents are quartz, muscovite, chlorite, and feldspar (Table 1). This table also evidences the excellent mineralogical homogeneity of the samples. As sample SM3 was located in the original drill core at a cm scale distance to both SM1 and SM2, there is no reason to believe that its composition should differ significantly and thereby impede any comparability. The matrix permeability of the sample material is on the order of 10−19 m2, determined by a gas permeameter at TU Darmstadt, Germany, using a fourth (neighboring) sample and argon gas and applying the Klinkenberg correction.

2.2. Experimental Procedures

The two halves of the prepared specimens were assembled, jacketed with a heat-shrink tube (Figure 1a,b), and vacuum-saturated with DI in a desiccator for more than 24 h. The experiments were performed using three different flow-through apparatuses. For experiments with saline fluids, a device made of Hastelloy C-276 was used, while the other two devices made of stainless steel were used for tests with DI as the fluid medium. All apparatuses can apply pore fluid pressures up to Pp = 50 MPa at hydrostatic confining pressure up to Pc = 100 MPa and temperatures between room temperature and T = 200 °C (for details, see Milsch et al. [49]). Fracture permeability can be determined by monitoring the differential pressure (using a 0~0.6 MPa differential pressure transducer) between the sample’s ends at a constant flow rate. The upstream pump maintains a constant flow rate, while the downstream pump is set to a constant pressure to receive the fluid volume (Figure 1c). A relief valve is connected in parallel to the downstream side, allowing sampling of the effluents for chemistry analysis under constant pore pressure.
Here, all experiments were conducted at constant effective pressure (Pc = 10 MPa and Pp = 1 MPa). Each experiment included three stages: (1) initially, continuous flow-through tests after pressurization at room temperature, (2) temperature cycles between room temperature and up to 70 or 90 °C, and (3) long-term permeability measurements with the intermittent flow at 70 or 90 °C. In two flow-through experiments (SM1 and SM2), DI was used as fluid medium, and in one test (SM3), a 0.5 M NaCl solution was used to investigate the effect of fluid type on fracture permeability evolution. The salinity was chosen since fluid inclusions within the slates contain mainly water with low salinity NaCl. Note, however, that in some cases, fluid inclusions also contain CaCl2. Details about applied temperatures, flow rates, duration of each stage, experimental conditions, and permeating fluid types for the three samples are listed in Table 2. The intention to divide each experiment into three different stages was the following:
(1)
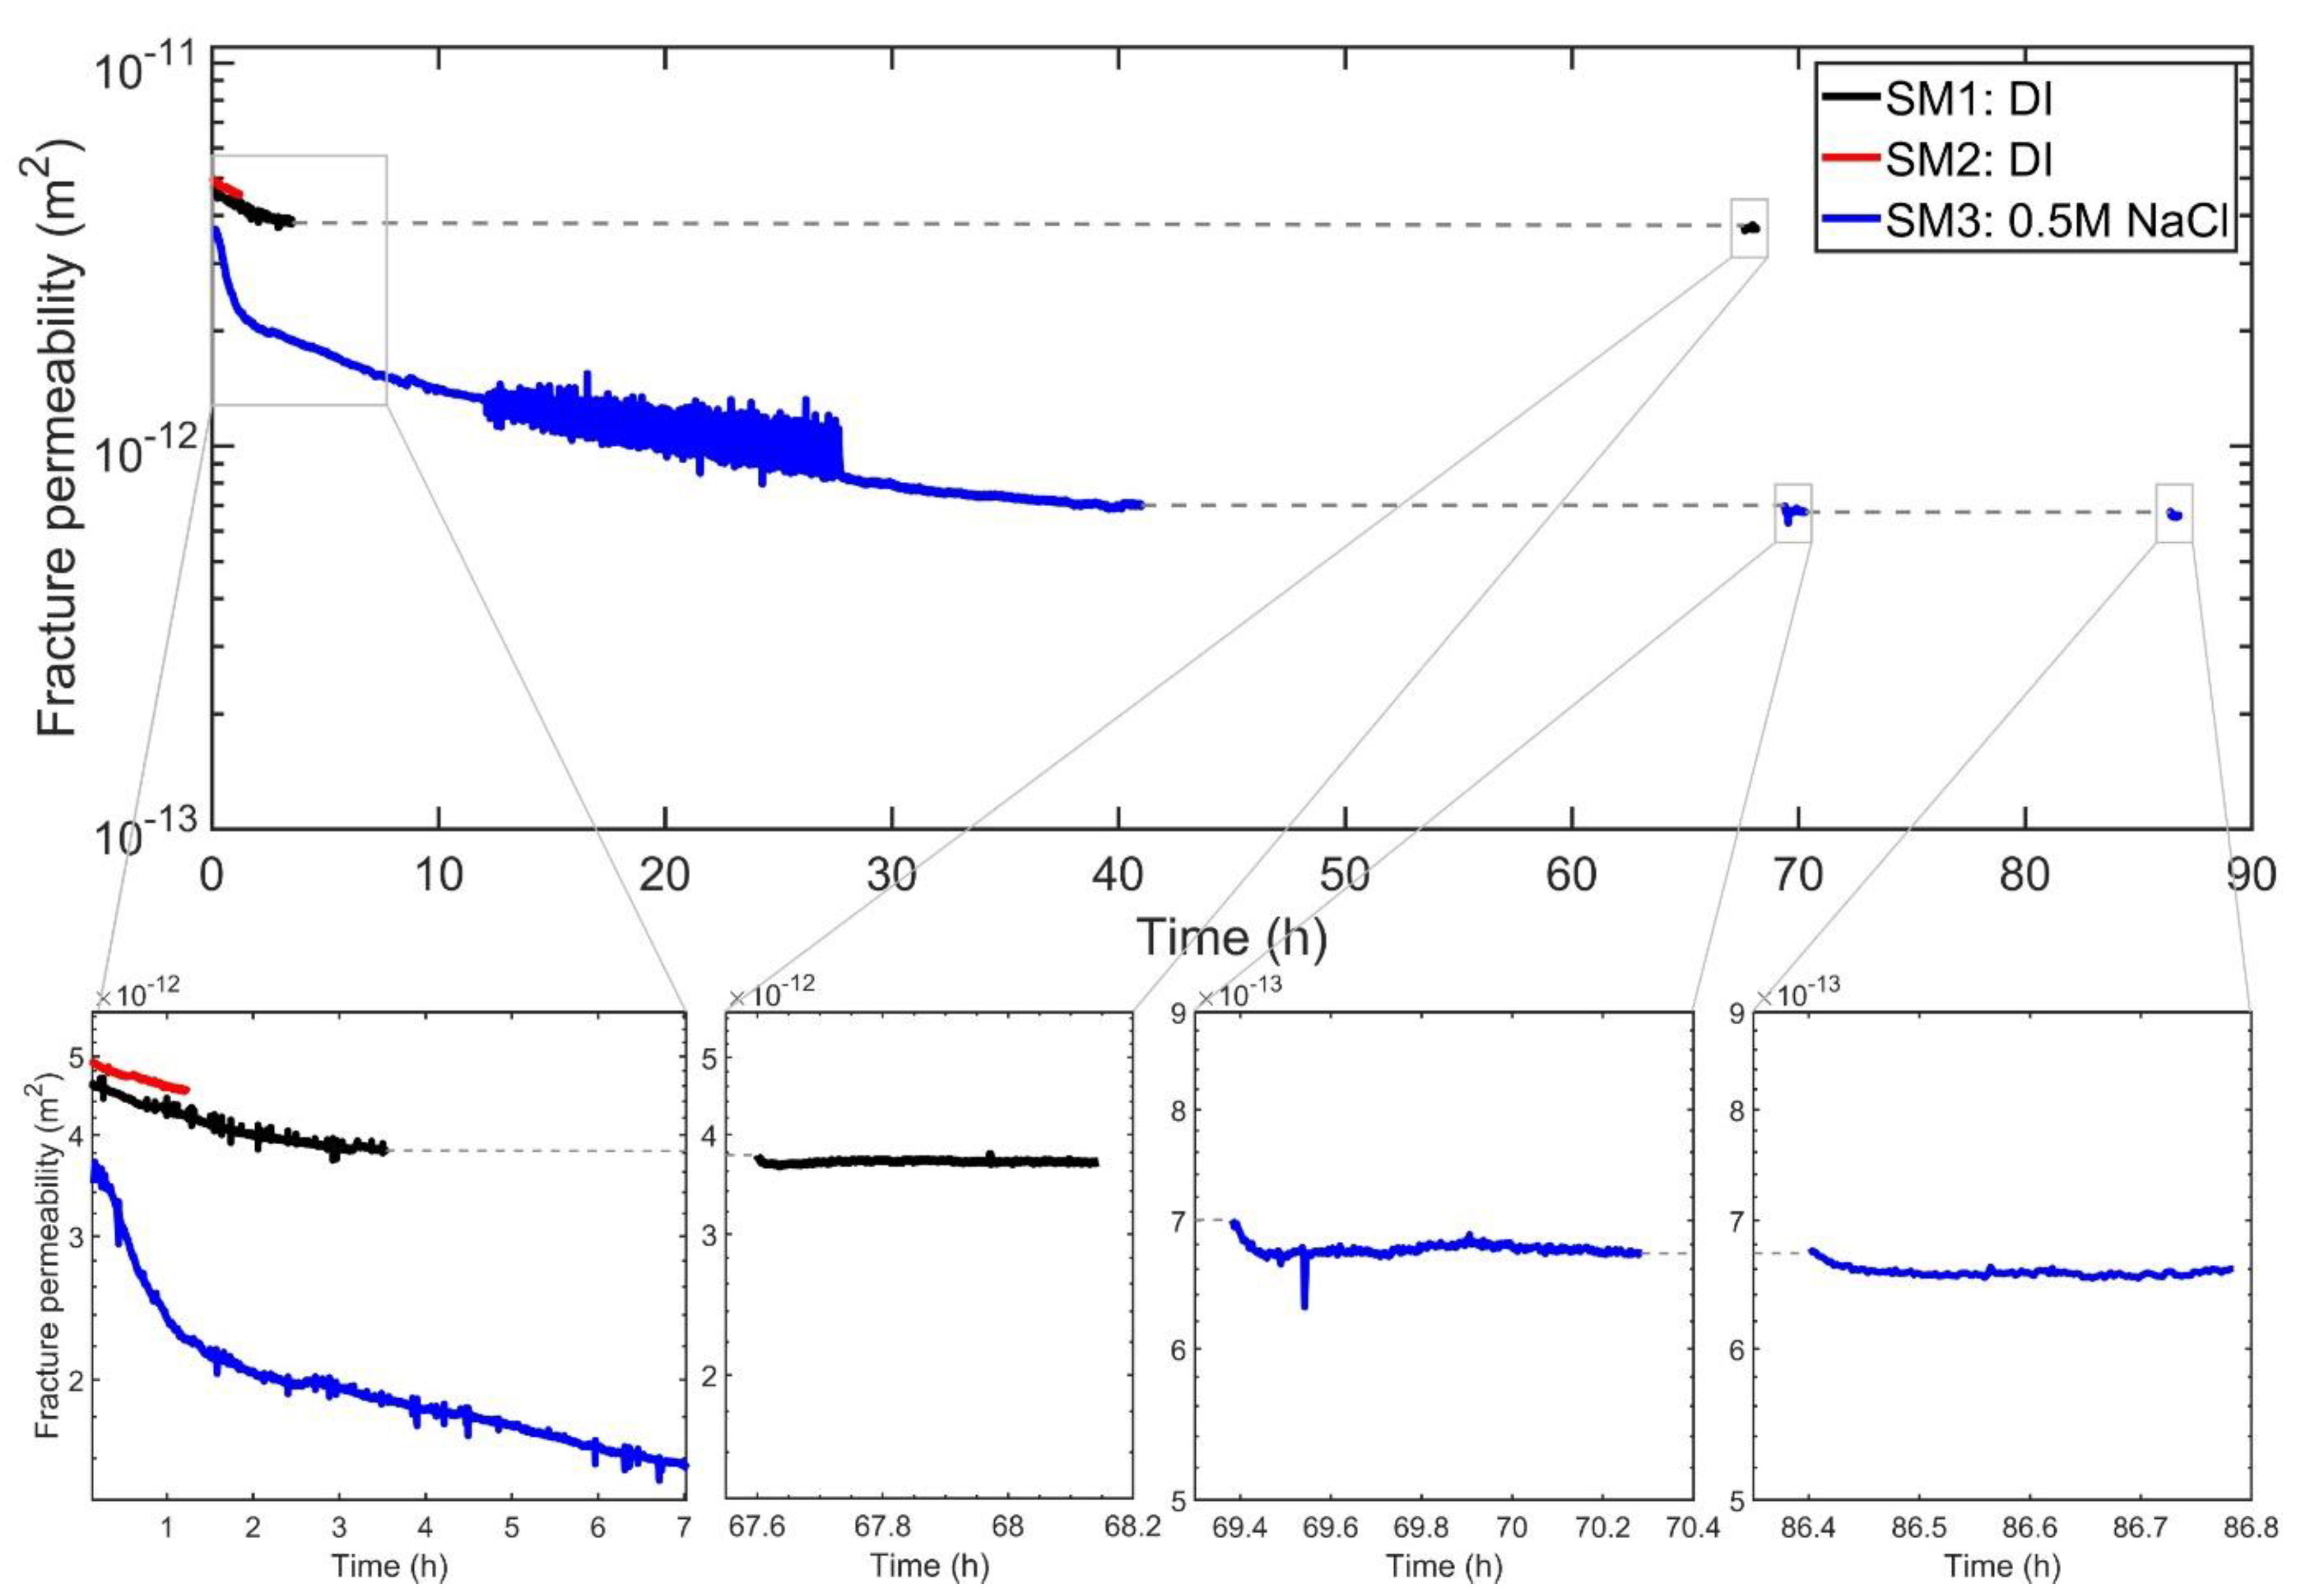
The purpose of stage one was to investigate the potential transient fracture permeability degradation after pressure build-up, which exerts a force on the fracture surfaces. Such initial fracture permeability decline was widely observed at the first dozens to hundreds of hours of continuous fluid flow through fractured granitic rocks [4,21], shale [22], novaculite [15,17], limestone [16], and dolomitic anhydrite [18]. However, this time-dependent fracture permeability decay did not occur in some fractured sandstones and mudstones [23,24] with the intermittent flow (flow-stop-flow with a certain time interval). To monitor the influence of pressure on fracture permeability evolution in slates, we continuously measured permeability for several to dozens of hours, followed by stopping the flow for dozens of hours and measured fracture permeability again. This initial stage was performed at room temperature immediately after pressurization.
(2)
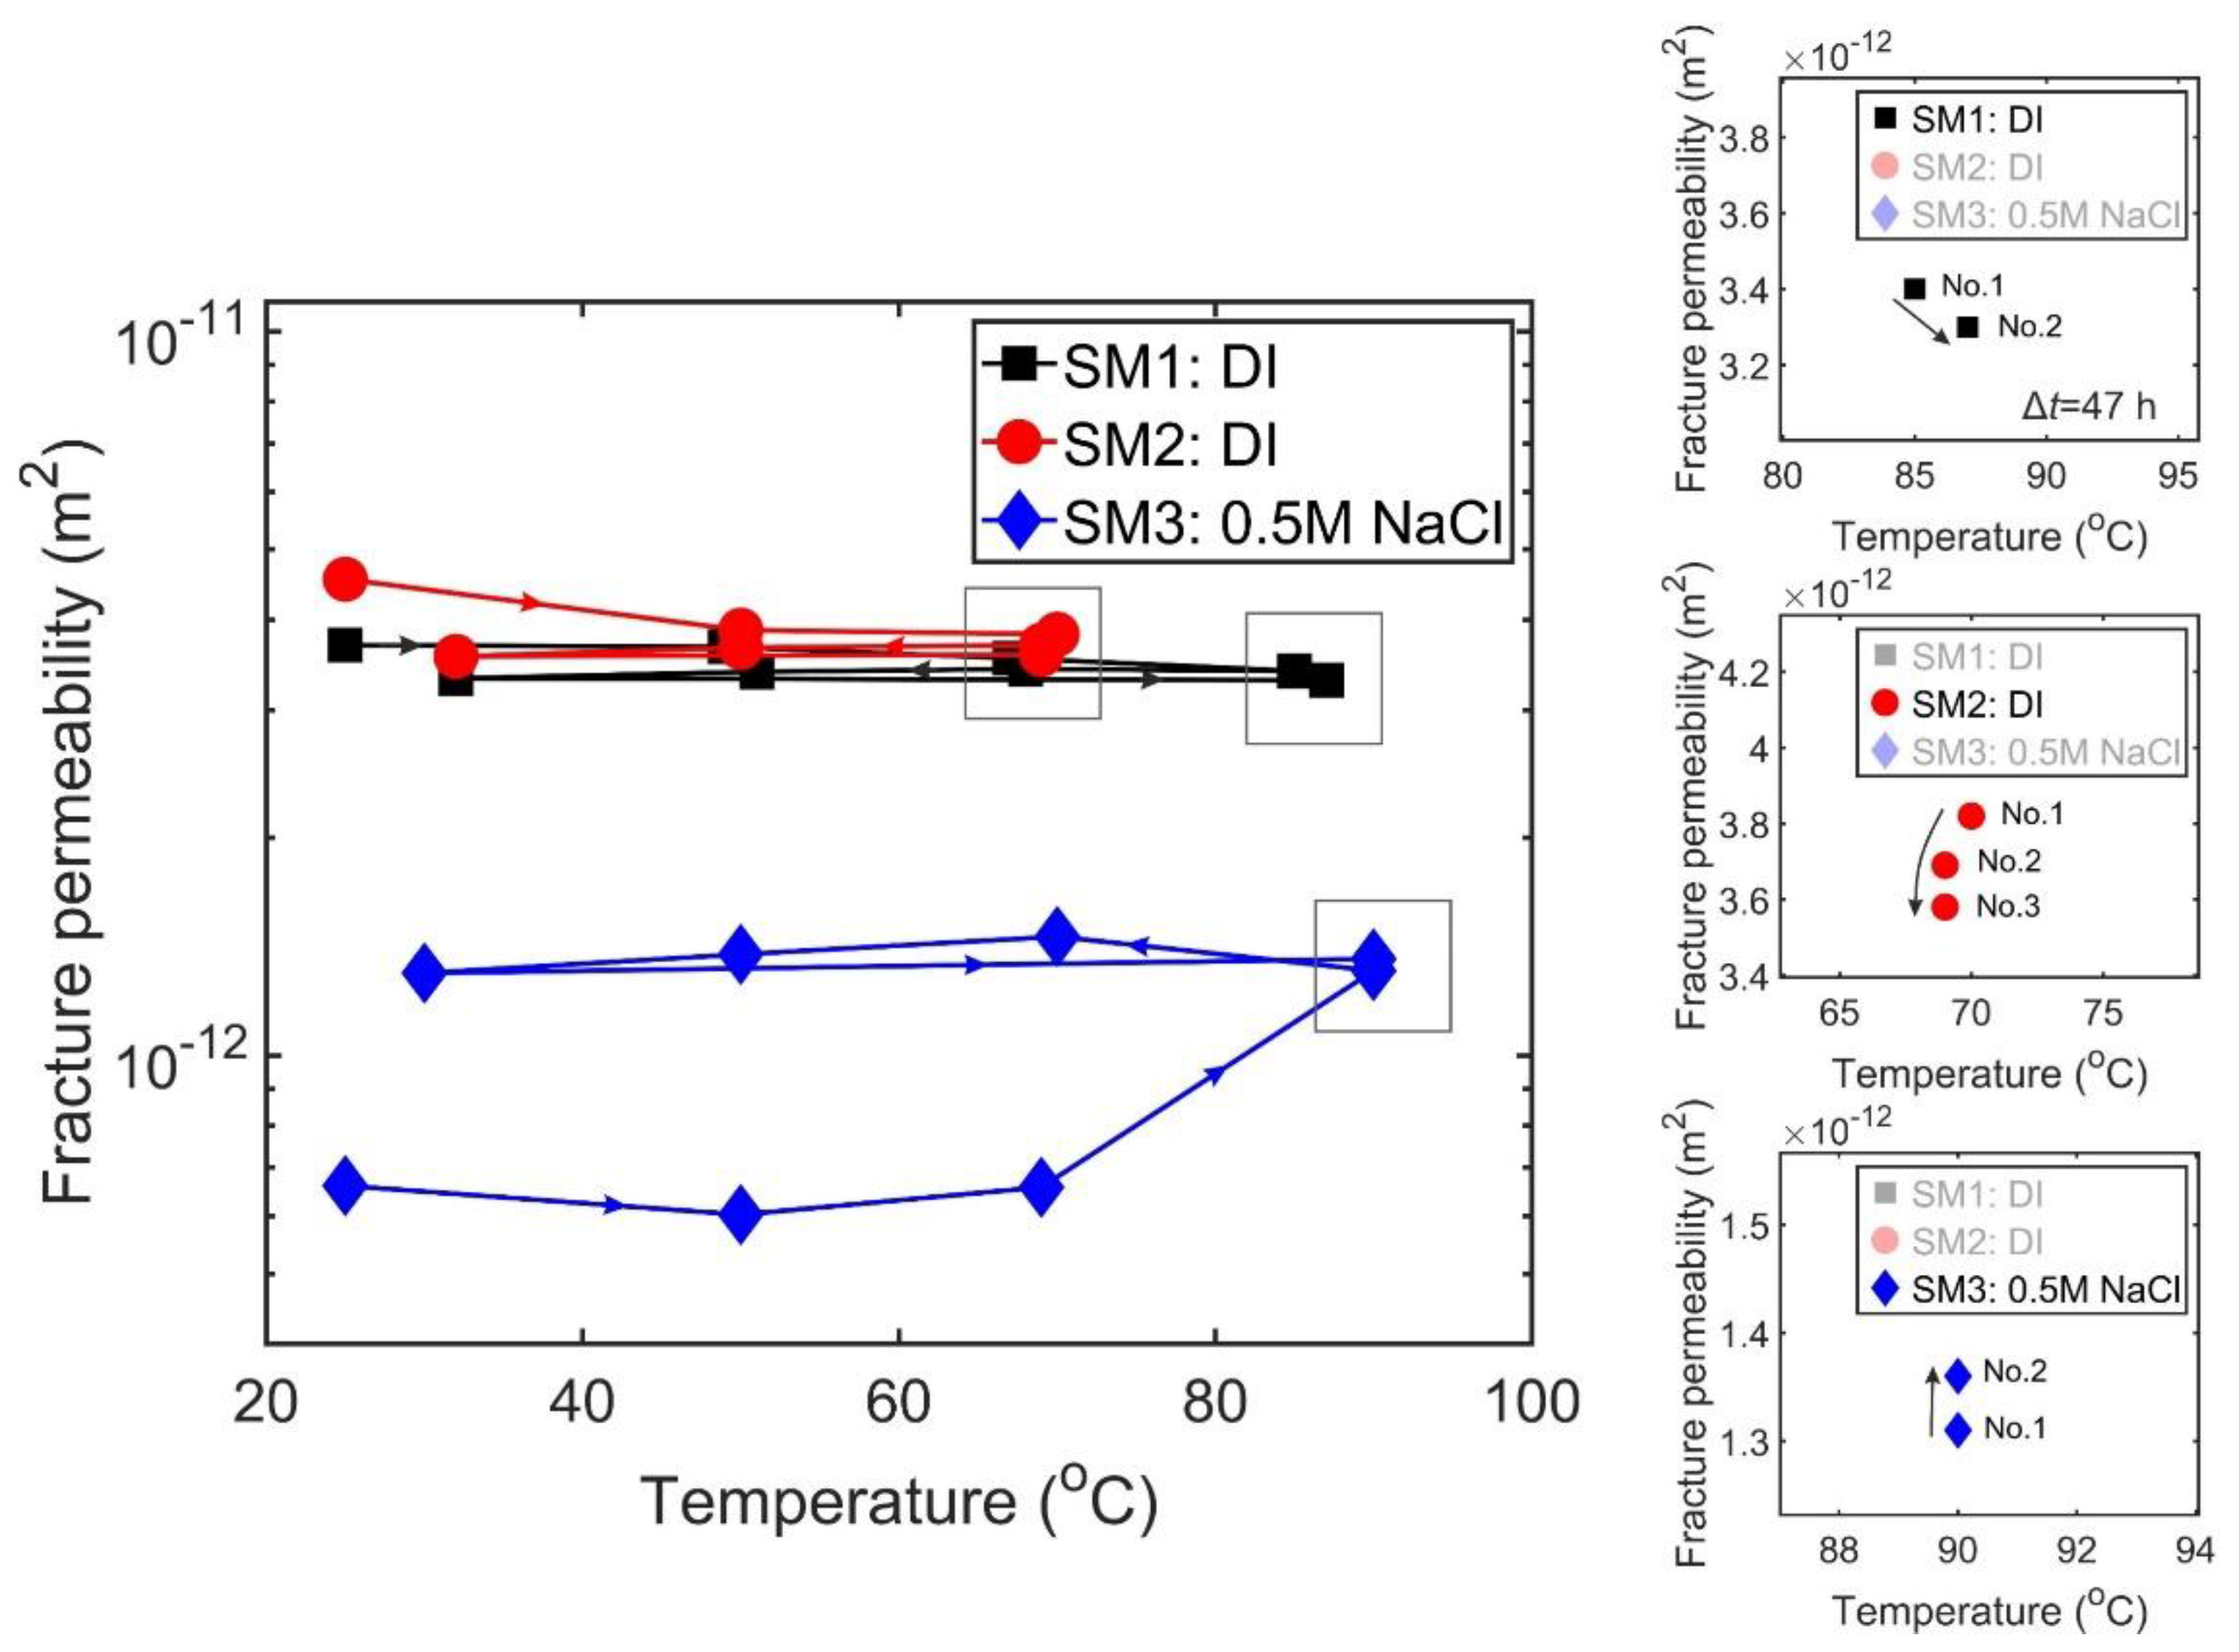
The second stage was to reveal thermal effects on fracture permeability evolution and to eliminate any irreversible fracture permeability changes upon thermal expansion of the rock matrix. The temperature was increased and decreased stepwise between room temperature and 70 °C for sample SM2 and between 25 °C and 90 °C for sample SM1 and SM3 (Table 2). Fracture permeability was measured after stabilization of temperature in each step.
(3)
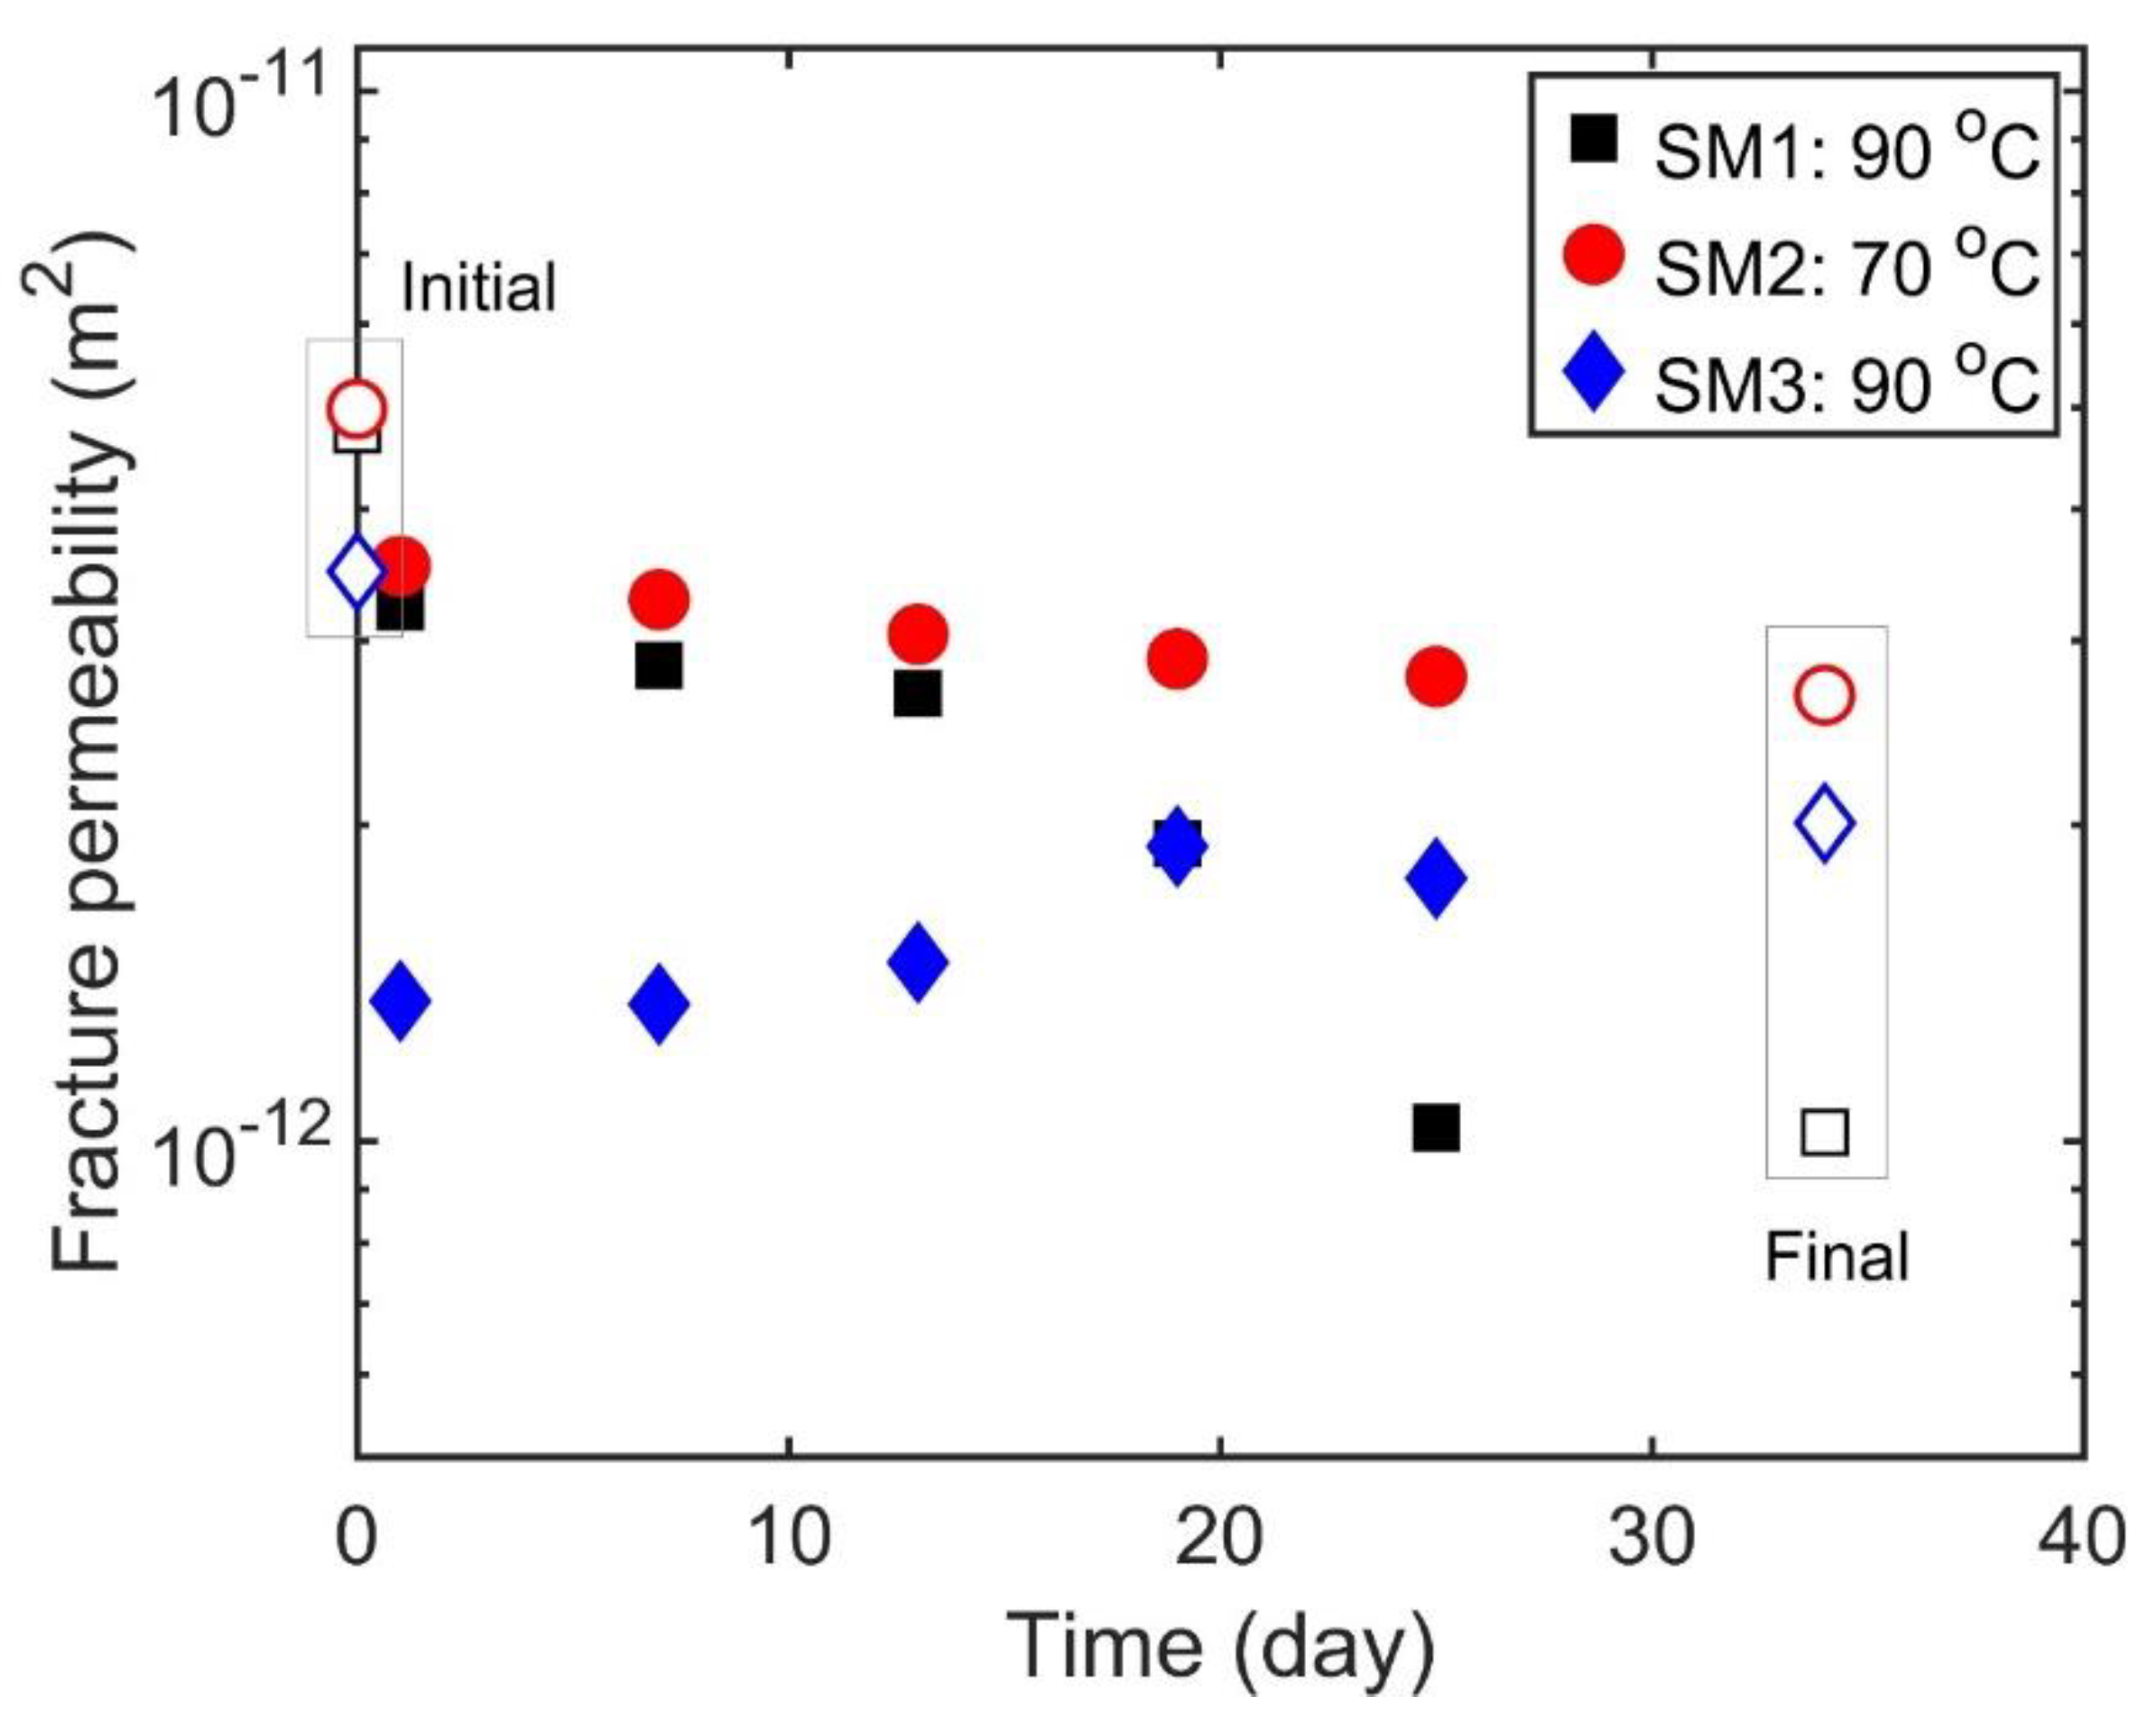
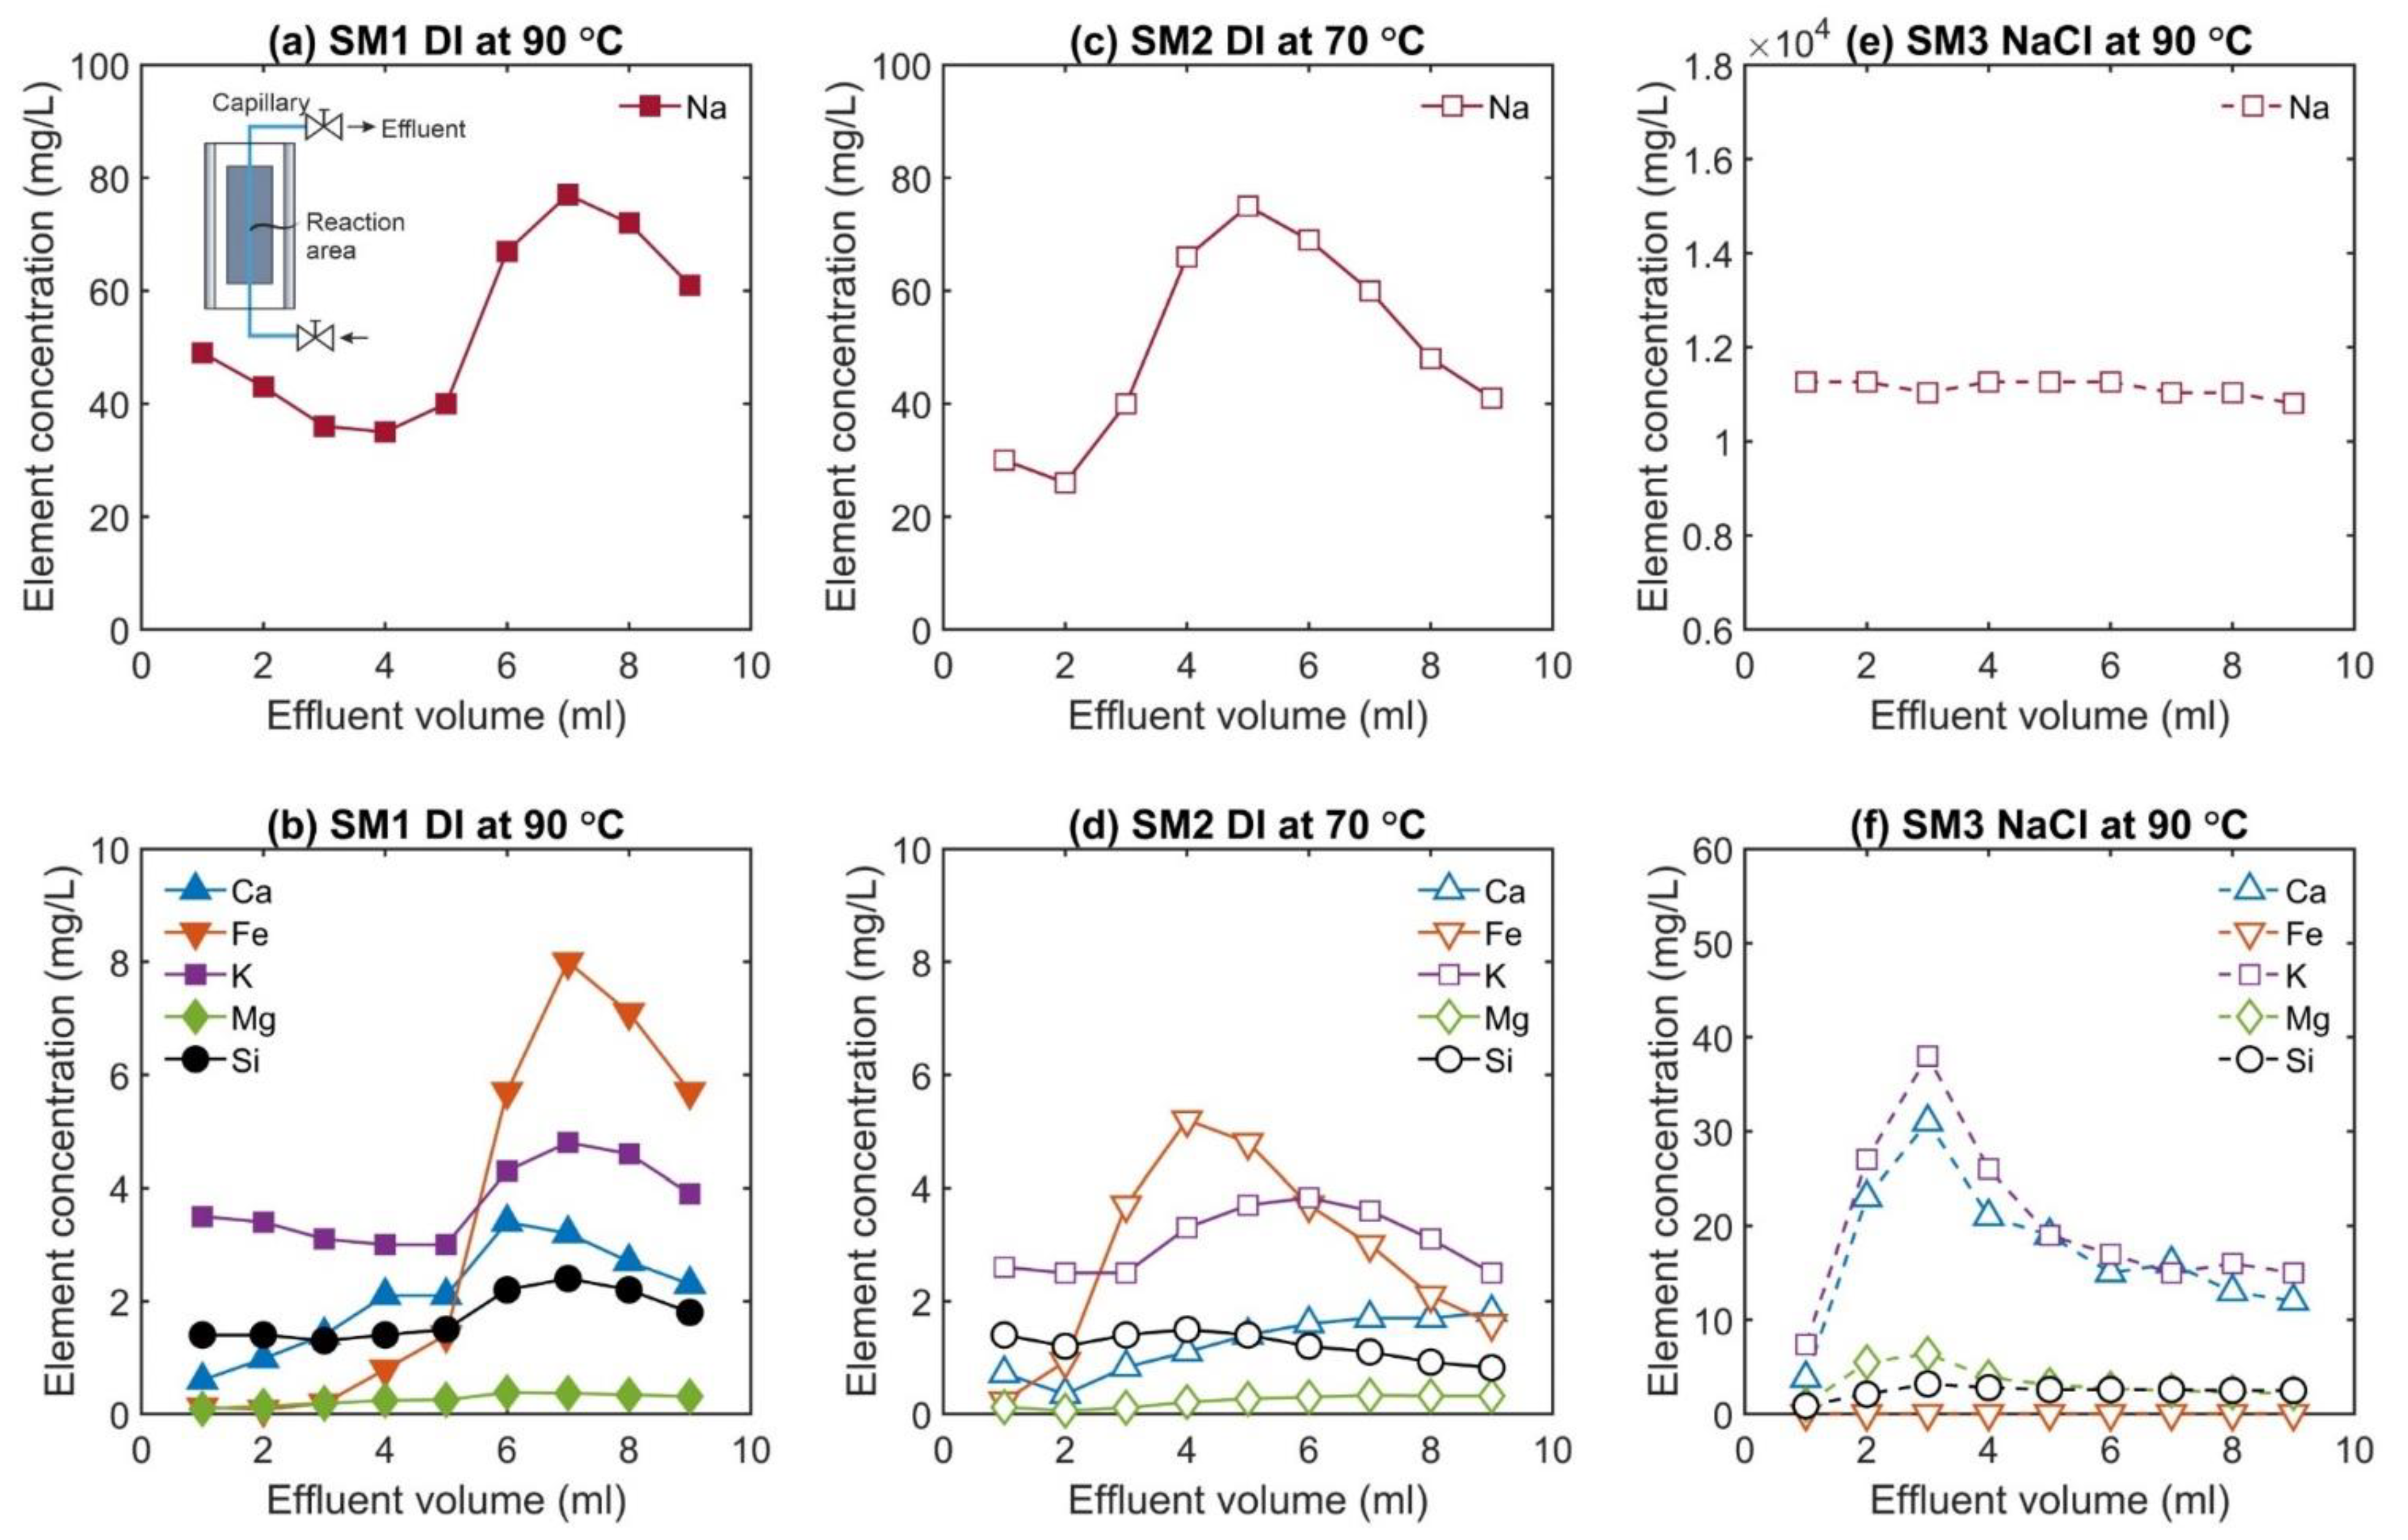
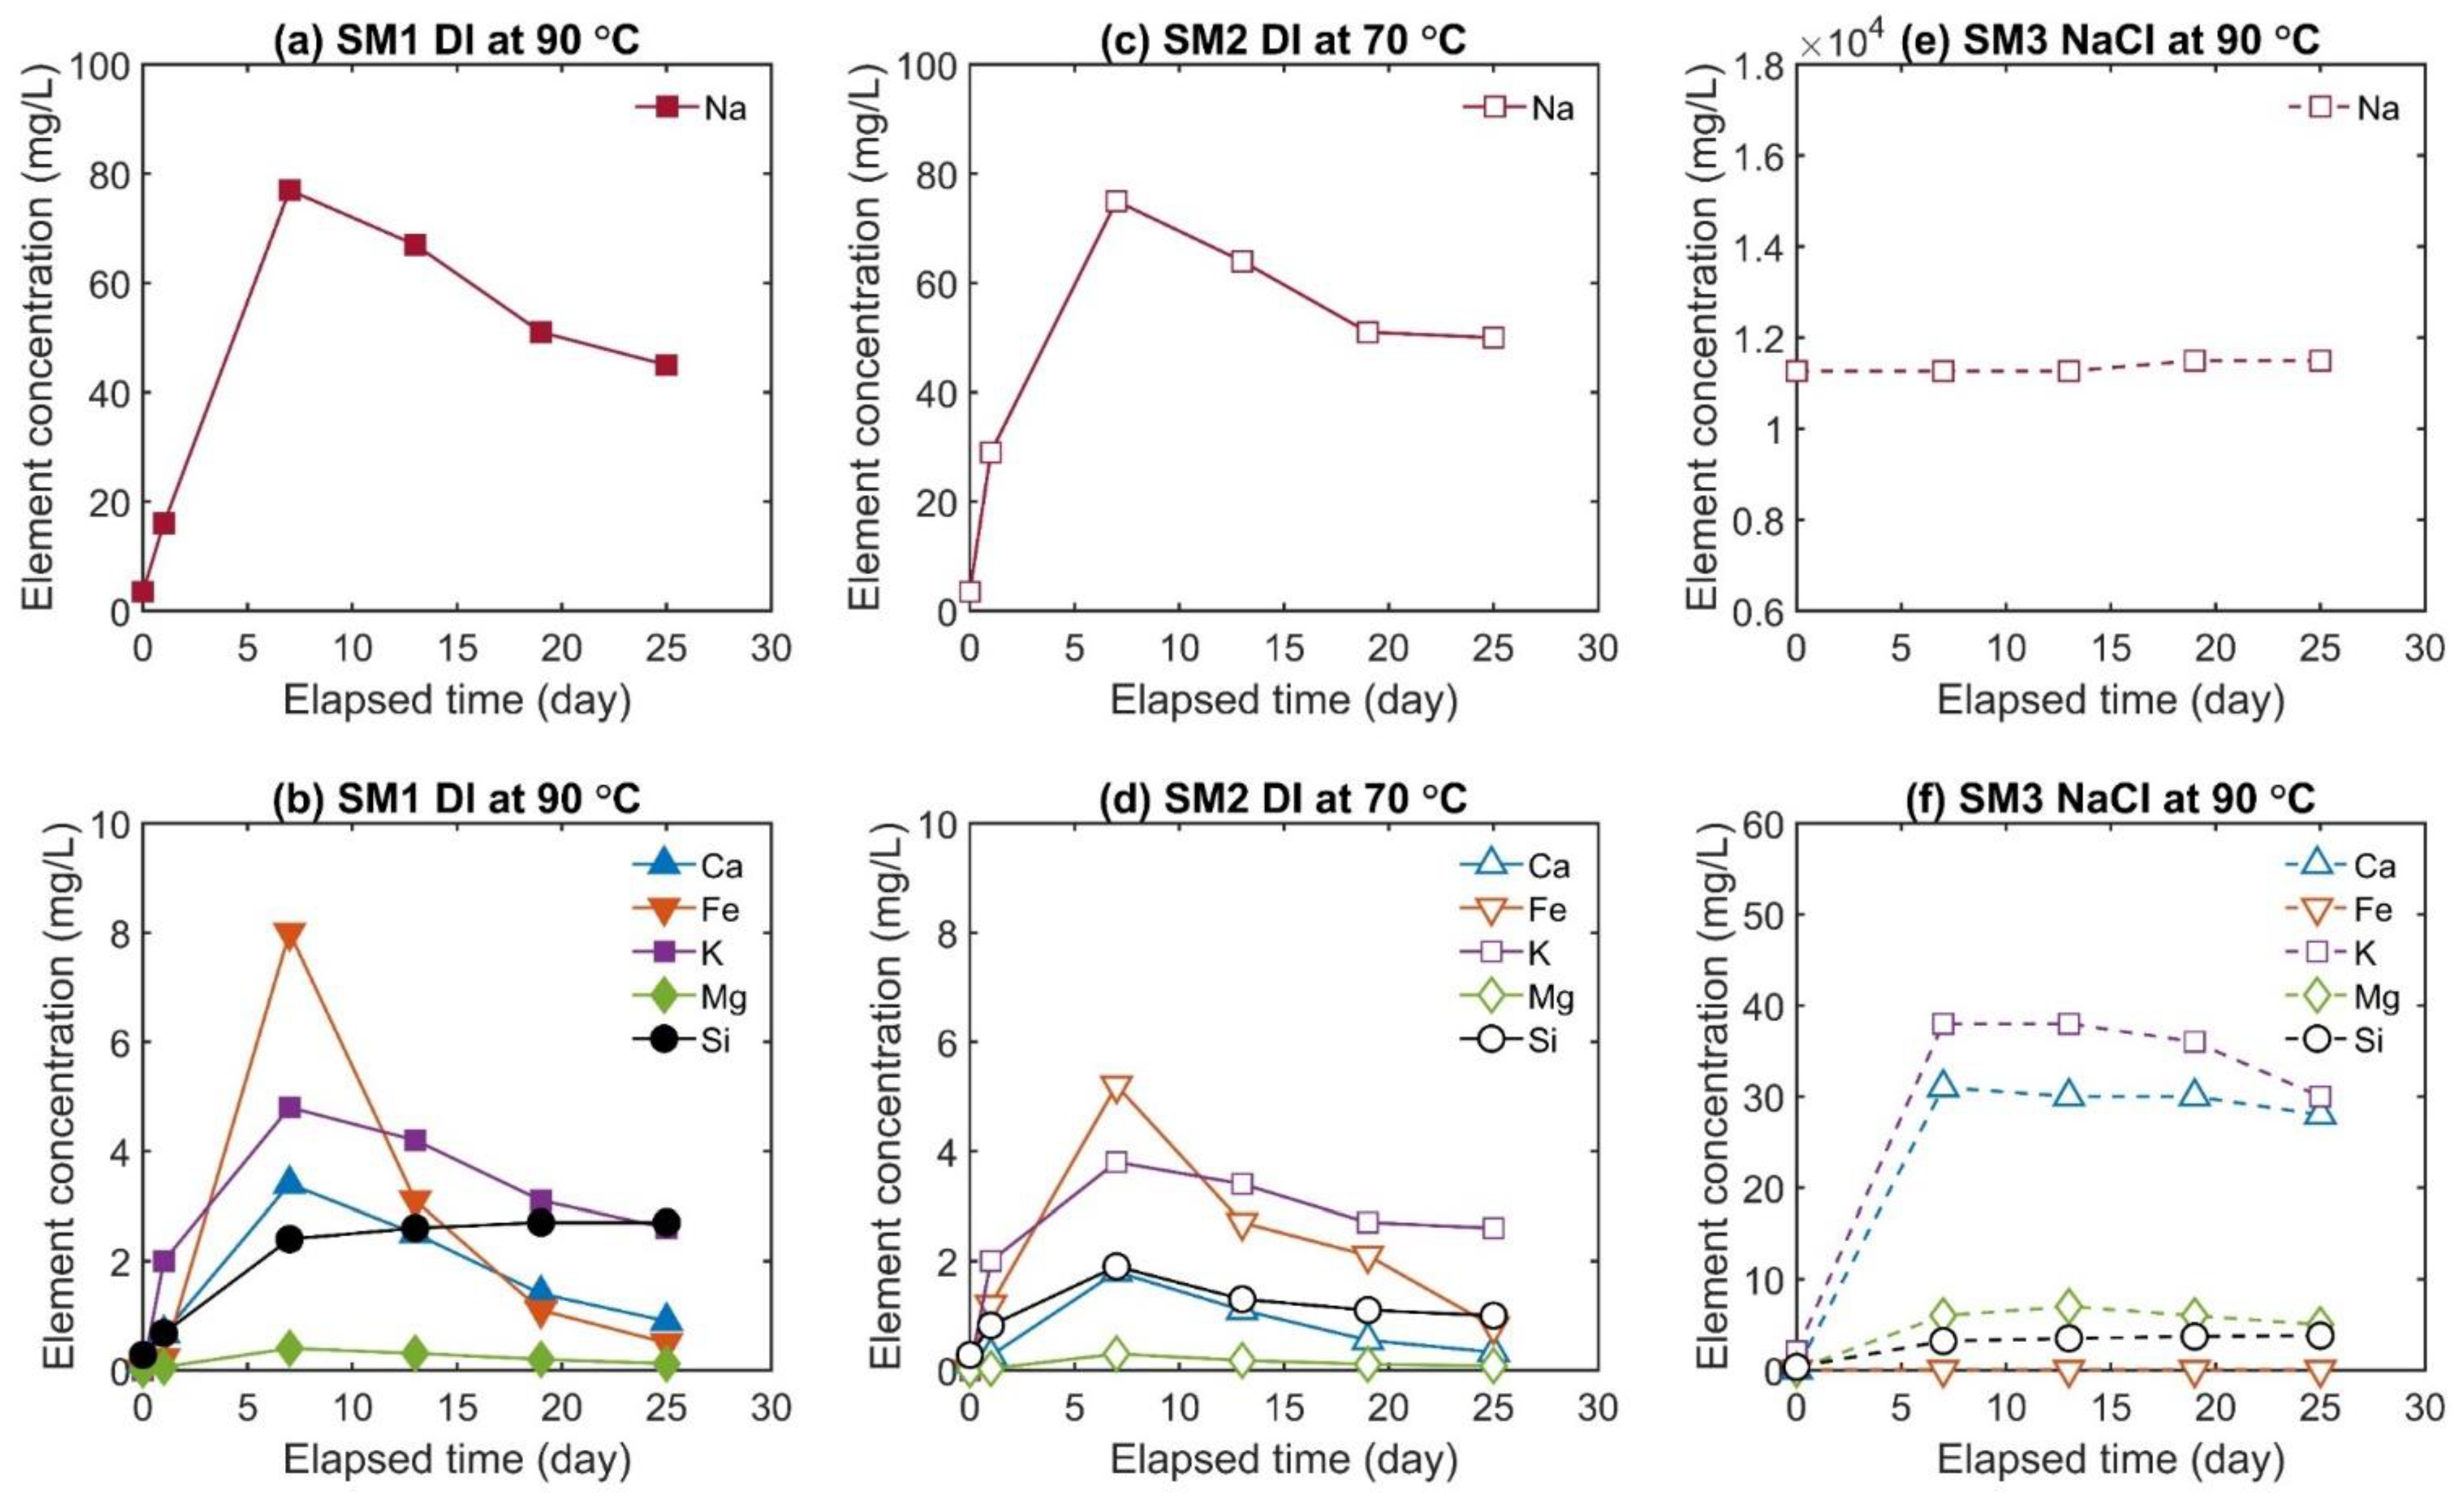
In the last stage, the temperature was kept at the highest value (70 or 90 °C), and permeability was measured regularly after a time interval of 6 days. In between the time intervals, the valve of the upstream pump was closed, and the downstream pump maintained constant pressure so that the pore fluid could be considered as a semi-closed system. Before each permeability measurement, the effluent was sampled through the relief valve at a constant flow rate of Q = 0.1 mL/min. Each time, seven to nine subsamples with a volume of V = 1.0 mL at constant pore fluid pressure of Pp = 1 MPa were collected (downstream side). Each sample was acidified by addition of 0.01 ml super-pure HNO3 to minimize any potential precipitation or alteration of the fluid. The purpose of the chosen sampling strategy with collecting small-volume subsamples (V = 1.0 mL) was to better specify the fluid composition within the fracture. Otherwise, a large volume of effluent would have mixed the fluid within the fracture with the fluid in the capillaries connected to the sample.
The experiments target the evaluation of a medium enthalpy EGS system with a reservoir or (fluid) production temperature of about 150 °C. After the heat exchanger, the fluid, typically, has a temperature of approximately 70 °C (lower bound experimental temperature), which increases to around 90 °C (upper bound experimental temperature) before being reinjected into the formation. Due to technical constraints, the temperature of the sample and the one of the fluid, when being injected into the sample, are identical (Figure 1c). The experiments thus replicate a reservoir scenario, where, when starting from the well-to-formation interface, rock and fluid are in thermal equilibrium. As fluid is continuously injected and transported further into the reservoir, the volume where rock and fluid are in thermal equilibrium expands. This study thus investigates processes that may alter fracture permeability in the vicinity of an injection well, where the formation is at fluid injection temperature.
During fluid flow (i.e., fracture permeability measurements and effluent sampling), the differential pressure between the sample ends was limited to Δp ≤ 0.5 MPa (i.e., the maximum upstream pore fluid pressure is below 1.5 MPa) to ensure to not exceed the measurable range of the differential pressure transducer and to avoid changing effective stress beyond critical values.
Sample permeability k is calculated based on Darcy’s law assuming steady-state conditions as
Q = k Δ p A μ L
where Q is the flow rate, L is the sample length, A = πr2 is the cross-sectional area of the cylindrical sample, Δp is the differential pressure over the sample length L, and µ is the dynamic fluid viscosity, which depends on the fluid type, salinity, temperature, and pore pressure [50,51] and was adjusted according to tabulated values in the cited literature when calculating permeability. By ignoring fluid flow in the rock matrix because of the low matrix permeability (k ~10−19 m2), the “cubic law”, assuming laminar flow through a fracture between parallel plates, gives the expression of the separation distance, bh, between the two smooth plates during flow-through tests as [52,53]
Q = b h 3 W Δ p 12 μ L
where W is the width of the fracture (sample diameter). bh can be considered an equivalent aperture (hydraulic aperture) in case of rough fractures. Using this approximation and assuming that all fluid flow through the fracture (A = Wbh), fracture permeability, kf, can be expressed by combining Equations (1) and (2) as
k f = b h 2 12

2.3. Analytical Methods

2.3.1. Effluent Element Concentrations

Effluent element concentrations of Al, Ca, Fe, K, Mg, Na, Si, and Zn were determined by Inductively Coupled Plasma-Optical Emission Spectrometry (ICP-OES) analyses performed at the ElMiE Lab at the German Centre for Geosciences (GFZ, Potsdam, Germany) using a 5110 spectrometer (Agilent, Santa Clara, CA, USA). The analytical precision and reproducibility are generally better than 2%, regularly tested using certified reference material and in-house standards. Effluent samples were diluted with HNO3.

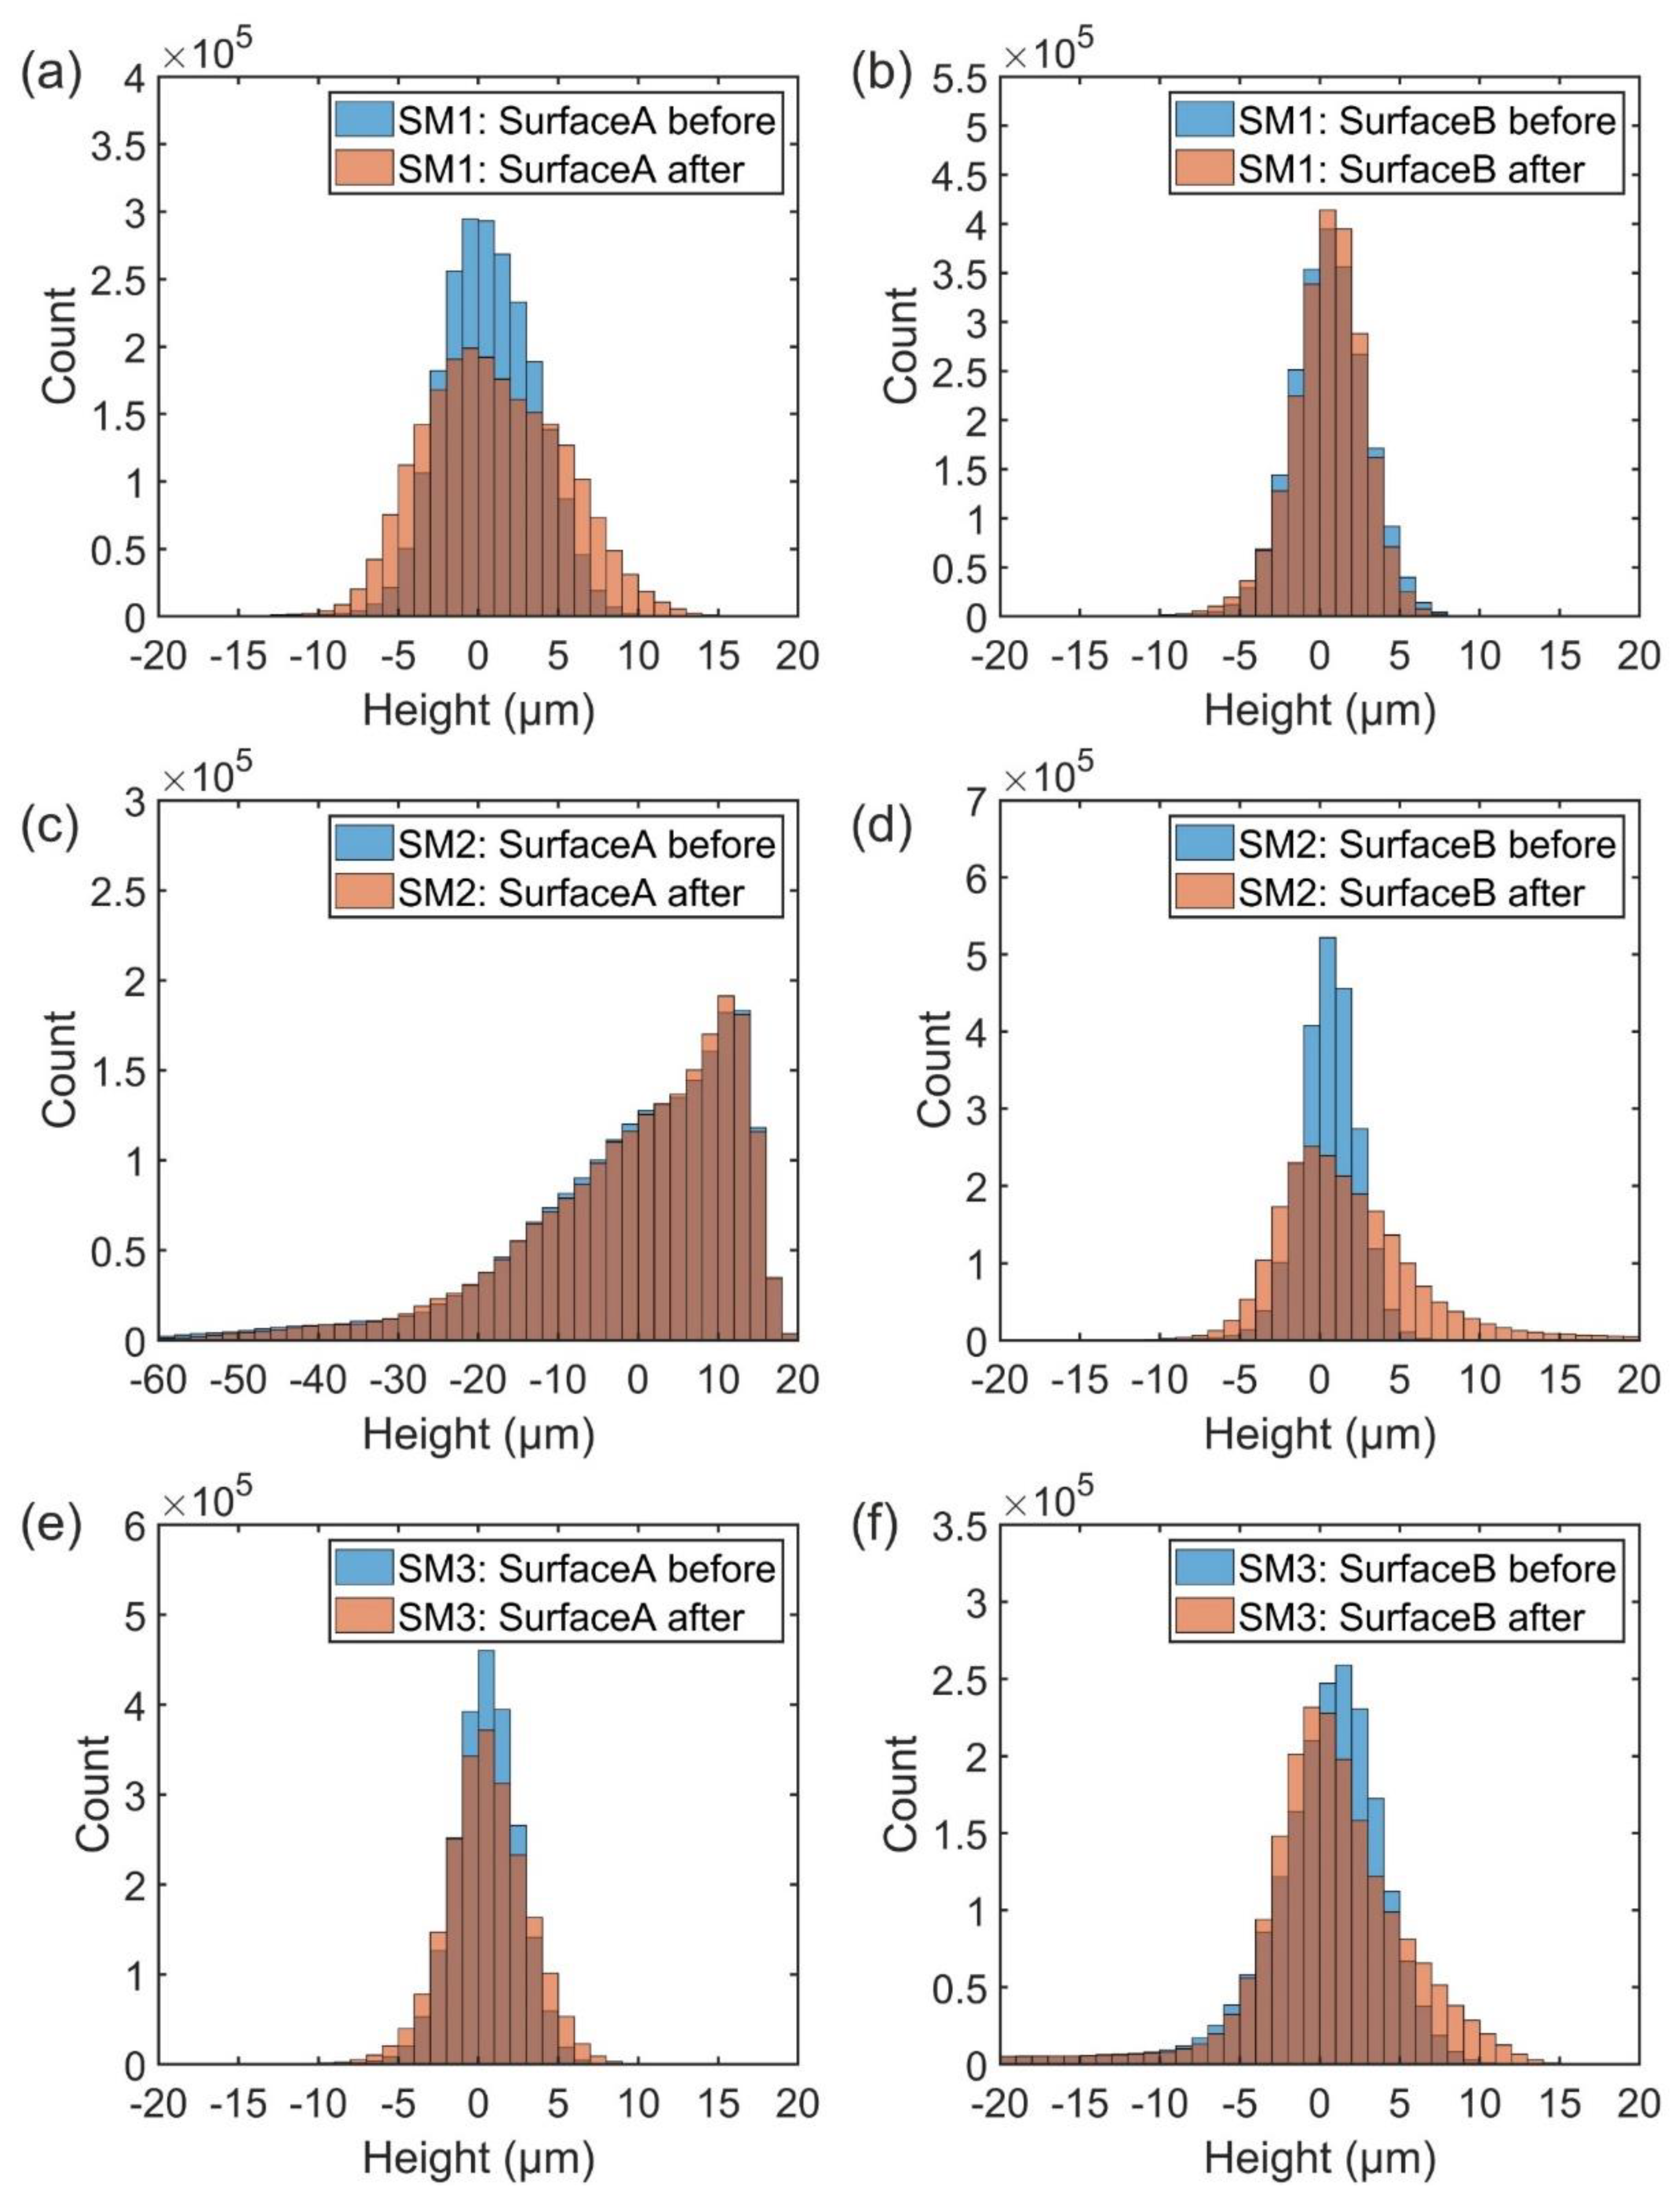
2.3.2. Fracture Surface Topographies
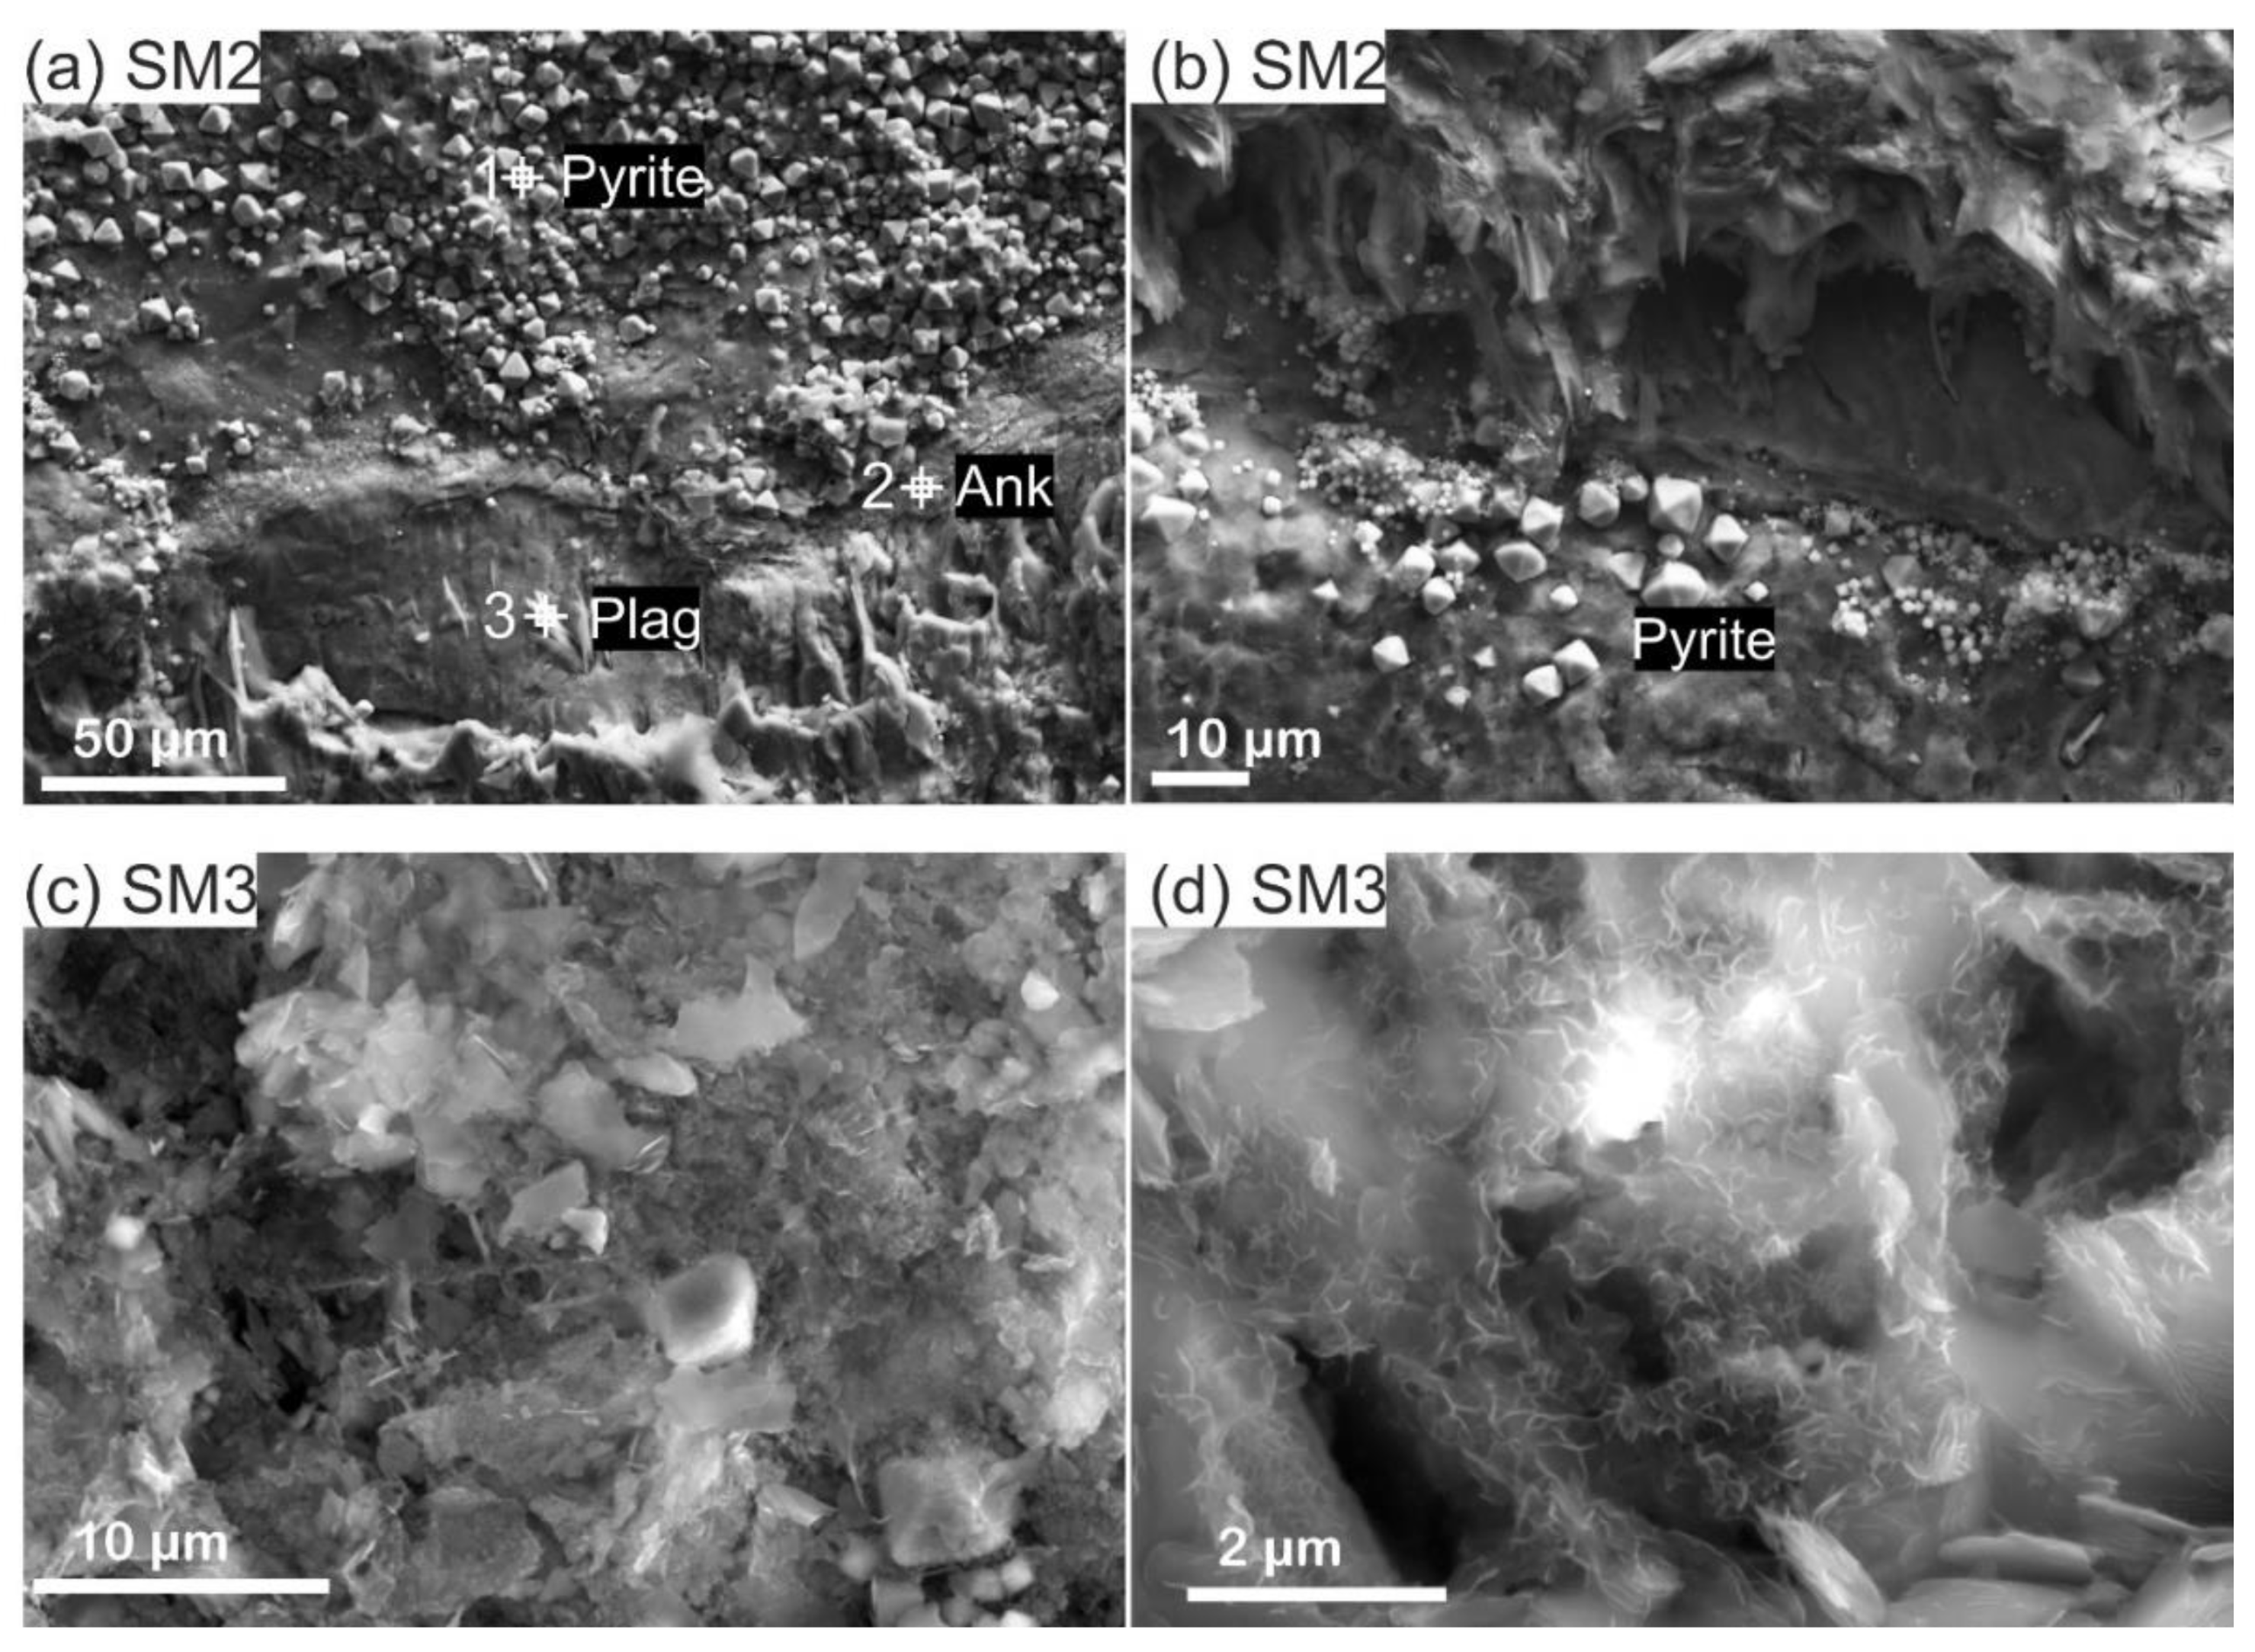
The fracture surface topographies were measured before and after the experiments using white light interferometry (Keyence VR 3000). The resolution of the in-plane coordinates was 23.5 µm, and the vertical resolution was 1.0 µm. Statistical parameters, the peak height difference Rp, the mean Rm, and the root-mean-square Rrms, of fracture surfaces were used to compare the changes of surface roughness, expressed as
R p = max | z i z a |
R m = 1 n i = 1 n | z i z a |
R rms = 1 n i = 1 n ( z i z a ) 2
where zi is the height of the ith point, and za is the mean height of the elevation plane, which is discretized by n points.

2.3.3. SEM-EDX

After the experiments were conducted, the fracture surfaces were coated with carbon and observed by performing scanning electron microscopy (SEM) using both the backscattered electron (BSE) and the secondary electron (SE) mode. Combined energy dispersive X-ray analysis (EDX) was performed to identify the elemental composition of representative locations.

3. Results

Fracture permeability (Equation (3)) evolution was explored upon continuous fluid flow after pressurization at ambient temperature, heating–cooling cycles, and intermittent flow over a long-time duration (Section 3.1). Effluent element concentrations were used to qualitatively analyze potential mineral reactions in rock fractures (Section 3.2). We compared fracture surface topographies before and after the experiments (Section 3.3) and explored the mechanisms governing fracture permeability evolution using microstructural observations (Section 3.4).

3.1. Variations of Fracture Permeability

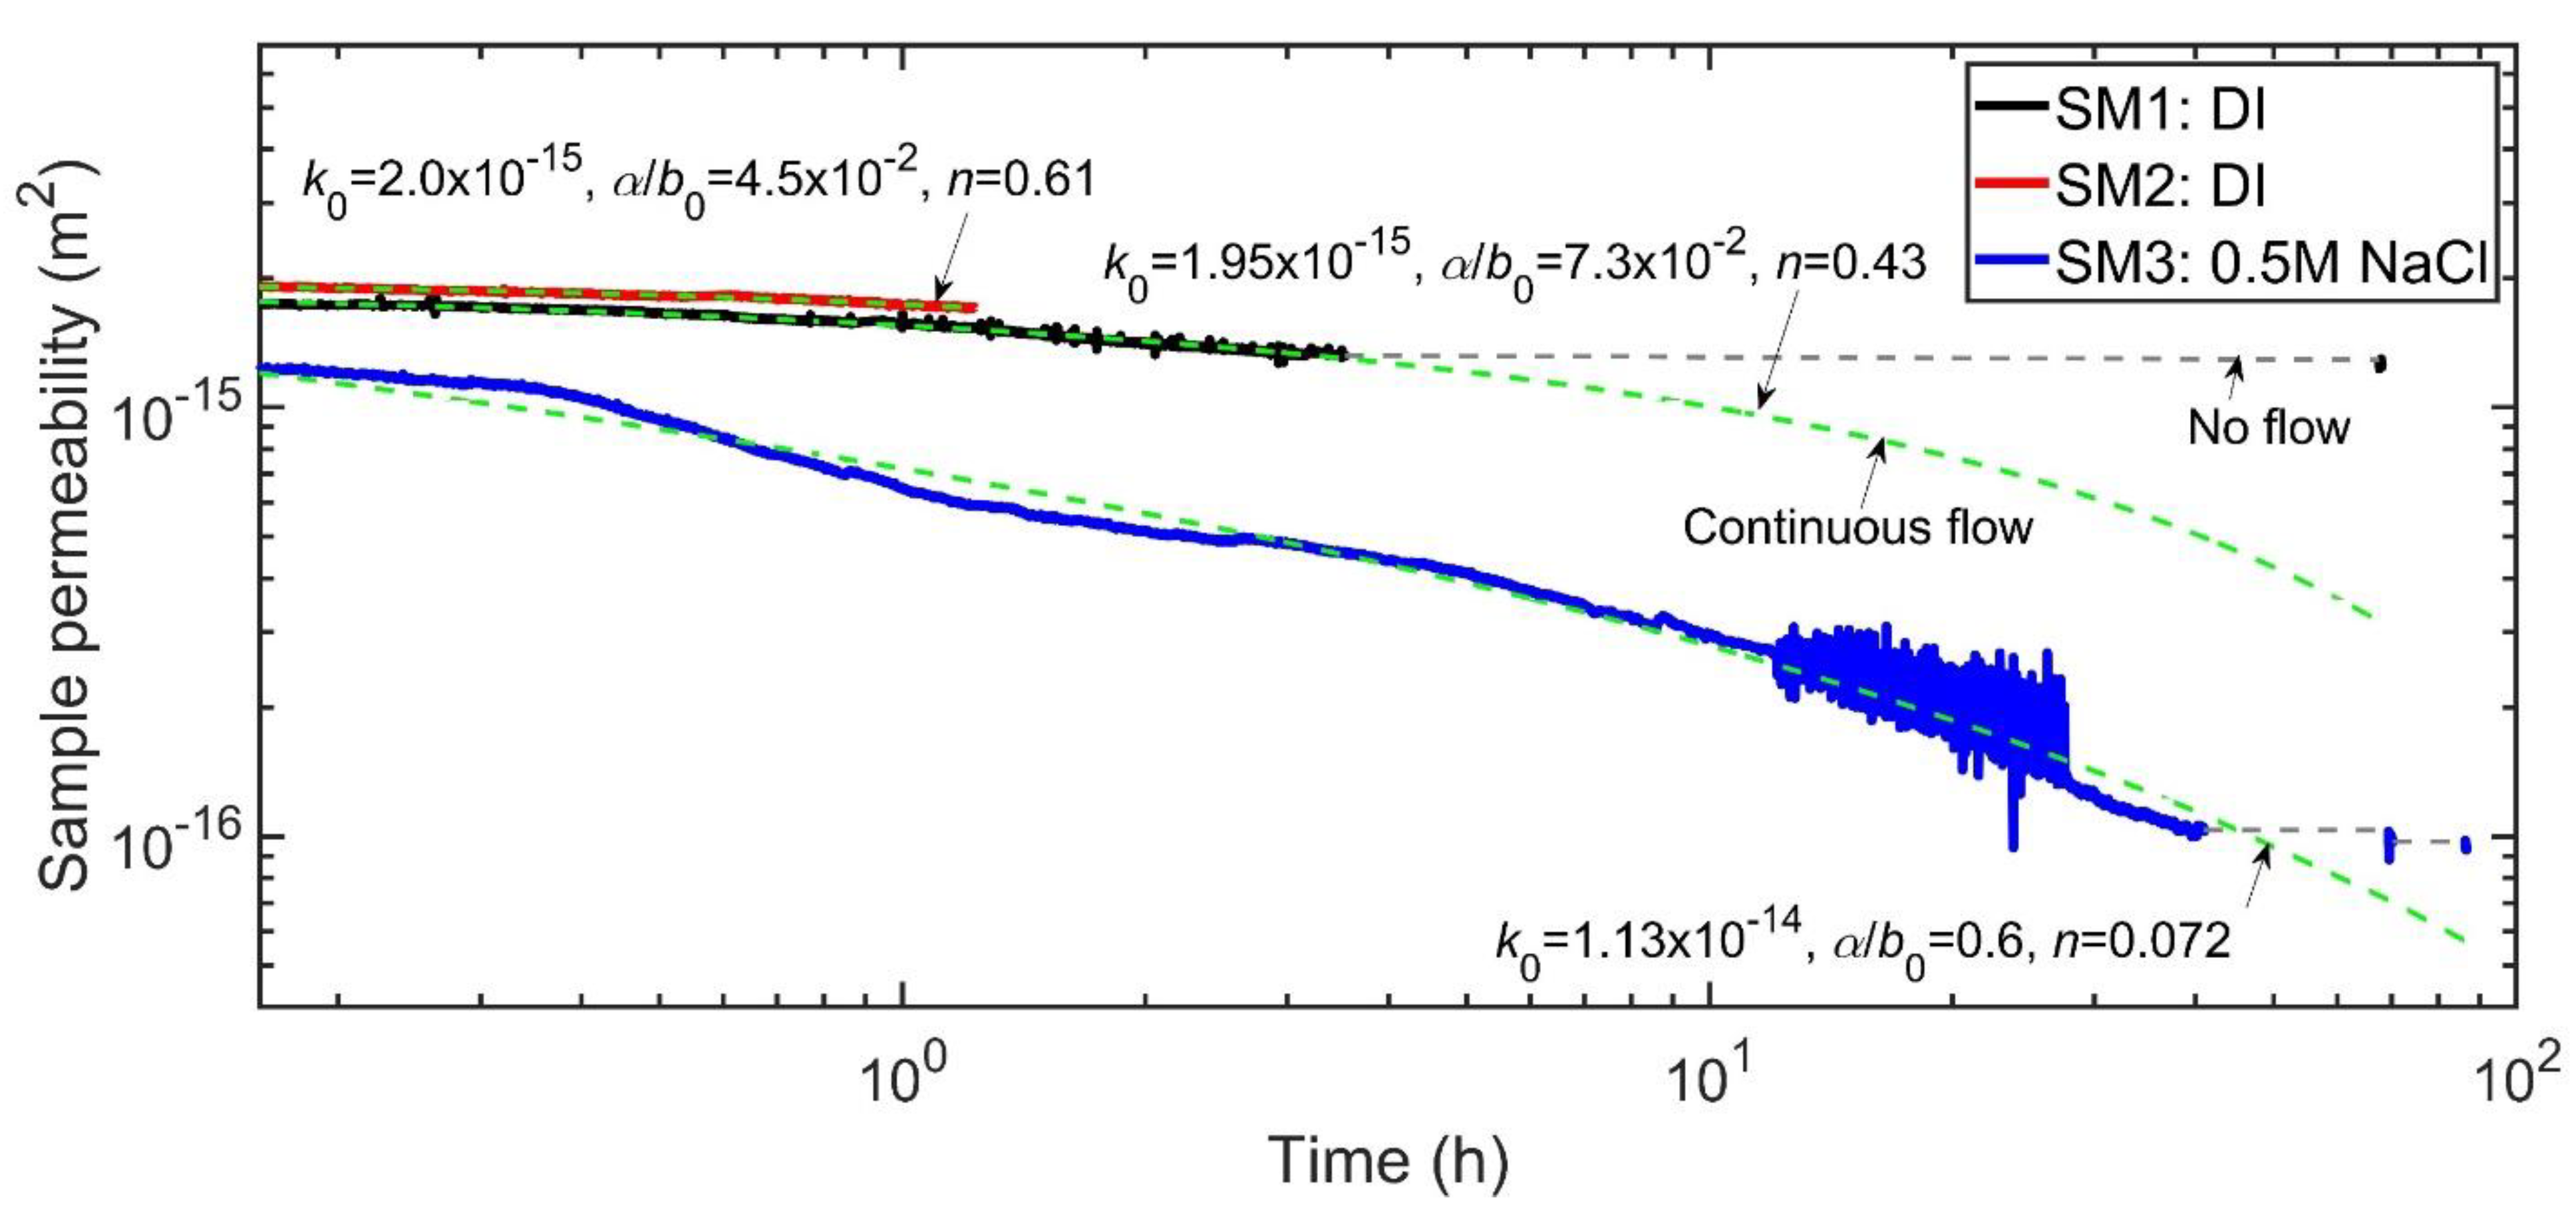
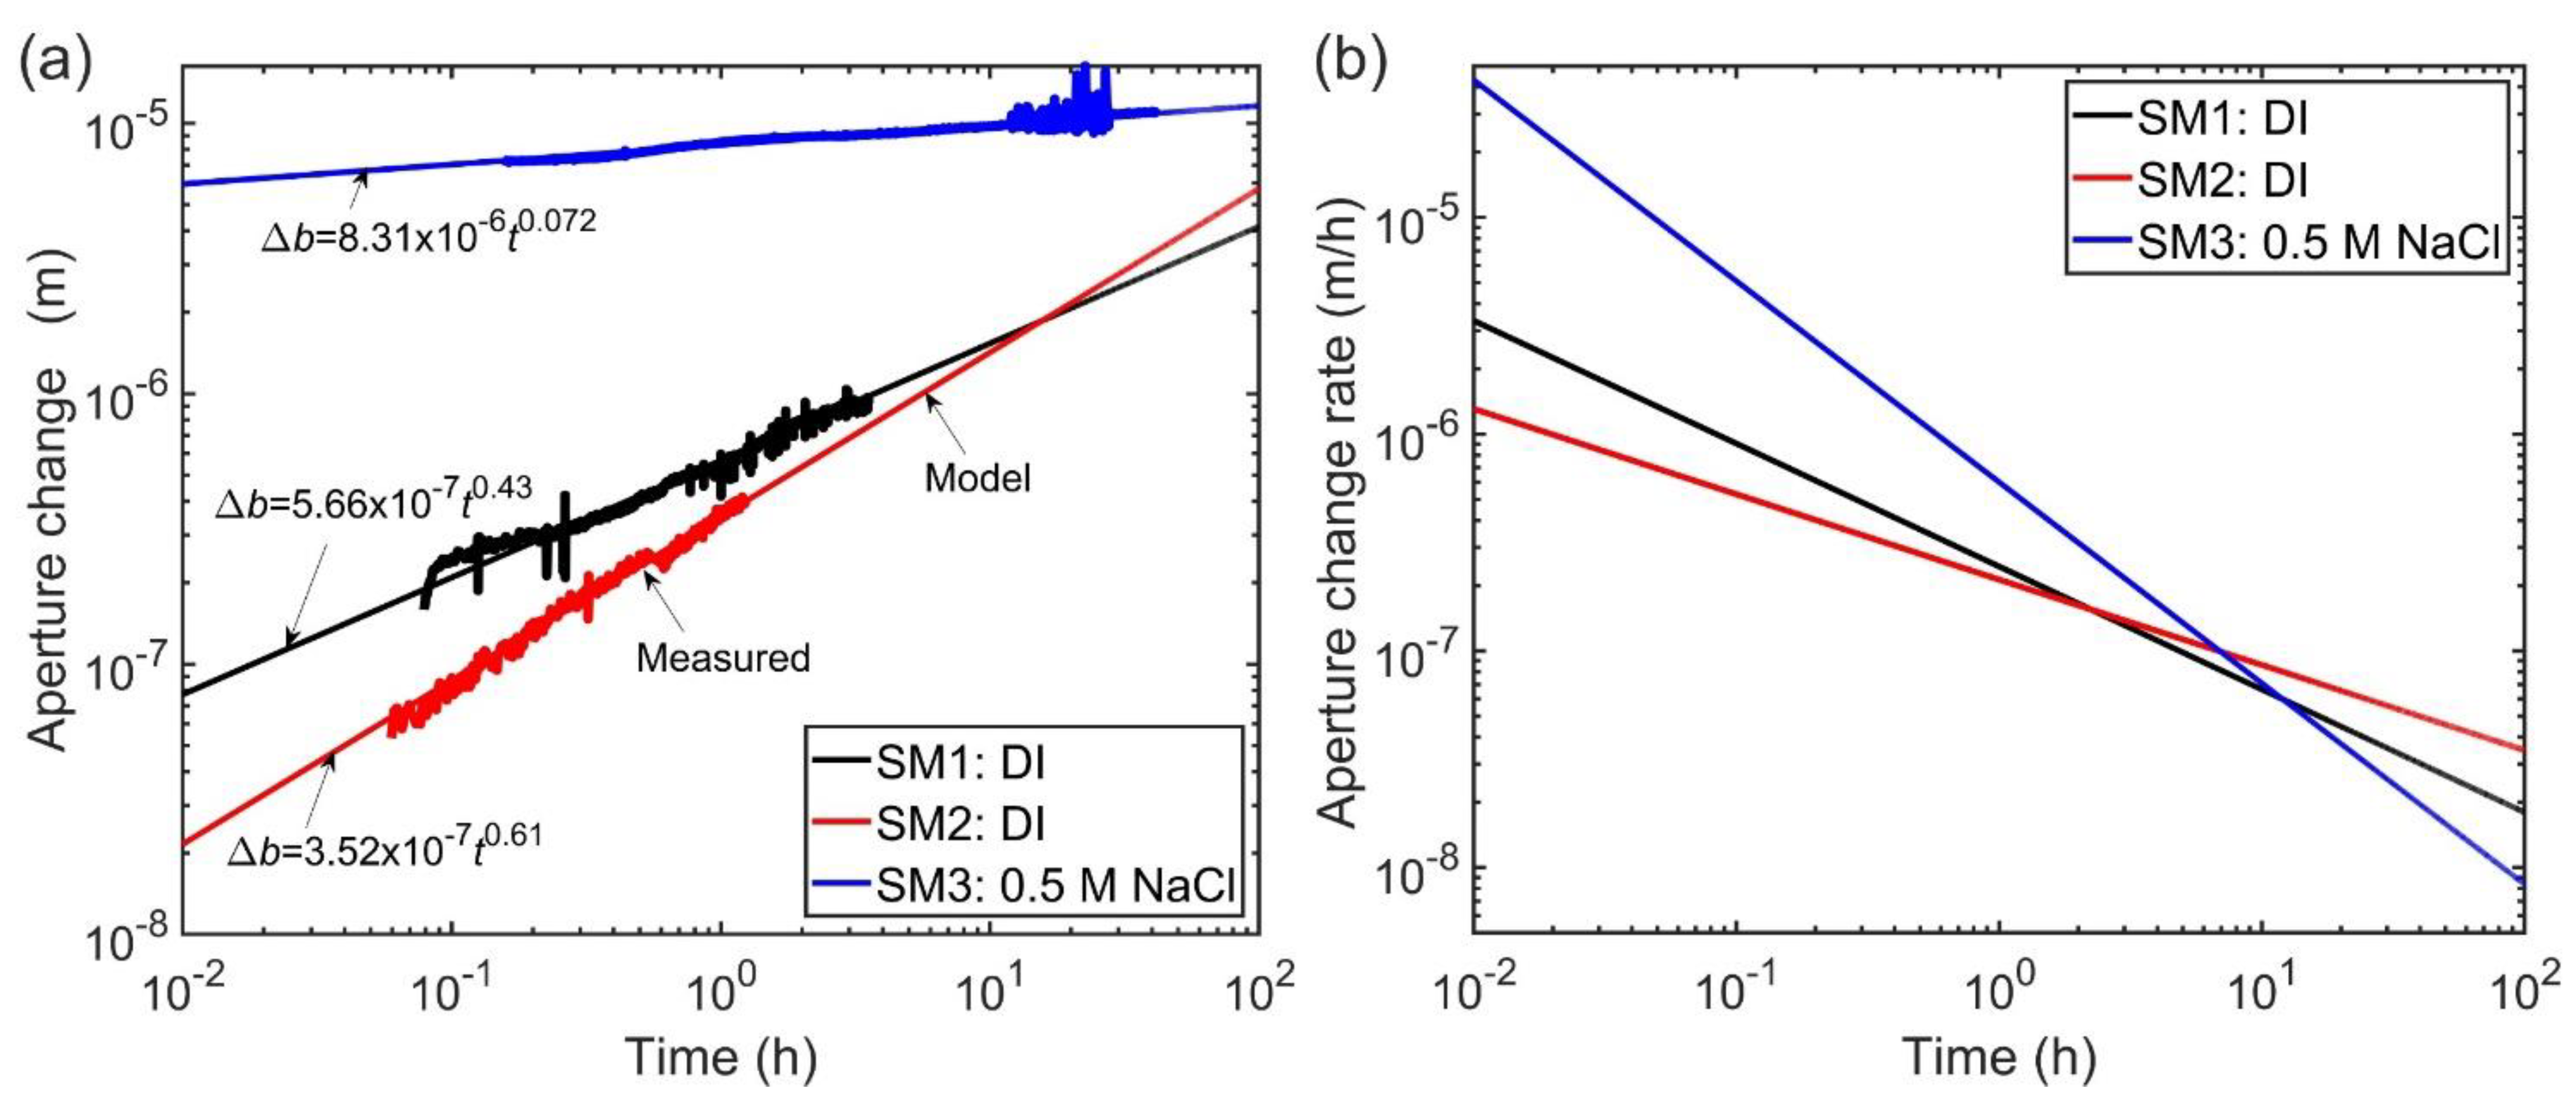
3.1.1. Initial Fracture Permeability Decline with Continuous Flow (Stage 1)

All samples exhibited a progressive fracture permeability decline with time during fluid flow, particularly pronounced for SM3 with NaCl solution as permeating fluid (Figure 2). Samples SM1 and SM2 showed nearly identical fracture permeability degradation, which slowly converged over time/reaching a minimum value. After the fluid flow was stopped for about 65 h, the fracture permeability of SM1 remained unchanged (i.e., kf = 3.7 × 10⁻¹² m2). Fracture permeability of sample SM3 was first continuously measured for 41 hours and subsequently measured again after flow was stopped for about 28 h and 16 h (see two lower right panels in Figure 2). Compared to samples SM1 and SM2, fracture permeability was more strongly reduced in the first 2 hours and progressively converged from initial 3.5 × 10⁻¹² m2 to 7 × 10⁻¹³ m2 at the end of continuous flow. Fracture permeability slightly declined further to 6.7 × 10⁻¹³ m2 and 6.6 × 10⁻¹³ m2 after interrupting fluid flow for 28 h and 16 h, respectively.
The evolution of fracture permeability with cumulative fluid flow volume is shown in Figure 3. Samples SM1 and SM2 presented almost similar permeability decay with flow volume, independent of flow rate. In contrast, the permeability of sample SM3 decreased more drastically with the same amount of NaCl solution. Again, the flow rate was adjusted during the flow tests to ensure that the differential pressure did not reach the maximum range of the transducer, but had no effect on permeability evolution. We expect that the total flow volume determines permeability variations by interaction with the fracture surface rather than flow dynamics.

3.1.2. Temperature Effects (Stage 2)

Using DI as permeating fluid, increasing the temperature stepwise resulted in a slight fracture permeability reduction from 3.7 × 10⁻¹² m2 (at 25 °C) to 3.4 × 10⁻¹² m2 (at 85 °C) in sample SM1, and from 4.5 × 10⁻¹² m2 (at 25 °C) to 3.8 × 10⁻¹² m2 (at 70 °C) in SM2, respectively (Figure 4). The permeability decline was not recovered after cooling to room temperature. After re-heating, the permeability of samples SM1 and SM2 was slightly reduced by about 3~6% at peak temperature (Figure 4, right-hand panels), indicating a time-dependent permeability reduction. A temperature increase from room temperature to 90 °C caused an irreversible permeability increase from 6.6 × 10⁻¹³ m2 to 1.3 × 10⁻¹² m2 in sample SM3, in particular between 70 and 90°C (Figure 4). Opposite to the behaviors of the other two samples, the permeability of SM3 slightly increased after re-heating to 90 °C.

3.1.3. Time Dependence of Permeability with Intermittent Flow (Stage 3)

For intermittent flow of DI through samples SM1 and SM2, fracture permeability progressively reduced over time, slightly more at T = 90 °C (SM1) than at T = 70 °C (SM2) (Figure 5). However, such time-dependent permeability reduction of both samples was likely to vanish or slowed down after cooling the sample to room temperature. For sample SM3 with a NaCl solution as permeating fluid, the permeability showed a 1.5-fold increase by over 34 days duration that remained constant after cooling down to 25 °C. In comparison to the initial permeability measured at room temperature in stage 1, all samples, subjected to the three test stages (i.e., the initial continuous flow, temperature cycles, and the intermittent flow), show at 25 °C fracture permeability reductions between 42 and 78% after a total test period of about 40 days (Table 3).
The initial and final permeability indicate the first permeability after pressure build-up and the end permeability at room temperature (see open symbols in Figure 5).

3.2. Fluid Chemistry Evolution

The element concentrations of Al and Zn in all effluent samples were negligible (<0.1 mg/L). Ca, Fe, K, Mg, Na, and Si concentration changed within a set of subsamples that were collected on day 7 after the first time interval of 6 days (Figure 6). This and each subsequent sampling sequence took approximately 1.5 h. It is implied that fluid–rock reactions occurred along the fracture and that dissolved matter diffused from the fracture aperture to the capillaries connected to the sample within the semi-closed pore fluid system. We interpret the subsample with peak element concentrations as the fluid representative of the composition in the fracture aperture during the 6-day interval. Because the fracture volume (on the order of ~0.01 mL) is significantly smaller than 1.0 mL (i.e., the volume of each effluent subsample), the absolute element concentrations of the fluid within the fracture aperture may be significantly larger than the measured peak values, depending on the dissolution and diffusion rates. Therefore, the measured element concentrations indicate the degree of fluid–rock reactions, but may represent a lower bound.
For samples SM1 and SM2 with DI, all element concentrations of SM1 are slightly higher than that of SM2, which is likely due to enhanced reaction rates at the higher temperature applied to sample SM1. Strikingly, the Na concentrations of both samples are about one order of magnitude higher than that of the other elements, revealing relatively strong reactions of Na-rich minerals in DI (e.g., plagioclase, c.f., Table 1). In sample SM3 with 0.5 M NaCl solution, the concentrations of Ca, K, and Mg are about one order of magnitude larger than those in SM1 and SM2 (Figure 6), and the Si concentration is ≈1.5–2 times higher than in SM1 and SM2. For sample SM3, the Fe concentration is negligible in all subsamples, possibly due to the dissolution limit of Fe-contained minerals or the lack of Fe-contained minerals (e.g., Ankerite and Chlorite) on the SM3 fracture surfaces.
By comparing all peak concentrations obtained after each time interval, we were able to evaluate the reaction rate evolution of the fluid–rock system under constant pressure and temperature conditions (Figure 7). For samples SM1 and SM2, the maximum concentrations occurred after the first time interval on day 7. Subsequently, all element concentrations progressively reduced with time, implying a reduction of fluid–rock interactions. In particular, Fe concentration reduced to nearly zero, which may manifest the reaction termination of Fe-containing minerals or the disappearance of such minerals after dissolution. In contrast, for sample SM3, the concentrations of all elements, except K, showed minor reduction after each week (Figure 7f), indicating that fluid–rock interactions in SM3 were relatively stable, although the dissolution reaction rates were faster than those in SM1 and SM2.

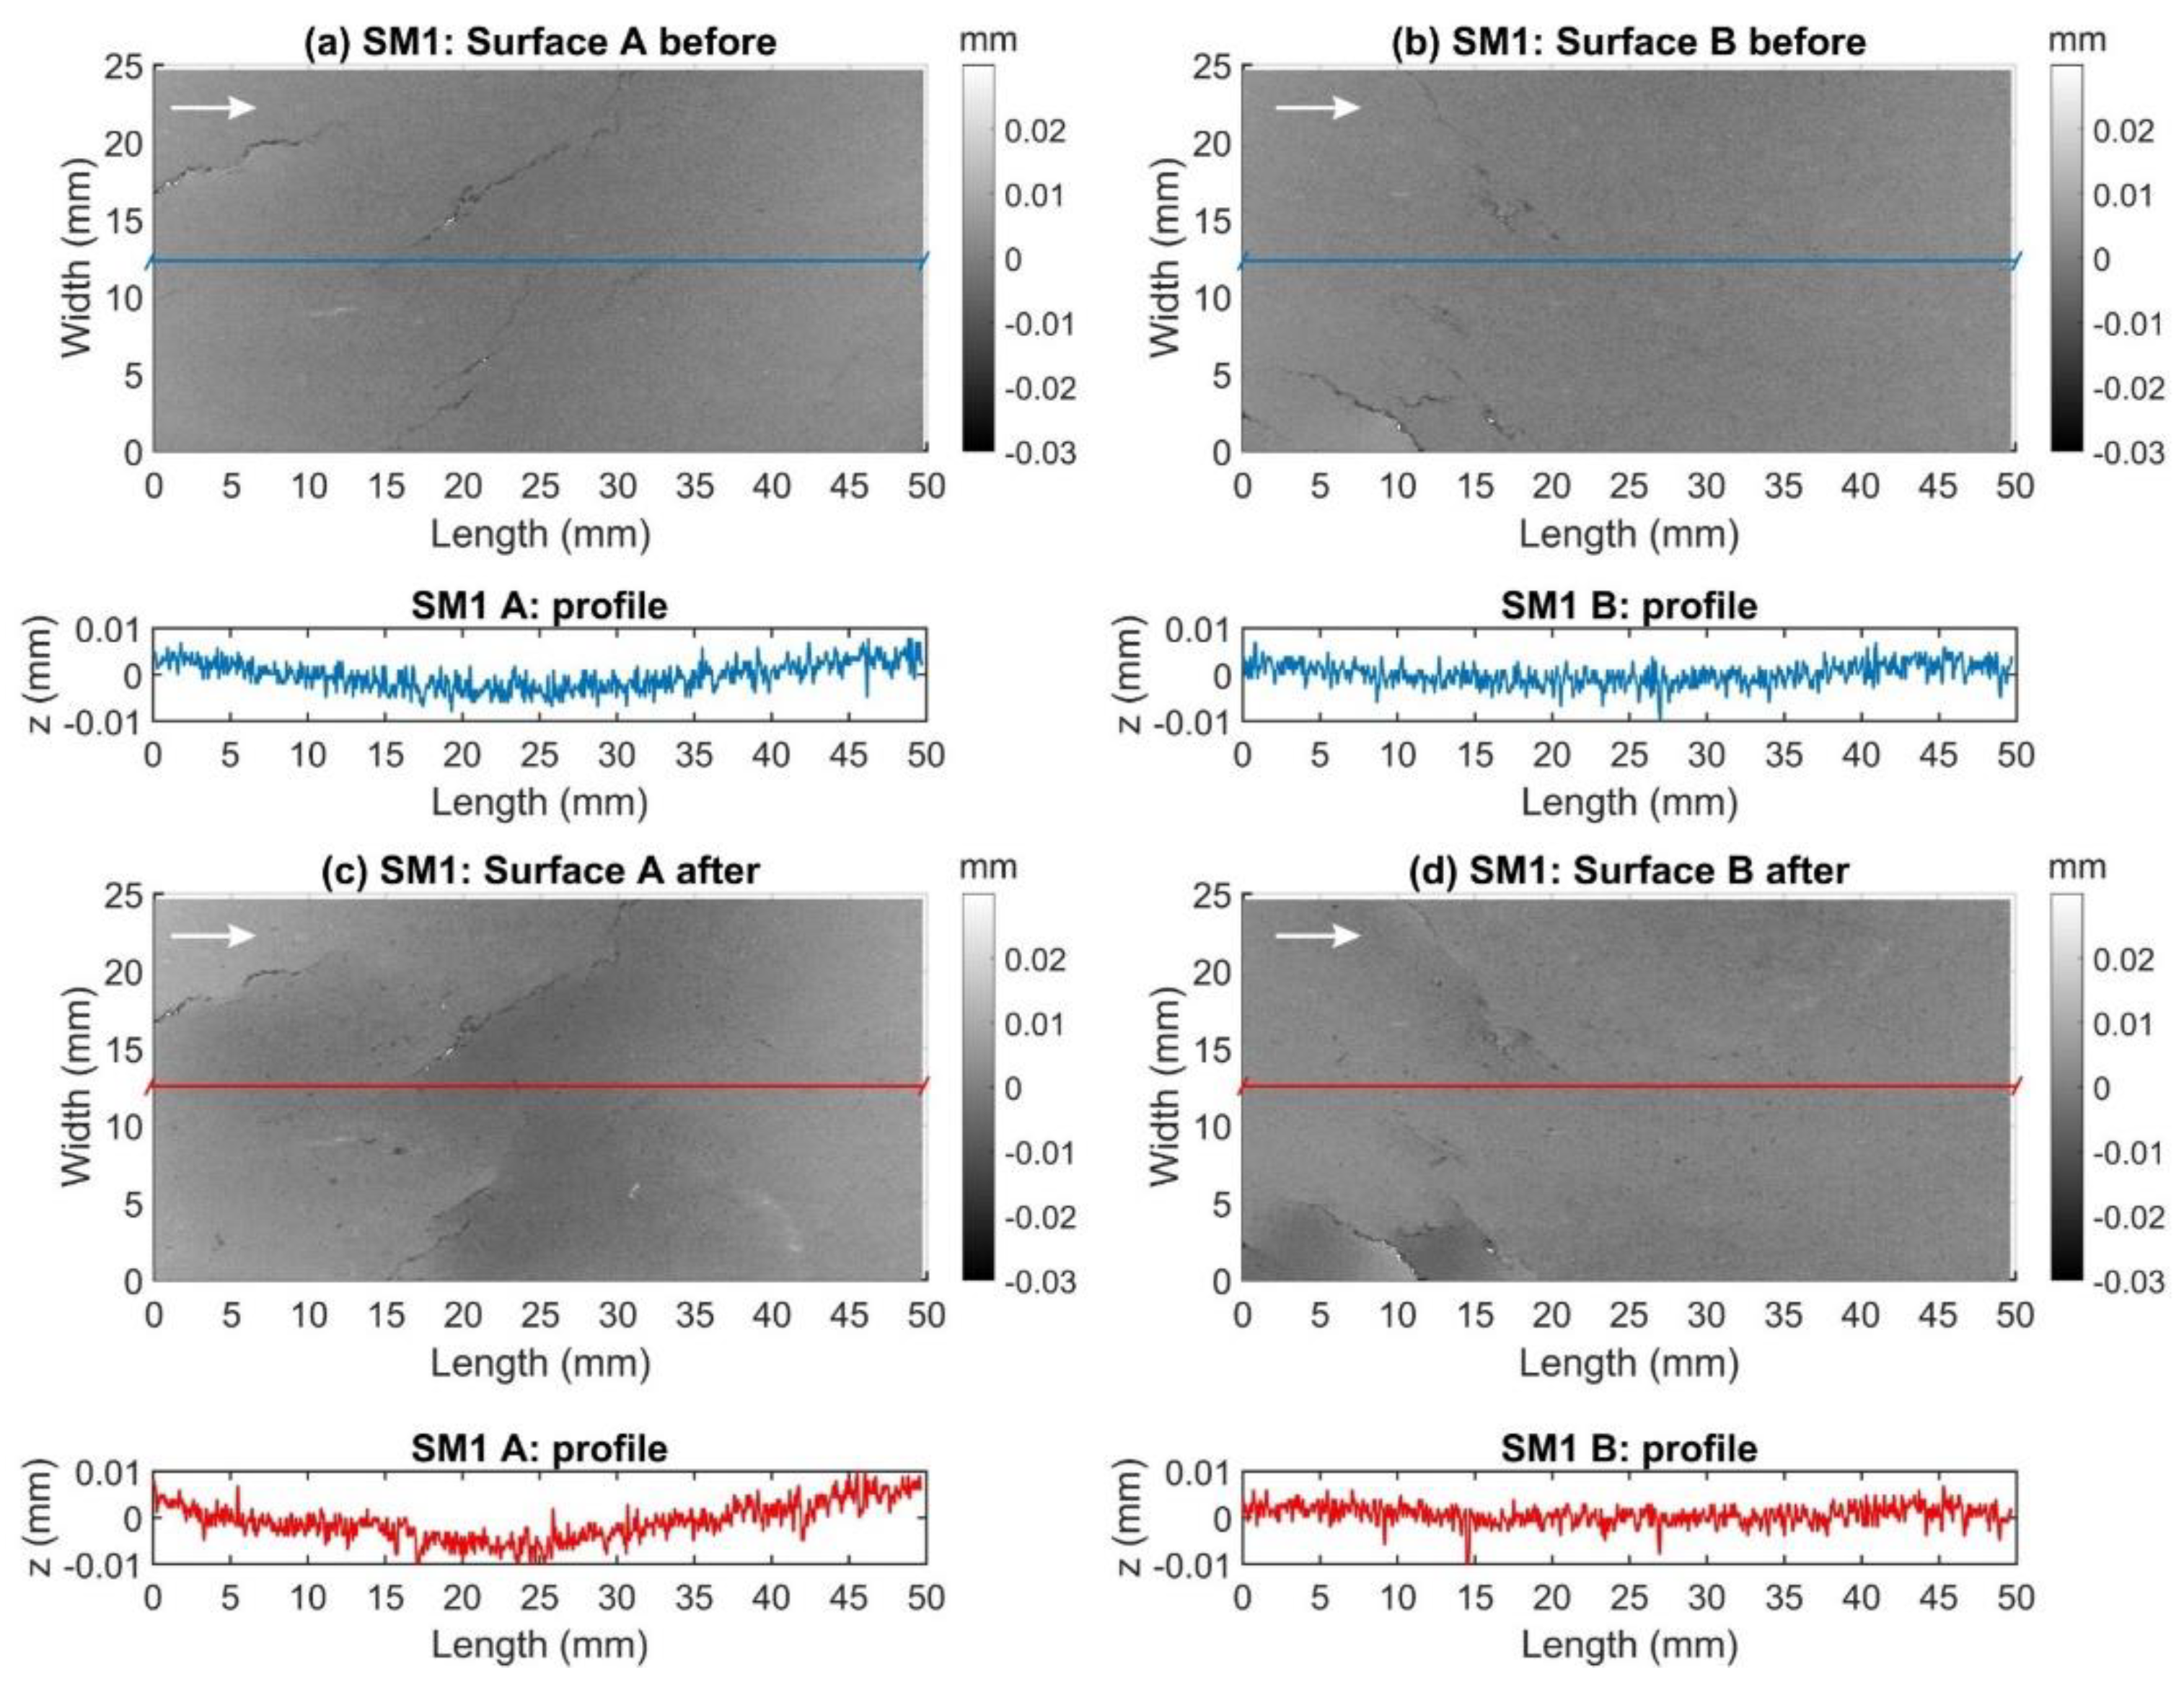
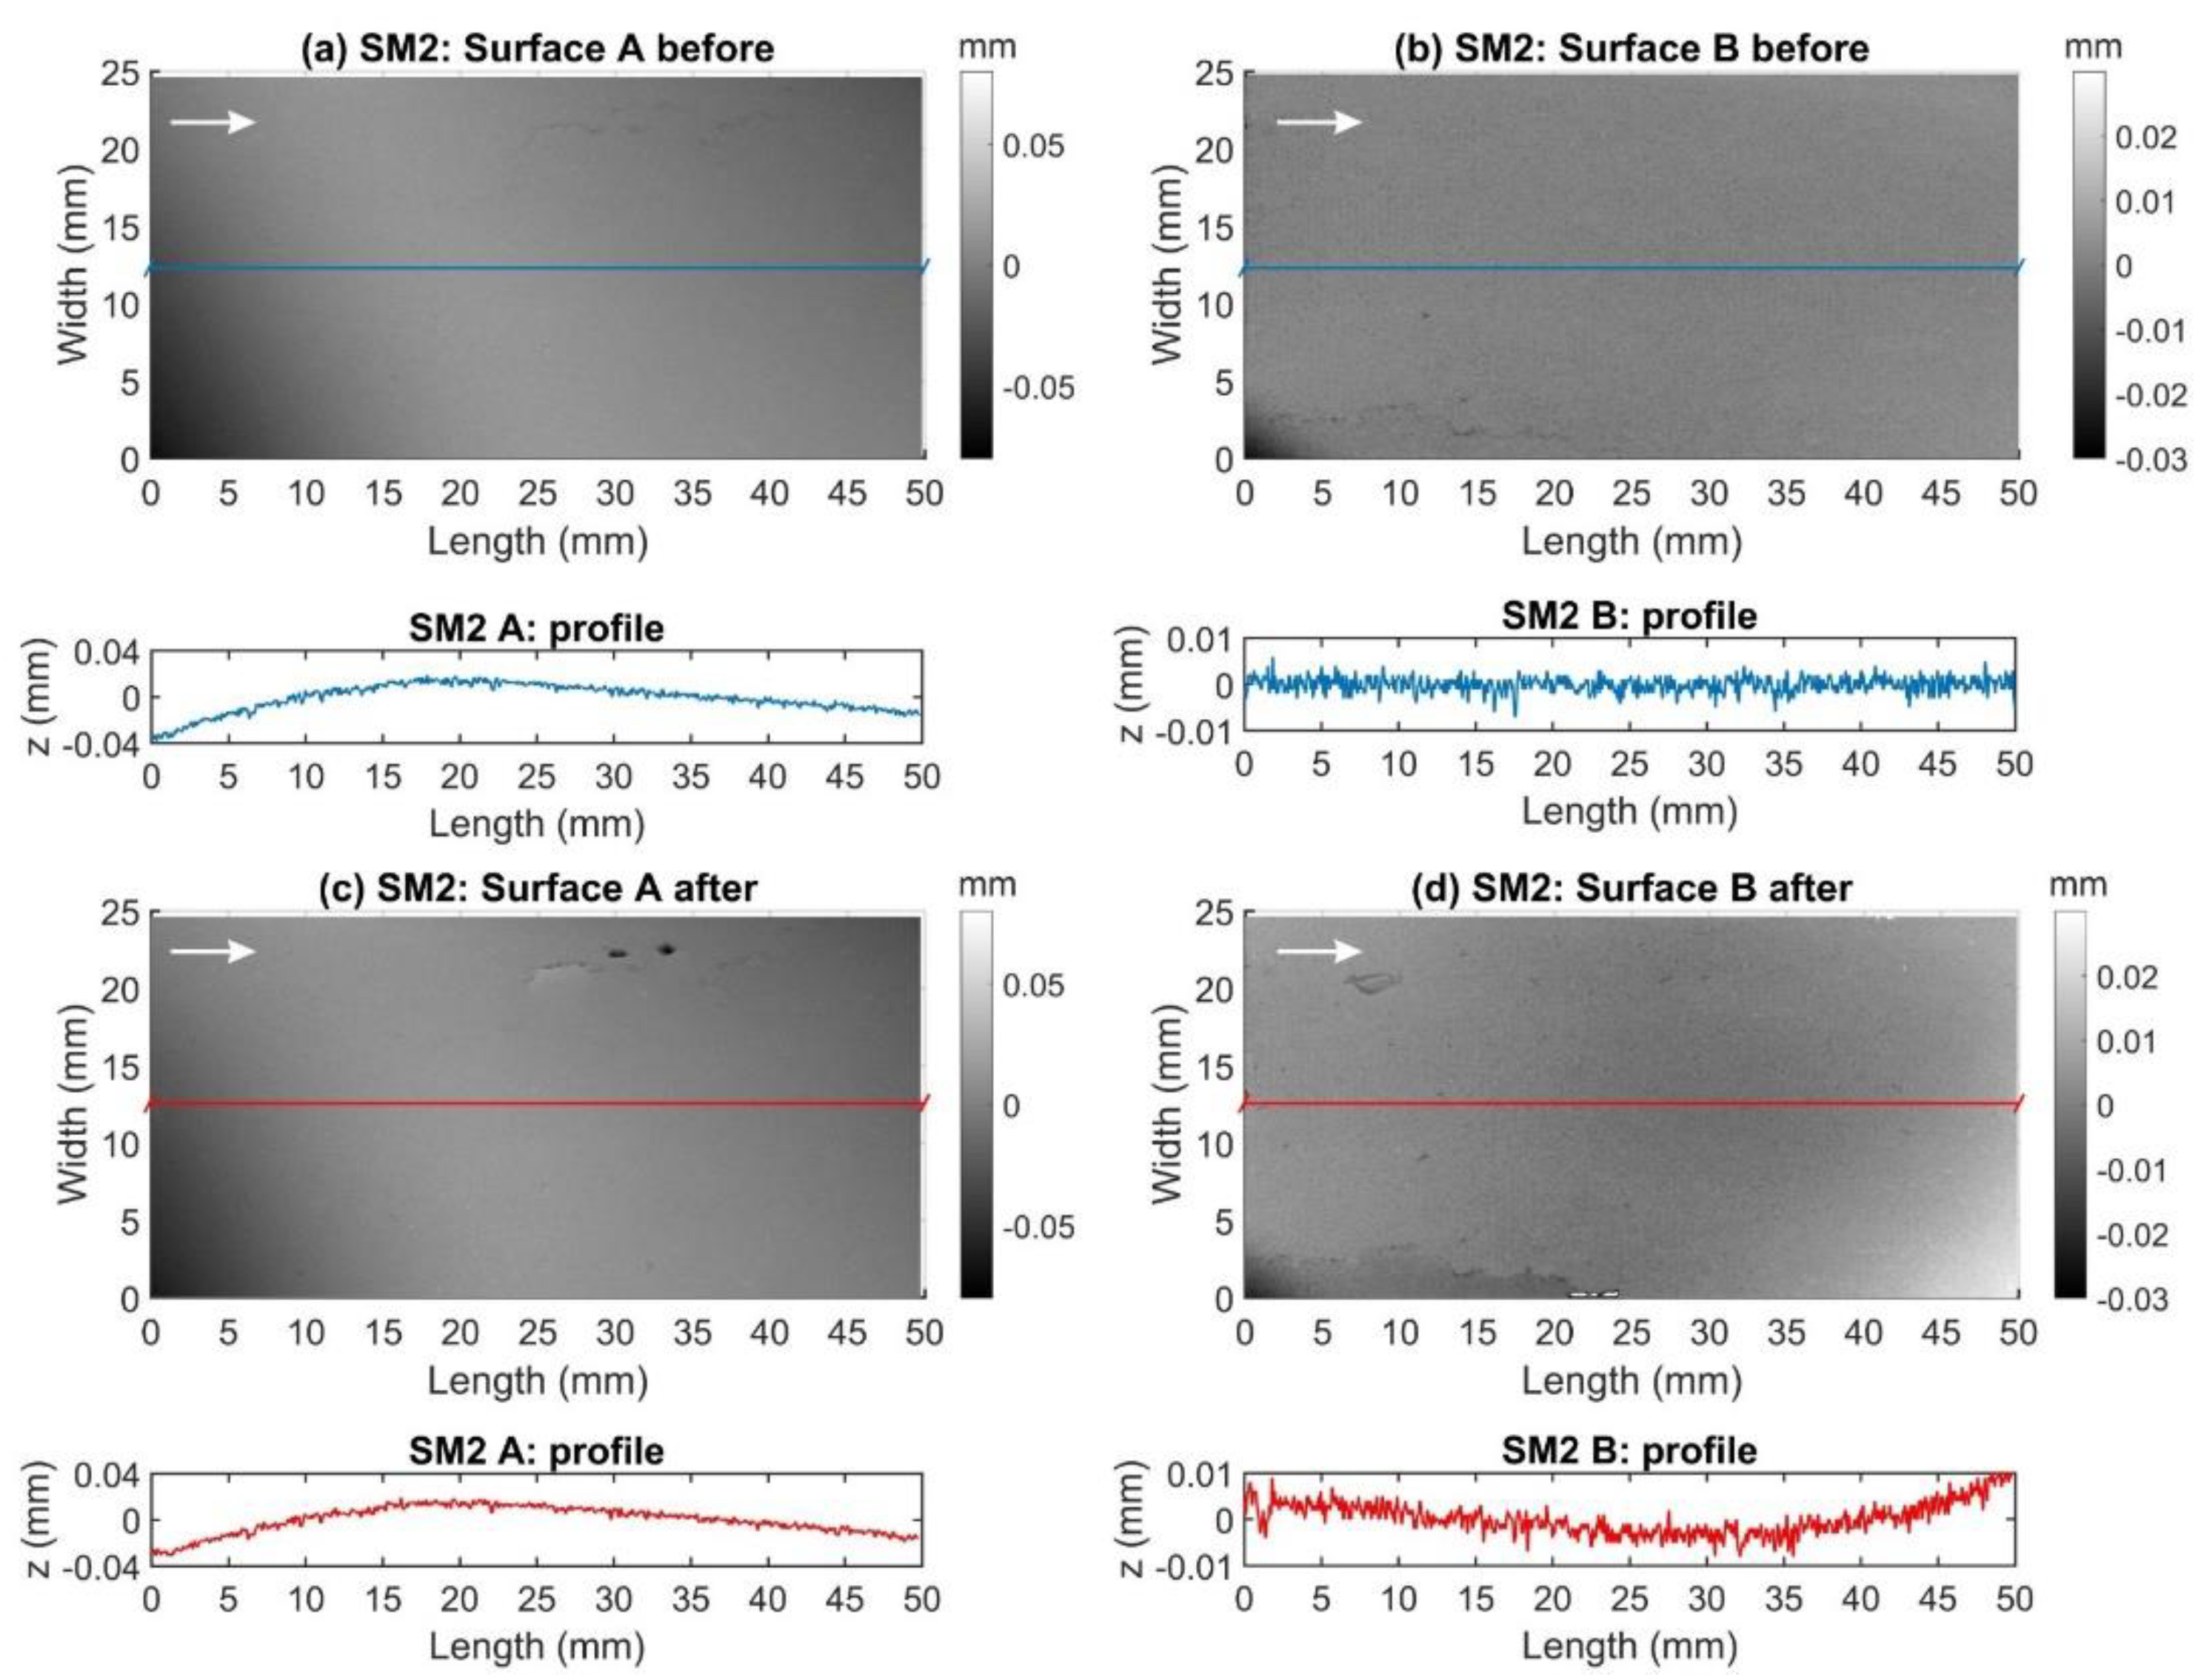
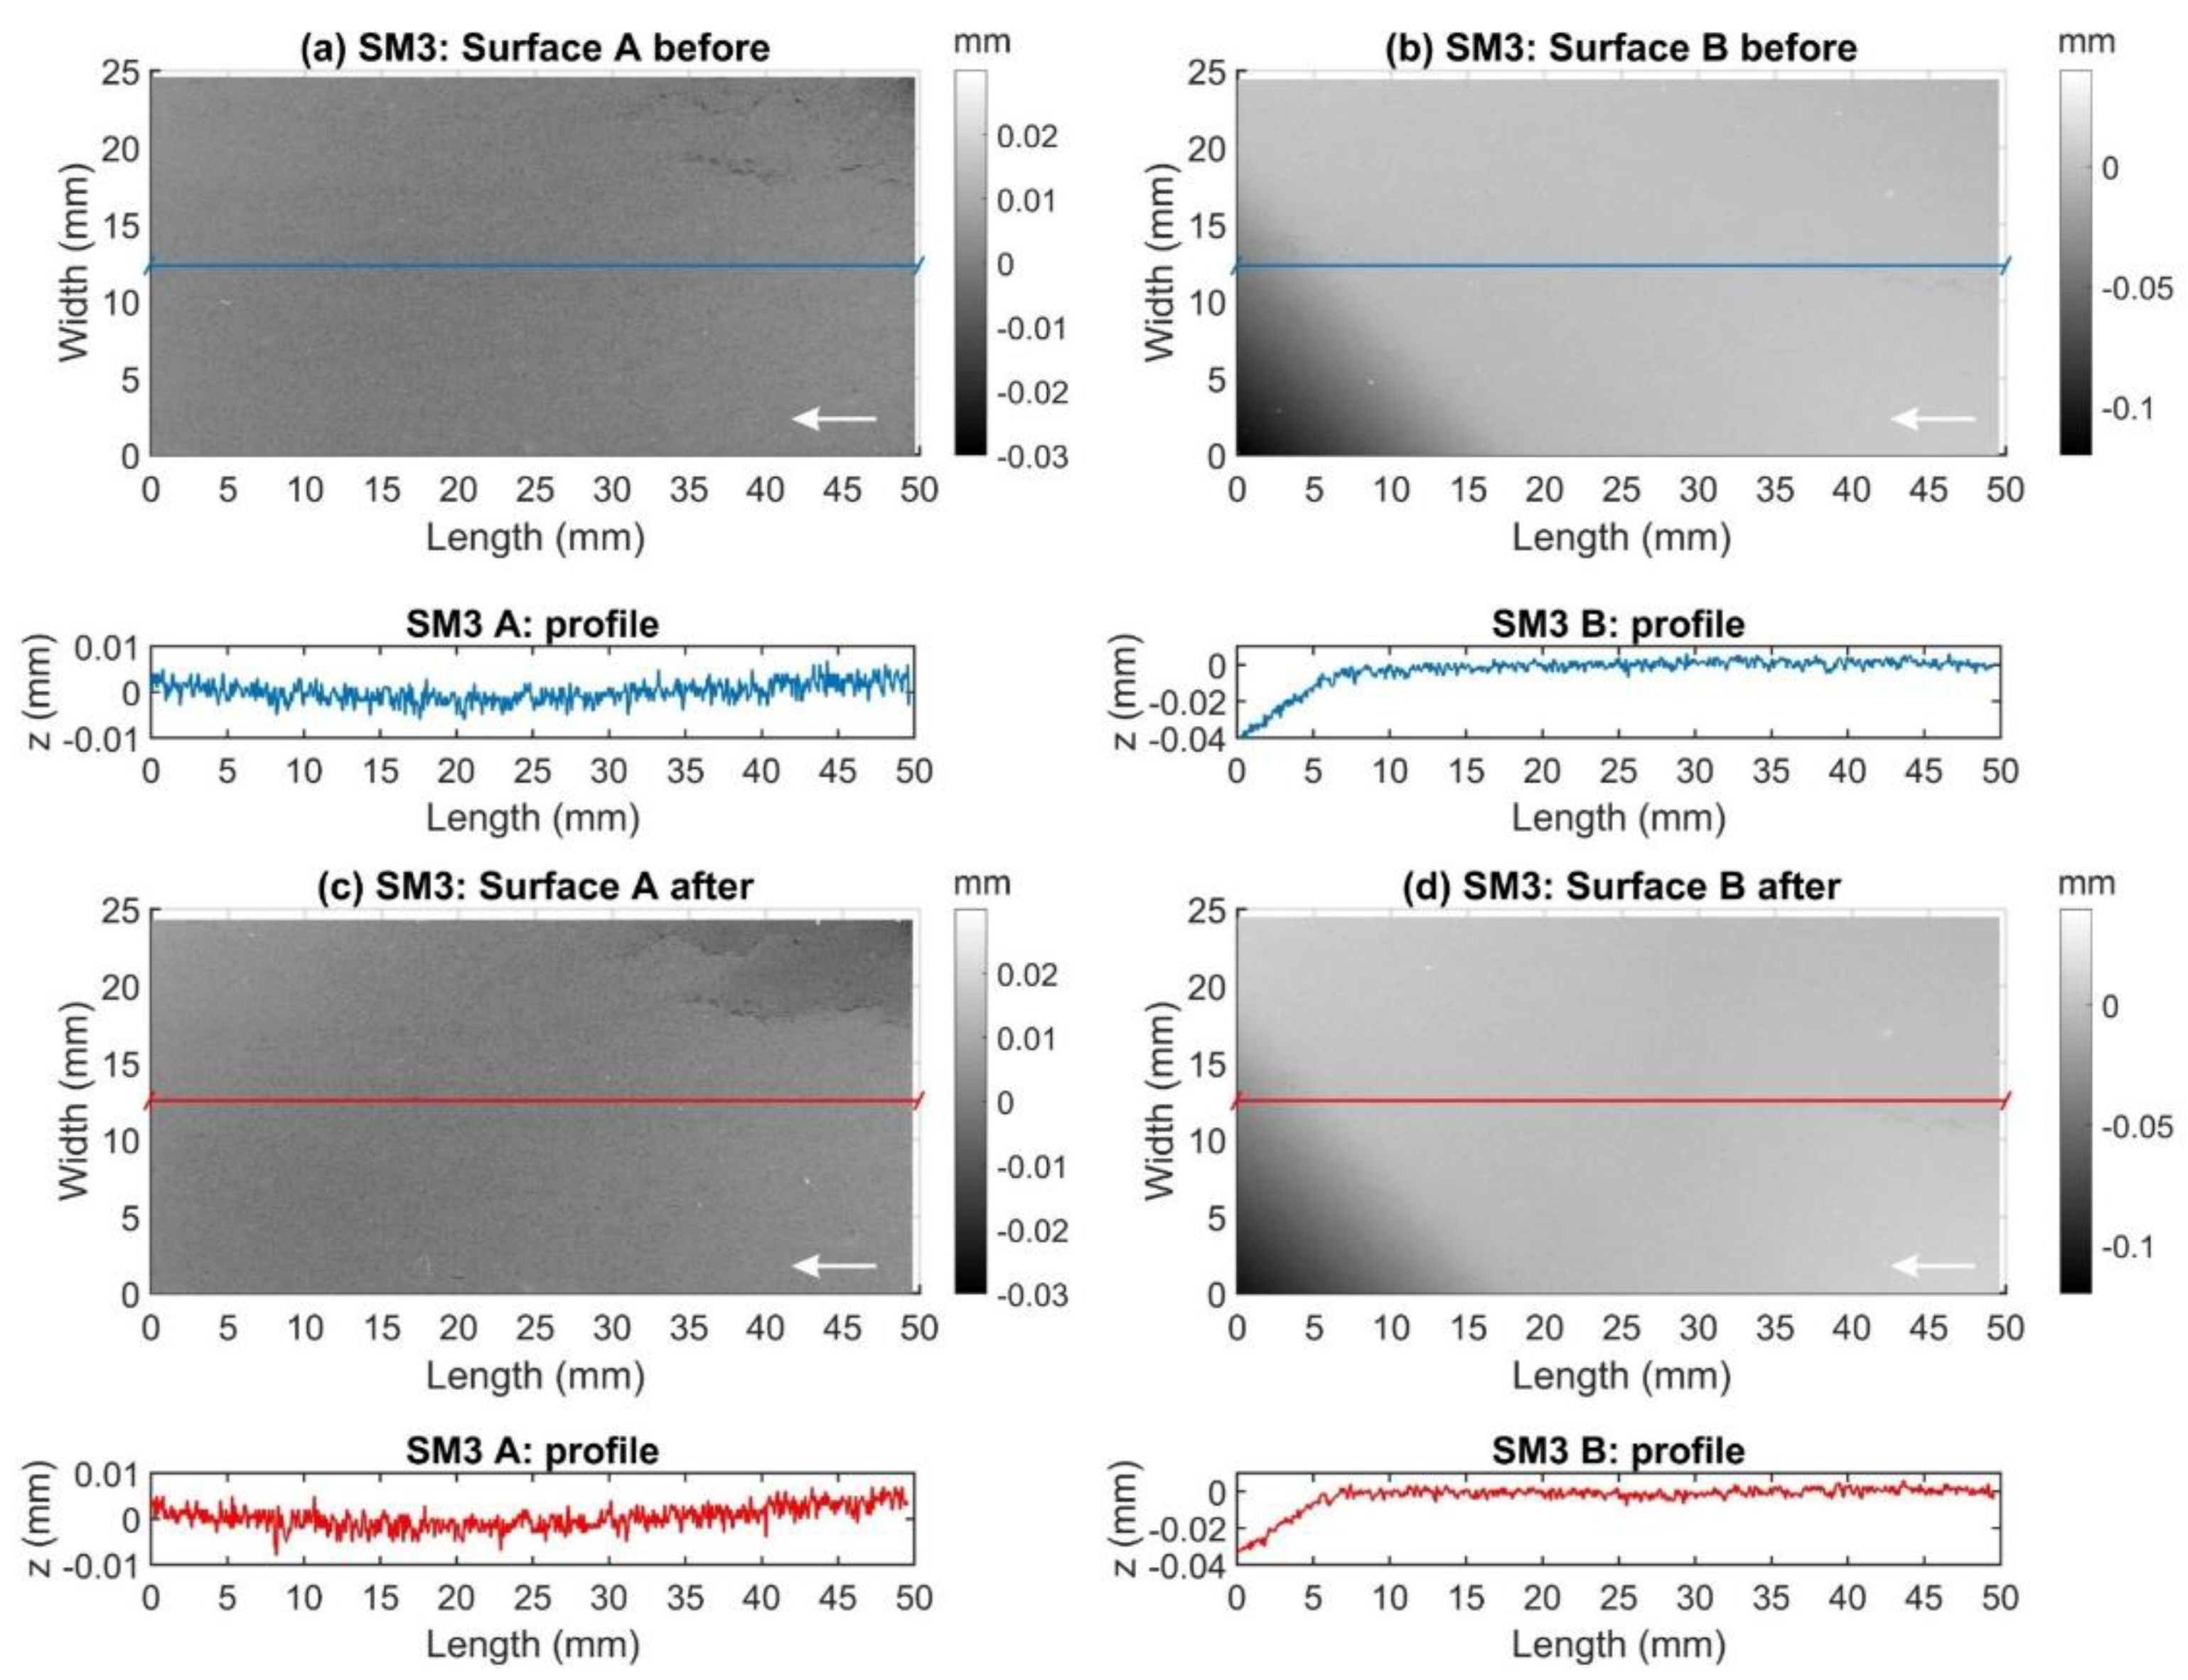
3.3. Fracture Surface Topography

Fracture surface topographies before and after the experiments are shown in Figure A1, Figure A2 and Figure A3 (in the Appendix A) for samples SM1, SM2, and SM3, respectively. The topography of both fracture surfaces changed due to fluid flow, particularly in areas close to the fluid injection side (i.e., dark areas in maps measured after testing), and in most cases resulted in a slightly wider height distribution compared to the initial surface (Figure 8). The removal of surface heights (dark areas in Figure A1, Figure A2 and Figure A3), where stresses are expected to be high (stress concentrations at the tips of the surface asperities), indicates that the mass loss is induced by pressure solution of contact asperities. However, the peak height difference Rp, the mean height Rm, and the root mean square height Rrms of the whole surface before and after the experiments show that fracture surface roughness remains nearly unchanged or slightly increased (Table 4), which indicates that the global statistical values cannot easily reveal some localized solution/dissolution processes. It can be assumed that such fracture surface roughness changes may result from a combination of pressure solution and dissolution/precipitation reactions, which, in turn, might counteract each other to a certain degree.

3.4. Microstructures

The post-experimental backscattered electron (BSE) micrograph and the EDX map of sample SM1 (Figure 9) taken as an example, indicate a complex mineral distribution, where pyrite and ankerite are normally located as a cluster, and other minerals are mixed without clear boundaries. Fracture surfaces are rough and attached with various particles (e.g., pyrite, plagioclase, muscovite) that are authigenic (Figure 10). The particle size is in general within 10 µm. Mineral dissolution and secondary mineral formation (precipitation) are hard to distinguish based on the micrographs. However, we observed some fiber-like texture at the edge of some crystals (Figure 10d) in sample SM3, which may imply strong reactions on the mineral surfaces.

4. Discussion

The observed evolution of fracture permeability with time and temperature in addition to the associated change of the effluent chemistry may be explained by one or more of the following mechanisms: pressure solution, stress corrosion, free-face dissolution, and fines migration. We discuss if these mechanisms may have contributed to permeability evolution in the separated experimental stages.

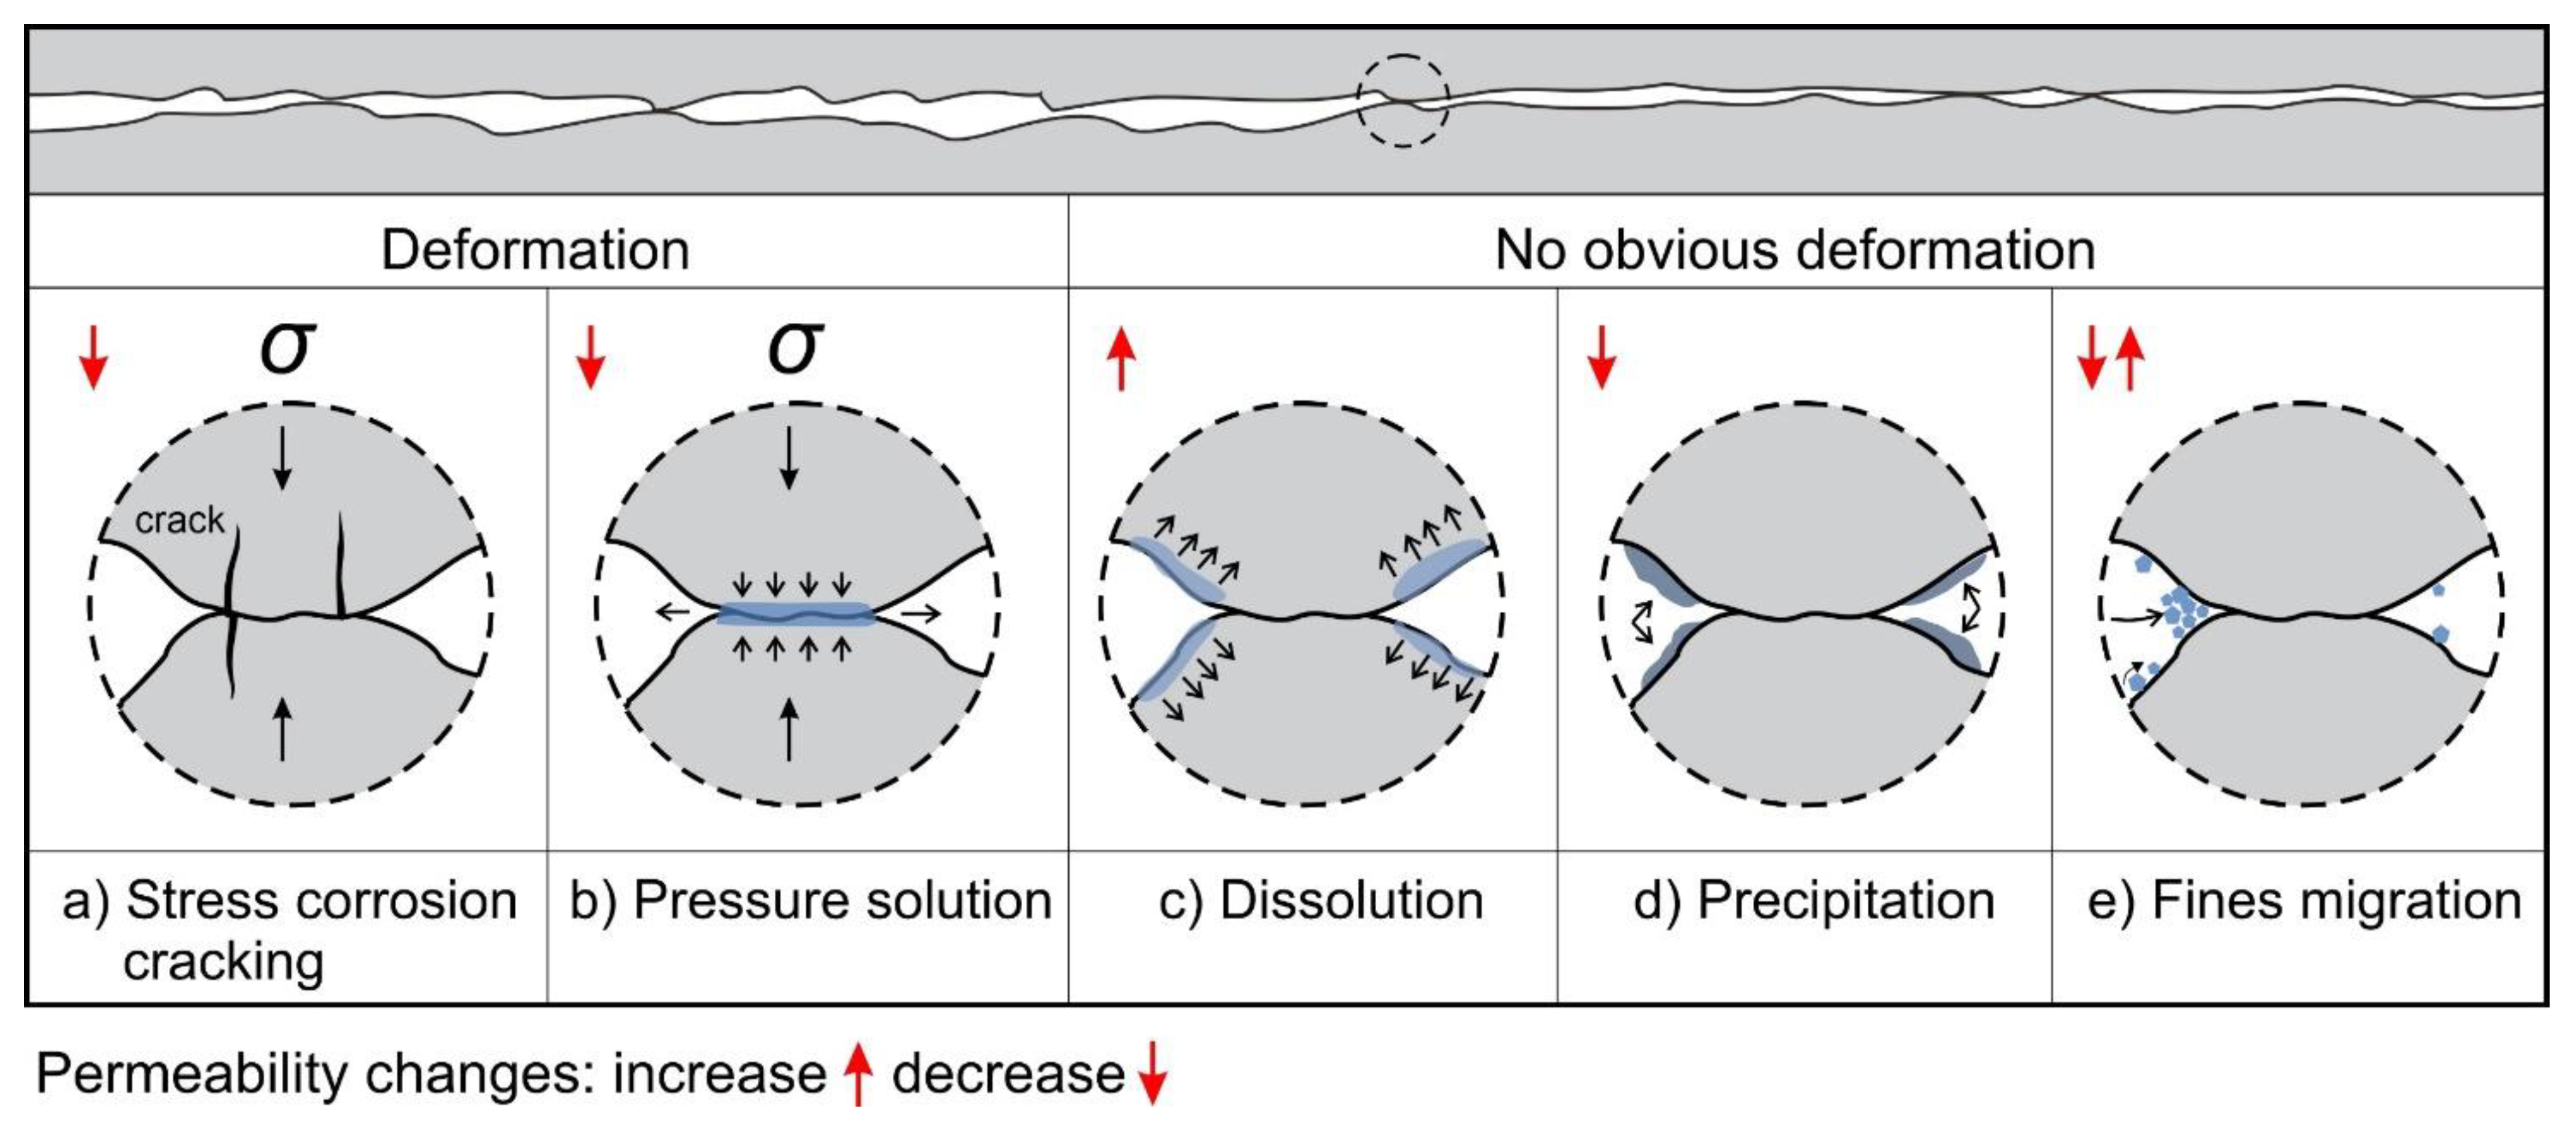
4.1. Mechanism of Initial Permeability Decline under Constant Conditions

Time-dependent fracture permeability decrease was observed with DI flow under static stress conditions [15,17,21,22]. The degradation was explained by pressure solution, a continuous sealing process of the macroscopic fracture. Im et al. [21] found that fracture permeability decay during hold periods over dozens of hours in slide-hold-slide experiments can be well described by power-law compaction coupled with the “cubic law”. Power-law compaction was established in indentation experiments, where the time-dependent displacement of the indenter into the crystalline mineral matrix can be described by a power-law function, induced by pressure solution [54]. Because of indentation of the contact asperities into the matrix, it is assumed that the overall fracture closure (Δb, geometrical aperture changes) also follows a power law with respect to time as
Δ b = α t n
where n is the power-law exponent, t is the elapsed time, and α is the aperture change when t = 1. Further, by substituting Equation (1) into Equation (2), sample permeability k can be expressed with hydraulic aperture bh as,
k = b h 3 6 π r
Assuming equivalent hydraulic and geometrical aperture b, sample permeability evolution can be correlated to fracture closure Δb [21,52,55] as
k = k 0 ( 1 Δ b b 0 ) 3
where k0 and b0 are the initial permeability and aperture, respectively. Substituting Equation (7) into Equation (9) yields
k = k 0 ( 1 α b 0 t n ) 3
We used the measured permeability data during continuous flow (Figure 2) to parameterize k0, α/b0, and n by using the least-squares method. The resulting values, provided in Table 5, fit very well to the data (Figure 11). We observed a similar permeability degradation trend but with a larger range of power exponents in comparison to similar permeability measurements in granite with saw-cut fractures under effective pressure of 3 MPa (n = 0.3~0.4) described in [21]. The power exponent n measured for sample SM3 is distinctly lower than of samples SM1 and SM2, which may imply that the permeability changes are not solely controlled by pressure solution. Because the indenter experiments indicate that pressure solution-controlled indenting displacement yields a power-law function with exponents normally larger than 0.3 [54]. Our results imply other processes (free-face dissolution) also play an important role in the overall fracture aperture variation, which will be discussed below. Evidently, when the flow was stopped for some time, measured permeability showed much less reduction than predicted for continuous flow (c.f., samples SM1 and SM3 in Figure 11). This suggests that a chemical equilibrium within the fracture aperture was attained during no flow periods leading to a high concentration of the pore fluid and less efficient pressure solution, resulting from limiting the diffusion from contacts to the pore fluids.
Another possibility is fines migration-induced permeability decline, commonly occurring in porous media [35]. In our samples, fine particles are attached to the fracture surfaces (Figure 10), which may have been transported upon fluid flow, causing permeability to decrease. During no flow periods, particles may not migrate and clog the flow pathways, mitigating permeability reduction. The drag force Fd, causing the particle to move, is proportional to the fluid dynamic viscosity μ, flow rate U, and particle radius rs: F d μ r s U [56,57]. We found that permeability reduction is relatively independent of flow rates (Figure 3). For DI and the 0.5 M NaCl solution, the dynamic viscosities at room temperature are 889.9 and 928.6 µPa*s, respectively [50,51]. For particles of similar size, this would lead to a difference of drag forces between the two fluid compositions of about 4%, which is unlikely to explain the lower permeability obtained with NaCl compared to DI. In addition, high-salinity fluid would increase the stability of mobile particles due to the increase in the electrostatic force [35]. In this case, with the assumption of fines migration, permeability should present less reduction upon fluid flow with NaCl, which is opposite to our experimental results. Therefore, fines migration is expected to be not the dominant factor in flow-dependent permeability reduction.
Assuming that the initial fracture aperture b0 is equivalent to the initial hydraulic aperture bh0, b0 can be expressed based on Equation (8) as
b 0 = 6 π r k 0 3
Using fitted parameters, k0 and α/b0 (Figure 11 and Table 5), we can determine the aperture change as a function of time, Δ b = α t n (Figure 12a). We noticed that the initial aperture changes of sample SM3 were significantly larger than that of the other two samples. However, the aperture closure rate Δ b ˙ = n α t n 1 , of sample SM3 decreased much faster and was smaller than that of SM1 and SM2 after about 10 hours duration (Figure 12b). This implies that at the beginning of the experiments, the NaCl solution accelerated the pressure solution rate by increasing the dissolution kinetics of some minerals, e.g., quartz [58,59] and calcite [60]. Due to an increasing rate of free-face dissolution, which has a contrasting (i.e., enlarging) effect on fracture aperture, the total aperture closure rate may significantly reduce if pressure solution rate slows down or terminate eventually due to the continuous increase in contact areas. Therefore, we expect that the initial permeability decline observed in stage 1 of our experiments was mainly governed by pressure solution with a relatively increasing contribution of free-face dissolution with increasing time.

4.2. Thermal Effects on Permeability

Thermally driven hydraulic aperture reduction is believed to be induced by thermal dilation, mechanical creep, and pressure solution [19,43]. However, in our experiments, temperature cycles resulted in opposite irreversible permeability changes (i.e., decrease in sample SM1 and SM2 with DI and increase in sample SM3 with the NaCl solution) (Figure 4). Therefore, thermal dilation or thermal stress effects cannot solely control the process, otherwise similar permeability changes are expected. In addition, we observed time-dependent permeability changes at peak temperatures and after temperatures cycling (Figure 4).
In general, increasing temperature enhances fluid–rock reaction rates [17,24,61,62,63,64], leading to enhanced pore space or permeability changes. The continuous flow tests in stage 1 demonstrated an interplay of pressure solution and free-face dissolution, where the initial pressure solution rate in sample SM3 with the NaCl solution was much faster than that of the other two samples. Obviously, the rate-limiting process of pressure solution (dissolution, transport, or precipitation) was different for DI and NaCl solutions and strongly temperature-dependent between 70 and 90 °C. Although we measured the amount of species diluted in the effluent, which strongly differed if using DI or NaCl solution as permeating fluid (Figure 7), we were not able to quantify the element concentrations. We expect that temperature-dependent solubilities and reaction rates, as well as time, control the permeability evolution, but cannot specify the relative contribution based on the available data. Nevertheless, the slight permeability reduction with time of samples SM1 and SM2 after temperature cycling, and the slight increase with time for sample SM3 may be explained by the cross-over from dominantly pressure solution controlled to free-face dissolution-controlled permeability evolution (c.f., Figure 12).

4.3. Potential Fluid–Rock Interactions on Time-Dependent Permeability Changes

Figure 13 shows potential processes that cause permeability changes with time. They may occur solely or simultaneously depending on the pressure, temperature, fluid, and rock compositions [16,17,24]. Despite fluid chemistry, pressure solution and stress corrosion require normal stress acting on the solid contacts as the driving force. Thus, they occur predominantly at the early stage when the effective stress on the contacts is relatively high. In this case, fracture permeability reduction is always accompanied by obvious fracture deformation [22]. In addition, sufficient dissolved components can be detected in the effluents due to pressure solution-enhanced solubility [17,19,24,43]. For the other mechanisms, i.e., free-face dissolution, precipitation [25,61], and fines migration [35], no obvious deformation is required in conjunction with fracture permeability changes at a relatively small scale.
We were not able to identify if stress corrosion cracking played a role in our experiments, but fines migration appeared to terminate towards the end of stage 1 (Figure 2) and hence to play a subordinate role during stage 2 and stage 3. Since we did not measure strain data to evaluate which mechanisms contribute to the overall process, we relied on analyses of measured permeability changes and effluent concentration variations. The element concentrations in sample SM3 were significantly larger than those of the other two samples (Figure 6), supporting the hypothesis that the NaCl solution could increase mineral reaction rates in SM3. Sodium cations would accelerate the dissolution rate of, for example, quartz [58,59] and calcite [60]. The enhanced concentrations of Ca and K in sample SM3 are possibly due to the dissolution of plagioclase (NaAlSi2O8 to CaAl2Si2O8) and muscovite (KAl2(AlSi3O8)(OH)2). The large Fe concentrations in samples SM1 and SM2 may result from Ankerite (Ca(Fe2+, Mg)(CO3)2) dissolution.
The element concentrations of sample SM1 at 90 °C were slightly higher than those of sample SM2 tested at 70 °C (Figure 7). This supports the hypothesis that increasing temperature enhances the fluid–rock interactions. The fact that all element concentrations of samples SM1 and SM2 showed a maximum after the first time interval and declines afterwards indicates that pressure solution was dominant at the early stage of long-term intermittent flow, but was progressively less effective in later stages when contact areas expanded. The changes in the effluent concentration (SM1 and SM2) are consistent with pressure solution evolution. Temperature-dependent kinetics is in line with our observation of stronger fracture permeability reduction with time at 90 °C compared to 70 °C (Figure 5). For sample SM3, the element concentrations (except Na) also increased after the first time interval, but remained relatively stable afterwards (Figure 7). This implies permeability changes are first mainly controlled by pressure solution and then by free-face dissolution, because the latter is directly correlated to the reactive surface areas that did not change dramatically. The increase in permeability with time for sample SM3 reveals the contribution of mass transfer forming voids.
We noticed that the stopped flow within the semi-closed pore fluid system mitigated permeability decline at room temperature (Figure 11), but the intermittent flow still led to substantial permeability changes at elevated temperatures (Figure 5). This discrepancy is likely also related to thermally enhanced fluid–rock interactions as permeability changes with the intermittent flow significantly slow down after cooling to room temperature.
In our experiments, the initial hydraulic aperture of saw-cut fractures was in the range of 6~7 µm (calculated from Equation (2)) under low-stress conditions (effective stress of 9 MPa), which is in the same order of magnitude as the fracture surface roughness (Table 4). This indicates that the fracture surface roughness is strongly correlated to the initial fracture aperture and thus represents a defining parameter with respect to fracture permeability. The surface height distributions remain unchanged or slightly rougher after the experiments (Figure 8), likely resulting in the dissolved mass on some localized areas (dark areas on the fracture surface topographies, Figure A1, Figure A2 and Figure A3). However, we were not able to quantify if such height reduction resulted from dissolution or pressures solution, because both mechanisms led to local mass removal from the fracture surface. In addition, we expect that the effect of mass transfer (caused by pressure solution or mineral dissolution) in such narrow fracture apertures are drastic, whereas larger fractures with high surface roughness or fractures under high-stress conditions may lead to different evolutions of fracture aperture, which need to be further investigated.

4.4. Implications for EGS

The long-term sustainability of rock fracture permeability is crucial to guarantee the lifespan of a successful EGS. Our experimental results demonstrate that newly generated fractures in slates (e.g., artificially prepared, injection created, and sheared) may be subject to large and fast permeability reduction with time under constant effective stress conditions. Such time-dependent fracture permeability reduction was also observed in granite, shale, and novaculite [4,15,17,19,21,22]. Similarly, fracture permeability reduction can slow down at the late stage during fluid flow. Moreover, the governed mechanisms in our experiments are pressure solution and free-face dissolution, where the former may slow down and terminate at some point, and the latter plays a more important role in the late stage. In the sample with NaCl solutions as the permeating fluid, permeability showed a slight increase at the late stage, where we expect that pressure solution is nearly stopped because of the enlargement of contact areas, and mineral dissolution may increase the voids. This behavior was also found in a flow-through experiment of a fractured limestone with distilled water, where free-face dissolution overtakes pressure solution, generating a “wormhole” for fluid flow [16]. Therefore, we infer that the pre-existing fractures, if hydraulically conductive, may persist for a very long term, but newly generated fractures will yield a certain reduction with time due to the initial high-stress concentration on the self-propping contacts. For assessing the performance of geothermal reservoirs after stimulation, such time-dependent permeability reduction must be borne in mind.
To reach the economic utilization of geothermal reservoirs, some indicators, such as production temperature, injection temperature, and the flow rate, have to be set within a certain range. Our laboratory investigation found that elevated temperatures lead to enhanced fluid–rock interactions, causing fracture permeability to change drastically, but such high reaction rates may be conducive to permeability enhancement if mineral dissolution dominates. Slates containing fractures, subjected to time-dependent closure, can possibly be mitigated by controlling injected fluid compositions. On the other hand, precipitation was not observed in our experiments, either due to permanent fluid under-saturation or as a result of the pore fluid exchange during the last permeability measurement before final cooling. This, however, may not be true in the field [13,14]. Dissolved minerals may increase the local permeability, where they dissolved, but may cause permeability reduction in far-field flow owing to precipitation at a large scale. Running an EGS in such metamorphic strata requires an understanding of the long-term evolution of the fractures in the host rocks, to which this study aimed to contribute. How to mitigate any fracture permeability reduction observed here, however, needs to be elucidated further.

5. Conclusions

To evaluate sustainability of fractures within slates, three long-term flow-through experiments with Wissenbach slate samples containing a macroscopic saw-cut fracture were conducted under constant pressures (i.e., Pc = 10 MPa and Pp = 1 MPa) and varying temperatures (room temperature up to 90 °C). Fracture permeability and effluent element concentrations were measured throughout the experiments. The results show that after applying effective pressure, the initial permeability reduction follows a power-law function during continuous flow, but this decrease slows down or terminates when flow is stopped. Temperature cycling causes an irreversible permeability decline when DI is used as the pore fluid, but permeability increases when the pore fluid is a 0.5 M NaCl solution. When fluid flow is intermittent, permeability shows a time-dependent reduction with DI as the permeating fluid, which is more pronounced at 90 °C compared to 70 °C. Again, permeability slightly increases when the sample is saturated with the NaCl solution. Ultimately, all samples yielded a certain and time-dependent permeability reduction. It is demonstrated that fracture permeability evolution in slates is controlled by pressure solution and free-face dissolution. Temperature cycles may affect fracture permeability by thermally enhanced fluid–rock interactions. NaCl accelerates the dissolution kinetics such that pressure solution is faster. However, pressure solution slows down drastically as the driving force (i.e., the normal stress on the contact asperities) decreases with time. The permeability degradation of fractured slates is similar to that of saw-cut granite fractures, which implies that slate reservoirs may be equally suitable for EGS as those in granites. However, for comparable effective pressures, the initial fracture aperture associated with the fracture surface roughness may determine how sensitive the aperture is to fluid–rock interactions in the long term.

Author Contributions

Conceptualization, C.C., J.H., E.R. and H.M.; methodology, C.C. and H.M.; investigation, C.C., J.H., J.A.S., E.R. and H.M.; experiments and measurements, C.C., J.A.S. and B.L.; writing-original draft preparation, C.C., B.W. and H.M.; writing-review and editing, J.H., B.L., J.A.S. and E.R.; supervision, E.R. and H.M. All authors have read and agreed to the published version of the manuscript.

Funding

This research was funded by EU—European Union’s Horizon 2020 research and innovation program (MEET project, grant number: 792037).

Data Availability Statement

All data related to this study can be obtained from the corresponding author upon request.

Acknowledgments

The authors would like to thank Stefan Gehrmann for rock sample preparation, Sabine Tonn for fluid chemistry measurements with ICP-OES, Ilona Schäpan and Valerian Schuster for SEM measurements. Furthermore, Tanja Ballerstedt and Jasper Florian Zimmermann are acknowledged for their assistance with the apparatus preparation and updates. We are also grateful to David Charles Peter Peacock as well as three anonymous reviewers for their thoughtful and constructive comments that helped to improve the manuscript.

Conflicts of Interest

The authors declare no conflict of interest.

Appendix A

Fracture surface topographies before and after the entire experiments are shown below.
Figure A1. Fracture surface topographies and the central profiles of sample SM1 before (a,b) and after (c,d) the entire experiments, where the arrows indicate the flow direction.
Geosciences 11 00443 g0a1
Figure A2. Fracture surface topographies and the central profiles of sample SM2 before (a,b) and after (c,d) the entire experiments, where the arrows indicate the flow direction.
Geosciences 11 00443 g0a2
Figure A3. Fracture surface topographies and the central profiles of sample SM3 before (a,b) and after (c,d) the entire experiments, where the arrows indicate the flow direction.
Geosciences 11 00443 g0a3

References

  1. Jolie, E.; Scott, S.; Faulds, J.; Chambefort, I.; Axelsson, G.; Gutiérrez-Negrín, L.C.; Regenspurg, S.; Ziegler, M.; Ayling, B.; Richter, A. Geological controls on geothermal resources for power generation. Nat. Rev. Earth Environ. 2021, 2, 5. [Google Scholar] [CrossRef]
  2. Huenges, E. Geothermal Energy Systems: Exploration, Development, and Utilization; Wiley-VCH: Weinheim, Germany, 2010; Volume xxii, 463p. [Google Scholar]
  3. Cheng, C.; Milsch, H. Hydromechanical investigations on the self-propping potential of fractures in tight sandstones. Rock Mech. Rock Eng. 2021, 54, 5407–5432. [Google Scholar] [CrossRef]
  4. Hofmann, H.; Blocher, G.; Milsch, H.; Babadagli, T.; Zimmermann, G. Transmissivity of aligned and displaced tensile fractures in granitic rocks during cyclic loading. Int. J. Rock Mech. Min. Sci. 2016, 87, 69–84. [Google Scholar] [CrossRef]
  5. Vogler, D.; Amann, F.; Bayer, P.; Elsworth, D. Permeability evolution in natural fractures subject to cyclic loading and gouge formation. Rock Mech. Rock Eng. 2016, 49, 3463–3479. [Google Scholar] [CrossRef]
  6. Kluge, C.; Blöcher, G.; Barnhoorn, A.; Schmittbuhl, J.; Bruhn, D. Permeability evolution during shear zone initiation in low-porosity rocks. Rock Mech. Rock Eng. 2021, 54, 5221–5244. [Google Scholar] [CrossRef]
  7. Milsch, H.; Hofmann, H.; Blocher, G. An experimental and numerical evaluation of continuous fracture permeability measurements during effective pressure cycles. Int. J. Rock Mech. Min. Sci. 2016, 89, 109–115. [Google Scholar] [CrossRef]
  8. Dobson, P.F.; Kneafsey, T.J.; Nakagawa, S.; Sonnenthal, E.L.; Voltolini, M.; Smith, J.T.; Borglin, S.E. Fracture sustainability in Enhanced Geothermal Systems: Experimental and modeling constraints. J. Energy Res. Technol. 2020, 143, 1–37. [Google Scholar] [CrossRef]
  9. Phillips, T.; Bultreys, T.; Bisdom, K.; Kampman, N.; Van Offenwert, S.; Mascini, A.; Cnudde, V.; Busch, A. A systematic investigation into the control of roughness on the flow properties of 3D-printed fractures. Water Resour. Res. 2021, 57, 4. [Google Scholar] [CrossRef]
  10. Rutter, E.H.; Mecklenburgh, J. Influence of normal and shear stress on the hydraulic transmissivity of thin cracks in a tight quartz sandstone, a granite, and a shale. J. Geophys. Res. Solid Earth 2018, 123, 1262–1285. [Google Scholar] [CrossRef] [Green Version]
  11. Gutierrez, M.; Oino, L.E.; Nygard, R. Stress-dependent permeability of a de-mineralised fracture in shale. Mar. Petrol. Geol. 2000, 17, 895–907. [Google Scholar] [CrossRef]
  12. Durham, W.B.; Bonner, B.P. Self-propping and fluid flow in slightly offset joints at high effective pressures. J. Geophys. Res. 1994, 99, 9391–9399. [Google Scholar] [CrossRef]
  13. Blöcher, G.; Reinsch, T.; Henninges, J.; Milsch, H.; Regenspurg, S.; Kummerow, J.; Francke, H.; Kranz, S.; Saadat, A.; Zimmermann, G.; et al. Hydraulic history and current state of the deep geothermal reservoir Groß Schönebeck. Geothermics 2016, 63, 27–43. [Google Scholar] [CrossRef]
  14. Regenspurg, S.; Feldbusch, E.; Norden, B.; Tichomirowa, M. Fluid-rock interactions in a geothermal Rotliegend/Permo-Carboniferous reservoir (North German Basin). Appl. Geochem. 2016, 69, 12–27. [Google Scholar] [CrossRef]
  15. Polak, A.; Elsworth, D.; Yasuhara, H.; Grader, A.S.; Halleck, P.M. Permeability reduction of a natural fracture under net dissolution by hydrothermal fluids. Geophys. Res. Lett. 2003, 30, 20. [Google Scholar] [CrossRef]
  16. Polak, A.; Elsworth, D.; Liu, J.; Grader, A.S. Spontaneous switching of permeability changes in a limestone fracture with net dissolution. Water Resour. Res. 2004, 40, 40. [Google Scholar] [CrossRef]
  17. Yasuhara, H.; Polak, A.; Mitani, Y.; Grader, A.; Halleck, P.; Elsworth, D. Evolution of fracture permeability through fluid–rock reaction under hydrothermal conditions. Earth Planet. Sci. Lett. 2006, 244, 186–200. [Google Scholar] [CrossRef]
  18. Elkhoury, J.E.; Detwiler, R.L.; Ameli, P. Can a fractured caprock self-heal? Earth Planet. Sci. Lett. 2015, 417, 99–106. [Google Scholar] [CrossRef] [Green Version]
  19. Yasuhara, H.; Kinoshita, N.; Ohfuji, H.; Lee, D.S.; Nakashima, S.; Kishida, K. Temporal alteration of fracture permeability in granite under hydrothermal conditions and its interpretation by coupled chemo-mechanical model. Appl. Geochem. 2011, 26, 2074–2088. [Google Scholar] [CrossRef]
  20. Kamali-Asl, A.; Ghazanfari, E.; Perdrial, N.; Bredice, N. Experimental study of fracture response in granite specimens subjected to hydrothermal conditions relevant for enhanced geothermal systems. Geothermics 2018, 72, 205–224. [Google Scholar] [CrossRef]
  21. Im, K.; Elsworth, D.; Fang, Y. The influence of preslip sealing on the permeability evolution of fractures and faults. Geophys. Res. Lett. 2018, 45, 166–175. [Google Scholar] [CrossRef] [Green Version]
  22. Im, K.; Elsworth, D.; Wang, C. Cyclic permeability evolution during repose then reactivation of fractures and faults. J. Geophys. Res. Solid Earth 2019, 124, 4492–4506. [Google Scholar] [CrossRef]
  23. Yasuhara, H.; Kinoshita, N.; Ohfuji, H.; Takahashi, M.; Ito, K.; Kishida, K. Long-term observation of permeability in sedimentary rocks under high-temperature and stress conditions and its interpretation mediated by microstructural investigations. Water Resour. Res. 2015, 51, 5425–5449. [Google Scholar] [CrossRef] [Green Version]
  24. Cheng, C.; Milsch, H. Evolution of fracture aperture in quartz sandstone under hydrothermal conditions: Mechanical and chemical effects. Minerals 2020, 10, 657. [Google Scholar] [CrossRef]
  25. Moore, D.E.; Lockner, D.A.; Byerlee, J.D. Reduction of permeability in granite at elevated temperatures. Science 1994, 265, 1558–1561. [Google Scholar] [CrossRef] [Green Version]
  26. Morrow, C.A.; Moore, D.E.; Lockner, D.A. Permeability reduction in granite under hydrothermal conditions. J. Geophys. Res. 2001, 106, 30551–30560. [Google Scholar] [CrossRef]
  27. Elsworth, D.; Yasuhara, H. Short-timescale chemo-mechanical effects and their influence on the transport properties of fractured rock. Pure Appl. Geophys. 2006, 163, 2051–2070. [Google Scholar] [CrossRef] [Green Version]
  28. Yasuhara, H.; Elsworth, D. Compaction of a rock fracture moderated by competing roles of stress corrosion and pressure solution. Pure Appl. Geophys. 2008, 165, 1289–1306. [Google Scholar] [CrossRef] [Green Version]
  29. Griffiths, L.; Heap, M.J.; Wang, F.; Daval, D.; Gilg, H.A.; Baud, P.; Schmittbuhl, J.; Genter, A. Geothermal implications for fracture-filling hydrothermal precipitation. Geothermics 2016, 64, 235–245. [Google Scholar] [CrossRef]
  30. Aben, F.; Doan, M.L.; Gratier, J.P.; Renard, F. Experimental postseismic recovery of fractured rocks assisted by calcite sealing. Geophys. Res. Lett. 2017, 44, 7228–7238. [Google Scholar] [CrossRef] [Green Version]
  31. Rutter, E. Pressure solution in nature, theory and experiment. J. Geol. Soc. 1983, 140, 725–740. [Google Scholar] [CrossRef]
  32. Anderson, O.L.; Grew, P.C. Stress corrosion theory of crack propagation with applications to geophysics. Rev. Geophys. 1977, 15, 77–104. [Google Scholar] [CrossRef]
  33. Atkinson, B.K. Subcritical crack growth in geological materials. J. Geophys. Res. 1984, 89, 4077–4114. [Google Scholar] [CrossRef]
  34. Brantut, N.; Heap, M.; Meredith, P.; Baud, P. Time-dependent cracking and brittle creep in crustal rocks: A review. J. Struct. Geol. 2013, 52, 17–43. [Google Scholar] [CrossRef]
  35. Cheng, C.; Milsch, H. Permeability variations in illite-bearing sandstone: Effects of temperature and NaCl fluid salinity. J. Geophys. Res. Solid Earth 2020, 125, 9. [Google Scholar] [CrossRef]
  36. Farough, A.; Moore, D.E.; Lockner, D.A.; Lowell, R. Evolution of fracture permeability of ultramafic rocks undergoing serpentinization at hydrothermal conditions: An experimental study. Geochem. Geophy. Geosyst. 2016, 17, 44–55. [Google Scholar] [CrossRef]
  37. Hilgers, C.; Tenthorey, E. Fracture sealing of quartzite under a temperature gradient: Experimental results. Terra Nova 2004, 16, 173–178. [Google Scholar] [CrossRef]
  38. Sanchez-Roa, C.; Saldi, G.D.; Mitchell, T.M.; Iacoviello, F.; Bailey, J.; Shearing, P.R.; Oelkers, E.H.; Meredith, P.G.; Jones, A.P.; Striolo, A. The role of fluid chemistry on permeability evolution in granite: Applications to natural and anthropogenic systems. Earth Planet. Sci. Lett. 2021, 533, 116641. [Google Scholar] [CrossRef]
  39. Kamali-Asl, A.; Ghazanfari, E.; Perdrial, N.; Cladouhos, T. Effects of injection fluid type on pressure-dependent permeability evolution of fractured rocks in geothermal reservoirs: An experimental chemo-mechanical study. Geothermics 2020, 87, 101832. [Google Scholar] [CrossRef]
  40. Fazeli, H.; Vandeginste, V.; Rabbani, A.; Babaei, M.; Muljadi, B. Pore-scale modeling of fluid–rock chemical interactions in shale during hydraulic fracturing. Energy Fuels 2021, 35, 13. [Google Scholar] [CrossRef]
  41. Farquharson, J.I.; Kushnir, A.R.; Wild, B.; Baud, P. Physical property evolution of granite during experimental chemical stimulation. Geotherm. Energy 2020, 8, 1–24. [Google Scholar] [CrossRef]
  42. Durham, W.B.; Bourcier, W.L.; Burton, E.A. Direct observation of reactive flow in a single fracture. Water Resour. Res. 2001, 37, 1–12. [Google Scholar] [CrossRef] [Green Version]
  43. Lima, M.G.; Vogler, D.; Querci, L.; Madonna, C.; Hattendorf, B.; Saar, M.O.; Kong, X.Z. Thermally driven fracture aperture variation in naturally fractured granites. Geotherm. Energy 2019, 7, 1–28. [Google Scholar] [CrossRef]
  44. Lu, R.; Watanabe, N.; He, W.; Jang, E.; Shao, H.; Kolditz, O.; Shao, H. Calibration of water–granite interaction with pressure solution in a flow-through fracture under confining pressure. Environ. Earth Sci. 2017, 76, 12. [Google Scholar] [CrossRef]
  45. Lu, R.; Nagel, T.; Shao, H.; Kolditz, O.; Shao, H. Modeling of dissolution-induced permeability evolution of a granite fracture under crustal conditions. J. Geophys. Res.-Sol. Earth 2018, 123, 5609–5627. [Google Scholar] [CrossRef]
  46. Dewers, T.; Hajash, A. Rate laws for water-assisted compaction and stress-induced water-rock interaction in sandstones. J. Geophys. Res. 1995, 100, 13093–13112. [Google Scholar] [CrossRef]
  47. Bijay, K.; Ghazanfari, E. Geothermal reservoir stimulation through hydro-shearing: An experimental study under conditions close to enhanced geothermal systems. Geothermics 2021, 96, 102200. [Google Scholar] [CrossRef]
  48. Ishibashi, T.; McGuire, T.P.; Watanabe, N.; Tsuchiya, N.; Elsworth, D. Permeability evolution in carbonate fractures: Competing roles of confining stress and fluid pH. Water Resour. Res. 2013, 49, 2828–2842. [Google Scholar] [CrossRef]
  49. Milsch, H.; Spangenberg, E.; Kulenkampff, J.; Meyhöfer, S. A new apparatus for long-term petrophysical investigations on geothermal reservoir rocks at simulated in-situ conditions. Transp. Porous Med. 2008, 74, 73–85. [Google Scholar] [CrossRef] [Green Version]
  50. Kestin, J.; Sokolov, M.; Wakeham, W.A. Viscosity of liquid water in the range −8 °C to 150 °C. J. Phys. Chem. Ref. Data 1978, 7, 941–948. [Google Scholar] [CrossRef] [Green Version]
  51. Kestin, J.; Khalifa, H.E.; Correia, R.J. Tables of the dynamic and kinematic viscosity of aqueous NaCl solutions in the temperature range 20–150 °C and the pressure range 0.1–35 MPa. J. Phys. Chem. Ref. Data 1981, 10, 71–88. [Google Scholar] [CrossRef]
  52. Witherspoon, P.A.; Wang, J.S.; Iwai, K.; Gale, J.E. Validity of cubic law for fluid flow in a deformable rock fracture. Water Resour. Res. 1980, 16, 1016–1024. [Google Scholar] [CrossRef] [Green Version]
  53. Zimmerman, R.W.; Bodvarsson, G.S. Hydraulic conductivity of rock fractures. Transp. Porous Med. 1996, 23, 1–30. [Google Scholar] [CrossRef] [Green Version]
  54. Gratier, J.P.; Renard, F.; Vial, B. Postseismic pressure solution creep: Evidence and time-dependent change from dynamic indenting experiments. J. Geophys. Res.-Sol. Earth 2014, 119, 2764–2779. [Google Scholar] [CrossRef]
  55. Ouyang, Z.; Elsworth, D. Evaluation of groundwater flow into mined panels. Int. J. Rock Mech. Min. Sci. 1993, 30, 71–79. [Google Scholar] [CrossRef]
  56. You, Z.; Badalyan, A.; Yang, Y.; Bedrikovetsky, P.; Hand, M. Fines migration in geothermal reservoirs: Laboratory and mathematical modelling. Geothermics 2019, 77, 344–367. [Google Scholar] [CrossRef]
  57. Bedrikovetsky, P.; Siqueira, F.D.; Furtado, C.A.; Souza, A.L.S. Modified particle detachment model for colloidal transport in porous media. Transp. Porous Med. 2011, 86, 353–383. [Google Scholar] [CrossRef]
  58. Dove, P.M. The dissolution kinetics of quartz in aqueous mixed cation solutions. Geochim. Cosmochim. Acta 1999, 63, 3715–3727. [Google Scholar] [CrossRef]
  59. Dove, P.M.; Crerar, D.A. Kinetics of quartz dissolution in electrolyte solutions using a hydrothermal mixed flow reactor. Geochim. Cosmochim. Acta 1990, 54, 955–969. [Google Scholar] [CrossRef]
  60. Ruiz-Agudo, E.; Kowacz, M.; Putnis, C.; Putnis, A. The role of background electrolytes on the kinetics and mechanism of calcite dissolution. Geochim. Cosmochim. Acta 2010, 74, 1256–1267. [Google Scholar] [CrossRef]
  61. Moore, D.E.; Morrow, C.; Byerlee, J. Chemical reactions accompanying fluid flow through granite held in a temperature gradient. Geochim. Cosmochim. Acta 1983, 47, 445–453. [Google Scholar] [CrossRef]
  62. Morrow, C.; Lockner, D.; Moore, D.; Byerlee, J. Permeability of granite in a temperature gradient. J. Geophys. Res. 1981, 86, 445–453. [Google Scholar] [CrossRef]
  63. Rimstidt, J.D.; Barnes, H. The kinetics of silica-water reactions. Geochim. Cosmochim. Acta 1980, 44, 1683–1699. [Google Scholar] [CrossRef]
  64. Brantley, S.L. Kinetics of Mineral Dissolution. In Kinetics of Water-Rock Interaction; Springer: New York, NY, USA, 2008; pp. 151–210. [Google Scholar]
Figure 1. Workflow for the long-term flow-through experiments, (a) two halves of prepared slate specimens, (b) the assembled sample jacketed with heat-shrink tubing, and (c) the flow-through apparatus.
Geosciences 11 00443 g001
Figure 2. Fracture permeability determined by continuous flow tests after pressure build-up (Pc: 10 MPa and Pp: 1 MPa) as a function of elapsed time at room temperature. The large fluctuation of SM3 permeability (blue line) between 13 and 27 h is because the upstream pump pressure reached a set limit, and the flow rate was automatically adjusted. Panels at the bottom show measurements after fluid flow was interrupted for certain time intervals.
Geosciences 11 00443 g002
Figure 3. Fracture permeability evolution in stage 1 after pressure build-up (Pc: 10 MPa and Pp: 1 MPa) versus cumulative flow volume. Temperature is 25 °C. Flow rates are indicated.
Geosciences 11 00443 g003
Figure 4. Fracture permeability variations during the temperature cycles between room temperature and up to 90 °C (SM1 and SM3) and 70 °C (SM2) (left panel). The arrows indicate the heating and cooling sequences. All tests started at approximately 25 °C. Details of permeability variations at the respective target temperatures (grey boxes) after first and second heating are shown in the three panels on the right. Sample SM2 was measured twice (No. 1 and No. 2) at 70 °C after first heating within a time interval of 15 h, indicating a time-dependent permeability reduction at constant temperature. After second heating of this sample, the respective permeability value is therefore labelled No. 3. Error bars are in the range of ±2 × 10⁻¹⁴ m2 and hence not visible on the logarithmic y-axis.
Geosciences 11 00443 g004
Figure 5. Time-dependent fracture permeability evolution with intermittent flow at 90 °C (SM1 and SM3) and 70 °C (SM2). Each symbol represents a steady-state permeability measurement. The open symbols indicate permeability measured at room temperature at the beginning and end of the experiments, respectively.
Geosciences 11 00443 g005
Figure 6. Effluent element concentrations of subsamples after the first time interval of 6 days in SM1 (a,b), SM2 (c,d), SM3 (e,f). Peak values indicate fluid composition extracted from the fracture aperture, while the other subsamples include fluid within the capillaries adjacent to the sample. Note the different scales of Na concentrations.
Geosciences 11 00443 g006
Figure 7. Peak effluent element concentrations extracted from each set of subsamples of sample SM1 (a,b), SM2 (c,d), SM3 (e,f), after prescribed time intervals. The data on day zero present the element concentrations of the injected fluid and data on day 1 (for SM1 and SM2) indicate the effluent sampled right after increasing the temperature to the targets. Note the different scales of Na concentrations.
Geosciences 11 00443 g007
Figure 8. Comparison of fracture surface height distribution before and after the experiments, two surfaces (a,b) for sample SM1, (c,d) for sample SM2, (e,f) for sample SM3, respectively..
Geosciences 11 00443 g008
Figure 9. (a) Backscattered electron (BSE) micrograph and (b) EDX map of the fracture surface of sample SM1 after experiments.
Geosciences 11 00443 g009
Figure 10. Scanning electron (SE) micrographs of the fracture surface of sample SM2 (a,b) and sample SM3 (c,d) after the experiments.
Geosciences 11 00443 g010
Figure 11. Sample permeability (Equation (1)) variations with time under constant pressure (Pc: 10 MPa and Pp: 1 MPa) and room temperature conditions. Fitting curves (in green) are derived based on Equation (10).
Geosciences 11 00443 g011
Figure 12. Measured and calculated (with Equation (7)) aperture change with time in log-log plot (a), where all parameters are derived based on the fitting curves in Figure 11, and (b) fracture aperture change rate as a function of time.
Geosciences 11 00443 g012
Figure 13. PPotential fluid—rock interactions occurring during the long-term experiments and their effects on fracture permeability and fracture deformation. (a) Stress corrosion cracking, (b) pressure solution, (c) dissolution, (d) precipitation, and (e) fines migration, in which both (b,c) involve dissolution of solid matter into a fluid phase, where the former is taking place within the contact area of stressed asperities and the latter occurs on the free faces of the mineral grains.
Geosciences 11 00443 g013
Table 1. Mineral composition of slate samples.
Mineral Content
(wt %)
QuartzMuscoviteChloritePlagioclaseChalcociteAnkeritePyrite
SM13633128551
SM23635118541
Table 2. Experimental conditions.
SampleTemperature (°C)Flow Rate a (mL/min)Flow TypeDuration b (Days)Permeant Fluid
SM1Room temperature0.3~0.5Continuous~3DI
25 → 50 → 70 → 90 → 70 → 50 → 32 → 900.3~0.5Intermittent3
900.05~0.3Intermittent34
SM2Room temperature0.3~0.5Continuous<1DI
25 → 50 → 70 → 50 → 32 → 700.3~0.5Intermittent3
700.1~0.3Intermittent34
SM3Room temperature0.02~0.3Continuous~30.5 M NaCl
25 → 50 → 70 → 90 → 70 → 50 → 32 → 900.02~0.1Intermittent3
900.1Intermittent34
a Flow rate used for permeability measurements, the flow rate during effluent sampling is always Q = 0.1 mL/min. b Elapsed time during the corresponding stages.
Table 3. Summary of experimental results.
SampleMax T (°C)kf (Initial) (10−12 m2)kf (Final) (10−12 m2)Duration (Days)Fluid
SM1904.761.0240DI
SM2704.982.6638DI
SM3903.492.01400.5 M NaCl
Table 4. Statistical parameters of fracture surface roughness before and after the flow-through experiments.
ParametersSM1_ASM1_BSM2_ASM2_BSM3_ASM3_BStage
Rp (µm)41.1851.0878.1380.9724.00119.26Before
65.4570.9878.57116.8052.96106.55After
Rm (µm)2.351.8210.991.461.5610.31Before
3.521.7810.693.471.989.12After
Rrms (µm)3.002.4114.312.162.0517.94Before
4.332.4413.694.932.6016.27After
Table 5. Fitting parameters.
Samplek0α/b0nAdjusted R2
SM11.95 × 10−157.3 × 10−20.430.99
SM22.0 × 10−154.5 × 10−20.610.99
SM31.13 × 10−140.60.0720.98
Publisher’s Note: MDPI stays neutral with regard to jurisdictional claims in published maps and institutional affiliations.

