1. Introduction
In the scientific literature, especially from the USA, debris flows following a wildfire are widely studied and documented. In the USA, debris flow early warning systems (DFEWSs), which take into account wildfires, have been developed and applied for civil protection purposes from many years through the identification of recurring factors that link the occurrence of debris flow in areas affected by wildfires, analyzing the variations in soil permeability induced by these fires’ action [
1,
2,
3,
4,
5,
6,
7,
8,
9,
10,
11,
12,
13,
14].
Contrarily, a correlation between wildfires and the occurrence of debris flows has been rarely observed or analyzed in Italy [
15,
16,
17,
18].
The northeastern part of Italy is no exception, having only two documented historical debris flow events between 1725 and 2020 for which wildfires were certainly a predisposing factor.
The rarity of the occurrence of this phenomenon has represented a problem for the prediction of debris flows by the DFEWS adopted in the northwestern Italian Alps, Piemonte (northwestern Italy).
In fact, the recent debris flow events of 2005 and 2019 were not predicted by DFEWS (the 2005 event was missed in back-analysis simulation), occurred, respectively, along the Rio Casella (Verbania province in 2005) and in the Rio delle Foglie catchments (in 2019 in Torino province) after they each had been beset by wildfires in preceding months.
Furthermore, these catchments were not considered capable of generating debris flow phenomena, based on their outcropping bedrock percentage-thresholds and according to Tiranti et al. [
19]. De facto, a debris flow event has never been observed in these catchments, before those reported in this paper, as case history.
The DFEWS, called DEFENSE (DEbris Flows triggEred by Storms-nowcasting systEm) proposed by Tiranti et al. [
20], which has been operating in Piemonte since 2010, is based on the clay weathering index (CWI) classification of alpine catchments [
20,
21,
22] and on the outcropping bedrock percentage-thresholds [
19], and predicts the initiation of debris flows with use of storm tracking by weather radar, both in real-time and nowcasting (one hour forecast). The rainfall-thresholds used by the DEFENSE are based on hourly rainfall intensity (mm/h) and they are different for each type of catchment, as identified by CWI class.
To understand the correlation between wildfires and the occurrences of debris flows, we have conducted analyses to characterize the changes in catchments’ conditions before and after wildfires.
The curve number method has been adopted to estimate hydrological variations before and after wildfires, to qualify catchments’ change in response to rainfall effects. Rainfall analyses, using both data from raingauges with 1-min acquisition time and weather radars estimations to identify the real rainfall field distribution, are presented.
1.1. The Study Areas: Rio Casella and Rio Delle Foglie Catchments
Rio Casella and Rio delle Foglie are two small catchments of 1.64 km
2 and 1.37 km
2 respectively, in the Western Italian Alps (Piemonte, Italy), within the municipality of Pallanzeno in Verbania province and of Bussoleno in Turin province (
Figure 1), again, respectively. Both catchments are characterized by steep slopes and are densely vegetated.
From our analysis of historical debris flow events, no reports of further significant past phenomena are known for the Rio Casella and Rio delle Foglie catchments.
1.1.1. Rio Casella Rainfall Event on 18 July 2005
On 18 July 2005, a brief and localized rainfall of moderate intensity involving the Rio Casella catchment causing a debris flow (
Figure 2). Rainfall values have been recorded by “Fomarco” raingauge (252 m asl) closest to the catchment and located in the municipality of Pieve Vergonte in the province of Verbania (
Figure 3).
Debris flow deposits accumulated during the event (
Figure 2) were characterized by an unusually large amount of fine-grained sediments not expected for this type of catchment, classified as Bad Clay Maker according to Tiranti et al. [
20,
21,
22]. In addition, dark-brown mud-rich deposits have also been observed below the coarse sediments associated with burnt wood.
The catchment of Rio Casella was affected in March 2005 by a wildfire that involved about 1 km
2 of catchment area (
Figure 3), corresponding to 60% of the entire surface drained by Rio Casella. The surface wildfire of high moderate-intensity [
23,
24,
25] affecting the shrub vegetation and the ground roots of the arboreal vegetation leading to the generation of a few centimeters thick layer formed by burnt vegetation and fine sediments (clayey silt and fine sands) as result of thermal reworking of the soil shallow horizon by high and prolonged temperatures.
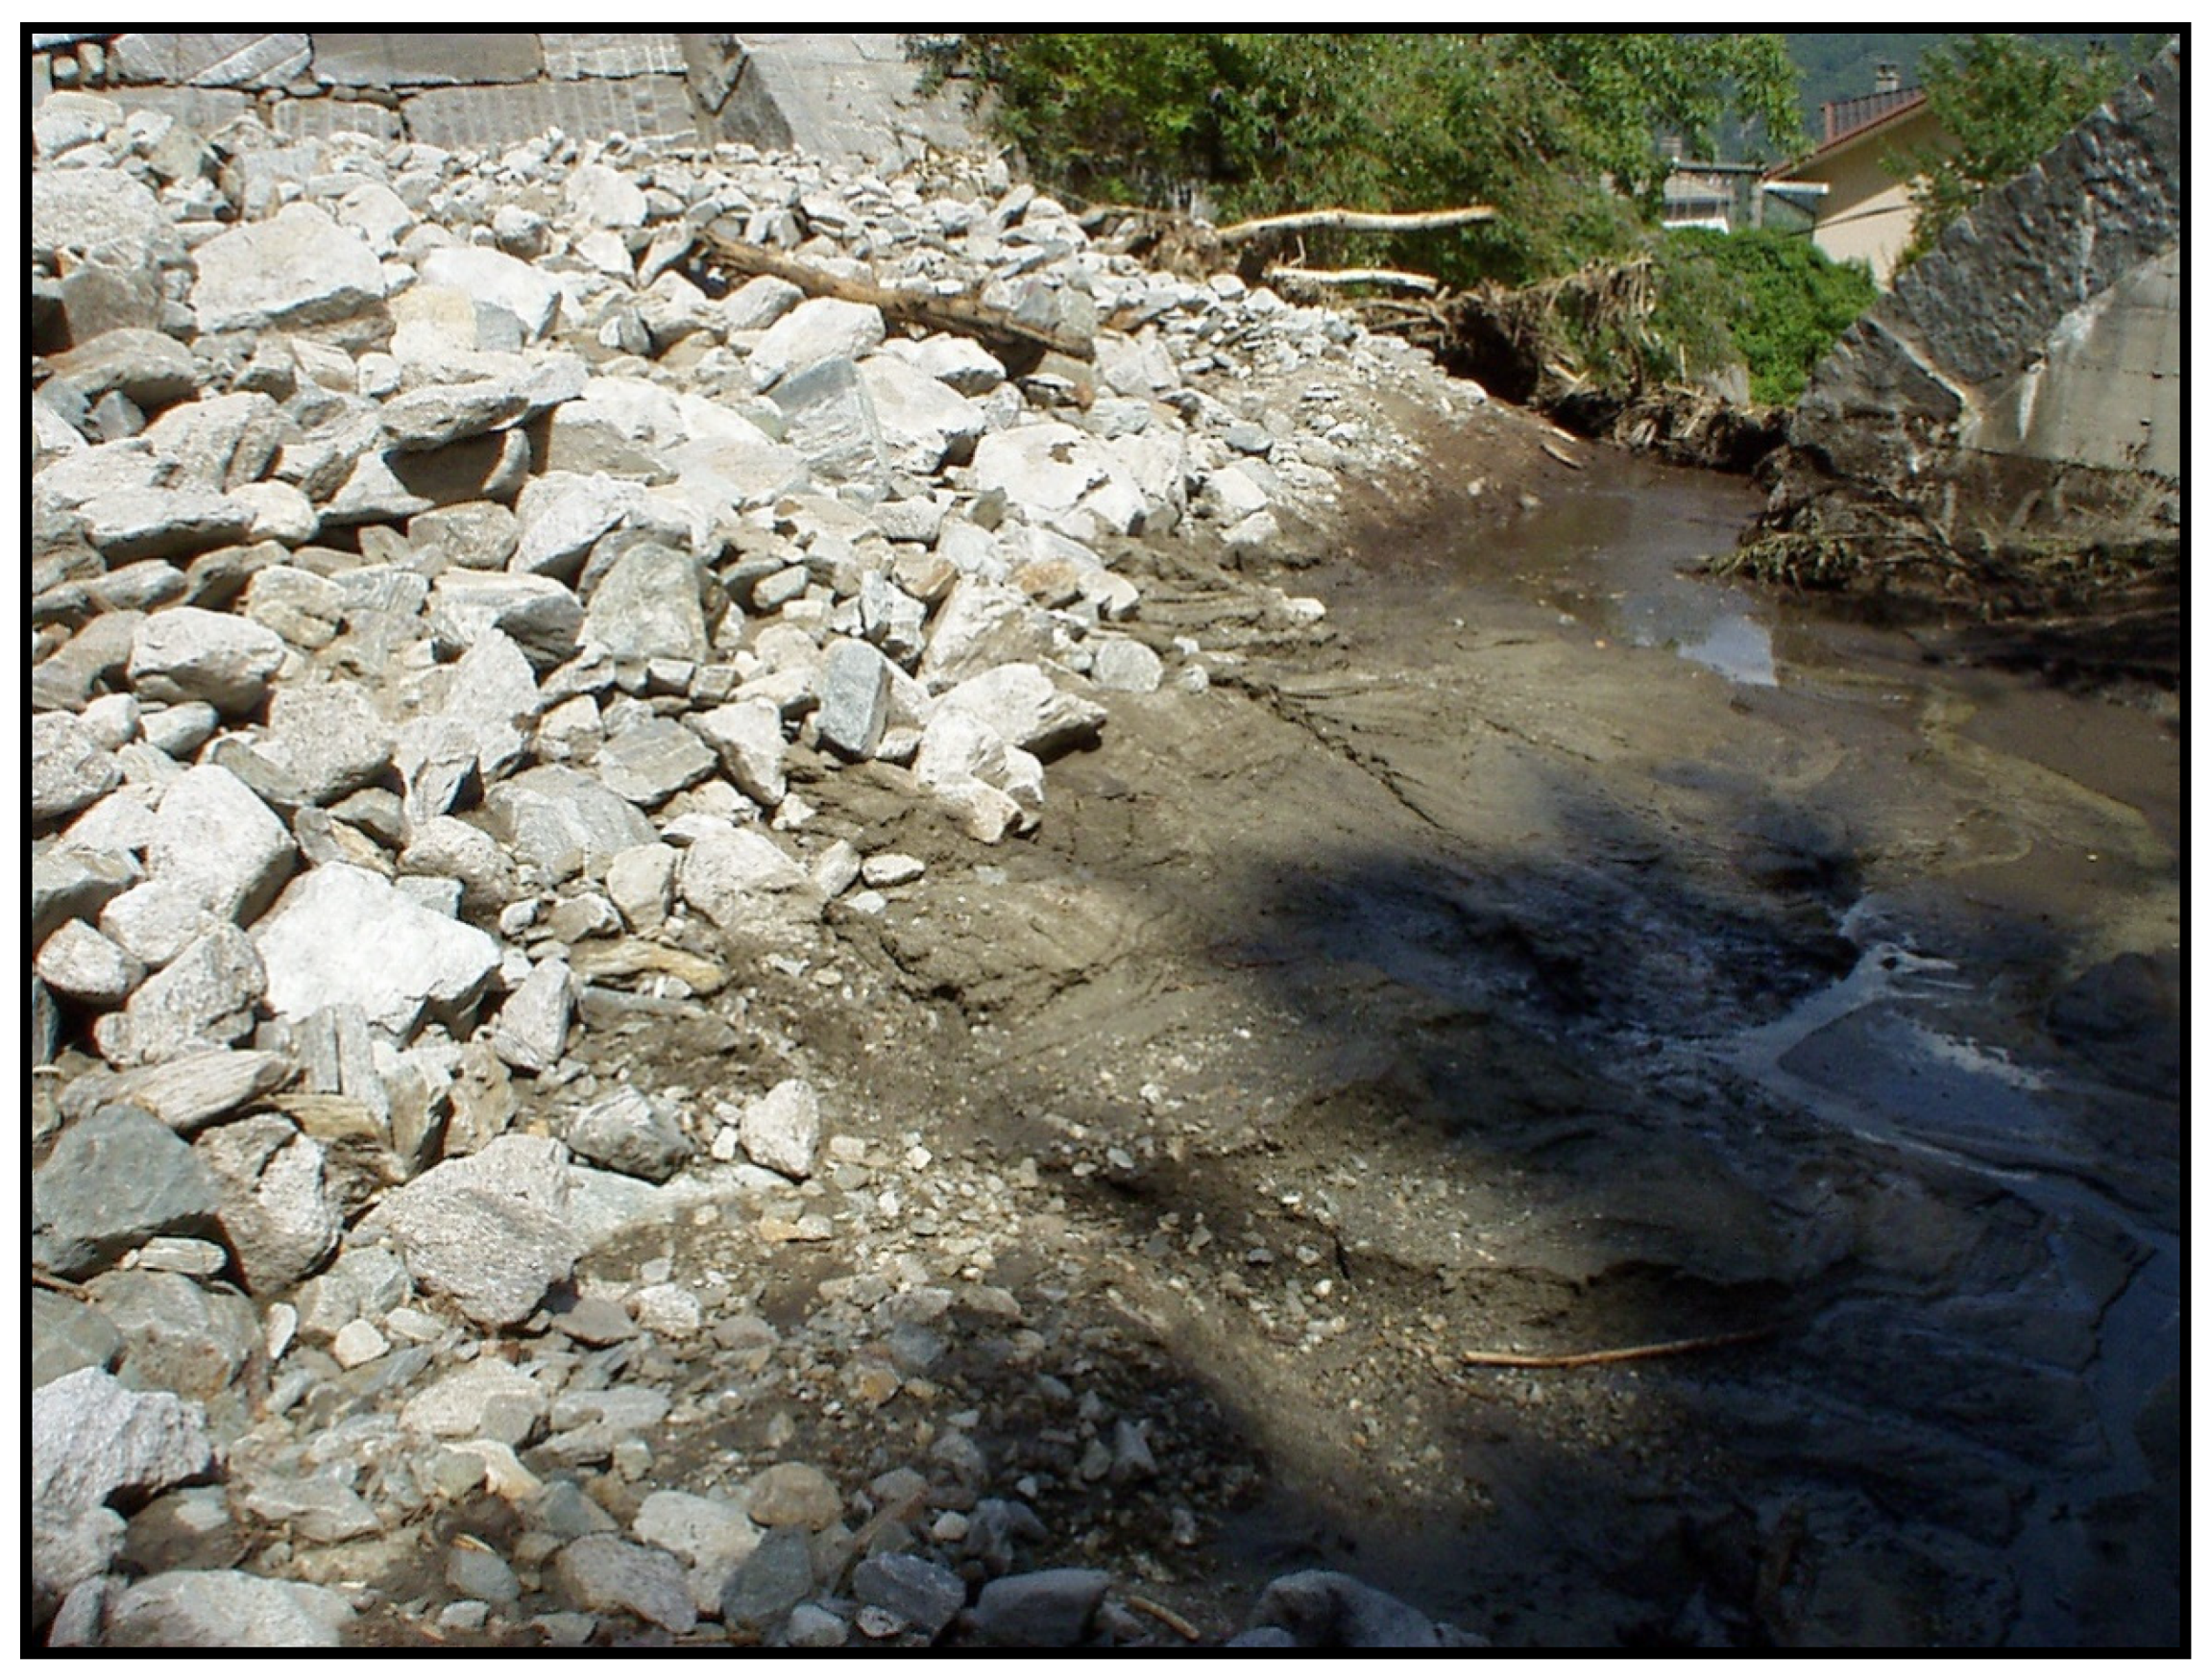
Post-debris flow event field observations led to the identification of a sedimentary processes attributable to the rainfall event on 18 July 2005, and at least one or more mud flow events attributable to rainfall events occurred during the preceding months. Indeed, what has been observed in the first instance consist in a deposit mainly formed by coarse grain-sizes sediments (from gravels to blocks), about three meters thick in the middle sector of the deposit and subordinated levee deposits formed by block and gravel in a brown clayey silt matrix with clast-supported texture. That deposits rest on brown fine sediments (from clayey silt to coarse sands) (
Figure 4).
March–June 2005 rainfall events triggered some small mud flows responsible for brown fine sediments deposition. The rainfall winnowing effect was responsible for the complete mobilization of the burned material from slopes [
26,
27,
28].
1.1.2. Rio Delle Foglie Rainfall Event on 7 June 2018
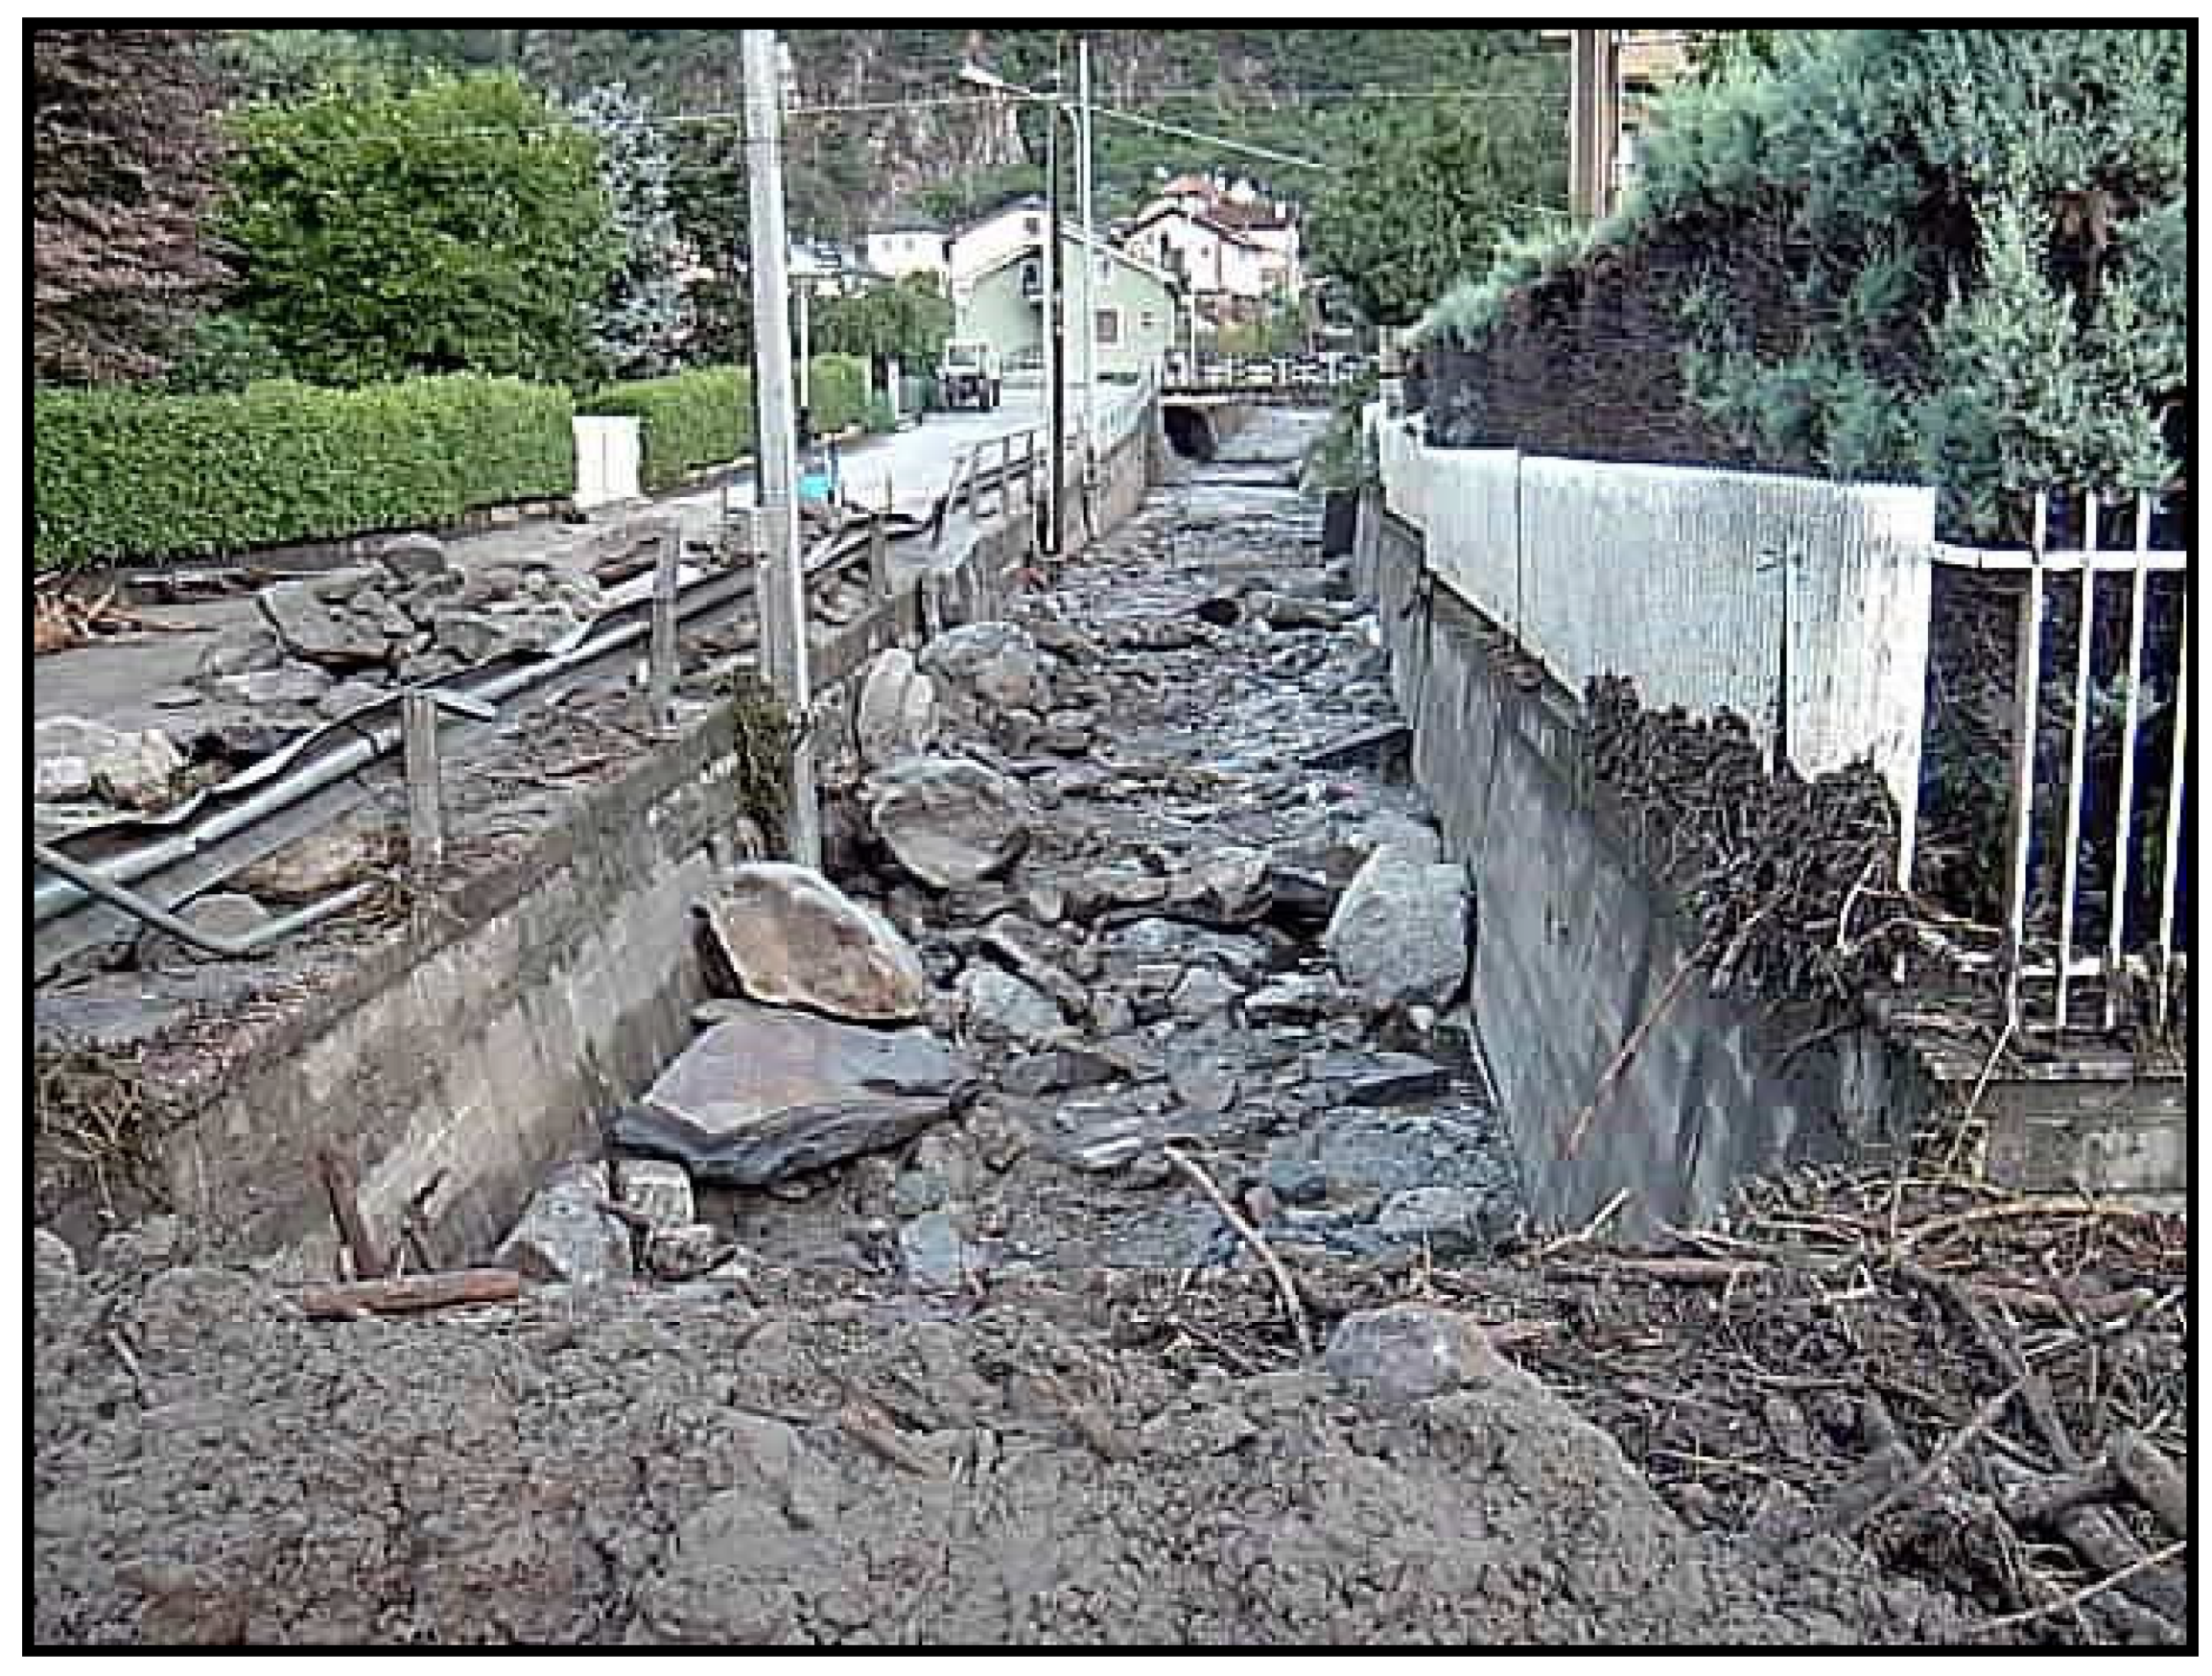
On 7 June 2018, a short and intense rainfall affected the Rio delle Foglie catchment causing the activation of a muddy-debris flow with high percentage of burnt wood material reached the alluvial fan area. The phenomenon affected part of the built-up area that rises on the alluvial fan and reached the railway underpass. Some of the houses closest to the alluvial fan apex area were severely damaged, while several other buildings suffered widespread rich-sediment flooding (
Figure 5).
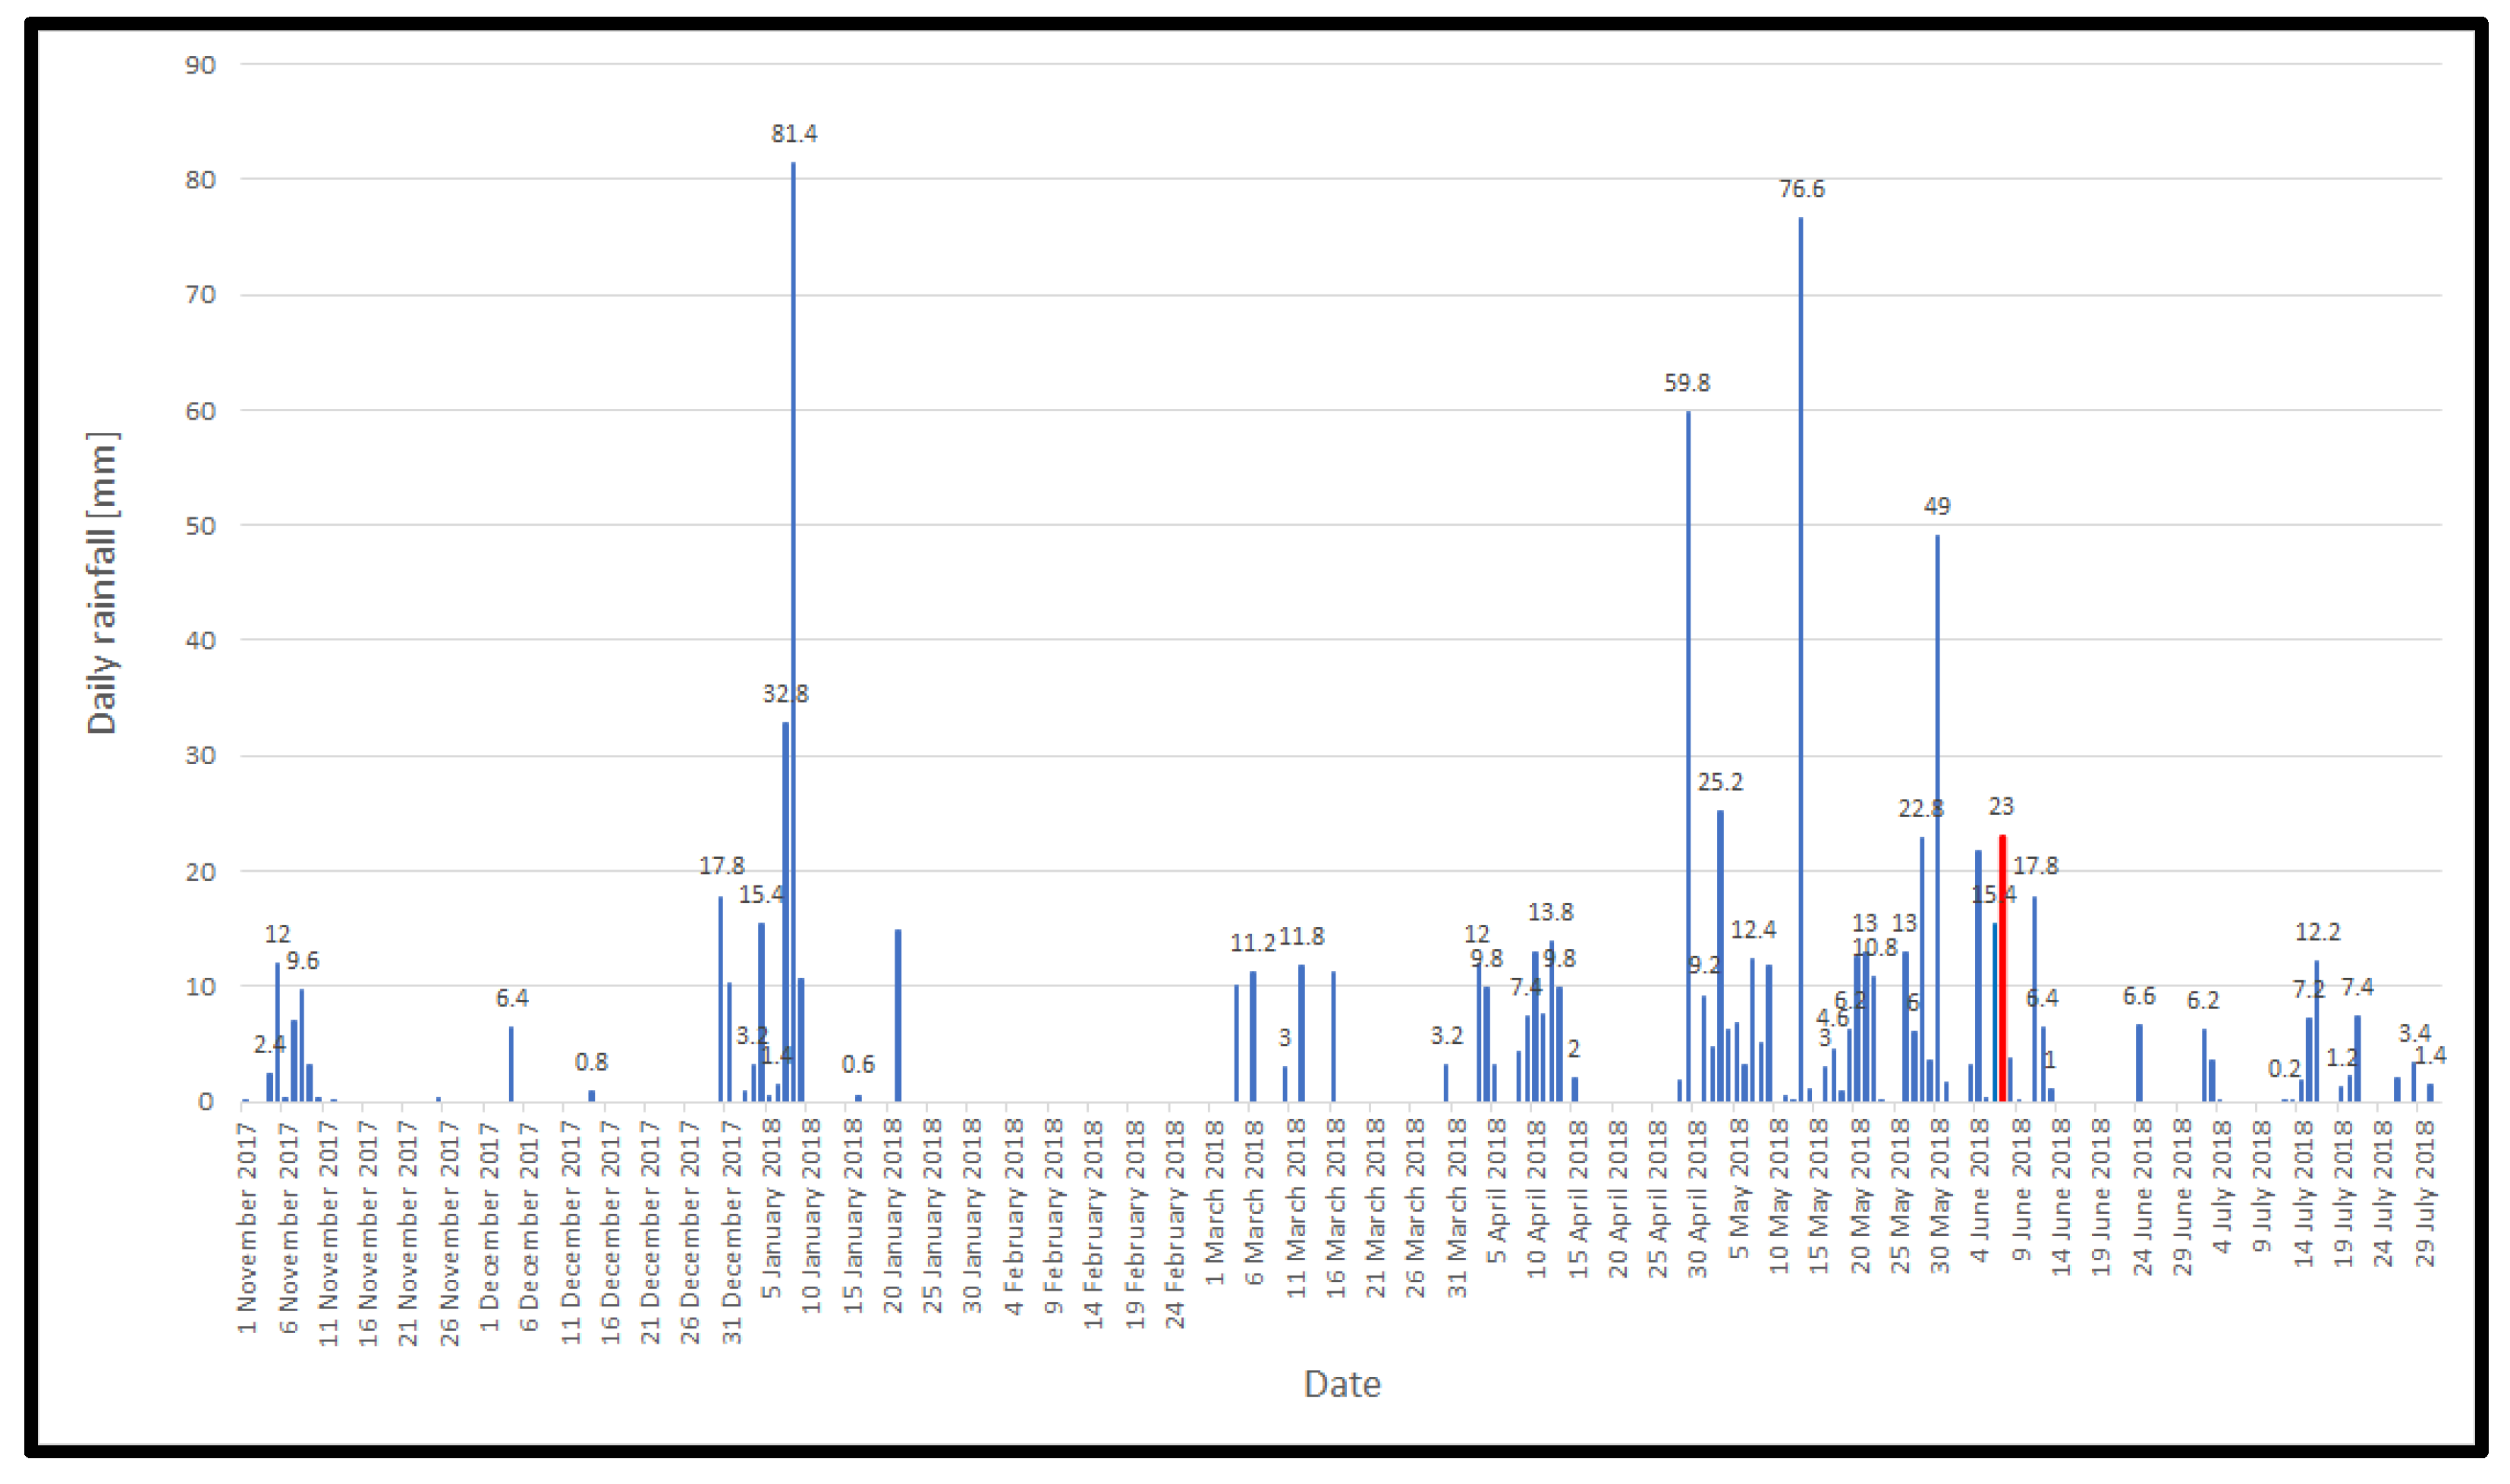
During preceding months, smaller floods caused by widespread rainstorms affected the catchment. The most significant events were recorded by nearest raingauge (Prarotto raingauge) (
Figure 6) on 29 April, 2 May, 9 May, and 13 May 2018, when several roads were damaged by mud flows following rainstorms. On the contrary, the event on 9 May 2018 consisted mainly in a water flow with modest transport of solid material. The catchment was largely affected by a wildfire in fall (
Figure 6). The fire intensity [
23,
24,
25] has been classified as medium-high in the upper part of the catchment and low in the lower-median section.
2. Materials and Methods
To understand the role of wildfires in predisposing debris flow occurrence, especially for catchments never involved by that phenomenon before, and to refine the DFEWS performances some different methodologies have been integrated.
Starting from the CWI classification of small Alpine catchments and the outcropping bedrock threshold to estimate the likely torrential processes that can occur in a catchment, a quick and easy approach to be applied on regional scale was adopted to understand how the catchments’ hydrological conditions can change following a wildfire, and, how these changes influence the debris flow initiation. This approach consists in assigning the CN value to the geological (rocks and deposits) and land use units within a catchment; subsequently, the assigned CN values are modified where these units have been affected by a wildfire.
Moreover, to quantify the triggering causes and to evaluate the response of catchments, raingauges and weather radars have been used to determinate rainfall events’ intensity and distribution.
2.1. Catchments’ Classification
Recently, a classification of the Alpine catchments in three typologies has been proposed starting from the dominant lithology forming bedrocks [
20,
21,
22]. This classification based on the clay weathering index (CWI) distinguishes the catchments by their dominant lithology as follows:
(1) Excellent Clay Maker (ECM) class: identifies catchments having bedrock formed by finely foliated fine-grained metamorphic rocks (e.g., calcschists, black shales, phyllades);
(2) Good Clay Maker (GCM) class: identifies catchments having bedrock formed by massive and/or coarsely stratified carbonate rocks (e.g., dolostones, limestones, marbles);
(3) Bad Clay Maker (BCM) class: identifies catchments having bedrock formed by massive and/or coarse-grained crystalline rocks (e.g., granitoids, gneisses, ophiolites).
The nature of the catchment’s bedrock influences the flow rheology, the sedimentary processes, the depositional styles of debris flow, the architecture of the alluvial fan, the frequency, and the mainly seasonality of debris flows’ occurrence. This classification includes the initiation conditions as a classification parameter and distinguishes for each basin class the type of precipitation that can initiate a debris flow.
Based on the propension of a lithofacies to produce clay, clayey silt or clay-like minerals which will constitute the fine fraction of loose material available for mobilization, there will be mass transport processes characterized by different rheology that will drive their initiation, propagation and deposition. The ECM and GCM catchments can yield from abundant to discrete amount of clay, clayey silt, or clay-like minerals, from which derives a viscoplastic behavior (cohesive) of debris flows. They debris flow’s rainfall triggering thresholds are respectively of 20 mm/h and 30 mm/h. Whereas BCM catchments produce negligible amounts of these sediment fine fraction, hence a collisional-frictional behavior (non-cohesive) of debris flows, with a rainfall triggering threshold of 50 mm/h.
In addition, depending on the catchments’ bedrock outcropping density (factor opposite to the extent of the vegetation cover), it is possible to distinguish the type of torrential process most likely to occur [
19]: water flows (flooding) could happen if outcropping bedrock is greater than 10%; hyperconcentrated flows (also called debris floods) become more likely if outcropping bedrock is greater than 20%; debris flows become highly probable if outcropping bedrock is greater than 59%.
Those classifications have been applied to 2100 Alpine catchments of Piemonte and they represent the theoretical basses of the regional DFEWS.
2.2. Curve Number Method
Curve Number is commonly used to provide an indication of a soil’s ability to retain water. In this paper it was applied to understand the changes of soil permeability due to its simple applicability on high number of catchments (2100 catchments).
The Curve Number is an empirical parameter used in the hydrological field to estimate in a quick way the slope runoff following a rainfall. SCS Runoff Curve Number method is developed by the United States Department of Agriculture (USDA) Soil Conservation Service (SCS) and allows to estimate the effective rain (this term refers to the precipitation fraction composing the direct outflow, mainly given by the surface outflow and the fastest sub-surface outflow component) using only one parameter “S” which represents the potential maximum water retention after runoff begins [
29]. The relationship between total rain and effective rain is represented by a family of parametric curves. The curves can be represented by the following equation [
30]:
The CN corresponds to the curve number, while the coefficient 25.4 is still linked to the original formulation in imperial units.
The obtained CN, a valid indicator of the runoff capacity of a soil [
31], is represented by a number between 0 and 100, where at 0 there is no production of runoff, while at 100 the entire precipitation turns into runoff. Indeed, extremes are difficult to reach, commonly the CN varies from 15 to values close to 100.
2.3. The Rainfall Monitoring System
Regional Agency for Environmental Protection of Piemonte (Arpa Piemonte) operates a dense automatic hydrological and meteorological network made by more than 370 weather stations. The rainfall is measured by tipping-bucket automatic raingauges with 0.2 mm resolution and 1 min time resolution. Data are collected by radio link data transmission and stored in a database. Regular maintenance to raingauges is performed and a real time automatic validation process is applied to the received data to detect anomalous values. Manned validation of data is performed to detect anomalies and to calculate daily rainfall values. For the aim of this study, the closest raingauges with the comparable elevation and position (falling on the same side of the watershed) respect to the catchments investigated were selected. Rainfall data recorded by “Fomarco” (for Rio Casella) and “Prarotto” (for Rio delle Foglie) raingauges have been analyzed at daily, hourly, and sub-hourly time-resolution considering intensity and accumulated values.
The continuous surveillance of the territory in the northwestern region of Italy is operated by Arpa Piemonte, which manages two Doppler polarimetric C-band weather radars, located at Bric della Croce (Torino Hill, Turin) hill and at Monte Settepani (Ligurian Apennines, Savona) (
Figure 7).
The Bric della Croce weather radar is located on the hills near Turin, at 736 m asl. It is placed on the top of a 33 m tower and covers the Piemonte region. There are no obstacles on the east side of the radar domain that may block the radar beam, while, on the western side of the radar domain, the visibility is limited by the Alps and, on the southern side, by the Apennines. The radar performs a full volume scans every five minutes. The complete scan is made of eleven elevations between −0.1 and 28.5 degrees. Each measurement is the result of the integration of about 50 pulses for each polarization. The range of the volume scan is 170 km and the range resolution is 340 m. The angular resolution is one degree. Bric della Croce radar operates in dual-PRF mode to mitigate the radar dilemma, with frequencies of 882 and 588 Hz.
The second C-band weather radar is located on the top of Monte Settepani peak at 1386 m asl, near Savona, in the Ligurian Apennines. Monte Settepani radar has an excellent visibility in the north and east sectors, corresponding to the Po valley and the mountain areas of Piemonte. Monte Settepani radar performs a volume scan every ten minutes. The volume scan is polarimetric and the acquired parameters are the same as for the Bric della Croce radar. The volumetric scan is composed by seven elevations between −0.3 and 14.9 degrees. The range is 136 km and the range resolution is 375 m, using short pulses of 0.5 μs and PRF of 1090 Hz.
To limit the effect of beam height respect to the ground, during winter season the radar reflectivity is corrected for vertical profile reflectivity (VPR) according to Koistinen [
32]. Single radar rainfall estimations from lowest beam are merged in 800 m × 800 m resolution composite considering maximum reflectivity, where more than one observation is available. Finally, composite radar reflectivity is converted in instantaneous rainfall intensity (mm/h) according to the well-known Z-R relationship:
where Z is the linear weather radar reflectivity expressed in mm/m
3, R is rainfall intensity in mm/h and a = 300 and b = 1.5 are coefficients experimentally derived [
33]. Further details on Piemonte weather radar and data processing can be found in Cremonini and Bechini [
34].
2.4. Remotesensing Observations and Data
In 2000, the European Commission Joint Research Centre and DG Environment established the European Forest Fire Information System (EFFIS) which is operating to provide the European institutions and citizens with near real time harmonized information on forest fires and their effects, to facilitate international collaboration in forest fire prevention and fighting. EFFIS is component of the Copernicus Emergency Management Services (
https://emergency.copernicus.eu/ (accessed on 14 August 2021).
Near-real time applications such as active fire detection and rapid damage assessment make use of data provided by the MODIS sensor, on board of the NASA TERRA and AQUA satellites for the detection of active fires and the mapping of burnt areas; two full mosaics of Europe are processed daily, providing information on burnt areas produced by wildfires. EFFIS provides the daily update of the perimeters of burnt areas in Europe for fires of about 30 ha or larger, twice every day. Hence, small burnt or un-burnt areas below the spatial resolution of the MODIS imagery are not mapped, including small, unburned islands inside the burnt area.
3. Results
The bedrock of the Rio Casella catchment consists in prevalent massive metamorphic rocks of the “Series of Gneissic Missives” formed mainly by minute gneisses, kinzigites, micaschists, metabasites, and subordinate white silicate marbles (
Figure 8). According to the CWI classification, this lithological setting would make the Rio Casella primarily characterized by non-cohesive debris flow processes, falling in the Bed Clay Maker (BCM) CWI class.
The Rio delle Foglie bedrock is formed by the Dora-Maira units, by the units of the carbonate metasedimentary cover consisting of marble and subordinate carbonate calc-schists (
Figure 9). Based on the dominant lithology forming the catchment bedrock (massive carbonate rocks), the basin is classified as Good Clay Maker (GCM) in accordance with the CWI classification.
The outcropping bedrock percentages of the two catchments derived from field survey and subsequently calculated in GIS environment were
In the case of Rio Casella, the outcropping bedrock percentage was of about 5.83%, for a catchment area of 0.09 km2;
In the case of Rio delle Foglie, the outcropping bedrock percentage was of about 1.68%, for a catchment area of 0.02 km2.
The areas affected by the wildfire were calculated obtaining the following results:
Wildfire affected a total area of 3.47 km
2 of which about 1 km
2 of the Rio Casella catchment (60.16%) was affected by the wildfire (
Figure 10).
The 2017 wildfire affected the Rio delle Foglie was of considerable extension with an area of 39.75 km
2. The catchment was almost entirely involved by wildfire for a total burned area of 1.34 km
2, equivalent to 97.45% (
Figure 11).
3.1. Catchments CN Pre End Post-Wildfires
To obtain the CN for the two case studies, the catchments were divided in four hydrological groups, based on outcropping bedrock and deposits forming the catchments. This reclassification is necessary to obtain information on soil permeability and therefore the parameter (S). It should be noted that this procedure is very simplified, as the realization of maps of real permeability would have required a considerable number of field measurements not compatible with the application scale of this study. The resulting four hydrological groups are the following:
A—high permeability, low runoff capacity, soils with high infiltration even if fully saturated, sand or gravel deep and well drained, considerable water conductivity;
B—medium-high permeability, soils with moderate infiltration if saturated, fairly drained and deep, medium-coarse texture, medium water conductivity;
C—medium-low permeability, soils with low infiltration if saturated, a layer prevents percolation vertically, soils with medium-fine texture and low infiltration, low water conductivity;
D—low permeability, high runoff capacity, soils with very low infiltration on saturation conditions, soils rich in swollen clay, soils with superficial clayey layer, shallow soils on impermeable substrate. Very low water conductivity.
For the two case studies, the reports in
Table 1 were used to assign a hydrological group to each catchment.
The hydrological groups thus identified were subsequently crossed with the land use units, to obtain the corresponding CN value (
Table 2).
In both cases, during the pre-wildfire phase, most of the catchment surface was characterized by hydrological group “B” (extensive and prevalent colluvial coverage), with a medium-high permeability.
The classification by hydrological groups was also applied in the post-wildfire events, considering the burnt colluvial cover areas assimilable to outcropping bedrock-like permeability due to the formation of hydrophobic soil surfaces [
36,
37,
38,
39] and therefore changing the hydrological class accordingly. Thus, the burnt areas have been reclassified in hydrological class “D” characterized by low permeability and high runoff capacity (like a bedrock).
Cross-referencing the hydrological group data with the land use units, as shown in
Table 2, the following results were obtained:
Rio Casella catchment: in the pre-wildfire the average CN was 37.3. After the wildfire CN average value increased to 70.5, for a total variation of 33.2;
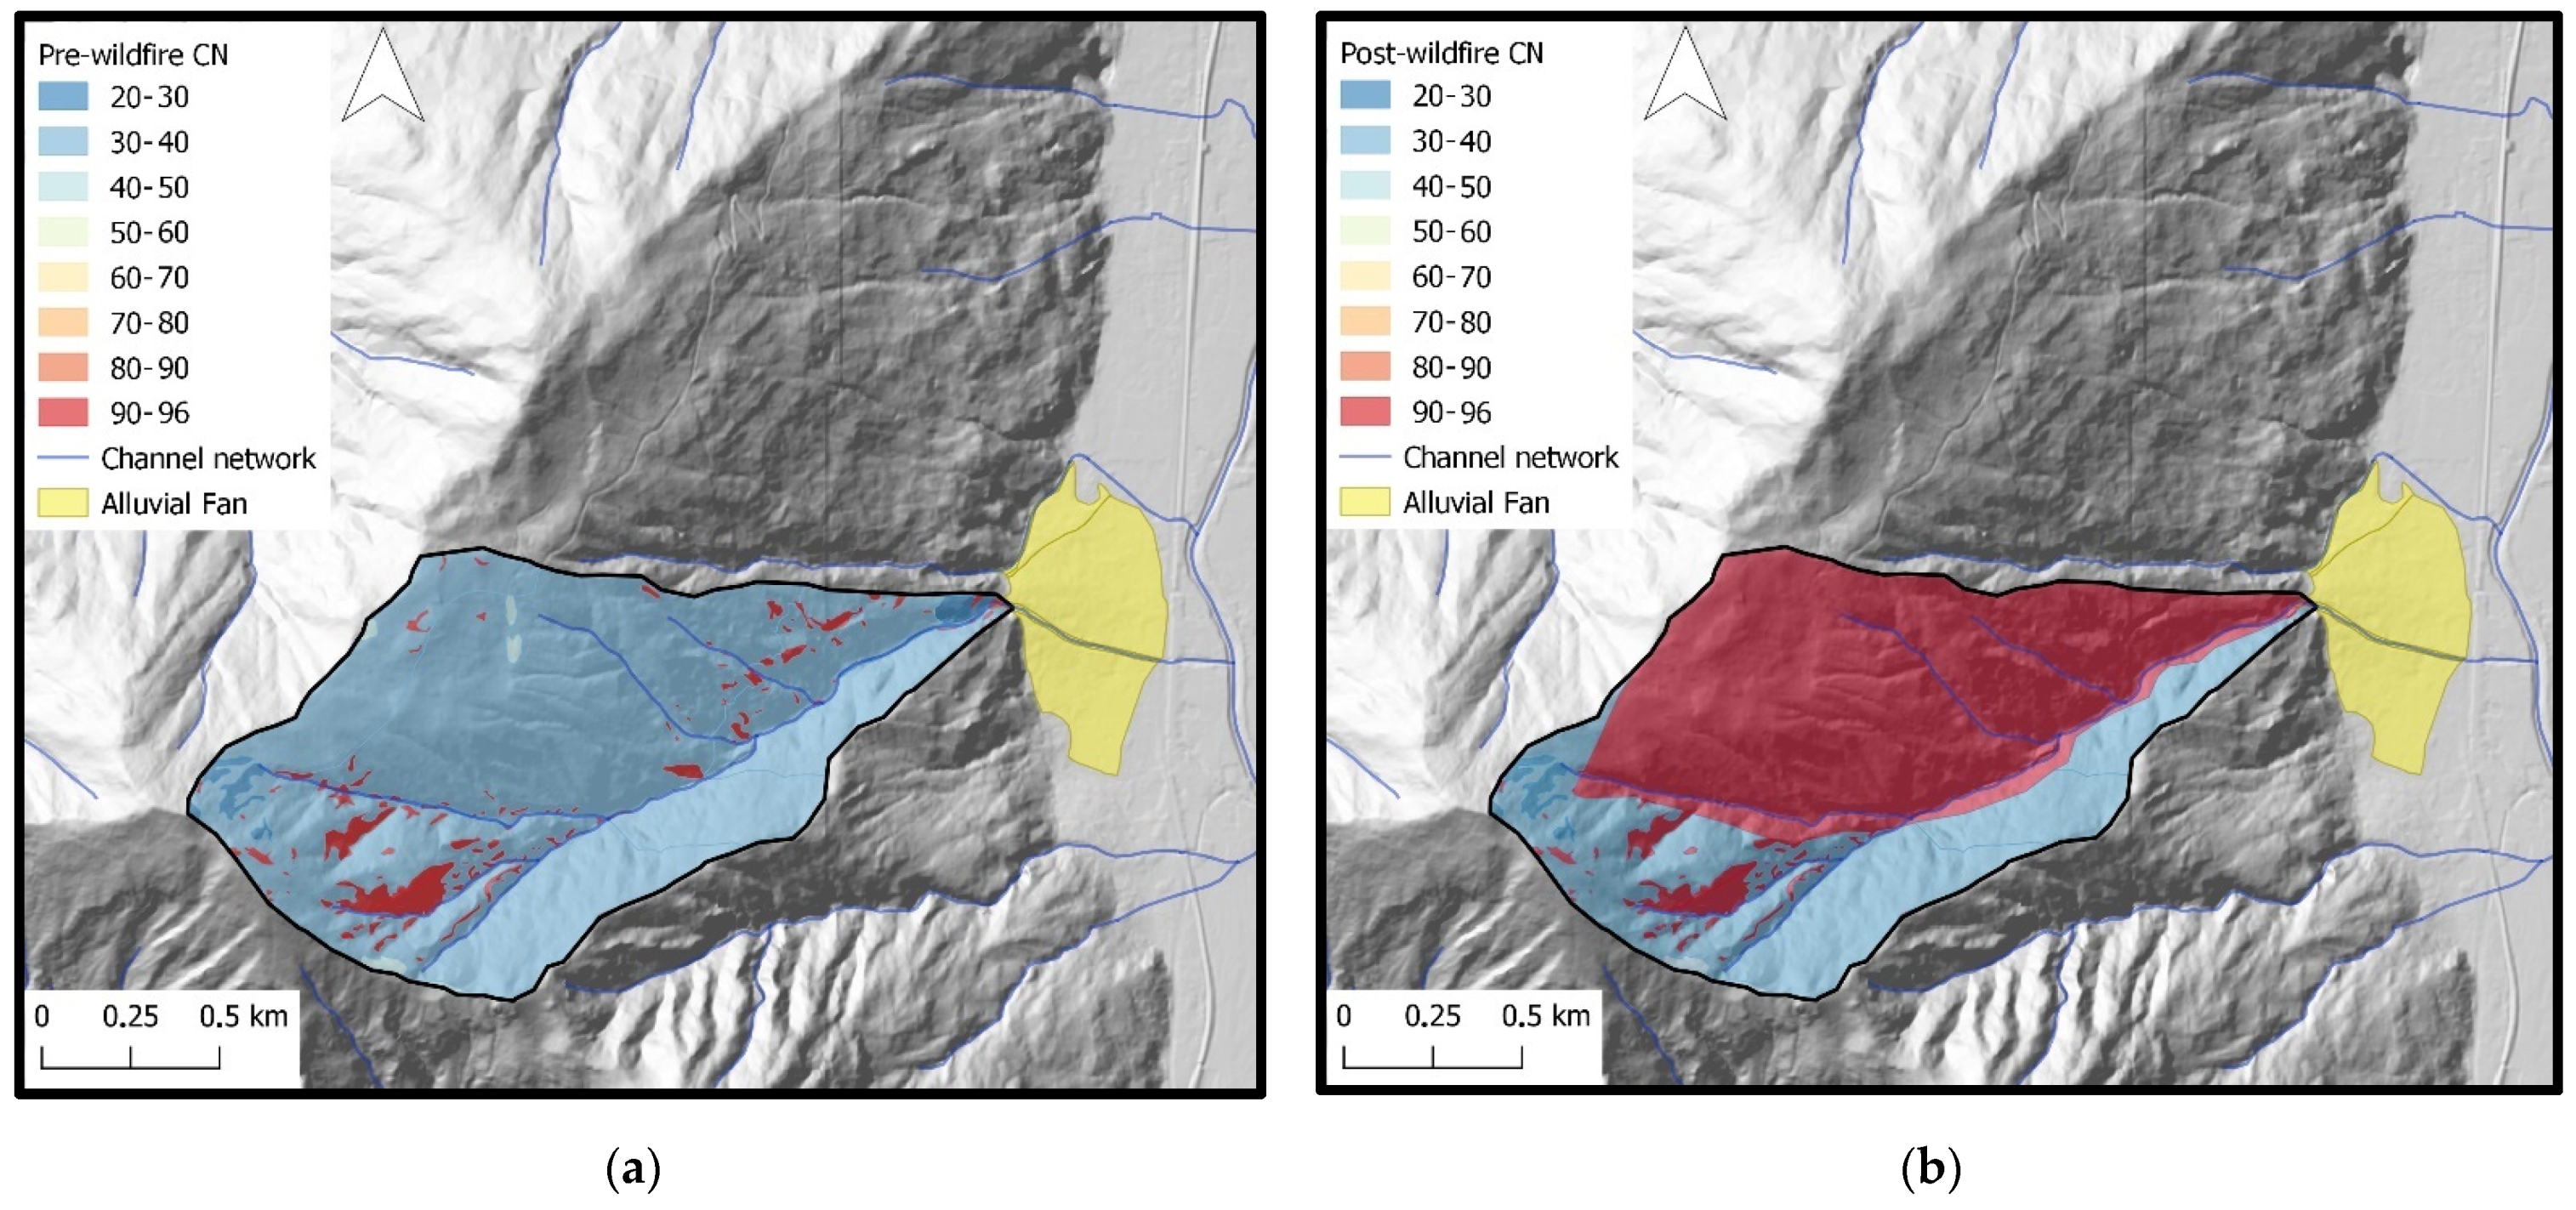
Rio delle Foglie catchment: before the wildfire the average CN was 39.3, while after the fire event it reached 88.2, for a total increase of 48.9.
Subsequently, considering the colluvial cover areas affected by wildfires as characterized by a permeability assimilable to the outcropping bedrock due to the formation of a discontinuous hydrophobic soil surface, the following results have been obtained:
Rio Casella catchment: the new percentage of the catchment having CN values like outcropping bedrock is 63.59%, corresponding to an area of 1.05 km2. The percentage variation of surface outcropping bedrock-like permeability is thus 57.76%;
Rio delle Foglie catchment: the new percentage of the catchment having CN values assimilable the outcropping bedrock is 97.54%, corresponding to an area of 1.34 km2, for a percentage variation of surface outcropping bedrock-like permeability of 95.86%.
Figure 12a,b and
Figure 13a,b show, respectively, changes related to the CN of Rio Casella and Rio delle Foglie catchments before and after wildfires.
3.2. Rainfall Analysis for Rio Casella
On 18 July 2005, Piemonte was affected by convective rainfalls, with rapid movement from the southwest and originating in proximity of Alpine and Apennine reliefs. The Verbania province (northern Alps of Piemonte) was hit since early afternoon by moderate intensity storms, detected by an early version of the regional weather radar systems (
Figure 14) and by raingauges of the regional monitoring network located in the area.
A first rainstorm cell of modest intensity started around 12:00 UTC, when the Fomarco raingauge recorded a peak of 6.8 mm in 30 min. The phenomenon was over in about an hour. A second rainstorm cell affected the same area since 18:00 UTC with longer duration and more intense precipitation. The Fomarco raingauge, close to the center of the shower, recorded 15.8 mm in 30 min (31.6 mm/h). The
Figure 15 shows the hyetograms of hourly and cumulated rainfall recorded by Fomarco raingauge indicating an hourly rainfall intensity of 17.2 mm in correspondence of debris flow occurrence. The daily cumulated rainfall at the end of rainstorm events recorded on 18 July 2005 was 38.8 mm.
In
Figure 16 rainfall event responsible for debris flow occurrence (in red) is compared with rainfall events occurred in preceding months.
From analysis of rainfall after wildfire and debris flow occurrence, it is evident how the rainfall triggering debris flow (in red) has not the higher values of the rainfall historical series. Before and after main debris flow triggering day, higher rainfall values have been recorded by Fomarco raingauge.
3.3. Rainfall Analysis for Rio Delle Foglie
On 7 June 2018, rainfall recorded by raingauges closest to the Rio delle Foglie catchment show low rainfall values around the debris flow occurrence (11:30–12:30 UTC). The Prarotto raingauge (1440 m asl, Condove, Turin), located respectively at 7.0 km from the catchment, recorded 0.4 mm. More consistent precipitations of 15.6 mm were recorded between 15:00 and 18:30 UTC (
Figure 17).
In
Figure 18 rainfall event responsible for debris flow occurrence (in red) is compared with rainfall events occurred in preceding months.
As previous seen for the Rio Casella’s rainfall analyses, also for Rio delle Foglie some rainfall events characterized by higher rainfall values have been recorded before the main debris flow event.
However, given the distance of the raingauge from the catchment, as well for the localized nature of convective precipitation, the rainfall data from these measurements cannot be considered representative of the actual rainfall field distribution responsible for debris flow triggering. Nevertheless, the rainfall data from the raingauge proved useful in mitigating the uncertainty of weather radar estimations. Weather radar visibility over the area of interest is partially limited due to the complex orography.
Considering 2.0° elevation (the first completely free elevation), the altitude of the Bric della Croce radar observations above Bussoleno are about 2500 m asl, while the subsequent elevation (3.0°) corresponds to an altitude from ground of about 3500 m asl.
Analyzing in detail the rainfall estimated by the weather radar, a thunderstorm was identified, which formed around 11:45 UTC in the municipality of Chianocco (bordering with Bussoleno) and surrounding areas and transited over the catchment in question between 11:55 and 12:25 UTC. The intensity of precipitation estimated by Bric della Croce weather radar in the catchment shows very intense peaks (from a single radar scanning of 5 min) between 60 and 100 mm/h at 12:00 UTC, with an average estimated cumulated rainfall of 12 mm in 30 min (24 mm/h) (
Figure 19). This rainfall intensity corresponds to a return period of five years. (
Figure 19).
As already happened for the Rio Casella events, the rainfall that occur in a period following the wildfire have winnowed the material resulting from combustion and convey it towards the main channel of the catchment. The burned layer winnowing can take place in subsequent phases and ends with the complete removal of it (rainfall events preceding the one that occurred in July 18), leaving an impoverished soil locally more impermeable due to the formation of a discontinuous hydrophobic soli surface. The result is a perceptible temporary decreasing in soil permeability and a consequent increasing in the runoff down the slopes. In such conditions, the action of rainfall is more effective in mobilizing the sediments present in the channel bed. Secondly, loose material from slopes is added in the form of small shallow landslides passing through modest phenomena of debris flow due to convergence towards natural impluvium and consequent channeling.
The analysis of these two case studies was thus tackled to identify them, describe their characteristics and understand how wildfires influence the initiation of debris flows by modifying the initial conditions of the catchments in order to integrate the new knowledge in the DEFENSE model to correctly predict also such events and improve the overall DFEWS performance.
The triggering of debris flows occurred in presence of rainfall of moderate intensity, especially if compared to those that characterized the preceding months responsible for the occurrence of mud flows of lower magnitude.
The precipitation analyses show a triggering rainfall intensity of about 17 mm/h for Rio Casella and 24 mm/h for Rio delle foglie.
4. Discussion and Conclusions
The case studies described have allowed to draw some conclusions, both regarding the effects of the wildfires related to debris flows initiating in small Alpine catchments and the technical-operational adjustments related to DFEWS DEFENSE.
Both case studies, the Rio Casella and Rio delle Foglie catchments, were affected by wide wildfires. In particular, the percentage of the basin affected by wildfire was high in both cases: for the Rio Casella a total area of 60.16% of the catchment was affected, while in the second case the area of the Rio delle Foglie was almost completely burned, for a total area percentage of 97.45%. With such high percentages of burnt catchment areas, the effects would have been very significant as predisposing factor to generate debris flows. This hypothesis has been corroborated by the results obtained during the calculation of the CN variation before and after the wildfires. In both cases the CN changes were very relevant: for the Rio Casella the increasing of area having a CN value assimilable to the outcropping bedrock-like permeability was 63.59% and for the Rio delle Foglie was 97.54%. These changes have certainly modified the catchments response to the rainfall effect.
The importance of the percentage of catchment area having outcropping bedrock-like permeability is a very relevant parameter [
19] in increasing the rainfall effect in mobilizing loose material necessary for debris flow triggering, due to decreasing in catchment water infiltration capacity. Consequently, the occurrence-probability of a hyperconcentrated flow and debris flow increases considerably: with outcropping bedrock (or bedrock-like permeability) percentage of less than 10% it is extremely rare to observe a flow characterized by high sediment concertation. Above 20% the occurrence probability of hyperconcentrated flow is significant. Finally, by exceeding 59% the occurrence of debris flows and hyperconcentrated flows is highly likely.
Before wildfires, the CN bedrock-like permeability total area was in both cases below 10% (5.83% for Rio Casella and 1.68% for Rio delle Foglie) with a negligible probability of hyperconcentrated and debris flow occurrence. After wildfires the percentage of areas that can be characterized by a permeability like a bedrock exceeded 59% (63.59% for Rio Casella and 97.54% for Rio delle Foglie) resulting in a high probability of debris flows occurrence.
The average CN of the two catchments was 37.3 for the Rio Casella and 39.3 for the Rio delle Foglie before the wildfires. In both cases the average infiltration capacity was relatively high before the wildfire occurrence. After wildfires the infiltration capacity decreased radically, with new average CN of 70.5 and 88.2 relatively. New CN values indicate a poor infiltration capacity making the two catchments able to generate debris flow phenomena.
In both case studies, results show that rainfall triggered debris flow were of moderate intensity with values under debris flows triggering thresholds by CWI classification. Rainfall analyses also show that historical rainfall intensities were in several cases higher than the events of 18 July 2005 for the Rio Casella and 7 June 2018 for the Rio delle Foglie. Rainfall affecting a catchment after a wildfire winnowing the shallow loose material produced by combustion on the slopes. The winnowing can take place gradually and in successive phases in concomitance with rainfall events following wildfire in the months preceding the main debris flow event. When the burnt loose material has been largely winnowed from slopes, an impoverished soil surface is left exposed and locally characterized by the presence of extensive hydrophobic top. The result is a significant and general decreasing in soil permeability with a consequent significant increasing in runoff down the slopes that become able to mobilize the coarse material present in the channel bed.
Previously, by the classifications carried out by Tiranti et al. [
20] on which the DEFENSE DFEWS is based, the two catchments were characterized as follows:
Rio Casella: BCM (Bad Clay-Maker) with return-period for rainfall triggering threshold value (>50 mm/h) of 20 years (for Toce river’s basin area), but non capable to generate hyperconcentrated or debris flow due to low bedrock outcropping percentage (5.83%);
Rio delle Foglie: GCM (Good Clay-Maker) with return-period for rainfall triggering threshold value (>30 mm/h) of 20 years (for Susa Valley area), but non capable to generate hyperconcentrated or debris flow due to low bedrock outcropping percentage (1.68%).
After wildfires both the catchments become able to generate hyperconcentrated or debris flow phenomena due to the variation of the area with CN like a bedrock permeability with triggering threshold values decreased, respectively 63.59% and 97.54%.
After wildfires, the rainfall triggering value was 17.2 mm/h (instead of 50 mm/h referred to CWI classification) corresponding to a return period less than five years for Rio Casella, while for the Rio delle Foglie the triggering rainfall value was 24 mm/h (instead of 30 mm/h referred to CWI classification) corresponding to a return period of five years. These new triggering threshold values (respectively lower than 66% and 20% referred to CWI classification rainfall-triggering values: 50 mm/h for BCM and 30 mm/h for GCM catchments), demonstrate how after a wildfire in small Alpine catchments the rainfall event necessary to initiate a debris flow is characterized by a reduced intensity and, consequently, a likely greater frequency of debris flow occurrence.
In the light of this study, it is therefore possible to envisage new thresholds, corresponding to the peaks of the events triggered debris flows, must be used within the framework of the DEFENSE in case of catchments are affected by wide wildfires. The integration of these new temporary thresholds (wildfire-induced) can be useful to allow the system to improve its performance for debris flow prediction triggered in conditions like those here analyzed. Moreover, the methodology here proposed shows a simple and quick application to large number of catchments (regional scale or more). Indeed, having all the necessary thematic maps (catchments and alluvial fans distribution and delimitation, geology map, bedrock outcropping map, land use map, wildfire delimitation collected from satellite in real time) processable in GIS environment, it is possible to obtain the CN values modifications after a wildfire in near real-time, so the DFEWS can modify the response to the rainfall (decreasing the threshold values) for catchments affected by the fire in an automatic way. This methodology eliminates the need to carry out field surveys to assess changes in a given catchment as a result of wildfire action, making the DFEWS response immediate.
Obviously, due to the uncertain linked to statistically results just based on two case studies (moreover, ECM catchments are not included in this work) it will needed to widen the research to many more cases to define the degree of reliability of the methodology here presented. It is relevant to highlight how Rio Casella data are the result of a less advanced technology than those of the Rio delle Foglie, both regarding weather radar estimation and the mapping methodologies adopted to wildfire delimitation (by field observations because the Copernicus project has not yet been available in 2005), so the obtained results and deriving consideration could be characterized by more uncertain compared with those of the Rio delle Foglie.
Further case studies are also needed to better estimate the time required to renormalize the thresholds both for rainfall values and outcropping percentage (bedrock like permeability) due to vegetation regeneration.
Author Contributions
Conceptualization, D.T.; methodology, D.T., and R.C.; formal analysis, D.T., R.C., and D.S.; investigation, D.T., R.C., and D.S.; data curation, D.T., R.C., and D.S. writing—original draft preparation, D.T., and R.C.; writing—review and editing, D.T.; visualization, D.T., R.C., and D.S.; supervision, D.T. All authors have read and agreed to the published version of the manuscript.
Funding
This research received no external funding.
Institutional Review Board Statement
Not applicable.
Informed Consent Statement
Informed consent was obtained from all subjects involved in the study.
Data Availability Statement
Acknowledgments
The authors would like to thank Jonathan B. Stoll for reviewing and proofreading the English-language paper.
Conflicts of Interest
The authors declare no conflict of interest.
References
- Wells, W.G. The effects of fire on the generation of debris flows in southern California. Rev. Eng. Geol. 1987, 7, 105–114. [Google Scholar]
- Cannon, S.H.; Powers, P.S.; Savage, W.Z. Fire-related hyperconcentrated debris flows on Storm King Mountain, Glenwood Springs, Colorado, USA. Environ. Geol. 1998, 35, 210–218. [Google Scholar] [CrossRef]
- Cannon, S.H. Debris-Flow Response of Watersheds Recently Burned by Wildfire. Ph.D. Thesis, University of Colorado, Boulder, CO, USA, 1999; p. 200. [Google Scholar]
- Cannon, S.H.; Reneau, S.L. Conditions for generation of fire- related debris flows, Capulin Canyon, New Mexico. Earth Surf. Process. Landf. 2000, 25, 1103–1121. [Google Scholar] [CrossRef]
- Cannon, S.H.; Bigio, E.R.; Mine, E. A process for fire-related debris flow initiation, Cerro Grande fire, New Mexico. Hydrol. Process. 2000, 15, 3011–3023. [Google Scholar] [CrossRef]
- Cannon, S.H.; Kirkham, R.M.; Parise, M. Wildfire-related debris-flow initiation processes, Storm King Mountain, Colorado. Geomorphology 2001, 39, 171–188. [Google Scholar] [CrossRef]
- Cannon, S.H. Debris-flow generation from recently burned watersheds. Env. Eng. Geosci. 2001, 4, 321–341. [Google Scholar] [CrossRef]
- Cannon, S.H.; Gartner, J.E. Wildfire-related debris flow from a hazards perspective. In Debris Flows and Debris Avalanches—the State of the Art; Hungr, O., Jacob, M., Eds.; Springer-Praxis Books in Geophysical Sciences: New York, NY, USA, 2005; pp. 321–344. [Google Scholar]
- Shakesby, R.A.; Doerr, S.H. Wildfire as a hydrological and geomorphological agent. Earth-Sci. Rev. 2006, 74, 269–307. [Google Scholar] [CrossRef]
- Santia, P.M.; Wolfea, V.G.D.; Higginsa, J.D.; Cannon, S.H.; Gartner, J.E. Sources of debris flow material in burned areas. Geomorphology 2008, 96, 310–321. [Google Scholar] [CrossRef]
- Kean, J.W.; Staley, D.M.; Cannon, S.H. In situ measurements of post-fire debris flows in southern California: Comparisons of the timing and magnitude of 24 debris-flow events with rainfall and soil moisture conditions. J. Geophys. Res. 2011, 116, F04019. [Google Scholar] [CrossRef]
- Florsheim, J.L.; Chin, A.; Kinoshita, A.M.; Nourbakhshbeidokhti, S. Effect of storms during drought on post-wildfire recovery of channel sediment dynamics and habitat in the southern California chaparral, USA. Earth Surf. Process. Landf. 2017, 42, 1482–1492. [Google Scholar] [CrossRef] [Green Version]
- Biase, R.A.D.; Lamb, M.P. Dry sediment loading of headwater channels fuels post-wildfire debris flows in bedrock landscapes. Geology 2020, 48, 189–193. [Google Scholar] [CrossRef] [Green Version]
- Kean, J.W.; Staley, D.M. Forecasting the Frequency and Magnitude of Postfire Debris Flows Across Southern California. Earth’s Future 2021, 9, e2020EF001735. [Google Scholar] [CrossRef]
- Carabella, C.; Miccadei, E.; Paglia, G.; Sciarra, N. Post-Wildfire Landslide Hazard Assessment: The Case of The 2017 Montagna Del Morrone Fire (Central Apennines, Italy). Geosciences 2019, 9, 175. [Google Scholar] [CrossRef] [Green Version]
- Bisson, M.; Favalli, M.; Fornaciai, A.; Mazzarini, F.; Isola, I.; Zanchetta, G.; Pareschi, M.T. A rapid method to assess fire-related debris flow hazard in the Mediterranean region: An example from Sicily (southern Italy). Int. J. Appl. Earth Obs. Geoinf. 2005, 7, 217–231. [Google Scholar] [CrossRef]
- Esposito, G.; Parodi, A.; Lagasio, M.; Masi, R.; Nanni, G.; Russo, F.; Alfano, S.; Giannatiempo, G. Characterizing Consecutive Flooding Events after the 2017 Mt. Salto Wildfires (Southern Italy): Hazard and Emergency Management Implications. Water 2019, 11, 2663. [Google Scholar] [CrossRef] [Green Version]
- Esposito, G.; Matano, F.; Molisso, F.A.; Ruoppolo, G.; Benedetto, A.D.; Sacchi, M. Post-fire erosion response in a watershed mantled by volcaniclastic deposits, Sarno Mountains, Southern Italy. Catena 2017, 152, 227–241. [Google Scholar] [CrossRef] [Green Version]
- Tiranti, D.; Cremonini, R.; Asprea, I.; Marco, F. Driving Factors for Torrential Mass-Movements Occurrence in the Western Alps. Front. Earth Sci. 2016, 4, 1–13. [Google Scholar] [CrossRef] [Green Version]
- Tiranti, D.; Cremonini, R.; Marco, F.; Gaeta, A.R.; Barbero, S. The DEFENSE (DEbris Flows triggEred by storms–Nowcasting SystEm): An early warning system for torrential processes by radar storm tracking using a Geographic Information System (GIS). Comput. Geosci. 2014, 70, 96–109. [Google Scholar] [CrossRef]
- Tiranti, D.; Bonetto, S.; Mandrone, G. Quantitative basin characterization to refine debris-flow triggering criteria and processes: An example from the Italian Western Alps. Landslides 2008, 5, 45–57. [Google Scholar] [CrossRef]
- Tiranti, D.; Deangeli, C. Modeling of debris flow depositional patterns according to the catchment and sediment source area characteristics. Front. Earth Sci. 2015, 3, 8. [Google Scholar] [CrossRef] [Green Version]
- Alexander, M.E. Calculating and interpreting forest fire intensities. Can. J. Bot. 1982, 60, 349–357. [Google Scholar] [CrossRef]
- Tedim, F.; Leone, V.; Amraoui, M.; Bouillon, C.; Coughlan, M.; Delogu, G.; Fernandes, P.; Ferreira, C.; McCaffrey, S.; McGee, T.; et al. Defining extreme wildfire events: Difficulties, challenges, and impacts. Fire 2018, 1, 9. [Google Scholar] [CrossRef] [Green Version]
- Scott, J.H. Magnitude and Intensity scales for wildland fire. In Proceedings of the 3rd International Fire Ecology and Management Conference, San Diego, CA, USA, 13–17 November 2006. [Google Scholar]
- Moody, J.A.; Shakesby, R.A.; Robichaud, P.R.; Cannon, S.H.; Martin, D.A. Current research issues related to post-wildfire runoff and erosion processes. Earth-Sci. Rev. 2013, 122, 10–37. [Google Scholar] [CrossRef]
- Woods, S.W.; Balfour, V.N. The effect of ash on runoff and erosion after a severe forest wildfire, Montana, USA. Int. J. Wildland Fire 2008, 17, 535–548. [Google Scholar] [CrossRef]
- Silins, U.; Stone, M.; Emelko, M.B.; Bladon, K.D. Sediment production following severe wildfire and post-fire salvage logging in the Rocky Mountain headwaters of the Oldman river basin, Alberta. Catena 2009, 79, 189–197. [Google Scholar] [CrossRef]
- Mockus, V. Estimation of total (and peak ratesof) surface runoff for individual storms. In Interim Survey Report Grand (Neosho) River Watershed; Exhibit A in Appendix B; U.S. Department of Agriculture: Washington, DC, USA, 1949. [Google Scholar]
- Hawkins, R.H.; Jiang, R.; Woodward, D.E.; Hjelmfelt, A.T.; Mullem, J.A.V. Runoff Curve Number Method: Examination of the Initial Abstraction Ratio. In Proceedings of the Second Federal Interagency Hydrologic Modeling Conference, Las Vegas, NV, USA, 29 July–1 August 2002; Volume 42, pp. 629–643. [Google Scholar] [CrossRef]
- Hawkins, R.H. Asymptotic Determination of Runoff Curve Numbers from Data. J. Irrig. Drain. Eng. 1993, 119, 334–345. [Google Scholar] [CrossRef]
- Koistinen, J. Operational correction of radar rainfall errors due to the vertical reflectivity profile. In Proceedings of the 25th International Conference on Radar Meteorology, Paris, France, 24–28 June 1991; pp. 91–94. [Google Scholar] [CrossRef]
- Joss, J.; Waldvogel, A. Precipitation measurement and hydrology. In Radar in Meteorology: Battan Memorial and 40th Anniversary Radar Meteorology Conference; Atlas, D., Ed.; American Meteorological Society: Boston, MA, USA, 1990; pp. 577–606. [Google Scholar]
- Cremonini, R.; Bechini, R. Heavy rainfall monitoring by polarimetric c-band weather radars. Water 2010, 2, 838–848. [Google Scholar] [CrossRef]
- Piana, F.; Fioraso, G.; Irace, A.; Mosca, P.; d’Atri, A.; Barale, L.; Falletti, P.; Monegato, G.; Morelli, M.; Tallone, S.; et al. Geology of Piemonte region (NW Italy, Alps–Apennines interference zone). J. Maps 2017, 13, 395–405. [Google Scholar] [CrossRef]
- DeBano, L.F.; Mann, L.D.; Hamilton, D.A. Translocation of hydrophobic substances into soil by burning organic litter. Soil Sci. Soc. Am. J. 1970, 34, 130–133. [Google Scholar] [CrossRef]
- DeBano, L.F. The effect of hydrophobic substances on water movement in soil during infiltration. Soil Sci. Soc. Am. J. 1971, 35, 340–343. [Google Scholar] [CrossRef]
- DeBano, L.F. The role of fire and soil heating on water repellency in wildland environments: A review. J. Hydrol. 2000, 231, 195–206. [Google Scholar] [CrossRef]
- Burch, G.J.; Moore, I.D.; Burns, J. Soil hydrophobic effects on infiltration and catchment runoff. Hydrol. Process. 1989, 3, 211–222. [Google Scholar] [CrossRef]
Figure 1.
Rio Casella and Rio delle Foglie catchments’ location.
Figure 1.
Rio Casella and Rio delle Foglie catchments’ location.
Figure 2.
Debris flow deposit in channel bed.
Figure 2.
Debris flow deposit in channel bed.
Figure 3.
Map shows the delimitation of wildfire involving the Rio Casella catchment and nearest raingauge (Fomarco weather station).
Figure 3.
Map shows the delimitation of wildfire involving the Rio Casella catchment and nearest raingauge (Fomarco weather station).
Figure 4.
Dark-brown mud sediments below the coarse deposits of 18 July debris flow.
Figure 4.
Dark-brown mud sediments below the coarse deposits of 18 July debris flow.
Figure 5.
Debris flow deposits involving buildings in Bussoleno municipality.
Figure 5.
Debris flow deposits involving buildings in Bussoleno municipality.
Figure 6.
Map shows the delimitation of wildfire involving the Rio delle Foglie catchment and nearest raingauge (Prarotto weather station).
Figure 6.
Map shows the delimitation of wildfire involving the Rio delle Foglie catchment and nearest raingauge (Prarotto weather station).
Figure 7.
Weather radars’ location (star symbols) and the location of the two catchments (red circles).
Figure 7.
Weather radars’ location (star symbols) and the location of the two catchments (red circles).
Figure 8.
Geological interpolated map of Rio Casella from the regional geological map of Piemonte at 1:100,000 scale [
35], on field hidden by extensive colluvial cover. Outcropping bedrock and deposits identified by survey as circumscribed polygons on interpolated map.
Figure 8.
Geological interpolated map of Rio Casella from the regional geological map of Piemonte at 1:100,000 scale [
35], on field hidden by extensive colluvial cover. Outcropping bedrock and deposits identified by survey as circumscribed polygons on interpolated map.
Figure 9.
Geological interpolated map of Rio delle Foglie from the regional geological map of Piemonte at 1:100,000 scale [
35], on field hidden by extensive colluvial cover. Outcropping bedrock and deposits identified by survey as circumscribed polygons on interpolated map.
Figure 9.
Geological interpolated map of Rio delle Foglie from the regional geological map of Piemonte at 1:100,000 scale [
35], on field hidden by extensive colluvial cover. Outcropping bedrock and deposits identified by survey as circumscribed polygons on interpolated map.
Figure 10.
The Rio Casella area affected by wildfire and its intersection with land use units.
Figure 10.
The Rio Casella area affected by wildfire and its intersection with land use units.
Figure 11.
The Rio delle Foglie area affected by wildfire and its intersection with land use units.
Figure 11.
The Rio delle Foglie area affected by wildfire and its intersection with land use units.
Figure 12.
(a) Calculated CN for the Rio Casella catchment before the wildfire; (b) calculated CN for the Rio Casella catchment after the wildfire.
Figure 12.
(a) Calculated CN for the Rio Casella catchment before the wildfire; (b) calculated CN for the Rio Casella catchment after the wildfire.
Figure 13.
(a) Calculated CN for the Rio delle Foglie catchment before the wildfire; (b) calculated CN for the Rio Casella catchment after the wildfire.
Figure 13.
(a) Calculated CN for the Rio delle Foglie catchment before the wildfire; (b) calculated CN for the Rio Casella catchment after the wildfire.
Figure 14.
Rainfall field distribution map (map representation from old weather radar systems) estimated by the weather radars on 18 July 2005. Red square indicates the Rio Casella catchment location. Weather radar estimates a cumulated daily rainfall value of 35.4 mm corresponding to48 dBZ.
Figure 14.
Rainfall field distribution map (map representation from old weather radar systems) estimated by the weather radars on 18 July 2005. Red square indicates the Rio Casella catchment location. Weather radar estimates a cumulated daily rainfall value of 35.4 mm corresponding to48 dBZ.
Figure 15.
Hourly and cumulated rainfall recorded by Fomarco raingauge on 18 July 2005.
Figure 15.
Hourly and cumulated rainfall recorded by Fomarco raingauge on 18 July 2005.
Figure 16.
Hourly and accumulated rainfall recorded by Fomarco raingauge from spring wildfire to July 2005. Debris flow occurrence day in red.
Figure 16.
Hourly and accumulated rainfall recorded by Fomarco raingauge from spring wildfire to July 2005. Debris flow occurrence day in red.
Figure 17.
Hourly and cumulated rainfall recorded by Prarotto raingauge on 7 June 2018.
Figure 17.
Hourly and cumulated rainfall recorded by Prarotto raingauge on 7 June 2018.
Figure 18.
Hourly and accumulated rainfall recorded by Prarotto raingauge from fall wildfire to June 2018. Debris flow occurrence day in red.
Figure 18.
Hourly and accumulated rainfall recorded by Prarotto raingauge from fall wildfire to June 2018. Debris flow occurrence day in red.
Figure 19.
Rainfall intensity of 24 mm/h estimated by Bric della Croce radar between 11:55 and 12:25 UTC hit Rio delle Foglie catchment (outlined polygon).
Figure 19.
Rainfall intensity of 24 mm/h estimated by Bric della Croce radar between 11:55 and 12:25 UTC hit Rio delle Foglie catchment (outlined polygon).
Table 1.
Hydrological groups and related rock and deposit types.
Table 1.
Hydrological groups and related rock and deposit types.
| Hydrological Group | Rocks and Deposits Associated to the Hydrological Groups for the Two Catchments |
|---|
| Group D | diorites, ortho- and paragneisses, micaschists, calc-schists and serpentinites |
| Group C | marbles |
| Group B | eluvial and colluvial covers |
| Group A | alluvial fans (also relict) and debris flow deposits, talus deposits, and rockfall deposits |
Table 2.
CN values determined by the intersection of land use units and hydrological groups, deriving from the application of CN standard values, modified from [
30,
31].
Table 2.
CN values determined by the intersection of land use units and hydrological groups, deriving from the application of CN standard values, modified from [
30,
31].
| Land Use | Hydrological Group and Derived CN Values |
|---|
| | A | B | C | D |
| High altitude grassland | 37 | 50 | 68 | 75 |
| Gravel | 20 | 22 | 24 | 26 |
| Riverbed | 23 | 25 | 28 | 32 |
| Outcropping rock | 80 | 87 | 93 | 96 |
| Vegetated cliff | 40 | 50 | 65 | 75 |
| Dense wood | 21 | 31 | 45 | 53 |
| Sparse wood | 29 | 38 | 54 | 61 |
| Grassland | 41 | 47 | 65 | 76 |
| Urban area | 92 | 94 | 96 | 98 |
| Shrubby | 38 | 45 | 60 | 70 |
| Grassland with scattered trees | 35 | 43 | 60 | 72 |
| Water | 99 | 99 | 99 | 99 |
| Publisher’s Note: MDPI stays neutral with regard to jurisdictional claims in published maps and institutional affiliations. |
© 2021 by the authors. Licensee MDPI, Basel, Switzerland. This article is an open access article distributed under the terms and conditions of the Creative Commons Attribution (CC BY) license (https://creativecommons.org/licenses/by/4.0/).


