1. Introduction
The continuous and accurate monitoring of surface displacements in high alpine regions is challenging due to the extreme weather conditions, long snowfall periods, snow creep and avalanches, and rock falls. However, these data are crucial to investigating the complexities of the slope processes, such as those occurring in glacial and paraglacial environments, where only a few studies have been performed to date [
1,
2,
3,
4]. Automated total station monitoring has been used in landslides and mines since the early 1990s [
5,
6]. These systems can be operated in continuous mode by controlling the data acquisition and transmission remotely. The optimal design of a monitoring network that can collect the underlying processes is a challenging and still open question. This is partly because investigating the underlying physical mechanisms requires three-dimensional displacement data with sufficiently large spatial coverage, high accuracy, and high temporal resolution. Furthermore, the design of a surface displacement monitoring system requires the consideration of environmental factors, hardware configuration, and reference frames. There are no solutions from the stack for the different requirements of monitoring systems, e.g., regarding differences in location, weather, or movement rates.
This work was motivated by the finding of a solution for the installation of a monitoring system in the Great Aletsch region of Switzerland, a challenging alpine environment. The goals of this monitoring system were the following: (1) Determine a broad spectrum of surface displacements in 3D, representative over an area of about 8 km² and with a temporal sampling of a few hours. (2) Install a monitoring system in an area without truly stable reference points, either for the location of the permanent monitoring system, or for any of the targets, which show surface velocities that range from millimeters/year to more than 1 m/day. (3) Quickly adapt the monitoring system to the changing requirements in terms of spatial coverage or spatial/temporal resolution. (4) Operate the monitoring system over several years under harsh environmental conditions with low winter temperatures, large temperature gradients, high wind speeds, significant snow-loads, limited sunlight, and difficult access. Modern Total Station Positioning Systems (TPS) can measure the relative position of prisms with sub-centimeter accuracy at distances up to about 1 km and were selected as core instruments of an integrated monitoring system. The total amount of daily TPS measurements is mainly limited by the available power supply and the number of prisms to be measured in every session. In addition, a TPS-based monitoring system can easily be adapted to changing needs by configuring the sequence and frequency of the target measurements and by adding, relocating, or removing prisms. Linked GNSS stations are used to compensate for minor local slope deformations in stable ground and to pass from a local to a geographic reference system.
This paper describes an exceptional monitoring infrastructure developed and successfully operated for 6 years (2014–2020) in the framework of a large research project focusing on paraglacial rock slope movements and landslide activity. The study area is located around the tongue of the retreating Great Aletsch Glacier in the Vallais Alps of Switzerland, which extends over a length of 23 km (the longest glacier of the European Alps) and provides a unique scenario to study and understand the evolution of paraglacial rock slope instabilities. We provide a description of the geological and glacial environment, including a focus on two active and two historic paraglacial rock slope instabilities. We further describe in detail the surface displacement monitoring setup and operation and the basic data processing steps. Selected monitoring results are presented in order to document and analyze the reliability and accuracy of the system, both in terms of the small reversible ground surface deformations and the large rapid gravitational slope movements.
2. Materials and Methods
2.1. Study Area
The study area is located around the (current) tongue of the Great Aletsch Glacier, which is surrounded by steep valley flanks extending from a 1600 m a.s.l. to a 2300 m a.s.l. elevation on the left flank and up to 3700 m a.s.l. on the right flank. The slopes consist the of gneisses and intrusive rocks of the central Aar Granite sequence with a strong foliation caused by the Tertiary Alpine deformation dipping steeply to the southeast [
7,
8]. During the Würm glacial period, which peaked in the Last Glacial Maximum (LGM; dated at ~28 kyr to ~18 kyr before present (BP); [
9,
10]), the Aletsch glacier region was a large icefield reaching into the Rhone Valley. After the LGM, glacial ice retreated strongly, followed by a series of successive glacial re-advances [
10,
11]. The last late-glacial re-advance (Egesen) left lateral moraine deposits which are well preserved in the study area and were dated to the Younger Dryas cold period (~12 kyr BP, [
12,
13,
14]). After a massive glacial retreat during the Holocene, the Aletsch Glacier re-advanced several times, culminating in the Little Ice Age (LIA) around 1860 [
15,
16]. Morainic deposits of the LIA lateral moraine show that the glacier was more than three kilometers longer and 300 m thicker in 1860 than today [
17]. There are two historic and two active rock slope instabilities in the study area (
Figure 1):
- (a)
The Taelli instability is a historic rock slope instability comprising an area of around 123,000 m² at the confluence of the Upper Aletsch and the Great Aletsch Glaciers. Signs of rock mass movement could be detected on aerial photographs for the first time in 1966 when the Taelli instability developed a distinct lateral release area before it collapsed in 1970 as a sliding mechanism slope (see also
Figure 2a).
- (b)
On the opposite slope of Taelli, the historic Silbersand instability covers an area of about 430,000 m². This historic instability is covered by undisturbed LIA lateral moraine deposits evidencing an age of at least 150 years and confined by a 30 m high head-scarp. Current monitoring data reveal a stable state of the formerly instable sliding mechanism rock mass.
- (c)
The active instability at Driest on the northwestern side of the Great Aletsch Glacier is characterized by a 50–100 m high, almost vertical head scarp showing a distinct white and un-weathered 1–5 m thick rock exposure in the lowest part of the scarp, representing displacements which occurred during recent decades (see also
Figure 2b). Grämiger et al. [
18] determined 10Be surface exposure ages of about 7.4 ka BP at the uppermost part of this head scarp. Studies by Kaab [
19] estimated visible downslope movements of the instability of 2m when analyzing aerial photographs with photogrammetric techniques between 1976 and 1995 and an uphill movement of 2 m at the landslide toe. With a width of the displaced mass of 835 m and a length of ~550 m, the Driest instability shows at least 250,000 m² of displaced surface material. Reconstruction of the slope movements along the head scarp with lichenometric methods and analysis of historic aerial photographs revealed a reactivation in 1993, when the landslide toe became ice free [
20]. Current monitoring data show displacements of a few centimeters per year of this rotational slide.
- (d)
The most active instability in the study area is the Moosfluh instability [
21,
22]. The history of Moosfluh was reconstructed by Glueer et al. [
23] using Aerial Digital Photogrammetry (ADP), Digital Image Correlation (DIC), total station monitoring (RTS), and field mapping data, revealing at least a post-Egesen origin of the deep-seated gravitational slope deformation (DSGSD). Low-velocity deformation was inferred for the period between the end of the Little Ice Age (LIA, 1850) until 1997 (>0.01 m/a) [
23]. Slope movements constantly accelerated up to 0.2 m per year in 2007. In September 2016, the toppling slope started to deform rapidly, with displacements of several meters per week, developing long tensile cracks, shear cracks, intensive rock fall activity, and large uphill- and downhill-facing scarps related to the formation of three secondary rockslides [
24].
2.2. Monitoring Setup
The monitoring network consists of two TPS stations, four permanent GNSS stations, two meteo stations and more than 80 optical prisms (
Figure 1). The TPS stations, referred to in this paper as TPS1 and TPS2, are located at Chatzulecher (TPS1: Leica TCP1201) and Driest (TPS2: Leica Nova TM50), each one equipped with a GNSS antenna mounted directly above its center and physically linked with a bracket. Furthermore, meteo sensors, which measure air temperature and pressure (covered by a multi-plate radiation shield), complete the setup. Details on the equipment used for the monitoring system are listed in
Table 1. Additionally, two permanent GNSS stations are located northeast of Chatzulecher and Ze Baechu (
Figure 1). The power supply is provided by solar panels (total size 2 m
2) and the energy is stored in batteries (2 × 270 Ah). The station is able to run without any solar power input for approximately 72 h and can thus also operate during the night or during/after periods of bad weather. After a testing phase in 2013, both TPS networks have been operated independently in continuous mode since 2014 (TPS1 since March and TPS2 since August) and are remotely controlled with the software Leica GeoMoS [
25]. A local high-speed 4G and WLAN Router receiver connects the sensors with the monitoring software installed on a server at Eidgenössische Technische Hochschule (ETH) Zurich. This solution is advantageous because it avoids having to install a dedicated computer in harsh environmental conditions; however, the drawback is that in the case of connection outage data cannot be transmitted and/or the monitoring station cannot be reached. In the following sections we describe details on the TPS station configurations and on the data acquisition.
2.3. TPS Pillars
The TPS stations are mounted on pillars designed to be lightweight but stable for precise measurements under extreme climate and weather conditions. According to established good practices, the TPS pillars are constructed with two mechanically unconnected layers (
Figure 3a), aimed at reducing the impact of unilateral solar radiation and of the vibrations induced by wind load due to high wind speeds. The inner pillar carries the measurement equipment, i.e., the total station and the GNSS antenna. The outer pillar protects the inner one and carries the protective roof. With a height of 1.45 m, the pillar is high enough to protect the instrumentation from being snow covered in winter. Both pillars are cylinders made of aluminum (thickness of 5 mm, inner cylinder diameter of 0.21 m, outer cylinder 0.30 m). The two layers are sufficiently lightweight to be transported to the remote location by helicopter and to be handled manually without special tools during set-up. They are grouted to the bedrock with 12 mm bolts glued into the rock. Frukacz et al. [
26] investigated this setup in great detail by measuring the temperature distribution within the pillar, the inclination at the foot of the pillar, and its deformation. The analysis showed that (i) the temperature differences within the pillar were well below 1 °C within the vertical profiles and 3 °C within the horizontal ones, and there was no relevant pillar bending; (ii) the bedrock reacted to daily changes in the solar radiation and temperature with tilt changes of up to 20 arcsec; and (iii) these variations had a negligible effect on the instrument centering, and the tilt changes were well within the limit where the total station can automatically correct them using its own internal inclination measurements (
Figure 3b). The bedrock and pillar tilts at night were negligible.
2.4. Protection of the TPS from Environmental Impacts
Modern total stations are typically resistant to environmental influences and can be operated over extended periods of time without any additional weather protection. However, since our total stations were set up in a remote alpine location, exposed to direct sunlight, rainfall, snow, and were accessible for animals and hikers, we decided to house them in a protection shelter. Initially, this shelter included 6 mm thick plane acrylic windows (plexiglass PMMA) and a roof made from polyamide and thus transparent for the GNSS signals (
Figure 4a). Although a plane window does have an impact on the TPS measurements by shifting the lines-of-sight parallel and introducing a distance bias (both depending on the angle of incidence) this is not problematic for monitoring if the relative geometry between the instrument and the windows does not change and if the targets are far from the instrument. The constant biases of the measurements taken at different times cancel out in the deformation analysis. However, direct reflections from the glass into the telescope are critical and need to be avoided by assuring that the measurements are not taken orthogonally to the glass surface [
27]. Furthermore, uneven surfaces of the glass or inhomogeneities of the refractive index could cause non-constant errors, affecting the deformation analysis if windows of poor quality are used. Large errors due to biased angular measurements occurred at the targets installed in the line-of-sight directions close to the vertical rods supporting the glass windows [
26,
28];
Figure 3c). We thus considered the use of protective housings without rods, such as an acrylic cylinder (
Figure 4b). This solution, however, produced significantly worse results due to the nearly orthogonal intersection of the line of sight and due to the geometrical imperfections and inhomogeneities of the material. We found that a bright, opaque polyamide cylinder with holes drilled for the individual lines of sight to the reflectors to be the best solution for protecting the total station (
Figure 4c). Wieser and Presl [
28] showed that the holes need to have at least the diameter of the telescope aperture plus a margin for assembly and target displacement to assure completely undisturbed measurements, i.e., a diameter of ~45 mm.
The TPS stations stand high above the surroundings for an unobstructed view of the monitored area and thus tend to attract lightening. Bare rock surfaces or locations within a slope of constant gradient are less prone for lightning strikes [
29,
30,
31]. TPS1 is located on a bare rock surface and within a slope of constant gradient. TPS2 sits on the top of the head-scarp of the Driest instability, within a large shoulder along the slope within an area of soil cover with near-surface water occurrence. Such locations are particularly susceptible to lightning strikes. As total stations contain sophisticated electronic equipment which is vulnerable to the surge of instable electrical current, a good lightning protection system is essential. A lightning rod, designed to be the highest point at the total station location, was installed to attract nearby electric charges and lead the current to the ground via grounding devices. We used flat, flexible tapes with low resistance for efficient conduction of the electric current into the ground, which consisted of a copper-coated steel ground rod of 0.5 m length which was buried into the soil. Additionally, every electronic device goes through a lightning protection box which inherits lightning arresters of gas-discharge bulbs and surge protectors.
2.5. TPS Network Management
The number of prisms monitored via TPS varied in time, as the network was constantly enlarged depending on landslide movements and loss of reflector prisms in highly unstable, rock-fall prone slopes or snow-creep/avalanche areas. The spatial distribution of the prisms as of June 2018 is shown in
Figure 1. Initial target positions are either registered manually, by pointing the telescope and targeting them on site, or by adding approximate geographic coordinates (e.g., measured during prism installation using a handheld GNSS receiver and transformed into the coordinate system of the RTS in post-processing) and letting the RTS search for it within a defined search window. The GeoMoS software was then set to measure all the reflector prisms in Automatic Target Recognition mode (ATR) in both faces on a four-hour schedule during the day and hourly during the night (between 23:00 and 05:00). Higher sampling during the night hours was implemented due to more stable atmospheric conditions and thus increased measurement accuracy. Measurements were performed considering a local coordinate system centered at the TPS location and oriented considering a reference point. Before every measurement cycle, the total station determines its prior orientation with a known reference point (TPS1: reflector 10 (2013–2019) and 68 (from 2019); TPS2-reflector 39). If the reference point cannot be measured during a measurement cycle, the orientation value of the last possible measurement is considered. At each session, the procedure acquires distances, angles, temperature, and pressure. Due to the complexity of the network and the high number of targets to measure, arranging measurements in point groups minimizing the motion of the TPS motors has proved to be useful to save energy. After every measurement cycle, the telescope was rotated into a downward-looking orientation in order to better protect the front lens from environmental impacts.
2.6. Data Processing
Measuring through an inhomogeneous atmosphere causes both temporally and spatially varying signal delays, resulting in distance biases and temporally and spatially varying curvature of the signal paths between the instrument and the targets, resulting in angle biases. The main effect of the atmosphere on the distance measurement needs to be taken into account by an atmospheric correction [
32], which is a scale factor depending on the density and composition of the air. For many practical use cases of total stations, this scale factor can be calculated from the temperature, pressure, and relative humidity with sufficient accuracy using standard formulae [
33,
34]. If the average values of these meteorological parameters along the line of sight are correctly entered in the total station when carrying out the measurement, the data output is already corrected for the atmospheric effects. However, if high accuracy is needed, the meteorological parameters may not be known with sufficient accuracy; measurement of these parameters is often possible only at the instrument site and a few other sites, but not along the entire line of sight. Furthermore, for practical reasons, the meteorological measurements stored in the instrument will not refer to the exact moment of the measurement but to some prior time. A deviation of the actual average conditions along the line of sight from the values stored in the instrument by 1 °C or 3.6 mbar results in a scale error of 1 ppm. In the alpine environment of the present study, with reflectors located on the other side of the glacier, the temperature and pressure differences along the lines of sight may by far exceed these values. Thus, the atmospheric correction by forward modeling using the standard formulae will have to account for large-scale and long-term variations (daily and seasonal changes of the meteorological parameters). Data-driven approaches need to be used for the further reduction in the atmospheric effects.
The temperature and pressure gradients causing the ray bending (see, e.g., [
35]) are predominantly vertical gradients. So, vertical angles are much more affected than the horizontal ones. The effect is usually negligible for measurements on short lines of sight (below a few hundred meters) and can be modeled using the equations and nominal atmospheric parameters for lines of sight far away from the ground (several hundred meters above ground). However, for configurations such as the ones in the present use case with long lines of sight, partially close to the ground and above inhomogeneous surfaces, there is no sufficiently accurate numeric model for the forward compensation of ray bending and the resulting angle errors based on meteorological parameters. Data-driven mitigation may be possible if there are stable calibration targets for calculating the impact of refraction on the angles in the vicinity of the targets to be monitored. In our scenario, we assumed that no such stable calibration targets exist, and measurements were taken along the slope as well as across the valley (
Figure 1)—each with individual and different atmospheric conditions. For this reason, no systematic atmospheric correction for angular measurements was possible. An attempt to correct for orientation errors with multiple reflectors in the same profile as the TPS stations is described by Frukacz et al. [
26] but has not been systematically applied so far.
The GNSS data were processed in a fully automated processing chain with the Bernese GNSS Software, based on single-frequency differential carrier phase techniques [
36]. A permanent geodetic GNSS reference station at Fiesch, operated by the Institute of Geodesy and Photogrammetry (IGP ETH Zurich), was used as a reference for processing. The baseline length between the reference and the GNSS station at TPS1 is approximately 5 km and at TPS2 about 7 km, whereas both TPS1 and TPS2 are located further downhill, with height differences of 412 m (TPS1) and 188 m (TPS2). The coordinates were computed for one position every 24 h in static mode, representing mean positions over this period [
37]. For the horizontal coordinates, an accuracy of 2 mm was obtained (empirical standard deviation, based on a regression line over several weeks) and 18 mm for the vertical coordinates. The total station measurements were exported from GeoMoS as raw data measurements and eventually corrected for the total station positioning changes recorded with the GNSS sensor physically coupled to the total station. In a first step, the positions from the atmospheric uncorrected distance and the horizontal and vertical angle measurements were calculated for each measurement period. Then, cumulative differences to the first measurement epoch in East, North, and Height were calculated (dE, dN, dH). In a second step, the nightly mean average of the measurements between 23:00 and 5:00 was computed and, together with the GNSS position changes for the same night, the shifted cumulative difference delivered the final displacement data.
3. Results
A large data set has been recorded using the described monitoring system installed at Chatzulecher (TPS1) and Driest (TPS2) since 2014. While the scientific interpretations of these measurements are presented elsewhere (e.g., in [
23,
24]), we focus here on the performance and robustness of the network.
3.1. Data Availability
Figure 5 and
Figure 6 provide an overview of the measurements performed by both of the TPS systems over the entire monitoring period considered (2014–2019). In general, we note that the majority of the points could be regularly measured over about 6 years, with good performance in terms of the daily measurement cycles. This is a very good result considering the environmental difficulties encountered in the high alpine regions. It was observed that reflectors located on the same side of the valley as the total station could be measured more frequently. This was caused by different weather conditions across the valley which could prevent measurements, while along the slope the weather was more constant. The points monitored by TPS1 were measured on average more than 6 times every day, apart from very specific cases. The data gaps are minor and are mainly related to communication problems and winter periods when some prisms were covered by snow. The amount of monitoring points remained quite stable over the entire period, and only five additional points were installed to complement the available information on key areas. Some of the points were unfortunately destroyed by rockfalls and/or snow avalanches, and their re-installation was not always achieved due to access difficulties. The TPS1 reference point for orientation (point 10) was regularly measured over the entire time period with >12 measurements/day. The reference point was modified to point 68 in 2019. Very high measurement rates in the summer of 2019 (24/day) at points 8 and 9 are related to an experiment performed to capture hourly variations of displacements associated with temperature and recharge fluctuations, and the results will be shown in the framework of specific scientific publications.
The number of points monitored by TPS2 is much larger and needed a series of adaptions during the monitoring period. Moreover, at TPS2 we experienced more problems related to data communication, as well as a longer data gap during the 2018 winter period. Point 39 (orientation reference) was also regularly measured over the entire time period, although with lower revisit rates compared to TPS1, leading to consequences in measurement precision. Slope acceleration occurred at the location Sand in the summer of 2015 (point 61 to 66) and at the Moosfluh in the fall of 2016 (points 71 to 83, see [
23,
24]) which required the installation of additional reflector points. Many points installed in the most active portions of the Mooslfluh slope instability were destroyed and repositioned several times due to increased block rotations and rock fall activity. The monitoring strategy for the points measured by TPS2 required more adaption due to the specific situation encountered at the Moosfluh slope, where the measurement rate was increased to 24/day during the 2016 slope acceleration and then progressively decreased to save energy during the periods of landslide deceleration. In the summer of 2018, an early warning system was operative during drilling operations and the installation of borehole monitoring instruments [
38], which required high measurement rates to identify the displacement rate increase in advance, potentially leading to dangerous scenarios for the operators permanently located in the area. The increase/decrease of daily measurement rates was adapted at both TPS stations for power saving during relatively long periods of adverse meteorological conditions and also depending on the status of the batteries.
3.2. Measurement Precision
The nominal distance accuracy (derived from the technical specifications) is 1 mm + 1.5 ppm for TPS1 at Chatzulecher and 0.6 mm + 1 ppm for TPS2 at Driest. The angular accuracy of a dual-face measurement is specified as 1″ (arc seconds) for TPS1 and 0.5″ for TPS2. To estimate the actual precision in our specific setting, we grouped point targets with similar distances from the total stations and calculated the empirical standard deviations from the corresponding time series of coordinates. For the point groups around TPS1, the theoretical standard deviations range from 1.5 mm for each direction (radial, tangential; point group i) to 2.5 mm (radial) and 4.8 mm (tangential) for point group iii (
Figure 7). For the point groups measured from TPS2, the empirical standard deviations range from 1 mm (tangential and radial) for points within 300 m of distance (point group iv) up to 3.6 mm (radial) and 8.2 mm (tangential) for points within 1700 m distance (point group vi). A specific reflector, point 54, was selected to investigate the effect of the temperature and pressure corrections in a specific time window. This reflector is located in a stable slope, 1451 m away from TPS2 towards the south and 364 m in altitude further down across the valley. During a 6-day period (31 September 2014 to 5 October 2014), hourly measurements of distances, as well as horizontal and vertical angles were conducted. The distance measurements show daily cycles which strongly correlate with the daily temperature changes as well as the pressure trends (
Figure 8a). These cycles are still visible after correcting the raw data measurements with the atmospheric correction factors (due to very inhomogeneous conditions in measuring across the valley), but the trend of this time period, caused by pressure changes, can be mitigated (
Figure 8c). The measurements taken during the night show a reduced scattering due to more stable atmospheric conditions. Processing only nightly measurements (between 23:00 and 05:00) results in higher measurement precision. This is in agreement with a detailed analysis of the refraction effects on terrestrial laser scanning in the same area presented by Friedli et al. [
39].
3.3. Reversible Displacements at Stable Slopes
Here, we present the cyclic deformations recorded over 4 years by the TPS and GNSS system on the stable rock mass between Chatzulecher and Ze Baechu across the valley (reflector prism 1 and 8 in
Figure 7 and
Figure 9b) and assess the magnitudes of the reversible displacements and strains.
Figure 9a shows the total snow heights, precipitation, and maximum daily temperatures recorded at the meteo station Eggishorn (2893 m a.s.l.) during the same time period.
Figure 9b reveals changes in the horizontal and vertical distances measured relative to the valley axis (dL, dQ, dH) between reflector 1 (646′616, 140′269, 1887; all coordinates in CH1903: East, North, Height) and reflector 8 (647′024, 139′631, 1925). Both the transversal (dL) and the vertical annual displacement amplitudes (dH) are in a similar range, varying annually between 24 mm and 62 mm. As only relative displacements between the prisms within the same system were observed, the values were estimated from raw measurements.
Accounting for the temperature changing between summer and winter, thus adding a temperature correction for the ~20 °C temperature difference, results in ~13 mm of the transversal displacement over a 756 m distance between the points caused by atmospheric refraction. The strain calculated as normal to the valley axis (dL/L) and in the vertical direction (dH/H) is between 3.6 × 10⁻⁵ to 8.2 × 10⁻⁵. It was also noticed that the movements are not completely reversible as all the components of the changes do not completely reach back to the initial level. The yearly irreversible strains are in the order of 7 × 10⁻⁶ for the lateral and 8 × 10⁻⁶ for the vertical components. Longer time series are required to confirm these long-term irreversible trends.
Figure 9c displays the change in position recorded from the GNSS antenna mounted at total station Chatzulecher (TPS1). The three components of East, North, and Height also show annual reversible position changes of several mm. The eastern component in the GNSS position changes in the range of 12 mm, whereas the northern component changes up to 22 mm, both with an accuracy of 2.5 mm. The accuracy of the heights is expected to be in the range of 18 mm. The measured displacements of TPS1 occur every year between April and July, with magnitudes of ~20 mm towards the northwest, before going back in the direction of the initial position. Similar to the measured reflectors, part of the yearly deformation cycle seems to be irreversible and in the range of 1–2 millimeters per year towards the northwest (downslope). As expected, the absolute movements from only one side of the valley, as determined from a single GNSS sensor, are smaller than the relative displacements between the two observation points on opposite sides of the valley.
Two independent measurement methods (relative RTS measurements between two points across the glacier and the GNSS data) show the same magnitudes and directions of reversible slope deformations, likely caused by groundwater infiltration from snowmelt and summer rainstorms [
40,
41] during spring and early summer. In addition, both data sets suggest an additional irreversible downslope displacement component of a few millimeters per year. A detailed analysis and modeling to better understand the physical processes can be found in Oestreicher et al. (2021) [
42]. They correlate extensive hydrologic data from boreholes with surface displacement data from this monitoring system and hypothesize that the irreversible deformation is caused partly by hydro-mechanically-controlled slope fatigue and partly by the effect of glacial retreat.
3.4. 3D Displacement at Landslides
For each of the two active landslides in the area of study, Driest and Moosfluh, we select four reflectors and show the uncorrected cumulative 3D displacement data in
Figure 9d,e. The Driest instability (
Figure 9d) shows an average total 3D displacement of 2–3 mm/month in the central part between 2014 and 2017. The displacement velocities are not constant throughout the year though, as usually during the 1–2 month snowmelt period the displacement rates briefly increase up to 10 mm/month and show constant displacements the rest of the year. During the exceptionally high snowmelt period of 2018, the Driest instability accelerated much more than in the years before with rates of up to 40 mm/month.
Figure 9e shows reflector data from the Moosfluh instability. After two years of measurement with displacement rates of about 40 mm/month (2014–2016), the slope movements suddenly accelerated dramatically, up to several meters/week in September 2016. Significant accelerations are always visible during the snowmelt, with accelerations of around 100 mm/month in 2015 and 250 mm/month in 2016. In September 2016, a second phase of acceleration led to the so-called “Moosfluh Crisis”, continuing until the fall of 2019. As described in [
24], this crisis affected the entire slope, which transitioned from a toppling-mode deep-seated gravitational slope deformation (DSGSD) into a rapidly mixed sliding-toppling mass with displacements of several meters per month (e.g., reflector 35 with 8.1 m/month in October 2016; red line in
Figure 9e). For the investigation of subsurface structures and kinematic modes, the 3D displacement vectors from our TPS stations and their evolution with time have shown to be of prime importance [
24].
4. Discussion and Conclusions
A high-precision total station monitoring system installed in the surroundings of the glacial tongue of the Great Aletsch Glacier in Switzerland was described in great detail. Two robotic total stations combined with permanent GNSS recordings are continuously measuring the 3D displacement of over 80 reflector prisms at up to a 2 km distance and with high accuracies. The design includes the protection of the instruments with polyamide cylinders and of the prisms with aluminum roofs. The construction involves a lightning concept and the transmission of monitoring data. A double-walled aluminum pillar carrying the total station and the GNSS antenna showed negligible thermal and physical deformation, setting the basis for the most accurate measurements.
The performance in the case of the data availability has proven very good considering the environmental effects in this high alpine environment: the majority of the reflector prisms could be regularly measured over the 6-year operation period. The measurement precision of the two instruments varies depending on the distance of the prisms to the instrument. For TPS1 at Chatzulecher (Leica TCP1201), the most distant reflectors are about 1000 m from the station, resulting in a radial precision of 2.5 mm and a tangential precision of 4.8 mm. For TPS2 at Driest with a Leica Nova TM50 instrument, a similar distance (1.2 km) shows a radial precision of only 1.8 mm and a tangential precision of 2.9 mm.
Looking at the reversible slope deformations on the stable slopes, we compared two independent measurement methods, the relative total station measurements between two points across the glacier, and the GNSS data. Both systems show the same magnitudes and directions of reversible slope deformations during the spring and early summer of a few centimeters per year, including a very small irreversible component. For the two active landslides in the study area, displacements of up to 10 millimeters per month in highly active phases during snowmelt are recorded for the Driest Instability and up to 8 m per month for the Moosfluh Landslide in October 2016.
In summary, the described system has successfully recorded several types of paraglacial deformation processes, such as gravitationally driven and irreversible rock slope movements, reversible rock slope deformations caused by annual cycles of groundwater recharge and depletion, and small irreversible deformations of stable rock slopes resulting from progressive rock damage driven by cyclic hydraulic and thermal loading. The developed monitoring system reached the required robustness and accuracy in all phases of its 6-year operation time. The experience gained during the design, installation, and management of the monitoring network provides guidelines and hints, as well as advantages and disadvantages, to be considered for similar scenarios. In particular, we highlight 6 important points to be considered:
- (a)
High-resolution ground surface displacement monitoring systems in alpine catchments, where several irreversible and reversible deformation phenomena occur at different spatial and temporal scales, cannot rely on any stable reference. Combining GNSS data with TPS measurements has demonstrated to be a good option to record reliable daily displacement data, besides complex network adjustment techniques [
26]. Constantly updating the position and orientation of the automated total station increases accuracies in the absence of stable locations for placing the instrument and control prisms [
6,
43]. Not accounting for total station displacement in the case of reversible slope deformation would deliver an erroneous picture of small displacements, both in magnitude and direction.
- (b)
As the stability of the total station pillar can lead to a variation of the center position of the total station and cause misinterpretations of the actual movement of the observed reflector prisms, the final accuracy of the results can be improved by considering pillar stability [
6,
26]. This is an especially important aspect when displacements at the pillar top are in the same order of magnitude as the expected displacements of the observed points. In this study, we show that the tilt of the total station due to the bending of the pillar is within the range of the internal tiltmeter correction of the instrument and automatically compensated for.
- (c)
During wintertime, when the recharge of the batteries by solar radiation is low, it is advantageous to trigger measurements manually during good phases of bad weather conditions at moments when clouds open the view, and a free line of sight is existent. This requires a webcam of the area and (so far) a person deciding to trigger a measurement. In GeoMoS, the possibility exists to define how many times GeoMoS will re-try to measure a point if it is not found. The purpose of this option is to avoid the case that a point was not measured because of some temporary obstruction. During times of low battery or in the case that a reflector prism is covered or destroyed, this can use a lot of energy and may not result in reliable measurements. Further measurement deficiencies are caused by seasonal maintenance of the mobile radio antennas which are used for data transmission. In our study area, this happens twice a year and only for a few days, though the concept of remotely controlled monitoring prohibits any measurements during this time, which would not be the case if a computer unit controlled the system on site.
- (d)
The accuracy of the total station measurements is strongly connected to atmospheric influences. For small displacement magnitudes, post-processing of the observation data with meteorological parameters (temperature, pressure, and humidity) is essential [
32,
35] and proved to reduce daily and seasonal fluctuations in this study. Furthermore, results obtained from measurements collected during the night rather than during the day were less affected by temporal variations of atmospheric conditions. In this study, we show that the results from small reversible slope deformations (absolute positions or relative displacements between two points) strongly improve by adding meteorological corrections. Direct atmospheric correction of monitoring data in a black-box process by the total station is not recommended; this could introduce significant errors for the times where these measurements are not representative of the conditions along the respective lines of sight. Therefore, we suggest recording the raw data and post-processing them for the further analysis.
- (e)
During the dramatic acceleration of the Moosfluh landslide in September 2016, the system recorded daily displacements of up to 1 meter per day and proved to be flexible as we could constantly add reflector prisms in the area of interest. However, it is dangerous to install reflector prisms in such active zones, mainly due to rockfall and deep crack formation due to active ground movement, and the working life of such reflector prisms can be very short. Reflectorless measurements in such active zones with terrestrial radar interferometry and Digital Image Correlation from time-lapse cameras can be a safer alternative and was used at Moosfluh to deliver the spatial information of the instable zone well within the range of accuracy needed for hazard analysis [
24,
44]. However, total station measurements are required for the investigation of the kinematic slope evolution from 3D surface vector data analysis.
- (f)
The majority of the points measured by both TPS systems regularly delivered good performance results over the entire monitoring period considered (2014–2019). Different weather conditions across the valley favor measurements to reflectors located on the same side of the valley as the total station. The system proved flexible when additional reflector prisms were installed during slope accelerations at the location Sand in the summer of 2015 and at Moosfluh in the fall of 2016 and also when the measurement rate was increased to 24/day and then progressively decreased to save energy during the periods of landslide deceleration. An early warning system was operative during drilling the operations and installation of the borehole monitoring instruments in 2018. This required high measurement rates to identify displacements which could potentially lead to dangerous scenarios for the operators permanently located in the area.
- (g)
Remote sensing monitoring systems, including terrestrial, airborne and spaceborne sensors, are often convenient to avoid field installations in high alpine environments. The main advantage lies in the fact that an increased amount of measurement points can be available, allowing for a better spatial representation of the surface displacement filed. However, the achievable accuracies are not yet comparable with the TPS measurements. In addition, data storage and transfer, as well as data processing, can lead to additional complications especially for long-term monitoring purposes. For these reasons, we believe that TPS can be still very powerful systems for the detailed analysis of surface-displacement processes in high mountain environments.
Author Contributions
Conceptualization, F.G., A.M., A.W. and S.L.; methodology, F.G., S.L., R.S., A.M., J.A., L.G., S.C., A.W., P.L.; validation, A.M., and S.L.; investigation, F.G., R.S., L.G., and S.C.; writing—original draft preparation, F.G.; writing—review and editing, A.M., J.A., A.W. and S.L.; project administration, S.L.; funding acquisition, S.L. All authors have read and agreed to the published version of the manuscript.
Funding
This project was funded by the Swiss National Science Foundation (projects 146593 and 172492).
Data Availability Statement
Data generated in this study and their corresponding metadata will be freely available on the ETH Research Collection upon publication via:
http://hdl.handle.net/20.500.11850/515184. A DOI was generated for the data: 10.3929/ethz-b-000515184, which is linked to the ETH Research Collection upon publication. Instructions for data access are given in the metadata on the ETH Research Collection.
Acknowledgments
This project was funded by the Swiss National Science Foundation (projects 146593 and 172492). The value of this study increased greatly from collaboration with Peter Schwitter (Natural Hazard Observation Service Naters), who supported us in the field, and Laudo Albrecht (ProNatura Center Aletsch) and the Community of Riederalp (Peter Albrecht), who enabled the construction of a monitoring network within the protected areas of the Aletsch Forest.
Conflicts of Interest
Author Grämiger, L. was employed by Dr. von Moos AG; author Conzett, S. was employed by terra vermessungen ag; author Limpach, Ph. was employed by BSF Swissphoto AG. The remaining authors declare that the research was conducted in the absence of any commercial or financial relationships that could be construed as a potential conflict of interest. The funders had no role in the design of the study; in the collection, analyses, or interpretation of data; in the writing of the manuscript; or in the decision to publish the results.
References
- Ambrosi, C.; Crosta, G. Large sackung along major tectonic features in the Central Italian Alps. Eng. Geol. 2006, 83, 183–200. [Google Scholar] [CrossRef]
- Bovis, M.J.; Stewart, T.W. Long-Term Deformation of a Glacially Undercut Rock Slope, Southwest British Columbia; August Aimé Balkema: Avereest, The Netherlands, 1998; pp. 1267–1276. [Google Scholar]
- Fey, C.; Wichmann, V.; Zangerl, C. Reconstructing the evolution of a deep seated rockslide (Marzell) and its response to glacial retreat based on historic and remote sensing data. Geomorphology 2017, 298, 72–85. [Google Scholar] [CrossRef]
- Fischer, L.; Amann, F.; Moore, J.R.; Huggel, C. Assessment of periglacial slope stability for the 1988 Tschierva rock avalanche (Piz Morteratsch, Switzerland). Eng. Geol. 2010, 116, 32–43. [Google Scholar] [CrossRef]
- Brown, N.; Kaloustian, S.; Roeckle, M. Monitoring of Open Pit Mines Using Combined GNSS Satellite Receivers and Robotic Total Stations. In Proceedings of the 2007 International Symposium on Rock Slope Stability in Open Pit Mining and Civil Engineering, Perth, Australia, 12–14 September 2007; pp. 417–429. [Google Scholar]
- Castagnetti, C.; Bertacchini, E.; Corsini, A.; Capra, A. Multi-sensors integrated system for landslide monitoring: Critical issues in system setup and data management. Eur. J. Remote Sens. 2013, 46, 104–124. [Google Scholar] [CrossRef]
- Labhard, T. Petrotektonische Untersuchungen am Südrand des Aarmassivs Nördlich Naters (Wallis, Schweiz). In Beitr zur Geol Karte der Schweiz, neue Folge Lieferung 124, Bern, Switzerland, 81 S; Kuemmerly und Frey: Bern, Switzerland, 1965. [Google Scholar]
- Steck, A. Die alpidischen Strukturen in den Zentralen Aaregraniten des westlichen Aarmassivs. Eclogae Geol. Helv. 1968, 61, 19–48. [Google Scholar] [CrossRef]
- Ivy-Ochs, S. Glacier variations in the European Alps at the end of the last glaciation. Cuad. De Investig. Geográfica/Geogr. Res. Lett. 2015, 41, 295–315. [Google Scholar] [CrossRef] [Green Version]
- Ivy-Ochs, S.; Kerschner, H.; Reuther, A.; Preusser, F.; Heine, K.; Maisch, M.; Kubik, P.W.; Schlüchter, C. Chronology of the last glacial cycle in the European Alps. J. Quat. Sci. 2008, 23, 559–573. [Google Scholar] [CrossRef]
- Maisch, M. Zum neuzeitlichen, gegenwärtigen und zukünftigen Gletscherschwund in Graubünden. Geogr. Helv. 1991, 46, 183–187. [Google Scholar] [CrossRef]
- Alley, R.B.; Meese, D.A.; Shuman, C.A.; Gow, A.J.; Taylor, K.; Grootes, P.M.; White, J.W.C.; Ram, M.; Waddington, E.D.; Mayewski, P.A.; et al. Abrupt increase in Greenland snow accumulation at the end of the Younger Dryas event. Nature 1993, 362, 527–529. [Google Scholar] [CrossRef]
- Kelly, M.A.; Kubik, P.W.; Von Blanckenburg, F.; Schlüchter, C. Surface exposure dating of the Great Aletsch Glacier Egesen moraine system, western Swiss Alps, using the cosmogenic nuclide 10Be. J. Quat. Sci. 2004, 19, 431–441. [Google Scholar] [CrossRef]
- Schindelwig, I.; Akçar, N.; Kubik, P.W.; Schlüchter, C. Lateglacial and early Holocene dynamics of adjacent valley glaciers in the Western Swiss Alps. J. Quat. Sci. 2011, 27, 114–124. [Google Scholar] [CrossRef]
- Joerin, U.E.; Stocker, T.F.; Schlüchter, C. Multicentury glacier fluctuations in the Swiss Alps during the Holocene. Holocene 2006, 16, 697–704. [Google Scholar] [CrossRef]
- Schimmelpfennig, I.; Schaefer, J.; Akçar, N.; Ivy-Ochs, S.; Finkel, R.; Schlüchter, C. Holocene glacier culminations in the Western Alps and their hemispheric relevance. Geology 2012, 40, 891–894. [Google Scholar] [CrossRef]
- Glaciological Reports. “The Swiss Glaciers” Yearbooks of the Cryospheric Commission of the Swiss Academy of Sciences (SCNAT) Published Since 1964 by the Laboratory of Hydraulics, Hydrology and Glaciology (VAW) of ETH Zürich, No. 1–126. 1881–2017. Available online: http://glaciology.ethz.ch/swiss-glaciers/ (accessed on 23 July 2018).
- Grämiger, L.M.; Moore, J.R.; Gischig, V.S.; Loew, S. Thermomechanical Stresses Drive Damage of Alpine Valley Rock Walls during Repeat Glacial Cycles. J. Geophys. Res. Earth Surf. 2018, 123, 2620–2646. [Google Scholar] [CrossRef]
- Kääb, A. Monitoring high-mountain terrain deformation from repeated air- and spaceborne optical data: Examples using digital aerial imagery and ASTER data. ISPRS J. Photogramm. Remote Sens. 2002, 57, 39–52. [Google Scholar] [CrossRef]
- Vogler, M. Hydro-Mechanical Interactions between the Great Aletsch Glacier and the Driest landslide (Switzerland); ETH Zurich: Hong Kong, China, 2015. [Google Scholar]
- Kos, A.; Amann, F.; Strozzi, T.; Delaloye, R.; Ruette, J.; Springman, S. Contemporary glacier retreat triggers a rapid landslide response, Great Aletsch Glacier, Switzerland. Geophys. Res. Lett. 2016, 43, 12466–12474. [Google Scholar] [CrossRef]
- Strozzi, T.; Delaloye, R.; Kääb, A.; Ambrosi, C.; Perruchoud, E.; Wegmüller, U. Combined observations of rock mass movements using satellite SAR interferometry, differential GPS, airborne digital photogrammetry, and airborne photography interpretation. J. Geophys. Res. Space Phys. 2010, 115, F01014. [Google Scholar] [CrossRef] [Green Version]
- Glueer, F.; Loew, S.; Manconi, A. Paraglacial history and structure of the Moosfluh Landslide (1850–2016), Switzerland. Geomorphology 2019, 355, 106677. [Google Scholar] [CrossRef]
- Glueer, F.; Loew, S.; Manconi, A.; Aaron, J. From Toppling to Sliding: Progressive Evolution of the Moosfluh Landslide, Switzerland. J. Geophys. Res. Earth Surf. 2019, 124, 2899–2919. [Google Scholar] [CrossRef]
- Leica Geosystems, A. Leica GeoMoS v5.1. User Manual; Pangea Geosystems: Perth, Australia, 2013; p. 712. [Google Scholar]
- Frukacz, M.; Presl, R.; Wieser, A.; Favot, D. Pushing the sensitivity limits of RTS-based continuous deformation monitoring of an alpine valley. Appl. Geomatics 2017, 9, 81–92. [Google Scholar] [CrossRef] [Green Version]
- Lienhart, W. Geotechnical monitoring using total stations and laser scanners: Critical aspects and solutions. J. Civ. Struct. Health Monit. 2017, 7, 315–324. [Google Scholar] [CrossRef]
- Wieser, A.; Presl, R. Systematische Einflüsse auf geodätische Totalstationsmessungen: Der Einfluss unterschiedlicher Schutzgehäuse auf Strecken- und Winkelmessung bei Totalstationen. GeoNews 2014, 1, 7. [Google Scholar]
- Dehn, S. Surge Protection Lightning Protection/Earthing Safety Equipment; DEHN + SöHNE GmbH + Co.KG.: Neumarkt, Germany, 2014; p. 489. [Google Scholar]
- Freeman, W. Lightning Protection, Grounding, Bonding, Shielding, and Surge Protection Requirements. National Weather Service Manual NWSM 30-4106 2017, Maintenance, Logistics, and Facilities Facilities Management, NWSPD 30–41; NWSM: Peshawar, Pakistan, 2017; p. 186. [Google Scholar]
- Vaisala. Technical Reference—Grounding and Lightning Protection in Vaisala Outdoor Installations; M211786EN-B; Vaisala Oyj: Vantaa, Finland, 2018; p. 66. [Google Scholar]
- Rüeger, J. Basic Working Principles of Electronic Distance Meters. In Electronic Distance Measurement: An Introduction; Springer: Berlin/Heidelberg, Germany, 1990; pp. 31–47. [Google Scholar]
- Ciddor, P.E.; Hill, R.J. Refractive index of air. 2. Group index. Appl. Opt. 1999, 38, 1663–1667. [Google Scholar] [CrossRef] [PubMed]
- Ciddor, P.E. Refractive index of air: New equations for the visible and near infrared. Appl. Opt. 1996, 35, 1566–1573. [Google Scholar] [CrossRef] [PubMed]
- Brunner, F.K. Modelling of Atmospheric Effects on Terrestrial Geodetic Measurements. In Geodetic Refraction: Effects of Electromagnetic Wave Propagation through the Atmosphere; Brunner, F.K., Ed.; Springer: Berlin/Heidelberg, Germany, 1984; pp. 143–162. [Google Scholar]
- Dach, R.; Andritsch, F.; Arnold, D.; Bertone, S.; Fridez, P.; Jäggi, A.; Jean, Y.; Maier, A.; Mervart, L.; Meyer, U.; et al. Bernese GNSS Software Version 5.2; AIUB Astronomical Institute, University of Bern: Bern, Switzerland, 2015. [Google Scholar]
- Limpach, P.; Geiger, A.; Raetzo, H. GNSS for Deformation and Geohazard Monitoring in the Swiss Alps. In Proceedings of the 3rd Joint International Symposium on Deformation Monitoring (JISDM 2016), Vienna, Austria, 30 March–1 April 2016. [Google Scholar]
- Hugentobler, M.; Loew, S.; Aaron, J.; Roques, C.; Oestreicher, N. Borehole monitoring of thermo-hydro-mechanical rock slope processes adjacent to an actively retreating glacier. Geomorphology 2020, 362, 107190. [Google Scholar] [CrossRef]
- Friedli, E.; Presl, R.; Wieser, A. Influence of atmospheric refraction on terrestrial laser scanning at long range. In Proceedings of the 4th Joint International Symposium on Deformation Monitoring (JISDM 2019), Athens, Greece, 15–17 May 2019. [Google Scholar]
- Hansmann, J.; Loew, S.; Evans, K.F. Reversible rock-slope deformations caused by cyclic water-table fluctuations in mountain slopes of the Central Alps, Switzerland. Hydrogeol. J. 2011, 20, 73–91. [Google Scholar] [CrossRef] [Green Version]
- Loew, S.; Ebneter, F.; Bremen, R.; Herfort, M.; Lützenkirchen, V.; Matousek, F. Annual Opening and Closure of Alpine Valleys. Felsbau: Rock Soil Eng. 2007, 25, 65. [Google Scholar]
- Oestreicher, N.; Loew, S.; Roques, C.; Aaron, J.; Gualandi, A.; Longuevergne, L.; Limpach, P.; Hugentobler, M. Controls on spatial and temporal patterns of slope deformation in a paraglacial environment. Earth Space Sci. Open Arch. M3 2021, 47. [Google Scholar] [CrossRef]
- Artese, S.; Perrelli, M. Monitoring a Landslide with High Accuracy by Total Station: A DTM-Based Model to Correct for the Atmospheric Effects. Geosciences 2018, 8, 46. [Google Scholar] [CrossRef] [Green Version]
- Manconi, A.; Kourkouli, P.; Caduff, R.; Strozzi, T.; Loew, S. Monitoring Surface Deformation over a Failing Rock Slope with the ESA Sentinels: Insights from Moosfluh Instability, Swiss Alps. Remote Sens. 2018, 10, 672. [Google Scholar] [CrossRef] [Green Version]
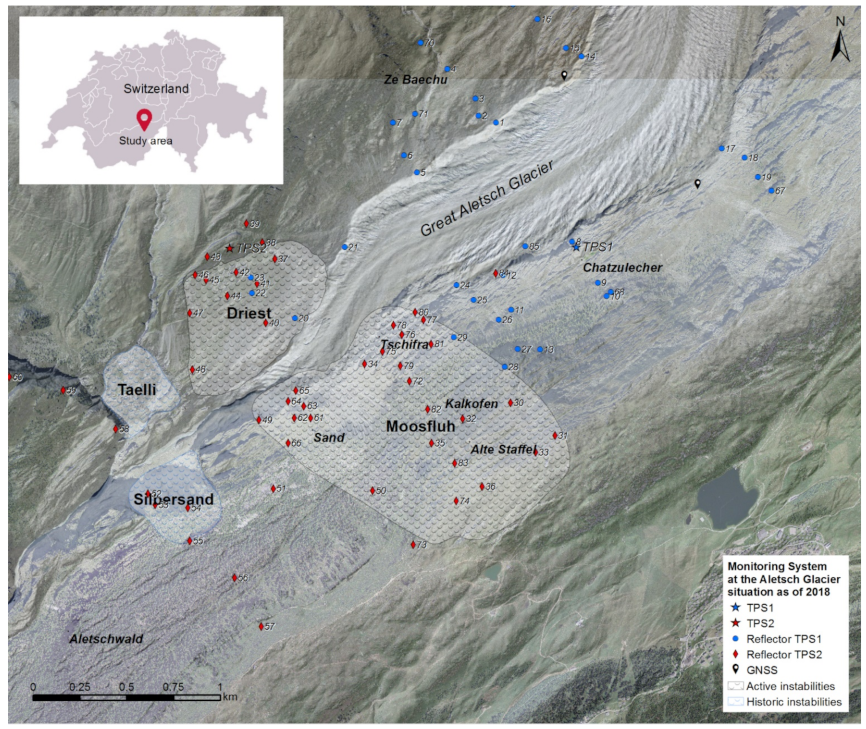
Figure 1.
Active and historic instabilities surrounding the glacier tongue of the Great Aletsch Glacier (Valais, Switzerland) and the monitoring system installed in 2013 and 2014 with two robotic total stations at Chatzulecher (TPS1) and Driest (TPS2), two meteo sensors, four permanent GNSS sensors and more than 80 reflector prisms monitored remotely on a daily basis by the total stations.
Figure 2.
The two rock slope instabilities on the northern valley flank of the Great Aletsch Glacier. (a) The Taelli instability, which started its movement in 1966 with a distinct head scarp, developed a lateral release area upslope and collapsed in 1970 at a time when the glacial ice frees the foot of the sliding mechanism slope. (b) The Driest instability with its distinctive white, fresh rock band at the head-scarp was reactivated in 1993 when it developed a lateral release area upslope. Current RTS monitoring data reveal a displacement rate of several tens of millimeters/year. Images: Federal Office of Topography swisstopo.
Figure 3.
Special aspects of the total station monitoring setup for high-precision measurements. (a) Double-walled and independently grouted pillar and protection house for the total station; (b) position deviation on the top of the inner aluminum pillar (where the RTS instrument is located) from tilt measurements of August 30 2015 (red) and contribution of the pillar bending as estimated from thermocouple measurements on the pillar itself (blue; modified from Frukacz et al., 2017); (c) variation of RTS measurements as function of angle between line of sight and pillar (framework) with four different PMMA windows (red) and without windows (blue); note that every 100° gon (=90° degree) there is a cubic aluminum rod of 20 mm width (modified from Wieser and Presl, 2014).
Figure 4.
Total station monitoring setup in the high alpine environment of the Great Aletsch Glacier with different, tested protection equipment. (a) Aluminum pillar at Chatzulecher with PMMA windows and polyamide roof; (b) aluminum pillar at Chatzulecher with PMMA cylinder and (c) aluminum pillar at Chatzulecher with an opaque polyamide cylinder and holes for unobstructed measurements; (d) protection of prisms used at Aletsch for high snow loads and heavy rainfall; proof of function of the protection roof during harsh winter conditions; less stable roof bent down by rockfall and/or snow load.
Figure 5.
Availability of TPS1 (Leica TCP 1201) measurements over the monitoring period. The target ID is shown in the
y-axis (for the location of targets see
Figure 1), while the colormap shows the amount of daily measurement cycles performed.
Figure 5.
Availability of TPS1 (Leica TCP 1201) measurements over the monitoring period. The target ID is shown in the
y-axis (for the location of targets see
Figure 1), while the colormap shows the amount of daily measurement cycles performed.
Figure 6.
Availability of TPS2 (Leica TM50) measurements over the monitoring period. The target ID is shown in the
y-axis (for the location of targets see
Figure 1), while the colormap shows the amount of daily measurement cycles performed.
Figure 6.
Availability of TPS2 (Leica TM50) measurements over the monitoring period. The target ID is shown in the
y-axis (for the location of targets see
Figure 1), while the colormap shows the amount of daily measurement cycles performed.
Figure 7.
Point groups within the RTS Monitoring area surrounding the Great Aletsch Glacier and expected radial and tangential precision of measurements for the instruments installed at TPS1 (Leica TCP 1201) and TPS2 (Leica TM50) measured in ATR mode.
Figure 7.
Point groups within the RTS Monitoring area surrounding the Great Aletsch Glacier and expected radial and tangential precision of measurements for the instruments installed at TPS1 (Leica TCP 1201) and TPS2 (Leica TM50) measured in ATR mode.
Figure 8.
Impact of distance measurements from atmospheric inhomogeneities. (a) Temperature and atmospheric pressure at TPS2 Driest (Leica Nova TM50) over a 6-day period (30 September 2014 to 5 October 2014); (b) raw data distance measurements of reflector 54 measured across the valley at 1451 m distance; and (c) distance measurements after correction of atmospheric impacts due to temperature and pressure changes. The results confirm that our approach of only using nightly measurements (between 23:00 and 05:00, marked in grey) helped in obtaining a higher measurement repeatability during phases of a more stable atmosphere.
Figure 9.
Four-year time series of meteo, total station monitoring, and GNSS data at the Great Aletsch Glacier region and location of the measurement points. Blue bars represent the time period of snow melt. (a) Total snow depth, precipitation, and maximum temperatures recorded at Eggishorn (2893 m a.s.l.); (b) relative movements in longitudinal, height, and orthogonal direction of the line between two reflector points (1 and 8) across the Great Aletsch Glacier showing a reversible strain of about 6 × 10⁻⁵ with an irreversible component of about 7 × 10⁻⁶; (c) change of a single GNSS sensor position recorded at Chatzulecher (TPS1) located in ‘stable’ ground, evidencing the existence of reversible slope deformations in the range of ±12 mm for the East and ±20 mm for the North component; (d) cumulative 3D displacement of reflectors located within the active Driest instability north of the Aletsch Glacier; (e) cumulative 3D displacement of reflectors located within the Moosfluh instability showing an acceleration of the landslide movement during snowmelt in April/May of every year and the exceptional event of September 2016.
![Geosciences 11 00471 g009]()
Table 1.
Equipment used for the monitoring system at Aletsch.
Table 1.
Equipment used for the monitoring system at Aletsch.
| Amount | Equipment Type | Purpose |
|---|
| 1 | Leica TCP1201 robotic total station | Measure the 3D coordinates of prisms using automatic target recognition (ATR) |
| 1 | Leica Nova TM50 robotic total station | Measure the 3D coordinates of prisms using automatic target recognition (ATR) |
| 2 × 2 | Kyocera photovoltaic module KD145GH-4YU | Polycrystalline solar module with 1 m² surface area each |
| 2 × 2 | Aluminum MgSi pillars (1.5 m heigh and 5 mm wall thickness) | Stable mounting of the total station on the inner pillar (diameter 0.23 m) and shielding of that pillar from one-sided external influences by the outer pillar (diameter 0.3 m) |
| 2 | u-blox L1 GNSS modules and NovAtel GPS-701-GG L1 GNSS antenna | Collect GNSS data for continuous 3D position determination |
| 2 | AnyRover mobile access router | For data transmission |
| 2 | Absorbent Glass Mat batteries (AGM; 2 × 270 Ah) | Power input for approximately more than 72 h without charging |
| 2 | Steca PR2020 solar charge controller | Control solar charging from solar panels with 2 m² surface area |
| 2 | Studer MDCI DC/DC converter | Regulate the output voltage from AGM batteries |
| 84 | Circular prisms GPH1-MP and protection roofs | Monitoring points |
| 2 | STS DTM combined temperature/pressure sensor | Provide meteo data at the RTS sites |
| 1 | Bernese GNSS software | Computation of daily static coordinates based on differential carrier phase post-processing |
| 1 | Leica GeoMoS software | Control of total station and meteo sensor measurements |
| Publisher’s Note: MDPI stays neutral with regard to jurisdictional claims in published maps and institutional affiliations. |
© 2021 by the authors. Licensee MDPI, Basel, Switzerland. This article is an open access article distributed under the terms and conditions of the Creative Commons Attribution (CC BY) license (https://creativecommons.org/licenses/by/4.0/).


 ,
, 


