Mapping Landform and Landslide Susceptibility Using Remote Sensing, GIS and Field Observation in the Southern Cross Road, Malang Regency, East Java, Indonesia

 ,
,  ,
,  ,
,  and
and
Abstract
1. Introduction
2. Methodology
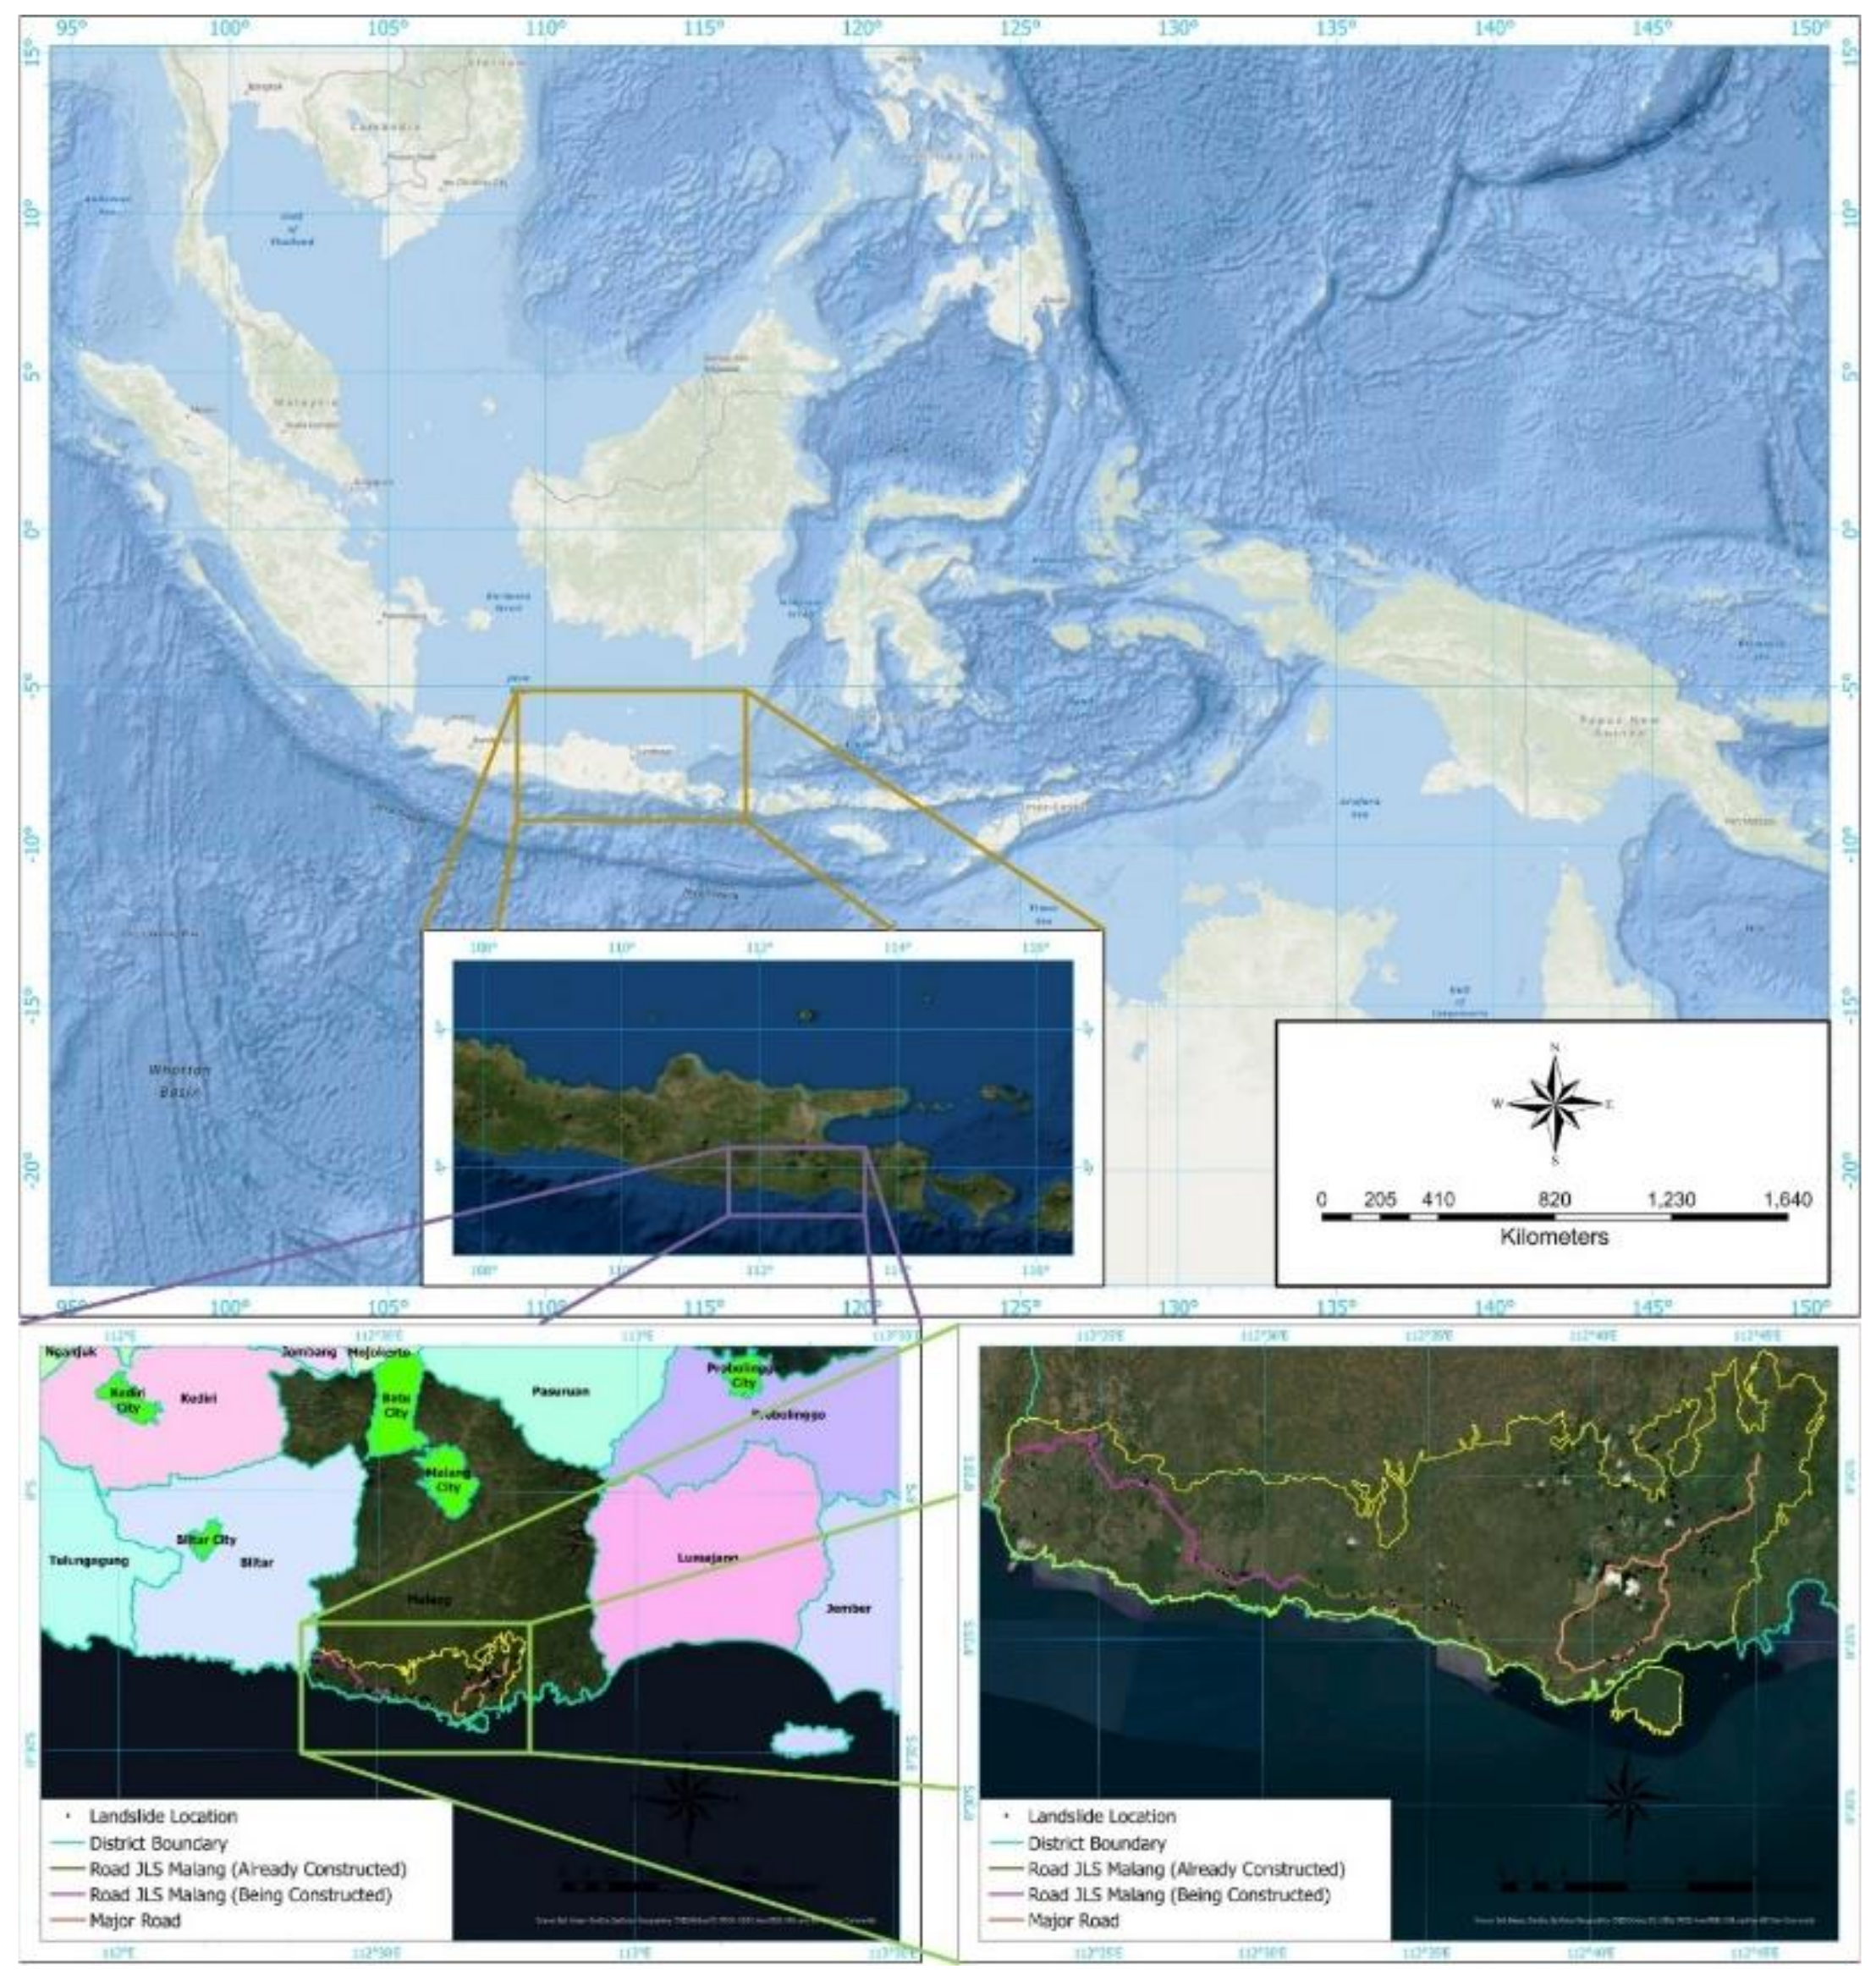
2.1. Study Area
2.2. Data Availability
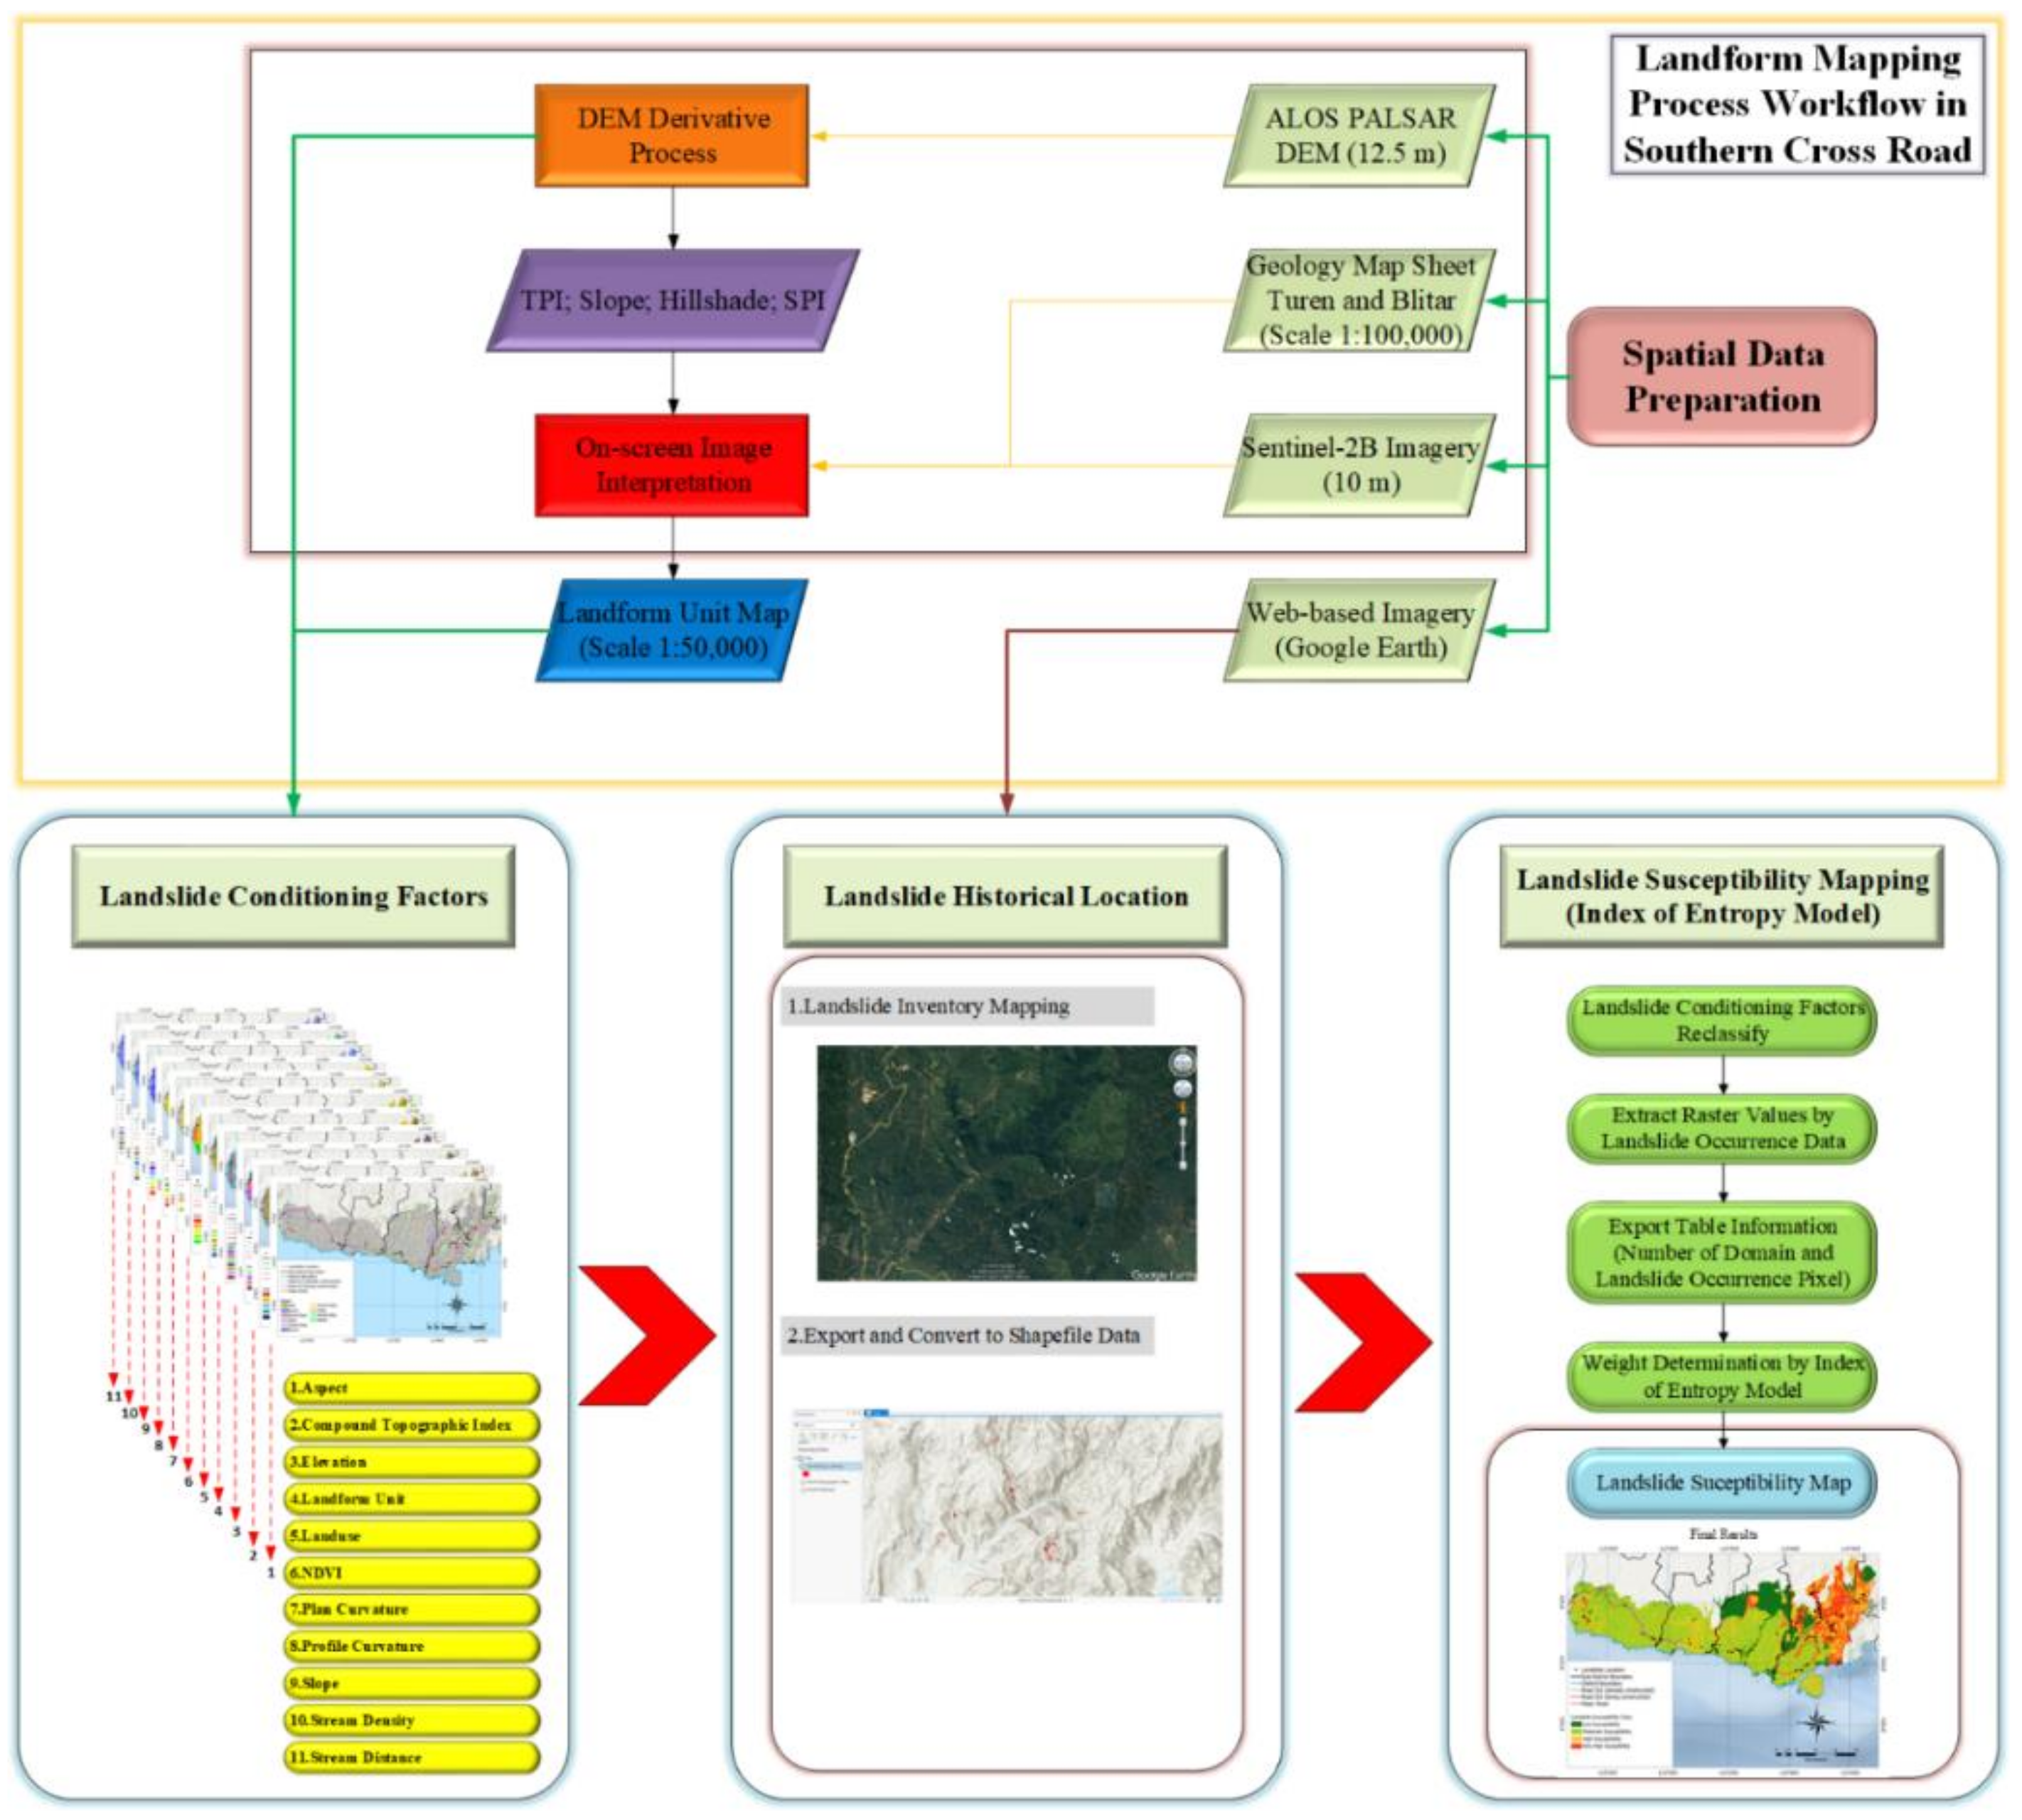
2.3. Data Analysis
2.3.1. Data Extraction Using DEM
2.3.2. On-Screen Image Interpretation (OSII)
2.3.3. Landslide Susceptibility Mapping
3. Results and Discussion
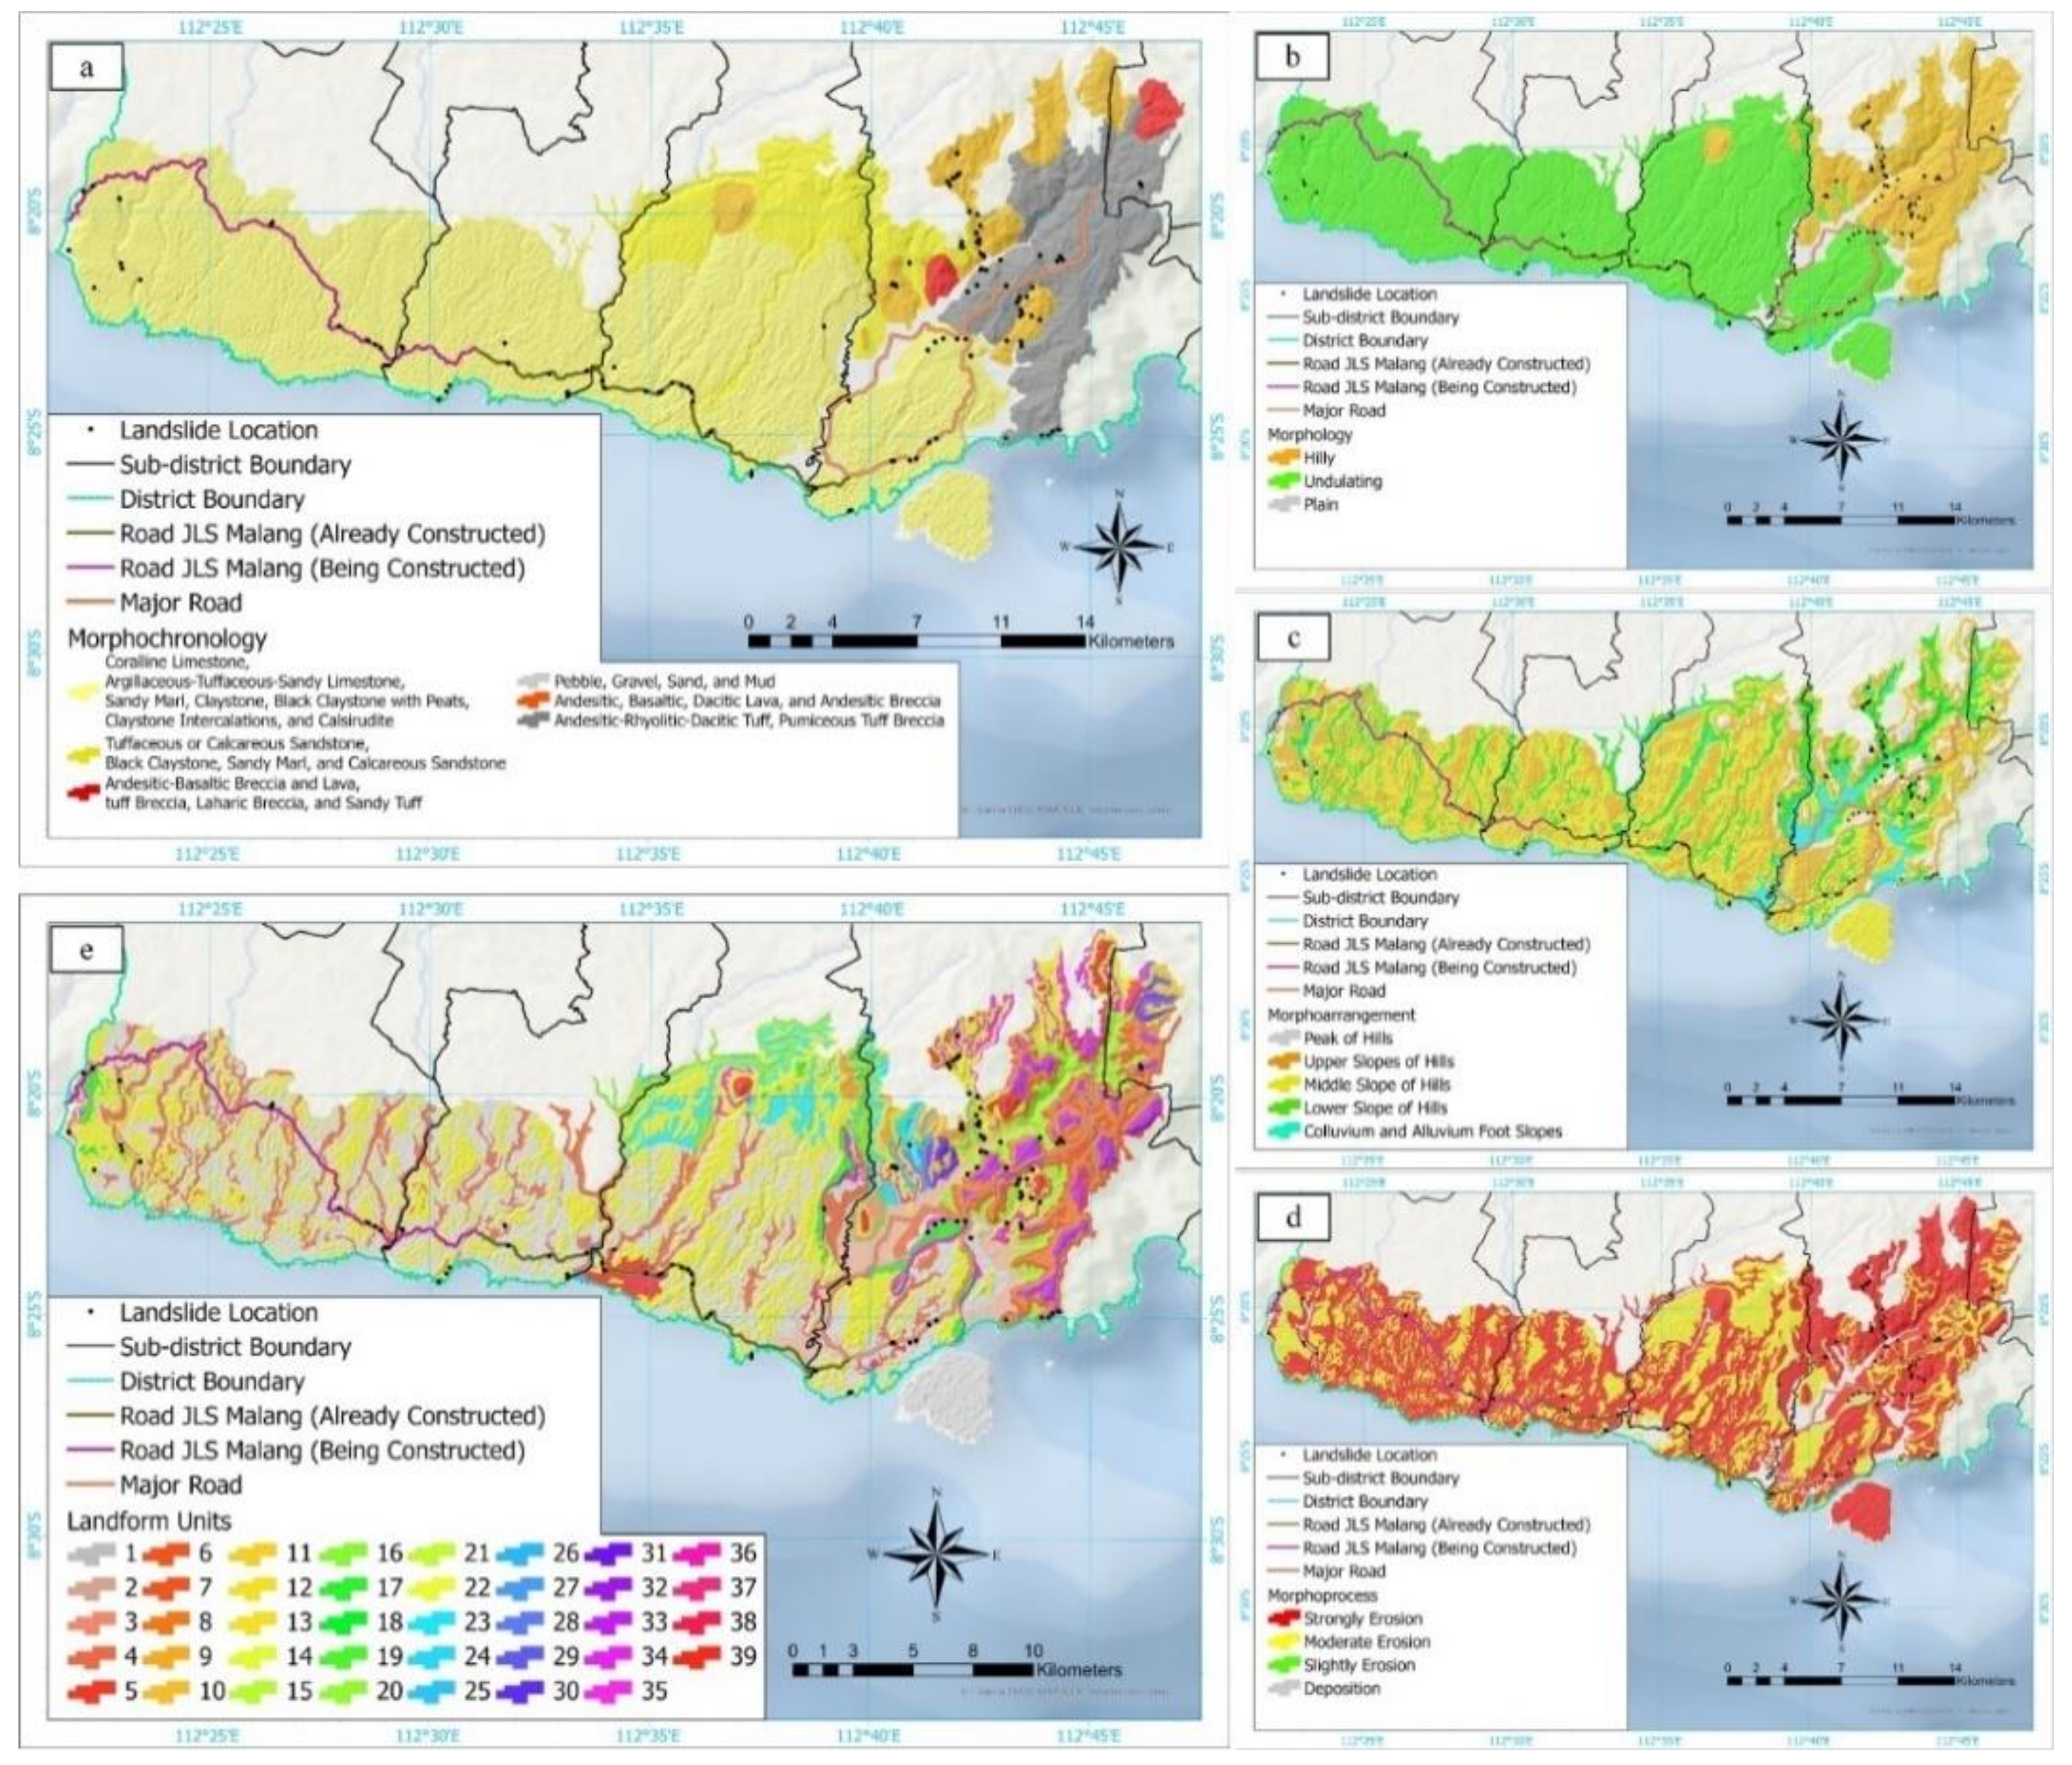
3.1. Morphological and Morphoarrangement Conditions in the Study Area
3.2. Morphochronological Condition in the Study Area
3.3. Morphogenesis Condition
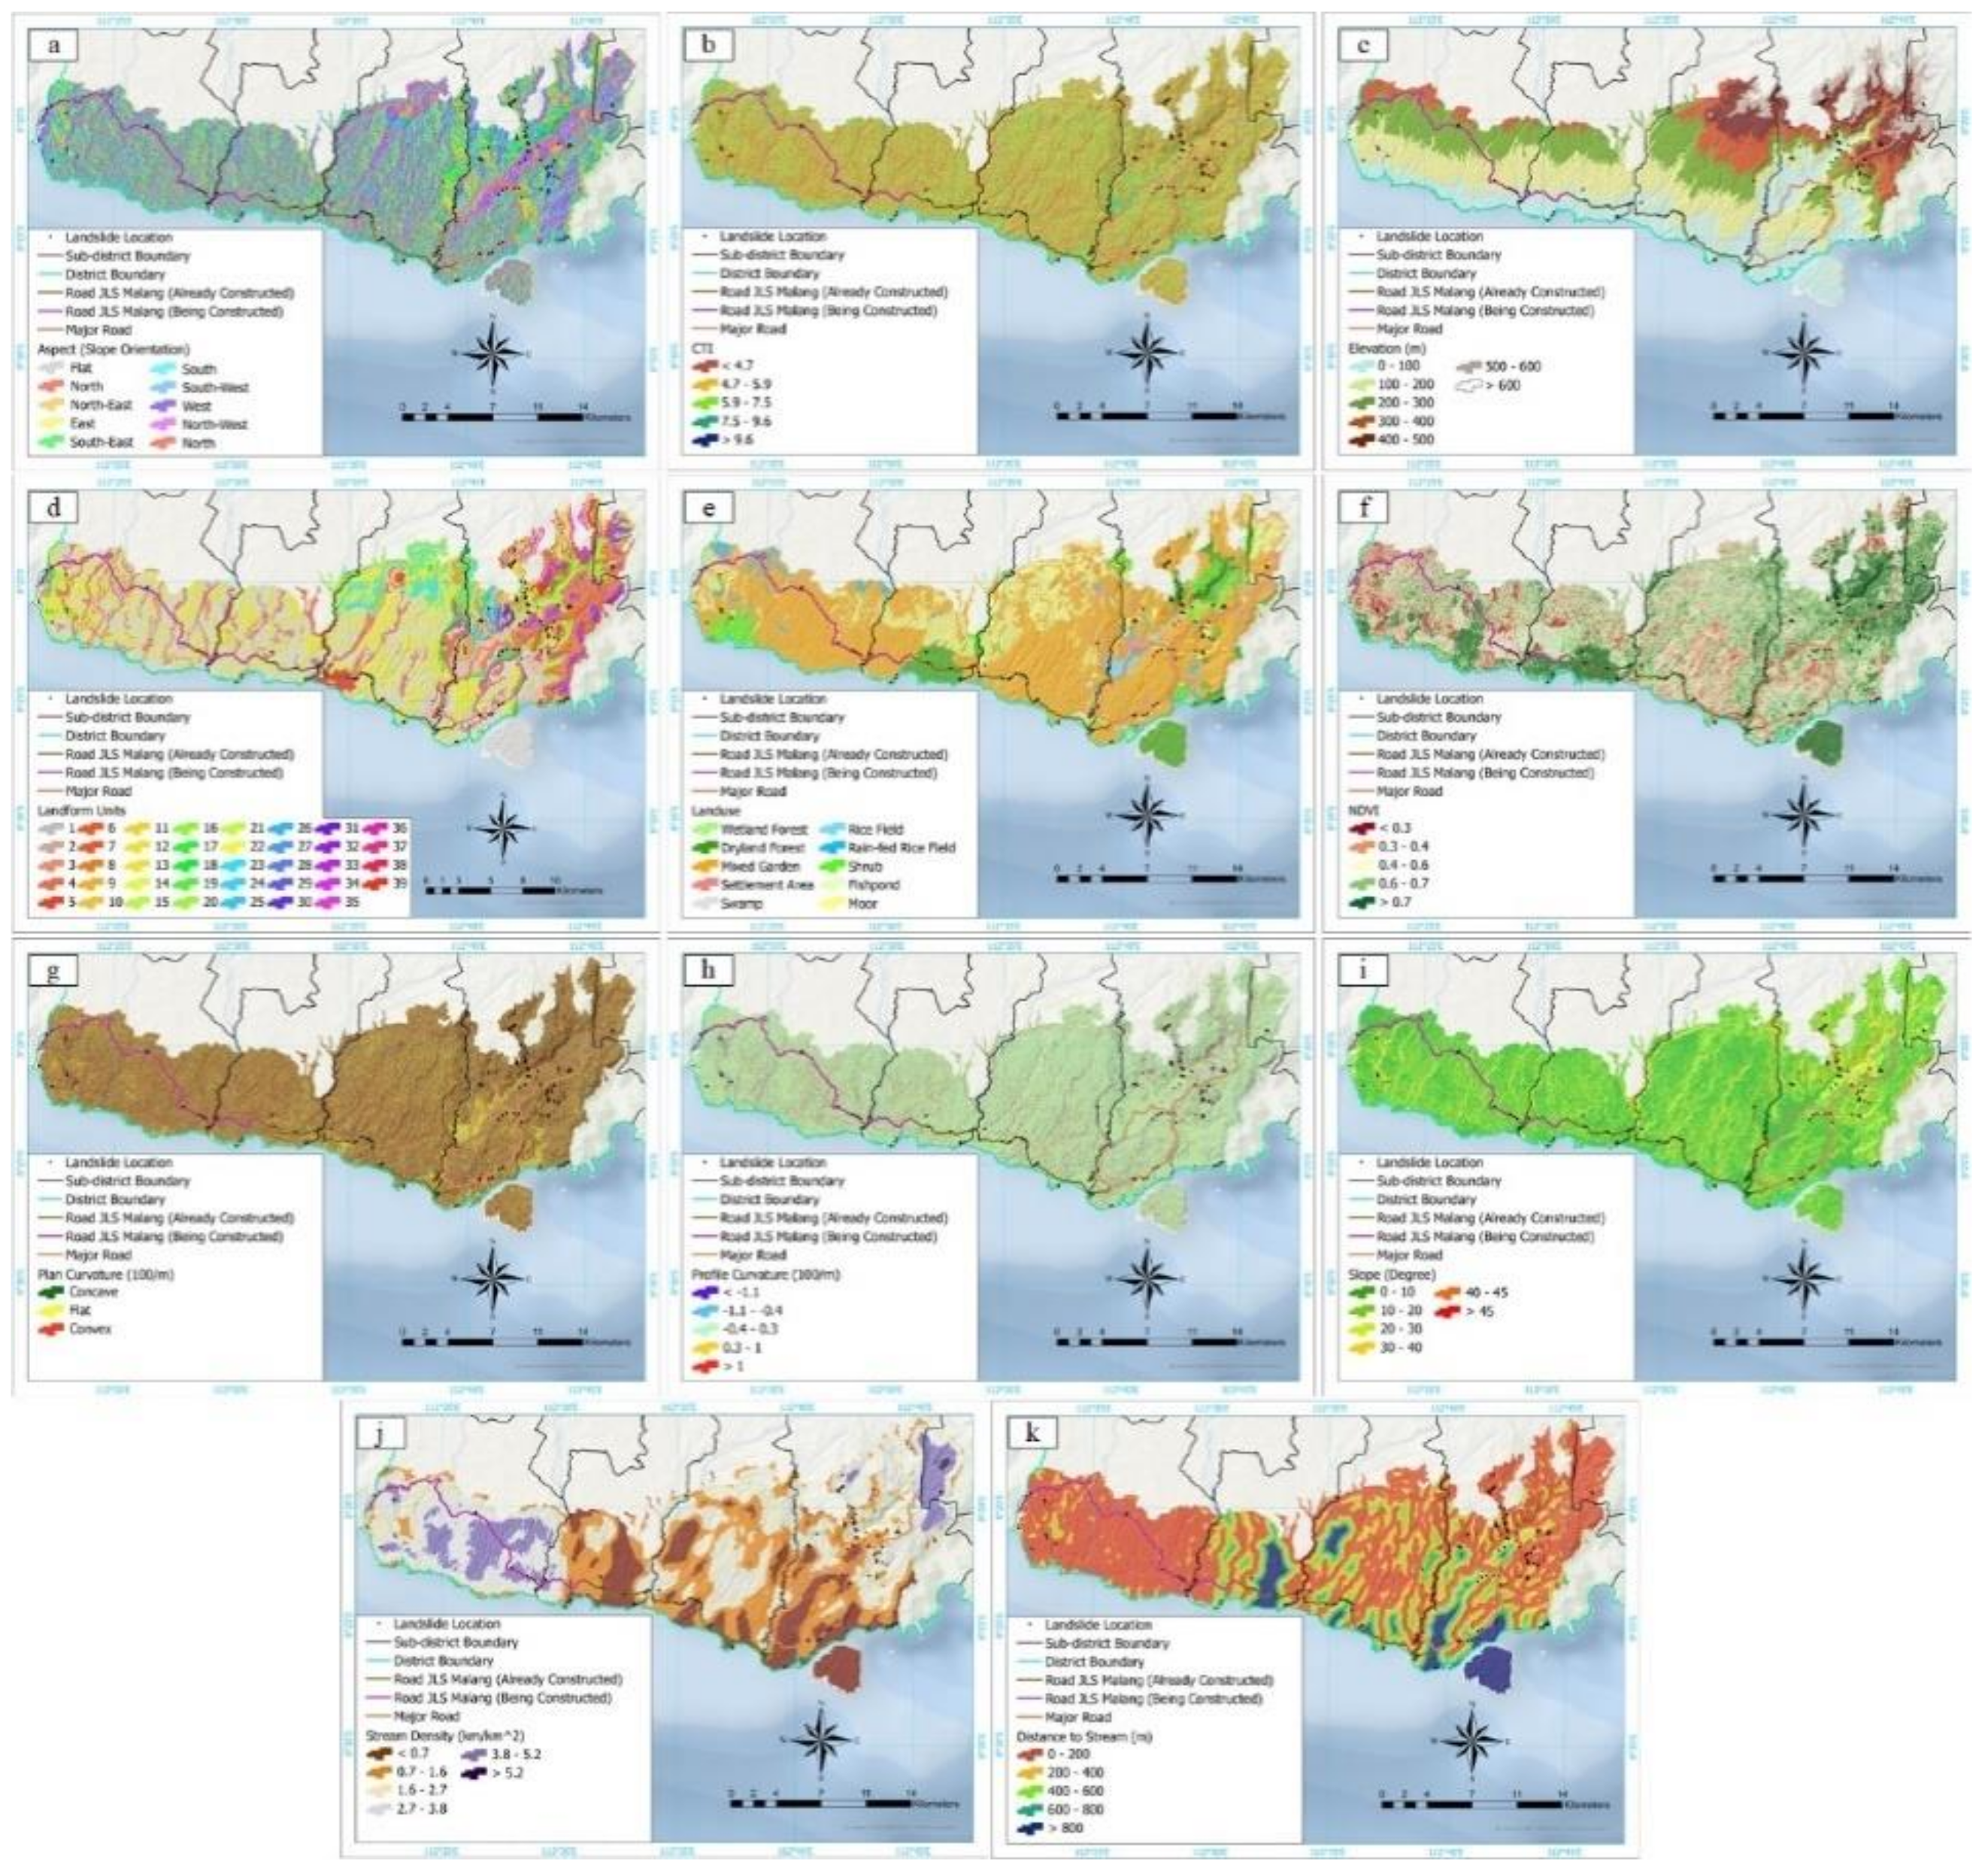
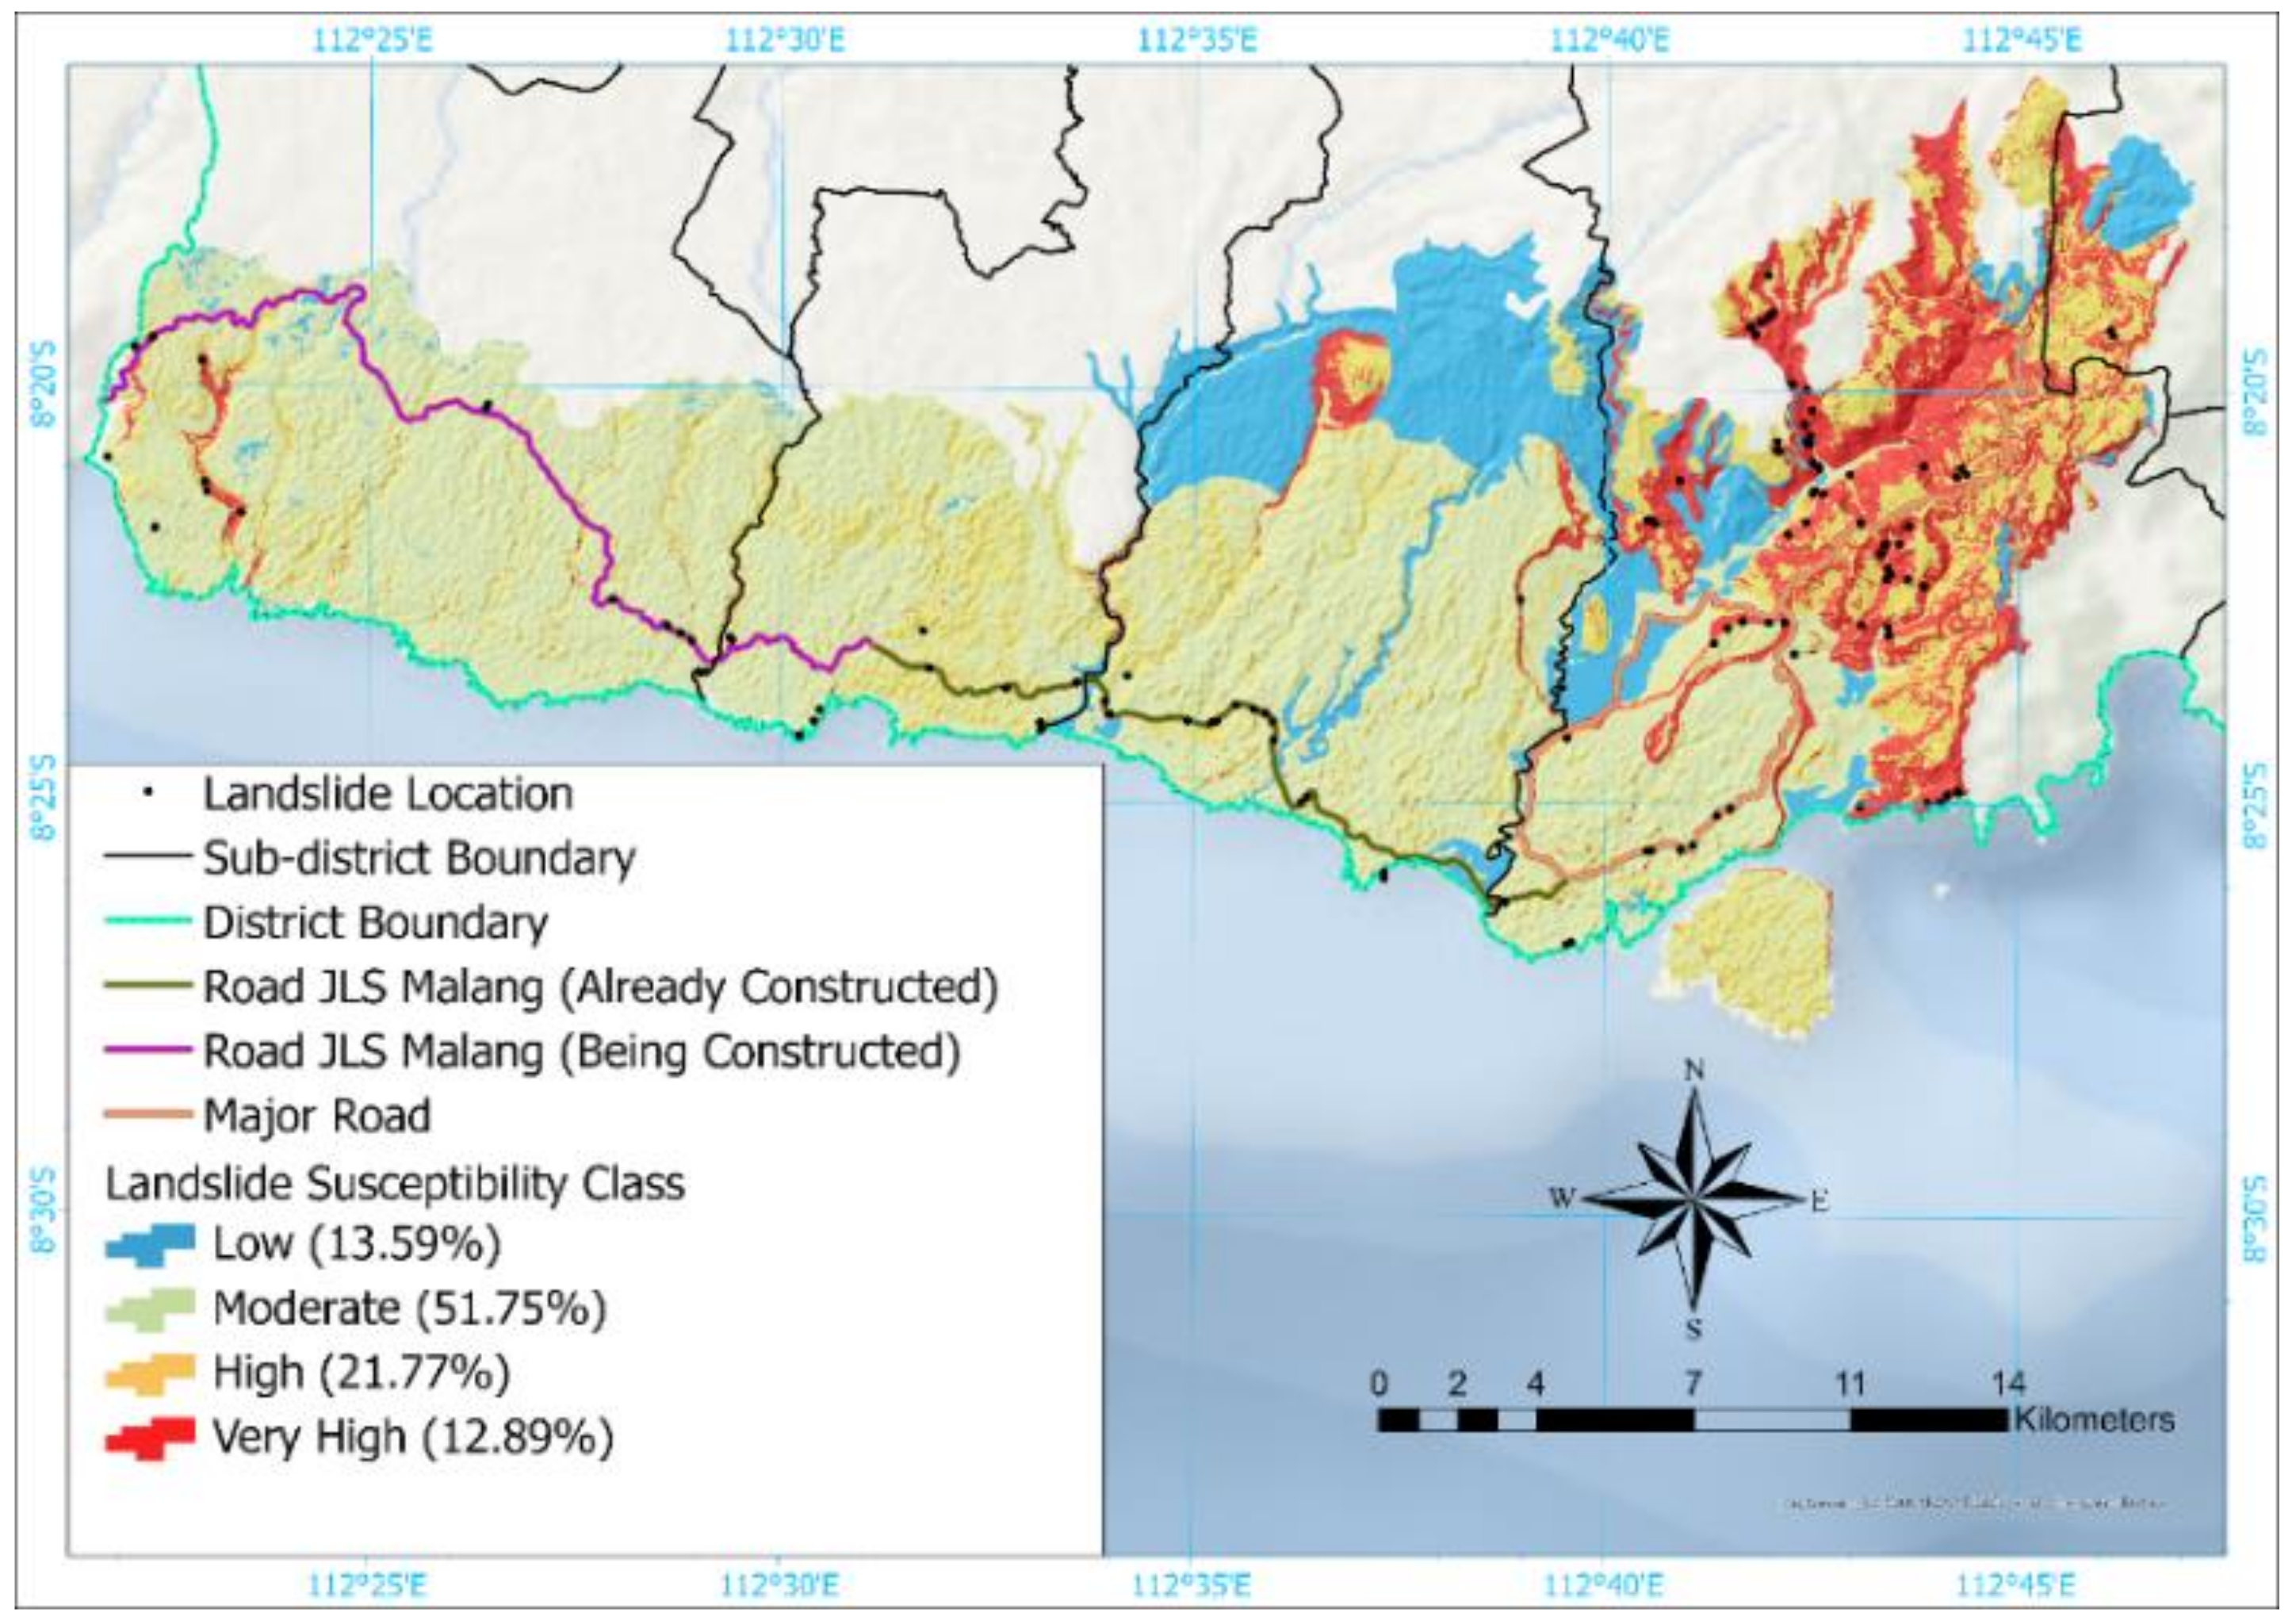
3.4 Analysis of Landslide Susceptibility
4. Conclusions
Author Contributions
Funding
Institutional Review Board Statement
Informed Consent Statement
Data Availability Statement
Acknowledgments
Conflicts of Interest
References
- Hadmoko, D.S.; Lavigne, F.; Sartohadi, J.; Hadi, P.; Winaryo. Landslide Hazard and Risk Assessment and Their Application in Risk Management and Landuse Planning in Eastern Flank of Menoreh Mountains, Yogyakarta Province, Indonesia. Nat. Hazards 2010, 54, 623–642. [Google Scholar] [CrossRef]
- Priyono, K.D.; Jumadi; Saputra, A.; Fikriyah, V.N.; Saputra, A. Risk Analysis of Landslide Impacts on Settlements in Karanganyar, Central Java, Indonesia. Int. J. Geomate 2020, 19, 100–107. [Google Scholar] [CrossRef]
- Bachri, S.; Shresta, R.P. Landslide Hazard Assessment Using Analytic Hierarchy Processing ( AHP ) and Geographic Information System in Kaligesing Mountain Area of Central Java Province Indonesia. Annu. Int. Work. Expo Sumatra Tsunami 2010, 9, 108–112. [Google Scholar]
- BNPB. Trends in Disasters in the Last 10 Years in Indonesia; BNPB: Jakarta, Indonesia, 2020. [Google Scholar]
- BPBD. East Java Disaster Risk Study 2016–2020; BPBD: Jawa Timur, Surabaya, Indonesia, 2015. [Google Scholar]
- Hasyim, A.W.; Gusti, H.I.K.; Prayitno, G. Determination of Land Cover as Landslide Factor Based on Multitemporal Raster Data in Malang Regency. Int. J. GEOMATE 2020, 18, 254–261. [Google Scholar] [CrossRef]
- Hadmoko, D.S.; Lavigne, F.; Samodra, G. Application of a Semiquantitative and GIS-Based Statistical Model to Landslide Susceptibility Zonation in Kayangan Catchment, Java, Indonesia. Nat. Hazards 2017, 87, 437–468. [Google Scholar] [CrossRef]
- Wang, L.; Sawada, K.; Moriguchi, S. Landslide Susceptibility Mapping by Using Logistic Regression Model with Neighborhood Analysis: A Case Study in Mizunami City. Int. J. GEOMATE 2011, 1, 99–104. [Google Scholar] [CrossRef]
- Arsyad, U.; Barkey, R.A.; Wahyuni, W.; Matandung, K.K. Characteristics of Landslides in the Tangka River Basin. J. Hutan dan Masy. 2018, 10, 203–214. [Google Scholar] [CrossRef]
- Pamungkas, Z.; Sartohadi, J. Slope Stability Study in Landslide Area in Magelang District Bompon Sub-Watershed. J. Bumi Indones. 2017, 6, 1–10. [Google Scholar]
- Xiong, J.; Sun, M.; Zhang, H.; Cheng, W.; Yang, Y.; Sun, M.; Cao, Y.; Wang, J. Application of the Levenburg-Marquardt Back Propagation Neural Network Approach for Landslide Risk Assessments. Nat. Hazards Earth Syst. Sci. 2019, 19, 629–653. [Google Scholar] [CrossRef]
- Thiery, Y.; Terrier, M.; Colas, B.; Fressard, M.; Maquaire, O.; Grandjean, G.; Gourdier, S. Improvement of Landslide Hazard Assessments for Regulatory Zoning in France: STATE–OF–THE-ART Perspectives and Considerations. Int. J. Disaster Risk Reduct. 2020, 47, 1–44. [Google Scholar] [CrossRef]
- Dahal, B.K.; Dahal, R.K. Landslide Hazard Map: Tool for Optimization of Low-Cost Mitigation. Geoenvironmen. Disasters 2017, 4, 1–9. [Google Scholar] [CrossRef]
- Khan, A.; Gupta, S.; Gupta, S.K. Multi-Hazard Disaster Studies: Monitoring, Detection, Recovery, and Management, Based on Emerging Technologies and Optimal Techniques. Int. J. Disaster Risk Reduct. 2020, 47, 1–53. [Google Scholar] [CrossRef]
- Rahma, A.D.; Mardiatno, D. Potential of Flood and Landslide Hazard Based on Geomorphological Characteristics in Sub-Das Gelis, Keling, Jepara. Maj. Ilm. Globe 2018, 20, 23–34. [Google Scholar] [CrossRef]
- Pradhan, B. Remote Sensing and GIS-Based Landslide Hazard Analysis and Cross-Validation Using Multivariate Logistic Regression Model on Three Test Areas in Malaysia. Adv. Sp. Res. 2010, 45, 1244–1256. [Google Scholar] [CrossRef]
- Pradhan, B.; Lee, S.; Buchroithner, M.F. Remote Sensing and GIS-Based Landslide Susceptibility Analysis and Its Cross-Validation in Three Test Areas Using a Frequency Ratio Model. Photogramm. Fernerkund. Geoinf. 2010, 1, 17–32. [Google Scholar] [CrossRef]
- Shahabi, H.; Hashim, M.; Ahmad, B. Bin. Remote Sensing and GIS-Based Landslide Susceptibility Mapping Using Frequency Ratio, Logistic Regression, and Fuzzy Logic Methods at the Central Zab Basin, Iran. Environ. Earth Sci. 2015, 73, 8647–8668. [Google Scholar] [CrossRef]
- Nugraha, H.; Wacano, D.; Dipayana, G.A.; Cahyadi, A.; Mutaqin, B.W.; Larasati, A. Geomorphometric Characteristics of Landslides in the Tinalah Watershed, Menoreh Mountains, Yogyakarta, Indonesia. Procedia Environ. Sci. 2015, 28, 578–586. [Google Scholar] [CrossRef]
- Smith, M.J.; Paron, P.; Griffiths, J.S. Geomorphological Mapping Methods and Applications; Elsevier Science: Amsterdam, The Netherlands, 2011; Volume 53. [Google Scholar] [CrossRef]
- Bishop, M.P.; James, L.A.; Shroder, J.F.; Walsh, S.J. Geospatial Technologies and Digital Geomorphological Mapping: Concepts, Issues and Research. Geomorphology 2012, 137, 5–26. [Google Scholar] [CrossRef]
- Malik, R.F.; Sartohadi, J. Detailed Geomorphological Mapping Using the Step-Wise-Grid Technique in the Bompon Watershed, Magelang District, Central Java. J. Bumi Indones. 2017, 6, 1–16. [Google Scholar]
- Scaioni, M.; Longoni, L.; Melillo, V.; Papini, M. Remote Sensing for Landslide Investigations: An Overview of Recent Achievements and Perspectives. Remote Sens. 2014, 6, 5909–5937. [Google Scholar] [CrossRef]
- Gökceoglu, C.; Aksoy, H. Landslide Susceptibility Mapping of the Slopes in the Residual Soils of the Mengen Region (Turkey) by Deterministic Stability Analyses and Image Processing Techniques. Eng. Geol. 1996, 44, 147–161. [Google Scholar] [CrossRef]
- Clerici, A.; Perego, S.; Tellini, C.; Vescovi, P. A Procedure for Landslide Susceptibility Zonation by the Conditional Analysis Method. Geomorphology 2002, 48, 349–364. [Google Scholar] [CrossRef]
- Lee, S.; Ryu, J.; Min, K.; Won, J. Landslide Susceptibility Analysis Using GIS and Artificial Neural Network. Earth Surf. Process. 2003, 28, 1361–1376. [Google Scholar] [CrossRef]
- Rawat, J.S.; Joshi, R.C. Remote-Sensing and GIS-Based Landslide-Susceptibility Zonation Using the Landslide Index Method in Igo River Basin, Eastern Himalaya, India. Int. J. Remote Sens. 2012, 33, 3751–3767. [Google Scholar] [CrossRef]
- Spinetti, C.; Bisson, M.; Tolomei, C.; Colini, L.; Galvani, A.; Moro, M.; Saroli, M.; Sepe, V. Landslide Susceptibility Mapping by Remote Sensing and Geomorphological Data: Case Studies on the Sorrentina Peninsula (Southern Italy). GIScience Remote Sens. 2019, 56, 940–965. [Google Scholar] [CrossRef]
- Evans, I.S. Geomorphometry and Landform Mapping: What Is a Landform? Geomorphology 2012, 137, 94–106. [Google Scholar] [CrossRef]
- Kaliraj, S.; Chandrasekar, N.; Ramachandran, K.K. Mapping of Coastal Landforms and Volumetric Change Analysis in the South West Coast of Kanyakumari, South India Using Remote Sensing and GIS Techniques. Egypt. J. Remote Sens. Sp. Sci. 2017, 20, 265–282. [Google Scholar] [CrossRef]
- Metelka, V.; Baratoux, L.; Jessell, M.W.; Barth, A.; Ježek, J.; Naba, S. Automated Regolith Landform Mapping Using Airborne Geophysics and Remote Sensing Data, Burkina Faso, West Africa. Remote Sens. Environ. 2018, 204, 964–978. [Google Scholar] [CrossRef]
- Saha, K.; Wells, N.A.; Munro-Stasiuk, M. An Object-Oriented Approach to Automated Landform Mapping: A Case Study of Drumlins. Comput. Geosci. 2011, 37, 1324–1336. [Google Scholar] [CrossRef]
- Verstappen, H.T. Old and New Trends in Geomorphological and Landform Mapping. Geomorphol. Mapping-Methods Appl. 2011, 15, 13–38. [Google Scholar] [CrossRef]
- Maulana, E.; Wulan, T.R. Multi-Prone Mapping of Southern Malang Regency Using the Landscape Approach. In Proceedings of the National Symposium on Geoinformation Science, PUSPICS Fakultas Geografi UGM, Yogyakarta, Indonesia, 25–26 November 2015; pp. 526–534. [Google Scholar]
- Wang, Q.; Shi, W.; Li, Z.; Atkinson, P.M. Fusion of Sentinel-2 Images. Remote Sens. Environ. 2016, 187, 241–252. [Google Scholar] [CrossRef]
- ESA. Sentinel-2 MSI Introduction. Available online: https://sentinel.esa.int/web/sentinel/user-guides/sentinel-2-msi/product-types (accessed on 12 June 2020).
- Kaku, K. Satellite Remote Sensing for Disaster Management Support: A Holistic and Staged Approach Based on Case Studies in Sentinel Asia. Int. J. Disaster Risk Reduct. 2019, 33, 417–432. [Google Scholar] [CrossRef]
- Julzarika, A.; Sari, I.L. Utilization of ALOS Palsar DEM, SRTM DEM, and Landsat Imagery to Determine Potential Landslides (Case Study: Purworejo Regency—Central Java Province). Inderaja LAPAN 2010, 1, 6–12. [Google Scholar]
- Alaska Satellite Facility. Available online: https://asf.alaska.edu/ (accessed on 12 June 2020).
- Galleries of Geology Map. Available online: https://vsi.esdm.go.id/ (accessed on 12 June 2020).
- Copernicus Open Access Hub. Available online: https://scihub.copernicus.eu/ (accessed on 12 June 2020).
- BIG. Indonesia Geospatial Portal. Available online: https://tanahair.indonesia.go.id/portal-web (accessed on 12 June 2020).
- Rashid, I.; Romshoo, S.A.; Hajam, J.A.; Abdullah, T. A Semi-Automated Approach for Mapping Geomorphology in Mountainous Terrain, Ferozpora Watershed (Kashmir Himalaya). J. Geol. Soc. India 2016, 88, 206–212. [Google Scholar] [CrossRef]
- Moore, I.D.; Grayson, R.B.; Ladson, A.R. Digital Terrain Modelling: A Review of Hydrological, Geomorphological, and Biological Applications. Hydrol. Process. 1991, 5, 3–30. [Google Scholar] [CrossRef]
- Weiss, A. Topographic Position and Landforms Analysis. In Proceedings of the Poster Presentation, ESRI User Conference, San Diego, CA, USA, 9–13 July 2001; Volume 200. [Google Scholar]
- Muddarisna, N.; Yuniwati, E.D.; Masruroh, H.; Oktaviansyah, A.R. An Automated Approach Using Topographic Position Index (TPI) for Landform Mapping (Case Study: Gede Watershed, Malang Regency, East Java, Indonesia). IOP Conf. Ser. Earth Environ. Sci. 2020, 412. [Google Scholar] [CrossRef]
- Li, L.; Qiang, Y.; Zheng, Z.; Zhang, J. Research on the Relationship between the Spatial Resolution and the Map Scale in the Satellite Remote Sensing Cartographies. Adv. Intell. Syst. Res. 2019, 168, 194–199. [Google Scholar] [CrossRef]
- Masruroh, H.; Sartohadi, J.; Setiawan, A. Developing Landslide Identification Method Based on Small Format Aerial Photography in the Bompon Watershed, Magelang, Central Java. Maj. Geogr. Indones. 2016, 9, 169–181. [Google Scholar] [CrossRef][Green Version]
- Bachri, S.; Sumarmi; Yudha Irawan, L.; Utaya, S.; Dwitri Nurdiansyah, F.; Erfika Nurjanah, A.; Wahyu Ning Tyas, L.; Amri Adillah, A.; Setia Purnama, D. Landslide Susceptibility Mapping (LSM) in Kelud Volcano Using Spatial Multi-Criteria Evaluation. IOP Conf. Ser. Earth Environ. Sci. 2019, 273. [Google Scholar] [CrossRef]
- Ayalew, L.; Yamagishi, H. The Application of GIS-Based Logistic Regression for Landslide Susceptibility Mapping in the Kakuda-Yahiko Mountains, Central Japan. Geomorphology 2005, 65, 15–31. [Google Scholar] [CrossRef]
- Guzzetti, F.; Cardinali, M.; Reichenbach, P.; Carrara, A. Comparing Landslide Maps: A Case Study in the Upper Tiber River Basin, Central Italy. Environ. Manage. 2000, 25, 247–263. [Google Scholar] [CrossRef] [PubMed]
- Shi, Y.; Jin, F. Landslide Stability Analysis Based on Generalized Information Entropy. Proc. Int. Conf. Environ. Sci. Inf. Appl. Technol. ESIAT 2009, 2009, 2–83. [Google Scholar] [CrossRef]
- Pourghasemi, H.R.; Mohammady, M.; Pradhan, B. Landslide Susceptibility Mapping Using Index of Entropy and Conditional Probability Models in GIS: Safarood Basin, Iran. Catena 2012, 97, 71–84. [Google Scholar] [CrossRef]
- Bacanli, Ü.G. Entropy Based Assessment and Palmer Drought Severity Index of Drought Analysis. Sci. Res. Essays 2012, 7, 3823–3833. [Google Scholar] [CrossRef]
- Amiri, V.; Rezaei, M.; Sohrabi, N. Groundwater Quality Assessment Using Entropy Weighted Water Quality Index (EWQI) in Lenjanat, Iran. Environ. Earth Sci. 2014, 72, 3479–3490. [Google Scholar] [CrossRef]
- Arabameri, A.; Cerda, A.; Tiefenbacher, J.P. Spatial Pattern Analysis and Prediction of Gully Erosion Using Novel Hybrid Model of Entropy-Weight of Evidence. Water 2019, 11, 1129. [Google Scholar] [CrossRef]
- Devkota, K.C.; Regmi, A.D.; Pourghasemi, H.R.; Yoshida, K.; Pradhan, B.; Ryu, I.C.; Dhital, M.R.; Althuwaynee, O.F. Landslide Susceptibility Mapping Using Certainty Factor, Index of Entropy and Logistic Regression Models in GIS and Their Comparison at Mugling-Narayanghat Road Section in Nepal Himalaya. Nat. Hazards 2013, 65, 135–165. [Google Scholar] [CrossRef]
- Wang, Q.; Guo, Y.; Li, W.; He, J.; Wu, Z. Predictive Modeling of Landslide Hazards in Wen County, Northwestern China Based on Information Value, Weights-of-Evidence, and Certainty Factor. Geomatics Nat. Hazards Risk 2019, 10, 820–835. [Google Scholar] [CrossRef]
- Bahrami, S.; Rahimzadeh, B.; Khaleghi, S. Analyzing the Effects of Tectonic and Lithology on the Occurrence of Landslide along Zagros Ophiolitic Suture: A Case Study of Sarv-Abad, Kurdistan, Iran. Bull. Eng. Geol. Environ. 2020, 79, 1619–1637. [Google Scholar] [CrossRef]
- Priyono, K.D.; Priyono, P. Morphometry Analysis and Morphostructure of Slope of Slides in Banjarmangu District, Banjarnegara Regency. Forum Geogr. 2008, 22, 72–84. [Google Scholar] [CrossRef]
- Raska, P.; Klimes, J.; Dubisar, J. Using Local Archive Sources to Reconstruct Historical Landslide Occurrence in Selected Urban REgions of the Czech Republic: Examples from Regions with Different Historical Development. Land Degrad. Dev. 2015, 26, 142–157. [Google Scholar] [CrossRef]
- Parise, M. Karst Geo-Hazards: Causal Factors and Management Issues. Acta Carsologica 2016, 44, 401–414. [Google Scholar] [CrossRef]
- Sari, D.F.N.; Damayanti, A.; Rokhmatullah. Karstification Identification of Dolina Characteristics Case Study: Ponjong District and Semanu District, Gunung Kidul District. In Proceedings of the National Geomatics Seminar, Surabaya, Indonesia, 12 July 2018; pp. 115–124. [Google Scholar] [CrossRef]
- Chen, L.; Guo, Z.; Yin, K.; Pikha Shrestha, D.; Jin, S. The Influence of Land Use and Land Cover Change on Landslide Susceptibility: A Case Study in Zhushan Town, Xuan’en County (Hubei, China). Nat. Hazards Earth Syst. Sci. 2019, 19, 2207–2228. [Google Scholar] [CrossRef]
- Regional Development Planning Agency - East Java, Infrastructure Development in East Java; Bappeda Jawa Timur. 2018.
- Ramanda, P.; Hakim, L.; Pangestuti, E. Community Participation in the Management of Tourist Objects of the Southern Cross Corridor in Malang Regency. J. Profit 2019, 13, 22–31. [Google Scholar]
- BPS of Malang Regency. Malang Regency In Figures 2020; BPS-Statistics of Malang Regency: Malang, Indonesia, 2020. [Google Scholar]
- Bijukchhen, S.M.; Kayastha, P.; Dhital, M.R. A Comparative Evaluation of Heuristic and Bivariate Statistical Modelling for Landslide Susceptibility Mappings in Ghurmi-Dhad Khola, East Nepal. Arab. J. Geosci. 2013, 6, 2727–2743. [Google Scholar] [CrossRef]


| Characteristic | Description |
|---|---|
| High-level description | Top-of-atmosphere reflectance in cartographic geometry |
| Production and distribution | Systematic generation and on-line distribution |
| Data volume | 600 MB (each 100 × 100 km2) |
| Ortho-images projection | UTM/WGS 84 |
| Factors | Data Used/Resolutions/Scales | Data Sources |
|---|---|---|
| Aspect (slope orientation) | DEM ALOS PALSAR (12.5 m × 12.5 m spatial resolution) | https://asf.alaska.edu/ Alaska Satellite Facility [39] |
| Compound topographic index | ||
| Elevation (m) | ||
| Landform units | DEM ALOS PALSAR (12.5 m × 12.5 m spatial resolution), geology map (1:50,000 scale map), and Sentinel-2B imagery (10m × 10m spatial resolution) | https://asf.alaska.edu/ Alaska Satellite Facility [39], https://vsi.esdm.go.id/ Galleries of Geology Map [40] https://scihub.copernicus.eu/ Copernicus Open-access Hub [41] |
| Land use | Sentinel-2B imagery (10 m × 10 m spatial resolution) | https://scihub.copernicus.eu/ Copernicus Open-access Hub [41] |
| NDVI | Sentinel-2B imagery (10 m × 10 m spatial resolution) | https://scihub.copernicus.eu/ Copernicus Open-access Hub [41] |
| Plan curvature (100/m) | DEM ALOS PALSAR (12.5 m × 12.5 m spatial resolution) | https://asf.alaska.edu/ Alaska Satellite Facility [39] |
| Profile curvature (100/m) | DEM ALOS PALSAR (12.5 m × 12.5 m spatial resolution) | https://asf.alaska.edu/ Alaska Satellite Facility [39] |
| Slope (degree) | ||
| Stream density (km/km2) | Digital topographic map, river (1:25,000) | https://tanahair.indonesia.go.id/ Inageoportal WebGIS [42] |
| Distance to stream (m) | Digital topographic map, river (1:25,000) | https://tanahair.indonesia.go.id/ Inageoportal WebGIS [42] |
| Unit Code | Symbol | Landform Unit | Area (km2) |
|---|---|---|---|
| 1 | U/3/SSE/1 | Middle slope of the Wonosari formation—significantly eroded | 132.59 |
| 2 | P/5/D/4 | Colluvium foot slope and alluvium deposition | 14.44 |
| 3 | H/3/M/2 | Middle slope of the hills Nampol formation—moderate erosion | 1.80 |
| 4 | U/4/SSE/1 | Lower slopes of the Wonosari formation—significantly eroded | 40.74 |
| 5 | H/1/SSE/5 | Hilltops of the Mandalika formation—significantly eroded | 3.67 |
| 6 | H/3/SSE/5 | Middle slope of tuff hills the Mandalika formation—significantly eroded | 12.48 |
| 7 | H/2/M/5 | Upper slope of the tuff hills the Mandalika formation—moderate erosion | 17.35 |
| 8 | H/1/SSE/2 | Hilltops of the Nampol formation—significantly eroded | 2.23 |
| 9 | H/2/SSE/3 | Upper slopes of the Wuni formation—significantly eroded | 2.09 |
| 10 | H/2/SSE/2 | Upper slope of the Nampol formation—significantly eroded | 3.15 |
| 11 | U/4/SSE/2 | Lower slope of the Nampol formation—significantly eroded | 3.74 |
| 12 | U/2/M/2 | Upper slope of the Nampol formation—moderately eroded | 11.22 |
| 13 | U/2/M/1 | Upper slope of the Wonosari formation—moderately eroded | 86.68 |
| 14 | U/5/D/1 | Colluvium foot slope and alluvium Wonosari formation | 1.29 |
| 15 | U/5/D/2 | Colluvium foot slope and alluvium Nampol formation | 2.08 |
| 16 | U/4/SSE/2 | Lower slope of the Nampol formation—significantly eroded | 8.62 |
| 17 | U/2/SE/1 | Hilltops of the Wonosari formation—slightly eroded | 5.45 |
| 18 | U/1/SE/2 | Hilltops of the Nampol formation—slightly eroded | 0.34 |
| 19 | H/4/M/2 | Lower slope of the hills of Nampol formation—moderately eroded | 0.47 |
| 20 | H/4/SSE/5 | Lower slope of the tuff Mandalika formation—significantly eroded | 13.98 |
| 21 | H/2/SSE/5 | Upper slope of the Mandalika formation—significantly eroded | 6.62 |
| 22 | H/4/SSE/5 | Lower slopes of the Mandalika formation—significantly eroded | 11.43 |
| 23 | U/3/M/2 | Middle slope of the Nampol formation—moderately eroded | 11.38 |
| 24 | H/4/SSE/2 | Lower slope of the Nampol formation—significantly eroded | 2.20 |
| 25 | H/3/SSE/2 | Middle slope of Nampol formation—significantly eroded | 1.41 |
| 26 | U/5/M/5 | Colluvium foot slope and alluvium of Mandalika formation—moderately eroded | 0.94 |
| 27 | H/1/SE/5 | Hilltops of the Mandalika formation—slightly eroded | 0.46 |
| 28 | U/5/D/2 | Colluvium foot slope and alluvium of Nampol Formation—deposited | 1.25 |
| 29 | H/3/M/3 | Middle slope of the Wuni formation—moderately eroded | 1.35 |
| 30 | H/1/SSE/3 | Hilltops of the Wuni Formation—significantly eroded | 0.49 |
| 31 | H/4/SSE/3 | Lower slopes of the Wuni formation—significantly eroded | 1.39 |
| 32 | H/1/SSE/5 | Hilltops of the Mandalika formation—significantly eroded | 10.75 |
| 33 | H/3/SSE/5 | Middle slope of the Mandalika formation—significantly eroded | 7.19 |
| 34 | H/4/M/3 | Lower slope of the hills—moderately eroded | 0.18 |
| 35 | H/5/D/5 | Colluvial foot slope and alluvium of Mandalika formation—deposited | 1.05 |
| 36 | U/2/SSE/1 | Upper slope of the Wonosari formation—significantly eroded | 3.42 |
| 37 | H/2/SSE/5 | Upper slope of the tuff Mandalika formation—significantly eroded | 2.24 |
| 38 | U/4/D/1 | Lower slope of Wonosari formation—deposited | 1.79 |
| 39 | U/3/D/1 | Middle slope of Wonosari formation—deposited | 2.64 |
| Symbol | Formation | Materials |
|---|---|---|
| Qa | Alluvium deposits | Pebble, gravel, sand, and mud |
| Tmwl | Wonosari | Coralline limestone, argillaceous-tuffaceous-sandy limestone, claystone, black claystone with peats, claystone intercalations, and calsirudite |
| Tmn | Nampol | Tuffaceous or calcareous sandstone, black claystone, sandy marl, and calcareous sandstone |
| Tmwl | Wuni | Andesitic-basaltic breccia and lava, tuff breccia, laharic breccia, and sandy tuff |
| Tomm | Mandalika | Andesitic, basaltic, dacitic lava, and andesitic breccia |
| Tomt | Tuff Mandalika | Andesitic-rhyolitic-dacitic tuff and pumiceous tuff breccia |
| Factors | Hjsum | Hjmax | Ij | Wj |
|---|---|---|---|---|
| Aspect | 3.072837 | 3.321928 | 0.074984 | 0.00015 |
| CTI | 2.242363 | 2.321928 | 0.034267 | 0.000039 |
| Elevation | 2.550763 | 2.807355 | 0.0914 | 0.000127 |
| Landform unit | 3.874697 | 5.285402 | 0.266906 | 0.003061 |
| Land use | 1.685205 | 3.321928 | 0.492703 | 0.000918 |
| NDVI | 2.271285 | 2.321928 | 0.021811 | 0.000025 |
| Plan curvature | 1.501695 | 1.584963 | 0.052536 | 0.000034 |
| Profile curvature | 2.215833 | 2.321928 | 0.045693 | 0.000071 |
| Slope | 2.009295 | 2.584963 | 0.222699 | 0.00164 |
| Stream density | 2.096787 | 2.584963 | 0.188852 | 0.000217 |
| Stream distance | 2.213677 | 2.321928 | 0.046621 | 0.000073 |
Publisher’s Note: MDPI stays neutral with regard to jurisdictional claims in published maps and institutional affiliations. |
© 2020 by the authors. Licensee MDPI, Basel, Switzerland. This article is an open access article distributed under the terms and conditions of the Creative Commons Attribution (CC BY) license (http://creativecommons.org/licenses/by/4.0/).
Share and Cite
Bachri, S.; Shrestha, R.P.; Yulianto, F.; Sumarmi, S.; Utomo, K.S.B.; Aldianto, Y.E. Mapping Landform and Landslide Susceptibility Using Remote Sensing, GIS and Field Observation in the Southern Cross Road, Malang Regency, East Java, Indonesia. Geosciences 2021, 11, 4. https://doi.org/10.3390/geosciences11010004
Bachri S, Shrestha RP, Yulianto F, Sumarmi S, Utomo KSB, Aldianto YE. Mapping Landform and Landslide Susceptibility Using Remote Sensing, GIS and Field Observation in the Southern Cross Road, Malang Regency, East Java, Indonesia. Geosciences. 2021; 11(1):4. https://doi.org/10.3390/geosciences11010004
Chicago/Turabian StyleBachri, Syamsul, Rajendra P. Shrestha, Fajar Yulianto, Sumarmi Sumarmi, Kresno Sastro Bangun Utomo, and Yulius Eka Aldianto. 2021. "Mapping Landform and Landslide Susceptibility Using Remote Sensing, GIS and Field Observation in the Southern Cross Road, Malang Regency, East Java, Indonesia" Geosciences 11, no. 1: 4. https://doi.org/10.3390/geosciences11010004
APA StyleBachri, S., Shrestha, R. P., Yulianto, F., Sumarmi, S., Utomo, K. S. B., & Aldianto, Y. E. (2021). Mapping Landform and Landslide Susceptibility Using Remote Sensing, GIS and Field Observation in the Southern Cross Road, Malang Regency, East Java, Indonesia. Geosciences, 11(1), 4. https://doi.org/10.3390/geosciences11010004