Allocation of Potentially Environmentally Hazardous Sections on Pipelines


Abstract
1. Introduction
2. Materials and Methods
- Accident sampling over underground utilities;
- Comparison of the sampling obtained with the ENPEMF MC measurement results;
- Comparison of the ENPEMF MC measurement results with the information on tectonic disturbances from a 1:25,000 scaled map, compiled by E.K. Melnikov, according to the order by St. Petersburg Government Committee for Urban Planning and Architecture, in 1994.
3. Results
4. Discussion
5. Conclusions
Author Contributions
Funding
Institutional Review Board Statement
Informed Consent Statement
Data Availability Statement
Acknowledgments
Conflicts of Interest
References
- Bezrodny, K.P.; Basov, A.D.; Romanevich, K.V. Control of the stress-strain state of the rock mass during tunnel construction using natural electromagnetic radiation method. Izv. Tula State Univ. Earth Sci. 2011, 1, 227–234. (In Russian) [Google Scholar]
- Turchaninov, I.A.; Markov, G.A. Abnormally high stress state of rock massifs and its accounting in underground mining. In The Physical Conditions and the Development of the Technology of Mining Production; Nauka: Leningrad, Russia, 1973; pp. 34–42. (In Russian) [Google Scholar]
- Rasskazov, I.Y.; Tsirel, S.V.; Rozanov, A.O.; Tereshkin, A.A.; Gladyr’, A.V. Application of acoustic measurement data to characterize initiation and development of disintegration focus in a rock mass. J. Min. Sci. 2017, 53, 224–231. [Google Scholar] [CrossRef]
- Norvatov, Y.A.; Petrova, I.B.; Kotlov, S.N. Hydroecological conditions for the opencast mining of the grib diamond deposit. Water Resour. 2012, 39, 798–801. [Google Scholar] [CrossRef]
- Haji, T.A.; Moumni, Y.; Msaddek, M.H. Fault-style analysis and seismic interpretation: Implications for the structural issues of the South-eastern Atlas in Tunisia. J. Afr. Earth Sci. 2020, 172, 103962. [Google Scholar] [CrossRef]
- Abreha, D.A. Analysing Public Transport Performance Using Efficiency Measures and Spatial Analysis; The Case Study of Addis Ababa, Ethiopia. Masters’ Thesis, International Institute for Geo-Information Science and Earth Observation, Enschede, The Netherlands, 2007. [Google Scholar]
- Litvinenko, V.S.; Kozlov, A.V.; Stepanov, V.A. Hydrocarbon potential of the Ural–African transcontinental oil and gas belt. J. Pet. Explor. Prod. Technol. 2017, 7, 1–9. [Google Scholar] [CrossRef][Green Version]
- Kholodilov, A.N.; Gospodarikov, A.P. Modeling Seismic Vibrations under Massive Blasting in Underground Mines. J. Min. Sci. 2020, 56, 29–35. [Google Scholar] [CrossRef]
- Lebedev, M.O.; Romanevich, K.V. Engineering and geophysical research in reconstruction of underground structures. Min. Inf. Anal. Bull. 2019, 2019, 97–110. [Google Scholar] [CrossRef]
- Mulev, S.N.; Starnikov, V.N.; Romanevich, O.A. The current stage of development of the geophysical method for recording natural electromag neticra diation (EEMI-NER). Ugol 2019, 10, 6–14. [Google Scholar] [CrossRef]
- Ezersky, M.; Eppelbaum, L. Geophysical Monitoring of Underground Constructions and its Theoretical Basis. Int. J. Georesour. Environ. 2017, 3, 56–72. [Google Scholar] [CrossRef][Green Version]
- Shabarov, A.; Tsirel, S. Geodynamic safety of subsurface management. Geomech. Geodyn. Rock Masses 2018, 1, 105–120. [Google Scholar]
- Tsirel’, S.V.; Pavlovich, A.A.; Melnikov, N.Y.; Zuev, B.Y. Physical Modeling of Deformation Processes in Pit Slope with Steep Bedding. J. Min. Sci. 2019, 55, 364–370. [Google Scholar] [CrossRef]
- Morozov, K.; Shabarov, A.; Kuranov, A.; Belyakov, N.; Zuyev, B.; Vlasenko, D.; Demekhin, D.; Bakhtin, E. Geodynamic monitoring and its maintenance using modeling by numerical and similar materials methods. In Proceedings of the 1st International Scientific Conference on Problems in Geomechanics of Highly Compressed Rock and Rock Massifs, GHCRRM 2019, Vladivostok, Russia, 15 July 2019. [Google Scholar]
- Karasev, M.A.; Bouslova, M.A.; Vilner, M.A.; Nguyen, T.T. Method for predicting the stress-strain state of the vertical shaft lining at the drift landing section in saliferous rocks. J. Min. Inst. 2019, 240, 628–637. [Google Scholar] [CrossRef]
- Zhu, Z.; Zhang, H.; Han, J.; Lv, Y. A Risk Assessment Method for Rockburst Based on Geodynamic Environment. Shock Vib. 2018, 2018, 2586842. [Google Scholar] [CrossRef]
- Han, J.; Zhang, H.-W.; Song, W.-H.; Li, S.; Lan, T.-W. Coal and gas outburst mechanism and risk analysis of tectonic concave. Meitan Xuebao/J. China Coal Soc. 2011, 36, 108–113. [Google Scholar]
- Zuev, B.Y.; Zubov, V.P.; Fedorov, A.S. Application prospects for models of equivalent materials in studies of geomechanical processes in underground mining of solid minerals. Eurasian Min. 2019, 1, 8–12. [Google Scholar] [CrossRef]
- Marschalko, M.; Yilmaz, I.; Bednárik, M.; Kubečka, K. Variations in the building site categories in the underground mining region of Doubrava (Czech Republic) for land use planning. Eng. Geol. 2011, 122, 169–178. [Google Scholar] [CrossRef]
- Susetyaningsih, A.; Farida, I.; Zhafirah, A. Optimization of utilization pedestrian trails and green lines in the city. J. Phys. Conf. Ser. 2019, 1402, 022015. [Google Scholar] [CrossRef]
- Ai, Q.; Yuan, Y. Rapid acquisition and identification of structural defects of metro tunnel. Sensors 2019, 19, 4278. [Google Scholar] [CrossRef]
- Zubov, V.P.; Nikiforov, A.V. Features of development of superimposed coal seams in zones of disjunctive geological disturbances. Int. J. Appl. Eng. Res. 2017, 12, 765–768. [Google Scholar]
- Protosenya, A.G.; Lebedev, M.O.; Karasev, M.A.; Belyakov, N.A. Geomechanics of low-subsidence construction during the development of underground space in large cities and megalopolises. Int. J. Mech. Prod. Eng. Res. Dev. 2019, 9, 1005–1014. [Google Scholar]
- Lange, I.Y.; Lebedeva, Y.A.; Kotiukov, P.V. A study of water permeability of coal ash and slag to assess the possibility of their use as road pavement layers. Int. J. Eng. Res. Technol. 2020, 13, 374–378. [Google Scholar] [CrossRef]
- Lebedeva, Y.; Kotiukov, P.; Lange, I. Study of the geo-ecological state of groundwater of metropolitan areas under the conditions of intensive contamination thereof. J. Ecol. Eng. 2020, 21, 157–165. [Google Scholar] [CrossRef]
- Dashko, R.E.; Lebedeva, Y.A. Improving Approaches to Estimating Hydrogeological Investigations as a Part of Engineering Survey in Megacities: Case Study of St. Petersburg. Water Resour. 2017, 44, 875–885. [Google Scholar] [CrossRef]
- Dashko, R.; Shidlovskaya, A. Impact of microbial activity on soil properties. Can. Geotech. J. 2016, 53, 1386–1397. [Google Scholar] [CrossRef]
- Eboli, L.; Mazzulla, G. A stated preference experiment for measuring service quality in public transport. Transp. Plan. Technol. 2008, 31, 509–523. [Google Scholar] [CrossRef]
- Eboli, L.; Mazzulla, G. Willingness-to-pay of public transport users for improvement in service quality. Eur. Transp. Trasp. Eur. 2008, 38, 107–118. [Google Scholar]
- Hanrahan, R.B.; Layde, P.M.; Zhu, S.; Guse, C.E.; Hargarten, S.W. The association of driver age with traffic injury severity in Wisconsin. Traffic Inj. Prev. 2009, 10, 361–367. [Google Scholar] [CrossRef]
- Badami, M.G.; Haider, M. An analysis of public bus transit performance in Indian cities. Transp. Res. Part A: Policy Pract. 2007, 41, 961–981. [Google Scholar] [CrossRef]
- Nikonov, A.A. Active faults: Definition and allocation problems. Geoecology 1995, 4, 16–27. (In Russian) [Google Scholar]
- Bolt, A.B.; Scott, R.W.; Horn, W.L.; MacDonald, G.A. Geological Elements: Earthquakes, Tsunamis, Volcanic Eruptions, Avalanches, Landslides, Floods; Mir: Moscow, Russia, 1978; p. 444. [Google Scholar]
- Asada, T. Earthquake Prediction Techniques: Their Application in Japan; Nedra: Moscow, Russia, 1984; p. 312. (In Russian) [Google Scholar]
- Ufimtsev, G.F.; Onukhov, F.S.; Timofeev, D.A. Terminology of Structural Geomorphology and Neotectonics; Nedra: Moscow, Russia, 1979; p. 256. [Google Scholar]
- Research Group for Active Faults. Active faults in and around Japan: The distribution and the degree if activity. J. Nat. Disas. Sci. 1980, 2, 61–99. [Google Scholar]
- Zhdanov, M.S. Geophysical Electromagnetic Theory and Methods; Elsevier: Amsterdam, The Netherlands, 2012; p. 680. [Google Scholar]
- Lyu, C.; Pedersen, H.A.; Paul, A.; Zhao, L.; Solarino, S. Shear wave velocities in the upper mantle of the Western Alps: New constraints using array analysis of seismic surface waves. Geophysics. J. Int. 2017, 210, 321–331. [Google Scholar] [CrossRef]
- Wen, Y.; Xu, C.; Liu, Y.; Jiang, G. Deformation and Source Parameters of the 2015 Mw 6.5 Earthquake in Pishan, Western China, from Sentinel-1A and ALOS-2 Data. Remote Sens. 2016, 8, 134. [Google Scholar] [CrossRef]
- Zubaidah, T.; Kanata, B.; Irmawati, B.; Ramadhani, C. Comprehensive Geomagnetic Signal Processing for Successful Earthquake Prediction. In Proceedings of the 13th Quality in Research (QiR) 2013, Yogyakarta, Indonesia, 25–28 June 2013. [Google Scholar]
- Sarlis, N.V.; Skordas, E.S. Study in natural time of geoelectric field and seismicity changes preceding theMw6.8 earthquake on 25 October 2018 in Greece. Entropy 2018, 20, 882. [Google Scholar] [CrossRef] [PubMed]
- Varotsos, P.A.; Skordas, E.S.; Sarlis, N.V. Fluctuations of the entropy change under time reversal: Further investigations on identifying the occurrence time of an impending major earthquake. EPL 2020, 130, 29001. [Google Scholar] [CrossRef]
- Zubov, V.P.; Nikiforov, A.V.; Kovalsky, E.R. Influence of geological faults on planning mining operations in contiguous seams. Ecol. Environ. Conserv. 2017, 23, 1176–1180. [Google Scholar]
- Belova, M.; Iakovleva, E.; Popov, A.; Idiyatullin, M. Localization of potentially dangerous geodynamic zones in underground mines. Rock Mechanics for Natural Resources and Infrastructure Development. In Proceedings of the 14th International Congress on Rock Mechanics and Rock Engineering, ISRM, Foz Do Iguassu, Brazil, 13–18 September 2019; pp. 1441–1447. [Google Scholar]
- Guzev, M.A.; Rasskazov, I.Y.; Tsitsiashvili, G.S. Algorithm of Potentially Burst-hazard Zones Dynamics Representation in Massif of Rocks by Results of Seismic-acoustic Monitoring. Procedia Eng. 2017, 191, 36–42. [Google Scholar] [CrossRef]
- Trifonov, V.G. Living tectonics of Holocene. Bull. Ussr Acad. Sci. 1987, 4, 99–112. [Google Scholar]
- Dashko, R.E.; Shidlovskaya, A.V.; Aleksandrova, O.Y.; Alekseev, I.V. Geological engineering and hydrogeological problems of substantiating the long-term stability of St. Isaac’s Cathedral (St. Petersburg). J. Min. Inst. 2012, 195, 28–32. (In Russian) [Google Scholar]
- Dashko, R.E.; Aleksandrova, O.Y.; Kotiukov, P.V.; Shidlovskaya, A.V. Special aspects of geotechnical conditions of St. Petersburg. Urban Dev. Geotech. Constr. 2011, 1, 1–47. (In Russian) [Google Scholar]


| Type of the Deposit | Name | Permittivity, F/m | Electrical Resistivity, Om/m | Magnetic Susceptibility, Unit Measure SI System 10−5 | |
|---|---|---|---|---|---|
| 1 | Quaternary deposits | Sea-lake sand and sabulous clay | 15–20 | 10–100 | 20–2800 |
| 2 | Glaciolacustrine and banded clay-bearing soil with sand and sabulous clay lens | 8–20 | 100–1000 | 50–25,000 | |
| 3 | Clay-bearing soil of the Ostashkovskaya till with inclusions of alluvium and ratchel | 4.5–10 | 1000–10,000 | 10–3000 | |
| 4 | Bedding rock | Upper Vendian Verkhnekotlinsky clays with interbedded sandstone | 4.5–40 | 1000–1,000,000 | 50–5000 |
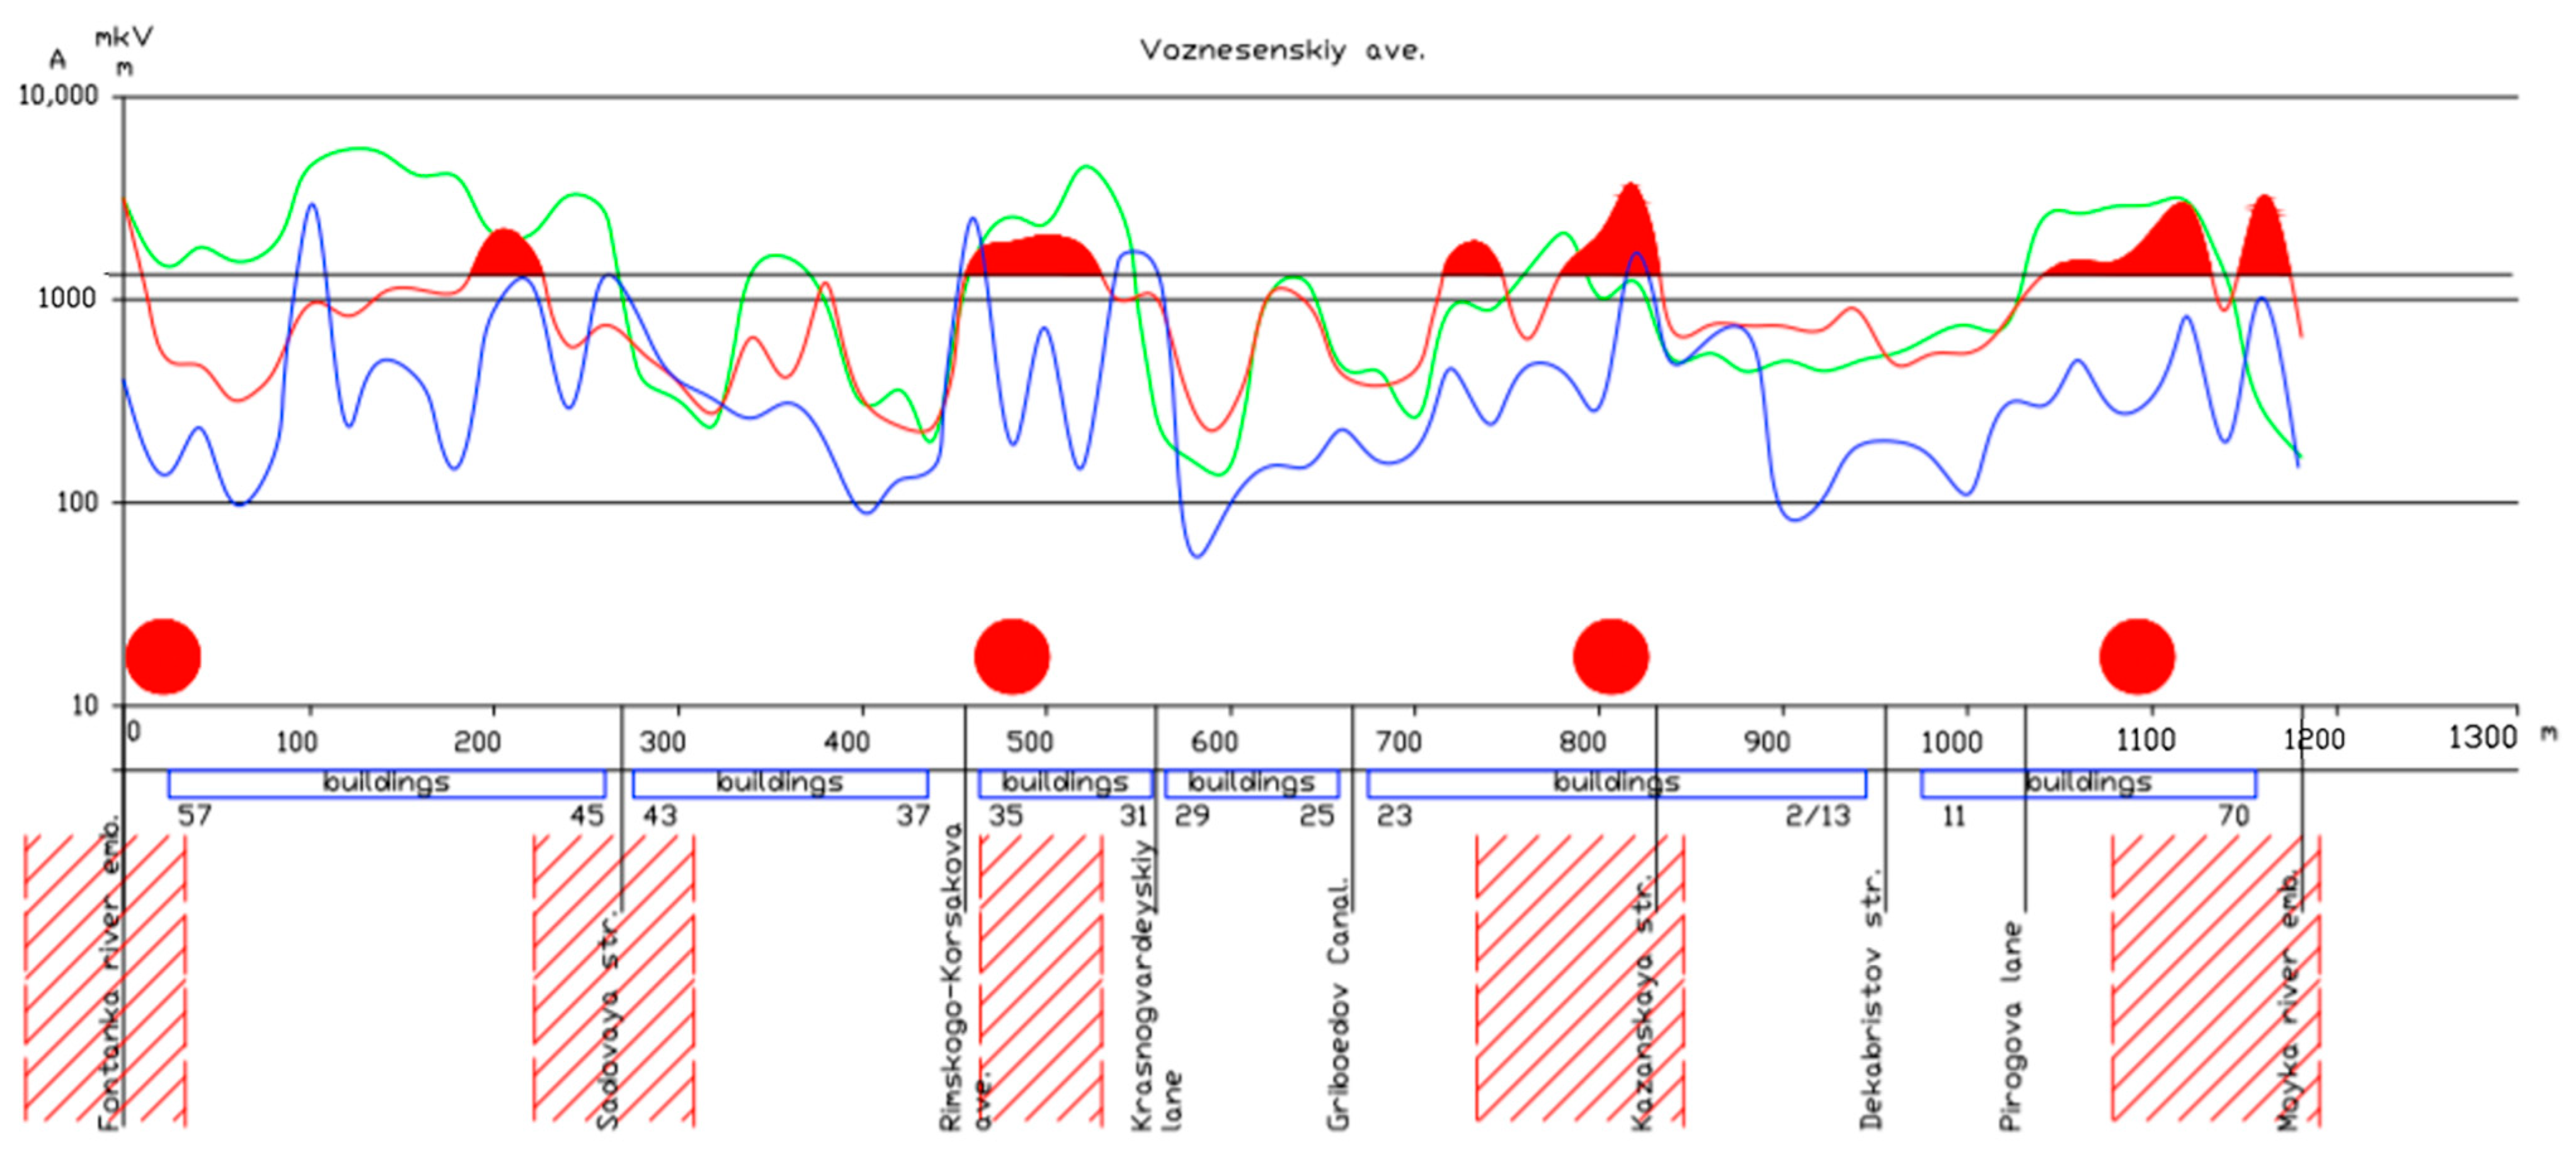
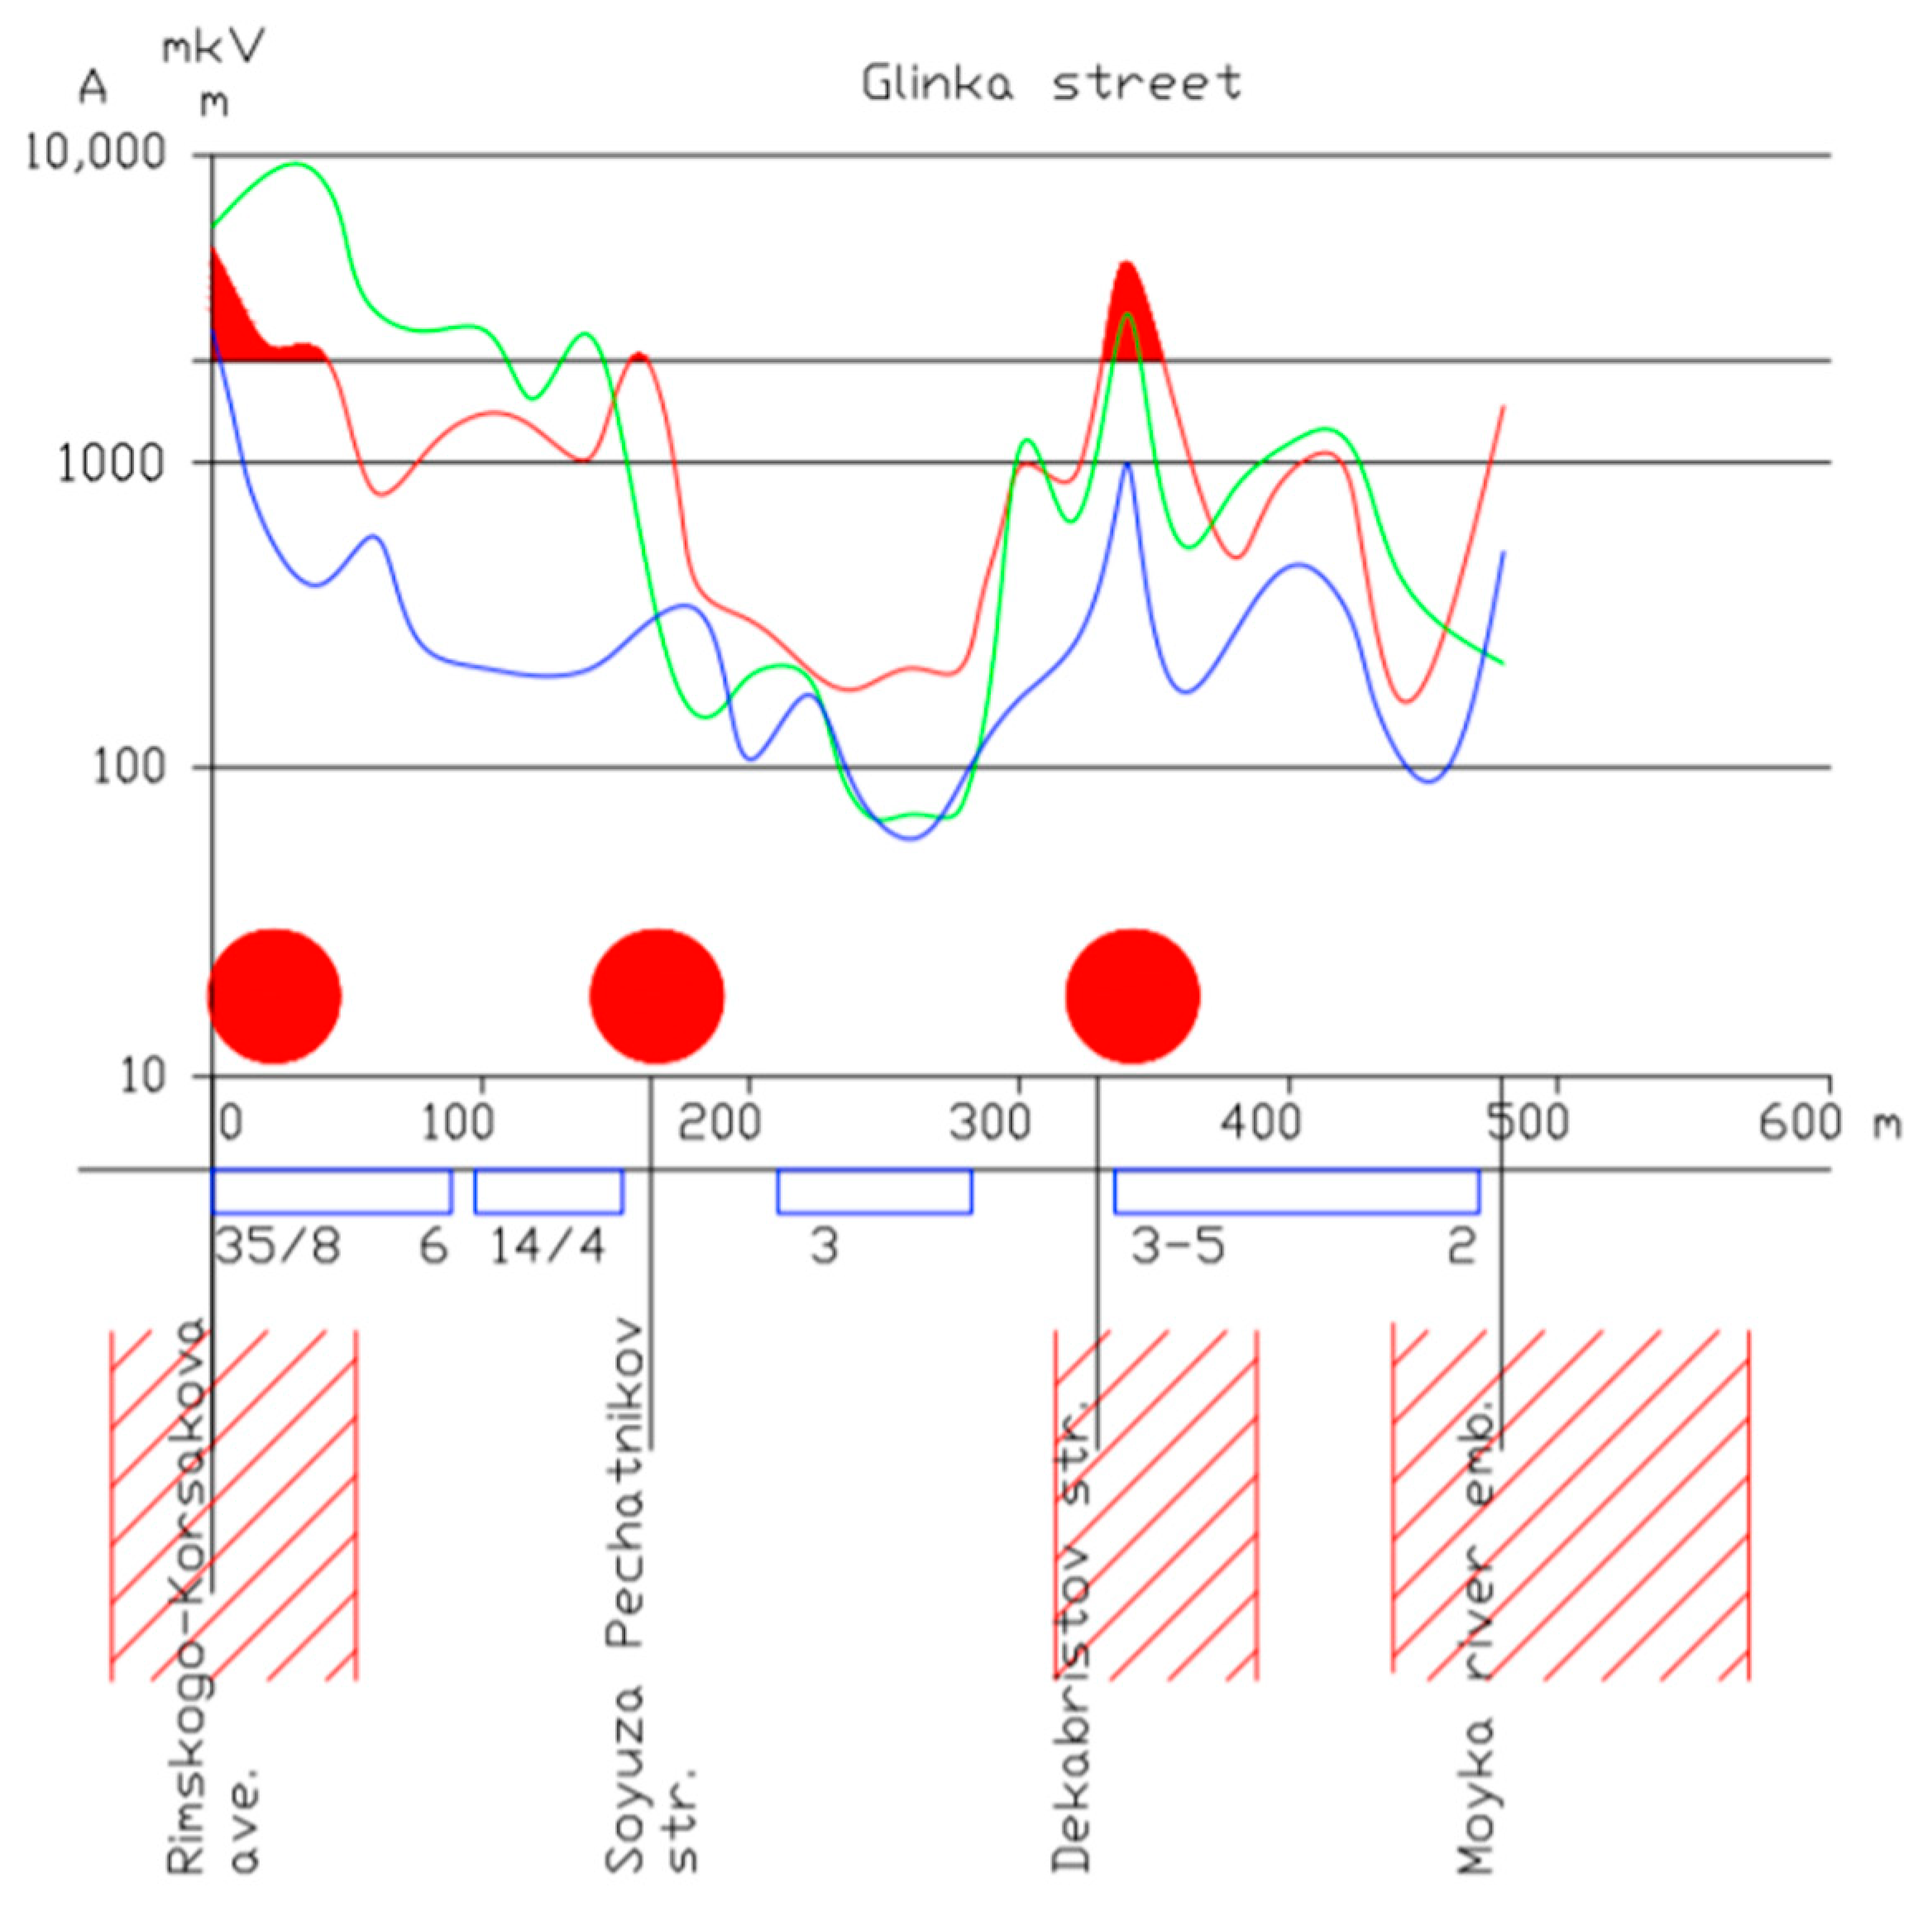
| Designation | Note | Designation | Note |
|---|---|---|---|
 | Vertical component of the ENPEMF MC Az |  | Zones of active faults |
 | Horizontal component (along the profile) Ax |  | House numbers |
 | Horizontal component (perpendicular to the profile) Ay |  | Accident sites at underground utilities |
 | Anomalous values of Az |
| Characteristics | Value |
|---|---|
| The total length of the electrical survey profile, with recording of the AEMF magnetic component, in km | 6.38 |
| The total length of the zones affected by GAF, allocated by the sum of geological data, in running km | 1.22 |
| The total length of internal fault-blocks in running km | 5.16 |
| The total number of accidents at underground utilities of the water supply system | 51 |
| The number of accidents at underground utilities of the water supply system within the zones affected by GAF | 41 |
| The number of accidents at underground utilities of the water supply system beyond the bounds of GAF | 10 |
| The number of accidents at underground utilities of the water supply system within the zones affected by GAF per running km | 33.61 |
| The number of accidents at the underground utilities of the water supply system beyond the bounds of GAF per running km | 1.94 |
| The ratio of the number of accidents within the zones affected by GAF to the number of accidents beyond their bounds | 17.34 |
Publisher’s Note: MDPI stays neutral with regard to jurisdictional claims in published maps and institutional affiliations. |
© 2020 by the authors. Licensee MDPI, Basel, Switzerland. This article is an open access article distributed under the terms and conditions of the Creative Commons Attribution (CC BY) license (http://creativecommons.org/licenses/by/4.0/).
Share and Cite
Iakovleva, E.; Belova, M.; Soares, A. Allocation of Potentially Environmentally Hazardous Sections on Pipelines. Geosciences 2021, 11, 3. https://doi.org/10.3390/geosciences11010003
Iakovleva E, Belova M, Soares A. Allocation of Potentially Environmentally Hazardous Sections on Pipelines. Geosciences. 2021; 11(1):3. https://doi.org/10.3390/geosciences11010003
Chicago/Turabian StyleIakovleva, Emiliia, Margarita Belova, and Amilcar Soares. 2021. "Allocation of Potentially Environmentally Hazardous Sections on Pipelines" Geosciences 11, no. 1: 3. https://doi.org/10.3390/geosciences11010003
APA StyleIakovleva, E., Belova, M., & Soares, A. (2021). Allocation of Potentially Environmentally Hazardous Sections on Pipelines. Geosciences, 11(1), 3. https://doi.org/10.3390/geosciences11010003