Abstract
Cuttings/cores’ Headspace Isotope and Composition Analysis (HICA) provides an effective way to calculate the nano pore throat size and distributions much like nitrogen and CO2 adsorption BET/BJH analysis, and it could also provide information about the original pore pressure or gas in place. Tight gas and oil storage is different from conventional where a majority of oil and gas are stored in nanometer sized pores (nanopores). Therefore the nanofludics, i.e., nanometer scale capillary sealing and opening in nanopores of tight rocks, plays a key role in overpressure conservation and storage of oil and gas, and also the fracing process involves the opening of the nano pore capillary seals through rock-fluid interactions. The rock-fluid nanofluidics interactions during fracing could also be studied through HICA and the results could help the optimization of fracing designs.
1. Introduction
Unconventional oil and gas production have altered the world oil and gas supply map, particularly in North America where the light oil and gas from tight rocks undergo extensive fracing in the long laterals. During the past decade, tens of thousands of laterals have been drilled and completed with the latest fracing technologies. Yet, there are still unresolved puzzles. In this work, we discuss the three puzzles that are not obviously correlated, but are rooted back to the first success of hydraulic fracturing in Barnett shale (Fort Worth Basin, TX) in 1997 [1,2,3], and have been perplexing unconventional tight oil and gas productions, storage and preservation models. These three puzzles are:
- The shale cuttings and core rocks seems to hold arbitrary amount of gases, for example, even weeks after exhumation and exposed to air, when water droplets are impinged onto the chips and core rocks, there are always gases coming out from the cuttings and core rocks.
- The recovery rates at some of the most prolific shale gas field are extraordinarily high, suggesting current gas in place model needs to be uplifted.
- The flow back of fracing water fluid is quite low at the most prolific tight, including shale, oil and gas laterals, and the current model of fracing and completion can not explain such low flow back which often indicate poor completion or poor reservoir pressure in conventional models.
We reveal through headspace stable isotope composition analysis of core chips and cuttings that these puzzles are associated with the nanofluidic natures of shale oil and gas reservoirs.
The success of hydraulic fracing in the Barnett is a result of two factors, i.e., the abundance of shale gas in place that is much larger than adsorption or conventional porosity pressure product model and measurement had predicted [1]; and the still mysterious breakthroughs [2,3] by Nicolas Steinsberger and Ray Walker [4,5] that large amount of fracing water, instead of ruining the formation as conventional wisdom predicting, actually helps shale gas production more than other fracturing technologies available then and now. The shale gas in place and the detailed mechanism of how water actually promote oil and gas production from shale and tight rocks are both still hot topics right now [4,6,7,8] as the detailed production results have shown below.
Meanwhile, stable carbon isotope analysis have been carried out on coal [9,10,11,12] and shale cuttings and core chips sealed in headspace or bags [13,14,15,16,17,18,19], and these results reported isotopic shifts which are both large and changing over the time after collection, as a typical example depicted in Figure 1 here.
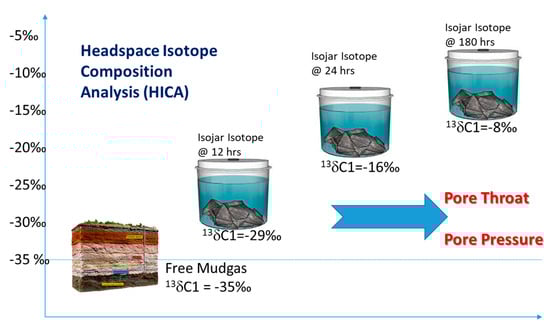
Figure 1.
Depicts the headspace isotope composition analysis (HICA) of cuttings from shale or coal chips. Previous results [9,10,11,12,13,14,15,16,17,18,19,20] strived to retrieve the permeability information through simple diffusion and adsorption models, while this paper describes the model to extract the pore throat and pore pressure information based on HICA.
Geomark [19] related the heavy fractionation to permeability and sweetspots, because adsorption favors heavy 13CH4 methane and better permeability will release the lighter 12CH4 faster, and this seemingly intuitive model has been adopted by some [18] in the shale drilling community. While some argue that adsorption fractionation is a minor factor even when adsorption favors 13CH4 [11,20] and therefore diffusion process should dominate the heavy fractionation. Experiments [21,22] and routine GC-IRMS chromatographs [23] actually all demonstrate that adsorption by minerals and carbon blacks under reservoir conditions actually favors lighter isotopologues, i.e., 12CH4 and 12CO2 instead of 13CH4 and 13CO2. Or so called chromatographic effect where every 13C desorbs actually sooner than 12C in every GC-IRMS peak. This is opposite to oxygen and hydrogen isotopologues at normal conditions [22] and carbon isotopologues at much lower temperature or dissolution conditions [20] where adsorption favoring heavy isotopologues is correct and very intuitive to accept. If adsorption does not favor 13CH4 or 13CO2, then the adsorption [19] or diffusion [20] dominated fractionation models should be further refined to explain and better characterize the physical conditions of shale and coal rocks. However, current diffusion dominated model assumes constant diffusion fractionation even when only adsorption effect is minimized [20], and have trouble explaining the many puzzles in shale oil and gas production as we discussed earlier in this paper.
Chatellier (private communications 2017) and Strapoc [14] both correlated the nano porosity in shale with the heavy shift of methane isotope in jars’ headspace or gas release, the evidences are convincing, however a more detailed model is on how to use it for calculating nano pore throat size and nano pore pressure and even guide for completion design and production is highly desirable. Xia [20] used a fixed diffusion related fractionation model to correlate the gas production with production isotope changes, and smaller isotope changes are observed during shale gas production and an Estimated Ultimate Recovery (EUR) model based on isotope is proposed.
This paper strives to land HICA and field isotope analysis with more practical applications. In this paper, we first present a simple nanofluidc model that shows such heavy fractionation shifts are results of nanoporosity and ultra-high pore pressures and could be used to calculate pore pressure, pore throat distribution in the nano meter range. Then, we use this model and HICA measurements to show that the nanopores could be effectively sealed by salt and opened by fluid-rock interactions. The implications about storage and production of shale and other ultra-tight resources are also discussed, major breakthroughs and further improvements of the shale revolution are explained.
2. Theory and Methods
2.1. Nanofluidic Model for Fractionation in Shale Gas
The flow of gases in shale rocks could be described by the equation below incorporating Darcy, Slippage/Klinger and Knudsen Diffusion flows similar to Javadpour [24],
Or
Or replace kinetic viscosity with where is the average thermal velocity of all the molecules, independent of pressure p or pore throat radius r, we arrive at:
here, J is the mass flux in kg/m2/s and c is a collision proportionality factor, normally given as equal to 1.0, and Kn is Knudsen number, and Kn = λ/r. λ is the gas molecular mean free path, which can be obtained by the gas kinetic theory,
where KB is Boltzmann constant and d is the diameter of the molecule.
The isotope fractionation only happens in the third Knudsen diffusion terms in Equation (4) where the term , which correlates with molecular weight M, is present; whereas the first Darcy/viscous flow and second slippage flow term is independent of the molecular weight, they will not introduce isotope fractionation. Note that the first Darcy term is proportional to pore pressure P and the square of pore throat diameter, i.e., r2; and both the second and third term are proportional to the pore throat diameter r and independent of pore pressure. Such differences also introduces large variations of the third diffusion term ratio in the total flow as pressure and pore throat changes. Figure 2a–d details the changes of each flow’s contribution as well as 13C/12C Fractionation (1−D*/D) as pressure and pore throat change.
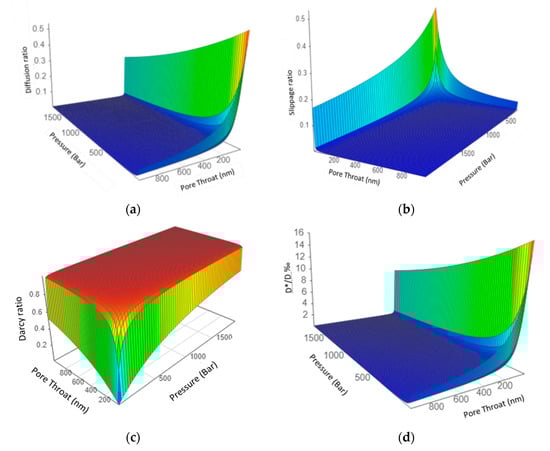
Figure 2.
3D figures demonstrate the change of the Diffusion, Darcy flow, Slippage flow in the total flow as pore pressure and pore throat diameter changes. Note: Color is just for better visualization of the 3D figures, not representing numeric values. (a). Diffusion ratio in the total flow at different pore throat (0.4–1 μm) and pressures; (b). Slippage flow ratio in the total flow at different pore throat (0.4–1 μm) and pressures; (c). Darcy flow ratio in the total flow at different pore throat (0.4–1 μm) and pressures; (d). 13C/12CFractionation (1 − D*/D)% in the flow at different pore throat (0.4–1 μm) and pressures.
2.2. Measurement of Nano Pore Pressure and Nano Pore Throat through Headspace Dynamics
The model above is further developed to correlate the dynamic changes of headspace methane isotope values and concentrations not only with pore throat size but also original pore pressures. With simulation [25] and detailed model experiments, we have proven the following highlighted conclusion and detailed results will be presented in a different paper.
- As shown in Figure 3, the head space isotope heavy shifts are only obvious if nano pore throat are present. With pore throat size above 200 nm, heavy shifts for methane isotope are minimized to less than 2 permil even if original pore pressure is lower than 10 Bar.
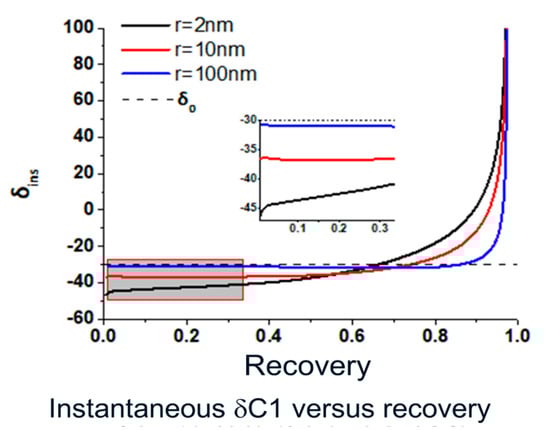 Figure 3. Simulated instantaneous 13C1 changes versus recovery, or gas released from nano pores to the open air (0.1 MPa), under the same original nano pore pressure (30 MPa) for different pore throat sizes. The initial much lighter isotope values will not be observed when drilling is happening in the bore hole with extra static water pressure. δ0 is the bulk gas isotope value or original gas on site before gas release or production.
 - Also shown in Figure 3, under the same initial pore pressure, the smaller nano size pore throat, we will have lighter isotope shifts for the gases released earlier and heavier isotope shifts for the gases released in the later stage of production; and from the dynamic changes perspective after we collect the cuttings during the middle of gas recovery, i.e., mimic of the cuttings we collected during drilling, we will observe heavier shift earlier for smaller nano size pore throat.
- Figure 4 simulates the fractionation after cuttings are collected after 1 h of mud pumping from the bore hole, i.e., gases already lost in the earlier part of gas release. Here, it is not intuitive to understand the fractionation changes are obvious as the original pore pressure parameter varies while pore throat is kept at constant. Simulation results show here, for the same pore throat size, the larger the initial pore pressure, we observe steeper and larger heavier shift in the end of the gas release; while the porosity differences result in much smaller changes for the observed fractionation. This simulation result demonstrates the possibility to restore the gases lost in the beginning when cuttings are brought up to the well head surface from the drill bit, i.e., if we could get the later part of the isotope change curve, simulation model could lead us to the original pore pressure. The absolute amount of original gas in place for each unit weight of rock could be calculated if we could also get the absolute amount of gas normalized to the unit weight of cuttings. Now, this being able to calculate the original pore pressure is an important step beyond just extracting the nano pore throat sizes through headspace isotope composition analysis (HICA). If we treat D*/D as a constant, we will not be able get neither the pore throat size nor the pore pressure.
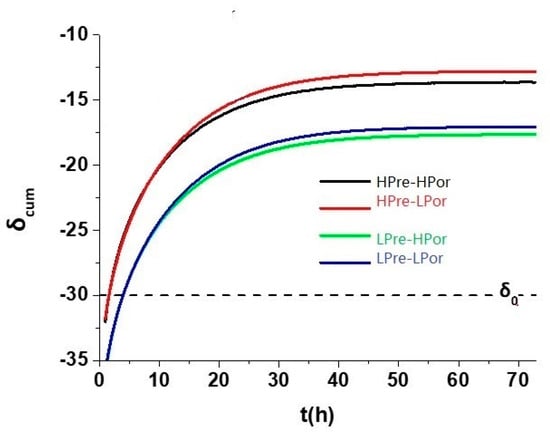 Figure 4. Simulated accumulated isotope changes over the time, i.e., a mimic of cuttings headspace isotope changes after the collection at the well head. The pore throats are fixed at 5 nm, while pore pressure and porosity vary from 30 MPa(LPre) to 45 MPa(HPre) and 5%(LPor) to 10%(HPor) respectively.
With the modeled results above, we developed a protocol that use the dynamic measurements of headspace methane isotope and concentration data to characterize the nano pore throat structure and nano pressures. Such valuable information is not easy to obtain with conventional methods such as BET/BJH because the pore throats profiles are often generated when there is water rock interactions as we demonstrated below, and regular BET/BJH could not be conducted under fluid-rock interaction conditions. Further, the original pore pressures are not accessible with other conventional methods. The headspace isotope composition analysis (HICA) for nanofluidic measurement could be an optimal tool for characterizing unconventional resources. The Figure 5 shows how the oil and gas resources’ key parameters vary from conventional to unconventional rocks, and the techniques that are used for characterization of these parameters.
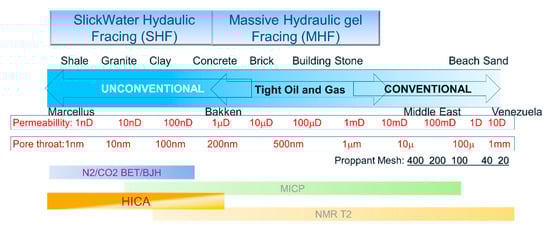
Figure 5.
Figure here plots the permeability and pore throat distribution for different typical oil and gas reservoir rocks, against the production method (top) and pore throat size analysis method. Also, note that regular proppant for fracing has a mesh smaller than 120, which has size well over 100 microns, which is more than 3 orders of magnitude larger than pore throat of unconventional reservoir rocks. A good analogy to opening nanometer pore throats with 100 micron size proppant is opening a hole in a needle with a sledgehammer.
3. Materials and Methods
The field test uses a field deployable compound specific isotope analyzer (FD-CSIA), i.e., the Gas Chromatograph—Infrared Isotope Ratio analyzer (GC-IR2) that was developed and marketed by ArrowGrand Technologies, LLC. The detailed description was given in another paper in this special issue of Geosciences. The GC-IR2 instrument is able to operate by the rig-site and measure samples with methane concentration down to 1000 ppm and give standard deviation error (1 σ) of 0.4 permil or better for δ13C values. The sample size is also small, as little as 1000 ppm*mL hydrocarbon is required to get 0.4 permil (1 σ) or better, and therefore allows repeated measurement of headspace samples. Calibration of the field instrument have been carried out with standard bottled gases. The mud gas reading is also logged in real time with the GC-IR2 while drilling the shale lateral wells.
The samples of cuttings or core chips are collected during drilling from the well site and then sealed in dry or wet conditions in sealed jars, e.g., Isojars offered by Isotech (Weatherford Corp., Champaign, IL, USA) or glass vials as shown in the results section below. In case of wet samples, distilled water with bactericide, i.e., Benzalkonium Chloride, are added to the jar or glass vials, to prevent bacteria growth that could distort the methane isotope measurement.
4. Results
4.1. Nano Pore Throat and Pore Pressure Measurement through Headspace Isotope Analysis
Very heavy shifts in jars’ headspace methane isotope values in relative to the free mud gas methane isotope values have been observed for core chips as well as cuttings after they were collected in jars during unconventional tight oil and gas drillings. The model above proves that the pore throats from where the gases are released are on the nanometer scale, i.e., the development of nanoporosity and pore throat. Such nano pore throat are not only observed in shale rock formations, but also tight siltstone and carbonate rocks [26], as evidenced by the isotope heavy shifts observed.
4.2. Nano Fluidics in Rock and Fracing Fluid Interaction through Headspace Isotope Analysis
With on-site headspace isotope and concentration analysis of cuttings/core, we further identified that fresh fracing water is vital for initiating imbibition processes [27,28], which is a missing vital part of fracing but often overlooked. Through the headspace isotope measurement and model, we noticed that fresh water effectively opened permanent seals in shale gas rocks, releasing gas retained at high pressure as a result of capillary pressure of saturated brine. As shown in Figure 6, the dry shale cutting/core from Longmaxi headspace could maintain very heavy fractionated δ13C1 isotope (δ13C1 > −10‰) over very long period of time, i.e., weeks; and with fresh water added, the headspace δ13C1 isotope value quickly changed to −20‰ or lighter along with significantly higher gas released. The results further verified that capillary seal as the overpressure model and water’s vital role in fracing. The practical applications of this water imbibition HICA analysis is to predict the water saturation of the tight rocks, correct GIP, and guide the fracing and shut-in process during completion. Table 1 shows the results of isotope changes using HICA for different rock cuttings from several shale formations. The results demonstrate how fracing water breaking up the seals and how gas are preserved in the rock through capillary seals that needs proper fluid to open.
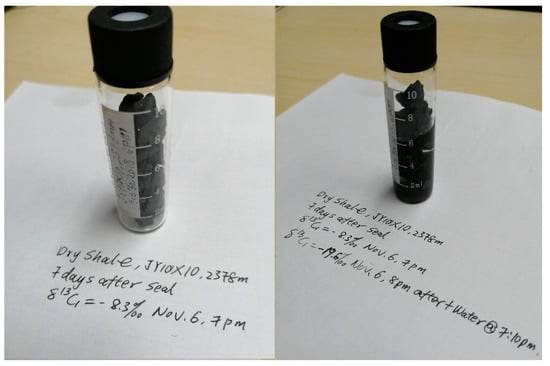
Figure 6.
Dry shale core chips are collected from core rocks from a Longmaxi vertical pilot well in the lower Longmaxi formation. The chips are sealed in a vial for 7 days after collection, and then headspace isotope is measured at −8.3‰; after adding distilled water headspace isotope is measured at −19.6‰.

Table 1.
Different samples with different isotope initial values and responds differently to water added later.
5. Discussion
Our results are consistent with the model by Javadpour [24], where they are also observing up to 50% of diffusion contribution to the total flow at low pressure and less than 1 nm pore throat. One special note here about the fractionation process is that the first term is proportional to pore pressure, at high pressure the Darcy flow will remain significant and proportionally increase with higher pressure even if pore throat decreases, and therefore the contribution of diffusion is suppressed compared to Javadpour’s plot of fixed lower pressure even when pore throat is significantly reduced to 0.4 nm, i.e., diameter of the methane molecule. This last plot demonstrates that the fractionation D*/D could not be treated as a constant through gas release from the tight rocks like shale, as simplified before [20]. Only when the pore throat is very narrow, i.e., under 20 nm, or pressure quite low, e.g., under 100 Bar, we would be able to observe obvious fractionation. To observe very large heavy fractionation in accumulated headspace like the experiments above demonstrated, we need to have pore throat down to 1nm or much smaller than 50 nm (Figure 2a–d).
By treating the D*/D as a function of pressure and pore throat, i.e., not as a constant has significant implications in calculating the original pore pressure or gas in place, or estimating ultimate recovery. The Darcy flow will dominate in a large portion of the gas release or production, therefore significantly more gases should be released or produced before isotope fractionation starts. Therefore, if pore pressure did not drop significantly below original reservoir pressure of 100Bars, the isotope fractionation, whether heavy or light will remain very small. However, the model here demonstrates that the dominating gas released during Darcy flow conditions will have a memory effect, which will result in heavier fractionation for the late stage diffusion dominated gas release or production. This memory effect gives headspace isotope and composition analysis a unique function, i.e., to restore the original pore pressure, besides measuring the pore throat like other methods for nano meter micro and up to sub-micron meso pore throat characterization.
The model first explained the results presented earlier in this paper and many other observations of cuttings or core chips from shale and tight formations. The reason we observed super heavily fractionated isotope from the cuttings collected hours to days in jars without water is because the pore throat are super narrow, i.e., effectively closed to inside high pressure gases, and the super heavy isotope readings is a result of the heavy fractionation at lower pressure of the pores already opened. When water is applied, nano throat closed by salt before is opened, and pristine high pressure gas is released and shift the heavy headspace to lighter values. The speed and magnitude of shift reflects the effectiveness of fluid-rock interaction, i.e., the matrix fracturing process, as well as the pores still trapped in pristine mode.
This model also elucidates the nanofludic fracturing at nanometer scale that is different from macroscopic conventional fracturing that we often emphasize. Without such nanofludic fracturing, the permeability of this rock matrix will still be too low to produce efficiently.
Following Equations (1)–(3) above, the pressure decay is controlled by a dimensionless parameter, 4 κt/(H/2)2, where κ is the effective permeability combining Darcy, Slippage and diffusion terms, as described in Equation (5), i.e.,
H = 1 m as thickness for the shale cutting, t is the time between Engelder [26] did the demo after sample is brought to the surface, i.e., 7 days. The effective permeability has to be under 5E-14 Darcy in order to hold gas at high pressure. Therefore, Engelder [26] proposed that only capillary seal could provide such low permeability. However, we further add that with regular water or low salinity water, the permeability is still not low enough, because water still has diffusion constant at about 1/1000th that of high pressure gas phase. This will leave regular shale, which has bulk permeability in the nano darcy region [26], with capillary seal a permeability in the 1E-12 Darcy, still much higher than 5E-14 Darcy. Only when the water in saturated with salt, the diffusion constant drops another magnitude of 2 or more, we could achieve the femto-darcy permeability as estimated here. This is consistent with the fact that slick water fracturing will have high salinity in the flowback water, an indirect indication of water’s role in matrix fracturing, i.e., opening of the nanofluidic seals. Also, explained is that high salinity water could not open tight oil and gas pore throats [29], while fresh water and fluid with surfactant could [30].
Such nanofludic seals, could not be opened by regular gel, but only opened by low salinity water or improved through optimization of rock-fluid interactions; the seals, once open, cannot be propped by regular proppants, and only through proper design of fracturing fluids, e.g., surfactants. Therefore, HICA could be a useful tool to characterize and optimization of the effectiveness of rock-fluid interaction during fracturing process.
This model demonstrates that the isotope and gas amount headspace dynamics from shale rocks could be used to retrieve the total gas amount if we could measure several data points during gas release, and also characterize the pore throat opened by the fluid. It provides similar information as porosity, pore size distribution and pore throat distribution measurements methods offered by NMR or BET low temperature adsorption.
Further results using this model and field measurement data to model pore pressure more reliably than conventional methods as well as optimizing fracing fluid design will be reported in our following papers submitted later.
6. Puzzles in Production
Now, we discuss the puzzles observed in tight oil and gas production, including shale gas, using the models developed above.
First puzzle is the stories that shale rocks exhumed from subsurface could hold shale gases for extended period of time. The overheard story happened in George Mitchell, the father of modern shale industry’s office in the late 90′s and earlier 2000′ goes as following—George was demonstrating to visitors the enigma or the amazing gas trapped from a piece of Barnett shale core which has been resting on his desk for more than a year, and he showed that when a droplet of water is impinged on the shale, bubbles could be seen coming from the core surfaces into the water droplet. Similarly, Terry Engelder, whose name associated with the word “fracing” for hydraulic fracturing and in his effort to explain the sink of low fracing water flowback, demonstrated that a small piece of Marcellus shale cutting from drilling bit which has been exposed in air for 7 days, could still generate gas bubbles after water droplet impinges, while water imbibes into the shale cutting, changing the surface wettability (Figure 7).
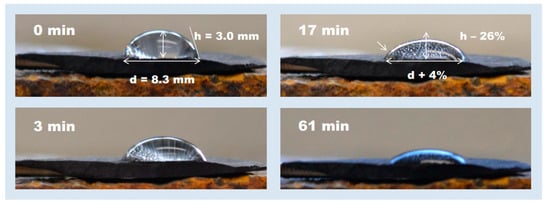
Figure 7.
(Authorized by Terry Engelder) Showing when water droplet impinges on a shale cutting from drillbit exposure in air over 7 days, the shale could still generate gas in the water droplet. As gas is generated, the wettability changes as the water imbibes [26].
The original intention of George Mitchell’s water drop demonstration was to show the gas in the shale is much larger than conventional adsorption model showed. However, following Mitchell’s suggestion, if the gases have been releasing like that when water impinges over a year or 7 days the amount of gases which the core or cutting is holding will be enormously unreasonable. So, it must be holding the gas until water impinged opens the “valve” to release the gases. But the permeability will have to be so low that it is below femto darcies (see Discussion for estimated calculations). There are also postulations that the gases released are just low pressure gases adsorbed by high TOC shale matrix and released after water displacement, or even air adsorbed over the year or 7 days. The headspace isotope and composition analysis (HICA) results above help to verify this nature of the gases release upon water droplet impingement is the opening of nano fluidic capillary seals. The isotope and composition changes reflect the gas release dynamics as a result of nano pore throat and high pore pressure maintained by saturated brine capillary seal.
Second puzzle is that some reported recoveries from prolific shale gas plays, e.g., in the core of Marcellus and China’s Jiaoshiba Longmaxi, are unreasonably high at over 60–100%, this obviously indicates the current pore pressure model is wrong and a better model should be developed. Similarly, in a lateral, it is widely recognized by industry that usually the 20% stages often produces over 80% of the total laterals, while the rest 80% stages contribute remaining 20% or less. This widely accepted recognition calls for better sweetspot identification to land the lateral and also steer to maximize the productivity of each stages, it also implies that some sweetspot already have recovery unreasonably high. Both better Gas in Place (GIP) calculation models and production models have to be developed. This model presented here explains the fractionation model and shows that headspace isotope analysis for core chips could reveal a more accurate pore pressure and therefore gas in place.
The last puzzle is that prolific shale gas plays along with a number of prolific tight oil plays, both shale and non-shale tight formations, have shown to have very “low flowback” (LoFB) of fracing water. This LoFB is the anathema for conventional oil and gas, indicating the well is ruined by water or the well does not have enough energy to push back the water. However, since the first modern hydraulic fracturing of Barnett shale gas well with fracing water, “LoFB” puzzle started to haunt operators [2,6,7,8]; and at the prolific Marcellus and Longmaxi shale, the flow back water often is much less than a third of what is pumped inside for fracing. Similar LoFB after fracing completions are observed in Eagleford and Wolfcamp shale oil plays, as well as non-shale formations, e.g., in the Mid-Bakken. The practices in the past decade or so however have demonstrated that LoFB is actually correlated with good production; and many intentional and unintentional delay or slowdown of flowback or shut-in, though not always, actually were rewarded with better production compared to offset that had immediate fast flowback. This raise the question of water-rock matrix interaction, is conventional way of water blocking model failing in unconventional tight oil and gas production?
All these three seemingly loosely correlated puzzles are actually rooted back to the first success of modern hydraulic fracturing in 1997, when the first water dominated fracturing succeeded with S.H. Griffin No. 4 vertical shale well by Nick Steinsberger at Mitchell Energy also had LoFB [2]. Similar shale revolution nostalgia was repeated again when Haynesville shale production per foot increased dramatically from 2016 to 2018 when larger volume of water fracing replaced gel fracing.
Here, in this paper we demonstrate with stable isotope headspace analysis that we could explain the rock-water interaction plays an important role in promoting instead of conventional way of blocking production, and thus explained the gases released from cuttings or cores after long exposure in the open air and water impingement. A nanofluidcs model is proposed, and we demonstrate we could actually also give better pore pressure or gas in place prediction to account for the ultrahigh recoveries reported.
7. Field Logging Results
Here in Figure 8, we present typical field HICA results, i.e., from core chip gas release HICA.
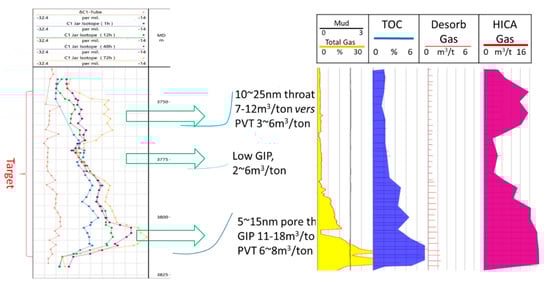
Figure 8.
The core chip HICA analysis along with other logs of a shale gas well drilled in the LMX-WF formation in Chongqing, south-west of China.
In the case of core chip gas release HICA, the core was brought up from coring drilling process in the Longmaxi-Wufeng (LMX-WF), i.e., Lower Silurian–Upper Ordovician, formation in Chongqing, China. The core-drilling was using water based mud and bringing up the core from the LMX-WF formation at 3200 m took over 18–30 h. The gas release or loss during core lifting is recognized as the major uncertainty in calculating the original gas in place (OGIP), which could account for over 90% to below 50% of the OGIP. Using the HICA model and field isotope and composition measurement data over 72 h, we are able to retrieve the OGIP and also the nano pore throat of the LMX-WF formation. The results are consistent with other limited depth sample measurements [13,17] where the isotope measurement were conducted back in the lab, i.e., all measurements show the gas release HICA isotope all trending heavier over the time, from close to −30‰ to heavier than −10‰.
There are three highlights from the HICA interpretations of Figure 8.
- The LMX-WF formation have high OGIP in the high TOC (5% typical or higher) lower LMX-WF sub-formation as well as lower TOC (1% TOC or lower) upper LMX sub-formation.
- The OGIP estimate based on HICA are generally 1.5 to 3 times the OGIP based on conventional protocol where the OGIP is calculated through porosity multiplied by the shut-in bottom hole pressure after completion. The HICA OGIP estimates are also 2–5 times the OGIP using on-site gas desorption protocol.
- Not only HICA could retrieve the OGIP but also calculate the pore throat through the different shapes of isotope and composition change over the time. It is shown that the most likely nano-pore throat is about 10–25 nm for the upper-LMX while 5–15 nm for the lower LMX-WF subformation. This is consistent with the measured permeability where the lower LMX-WF have the lowest permeability while the upper LMX have the highest permeability.
It is note there that all the samples are submerged in fresh low salinity water for measurement over the time, if the core samples are sealed in dry conditions, the HICA results will be different and similar to the results presented above, where the headspace gas could have very heavy isotope while concentration maintained low over long period of time due to good sealing of the nano pore throat.
8. Conclusions
A model of for headspace isotope and concentration analysis (HICA) for shale and other tight resources has been proposed and discussed. HICA will help the unconventional resources development by providing valuable data like nano pore throat and pore pressure. The results are quite different to results from conventional models.
- Nano pore throat size and over pressure as a result of nano capillary effect are the dominating storage and production in unconventional resources; whereas conventional resources have pore throat size in the micron or larger dimensions, at least 2–3 orders of magnitude difference.
- The isotope fractionation observed in experiment could be used to explain and measure the nano pore throat and capillary over pressure, and the HICA model gives a preliminary modeling of the isotope fractionation and composition changes with respect the nano pore throat and over pressures.
The experiment results both in this paper as well as production data available in the public domain demonstrate that the current methods of measuring gas in place or pore pressure needs to be modified to account for the nanofluid nature of shale, coalbed methane and other tight oil and gas resources. Water-rock stimulation should be considered in greater details both during completion and production. Rig-site HICA with the model presented here offer a convenient way to characterize these properties onsite.
Author Contributions
S.W., Y.T. formulated the model. M.L. and S.W. did the computer simulation. S.W.and A.S. compiled the field data. S.W. prepared the manuscript. All authors have read and agree to the published version of the manuscript.
Funding
This research received no external funding.
Conflicts of Interest
The authors declare no conflict of interest.
References
- Bowker, K.A. Recent Development of the Barnett Shale Play, Fort Worth Basin; West Texas Geological Society: Midland, TX, USA, 2003; pp. 4–11. [Google Scholar]
- Zuckerman, G. The Frackers: The Outrageous Inside Story of the New Billionaire Wildcatters; Penguin Group: New York, NY, USA, 2013. [Google Scholar]
- Gold, R. The Boom: How Fracking Ignited the American Energy Revolution and Changed the World; Simon and Schuster Paperbacks: New York, NY, USA, 2014. [Google Scholar]
- Meyhofer, M.J.; Richardson, M.F.; Walker, R.N.; Meehan, D.N.; Oehler, M.W.; Browning, R.R., Jr. Proppants? We Don’t Need No Proppants. In Proceedings of the Annual Technical Conference and Exhibition, San Antonio, TX, USA, 5–8 October 1997. [Google Scholar]
- Walker, R. Proppants, We Still Don’t Need No Proppants—A Perspective of Several Operators. In Proceedings of the SPE Annual Technical Conference and Exhibition, New Orleans, LA, USA, 27–30 September 1998. [Google Scholar]
- Jacobs, T. Letting It Soak In: Delaying Flowback Delivers Unique Results. J. Petrol. Technol. 2015, 67, 12. [Google Scholar]
- Bostrom, N.; Chertov, M.; Pagels, M.; Willberg, D.; Chertova, A.; Davis, M.; Zagorski, W. The Time-Dependent Permeability Damage Caused by Fracture Fluid; Society of Petroleum Engineers: New Orleans, LA, USA, 2014. [Google Scholar]
- Bertoncello, A.; Wallace, J.; Blyton, C.; Honarpour, M.; Kabir, S. Imbibition and Water Blockage in Unconventional Reservoirs: Well-Management Implications During Flowback and Early Production; Society of Petroleum Engineers: New Orleans, LA, USA, 2014. [Google Scholar]
- Su, X.B.; Chen, R.; Lin, X.Y. The curve characteristic and application of 13CH4 and 12CH4 in coal adsorption. J. Coal Sci. 2007, 32, 539–543. [Google Scholar]
- Duan, L.J.; Tang, S.H.; Liu, H.L. Desorption and carbon isotope fractionation of coalbed methane in Jincheng area. Geol. J. China 2008, 14, 414–418. [Google Scholar]
- Strąpoć, D.; Schimmelmann, A.; Mastalerz, M. Carbon isotopic fractionation of CH4 and CO2 during canister desorption of coal. Org. Geochem. 2006, 37, 152–164. [Google Scholar] [CrossRef]
- Niemann, M.; Whiticar, M.J. Stable Isotope Systematics of Coalbed Gas during Desorption and Production. Geoscience 2017, 7, 43. [Google Scholar] [CrossRef]
- Li, K.; Meng, Z.; Ji, J. Characteristics and influencing factors of desorption gas in Wufeng-Longmaxi formations in Fuling area, Sichuan Basin. Pet. Geol. Exp. 2018, 40, 90–96. [Google Scholar]
- Strąpoć, D.; Michael, E.; Roper, J.; Maguire, M. Insights into Shale Gas Production & Storage From Gas Chemistry—What Is It Telling Us? In Proceedings of the AAPG Hedberg Conference, Austin, TX, USA, 1–5 October 2012. [Google Scholar]
- Chatellier, J.-Y.; Flek, P.; Molgat, M.; Anderson, I.; Ferworn, K.; Larsen, N.L.; Ko, S. Overpressure in Shale Gas: When Geochemistry and Reservoir Engineering Data Meet and Agree. AAPG Mem. 2013, 3, 45–69. [Google Scholar]
- Lu, J.; Larsonb, T.E.; Smyth, R.C. Carbon isotope effects of methane transport through Anahuac Shale—A core gas study. J. Geochem. Explor. 2015, 148, 138–149. [Google Scholar] [CrossRef]
- Yang, Z.; Wei, Z.; He, W. Characteristics and significance of on-site gas desorption from Wufeng-Longmaxi shales in southeastern Sichuan Basin. Nat. Gas Geosci. 2017, 28, 156–163. [Google Scholar]
- Meng, Q.; Wang, X.F.; Wang, X.Z. Variation in the carbon isotopic composition of alkanes during shale gas desorption process. J. Nat. Gas Geosci. 2016, 1, 139–146. [Google Scholar] [CrossRef]
- Zumberge, J.E.; Ferworn, K.A.; Curtis, J.B. Gas character anomalies found in highly productive shale gas wells. Geochim. Cosmochim. Acta Suppl. 2009, 73, 1539. [Google Scholar]
- Tang, Y.; Xia, X. Isotope fractionation of methane during natural gas flow with coupled diffusion and adsorption/desorption. Geochim. Cosmochim. Acta 2012, 77, 489–503. [Google Scholar]
- Larson, T.E.; Breecker, D.O. Adsorption isotope effects for carbon dioxide from illite- and quartz-packed column experiments. Chem. Geol. 2014, 370, 58. [Google Scholar] [CrossRef]
- Rahn, T.; Eiler, J.M. Experimental constraints on the fractionation of 13C/12C and 18O/16O ratios due to. Geochim. Cosmochim. Acta 2001, 65, 839–846. [Google Scholar] [CrossRef]
- Meier-Augenstein, W. Applied gas chromatography coupled to isotope ratio mass. J. Chromatogr. A 1999, 842, 351–371. [Google Scholar] [CrossRef]
- Javadpour, F. Nanopores and Apparent Permeability of Gas Flow in Mudrocks (Shales and Siltstone). J. Can. Pet. Technol. 2009, 48, 16–21. [Google Scholar] [CrossRef]
- Cao, G.; Zhang, H.; Jiang, W.; Wu, S.; Zhu, D.; Lin, M. A New Gas-Content-Evaluation Method for Organic-Rich Shale Using the Fractionation of Carbon Isotopes of Methane. SPE J. 2019, 24, 6. [Google Scholar] [CrossRef]
- Sorensen, J.; Kurz, B.; Hawthorne, S.; Jin, L.; Smith, S.; Azenkeng, A. Laboratory characterization and modeling to examine CO2 storage and enhanced oil recovery in an unconventional tight oil formation. Energy Proced. 2017, 114, 5460–5478. [Google Scholar] [CrossRef]
- Engelder, T. Capillary tension and imbibition sequester frack fluid in marcellus gas shale. Proc. Natl. Acad. Sci. USA 2012, 109, E3625. [Google Scholar] [CrossRef]
- Engelder, T.; Cathles, L.; Bryndzia, L. The fate of residual treatment water in gas shale. J. Unconv. Oil Gas Resour. 2014, 7, 33–48. [Google Scholar] [CrossRef]
- Teklu, T.; Li, X.; Zhou, Z.; Alharthy, N.; Wang, L.; Abass, H. Low-salinity water and surfactants for hydraulic fracturing and EOR. J. Pet. Sci. Engin. 2018, 162, 362–377. [Google Scholar] [CrossRef]
- Shuler, P.; Tang, H.; Lu, Z.; Tang, Y. Chemical Process for Improved Oil Recovery from Bakken Shale. In Proceedings of the CSUG/SPE, Calgary, AB, Canada, 15–17 November 2011. [Google Scholar]
© 2020 by the authors. Licensee MDPI, Basel, Switzerland. This article is an open access article distributed under the terms and conditions of the Creative Commons Attribution (CC BY) license (http://creativecommons.org/licenses/by/4.0/).