Article

Ice-Cliff Morphometry in Identifying the Surge Phenomenon of Tidewater Glaciers (Spitsbergen, Svalbard)

by
Joanna Ewa Szafraniec
Faculty of Natural Sciences, Institute of Earth Sciences, University of Silesia in Katowice, Będzińska 60, 41-200 Sosnowiec, Poland
Geosciences 2020, 10(9), 328; https://doi.org/10.3390/geosciences10090328
Submission received: 27 May 2020 / Revised: 14 August 2020 / Accepted: 18 August 2020 / Published: 20 August 2020
(This article belongs to the Special Issue Glacier Characteristic Variability in Polar Regions)

Abstract

:
In this study, 110 tidewater glaciers from Spitsbergen were studied to characterize the frontal zone using morphometric indicators. In addition, their time variability was also determined based on features of the active phase of glacier surges. Landsat satellite imagery and topographic maps were used for digitalization of the ice-cliffs line. In recent years (2014–2017) all the glaciers studied can be thus classified as: stagnant (33%), retreating and deeply recessing (33%), starting to move forward/fulfilling the frontal zone (23%), and surging (11%). Indicators of the glacier frontal zone (CfD and CfE) allow to identify the beginning and the end of the active phase through changes in their values by ca. 0.05–0.06 by the year and get even bigger for large glaciers as opposed to typical interannual differences within the limits of ±0.01 to 0.02. The active phase lasted an average of 6–10 years. The presence of a “glacier buttress system” and the “pointed arch” structure of the ice-cliff seem to be an important factor regulating the tidewater glacier stability.

1. Introduction

Spitsbergen glaciers are in rapid recession. This is observed in both land-based glaciers [1,2,3,4,5] and those terminating at sea [6,7,8] and is regarded as a manifestation of the Arctic amplification effect, whereby changes in the net radiation balance tend to produce a larger increase in temperature near the pole than the planetary average [9,10]. This process contributes to the expansion of low-albedo, ice-free sea surfaces with positive feedback (e.g., [11,12,13]).
In Spitsbergen (Svalbard Archipelago), surging glaciers represent a significant proportion of the glacier cover [6,14,15,16,17,18,19,20,21,22]. They operate within the so-called “climate envelope” [23], i.e., in optimal thermal and humidity conditions. Their behavior is mainly driven through snow mass supply in the glacier reservoir area (e.g., [24,25]) and glacier enthalpy disorder, mainly at the ice-cliff area [22,26]. The surging tidewater glaciers behave differently than the land-based glaciers. On land, the increased stress mainly propagates through the glacier surface from the accumulation area to the ablation zone where the maximum ice flow velocities are also measured. This sometimes manifests as an ice bulge [19,27,28]. For tidewater glaciers, on the other hand, the properties of the active phase are often more obvious at the glacier ice-cliff. This phenomenon tends to be seen as an expanding crevassed zone [22], as a result of the steep slope on the glacier surface propagating due to ablation of its lowermost part—the frontal zone. These features have been observed in Aavatsmarkbreen, for example. Other glaciers also show a characteristic lowering of the frontal zone due to ablation, and consequently intensive calving and retreat into deeper water from the pinning point. This is, for example, the case of Wahlenbergbreen, Mendeleevbreen, or Paierlbreenn [6]. Meltwater and precipitation entering the glacier also enhances crevasse propagation towards the top of the glacier [22,29,30]. The presence of crevasses in the frontal zone is important for determining tidewater glacier dynamics. In particular, crevasse formation increases the susceptibility of the glacier to mechanical ablation by calving [6,7,20,31,32], facilitates the distribution of meltwater through en- and subglacial drainage systems [22,33,34,35], particularly at low inclinations, crevasse allows penetration of direct radiation into deeper parts (also through multiple reflection of radiation from the crevasse ice walls [36]) and facilitates ice-atmosphere and ice-ground/sea thermal conductivity. The length of the ice-cliff [20] also influences thermal conductivity processes at the common ice–water–atmosphere boundary. As such, the ice-cliff wall also represents an additional heat and energy exchange zone. The glacier behavior is also influenced by the depth of the fjord into which the glacier flows [37,38,39]. Thus, glaciers terminating in deeper parts of fjords are more susceptible to form a dense network of crevasses, further supplying heat to the underwater sections of the ice-cliff. This effect is particularly pronounced in areas where warmer West Spitsbergen Current waters penetrate deeply into the fjord [40].
Regardless of the mechanisms determining the surging behaviour, a common sign of the active phase from all surging glaciers is the quick and constant change in geometry of the glacier frontal zone. If the ice-cliff bent towards the sea (convex), it is indicative of an advancing phase, whilst a bending towards the land (concave) is a sign of glacier retreat through intensive calving. This geometry is indeed representative of its dynamic state.
The purpose of this study is to analyze Spitsbergen tidewater glaciers using selected morphometric parameters of the frontal zone. This study combines data from 110 tidewater glaciers, including surging glaciers. Here, data from 1936 to 2017, both from recessive and advancing fronts is analyzed. In particular, the study focuses on annual geometrical changes of glaciers surging in the 1985–2017 period. Frontal morphometry was thus assessed as potential indicator to determine the initiation and termination of the active phase of the glacier surge. These data was used to forecast the initiation of active phases in 2017 and later, based on frontal morphology data from the 2014–2017 period. The results suggest that the “glacier buttresses system” of the frontal zone anchored on land plays a potential role on ice-cliff stabilization.

2. Materials and Methods

Landsat 7 Enhanced Thematic Mapper Plus (ETM+) satellite images with 30 m × 30 m resolution (543 bands) were collected from the summer seasons in year 2000 supplemented with a few in 2002. Landsat 8 Operational Land Imager/Thermal InfraRed Sensor (OLI/TIRS) imagery (654 bands) were collected for the 2014, 2017, 2018, and 2019 seasons (Table S1: Emblems of topographic maps and IDs and acquisition dates of Landsat satellite images used in the research). These images were downloaded using the EarthExplorer browser [41]. They were published by the United States Geological Survey (USGS) and the National Aeronautics and Space Administration (NASA) in the public domain. The selected data cover the ablation season. Topographic maps at 1:100,000 scale published by Norwegian Polar Institute (old and new editions [42]) were used to define the ice-cliff edges for the years 1936, for the 1960s and 1970s, and partly for the 1990s. The maps from the older edition were georeferenced to the UTM 33 coordinate system using the ED50 ellipsoid (EPSG:23033) and then transformed into ETRS89 (EPSG:25833). Older Landsat 5 Thematic Mapper (TM) (543 bands) images from the period 1985–1998 and data described earlier were used to track yearly changes in the morphometry of 15 selected glaciers (1985–2017) (Table S2. IDs and acquisition dates of Landsat satellite images for selected tidewater glaciers in Spitsbergen in the period 1985–2019). For a few cases Terra ASTER © NASA satellite scenes were used. Collected satellite images were also used to digitize the surface area of glaciers on available imagery in the year (max. 5 years) before the occurrence of the active phase of the glacier surge (see Table S2—data pointed by red color of font). The vector layers (polygons) were used to calculate the basic morphometric parameters of a given glacier in order to examine the relationship between them and morphometry of the frontal zone. The average glacier slope is determined as the ratio between the elevation difference (maximum and minimum altitudes of the glacier found using the TopoSvalbard portal [43]) and the length of the glacier measured along the central line. The compactness coefficient was calculated as the ratio of the glacier perimeter to the circle perimeter of area equal to the glacier area.
The data were analyzed using QGIS software (different versions). The ice-cliff line was delineated (vector layers) manually in a 1:20,000 scale. The composition of 543 (654) spectral bands clearly highlights the glacier ice area (blue), the non-glaciated area on land (brown, red) and sea water area (black, dark navy blue). For maps, the glacier front delineated in the original study was used as the cliff line.
The length of the ice-cliff line may vary between seasons, particularly depending on whether the image was taken at the beginning or the end of the ablation season. Uniform quality images from the whole of Spitsbergen are not available from the same day, due to variable cloud cover, different glacier exposure (shading), or other variables such as the presence of pack ice. The glacier range defined in the maps used were also based on aerial photographs and satellite images taken on different days for the same reasons.
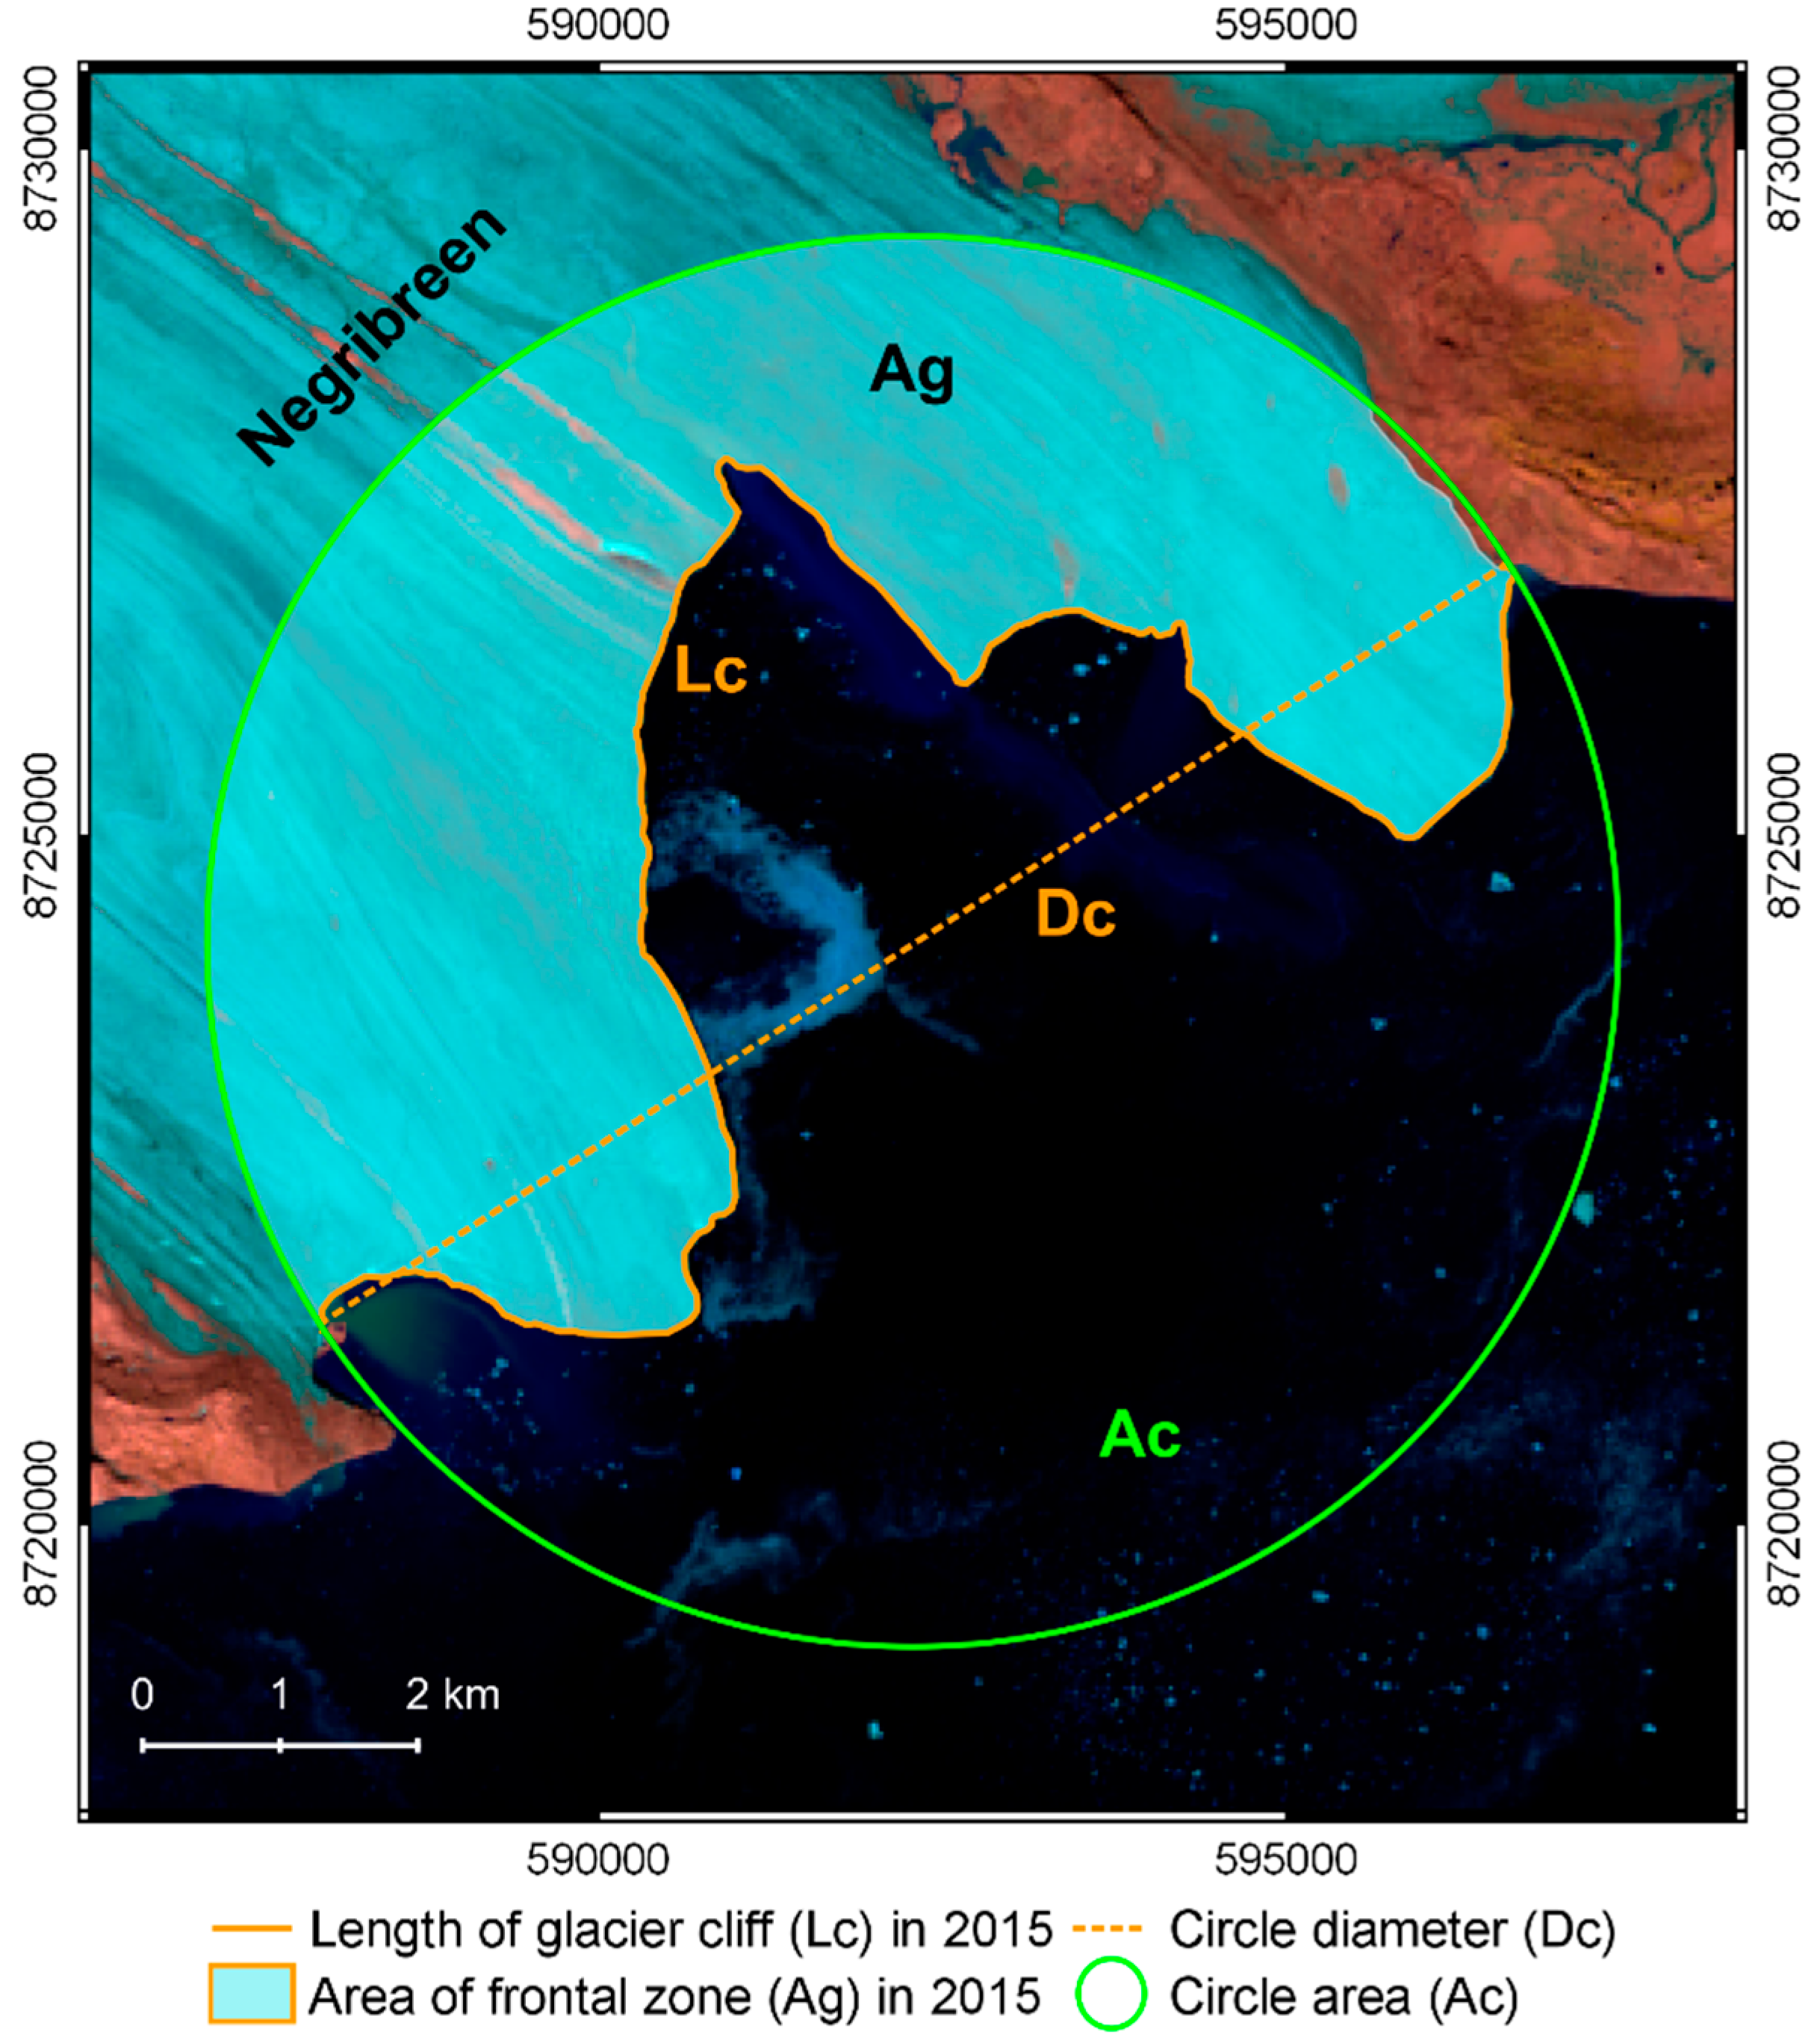
This study assumes that the glacier frontal zone reacts clearest and fastest to changes in glacier dynamics than any other glacier sections. The following definition of the frontal zone (Figure 1) was used here as standard: the “frontal zone Ag” of tidewater glaciers is defined as the section contained within the Ac circle with a diameter Dc equal to the distance between the parts of the glacier ice-cliff Lc anchored on land.
Following the definition of the glacier frontal zone, the morphometric indicators—”glacier front dynamics indicator CfD” and “ice-cliff balance indicator CfE”—were defined. Thus, CfD represents the ratio of glacier frontal zone area Ag to circle area Ac:
CfD   =   Ag Ac .
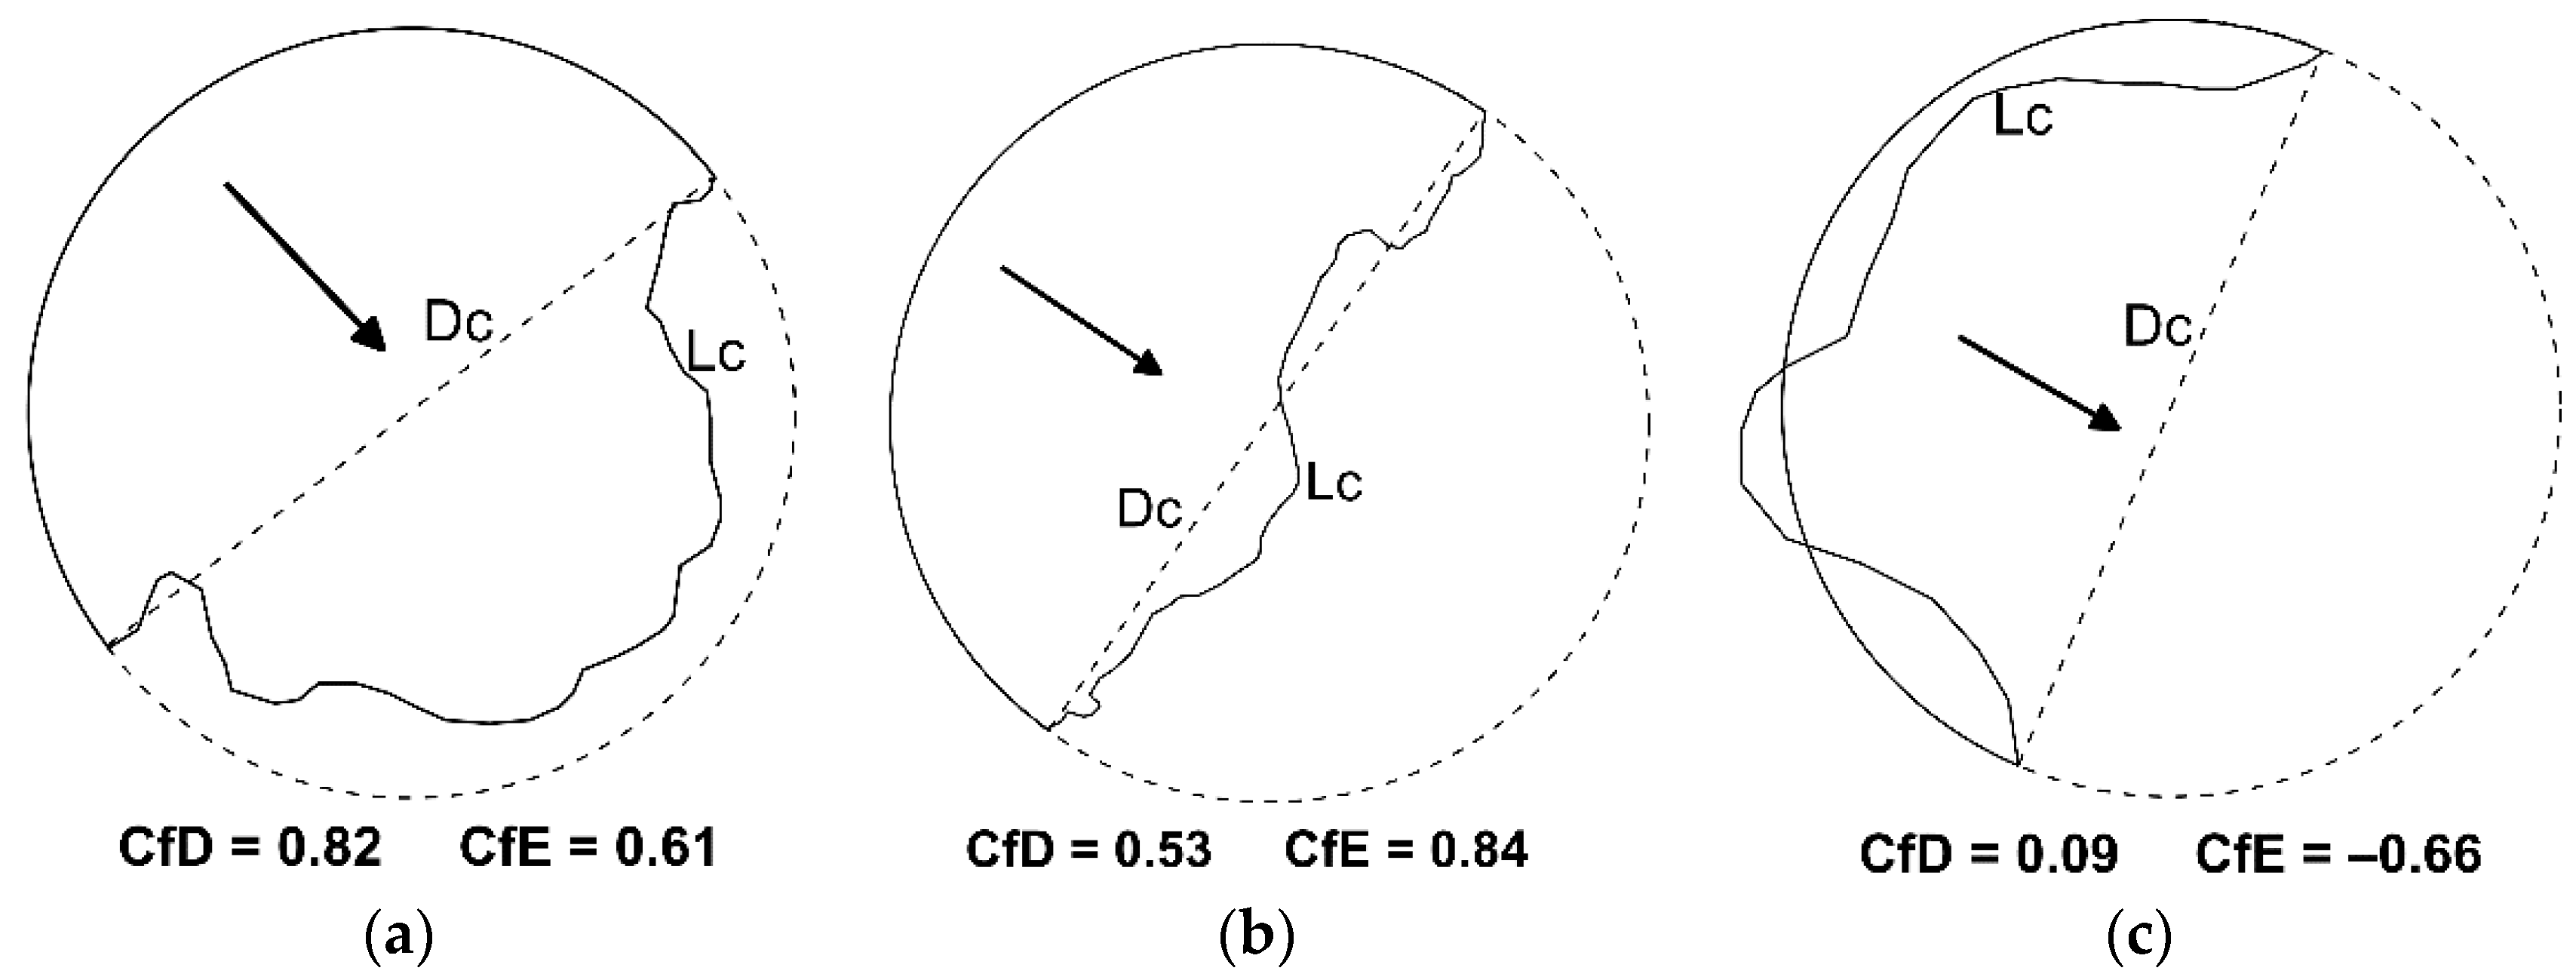
A CfD close to 1 or higher represents a convex frontal zone typical of advancing glaciers (Figure 2a). The highest absolute value of CfD = 1.11 was found for Negribreen in 1969. A value of CfD above 1 (extreme cases) usually means that the frontal zone has spilled out and moved far out into the sea, beyond the outlet of the valley that limits it, and in consequence beyond the perimeter of the theoretical circle Ac. A CfD of approximately 0.5 represents a semi-circular frontal zone with a cliff line closely following the diameter of the circle and usually presenting very little variability (Figure 2b). Finally, a CfD close to or below 0 is indicative of a clearly concave glacier front in deep recession, where the inflexion point(s) of the ice-cliff line is often at a long distance from the line between the anchor points (Figure 2c). A negative value appears when the greater part of the frontal zone is outside the circle area Ac. Then this “minus” area needs to be subtracted from the value of the frontal zone area lying inside the circle (usually lateral part anchored on land). The lowest CfD = −1.15 was found for Samarinbreen in 1961.
The ice-cliff balance indicator, CfE, is the ratio of the circle diameter length Dc to the ice-cliff length Lc:
CfE   =   Dc Lc .
The absolute value (a.v., modulus), used to compared among different glaciers, represents the degree of curving of the ice-cliff. Thus, an absolute of 1 indicates a straight line; that is, that the length of the ice-cliff Lc is equal to the circle diameter Dc. This can be achieved by any glacier during the evolution between the concave and convex shape of its frontal zone (and vice versa). Ice-cliff bending level increases as the absolute values approach 0, with the number of inflexion points increasing concomitantly. The greatest curvature of the ice-cliff was found for Sefströmbreen in 1990 (|CfE| = 0.21). The symbols + and − are used to distinguish between convex (+) and concave (−) glaciers. A negative sign is when most of the measured ice-cliff length Lc is located between the circle diameter Dc and the part of the frontal zone closer to the glacier body. In turn, when most of the cliff line exceeds the circle diameter Dc towards the sea, the sign for CfE is positive (cf. Figure 2).

3. Results

3.1. Geometric Parameters of the Glacier Ice-Cliffs in Spitsbergen (1936–2017)

Ice geometry data from Spitsbergen glaciers (Table 1) were compiled for the year 1936 (28 glaciers; no data available from the NW and N parts of Spitsbergen), the period 1961–1966 (35 glaciers; no data available from the N and NE parts of Spitsbergen), 1969–1977 (17 glaciers; no data available from S Spitsbergen), 1990 (73 glaciers), 2000, 2014, and 2017 (110 glaciers each year). The different periods include different combinations of glacier systems (their complexity). For example, Strongbreen was configured as one glacier system in 1936 while it is currently shaped as several separate land-terminated (e.g., Karlbreen) and tidewater glaciers (e.g., the Kvalbreen–Indrebøbreen system, Moršnevbreen, the Sokkelbreen–Naglebren–Nuddbreen system ⇒ Strongbreen, the Vindeggbreen–Persejbreen system), as a result of recession.
Due to the asymmetrical distribution of morphometric parameters of the glaciers in terms of their area and their frontal zones, the calculation of average values for the glaciers population from each period took into account the median and interquartile range (IQR) values. Glaciers between 19.5 km2 and 110.4 km2 analyzed here (within the IQR; based on data by Błaszczyk et al. [20]) can be considered as typical in terms of surface area.
For the following parameters—Lc, Dc, Ag, and Ac—the results show that the highest median appeared in 1936. The values subsequently decreased until the year 2000. Thus, the median ice-cliff length (Lc) decrease by 1.6-fold, the median valley width at the glacier front anchoring points (Dc) showed a 2-fold decrease, the frontal zone area (Ag) decreased by 4.9-fold, and the median value of area of the circle surrounding the glacier frontal zone (Ac) decreased by 3.8-fold. However, the period 1969–1977, when the values were slightly higher, was an exception. In addition, an increase in Lc was observed between 2000 and 2014 followed by a 1.1-fold decrease. Ag, on the other hand, showed a 1.3-fold decrease first followed by a 1.2-fold increase measured in 2017. The CfD and CfE indicators also show a general downward trend, suggesting that ice-cliffs are presenting an increasingly recessive nature. The exception was the year 2000, when these indicators increased.
If the interaction between CfD and CfE for each glacier is considered, then most of the glaciers were in a state of recession throughout all the periods discussed here (negative CfE values and CfD values below 0.5) (Figure 3). However, there is always a group of advancing glaciers (or shortly after the active phase of the glacier surge), representing 10.5% (1990) to 18.2% (2000) of the population of tidewater glaciers. These glaciers are characterized by a positive CfE value and a CfD value often above 0.5.

3.2. Frontal Zone Morphometry of the Retreating Glaciers

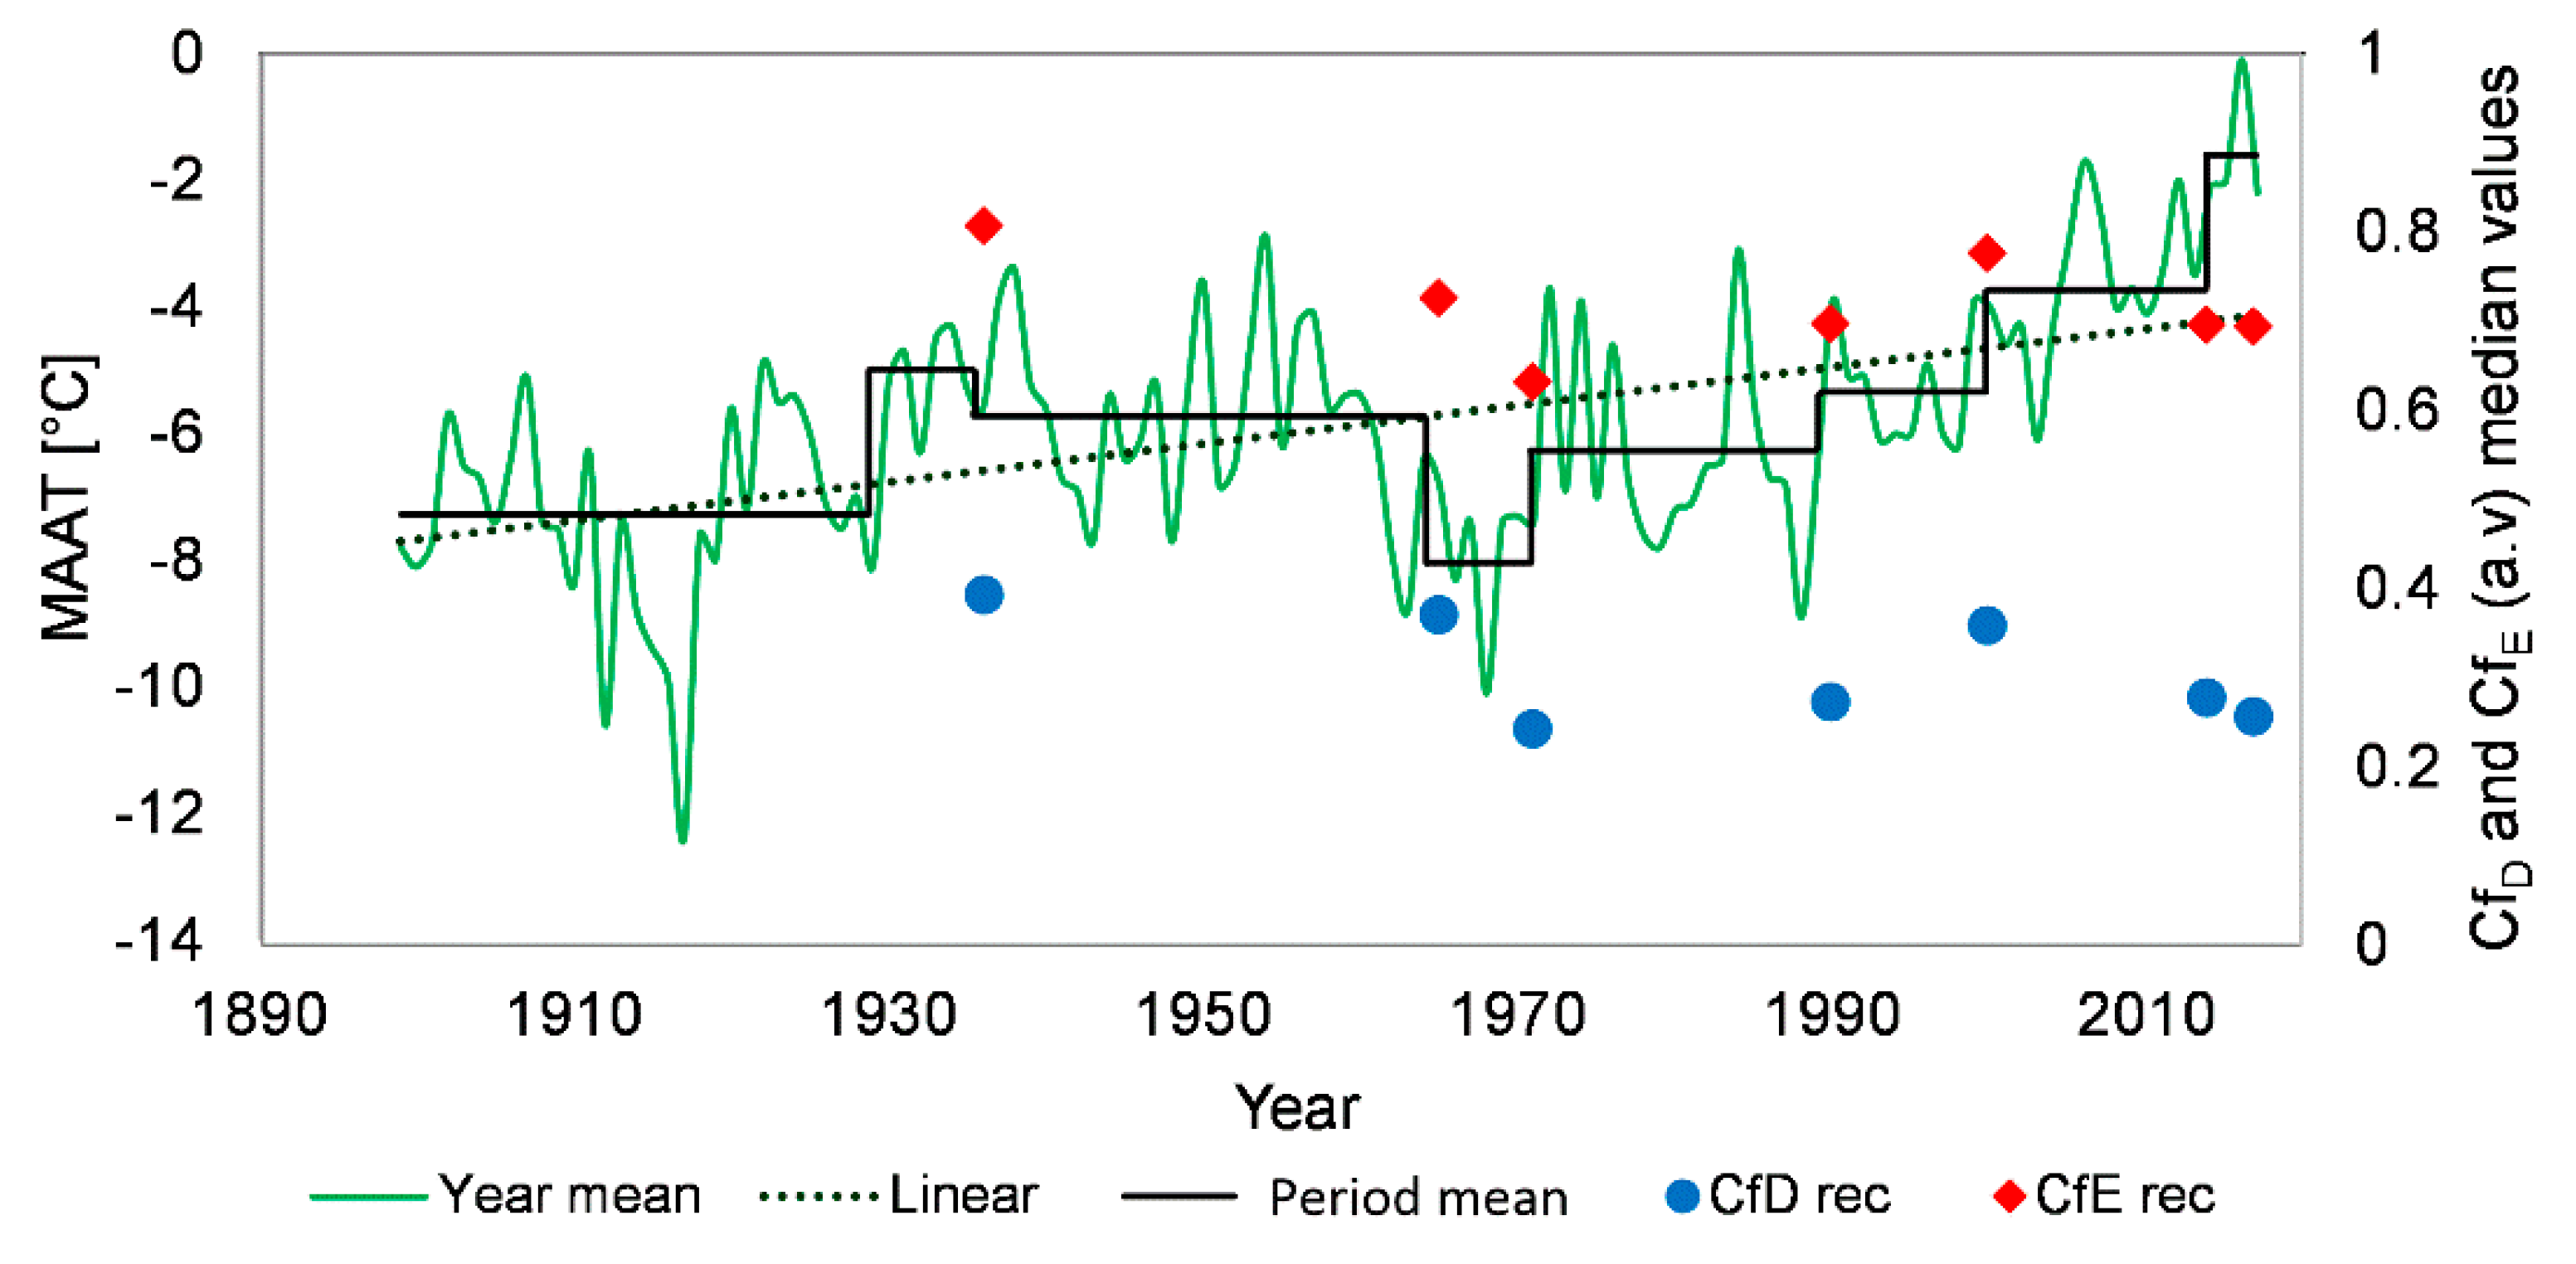
The values of morphometric indicators of the glacier frontal zones during recession phase were plotted against the mean annual air temperature (MAAT) measured at the Svalbard Airport for each of the different periods considered (Figure 4). Glaciers showed a less intense recession following the minimum temperatures recorded at the beginning of the 20th century, presenting the highest median CfD and CfE (specifically, CfD = 0.39 and CfE = 0.81 a.v. in 1936). In contrast, the same glaciers showed their strongest recession episode over 30–40 years later, where the median values for both indicators dropped to CfD = 0.24 and CfE = 0.63 a.v., (median from 1969–1977). Until the end of the 20th century, the median values increased reaching CfD = 0.36 and CfE = 0.78 a.v. in 2000. The recession process further intensified over the first 17 years of the 21st century, accompanied by a decrease in CfD and CfE, down to 0.26 and 0.69 a.v., respectively, in 2017. Both values were close to the levels observed in the 1990s, which was followed by the largest number of surging tidewater glaciers in Spitsbergen.
In relation to ice-cliff exposure in 1990, south-east and north-west facing glaciers showed the strongest recessive nature (Figure 5). These glaciers showed a median CfD of 0.11 and a relatively low CfE (a.v.) compared to the other glacier groups.
In the year 2000, a clear growing trend was observed for the dynamically active of most glacier fronts, apart from those from the southern sector. This was most noticeable for ice-cliffs facing the south-east sector, with CfD values reaching over 0.44. The ice-cliff lengths in relation to the circle diameter also shortened, presenting median CfE (a.v.) of approximately 0.80.
More recessive stage was also observed for the 2014–2017 period, apparent as a clearly visible melting of the most dynamic part of the glacier frontal zones, particularly obvious for ice-cliffs facing to the southern sector. At this stage, ice-cliffs withdraw considerably with the CfD reaching its lowest recorded value at −0.06. This curving is also reflected in the lowest median CfE reaching 0.46 (a.v.). A significant decrease in CfD and CfE was also observed from north-facing glaciers, and to a lesser extent, for west- and north west-facing fronts. The fluctuation in CfD and CfE was smaller for east- and south west-facing glaciers.

3.3. Frontal Zone Morphometry of the Advancing Glaciers

Over the years 1990–2017, advancing ice-cliffs were found in glaciers from all geographical aspects, and roughly around the same number of cases (up to 5% difference). This pattern was particularly obvious for all north-, east-, or south west-facing tidewater glaciers from Spitsbergen, with fewer cases found from north-east (8% difference), south, and west. However, the proportion of cases changed over this period. Thus, in 1990–2000 the most active glacier fronts were found particularly in the N–S axis (e.g., Petermannbreen, Monacobreen, Waggonwaybreen, Paierlbreen, and Storbreen) and with north-east exposure (e.g., Davisbreen, and Inglefieldbreen-Nordsysselbreen). In turn, in 2014–2017, active ice-cliffs dominate in the E–W axis (e.g., Vindeggbreen-Persejbreen, Sjettebreen, Arnesenbreen, and Strongbreen) and from south west-facing glaciers (e.g., Blomstrandbreen, Kollerbreen, and Marstrandbreen).
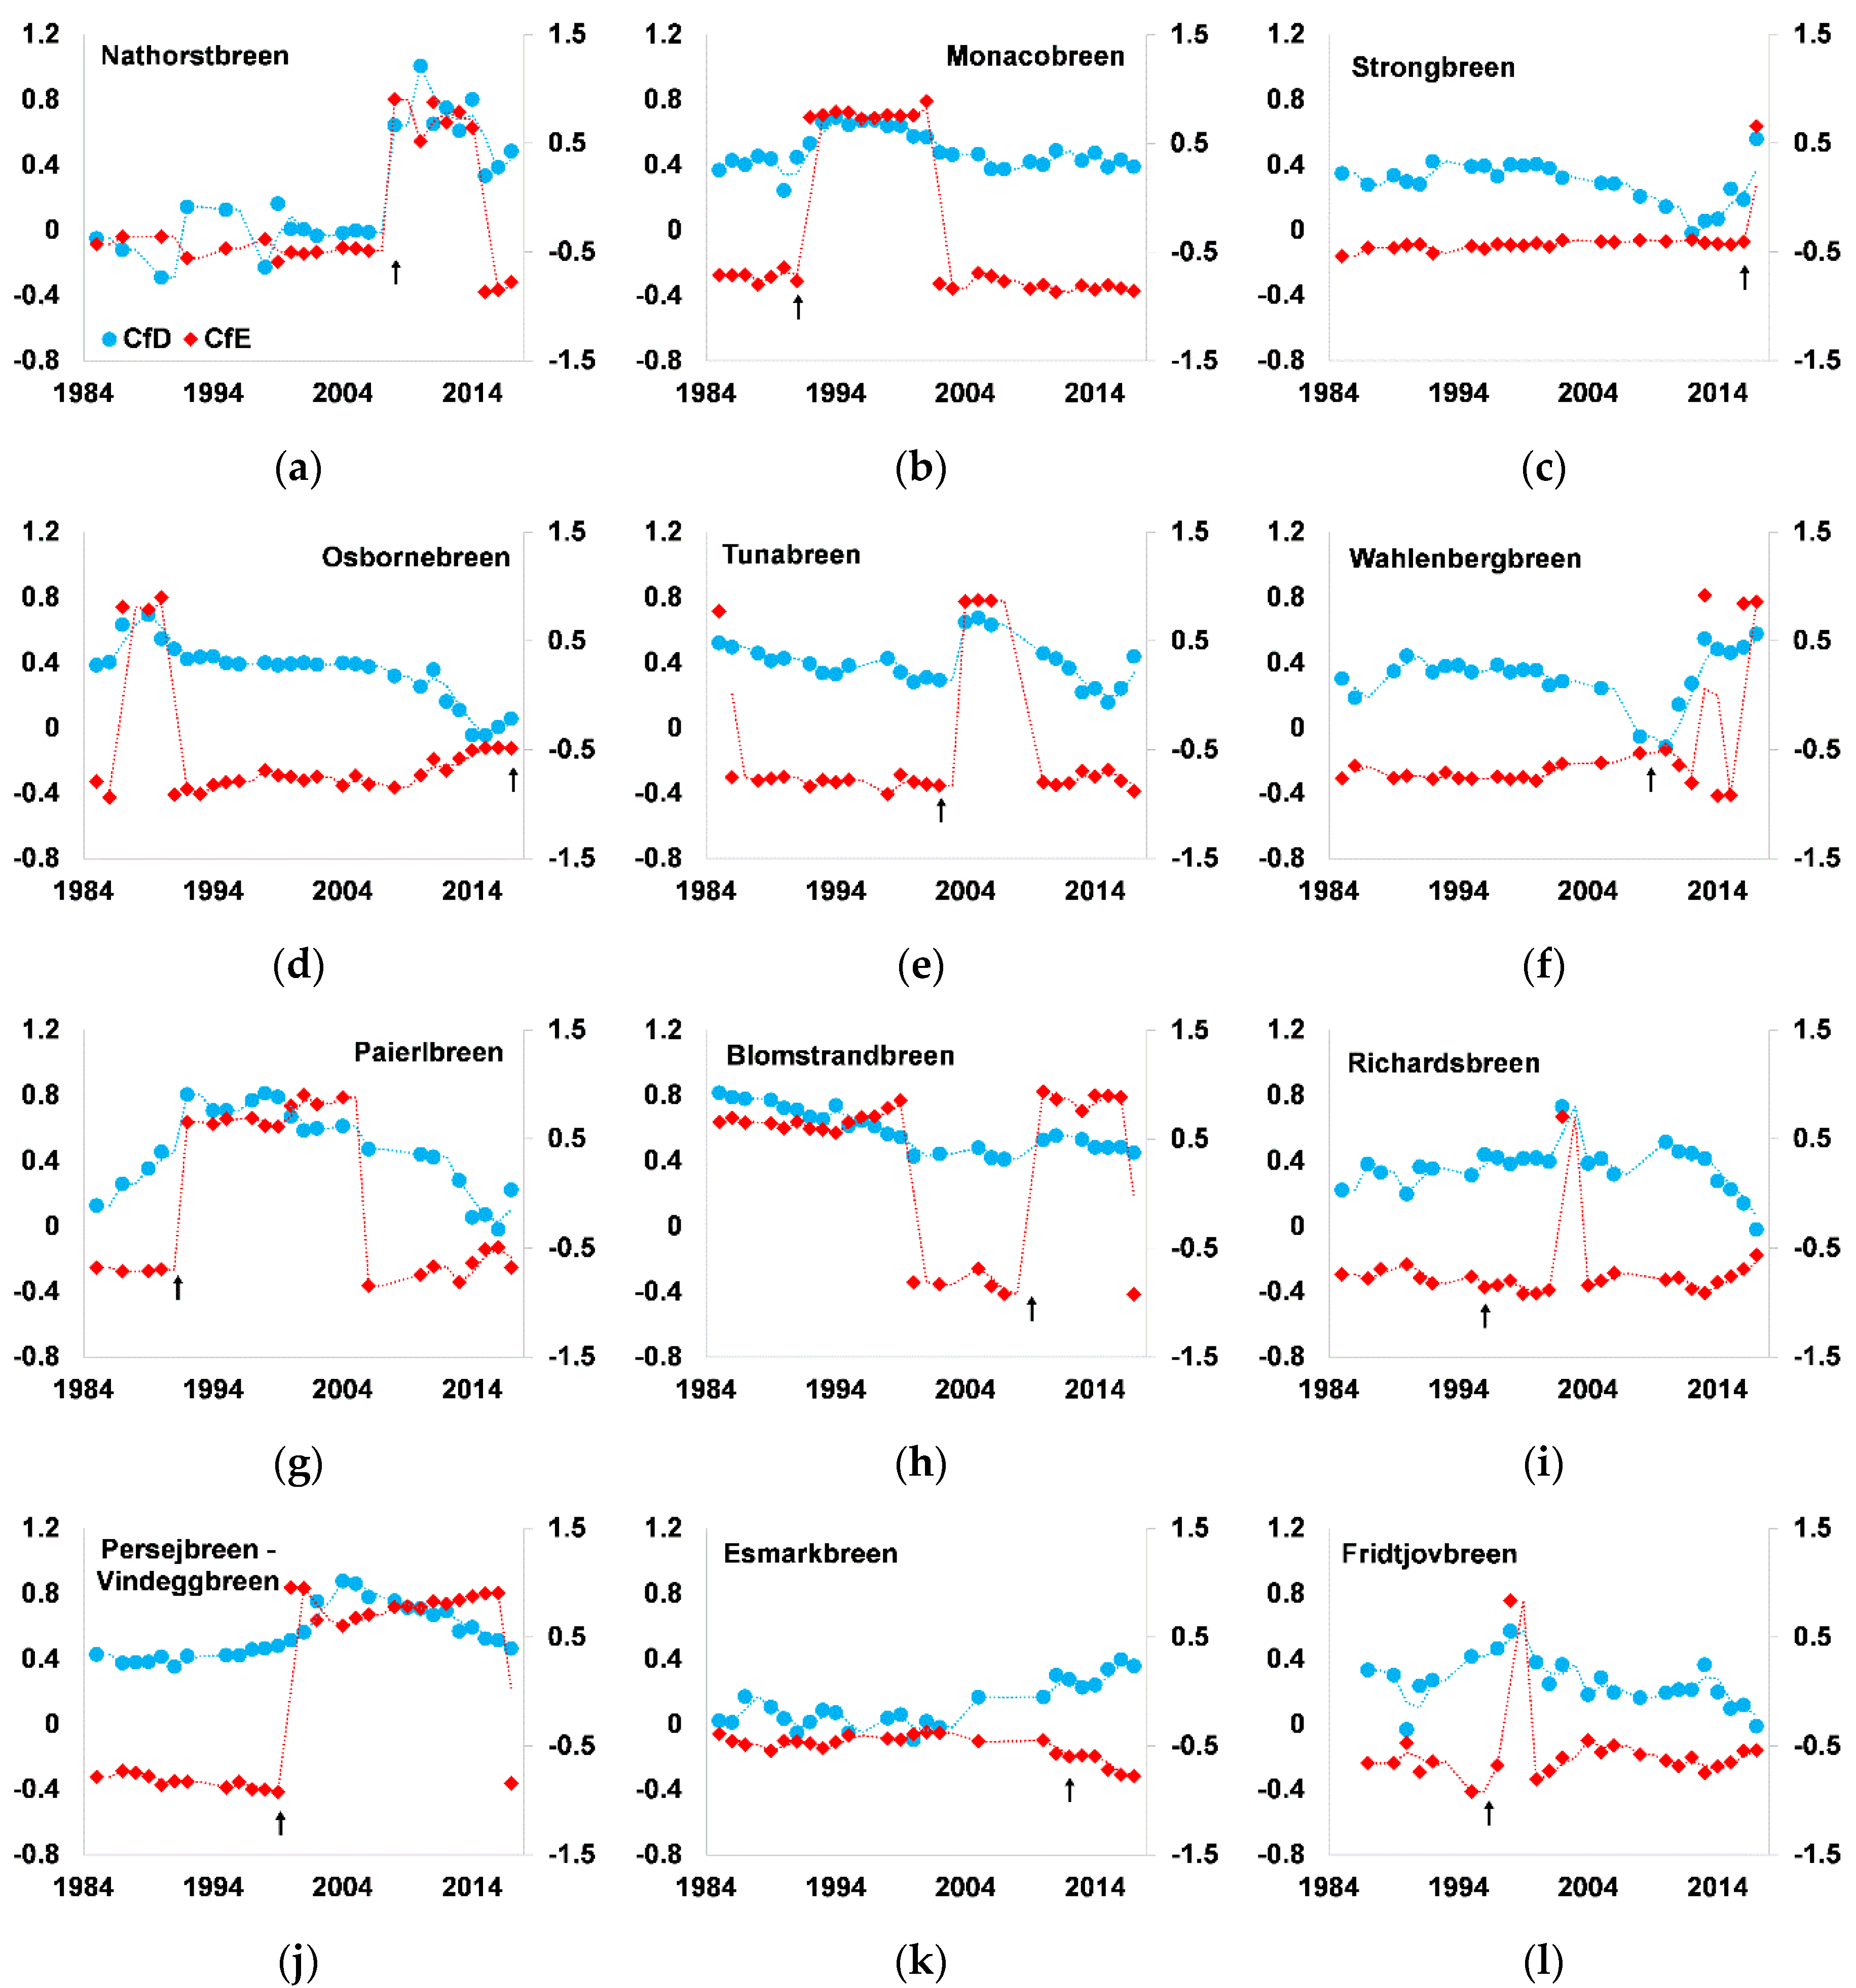
Annual variations in the frontal zone geometrical indicators were analyzed for 15 glaciers. These glaciers experienced an active phase of the glacier surge at some point during 1985–2017 (based on: Murray et al. [45]; Błaszczyk et al. [20]; Sund et al. [19]), or/and the advance could be directly observed from data analyzed in this study (Figure 6, Table 2). As the glaciers advance, their CfD values changed from 0.33 (0.18 to 0.40 of IQR) during the quiescent phase to 0.61 (0.54 to 0.71 of IQR) during the active phase. The median CfE changed from −0.72 (−0.81 to −0.56 of IQR) during the quiescent phase to 0.78 (0.69 to 0.88 of IQR) during the active phase of the glacier surge.
The comparison presented in Table 2 allows assessing how the timing of the initiation and end of the active phase can be determined based on CfD and CfE. This relation differed slightly for the published data: by ±0 to 4 years for the beginning and ±1 to 6 years for the end of the active phase. The average duration of the active phase based on data published for 10 glaciers was approximately 3–10 years, while the CfD and CfE indicators showed an average active phase of 6–10 years. Some of the published results, however, appeared in print during the active phase and the glacier could have continued surging afterwards.
The increase in CfD and CfE was nearly concomitant to the glacier movement for larger glaciers (e.g., Nathorstbreen, Monacobreen, and Paierlbreen). However, a delay of few years was also observed (e.g., Mendeleevbreen and Wahlenbergbreen). A correlation analysis between the values of both indicators also show a delay of up to five years before the indicator values jump (Table 3). The largest significant correlation of indicators at the significance level of 0.05 took place one year and five years before the active phase. In all cases, the active phase ended with an obvious decrease in CfD and CfE; thus, entering a quiescent phase characterized by small interannual changes in these values.
Preliminary analysis indicates that the length of the ice-cliff just before the active phase of the glacier surge is well correlated with the glacier surface slope and the glacier compactness. The gentler the slope of the glacier surface and more complex the glacier in terms of its geometry, the longer its ice-cliff. This is because the glaciers that are most complex in shape are usually large valley glacier systems with numerous tributaries. These studies will be continued.

3.4. Application of CfD and CfE Indicators in the Classification of Spitsbergen Tidewater Glaciers in Terms of Dynamics

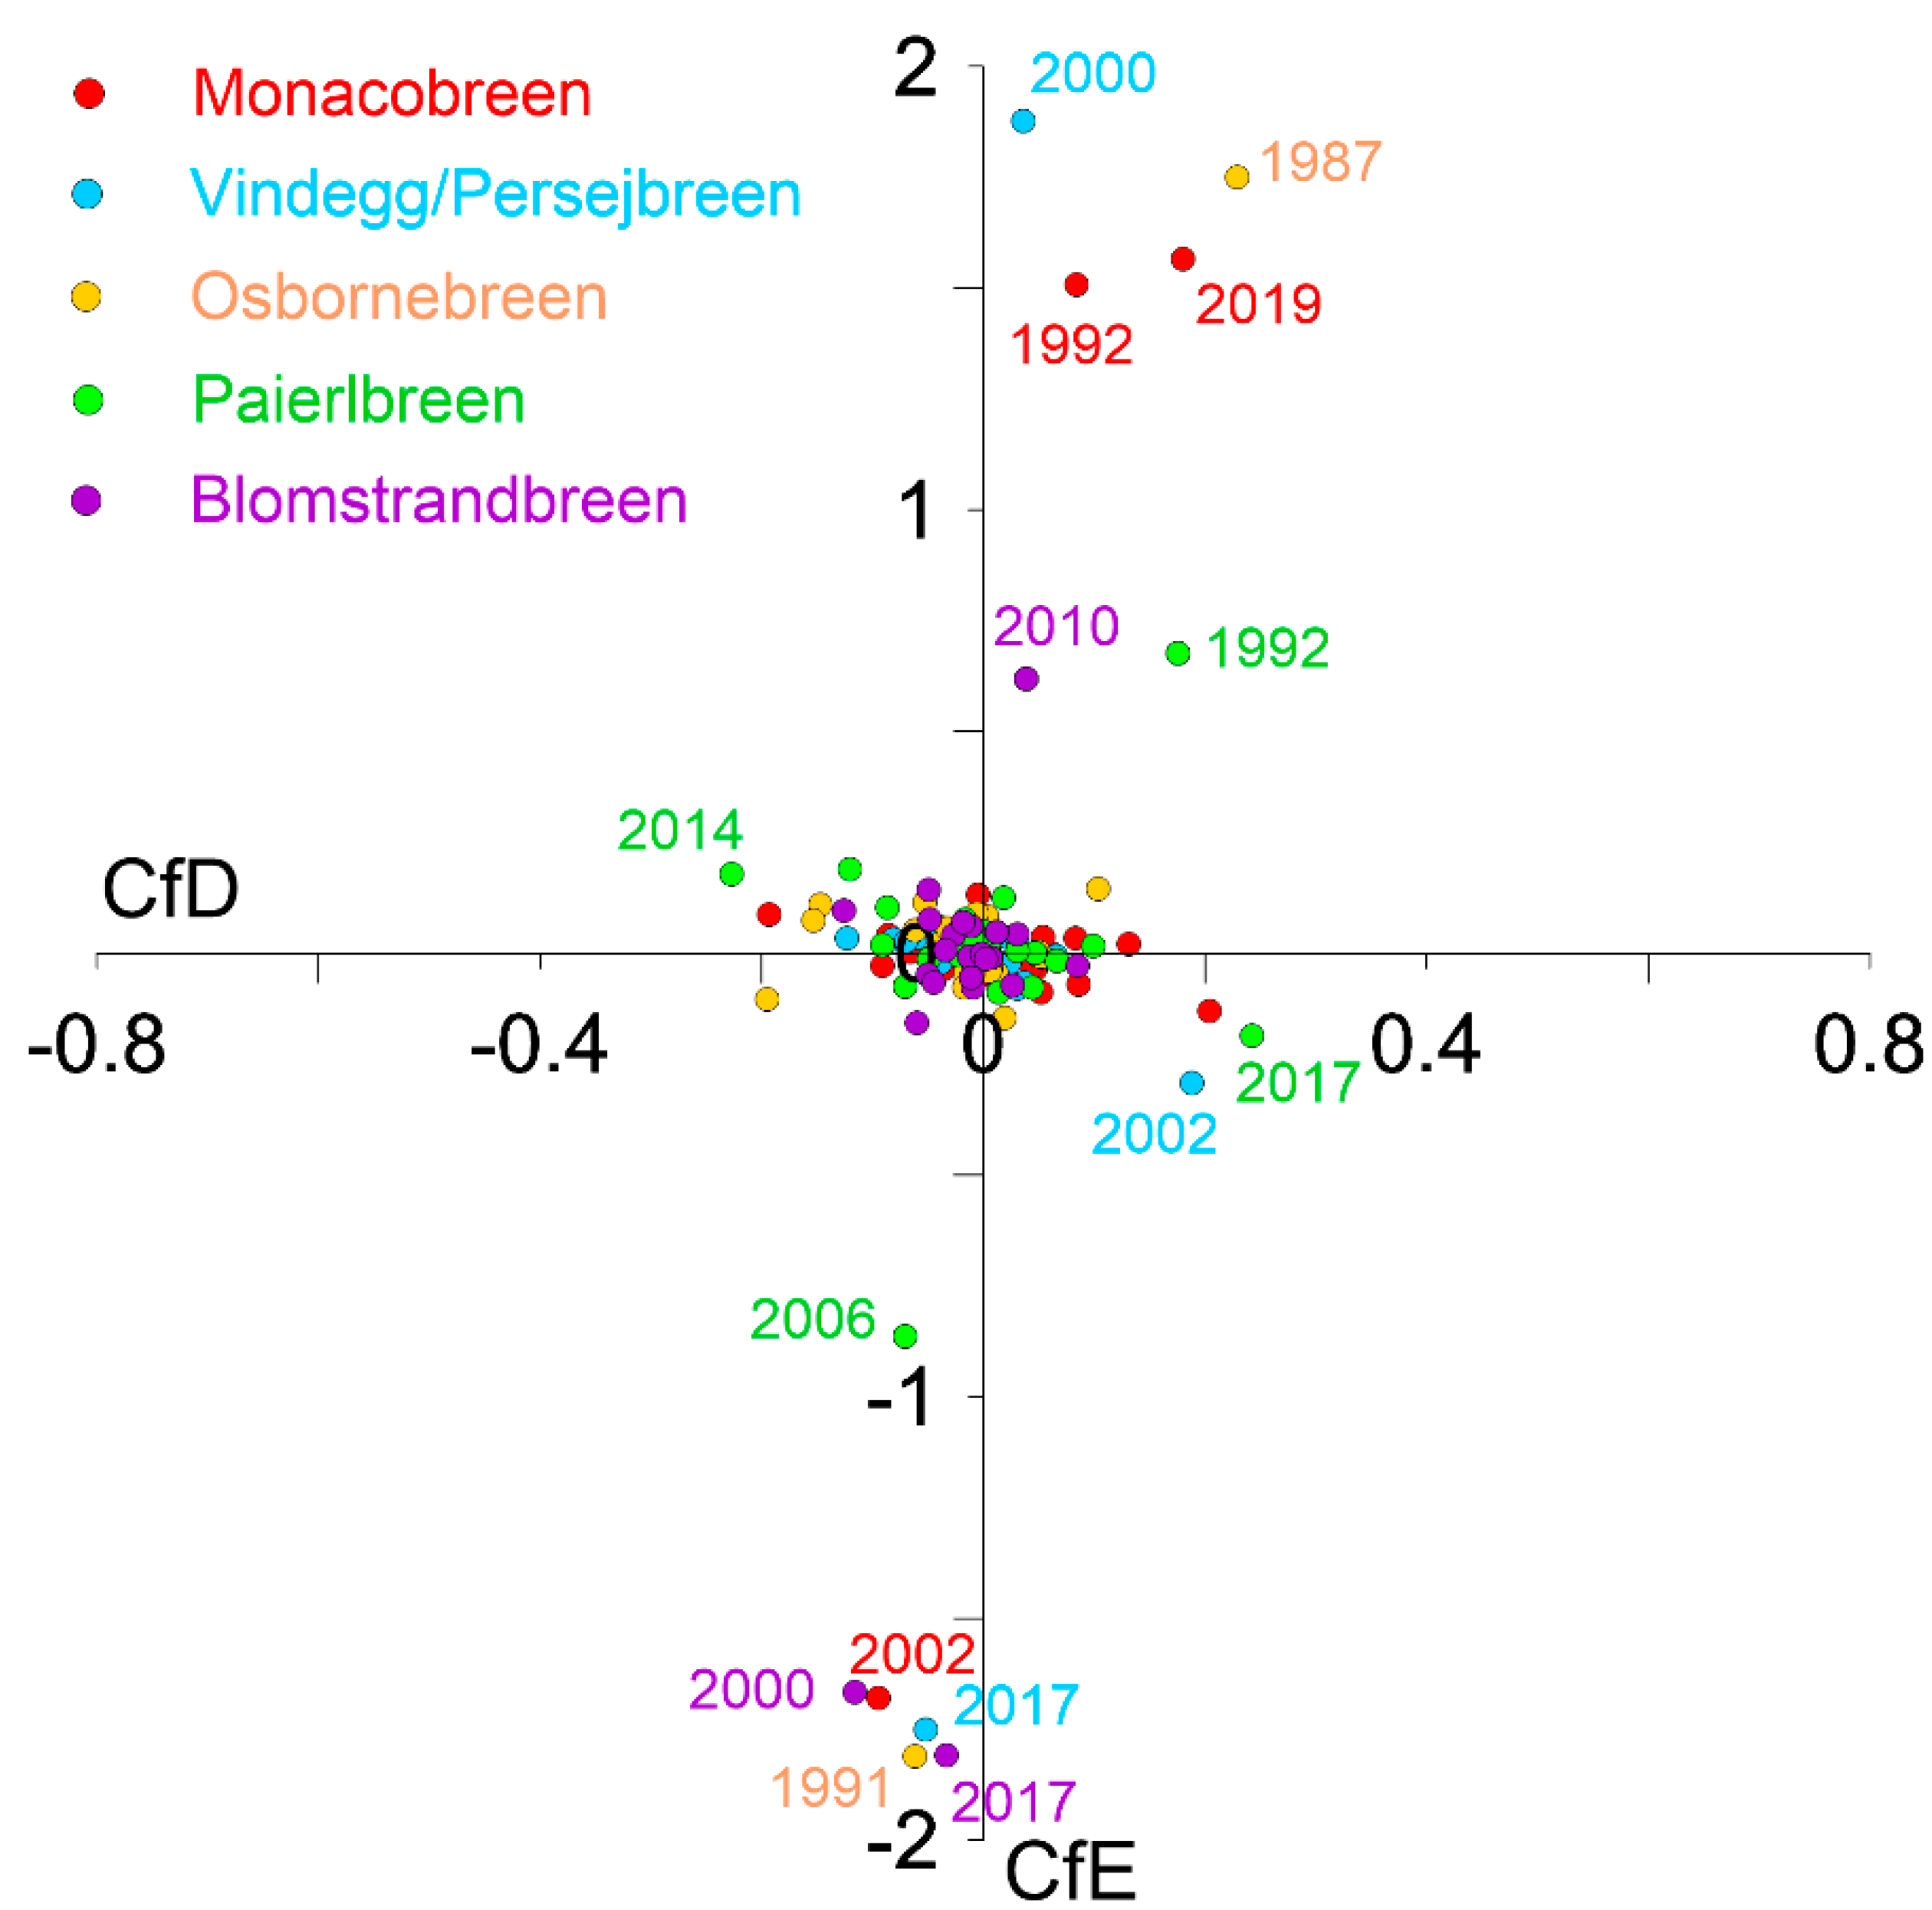
Interannual changes in indicator values were presented to describe the dynamic state of five Spitsbergen tidewater glaciers with the most complete data sets for the period 1985–2017: Monacobreen (to 2019; N part of Spitsbergen), the Vindeggbreen–Persejbreen system (E part of the island), the Osbornebreen–Vintervegen system and Blomstrandbreen (both in W part of Spitsbergen), and Paierlbreen (S part of the island) (Figure 7; see Table S2). The data indicates that most of the time the ice-cliffs are characterized by slight interannual changes in indicator values. The situation changes significantly with the beginning of the active phase of the glacier surge when the increase in values appears as a clear deviation in the I quadrant of the graph (advance), and this is also recorded in Figure 6. A similar clear deviation occurs in the III quadrant during the transition of the active phase to the quiescent phase. Then in Figure 6 the CfE values go negative (retreat).
The analysis of the interannual variation in the CfD and CfE indicators allows describing the following dynamic models for tidewater surging glaciers in Spitsbergen:
  • At the beginning of “the active phase of the glacier surge” both CfD and CfE indicators increase rapidly by 3–5 times during approximately 1–5 years. For larger glaciers, the rate of increase can reach a maximum of a 10× increase (I quadrant in Figure 7 and Figure 8). In this phase, the frontal zone protrudes (convex shape) and the glacier moves forward. Then the ice-cliff position is marked by slight fluctuations or “stagnates”, and numerous inflexion points associated with intensive calving appear in the cliff line.
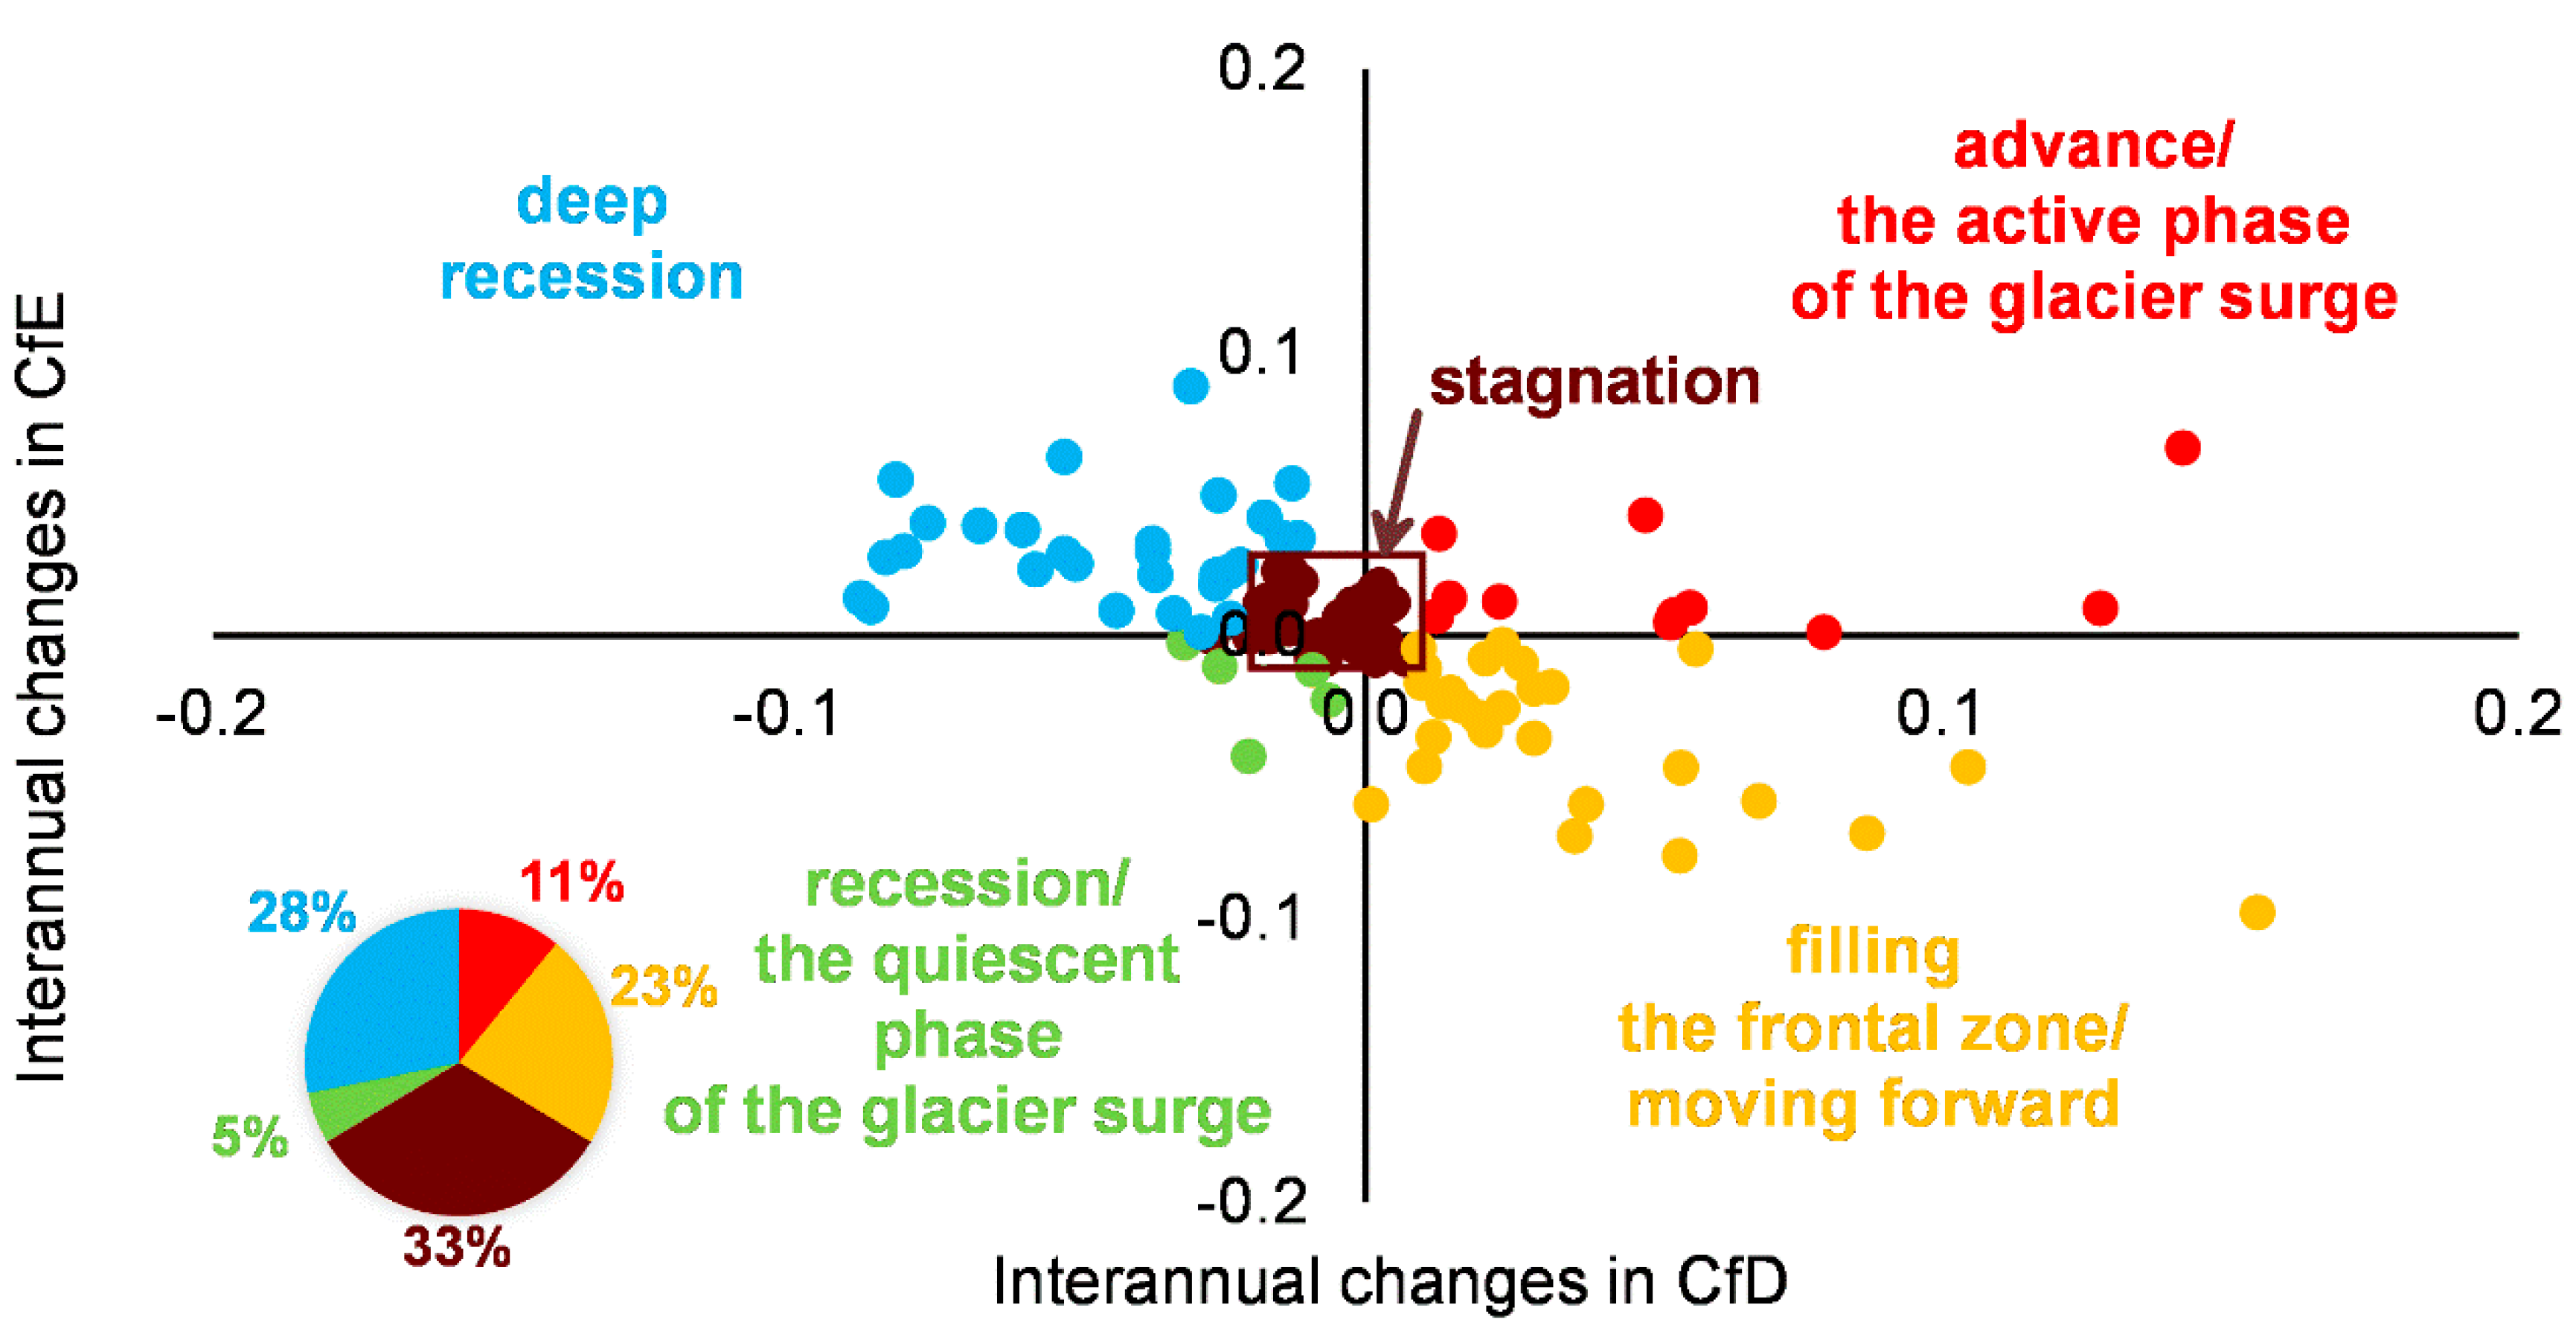
  • After the active phase, the glacier first loses its frontal zone convexity, mainly as a result of intensive calving, and it is subject to “recession” (including the quiescent phase of the glacier surge). At this point, CfD and CfE values decrease interannually to an average of 0.05–0.06 (for CfE the sign changes to negative; III quadrant).
  • Subsequently, the glacier can enter a “deep recession phase”, when its frontal zone is strongly concave, especially for the largest glaciers (IV quadrant). “Glacier buttresses” are also observed, i.e., parts of the glacier front anchored on land, from which the ice-cliff bends into an arch. During the quiescent phase, CfD and CfE values change very little interannually and are ca. 0.015–0.025. The value of CfD decreases the most (it can even be negative), with the CfE value slowly increasing from −1 to approximately −0.5.
  • The glacier begins to lose its maximum ice-cliff concavity at the end of the recession with “the frontal zone filling and the slow forward movement” beginning (II quadrant). At this point, the CfD value slowly increases and CfE value slowly decreases (from −0.5 to −1) until the protrusion of the glacier front and the value changes to plus sign.
The presented model was adopted for Monacobreen for the 1985–2019 period (Table 4). Based on the indicators, the beginning of the active phase (I) of the glacier surge was determined in 1991–1992. For the first 2 years, the frontal zone was getting convex and the glacier advanced about 1100 m in western part to about 1500 m in eastern part of the cliff line compared to 1991. Then it entered a period of stagnation/minor fluctuations in the position of its ice-cliff, rising slightly in the western part and about 700 m in the eastern part of the cliff. At the end of the active phase (2000–2001), retreat began with the still convex frontal zone. The active phase lasted until 2001–2002 (10 years). After this period, the glacier entered the quiescent phase of the glacier surge (negative CfE). Slow withdrawal of the ice-cliff position was accompanied by ablation by calving and melting (concave shape). By 2007, the glacier withdrew from about 700 m in the eastern part of the ice-cliff to about 800–900 m in the western part. The appearance of inflexion points (2005) indicates probably an important role of the outflow of subglacial waters. After 2008, the quiescent phase was marked by some recovery in glacier behaviour, reflected in changes in the indicators values from year to year up to 2018. The glacier retreated by 500–600 m. The quiescent phase lasted 17 years. In 2018–2019, a new active phase (II) of the glacier surge began (positive CfE), as before, from the bending of the ice-cliff line towards the sea and an advance of about 800–900 m on the central line of the glacier.
Interannual variations in CfD and CfE estimated on the basis of the data from 2014 and 2017 were also analyzed including all glaciers (Figure 8) to determine which of them may experience an active phase of glacier surge in 2017 and later according to the model proposed. In addition, a class represented stagnant glaciers has been specified based on the IQR of interannual variations of CfD and CfE. In this class CfD varied from −0.02 to 0.01 per year and CfE from −0.01 to 0.02 per year during the analyzed period.
A total of 28% of the 110 tidewater glaciers were in deep recession. In the 2014–2017 period, one-third were stagnant glaciers with an uncertain future behavior, although this might be a sign of an impending active phase of the glacier surge. For example, Nathorsbreen, Tunabreen, and Persejbreen showed interannual differences for CfD and CfE close to 0 about 4 years before the active phase of the glacier surge. Eleven percent of glaciers should have already been experiencing an active phase of the surge.
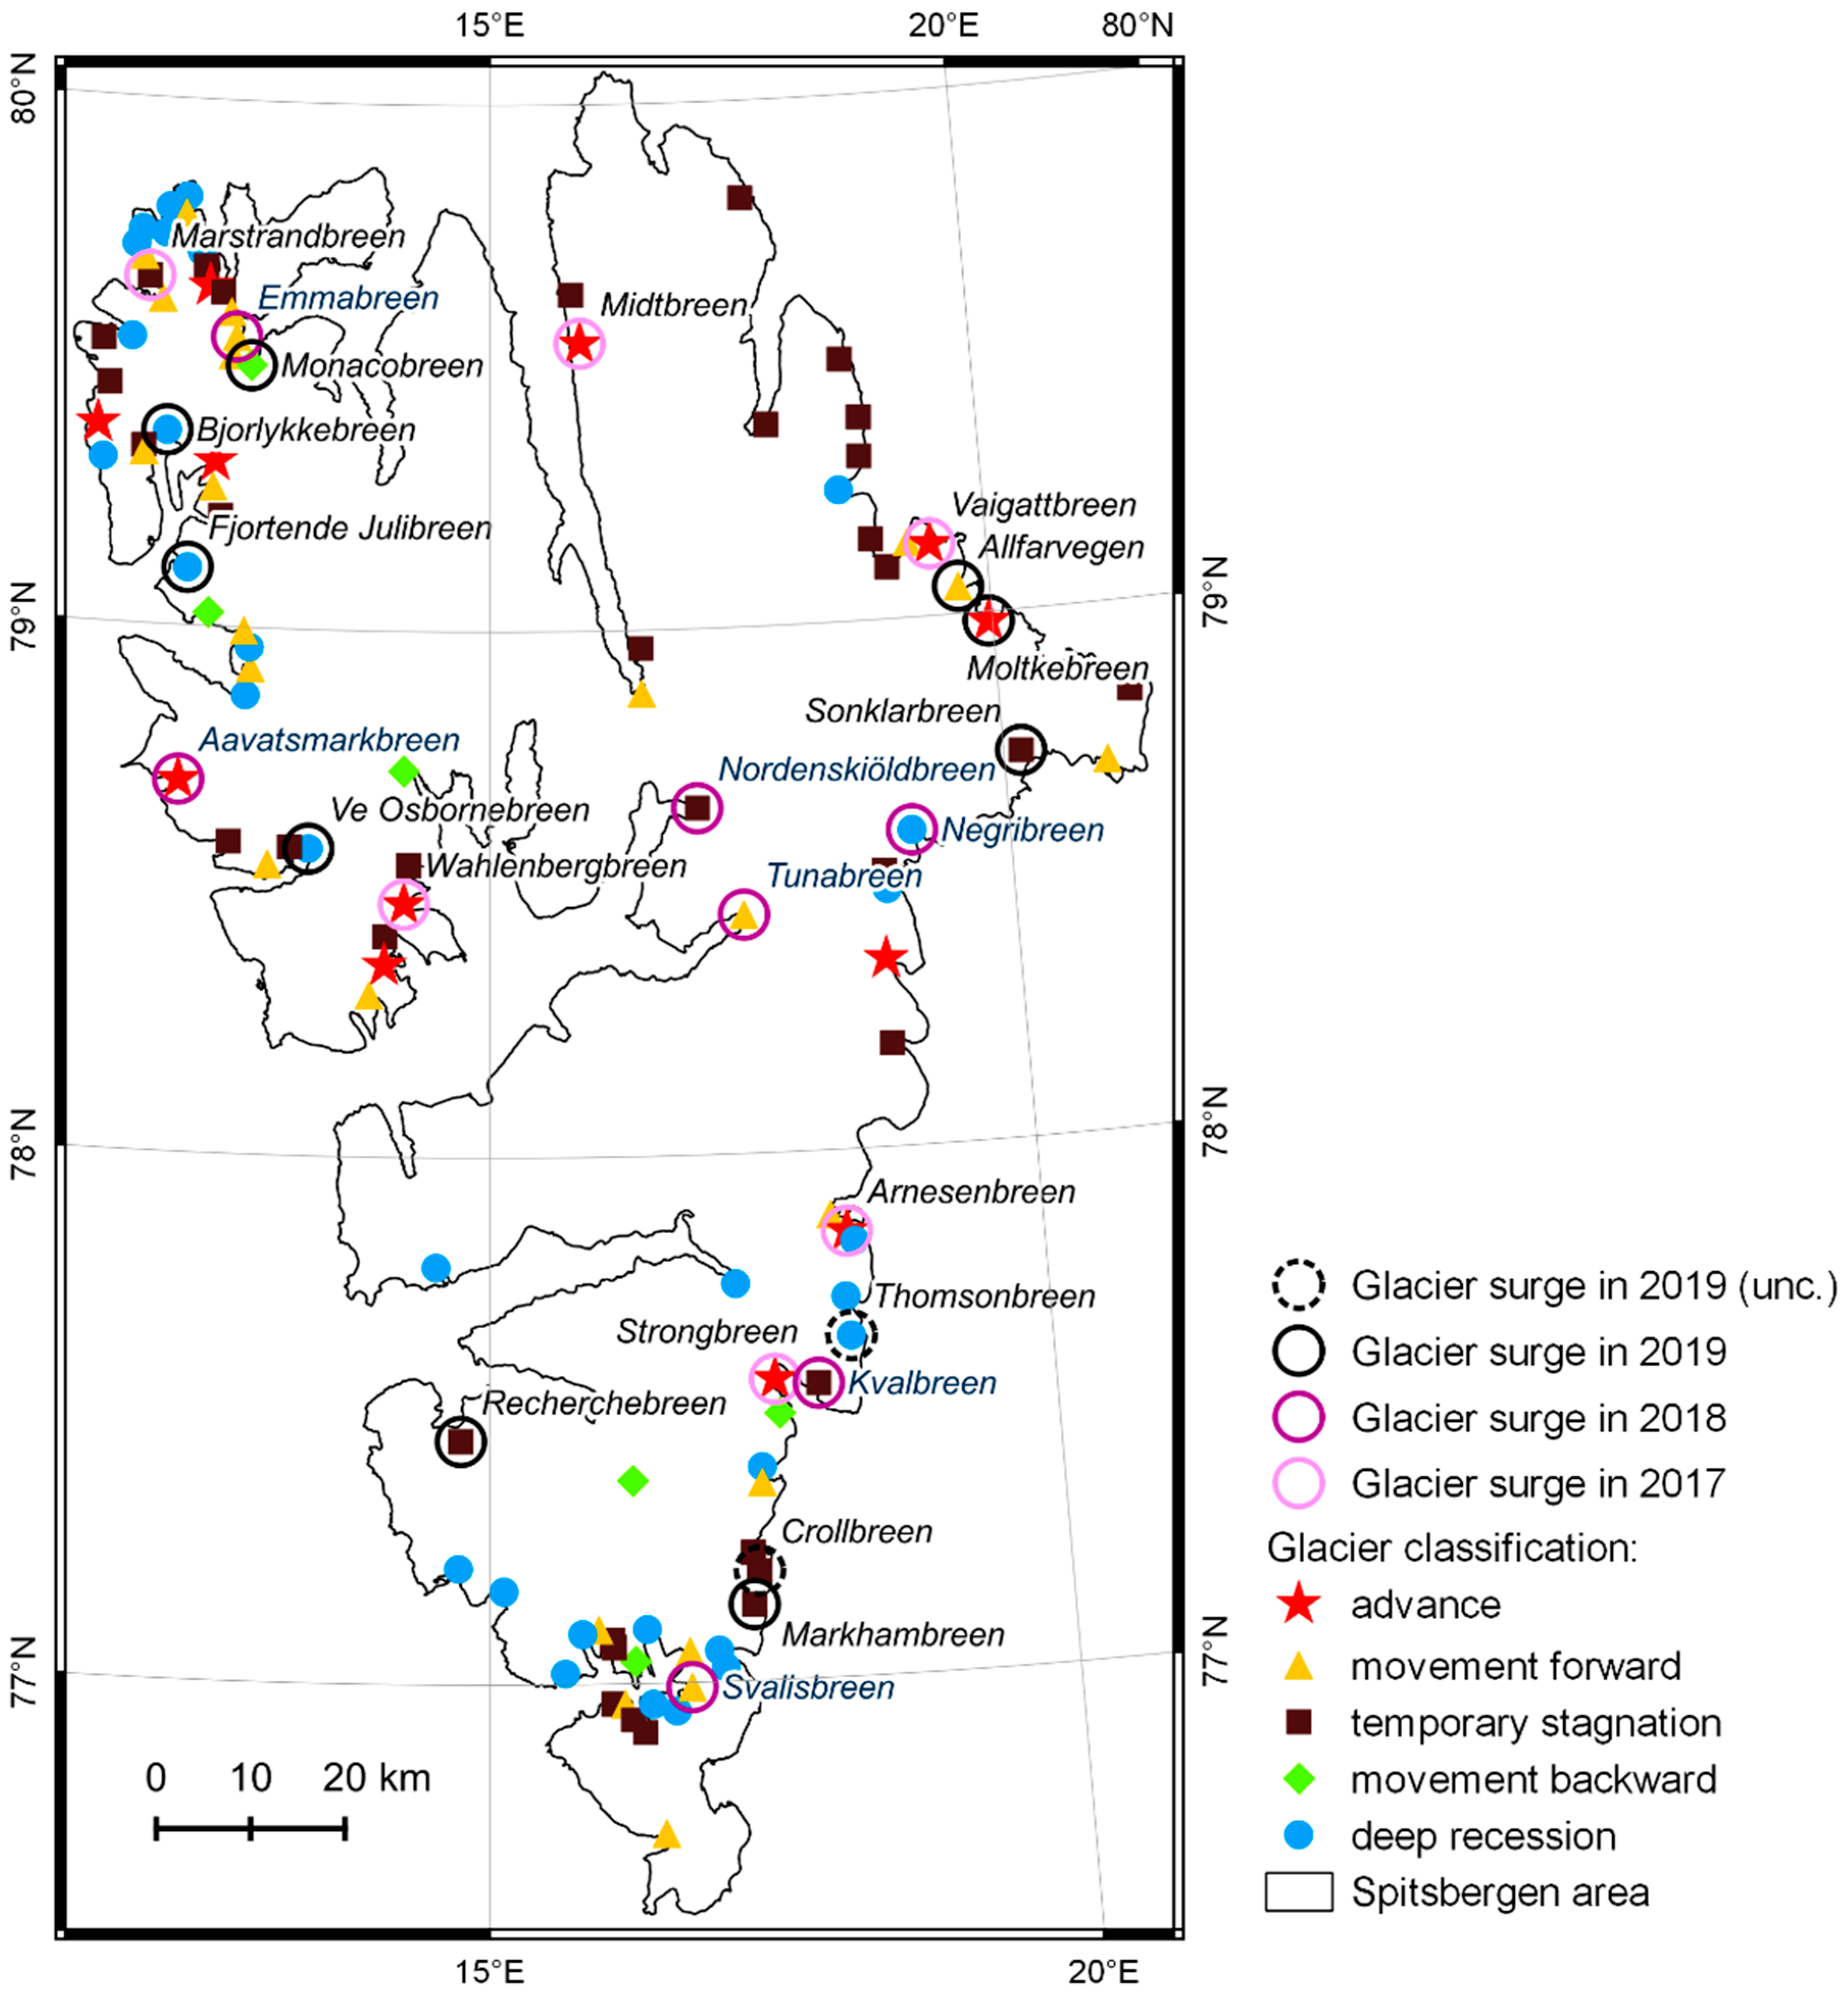
This classification was further compared with other information from these glaciers, particularly whether a clear advance was observed on Landsat satellite scenes in 2017 (6 glaciers), in 2018 (additional 7 glaciers), and in 2019 (additional 11 glaciers) (Figure 9). The advance was identified as a forward shift of the ice-cliff in relation to previous years, and based on the presence of a crevassed zone within the glacier frontal zone Ag, both characteristic of rapid glacier movement during the surge [7]. Eleven of the glaciers showed overlapping classifications as those clearly advancing and showing movement forward (Aavatsmarkbreen, Midtbreen, Vaigattbreen, Wahlenbergbreen, Arnesenbreen, Strongbreen → Moršneevbreen, Svalisbreen, Emmabreen, Tunabreen, Allfarvegen, and Moltkebreen), 7 as stagnant (Marstrandbreen, Nordenskiöldbreen, Kvalbreen, Sonklarbreen, Crollbreen, Markhambreen, and Recherchebreen), 5 as deeply withdrawn, ready for advance (Negribreen, Thomsonbreen, ve Osbornebreen, Fjortende Julibreen, and Lilliehöökbreen → Bjørlykkebreen), and 1—Monacobreen—as retreating. Five glaciers, classified as advancing, were still (2019) in recession/quiescent phase (Fjerdebreen, Chauveaubreen, the Heuglinbreen–Hayesbreen–Königsbergbreen system, and Nansenbreen) or stagnant (Kollerbreen). In the case of Johansenbreen, classified in Figure 8 and Figure 9 as a stagnant glacier, an ice bulge is observed on satellite imagery (Landsat 8—2019) moving down glacier, while the medial moraine has been bent, both of which are typical first characteristics of glacier surge [19].

4. Discussion

4.1. The Role of the Ice-Cliffs Morphometry in the Glacier Surge Triggering

The recession of Spitsbergen tidewater glaciers is reflected in the morphometry of their ice-cliffs. The vast majority of them showed a retreating nature for the 1936–2017 period. This was reflected in the concave shape of the ice-cliff, which increases with the size of the glacier, as demonstrated by the CfD and CfE indicators. Approximately 10–18% of the tidewater glaciers have been experiencing the active phase at any given time, as manifested by the pronounced glacier front curving in the direction of flow (convex shape).
The most pressing question is at which critical point the forward glacier movement turns from normal flow to glacier surge. The preliminary analysis suggests that larger, complex glaciers (with many tributaries), with low average surface slopes and long ice-cliffs have a bigger tendency to surge. These results also coincide with previous observations (e.g., [17,23,54,55,56]). The analysis also indicates that the bending of the ice-cliff will rapidly follow the initiation of the glacier surge in the case of large glaciers. However, this response tends to be delayed for smaller glaciers, up to five years, as the initial phase of the surge is characterized by a forward movement followed by a slow filling of the glacier frontal zone making a protrusion.
The frontal zone Ag of tidewater glaciers during the active phase usually fits into the Ac circle and the CfD indicator ranges from 0.5 to 1.0. The closer the ice-cliff is anchored at the valley mouth and the wider the valley, the more the CfD approaches 1. In extreme cases CfD even exceeds this value and the frontal zone “spills out” into the open sea (e.g., Negribreen in 1969). The median CfD in 1936 was the highest (cf. Table 1). At that time, tidewater glaciers had a greater range [4] and greater complexity of their glacial system. The high median CfD in 2000, in turn, was mainly the result of there being the largest number of cases of surging glaciers (18.2%).
The part of the glacier front that anchors the ice-cliff on land in an ice-wedge-like form can play an important role in the dynamics of tidewater glaciers. Their significance can be compared to buttresses like those found in Gothic cathedrals, designed to spread the force and support the weight. For glaciers, not normal forces (perpendicular to the glacier front line) are of particular importance for the stability of the strongly bending ice-cliff, but the bending moment and a cutting force follows a transverse to the glacier axis. Thicker and wider glacier buttress systems give the support and stabilization for the concave part of the glacier frontal zone (analogous to a parabolic arch, especially pointed arches in building structures [57]). Thus, larger glaciers also show a larger linear recession and greater ice-cliff bending, compared to smaller ones, before reaching the inflexion point (node) when, according to the catastrophe theory [58], the moment of the internal stresses is destabilized and the node (inflexion point) jumps. Therefore, larger glaciers are characterized by a rapid curving of the ice-cliff line following the glacier movement at the beginning of the active phase. Many glaciers, e.g., Nathorstbreen, Strongbreen, Storbreen, Mendelejeevbreen, Negribreen (cf. Figure 1), Selfströmbreen, Monacobreen (cf. Table 4), and Olsokbreen, showed a characteristic cliff indentation point(s) during deep recession, which could give rise to the stability node jump (e.g., by earthquakes, tides, waves or by the distribution of inner stresses etc.), initiating a hysteresis loop. The role of the “buttresses” in stabilizing ice-cliffs will increase as glaciers retreat into a shallower, sediment-covered valley bottoms, which may also contribute to extending the glacier surge cycle.
Smaller glaciers without buttresses only achieve a reduced front curving during recession, a so-called flat arch in terms of the ice-cliff shape. This arc is “structurally” less stable because it is more susceptible to normal forces [57]. Consequently, glacier dynamics appear to adapt faster to the interaction of the combined factors affecting the glacier–atmosphere–sea boundaries. The movement of the ice mass from the glacier top to the cliff [24,25] could be the prevailing force initiating the active phase in the case of smaller glaciers. This seems to be applicable to the approaching glacier surge of Johansenbreen, whose signs were seen on the Landsat 8 satellite image from 2019.
The model of glacier behavior before the glacier surge (mechanics of the structure) can be associated with the results of observations of the propagation of crevasses up the glacier from the ice-cliff [22,29,30]. The node jump of the ice-cliff line will also be favored by an asymmetry in the mass balance distribution, especially noticeable in meridionally located glaciers [59]. A disproportionate snow accumulation caused by prevailing winds and an uneven supply of direct radiation in summer (e.g., fog and shading) will also be reflected indirectly in the stress distribution throughout the entire glacier profile. Tidal amplitude [60] and fjord depth in front of the ice-cliff [37,38,39] also play important roles, especially in cases of anchoring the ice-cliff closer to the valley mouth. Thus, the greater the depth (hydrostatic support), the greater the impact on the cliff destabilization.
The glacier buttress system loses its function following surface ablation of land-based ice. The glacier surface altitude has been decreasing over the recent years, especially in the ablation area [61,62]. In turn, a thick layer of mineral deposits can work as an isolating layer protecting the ice beneath [63].

4.2. Duration of the Active Phase During the Glacier Surge

In the light of the observed Arctic amplification, the number of surging tidewater glaciers is expected to increase. Both, glacier coverage studies (e.g., [4,5,6,7,8]) and their CfD and CfE coefficients, indicate a deepening recession, including especially large glacial systems with the glacier buttresses and an extensive network of tributaries with a relatively narrow and flat receiving zone. One third of the glaciers are stagnant, and therefore potentially ready for an advance. The situation for 2017 morphometrically was similar to the situation in 1990 (cf. Table 1, Figure 4), which was followed by the culmination of cases of the active phase of the surge.
The beginning and end of the active phases of the glacier surge are the most difficult ones to determine through observation. This analysis shows that morphometric indicators can be a simple and accurate method to measure the duration of the active phase, as proven using published observational data. The active phase is estimated to last on average 3–10 years in Svalbard [14], based on published data, while the results presented here from 10 glaciers suggest an average duration of 6–10 years (see Table 2). The beginning and end of the active phase remains to be defined. A clear yearly jump in the value of the CfD and CfE coefficients and the positive sign in the CfE value are directly related to a sudden glacier forward movement, whose acceleration characterizes the active phase of the glacier surge. Therefore, this rapid increase and decrease in CfD and CfE coefficients (cf. Figure 6 and Figure 7, Table 4) can be taken as a determinant of the beginning and end of the glacier surge.
The Monacobreen case study (cf. Table 4) shows that the proposed classification based on both indicators can be a useful tool for finding dynamic patterns of surging tidewater glaciers. These data refer to the results of Murray et al. [45], where the authors indicated three phases in the glacier surge cycle: acceleration, deceleration, and quiescence. Classification according to CfD and CfE indicates that both the active phase and the quiescent phase can show more variation in terms of the dynamic reaction of the glacier. The method requires further analysis to exclude overlapping of mid-seasonal fluctuations on interannual glacial dynamics. In this analysis, due to availability and quality, the data came from different parts of the ablation season.

5. Conclusions

The morphometric indicators used here, the frontal zone dynamics indicator CfD and the ice-cliff balance indicator CfE, allow determining of the dynamic state of tidewater glaciers and classifying them as: deeply receding glaciers, glaciers fulfilling the frontal zone/showing a forward movement, glaciers clearly advancing (active phase of the glacier surge), those showing signs of recession (quiescent phase), and stagnant glaciers. In addition, they allow forecasting future glacier behavior using remote sensing methods (e.g., satellite imagery, aerial photographs, laser scanning data, etc.).
The value of these indicators just before the surge is related to the size of the glacier and the complexity of the glacier system, the length of the ice-cliff and the average slope of its surface. The beginning and end of the active phase of the glacier surge can be identified as a sudden change in the ice-cliff morphometric indicators, as exceeding by several times the median of their interannual fluctuations in the order of approximately 0.05–0.06. This, in turn, gives the opportunity to estimate the duration of the active phase, which in the case of the 10 most-studied Spitsbergen tidewater glaciers appears to last on average 6–10 years.
The analysis shows a clear difference in morphometry and the behavior of the surging glaciers between smaller and large tidewater glaciers. One of the elements affecting the rate of the dynamic processes and their scale is the presence of glacier buttresses, which drives the distribution of the internal stresses in glaciers to the land anchored part, ensuring the stabilization of the ice-cliff. Buttresses are especially characteristic of large glaciers which can reach larger linear recession values, but also react more violently to the jump of the ice-cliff stability node. This also triggers the propagation of crevasses from the ice-cliff line up the glacier, especially in cases of anchoring the ice-cliff closer to the valley mouth. The presence of the glacier buttress system is probably another variable regulating the distribution of forces inside the glacier, which should be included in the modelling of the calving processes of tidewater glaciers.
The morphometric model proposed here is of limited use for glaciers with very little contact with the sea and in the case of ice-cliff shading. Glaciers pinning on islands/capes are also a problem. In this case, each part of the ice-cliff between the island(s) and the land should be treated as a separate section. Glaciers that have not lost their complexity are best suited for long-term analyzes.
Currently, Spitsbergen tidewater glaciers show a strong recession pattern, as expected following Arctic amplification models. Thus, the morphometric indicators presented here also suggest a likely intensification of the phenomenon of the glacier surge in the coming years.

Supplementary Materials

The following are available online at https://www.mdpi.com/2076-3263/10/9/328/s1, Table S1: Emblems of topographic maps and IDs and acquisition dates of Landsat satellite images used in the research; Table S2: IDs and acquisition dates of Landsat satellite images for selected tidewater glaciers in Spitsbergen in the period 1985–2019.

Funding

This paper has been partly created thanks to funds of the Leading National Research Center (KNOW) No. 03/KNOW2/2014 received by the Centre for Polar Studies in the University of Silesia in Katowice for the period 2014–2018 and supported with in statutory activities No 3841/E-41/S/2019 of the Ministry of Science and Higher Education of Poland.

Acknowledgments

The author is very grateful to Leszek Kolondra (University of Silesia in Katowice) for sharing his collection of topographic maps. The author thanks very much the Reviewers and the Academic Editor, Kristian Kjellerup Kjeldsen, for all corrections and remarks improving the final version of the text.

Conflicts of Interest

The author declare no conflict of interest.

References

  1. Rachlewicz, G.; Szczuciński, W.; Ewertowski, M. Post-“Little Ice Age” retreat rates of glaciers around Billefjorden in central Spitsbergen, Svalbard. Pol. Polar Res. 2007, 28, 159–186. [Google Scholar]
  2. Ziaja, W.; Pipała, R. Glacial recession 2001–2006 and its landscape effects in the Lindströmfjellet-Håbergnuten mountain ridge, Nordenskiöld Land, Spitsbergen. Pol. Polar Res. 2007, 28, 237–247. [Google Scholar]
  3. Małecki, J. Elevation and volume changes of seven Dickson Land glaciers, Svalbard, 1960–1990–2009. Polar Res. 2013, 32, 18400. [Google Scholar] [CrossRef]
  4. Martín-Moreno, R.; Álvarez, F.A.; Hagen, J.O. “Little Ice Age” glacier extent and subsequent retreat in Svalbard archipelago. Holocene 2017, 27, 1379–1390. [Google Scholar] [CrossRef]
  5. Szafraniec, J.E. Deglaciation rate on southern and western Spitsbergen in the conditions of Arctic amplification. Pol. Polar Res. 2018, 39, 77–98. [Google Scholar] [CrossRef]
  6. Błaszczyk, M.; Jania, J.A.; Kolondra, L. Fluctuations of tidewater glaciers in Hornsund Fjord (Southern Svalbard) since the beginning of the 20th century. Pol. Polar Res. 2013, 34, 327–352. [Google Scholar] [CrossRef]
  7. Błaszczyk, M.; Ignatiuk, D.; Uszczyk, A.; Cielecka-Nowak, K.; Grabiec, M.; Jania, J.A.; Moskalik, M.; Walczowski, W. Freshwater input to the Arctic fjord Hornsund (Svalbard). Polar Res. 2019, 38, 3506. [Google Scholar] [CrossRef]
  8. Nuth, C.; Kohler, J.; König, M.; von Deschwanden, A.; Hagen, J.O.M.; Kääb, A.; Moholdt, G.; Pettersson, R. Decadal changes from a multi-temporal glacier inventory of Svalbard. Cryosphere 2013, 7, 1603–1621. [Google Scholar] [CrossRef] [Green Version]
  9. Serreze, M.C.; Francis, J.A. The Arctic Amplification Debate. Clim. Chang. 2006, 76, 241–264. [Google Scholar] [CrossRef] [Green Version]
  10. Francis, J.A.; Vavrus, S.J. Evidence linking Arctic amplification to extreme weather in mid-latitudes. Geophys. Res. Lett. 2012, 39, L06801. [Google Scholar] [CrossRef]
  11. Meier, W.N.; Gerland, S.; Granskog, M.A.; Key, J.R. Sea ice. In Snow, Water, Ice and Permafrost in the Arctic (SWIPA): Climate Change and Cryosphere; Arctic Monitoring and Assessment Programme (AMAP): Oslo, Norway, 2011; pp. 357–443. [Google Scholar]
  12. Overland, J.E.; Wang, M.; Walsh, J.E.; Christensen, J.H.; Kattsov, V.M.; Chapman, W.L. Climate Model projections for the Artcic. In Snow, Water, Ice and Permafrost in the Arctic (SWIPA): Climate Change and Cryosphere; Arctic Monitoring and Assessment Programme (AMAP): Oslo, Norway, 2011; pp. 37–54. [Google Scholar]
  13. Isaksen, K.; Nordli, Ø.; Førland, E.J.; Łupikasza, E.; Eastwood, S.; Niedźwiedź, T. Recent warming on Spitsbergen–Influence of atmospheric circulation and sea ice cover. J. Geophys. Res. D Atmos. 2016, 121, 11–913. [Google Scholar] [CrossRef]
  14. Dowdeswell, J.A.; Hamilton, G.S.; Hagen, J.O. The duration of the active phase on surge-type glaciers: Contrasts between Svalbard and other regions. J. Glaciol. 1991, 37, 388–400. [Google Scholar] [CrossRef] [Green Version]
  15. Lefauconnier, B.; Hagen, J.O. Surging and Calving Glaciers in Eastern Svalbard; Meddelelser, 116: Oslo, Norway, 1991; p. 130. [Google Scholar]
  16. Hagen, J.O.; Liestøl, O.; Roland, E.; Jorgensen, T. Glacier atlas of Svalbard and Jan Mayen; Meddelelser, 129: Oslo, Norway, 1993; p. 169. [Google Scholar]
  17. Hamilton, G.S.; Dowdeswell, J.A. Controls on glacier surging in Svalbard. J. Glaciol. 1996, 42, 157–168. [Google Scholar] [CrossRef] [Green Version]
  18. Jiskoot, H.; Murray, T.; Boyle, P. Controls on the distribution of surge-type glaciers in Svalbard. J. Glaciol. 2000, 46, 412–422. [Google Scholar] [CrossRef] [Green Version]
  19. Sund, M.; Eiken, T.; Hagen, J.O.; Kääb, A. Svalbard surge dynamics derived from geometric changes. Ann. Glaciol. 2009, 50, 50–60. [Google Scholar] [CrossRef] [Green Version]
  20. Błaszczyk, M.; Jania, J.A.; Hagen, J.O. Tidewater glaciers of Svalbard: Recent changes and estimates of calving fluxes. Pol. Polar Res. 2009, 30, 85–142. [Google Scholar]
  21. Farnsworth, W.R.; Ingólfsson, Ó.; Retelle, M.; Schomacker, A. Over 400 previously undocumented Svalbard surge-type glaciers identified. Geomorphology 2016, 264, 52–60. [Google Scholar] [CrossRef]
  22. Sevestre, H.; Benn, D.I.; Luckman, A.; Nuth, C.; Kohler, J.; Lindbäck, K.; Pettersson, R. Tidewater glacier surges initiated at the terminus. J. Geophys. Res. Earth Surf. 2017, 123, 1035–1051. [Google Scholar] [CrossRef]
  23. Sevestre, H.; Benn, D.I. Climatic and geometric controls on the global distribution of surge-type glaciers: Implications for a unifying model of surging. J. Glaciol. 2015, 61, 646–662. [Google Scholar] [CrossRef] [Green Version]
  24. Nuth, C.; Moholdt, G.; Kohler, J.; Hagen, J.O.; Kääb, A. Svalbard glacier elevation changes and contribution to sea level rise. J. Geophys. Res. 2010, 115. [Google Scholar] [CrossRef] [Green Version]
  25. Małecki, J.; Faucherre, S.; Strzelecki, M.C. Post-surge geometry and thermal structure of Hørbyebreen, central Spitsbergen. Pol. Polar Res. 2013, 34, 305–321. [Google Scholar] [CrossRef]
  26. Benn, D.I.; Fowler, A.C.; Hewitt, I.; Sevestre, H. General theory of glacier surges. J. Glaciol. 2019, 65, 701–716. [Google Scholar] [CrossRef] [Green Version]
  27. Mansell, D.; Luckman, A.; Murray, T. Dynamics of tidewater surge-type glaciers in northwest Svalbard. J. Glaciol. 2012, 58, 110–118. [Google Scholar] [CrossRef]
  28. McMillan, M.; Shepherd, A.; Gourmelen, N.; Dehecq, A.; Leeson, A.; Ridout, A.; Flament, T.; Hogg, A.; Gilbert, L.; Benham, T.; et al. Rapid dynamic activation of a marine-based Arctic ice cap. Geophys. Res. Lett. 2014, 41, 8902–8909. [Google Scholar] [CrossRef]
  29. Aschwanden, A.; Bueler, E.; Khroulev, C.; Blatter, H. An enthalpy formulation for glaciers and ice sheets. J. Glaciol. 2012, 58, 441–457. [Google Scholar] [CrossRef] [Green Version]
  30. Dunse, T.; Schellenberger, T.; Hagen, J.O.; Kääb, A.; Schuler, T.V.; Reijmer, C.H. Glacier-surge mechanisms promoted by a hydro-thermodynamic feedback to summer melt. Cryosphere 2015, 9, 197–215. [Google Scholar] [CrossRef] [Green Version]
  31. Benn, D.I.; Warren, C.R.; Mottram, R.H. Calving processes and the dynamics of calving glaciers. Earth Sci. Rev. 2007, 82, 143–179. [Google Scholar] [CrossRef]
  32. Benn, D.I.; Åström, J.A. Calving glaciers and ice shelves. Adv. Phys. X 2018, 3, 1513819. [Google Scholar] [CrossRef] [Green Version]
  33. Hagen, J.O.; Kohler, J.; Melvold, K.; Winther, J.-G. Glaciers in Svalbard: Mass balance, runoff and freshwater flux. Polar Res. 2003, 22, 145–159. [Google Scholar] [CrossRef] [Green Version]
  34. Benn, D.I.; Kristensen, L.; Gulley, J.D. Surge propagation constrained by a persistent subglacial conduit, Bakaninbreen–Paulabreen, Svalbard. Ann. Glaciol. 2009, 50, 81–86. [Google Scholar] [CrossRef] [Green Version]
  35. Bougamont, M.; Christoffersen, P.; Hubbard, A.L.; Fitzpatrick, A.A.; Doyle, S.H.; Carter, S.P. Sensitive response of the Greenland Ice Sheet to surface melt drainage over a soft bed. Nat. Commun. 2014, 5, 5052. [Google Scholar] [CrossRef] [Green Version]
  36. Pfeffer, W.T.; Bretherton, C.S. The effect of crevasses on the solar heating of a glacier surface. In IAHS Publ. 170, Proceedings of the an International Symposium Held during the XlXth General Assembly of the International Union of Geodesy and Geophysics–The Physical Basis of Ice Sheet Modelling, Vancouver, BC, Canada, 9–22 August 1987; Waddington, E.D., Walder, J.S., Eds.; IAHS Press, Institute of Hydrology: Wallingford, UK, 1987; pp. 191–205. [Google Scholar]
  37. Brown, C.S.; Meier, M.F.; Post, A. Calving Speed of Alaska Tidewater Glaciers, with Application to Columbia Glacier; U.S. Geological Survey Professional Paper 1258-C; United States Government Printing Office: Washington, WA, USA, 1982.
  38. Meier, M.F.; Post, A. Fast Tidewater Glaciers. J. Geophys. Res. 1987, 92, 9051–9058. [Google Scholar] [CrossRef]
  39. Moskalik, M.; Tęgowski, J.; Głowacki, P.; Żulichowska, M. Principal Component and Cluster Analysis for determining diversification of bottom morphology based on bathymetric profiles from Brepollen (Hornsund, Spitsbergen). Oceanologia 2014, 56, 59–84. [Google Scholar] [CrossRef] [Green Version]
  40. Walczowski, W.; Piechura, J. Influence of the West Spitsbergen Current on the local climate. Int. J. Climatol. 2011, 31, 1088–1093. [Google Scholar] [CrossRef]
  41. EarthExplorer. Available online: https://earthexplorer.usgs.gov/ (accessed on 12 May 2020).
  42. Kartserie: Svalbard (S100)–the Svalbard Coverage by the Topographic Maps, Norwegian Polar Institute. Available online: https://www.npolar.no/produkt/svalbard-s100/ (accessed on 12 May 2020).
  43. TopoSvalbard Portal, Norwegian Polar Institute. Available online: https://toposvalbard.npolar.no/ (accessed on 12 May 2020).
  44. Norwegian Meteorological Institute (2020). Air Temperature in Svalbard, Annual Mean. Environmental Monitoring of Svalbard and Jan Mayen (MOSJ). Available online: http://www.mosj.no/en/climate/atmosphere/temperature-precipitation.html (accessed on 12 May 2020).
  45. Murray, T.; Strozzi, T.; Luckman, A.; Jiskoot, H.; Christakos, P. Is there a single surge mechanism? Contrasts in dynamics between glacier surges in Svalbard and other regions. J. Geophys. Res. 2003, 108. [Google Scholar] [CrossRef]
  46. Sund, M.; Lauknes, T.R.; Eiken, T. Surge dynamics in the Nathorstbreen glacier system, Svalbard. Cryosphere 2014, 8, 623–638. [Google Scholar] [CrossRef] [Green Version]
  47. Rolstad, C.; Amlien, J.; Hagen, J.O.; Lundén, B. Visible and near-infrared digital images for determination of ice velocities and surface elevation during a surge on Osbornebreen, a tidewater glacier in Svalbard. Ann. Glaciol. 1997, 24, 255–261. [Google Scholar] [CrossRef] [Green Version]
  48. Flink, A.E.; Noormets, R.; Kirchner, N.; Benn, D.I.; Luckman, A.; Lovell, H. The evolution of a submarine landform record following recent and multiple surges of Tunabreen glacier, Svalbard. Quat. Sci. Rev. 2015, 108, 37–50. [Google Scholar] [CrossRef] [Green Version]
  49. Sevestre, H.; Benn, D.I.; Hulton, N.R.J.; Bælum, K. Thermal structure of Svalbard glaciers and implications for thermal switch models of glacier surging. J. Geophys. Res. Earth Surf. 2015, 120, 2220–2236. [Google Scholar] [CrossRef] [Green Version]
  50. Burton, D.J.; Dowdeswell, J.A.; Hogan, K.A.; Noormets, R. Marginal Fluctuations of a Svalbard Surge-Type Tidewater Glacier, Blomstrandbreen, Since the Little Ice Age: A Record of Three Surges. Arct. Antarct. Alp. Res. 2016, 48, 411–426. [Google Scholar] [CrossRef]
  51. Dowdeswell, J.A.; Benham, T.J. A surge of Perseibreen, Svalbard, examined using aerial photography and ASTER high resolution satellite imagery. Polar Res. 2003, 22, 373–383. [Google Scholar] [CrossRef]
  52. Murray, T.; James, T.D.; Macheret, Y.; Lavrentiev, I.; Glazovsky, A.; Sykes, H. Geometric Changes in a Tidewater Glacier in Svalbard during its Surge Cycle. Arct. Antarct. Alp. Res. 2012, 44, 359–367. [Google Scholar] [CrossRef]
  53. Lønne, I. Low-velocity glacial surges–Processes unlocked by modern surge on Svalbard. Geology 2006, 34, 553–556. [Google Scholar] [CrossRef]
  54. Clarke, G.K.C. Length, width and slope influences on glacier surging. J. Glaciol. 1991, 37, 236–246. [Google Scholar] [CrossRef] [Green Version]
  55. Grant, K.L.; Stokes, C.R.; Evans, I.S. Identification and characteristics of surge-type glaciers on Novaya Zemlya, Russian Arctic. J. Glaciol. 2009, 55, 960–972. [Google Scholar] [CrossRef] [Green Version]
  56. Kienholz, C.; Rich, J.L.; Arendt, A.A.; Hock, R. A new method for deriving glacier centerlines applied to glaciers in Alaska and northwest Canada. Cryosphere 2014, 8, 503–519. [Google Scholar] [CrossRef] [Green Version]
  57. Dobra, D.; Jambrożek, S.; Komosa, M.; Mikołajczak, E.; Przybylska, P.; Sysak, A.; Wdowska, A. Metoda sił –łuki (Force method–arches). In Mechanika Budowli (Building Mechanics); Part, I., Pawlak, Z., Eds.; 2003/2004; Poznań University of Technology: Poznań, Poland; Available online: http://www.se.put.poznan.pl/almamater/wyklady/mechanika_budowli_03-04/czesc1/12.pdf (accessed on 12 May 2020). (In Polish)
  58. Thom, R. Structural Stability and Morphogenesis: An Outline of a General Theory of Models; CRC Press, Taylor & Francis Group LLC: Boca Raton, FL, USA; London, UK; New York, NY, USA, 2018; p. 348. [Google Scholar]
  59. Grabiec, M.; Leszkiewicz, J.; Głowacki, P.; Jania, J. Distribution of snow accumulation on some glaciers of Spitsbergen. Pol. Polar Res. 2006, 27, 309–326. [Google Scholar]
  60. Pętlicki, M.; Ciepły, M.; Jania, J.A.; Promińska, A.; Kinnard, C. Calving of tidewater glacier driven by melting at the waterline. J. Glaciol. 2015, 61, 851–863. [Google Scholar] [CrossRef] [Green Version]
  61. Ziaja, W.; Dudek, J.; Ostafin, K. Landscape transformation under the Gåsbreen glacier recession since 1899, southwestern Spitsbergen. Pol. Polar Res. 2016, 37, 155–172. [Google Scholar] [CrossRef] [Green Version]
  62. Szafraniec, J.E.; Dobiński, W. Deglaciation rate of the selected nunataks in Spitsbergen, Svalbard–potential for the permafrost expansion above glacial environment. Geosciences 2020, 10, 202. [Google Scholar] [CrossRef]
  63. Lundstrom, S.C.; McCafferty, A.E.; Coe, J.A. Photogrammetric analysis of 1984–89 surface altitude change of the partially debris-covered Eliot Glacier, Mount Hood, Oregon, U.S.A. Ann. Glaciol. 1993, 17, 167–170. [Google Scholar] [CrossRef] [Green Version]
Figure 1. Frontal zone Ag of Spitsbergen tidewater glaciers on the example of Nigerbreen (based on the 654 spectral bands composition of the Landsat 8 satellite imagery ID: LC82150032015238LGN01, 26.08.2015, USGS/NASA Landsat [41].
Geosciences 10 00328 g001
Figure 2. Examples of the shape of the frontal zone expressed by CfD and CfE indicators depending on the dynamic state of a tidewater glacier: (a) Advancing glacier; (b) Glacier in the momentary equilibrium state; and (c) Glacier undergoing recession. An arrow points the glacier flow direction.
Geosciences 10 00328 g002
Figure 3. Relationships between the glacier front dynamics indicator CfD and the ice-cliff balance indicator CfE for Spitsbergen tidewater glaciers in selected years of the 1936–2017 period: (a) 1936; (b) 1961–1977; (c) 1990; (d) 2000; (e) 2014; and (f) 2017.
Geosciences 10 00328 g003
Figure 4. Median values of the CfD and CfE indicators for the selected years of the 1936–2017 period under the background of the mean annual air temperature at the Svalbard Airport (temperature values based on data made available by the Norwegian Meteorological Institute [44].
Geosciences 10 00328 g004
Figure 5. Median values of CfD (a) and CfE (a.v.) (b) indicators relative to the exposition of the Spitsbergen tidewater glaciers during the recession phase in years: 1990, 2000, 2014, and 2017.
Geosciences 10 00328 g005
Figure 6. CfD (left Y axis; blue circles) and CfE (right Y axis; red rhombs) values for selected tidewater Spitsbergen glaciers, which experienced an episode of the active phase of the glacier surge in 1985–2017 (X axis–years): (a) the Nathorstbreen–Zawadzkibreen system; (b) Monacobreen; (c) the Strongbreen–Moršnevbreen system; (d) the Osbornebreen–Vintervegen system; (e) Tunabreen; (f) Wahlenbergbreen; (g) Paierlbreen; (h) Blomstrandbreen; (i) Richardsbreen; (j) the Persejbreen–Vindeggbreen system; (k) Esmarkbreen; (l) Fridtjovbreen; (m) Mendelejeevbreen; (n) Arnesenbreen; and (o) Chauveauxbreen. An arrow indicates the moment of the glacier movement forward.
Geosciences 10 00328 g006aGeosciences 10 00328 g006b
Figure 7. Interannual changes in the values of CfD and CfE indicators for five selected tidewaters glaciers surging between 1985 and 2017.
Geosciences 10 00328 g007
Figure 8. Classification of Spitsbergen tidewater glaciers according to the criterion of the glacier frontal zone dynamics, based on the state in the years 2014 and 2017—the relation of interannual changes of CfD and CfE and percentage representation (a pie chart inset).
Geosciences 10 00328 g008
Figure 9. Classification of tidewater glaciers based on interannual changes of CfD and CfE between 2014 and 2017. Circles indicate glaciers with the characteristics of the active phase observed on satellite imagery in 2017, 2018, and 2019.
Geosciences 10 00328 g009
Table 1. Median values of morphometric parameters of glacier frontal zones of Spitsbergen tidewater glaciers (the interquartile range IQR is given in brackets).
YearLc
[km]
Dc
[km]
Ag
[km2]
Ac
[km2]
CfDCfE
(a.v.)
1936
(28 glaciers)
4.24
(3.43–5.74)
3.35
(2.31–4.10)
3.62
(1.01–6.24)
8.82
(4.18–13.26)
0.40
(0.35–0.45)
0.79
(0.71–0.87)
1960–1966
(35)
2.47
(1.93–4.71)
1.85
(1.43–3.05)
0.91
(0.43–1.92)
2.67
(1.60–7.24)
0.37
(0.30–0.43)
0.75
(0.63–0.81)
1969–1977
(17)
5.58
(4.38–6.61)
3.03
(2.39–3.43)
2.71
(–0.87–4.57)
7.21
(4.47–9.19)
0.38
(–0.20–0.48)
0.61
(0.40–0.81)
1990
(73)
3.16
(2.28–5.09)
2.24
(1.44–3.12)
0.93
(0.11–2.46)
3.93
(1.62–7.69)
0.30
(0.16–0.40)
0.60
(0.30–0.80)
2000
(110)
2.71
(1.17–3.73)
1.71
(1.00–2.66)
0.74
(0.20–1.92)
2.30
(0.79–5.55)
0.39
(0.27–0.47)
0.79
(0.66–0.87)
2014
(110)
2.78
(1.39–4.38)
1.72
(1.00–2.89)
0.59
(0.19–1.89)
2.34
(0.78–6.59)
0.30
(0.18–0.40)
0.71
(0.57–0.79)
2017
(110)
2.61
(1.46–4.23)
1.86
(1.04–3.01)
0.69
(0.08–1.95)
2.70
(0.85–7.12)
0.29
(0.13–0.44)
0.70
(0.57–0.80)
Table 2. The beginning and the end of the active phase of the glacier surge for selected Spitsbergen tidewater glaciers based on publications and morphometric indicators of the glacier frontal zone.
Surging GlaciersSource of Data (Published)According to Published DataAccording to the Ice-Cliff Morphometry
Start of the Active PhaseEnd (and Duration—in Brackets) of the Active PhaseStart of the Active PhaseEnd (and Duration—in Brackets) of the Active Phase
Nathorstbreen systemSund et al. [46]2003–stage 1
2008–stage 2
2013 (?)
(~5–10 years)
2006–20082014–2015
(6–9 years)
MonacobreenMurray et al. [45]
Mansell et al. [27]
1990–1992
1993–1995
1997
(2–7 years)
1991–19922001–2002
(9–10 years)
OsbornebreenDowdeswell et al. [14];
Rolstad et al. [47]
1986–1987?1986–19871990–1991
(3–5 years)
TunabreenFlink et al. [48];
Sevestre et al. [49]
2002–2003
2003
2004–2005
2005
(1–3 years)
2002–20042006–2010
(2–8 years)
WahlenbergbreenSevestre at al. [22]20092012–2013
PaierlbreenBłaszczyk et al. [6]1993 (?)1999 (?)
(6 years?)
1990–19922004–2006
(12–16 years)
BlomstrandbreenMansell et al. [27];
Burton et al. [50]
2007
2009
2010 (?)
2013
(1–6 years)
2007–20102016–2017
(6–10 years)
PersejbreenDowdeswell and Benham [51]2000–2001?1999–20002015–2016
(5–17 years)
FridtjovbreenMurray et al. [45];
Murray et al. [52];
Lønne [53]
1994–1995
and re-advance in 1998–1999
1997
(2–3 years
or 3–5 years)
1995–19961998–1999
(2–4 years)
MendeleevbreenBłaszczyk et al. [6]between 1995–2002between 2002–2010
(up to 15 years?)
1996–19972006–2010
(9–14 years)
Table 3. The relationship between CfD and CfE up to 5 years before the active phase of the glacier surge expressed as a correlation coefficient.
Year Before Surge12345
Coeff. of corr.−0.84−0.73−0.76−0.77 *−0.80
* Not statistically significant.
Table 4. Characteristics of Monacobreen dynamics based on CfD and CfE indicators and their interannual changes in 1985–2019.
YearThe Ice-Cliff ShapeIndicatorsInterannual Changes in Indicators ValueDynamics
CfDCfECh. of CfDCh. of CfE
1985 Geosciences 10 00328 i0010.367−0.713????
1986 Geosciences 10 00328 i0020.428 −0.7110.0610.002 Frontal zone filling/stagnation
1987 Geosciences 10 00328 i0030.402 −0.711−0.0260.000
1988 Geosciences 10 00328 i0040.454 −0.7990.052−0.088
1989 Geosciences 10 00328 i0050.437 −0.729−0.0170.070 Deep recession stage—strongly concave ice-cliff shape
1990 Geosciences 10 00328 i0060.244 −0.641−0.1930.088
1991 Geosciences 10 00328 i0070.448 −0.7700.204−0.129 Entering the active phase (I) of the glacier phase—an advance, convex shape of the ice-cliff
1992 Geosciences 10 00328 i0080.532 0.738 0.0841.508
1993 Geosciences 10 00328 i0090.663 0.758 0.1310.020
1994 Geosciences 10 00328 i0100.691 0.789 0.0280.031 Stagnation—convex ice-cliff, many inflexion points
1995 Geosciences 10 00328 i0110.646 0.783 −0.045−0.006
1996 Geosciences 10 00328 i0120.670 0.724 0.024−0.059
1997 Geosciences 10 00328 i0130.675 0.732 0.0050.008
1998 Geosciences 10 00328 i0140.640 0.759 −0.0350.027
1999 Geosciences 10 00328 i0150.641 0.750 0.001−0.009
2000 Geosciences 10 00328 i0160.575 0.753 −0.0660.003 Deep recession by calving and melting
2001 Geosciences 10 00328 i0170.570 0.885 −0.0050.132
2002 Geosciences 10 00328 i0180.475 −0.794−0.095−1.679 Entering the quiescent phase of the glacier stage—retreat, few inflexion points on the ice-cliff line
2003 Geosciences 10 00328 i0190.463 −0.837−0.012−0.043
2004
2005 Geosciences 10 00328 i0200.466 −0.695???
2006 Geosciences 10 00328 i0210.375 −0.722–0.091−0.027
2007 Geosciences 10 00328 i0220.375 −0.7700.000−0.048
2008
2009 Geosciences 10 00328 i0230.420 −0.839???
2010 Geosciences 10 00328 i0240.402 −0.801−0.0180.038
2011 Geosciences 10 00328 i0250.488 −0.8700.086−0.069 Small interannual fluctuations and stagnation—filling the frontal zone balanced by the ice-cliff retreating
2012
2013 Geosciences 10 00328 i0260.427 −0.809???
2014 Geosciences 10 00328 i0270.474 −0.8450.047−0.036
2015 Geosciences 10 00328 i0280.388 −0.804−0.0860.041
2016 Geosciences 10 00328 i0290.431 −0.8350.043−0.031
2017 Geosciences 10 00328 i0300.390 −0.858−0.041−0.023
2018 Geosciences 10 00328 i0310.473 −0.8230.0830.035 Entering the active phase (II) of the glacier phase—an advance, convex shape of the ice-cliff
2019 Geosciences 10 00328 i0320.653 0.743 0.1801.566
Explanation: “The ice-cliff shape” column: solid line—Lc; dashed line—Dc; the “Indicators” column: pink colour—active phase; blue colour—quiescent phase; colors in the “Dynamics” column—see Figure 8; and stagnation—values centered around 0 of interannual changes within the IQR: from −0.037 to 0.054 for CfD and from −0.038 to 0.037 for CfE).